42
East of England LETB Workforce Plan for Investment in Education and Training in 2015/16
| Date post: | 23-Dec-2015 |
| Category: |
Documents |
| Upload: | paulina-melton |
| View: | 215 times |
| Download: | 2 times |

East of England LETBWorkforce Plan for Investment in Education and Training in
2015/16

2
Content:
1. Workforce planning and commissioning process 2014
• Workforce planning and commissioning process 2014• Taking a long view
2. Future workforce needs and priorities
• Health needs• Service direction• Future workforce needs and priorities• EoE providers’ workforce forecasts 2015-2019
3. Analysis and investment plan 2015/16
• EoE regional response to workforce priorities• Risks and confidences• EoE investment decisions 2015• EoE education commissioning plan 2015 headlines
4. Appendices
• Appendix 1 EoE non-medical and medical commissioning plan 2015• Appendix 2 Forecast supply by professional group

3
Workforce planning and commissioning process 2014

4
Workforce planning and commissioning process 2014
We have aimed to develop an education commissioning plan for the region which is supported by multi-professional review, recognised by professional groups as being fit for purpose, affordable and supported by quality outcomes for education providers and employers. To achieve this we:
1. Developed a workforce planning process with a clear strategic focus, with a greater emphasis on conversations with stakeholders about what future EoE workforce will look like in terms of skills, roles and behaviours and what workforce development initiatives would achieve this view.
2. Developed the knowledge of strategic workforce planning within the LETB, within the Workforce Partnerships and the wider planning community, introduced new planning tools and raised the profile of workforce planning among senior leaders.
3. Developed an affordable EoE regional workforce forecast.
4. Increased attention on safe staffing policies and guidance and their impact upon current and future workforce supply
5. Conducted a series of multi-professional reviews of regional workforce forecasts and commissioning plans, prioritised investment for the whole workforce (non-medical, medical, pre-professional) using intelligence about demand and supply position for each professional group to ensure best allocation of resources.
6. Extended the workforce planning process to General Practice workforce, working closely with commissioners of services.
7. Delivered further progress on integration of medical workforce planning into the main planning process.
8. Began a dialogue with our planning partners about intelligence sharing and alignment of processes and templates for greater system transparency.

January 2014February 2014
March 2014April 2014
May 2014June 2014 July 2014August 2014 September 2014December 2014
Service Planning and longer-term financial planning
Strategic Workforce Planning
Operating workforce plans
People process management
Planning processes at provider level
February 2015
Stage 1: Setting strategic context Conversations about future
workforce needs and prioritiesDeveloping our capacity
Stage 2: development of providers’ workforce forecasts commissioning plans in Workforce
Partnerships
Stage 3: Review of EoE workforce forecasts and commissioning plan
Stage 4: Development of EoE Investment Plan and strategy update
Education commissioning and Investment Plan
Strategy , TransformationRecruitment and retention
LETB workforce planning process 2014/15
Development of the process
Initial work on strategic planning in 2014
Added to 2015planning process
Workforce planning and commissioning process 2014
We designed the 4-stage process with a greater emphasis on conversations about future workforce needs

6
EoE Skills Strategy 2013 - 2020Investment plan 2014
Conversations with stakeholders about future workforce needs and priorities
Workforce forecasts and education commissioning plans
Reviews of plans
EoE regional education commissioning plan
Updated EoE Skills Strategy 2013 - 2020Investment plan 2015
Workforce planning and commissioning process 2014
Our workforce strategy provides the context for our activities as a LETB throughout the planning round in 2014. The strategy is also a live document that is continuously updated as new workforce intelligence comes to light.

7
Taking a long view
“…Many decisions about resources need to be made for the long term, for example, the numbers of people to be trained, the skills they will require, the buildings likely to be needed...Taking a long-term view should...provide the opportunity for more effective management of the health service. Good management requires clarity about the long-term, strategic direction of the service coupled with flexibility to respond decisively and appropriately to changes as they occur”.
Wanless report “Securing our future health: Taking a long-term view” (2002, p.1)
We recognise that:
• Strategy is not just a product of the top management thinking, it is shaped by our stakeholders;
• Strategy emerges slowly in response to a multitude of different influences. The process of strategy development is iterative and continuous, reflecting the complexity of internal and external worlds;
• Our assumptions need to be constantly re-examined, concentrating on important issues;
• We must explore issues that are most uncertain and might result in discontinuities. It is these discontinuities that the strategic planning is aiming to address;
EoE LETB commissioned specific education and training on Strategic Workforce Planning (through Henley Business School) to build capability in relation to strategic workforce planning. We held five workshops, including one in each Workforce Partnership, aiming to:
• Increase understanding and confidence in Strategic Workforce Planning;
• Identify future workforce needs and translate these into workforce priorities and actions to mitigate risks;
85 attendees representing the acute sector, mental health, community, commissioners, local authority, social care, patient groups, HEIs and Health Education East of England.
The following slides summarise our findings from these workshops.

8
Future workforce needs and priorities

Health needs
• The East of England is the second largest English region by area at around 19,100 square kilometers. The region covers 9 per cent of the total area of the UK.
• According to the Census 2011 there were 5.8 million residents in the East of England. This was an increase of 8% since 2001.
• In 2011 the East of England had 17% of people whose day to day activities were limited by a long term health problem or disability and 10% of people who provided unpaid care for someone with an illness or disability (the same percentage as for England and Wales as a whole).
• The health of people in the East of England is generally better than the average for England. There are inequalities in health within the region and these are closely related to deprivation. Health of people in a small number of local authorities in the region, for example Peterborough, Luton, is generally worse than average.
• Although the rate of alcohol related admissions is lower than the England average it has continued to rise. The proportion of adults participating in recommended levels of physical activity has fallen in the region.
• While death rates from smoking in the East of England remain lower than the England average, preventing ill health by addressing smoking continues to be a priority for the region.
• The median age of the region was 40 in 2011, 1 year higher than the England and Wales average. Within the region this ranged from 31 in Cambridge to 51 in North Norfolk.
• The East of England’s population is forecast to get older still, meaning an increase in demand for elderly services such dementia and cancer and an urgent need to promote independent living for elderly. The demand for mental health service continues to increase.
• Local NHS workforce is also ageing, the average EoE workforce age is currently 43 and is forecast to increase by 1 year between 2013 and 2020.
Sources: East of England health profile 2012, ONS analysis of Census 2011, EoE workforce analysis

Service direction
Our stakeholders identified the following service requirements common to all areas of East of England:
Person-centered
• Person-centred care with the patients and public being at the centre of all our planning. In the future the care will be created jointly between care professionals and service users. The co-production of care is about establishing a greater quality of status and decision making between staff and those using the service.
• Education and empowerment of patients and carers, so that they become co-providers and active participants in health care.
Shift in care from acute to community
• Wider primary care and a significant shift in activity and resource from the hospital sector to the community, ensuring patients have access to a broader range of services in primary care, centered on the expanded role of general practice.
Integration
• Development of a more integrated system of community-based services that provide responsive and holistic services to communities, particularly for frail older people. This will include integration across health and social care and across different elements of NHS care, integration of specific services and organisations.
• For patients with multiple long-term conditions, particularly elderly and frail, the model of integrated care will require active co-ordination of the full range of support, including lifestyle and acute care.
• Provide more responsive and patient-centred services across the seven days in order to reduce variation in outcomes for patients ;
• Design services that maximise quality and achieve an increase in productivity, with greater use of technology, including telehealth and telecare.

Future workforce needs and priorities
In order to achieve the service ambitions the following future workforce needs and priorities have been identified in consultation with stakeholders:
The future workforce will need to be:
• Adaptable, with skills responsive to new evidence and new models of care;
• Able to meet patient needs at all times and in all settings;
• Capable of working collaboratively with patients and carers, helping them to manage their own care;
• Able to provide and co-ordinate holistic care in all areas of physical and mental health;
• Compassionate, caring, with high levels of knowledge;
In order to develop the workforce with the above skills and behaviours, the following need to be priority areas:
• Developing career progression for staff in bands 1-4;
• “Growing your own” workforce, ensure wider participation of staff in education and training;
• Developing transferability of skills to enable flexible working across sectors and teams, across health and social care;
• Developing capacity and competencies of staff working in the community, primary care and social care;
• Maximising knowledge of technology;
• Developing common core training for all staff, particularly in dementia and care of the elderly;
• Developing new roles, such as Physician associates, that will increase workforce supply;
• Increasing pre-registration commissions to address shortfall of registered professionals, particularly Adult nurses;
• Focusing effort on return to practice of registered professionals, particularly Adult nurses;
• Developing new education programmes to address multi-disciplinary working, clinical decision-making, risk management
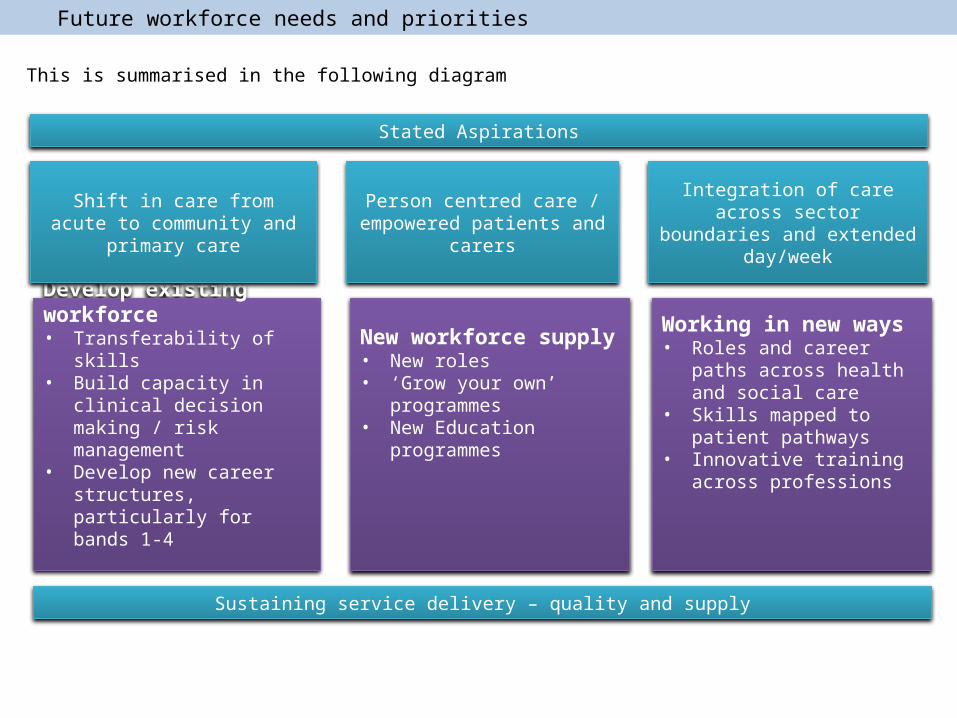
Develop existing workforce• Transferability of skills• Build capacity in clinical
decision making / risk management
• Develop new career structures, particularly for bands 1-4
Stated Aspirations
Shift in care from acute to community and primary care
Person centred care / empowered patients and carers
Integration of care across sector boundaries and extended
day/week
New workforce supply• New roles• ‘Grow your own’ programmes• New Education programmes
Working in new ways• Roles and career paths across
health and social care• Skills mapped to patient
pathways• Innovative training across
professions
Sustaining service delivery – quality and supply
This is summarised in the following diagram
Future workforce needs and priorities

13
The providers’ workforce forecasts indicate an overall 3% reduction in the number of establishment posts between 2014 and 2019, reflecting the service and financial planning background against which the NHS has been performing for the last 4 years:
• The current vacancy rates are 7% in the acute and the community sector and 12% in the mental health sector
• Existing vacancies will provide the scope for growth in staff in post numbers over the next few years.
EoE providers’ workforce forecasts 2015-2019
The significant changes in staff in post numbers in the community sector and the mental health sector in 2012 reflect the transfer of PCT clinical staff into community and MH organisations
58,884
63,704
68,20365,913
EoE NHS Acute providers' workforce
Actual SIP FTEEstablishment Plans 2014
3,594
11,316
12,062
11,353
EoE NHS Community providers' workforce
Actual SIP FTE
Establishment Plans 2014
14,189
14,873
16,596
15,565
EoE NHS Mental Health providers workforce
Actual SIP FTEEstablishment Plans 2014

14
Analysis and investment plan 2015/16

Establish development pathway for band 4 to band 5
Implementation of national bands 1-4 project deliverables
Grow your own approach
Develop education portfolio for bands 1-4
Generic skill sets / cross sector roles
Increase pre-registration commissioning
Return to Practice system wide approach Employment offer – maximise NQHP return Rotation programme for registered nurses New programmes – 2 year shortened degree; 2 year masters programme Adaptation - system wide approach for adaptation/conversion for registered nurses Pre-registration review Roll-out of CLIP
Shared streamlined recruitment processes Shared approach to overseas recruitment Flexible resourcing across organization boundaries Leadership–talent pipeline
Recruitment of GP training numbers
Recruitment, retention and career support
Commissioning pathway for Practice Nurse
Develop physicians associate role
Supply pathway and development plan
Pre-professional development
Expansion of pre-registration placements
Commission 400 paramedic trainees
Expand recruitment to ACCS EM and DREEM programmes
Advanced practitioner / physician assistants pathway and commissioning plan
Develop local opportunities for Advanced Practitioner and physicians assistants
Lead adoption and spread of N&S dementia approach, dementia alliance and training approach
Performance manage tier 1 training uptake
Establish dementia alliance
Mapping, reporting and enhancing tier one training
Development of advanced dementia training portfolio
Implementation of dementia coach, champion
Development of recruitment to values benchmark
All HEEoE programmes recruit to Values
Develop 360 behavioural modelling tool for VBC and roll out to all HEE students
Commission VBR core training package
Implementation of VBR benchmark across HEIs
VBR core training package rolled out across all EoE clinical learning environments
Clinical decision making
Skills cross sector
Common core skills set
Patient experts
Self care and health coaching
Technology
Rotations and placement redesign
Increase the number of apprenticeships and
expand the opportunities for bands
1-4 staff
Ensure effective workforce supply, responding to
identified deficits
Support the reconfiguration of
primary care at scale by workforce
transformation
Improve urgent and emergency care services
Improve patient care of frail elderly and people
with dementia
Transform patient experience through
embedding the values of the NHS Constitution in
the workforce
Bands 1-4Workforce Supply Primary Care Emergency Care Dementia Values
Ensure transferability of skills, cross sector
working and focus on patient in skills development
Skills Development
EoE regional response to workforce priorities
In response to the local providers’ workforce priorities and plans we developed a framework of activities across the seven areas of workforce development and transformation

16
Risks and confidences
As we worked through this year’s planning round and the review sessions with providers we found that…
• Strategic workforce planning provided the most valuable insights into current workforce issues and the future workforce needs. Our workforce priorities have been developed jointly with stakeholders.
• There is a strong link between the NHS vision, commissioners’ intentions and providers’ strategic workforce planning narratives;
• Development of reliable numerical forecasts remains a challenge for providers, as the need to maintain and improve quality of services becomes increasingly challenging within the current financial parameters and service configurations. Workforce forecasts will be re-visited during the 2015 planning round.
• The use of staffing planning tools remains patchy, providers need education support in this area;
• Providers’ education plans are often based on the capacity to train rather than the demand for workforce. In the future providers will receive greater support in the development of supply and demand assumptions;
• Despite the forecast reductions in demand, for some professional groups the current shortfall in supply is likely to continue into the future. Overseas recruitment of Adult nurses will continue to be one of the supply measures in the East of England.
• The EoE NHS providers are facing competition from non-NHS sector and social care providers for workforce supply. Additionally, the labour markets become increasingly global, and the international workforce flows are difficult to predict. Outflows of newly qualified graduates and experienced staff from EoE NHS present risk to supply. Maximising the EoE employment return on our educational investment in pre-registration students is one of the local priorities.

17
EoE investment decisions 2015
• To arrive at our investment decisions for 2015 we did a careful assessment of available workforce intelligence including the workforce priorities collectively developed by stakeholders, providers’ workforce and education commissioning plans and the existing and anticipated national guidance.
• For non-medical professionals we modelled future supply using best knowledge of course attrition rates and workforce flows. We made judgements about the likelihood of future over- and under-supply.
• Medical commissioning has been undertaken nationally based on workforce forecasts and planning with input from a number of stakeholders, including HEE, Medical Royal Colleges and the Centre for Workforce Intelligence.
• Changes to medical training posts are allocated locally, using a weighted capitation method and other models, such as number of deliveries in obstetrics and dialysis activity in renal medicine. Local influence has centred on where to place agreed posts rather than determining actual numbers. The EoE directorate of education and quality have fostered close working relationships with Heads of School and Programme Directors to shape the location of individual posts across Trusts based on a range of factors including: quality reports, training provided, workload activity and intensity and historical information.
• Our commissioning decisions reflect outcomes of a number of review and challenge sessions with providers and stakeholders at Workforce Partnership level and at LETB level.

18
EoE investment decisions 2015
We are planning in a complex and changing environment, with a great deal of uncertainty. Our investment choices tackle the current supply issues and anticipate the future needs, allowing for flexibility of response to new service models that are yet to emerge. Our investment in 2015 will:
• Help ensure security of future supply through investment in pre-registration commissions and post-graduate medical training;
• Develop existing staff who will be providing care in the future through investment of our workforce development fund
• Support workforce transformation projects which will pave the way to new ways of working and adoption of new roles
Indicative spend on workforce education, training and development in 2015
Non-medical pre-registration commissions £147m
Undergraduate medical training £34m
Post-graduate medical training £159m
Education support £12m
Workforce development £19m
Of which post-graduate non-medical education – £11m
Of which transformation funding - £6m
National projects £5m
Other (running costs, reserves, leadership) £17m
Total £393m
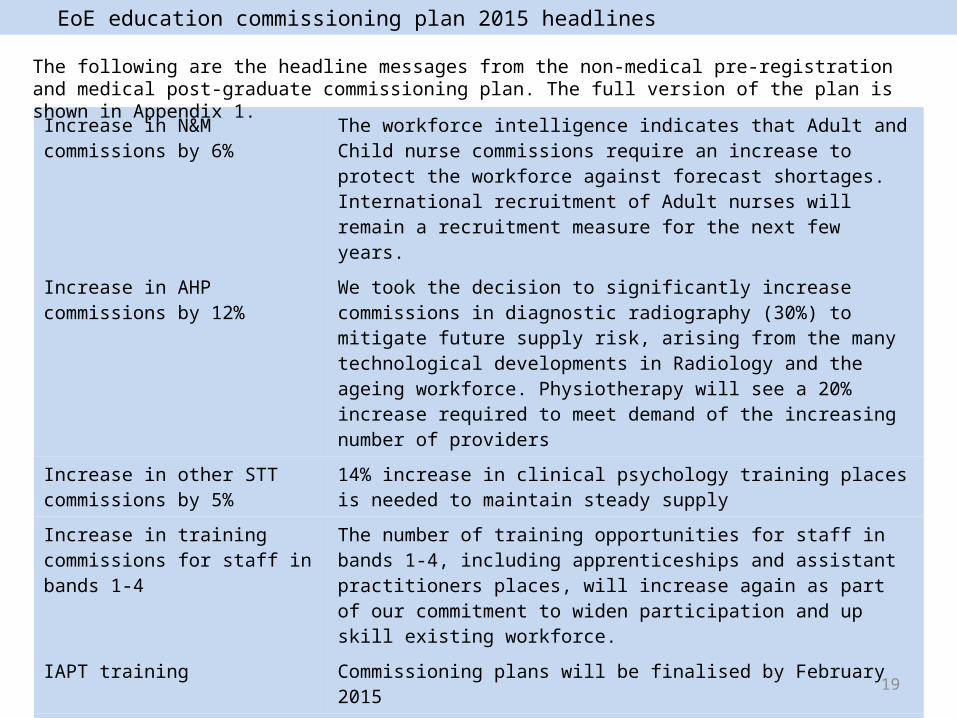
19
Increase in N&M commissions by 6%
The workforce intelligence indicates that Adult and Child nurse commissions require an increase to protect the workforce against forecast shortages. International recruitment of Adult nurses will remain a recruitment measure for the next few years.
Increase in AHP commissions by 12%
We took the decision to significantly increase commissions in diagnostic radiography (30%) to mitigate future supply risk, arising from the many technological developments in Radiology and the ageing workforce. Physiotherapy will see a 20% increase required to meet demand of the increasing number of providers
Increase in other STT commissions by 5%
14% increase in clinical psychology training places is needed to maintain steady supply
Increase in training commissions for staff in bands 1-4
The number of training opportunities for staff in bands 1-4, including apprenticeships and assistant practitioners places, will increase again as part of our commitment to widen participation and up skill existing workforce.
IAPT training Commissioning plans will be finalised by February 2015
Increase in training of Paramedics
EoE paramedics will be trained through a university diploma route and on the job within the EoE Ambulance Trust. We plan a significant increase in the number of students joining the paramedic training this year (up to 600 students).
Increase in medical commissions by 2%
The numbers of training posts will increase in acute care programme by 20% and general practice by 14%.
EoE education commissioning plan 2015 headlines
The following are the headline messages from the non-medical pre-registration and medical post-graduate commissioning plan. The full version of the plan is shown in Appendix 1.

20
Appendix 1
EoE non-medical and medical commissioning plan 2015

EoE non-medical education commissioning plan 2015
The following pages show our plan for commissioning non-medical training places
SpecialtySep-14
CommissionsSep-15
CommissionsPercentage
ChangeCommentary
Adult Nursing 1329 1430 8% IncreaseChildren's Nursing 139 150 8% IncreaseLearning Disabilities Nursing 42 42 0% Steady stateMental Health Nursing 273 273 0% Steady stateTotal Nursing 1783 1895 6% Increase
Midwifery 273 287 5% Increase
Physiotherapy 118 142 20% IncreaseOccupational Therapy 115 123 7% IncreaseSpeech and Language Therapy 50 50 0% Steady stateDietetics 30 32 7% IncreaseRadiography (Diagnostic) 74 96 30% IncreaseRadiography (Therapeutic) 42 39 -7% DecreaseAHP Other 14 16 14% IncreaseTotal AHP 443 498 12% Increase
Health Visiting 103 99 -4% Decrease
Operating Department Practitioner 96 101 5% IncreasePre-Registration Pharmacist 73 72.5 -1% DecreasePre-Registration Pharmacy Technician 40 42 5% IncreaseClinical Psychology 42 48 14% IncreaseOther Therapeutic and Technical Staff 25 26 4% IncreaseTotal Therapeutic & Technical Staff 276 289.5 5% Increase

EoE non-medical education commissioning plan 2015
Assistant Practitioner 309 371 20% IncreaseApprenticeships 1731 2000 16% IncreaseMaternity Support Workers 31 39 26% IncreaseTotal Bands 1-4 2071 2410 16% Increase
PTP Healthcare Science 41 62 51% IncreaseSTP Healthcare Science 20 20 0% IncreaseHSST Healthcare Science 2 6 200% IncreaseTotal Healthcare Science 63 112 78% Increase
Total 5012 5591 12% Increase
Paramedics (HEFCE-funded) 210 210 0% Steady stateParamedics (on the job training) 600 n/a Increase

EoE medical commissioning plans 2015
SpecialtySep-14
CommissionsSep-15
CommissionsPercentage
ChangeCommentary
Foundation Programme Year 1 618 618 0% Steady stateCore TrainingCore Medical Training 248 248 0% Steady stateCore Psychiatry Training 125 125 0% Steady stateCore Surgical Training 100 100 0% Steady stateAcute Care Common Stem - Acute Medicine 29 29 0% Steady stateAcute Care Common Stem - Anaesthesia 28 28 0% Steady stateAcute Care Common Stem and run-through 90 108 20% IncreaseDirect Recruitment into EM at ST3 (DREM) 15 15 0% Steady stateEM ST4 153 153 0% Steady stateCore Anaesthetics Training 111 111 0% Steady state
Sub Total 899 917 2% IncreaseIntensive Care Medicine Steady stateIntensive Care Medicine 30 30 0% Steady stateAnaesthetics 114 114 0% Steady state
Sub Total 144 144 0% Steady state
The following pages show our plan for commissioning medical training posts at the foundation, core training and higher specialty training level.
We plan for steady state in commissions on all medical specialties, except for the increases in General Practice and Emergency Medicine (through increased recruitment in Emergency Medicine pathways training, including Direct Recruitment into Emergency Medicine and the offer of run through training).

EoE medical commissioning plans 2015
SpecialtySep-14
CommissionsSep-15
CommissionsPercentage
ChangeCommentary
MedicineRespiratory Medicine 42 42 0% Steady stateDermatology 12 12 0% Steady stateNeurology 18 18 0% Steady stateCardiology 64 64 0% Steady stateRheumatology 24 24 0% Steady stateGenito-urinary Medicine 3 3 0% Steady stateClinical Pharmacology and Therapeutics 5 5 0% Steady stateGeriatric Medicine 43 43 0% Steady stateMedical Oncology 10 10 0% Steady stateClinical Physiology 6 6 0% Steady stateClinical Neurophysiology 2 2 0% Steady stateRenal Medicine 19 19 0% Steady stateNuclear Medicine single CCT 1 1 0% Steady stateEndocrinology and Diabetes Mellitus 26 26 0% Steady stateGastroenterology 41 41 0% Steady stateClinical Genetics 6 6 0% Steady stateClinical Oncology 17 17 0% Steady stateAllergy 3 3 0% Steady stateAcute Internal Medicine 39 39 0% Steady stateHaematology 20 20 0% Steady stateImmunology 4 4 0% Steady stateRehabilitation Medicine 4 4 0% Steady stateSport and Exercise Medicine 3 3 0% Steady stateOccupational Medicine 5 5 0% Steady statePalliative Medicine 16 16 0% Steady stateMedical Ophthalmology 3 3 0% Steady stateStroke Medicine 15 15 0% Steady stateMetabolic Medicine 0 0 Steady state
Sub Total 451 451 0% Steady state

EoE medical commissioning plans 2015
SpecialtySep-14
CommissionsSep-15
CommissionsPercentage
ChangeCommentary
Surgery Steady stateGeneral Surgery 71 71 0% Steady statePaediatric Surgery 4 4 0% Steady stateOtolaryngology 25 25 0% Steady stateTrauma and Orthopaedic Surgery 54 54 0% Steady stateUrology 17 17 0% Steady statePlastic Surgery 26 26 0% Steady stateCardio-thoracic surgery 13 13 0% Steady stateVascular Surgery 3 3 0% Steady stateOral and Maxillo-facial Surgery 6 6 0% Steady state
Sub Total 219 219 0% Steady statePsychiatry Steady statePsychiatry of Learning Disability 14 14 0% Steady stateGeneral Psychiatry 71 71 0% Steady stateChild and Adolescent Psychiatry 16 16 0% Steady stateForensic Psychiatry 7 7 0% Steady stateMedical Psychotherapy 0 0 Steady stateOld Age Psychiatry 22 22 0% Steady state
Sub Total 130 130 0% Steady stateDental Foundation Programme Training 46 46 0% Steady stateDentistry Steady stateOrthodontics 8 8 0% Steady stateOral Surgery 1 1 0% Steady stateDental Public Health 1 1 0% Steady state
Sub Total 10 10 0% Steady state

EoE medical commissioning plans 2015
SpecialtySep-14
CommissionsSep-15
CommissionsPercentage
ChangeCommentary
Run through programmes Steady statePaediatrics 226 226 0% Steady stateOphthalmology 40 40 0% Steady stateObstetrics and Gynaecology 161 161 0% Steady stateChemical Pathology 4 4 0% Steady stateHistopathology 40 40 0% Steady stateClinical Radiology 95 95 0% Steady statePaediatric and perinatal pathology 1 1 0% Steady statePublic Health Medicine 40 40 0% Steady stateGeneral Practice 292 332 14% Increase
Sub Total 899 939 4% IncreaseMedical Micobiology 13 13 0% Steady stateMedical Virology 2 2 0% Steady stateInfectious Diseases 5 5 0% Steady state
Sub Total 20 20 0% Steady stateInfection Training/Medical Microbiology 13 13 0% Steady stateInfection Training/Medical Virology 2 2 0% Steady stateInfection Training/Infectious Diseases 5 5 0% Steady state
Sub Total 20 20 0% Steady stateTotal 3456 3514 2% Increase

27
Appendix 2
EoE forecast supply by professional group

28
The purpose of the forecast supply intelligence is to inform validation of providers’ education commissioning plans. Because the future is uncertain, providers’ workforce forecasts are of limited value as an indicator of workforce demand in 5 years. We developed supply forecasts in order to determine which professions are likely to be experiencing reducing supply in the future; we then made judgments about the desired level of supply based on all workforce intelligence we have access to, and the required direction of travel for education commissioning numbers to support the desired level of supply.
The following slides provide a forecast supply position for most non-medical professions for which we commission training. The terminology used is as follows:
• “Establishment to be filled” is the level of steady overall demand, assuming reduction in vacancy rate to 3%;
• “Forecast supply” is estimated local supply based on assumptions about newly qualified output, retirements and workforce flows;
• “Forecast over- or under-supply “ is the gap between the “forecast supply” and the “establishment to be filled”
The direction of travel for commissions is the outcome of the multi-professional review of providers’ education commissioning plans.
The purpose of forecast supply modellingEoE stakeholders’
workforce prioritiesProviders’ workforce forecasts (demand)
Providers’ education commissioning plans
Validation of providers’ plans against:
1. EoE workforce priorities2. Forecast supply and demand3. National policy
EoE education commissioning plan

29
Adult nurse
Direction of travel for commissions:
• A number of key policy documents: the Francis enquiry, Keogh review and Berwick review• NQB guidance 2013, NICE guidance 2014• The use of staffing planning tools by providers is patchy;• Shortages are reported in all four Workforce Partnerships areas
Supply forecast assumptions
Mar-14 Mar-15 Mar-16 Mar-17 Mar-18 Mar-190
5000
10000
15000
20000
25000
-2000-1800-1600-1400-1200-1000-800-600-400-2000
-1826
-1444-1661
-1821 -1842 -1847
Forecast supply FTE
establishment to be filled assuming vac. rate, FTE
Forecast Over/under-supplyDe
mand and Supply FTE
Over/under-supply
Staff aged 55+: 13%Net outflow from EoE NHS: -1% of SIP p.a. Course attrition: 2820%Attrition after graduation: 5%
Establishment to be filled (for model): 5% growth over 5 years
Supply is forecast to reduce by 3.4% over 5 years
Increase in commissions is agreed because our forecast indicates under-supply is likely
Context:

30
Child nurse
Direction of travel for commissions:
• Growing public health needs specific to children;• Child health profiles indicate issues in parts of Norfolk, Suffolk and Bedfordshire where child health
indicators are below England average;• Shortages are reported in some parts of the region
Supply forecast assumptions
Staff aged 55+: 7%Net outflow from EoE NHS: -4% of SIP p.a. Course attrition: 2222%Attrition after graduation: 5%
Establishment to be filled (for model): 5% growth over 5 years
Supply is forecast to increase by 30% over 5 years
A small increase in commissions is agreed to tackle localised supply issues
Context:
Mar-14 Mar-15 Mar-16 Mar-17 Mar-18 Mar-190
200
400
600
800
1000
1200
-100
-50
0
50
100
150
200
250
-66
-1
41
87
141
194
Forecast supply FTE
establishment to be filled assuming vac. rate, FTE
Forecast Over/under-supply
Demand and Supply FTE
Over/under-supply

31
Mental Health nurse
Direction of travel for commissions:
• A number of key policy documents: the Francis enquiry, Keogh review and Berwick review• NQB guidance 2013, NICE guidance 2014; The use of staffing planning tools by providers is patchy;• Reports of shortages of experienced MH nurses; outflows from Essex and Beds and Herts to
London• Older workforce; unfilled vacancies of 8%
Supply forecast assumptions
Staff aged 55+: 16%Net outflow from EoE NHS: -2% of SIP p.a.Course attrition: 26%20%Attrition after graduation: 5%
Establishment to be filled (for model): 5% growth over 5 years
Supply is forecast to reduce by 1% over 5 years
Steady state in commissions is agreed, reflecting providers plans for service reconfiguration
Context:
Mar-14 Mar-15 Mar-16 Mar-17 Mar-18 Mar-190
500
1000
1500
2000
2500
3000
3500
4000
-350
-300
-250
-200
-150
-100
-50
0
-295
-181-208 -210 -209 -207
Forecast supply FTE
establishment to be filled assuming vac. rate, FTE
Forecast Over/under-supply
Demand and Supply FTE
Over/under-supply

32
Midwife
Direction of travel for commissions:
• NQB guidance 2013, NICE guidance 2014• Patchy use of staffing guidance and Birth Rate Plus tool therefore uncertainty about staffing needs
in the future• To maintain commissions at steady state is one of the HEE Mandate deliverables
Supply forecast assumptions
Staff aged 55+: 13%Net outflow from EoE NHS: -2% of SIP p.a. Course attrition: 2720%Attrition after graduation: 5%
Establishment to be filled (for model): 4% growth over 5 years
Supply is forecast to increase by 15% over 5 years
A small increase in commissions is agreed to tackle localised supply issues
Context:
Mar-14 Mar-15 Mar-16 Mar-17 Mar-18 Mar-190
500
1000
1500
2000
2500
3000
-150
-100
-50
0
50
100
150
200
250
300
-101
14
65
132176
240
Forecast supply FTE
establishment to be filled assuming vac. rate, FTE
Forecast Over/under-supply
Demand and Supply FTE
Over/under-supply

33
Clinical Psychologists
Direction of travel for commissions:
• Significant change in staff in post numbers in the past;• Significant outflows due to demand from the non-NHS sector, ranging between -4% and -7% p.a. of
staff in post;• Retention of supply is an issue
Supply forecast assumptions
Staff aged 55+: 10%Net outflow from EoE NHS: -4% of SIP p.a.Course attrition: 5%Attrition after graduation: 0%
Establishment to be filled (for model): 4% growth over 5 years
Supply is forecast to increase by 1% over 5 years
An increase in commissions is agreed in response to likely future under-supply
Context:
Mar-14 Mar-15 Mar-16 Mar-17 Mar-18 Mar-19 Mar-200
100
200
300
400
500
600
700
-45-40-35-30-25-20-15-10-50
-41
-19 -17 -17 -19 -20 -20
Forecast supply FTE
establishment to be filled assuming vac. rate, FTE
Forecast Over/under-supply
Demand and Supply FTE
Over/under-supply

34
Diagnostic Radiographers
Direction of travel for commissions:
• Demand is likely to grow due emergency care, 7 day working and stroke targets. • Radiographers provide skill mix in Radiology which is an area of growth. • Persistent shortage of ultra-sonographers in EoE; • High retirement rate
Supply forecast assumptions
Staff aged 55+: 16%Net outflow from EoE NHS: -3% of SIP p.a.Course attrition: 2120%Attrition after graduation: 5%
Establishment to be filled (for model): 7% growth over 5 years
Supply is forecast to decrease by 10% over 5 years
A significant increase in commissions is agreed in response to significant forecast under-supply
Context:
Mar-14 Mar-15 Mar-16 Mar-17 Mar-18 Mar-190
200
400
600
800
1000
1200
1400
1600
-250
-200
-150
-100
-50
0
-123-104
-123-147
-176
-205
Forecast supply FTE
establishment to be filled assuming vac. rate, FTE
Forecast Over/under-supply
Demand and Supply FTE
Over/under-supply

35
Dieticians
Direction of travel for commissions:
• Not a hotspot currently• Growing public health roles likely to impact on NHS providers• Obesity agenda
Supply forecast assumptions
Staff aged 55+: 8%Net outflow from EoE NHS: -1% of SIP p.a.Course attrition: 15%Attrition after graduation: 0%
Establishment to be filled (for model): 1% growth over 5 years
Supply is forecast to increase by 14% over 5 years
A small increase in commissions is agreed to tackle localised supply issues
Context:
Mar-14 Mar-15 Mar-16 Mar-17 Mar-18 Mar-190
50
100
150
200
250
300
350
400
450
-20
-10
0
10
20
30
40
50
-15
7
17
25
36
46
Forecast supply FTE
establishment to be filled assuming vac. rate, FTE
Forecast Over/under-supply
Demand and Supply FTE
Over/under-supply

36
Occupational Therapists
Direction of travel for commissions:
• Difficulty recruiting to bands 7 and 8 in EoE NHS • Demand from non-NHS sector where there is difficulty recruiting to posts too; • Uncertainty about Cambridgeshire Community Services due to the contract end
Supply forecast assumptions
Staff aged 55+: 11%Net outflow from EoE NHS: -6% of SIP p.a.Course attrition: 2320%Attrition after graduation: 5%
Establishment to be filled (for model): 5% growth over 5 years
Supply is forecast to decrease by 10% over 5 years
An increase in commissions is agreed in response to likely future under-supply
Context:
Mar-14 Mar-15 Mar-16 Mar-17 Mar-18 Mar-190
200
400
600
800
1000
1200
1400
1600
-250
-200
-150
-100
-50
0
-112-88
-102-121
-185-205
Forecast supply FTE
establishment to be filled assuming vac. rate, FTE
Forecast Over/under-supply
Demand and Supply FTE
Over/under-supply

37
Operating Department Practitioners
Direction of travel for commissions:
• Currently a hotspot in Cambridgeshire, Bedfordshire and Hertfordshire; • Anecdotes of attrition to private sector; data supports a significant outflow of staff from NHS last
year, 6% of staff in post;• Shortages of experienced staff;
Supply forecast assumptions
Staff aged 55+: 11%Net outflow from EoE NHS: -6% of SIP p.a.Course attrition: 2320%Attrition after graduation: 5%
Establishment to be filled (for model): 0% growth over 5 years
Supply is forecast to increase by 1% over 5 years
A small increase in commissions is agreed to tackle localised supply issues
Context:
Mar-14 Mar-15 Mar-16 Mar-17 Mar-18 Mar-190
100
200
300
400
500
600
700
800
900
1000
-30
-25
-20
-15
-10
-5
0
5
10
15
-26
-3 -4
0
5
9
Forecast supply FTE
establishment to be filled assuming vac. rate, FTE
Forecast Over/under-supply
Demand and Supply FTE
Over/under-supply

38
Pharmacists
Direction of travel for commissions:
• Awareness of potentially new roles for the pharmacy workforce in Emergency Care in the future in conjunction with community pharmacies: more pharmacist prescribers, pharmacy triaging of patients and medicines reconciliation.
• There is recognition that the employment market is more buoyant compared with the past 2-3 years
Supply forecast assumptions
Staff aged 55+: 10%Net outflow from EoE NHS: -4% of SIP p.a.Course attrition: 5%Attrition after graduation: 5%
Establishment to be filled (for model): 4% growth over 3 years
Supply is forecast to increase by 8% over 3 years
Steady state in commissions
Context:
Mar-14 Mar-15 Mar-16 Mar-170
100
200
300
400
500
600
700
800
-60-50-40-30-20-10010203040
-10
9
27Forecast supply FTE
establishment to be filled assuming vac. rate, FTE
Forecast Over/under-supply
Demand and Supply FTE
Over/under-supply

39
Pharmacy Technicians
Direction of travel for commissions:
• Awareness of potentially new roles for the pharmacy workforce;• Pharmacy Technicians provide the flexibility within the pharmacy workforce to develop skill mix
opportunities and develop new ways of working across a range of organisations;• There is recognition that the employment market is more buoyant compared with the past 2-3 years
Supply forecast assumptions
Staff aged 55+: 12%Net outflow from EoE NHS: -1% of SIP p.a.Course attrition: 15%Attrition after graduation: 5%
Establishment to be filled (for model): 1% growth over 4 years
Supply is forecast to increase by 1% over 4 years
A small increase in commissions is agreed to tackle localised supply issues
Context:
Mar-14 Mar-15 Mar-16 Mar-17 Mar-180
100
200
300
400
500
600
700
800
-30
-25
-20
-15
-10
-5
0
5
10
-8 -8
-2
4Forecast supply FTE
establishment to be filled assuming vac. rate, FTE
Forecast Over/under-supply
Demand and Supply FTE
Over/under-supply

40
Physiotherapists
Direction of travel for commissions:
• Impact of significant amount of private sector provision; • Difficulty recruiting to bands 6 and 7 but not a problem for band 5;• Recognition of the need to develop newly qualified to level 1 and 2 as opposed to increasing entries
at band 5
Supply forecast assumptions
Staff aged 55+: 6%Net outflow from EoE NHS: -3% of SIP p.a.Course attrition: 11%Attrition after graduation: 5%
Establishment to be filled (for model): 3% growth over 5 years
Supply is forecast to increase by 4% over 5 years
An increase in commissions is agreed to tackle localised supply issues
Context:
Mar-14 Mar-15 Mar-16 Mar-17 Mar-18 Mar-190
200400600800
100012001400160018002000
-120
-100
-80
-60
-40
-20
0
20
40
-98
-22
017
-3
12Forecast supply FTE
establishment to be filled assuming vac. rate, FTE
Forecast Over/under-supply
Demand and Supply FTE
Over/under-supply

41
Speech and Language Therapists
Direction of travel for commissions:
• Significant outflow from NHS in the past; retention is key if commissions to remain at steady state;• Difficulty recruiting to bands 6+ across all specialties; in some specialties (Learning Disabilities)
difficulty recruiting to band 5 too;• Impact of increasing number of private sector providers, particularly education
Supply forecast assumptions
Staff aged 55+: 9%Net outflow from EoE NHS: -4% of SIP p.a.Course attrition: 14%Attrition after graduation: 5%
Establishment to be filled (for model): 1% growth over 5 years
Supply is forecast to increase by 1% over 5 years
Steady state in commissions is agreed
Context:
Mar-14 Mar-15 Mar-16 Mar-17 Mar-18 Mar-190
100
200
300
400
500
600
700
-25
-20
-15
-10
-5
0
5
10
15
-22
3
10 11
-7-9
Forecast supply FTE
establishment to be filled assuming vac. rate, FTE
Forecast Over/under-supply
Demand and Supply FTE
Over/under-supply

42
Therapeutic Radiographers
Direction of travel for commissions:
• Not a hotspot currently• Potential impact of “proton beam” by 2018• Increasing cancer rates
Supply forecast assumptions
Staff aged 55+: 9%Net outflow from EoE NHS: -1% of SIP p.a.Course attrition: 4730%Attrition after graduation: 5%
Establishment to be filled (for model): 1% growth over 5 years
Supply is forecast to increase by 24 % over 5 years
A small reduction in commissions is agreed because of likely future oversupply
Context:
Mar-14 Mar-15 Mar-16 Mar-17 Mar-18 Mar-190
50
100
150
200
250
300
350
400
-20
-10
0
10
20
30
40
50
60
70
80
-12
8
20
35
51
67
Forecast supply FTE
establishment to be filled assuming vac. rate, FTE
Forecast Over/under-supply
Demand and Supply FTE
Over/under-supply


