64
Eastern Cape Forestry Sector Profile Greenline Business Management (Pty) Ltd. October 2007

Eastern Cape Forestry Sector Profile
Greenline Business Management (Pty) Ltd. October 2007

Final
Page 1
TABLE OF CONTENTS
1 INTRODUCTION ...........................................................................................3
2 METHODOLOGY ..........................................................................................4
2.1 Limitations ............................................................................................6
3 ACKNOWLEDGEMENTS .............................................................................7
4 PLANTATIONS .............................................................................................9
4.1 Existing Plantations .............................................................................9 4.2 Potential for New Afforestation .........................................................14
5 NATURAL FORESTS AND WOODLANDS................................................17
6 FOREST-USE ACTIVITIES.........................................................................19
6.1 Timber Products .................................................................................19 6.2 Furniture Manufacture........................................................................22 6.3 Non-Timber Forest Products .............................................................23
7 CONTRIBUTION TO EMPLOYMENT .........................................................25
8. CONTRIBUTION TO THE ECONOMY........................................................28
8 TRENDS IN THE SECTOR .........................................................................33
8.1 Forestry Licences...............................................................................33 8.2 Fire Damage ........................................................................................35 8.3 Reforestation and New Plantations...................................................38 8.4 Deforestation of Indigenous Forests ................................................39 8.5 Plantation Yields.................................................................................40
9 MUNICIPALITIES........................................................................................41
9.1 Amathole District Municipality ..........................................................42 9.1.1 Amahlati Local Municipality....................................................42 9.1.2 Great Kei Local Municipality ...................................................43 9.1.3 Buffalo City Local Municipality...............................................44 9.1.4 Mbashe Local Municipality......................................................45 9.1.5 Mnquma Local Municipality ....................................................46 9.1.6 Nkonkobe Local Municipality..................................................47
9.2 Chris Hani District Municipality.........................................................48 9.2.1 Emalahleni Local Municipality ................................................48 9.2.2 Ngcobo Local Municipality......................................................49 9.2.3 Intsika Yethu Local Municipality.............................................50 9.2.4 Sakhisizwe Local Municipality................................................51
9.3 OR Tambo District Municipality ........................................................52

Final
Page 2
9.3.1 KSD Local Municipality ...........................................................52 9.3.2 Mbizana Local Municipality.....................................................53 9.3.3 Mhlontlo Local Municipality ....................................................54 9.3.4 Qaukeni Local Municipality.....................................................55 9.3.5 Ntabankulu Local Municipality ...............................................56 9.3.6 Nyandeni Local Municipality...................................................57 9.3.7 Port St Johns Local Municipality............................................58
9.4 Ukhahlamba District Municipality .....................................................59 9.4.1 Elundini Local Municipality.....................................................59
9.5 Alfred Nzo District Municipality.........................................................60 9.5.1 Umzimvubu Local Municipality...............................................60 9.5.2 Matatiele Local Municipality....................................................61
10 SOURCES AND REFERENCES .............................................................62
Appendix A Forestry Plantations.....................................................................63 Appendix B Natural Forests ............................................................................63 Appendix C Employees in Plantations ............................................................63 Appendix D Utilisation Activities ......................................................................63
Final
Page 3
EASTERN CAPE FORESTRY SECTOR PROFILE
1 INTRODUCTION
The forestry sector in the Eastern Cape makes a significant contribution to the
rural economy and local employment. Due to biophysical characteristics, there
are substantial areas which are suitable for commercial afforestation, creating
the opportunity for more than doubling the current plantation area.
The Department of Water Affairs and Forestry (DWAF) recognises the roles of
the Provincial and Local Governments in stimulating and supporting economic
development, and has commissioned the compilation of this profile to provide
strategic level information about the forestry sector.
Situated in the mountainous areas of the province, mostly invisible from the
major roads, the sector has received little attention in the past. With a looming
national timber shortage, the dire need for rural economic development, and
investment in major new wood processing capacity, it is becoming recognised
that the forestry sector plays a legitimate and significant role in the local
economy.
This profile reflects the locality, scale and extent of plantations, forests and
forestry activities in the Eastern Cape Province. Based on inputs from officials
and industry managers, economic and employment statistics are provided.
These are then analysed at a local municipality level.

Final
Page 4
2 METHODOLOGY
This profile was compiled using existing datasets, information provided by
management staff of various enterprises, the writer’s previous experience, and
various reports by other experts.
Information about the forestry plantations was obtained from management staff
of the various DWAF management units and forestry sector companies. In an
effort to minimize the processing of information for DWAF managers (in the
absence of dedicated planning staff), compartment lists were obtained reflecting
the most recent planning exercise. These were converted from text format to
excel spreadsheets, and analysed. The managers from the private sector were
provided with information frameworks which they filled in independently and in
discussion with the writer. Further information was added from existing maps
and the knowledge of the writer.
The National Forest Inventory was used as the basis for information about the
natural forests. To reduce the number of records, forests were grouped into
‘patrols’ according to DWAF’s organisation. Common sense was applied to the
grouping of forests where they had not been divided into patrols, and the groups
were named in relation to nearby known localities. Reliable information and
maps about the extent and location of woodlands were unavailable despite
numerous attempts to obtain this information from the offices of DWAF. In
discussion with the Manager of Forestry Development, Nkosi Quvilie, it was
agreed that it would not be possible to address the woodlands section in any
detail.
The Strategic Environmental Assessment was used as a basis for information
about the forestry potential. It is recognized, however, that there are some
weaknesses, especially the overestimate of forestry potential in the
mountainous areas west of Mount Fletcher.
Final
Page 5
Information about primary processing was obtained from various sources,
namely DWAF management, the Small Sawmillers Association and sawmill
managers. Some information was extrapolated on the basis of ratios from LHA
(2004).
DWAF provided a list of activities which was compiled as part of a provincial
survey.
Information about secondary wood processing was obtained from Furntec in the
form of a list of furniture manufacturers in the province. The details did not
include scale, employment or any economic information. Rough estimates of
scale were made based on a discussion with Furntec staff.
Information related to employment and revenues was obtained mostly from the
managers of the forestry departments and companies. As expected, details
about revenues and cost components were unavailable. Estimates were
therefore made based on knowledge of product prices and current timber yields.
Detailed information about employees was provided by DWAF and by the
company managers responsible for human resources. Extrapolations from this
information were made where other information was unavailable, for example
for small sawmillers and pole treatment plants.
The maps were compiled from a combination of existing Municipal and
infrastructure data, the National Forest Inventory, the Strategic Environmental
Assessment, and additional information provided by the writer regarding
downstream processing.
A trip through the key forestry areas was undertaken, during which meetings
were held with people who provided valuable information.

Final
Page 6
7 August - Stutterheim
9 August - Port Elizabeth
13 August - Tsitsikama, Kareedouw
18 September - Mthata, Butterworth, Port St. Johns
19 September - Mt. Ayliff, Bizana
20 September - Kokstad
3 October - Maclear, Ugie, Elliot
4 October - Engobo, Cofimvaba, Queenstown, Keiskammahoek, Hogsback
and Katberg
It should be noted that the provision of information for this profile required work
additional to that of the annual forestry sector information survey commissioned
by DWAF. If this exercise were to be repeated in the future, it may be useful to
extend the terms of reference of the DWAF survey to include the information
presented in this profile, so as to avoid unnecessary duplication.
2.1 Limitations
This assignment was intended to be a desktop study. However, some
details were simply not available and time did not allow for detailed
research to be conducted. In order to provide a more coherent picture,
estimates and extrapolations using conservative figures have been made so
as to include information pertaining to scale, employment and economic
activity.
As a result of the unusually high levels of temporarily unplanted areas, the
stage of maturity of the plantations near Ugie/Maclear and unequal age-
class distributions in most plantations, and the lack of industrial wood
processing facilities, the employment and economic value of the forestry
sector is lower than it would be under normal circumstances.
Final
Page 7
It is expected that many new job opportunities will be created as new
afforestation and the rehabilitation of existing plantations gain momentum.
As the industrial processing facilities in Ugie and Kokstad come on stream,
there will be greater opportunity for harvesting and transport activities along
with the wood processing benefits.
3 ACKNOWLEDGEMENTS
In a competitive business environment where the demands on managers for
results are high, the provision of information for this report required work that is
over and above the normal workload. The willingness and generosity of time
from the following people is acknowledged gratefully: Willem Hatting, Fred
Bassett, John Ferguson and David Ngubane (Singisi Forest Products); Gary
Chaplin and Kobus Venter (P G Bison); John Rance and Louis de Kock
(Amatole Forest Products); Cassie Carstens and Willem Jakobs (MTO); Nkosi
Quvile, Sonwabile Menyelwa, Mawethu Mqalo, Shakes Soyiswapi, Lucky
Katende, Tyrus Mbiko, Charlie Gcilitshana, Vuyani Kwindla and Dan Mtathi
(DWAF Forestry); Sean Houdsen (Tekwani); Arthur West (Furntec); Fiona Lees
(Small Sawmillers); and Martin Flavell (formerly E C Veneers).

Final
Page 8
Map 1 - Existing Forestry

Final
Page 9
4 PLANTATIONS
In a global context, South Africa’s plantations represent about 1% of the world’s
forestry plantations of 109.5 million ha (FAO, 2005). The plantations of the
Eastern Cape, which total 129 334 ha in extent, represent 10% of South Africa’s
total forestry plantations.
Map 1 shows that the large majority of the Eastern Cape’s plantations are
located on the escarpment of the Amatola Mountains (near King William’s Town
and Stutterheim), Matiwane (west of Mthatha), Southern Drakensberg (Ugie,
Maclear and Elliott) and other smaller ranges of hills and mountains. One large
block of plantations is located in the Tsitsikamma area in the southernmost
region of the Eastern Cape. There are many smaller plantations scattered in the
areas formerly known as Ciskei and Transkei.
The wide and scattered distribution of forestry plantations within the Eastern
Cape presents unique logistical and managerial challenges, as scale is an
important factor in management efficiency, risk profile and the profitability of
plantations. Map 1 shows the scattered distribution of the plantations, especially
those under state management.
4.1 Existing Plantations
Most of the forestry plantations in the province were established by the
state during the early parts of the previous century. Later, during the
formation of the homelands, they were transferred to and managed by the
various governments’ agriculture and forestry departments. In the years
prior to the abolishment of the homelands, Safcol was established as a
state-owned company to manage the plantations in the “old” South Africa.
Safcol later formed Mountain to Ocean (MTO), under which Safcol’s
Eastern Cape plantations were managed. After the abolishment of the

Final
Page 10
homelands, the various government plantations were brought under the
new government’s Department of Water Affairs and Forestry (DWAF). A
large new plantation was established in the Ugie/Maclear area by Anglo-
American Corporation, and this has recently been acquired by P G Bison.
Table 1 shows that 51% of the province’s plantations are privately owned,
while 46% are state-owned (MTO and DWAF). 103 807 ha (81%) are Pine
plantations. Until recently, the objective of these plantations was the
production of sawtimber over long rotations (25 years and longer). With the
operationalisation of the P G Bison chipboard plant in Ugie, the opportunity
exists for the rotation length of some of the plantations to be shortened.
Gum and wattle species are used mainly for local building, fencing and
fuelwood purposes, although in some areas they have commercial uses,
mainly for treated pole manufacture.
Pine Gum Wattle Other TotalPrivate 58733 5811 15 1923 66481State 45094 13329 1206 306 59935Community 2361 556 2917Total 103827 21501 1777 2229 129334
Ownership Existing Forestry Area (hectares)
Table 1 - Ownership of Existing Forestry Plantations
In addition to the information tabled, there are many areas in which
plantation species, mainly wattle, exist in unmanaged jungles. It is
estimated from discussions with people involved in the forestry sector that
there are around 5 000 ha of such trees within the province. In some areas
there is the potential to fell, re-establish and manage such stands for
commercial or other purposes, whereas in other areas the stands may be
subject to environmental constraints.

Final
Page 11
The distribution of age-classes is important in forestry management in that it
reflects the sustainability of plantation timber production. Table 2 shows the
age-class distribution of the Pine plantations in the province under private
and state ownership. Of concern is that 49% of the state plantations are
either Temporarily Unplanted (TU) or younger than 5 years old. This
situation has arisen due to devastating fires in the Tsitsikamma area over
the past few years, as well as from an inability to fully meet operational and
management objectives within the cumbersome policy and procedural
frameworks of government departments.
The variation in area within the age-class of private plantations is a result of
the stage of maturity of the new plantations in Elundini, as well as the
strident efforts at rehabilitation of restructured state plantations by the new
private sector operators.
Private State Total5 11299 11657 2295510 6215 6901 1311615 14926 4102 1902820 15414 4923 2033625 2827 1960 478730 3570 3809 737935 878 1248 2125>35 657 657TU 3605 9837 13442Total 58734 45093 103827
Age Class (Years)
Pine Area (hectares)
Table 2 - Age-Class Distribution of Pine Plantations
Nearly 50% of the province’s plantations are managed and operated by P G
Bison (private) and MTO (state-owned). 23% of the plantations are
managed and operated by DWAF. Other significant private sector operators
are Singisi Forest Products (14%) and Amathole Forestry Company (11%).
Final
Page 12
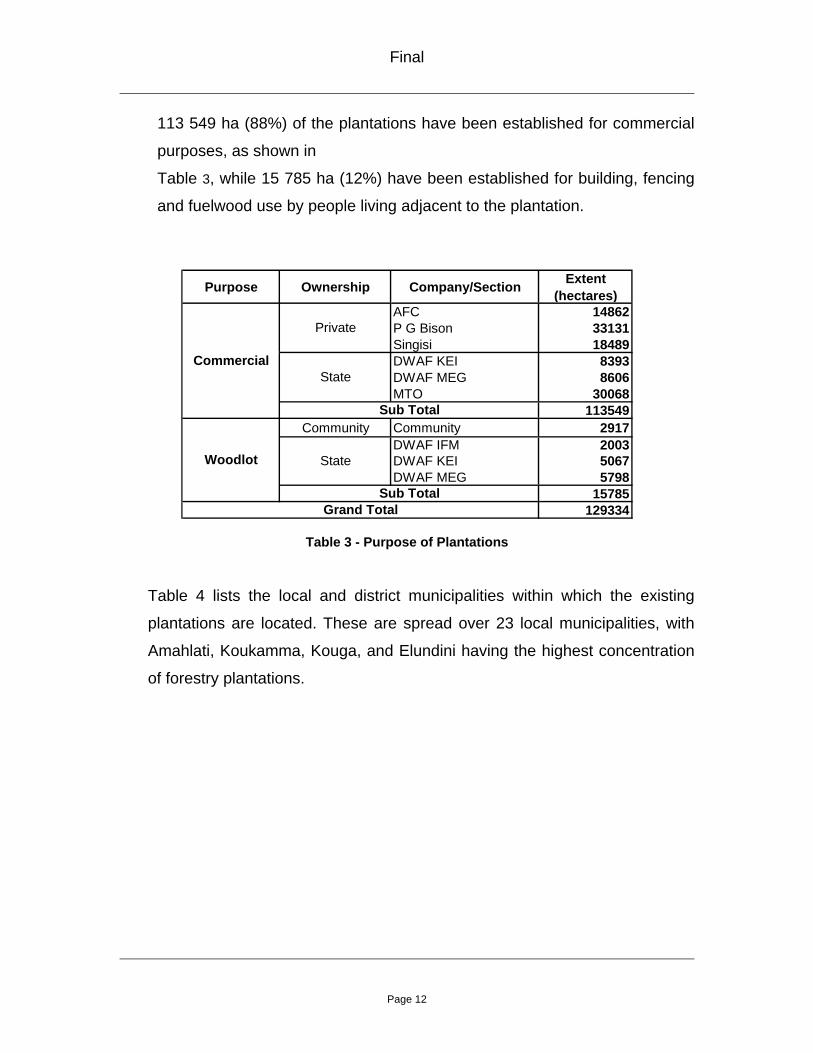
113 549 ha (88%) of the plantations have been established for commercial
purposes, as shown in
Table 3, while 15 785 ha (12%) have been established for building, fencing
and fuelwood use by people living adjacent to the plantation.
Purpose Ownership Company/Section Extent
(hectares)AFC 14862P G Bison 33131Singisi 18489DWAF KEI 8393DWAF MEG 8606MTO 30068
113549Community Community 2917
DWAF IFM 2003DWAF KEI 5067DWAF MEG 5798
15785129334Grand Total
Private
State
StateWoodlot
Sub Total
Sub Total
Commercial
Table 3 - Purpose of Plantations
Table 4 lists the local and district municipalities within which the existing
plantations are located. These are spread over 23 local municipalities, with
Amahlati, Koukamma, Kouga, and Elundini having the highest concentration
of forestry plantations.

Final
Page 13
Private State Community TotalMatatiele 400 8 408Umzimvubu 419 2812 203 3434Subtotal 419 3212 211 3842Amahlati 10950 2645 13595Buffalo City 474 53 526Mbashe 2432 30 2462Mnquma 820 543 1363Ngqushwa 57 15 72Nkonkobe 3911 110 39 4061Subtotal 14862 6538 679 22078Kouga 10634 10634KouKamma 19434 19434Subtotal 0 30068 0 30068Emalahleni 145 145Engcobo 2012 2012Intsika Yethu 5167 510 5677Lukanji 111 111Sakhisizwe 9224 455 9679Senqu 122 122Subtotal 9224 7634 887 17745Bizana 951 951KSD 6805 1572 387 8764Mbizana 376 376Mhlontlo 10314 2917 499 13730Mhontlo 50 50Ntabankulu 1140 3 1143Nyandeni 2718 105 2823Port St Johns 392 392Qaukeni 1892 43 1935Subtotal 18070 11007 1086 30164Elundini 23907 1476 54 25437Subtotal 23907 1476 54 25437
66482 59935 2917 129334
Ownership
Grand Total
ORT
Ukhahlamba
Amathole
Cacadu
Chris Hani
District Municipality
Alfred Nzo
Local Municipality
Table 4 - Distribution of Plantations within Local Municipalities

Final
Page 14
4.2 Potential for New Afforestation
The eastern portion of the Eastern Cape has large areas which are
biophysically suitable for commercial forestry. In 2003, DWAF
commissioned a Strategic Environmental Assessment (SEA) of areas that
are biophysically suitable for forestry in Water Management Area 12
(WMA12) (Umzimvubu – Keiskamma). This area covers large portions of
the district municipalities of Amathole, Ukahlamba, Alfred Nzo, O. R. Tambo
and Chris Hani.
Although there are other areas with forestry potential within the province,
WMA12 represented the area with the highest forestry potential and where
the hydrological impacts are likely to be lowest. The area has one of the
lowest total requirements for water in the country, due to relatively high
rainfall and low levels of economic activity.
The assessment identified 1 751 478 ha within DWAF’s Water Management
Area12 (WMA12)1 as having potential for commercial afforestation. 161 531
ha were identified as having “good” potential (Mean Annual Increments2 of
22 for Pine, 35 for Gum and 10 for Wattle) and 1 589 947 ha as moderate
(Mean Annual Increments of 15 for Pine, 15 for Gum and 8 for Wattle).
The areas with forestry potential were identified on the basis of biophysical
criteria after filtering out existing forestry, areas of high biodiversity,
conservation value, socio-economic value, hydrological restrictions,
infrastructural constraints, and urban and residential settlements. At this
stage the areas are merely identified as being suitable for forestry (as
opposed to available). If people with rights to the land with forestry potential
1 Only areas in WMA12 that have forestry potential have been identified in this report. 2 Mean Annual Increment is a measure of plantation growth in cubic meters per hectare per year

Final
Page 15
wished to participate in forestry, and decided to use 15% of this land for this
purpose, then up to 262 722 ha of new plantations could be possible. The
SEA assumed a more conservative target of 100 000ha as being realistic.
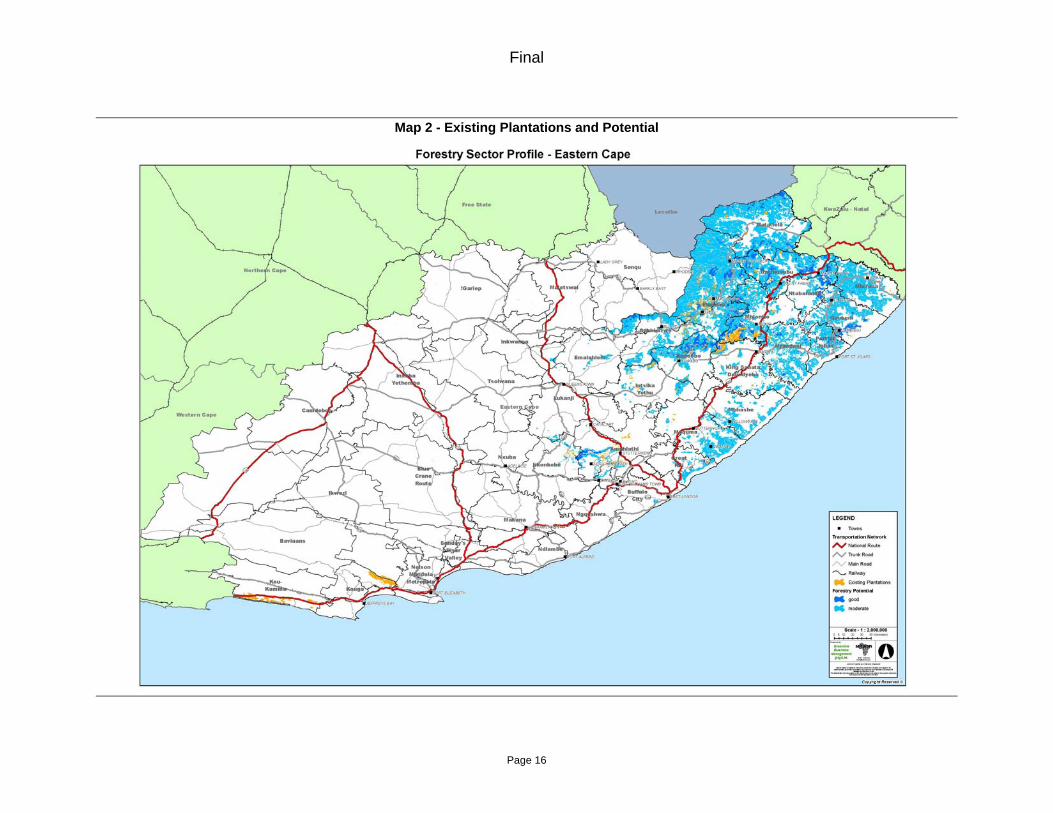
Table 5 shows the forestry potential in each of the local municipalities, at
15% of the total suitable area. The forestry potential is also shown in Map 2.
Good Moderate Total 15%Matatiele 18310 250928 269238 40386Umzimvubu 27746 131288 159035 23855Sub Total 46056 382217 428273 64241Amahlathi 6587 15802 22389 3358Great Kei 23192 23192 3479Mbhashe 50982 50982 7647Mnquma 35 65640 65675 9851Nkonkobe 1358 4931 6289 943Nxuba 6 6 1BCM 6 3783 3790 568Sub Total 7986 164336 172323 25848Emalahleni 3656 27269 30925 4639Engcobo 21181 63697 84878 12732Inkwanca 1401 1401 210Intsika Yethu 1271 23740 25011 3752Lukanji 79 3250 3329 499Sakhisizwe 987 56494 57481 8622Tsolwana 71 71 11Sub Total 27174 175923 203097 30464Mbizana 2590 119710 122301 18345Mhlontlo 16482 98735 115217 17282Ntabankulu 13467 35713 49180 7377Nyandeni 3659 101392 105050 15758Port St Johns 3984 50532 54516 8177Qaukeni 13584 83605 97189 14578KSD 2422 40363 42785 6418Sub Total 56188 530050 586237 87936Elundini 23987 331406 355393 53309Maletswai 33 33 5Senqu 140 5982 6123 918Sub Total 24127 337422 361549 54232
161531 1589947 1751478 262722
Forestry Potential (hectares)
ORT
Grand Total
District Municipality
Local Municipality
Ukahlamba
Chris Hani
Amathole
Alfred Nzo
Table 5 - New Afforestation Potential
Final
Page 16
Map 2 - Existing Plantations and Potential

Final
Page 17
5 NATURAL FORESTS AND WOODLANDS
The National Forest Inventory (NFI) identified 226 997 ha of natural forest in the
Eastern Cape. The NFI shows that 139 944 ha are named, and are assumed to
be legally demarcated forests. 87 053 ha of forest, while shown on the NFI
maps, are not identified by any names and are assumed to not be legally
demarcated. For the purposes of this report, these unnamed groups of forests
are referred to by the names of nearby localities.
These natural forests are owned and managed by the state (DWAF, DEDEA3,
municipalities), private farmers, traditional authorities and various conservation
authorities. The greatest number of individual forests are managed by DWAF
and clustered into “patrols”, as listed in Table 6.
The vegetation group referred to as “woodlands” has recently become the
responsibility of DWAF with regard to the protection and promotion of equitable
and sustainable use. The National Forest Act, according to Willis (2002),
defines woodlands as “a group of trees which are not a natural forest, but
whose crowns cover more than five per cent of the area bounded by trees
forming the perimeter of the group”. A strategic framework for the
implementation of a woodlands policy was formulated in 2005 (DWAF, 2005).
Unlike the data pertaining to forestry plantations and, to some extent, natural
forests, much work still needs to be done to carry out a reliable inventory of the
woodlands.
3 DEDEA (Department of Economic Development and Environmental Affairs)

Final
Page 18
Matatiele 1684Umzimvubu 4597Sub Total 6281Amahlathi 23435Buffalo City 16464Great Kei 4660Mbhashe 14281Mnquma 9418Ngqushwa 8087Nkonkobe 11825Nxuba 1260Sub Total 89429Baviaans 10Blue Crane Route 2707Kouga 6470Kou-Kamma 16917Makana 3740Ndlambe 5201Sunday's River Valley 13657Sub Total 48703Emalahleni 1032Engcobo 9199Intsika Yethu 1893Lukanji 991Sakhisizwe 468Sub Total 13583Nelson Mandela Metropole 4893Sub Total 4893King Sabata Dalindyebo 5727Mbizana 3719Mhlontlo 8041Ntabankulu 3353Nyandeni 13199Port St Johns 18714Qaukeni 10599Sub Total 63351Elundini 757Sub Total 757
226997
Alfred Nzo
Grand Total
District Municipality Local Municipality Extent
(Hectares)
Ukahlamba
ORT
NMM
Chris Hani
Cacadu
Amathole
Table 6 - Natural Forests

Final
Page 19
6 FOREST-USE ACTIVITIES
6.1 Timber Products
The most significant commercial activities in the forestry sector arise from
the processing of timber from the province’s commercial forestry
plantations. It is estimated that around 770 500 m3 of timber is processed in
the Eastern Cape each year, producing 328 700 m3 of sawnboard which is
mainly used in the construction sector. More than half of the raw material is
processed in three large (>50 000 m3/a), efficient sawmills that produce
high quality, softwood lumber. 25% is processed by three medium (20-49
000 m3/a), and 39 small (<20 000 m3/a) sawmills. Two other sawmills
process relatively small quantities of indigenous timber.
In addition to the sawmills there are 11 pole treatement plants, a small
chipboard operation, and a veneer plant in the province.
Type No.Roundwod
intake (m3/a)Production
(m3/a)Sawmill Large 3 382500 191250Sawmill Medium 3 93500 38900Sawmill Small 39 97500 39750Sawmill Indigenous 2 5000 2000Chipboard 1 35000 14000Pole Treatment 10 76000 30400Charcoal 7 56000 9600Veneer 1 25000 10000
Total 66 770500 335900
Table 7 - Wood Processing Activities
There is a large chipboard plant under construction at Ugie in the Elundini
Local Municipality. The coming on stream of this plant will herald an
important new era for the Eastern Cape forestry sector, as it will increase
the viability of existing plantations which have been too far from markets for
small-sized logs. It will also create greater market opportunities for faster-
Final
Page 20
growing hardwoods, and justify the management of plantations on shorter
rotations, which are likely to hold more attractive prospects for communities
who live on land which has afforestation potential.
It should be noted that due to the confinement of this report to the Eastern
Cape Province, the large (and growing) wood-processing facilities in the
Kokstad area have been excluded. In addition to two large sawmills, there is
a new plywood plant and advanced plans for additional industrial wood
processing facilities in this area.
A consistent theme throughout the information-gathering process was the
looming shortage of timber resulting from fires, uncontrolled harvesting and
a lack of timeous re-establishment after harvesting. Small sawmillers in
particular are subject to threatened wood supplies, which are already
beginning to manifest.
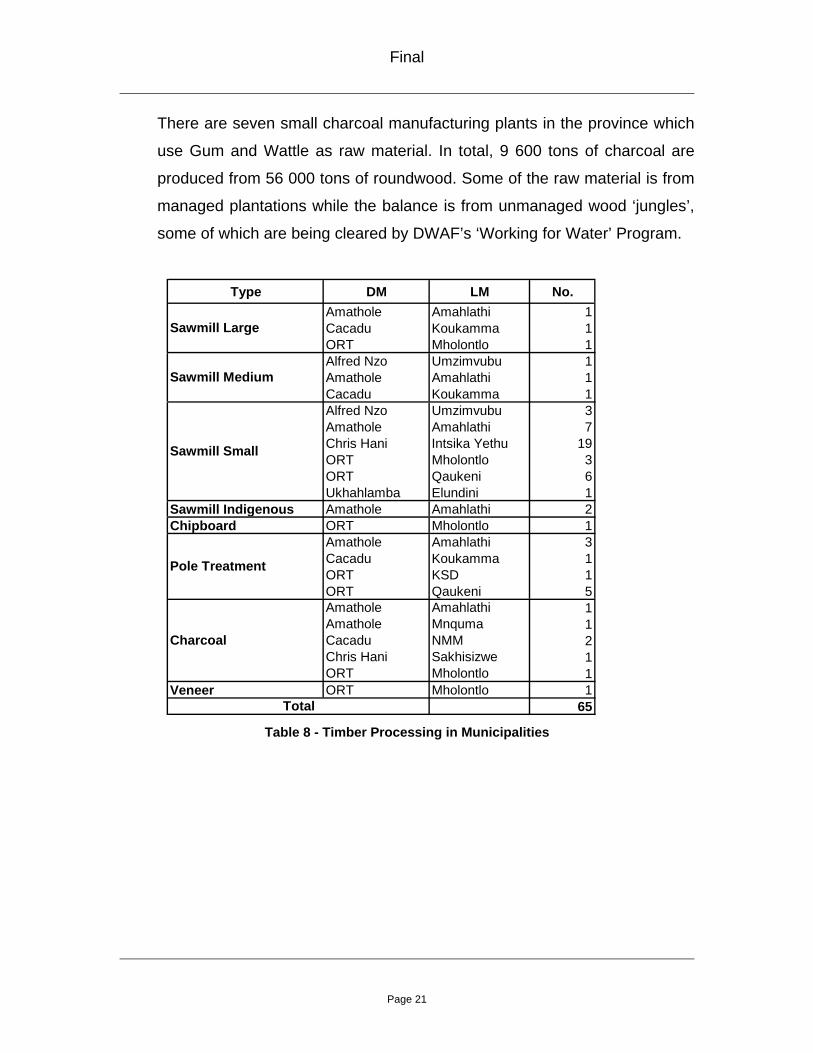
Table 8 shows the distribution of timber processing within the various
municipalities of the province. Of particular interest is the high number of
small sawmillers located in the Chris Hani DM (20%), in which fewer than
14% of the Province’s plantations are located.
The proliferation of pole treatment plants is a result of opportunities created
around Gum plantations in areas where customer requirements are lower
than South African Bureau of Standards (SABS) standards. Unlike the
pressurized treatment processes used by large processors, many of the
small plants merely dip logs into heated creosote, which results in minimal
penetration levels that are well below SABS standards.
Final
Page 21
There are seven small charcoal manufacturing plants in the province which
use Gum and Wattle as raw material. In total, 9 600 tons of charcoal are
produced from 56 000 tons of roundwood. Some of the raw material is from
managed plantations while the balance is from unmanaged wood ‘jungles’,
some of which are being cleared by DWAF’s ‘Working for Water’ Program.
Type DM LM No.Amathole Amahlathi 1Cacadu Koukamma 1ORT Mholontlo 1Alfred Nzo Umzimvubu 1Amathole Amahlathi 1Cacadu Koukamma 1Alfred Nzo Umzimvubu 3Amathole Amahlathi 7Chris Hani Intsika Yethu 19ORT Mholontlo 3ORT Qaukeni 6Ukhahlamba Elundini 1
Sawmill Indigenous Amathole Amahlathi 2Chipboard ORT Mholontlo 1
Amathole Amahlathi 3Cacadu Koukamma 1ORT KSD 1ORT Qaukeni 5Amathole Amahlathi 1Amathole Mnquma 1Cacadu NMM 2Chris Hani Sakhisizwe 1ORT Mholontlo 1
Veneer ORT Mholontlo 165Total
Sawmill Large
Sawmill Medium
Sawmill Small
Pole Treatment
Charcoal
Table 8 - Timber Processing in Municipalities
Final
Page 22
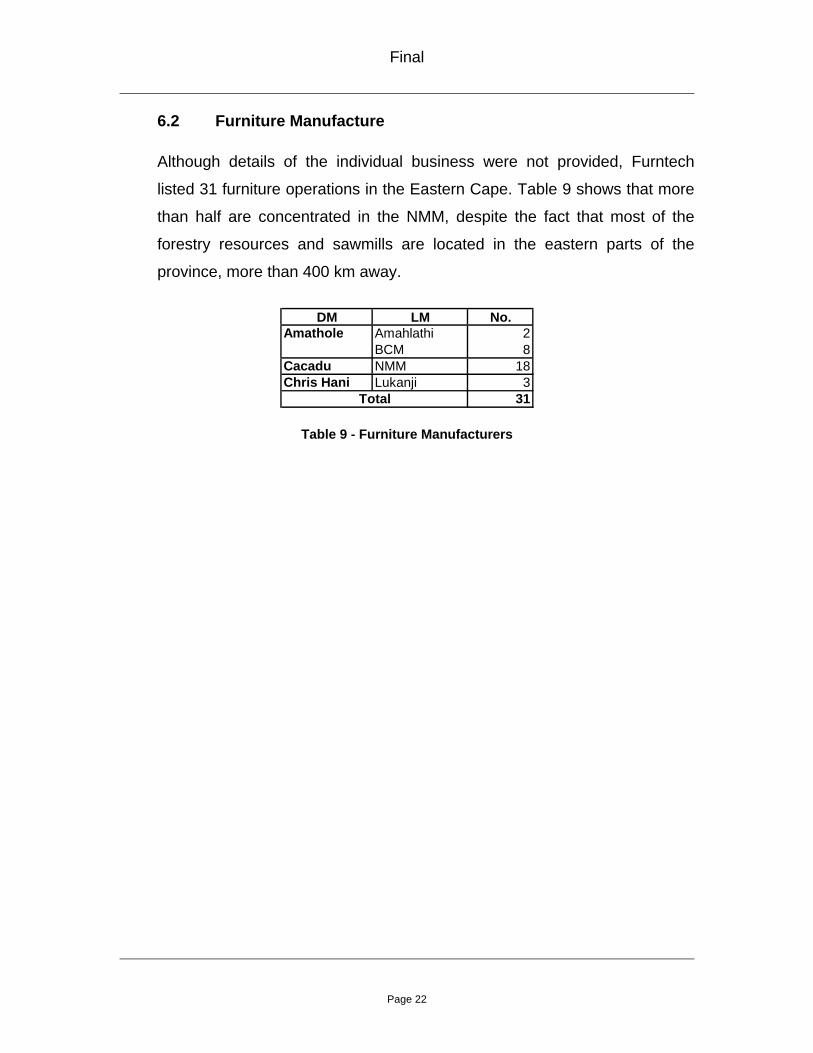
6.2 Furniture Manufacture
Although details of the individual business were not provided, Furntech
listed 31 furniture operations in the Eastern Cape. Table 9 shows that more
than half are concentrated in the NMM, despite the fact that most of the
forestry resources and sawmills are located in the eastern parts of the
province, more than 400 km away.
DM LM No.
Amathole Amahlathi 2BCM 8
Cacadu NMM 18Chris Hani Lukanji 3
31Total
Table 9 - Furniture Manufacturers
Final
Page 23
6.3 Non-Timber Forest Products Of less commercial although significant economic importance are the
varieties of Non-Timber Forest Products (NTFP’s) that are associated with
the forestry sector.
Such NTFP’s include:
• Beekeeping and honey production
• Basket-making
• Picking and packaging of edible plants
• Ferns, foliage and flowers
• Hiking trails
• Medicinal plants
• Picking and packaging of mushrooms
DWAF recorded two beekeeping operations that are associated with
plantations in Isinja (Nyandeni Local Municipality) and Cengcane (Mhlonto
Local Municipality). It also listed four basketry operations in the Port St
John’s Local Municipality.
The only forest fern and foliage operation of significance is based in
Tsitsikamma, where Forest Ferns produces 300 tons of foliage per annum,
mainly for the export market (Institute Of Natural Resources, 2003).
Although the collection of woody material, medicinal plants and edible fruits
is common, this is mostly informal and for household purposes. In some
areas, however, there is large-scale, illegal exploitation for commercial
purposes. The use of such forest produce is widespread in areas where
forests occur. The value to households of such produce is variable, and
attempts at quantification usually include areas that are regarded as
woodland and grassland.
Final
Page 24
Hiking trails in the province which traverse forestry areas include Hogsback,
Amatola and Tsitsikamma. In addition, many managed plantation areas
offer picnic, fishing and mountain-biking facilities to the public.

Final
Page 25
7 CONTRIBUTION TO EMPLOYMENT
From the information available, 8 158 people are estimated to be directly
employed in the forestry sector. A further 1 057 people are estimated to be
employed in furniture manufacture (925), ferns and foliage (120), basketry (8)
and beekeeping (4).
If anything, the figure is conservative as it does not account for people who may
be involved in non-remunerative work in community plantations, non-DWAF
employees in natural forests and woodlands, and other activities that have not
been included in this report. It also excludes the figure of at least 200 people
who will be employed in the new chipboard plant at Ugie.
Activity EmployeesPrivate Plantation 2375State Plantations 1760Natural Forests 334Sawmill Large 1263Sawmill Medium 583Sawmill Small 975Sawmill Indigenous 23Chipboard 158Pole Treatment 342Veneer 106Charcoal 240
Total 8158
Table 10 - Employment in Forestry Most of these jobs are provided in the rural areas, which are generally classified
as the poorest in South Africa. Table 11 shows a breakdown of employment
numbers per local municipality, with details for plantations, natural forests and
downstream processes.
Final
Page 26
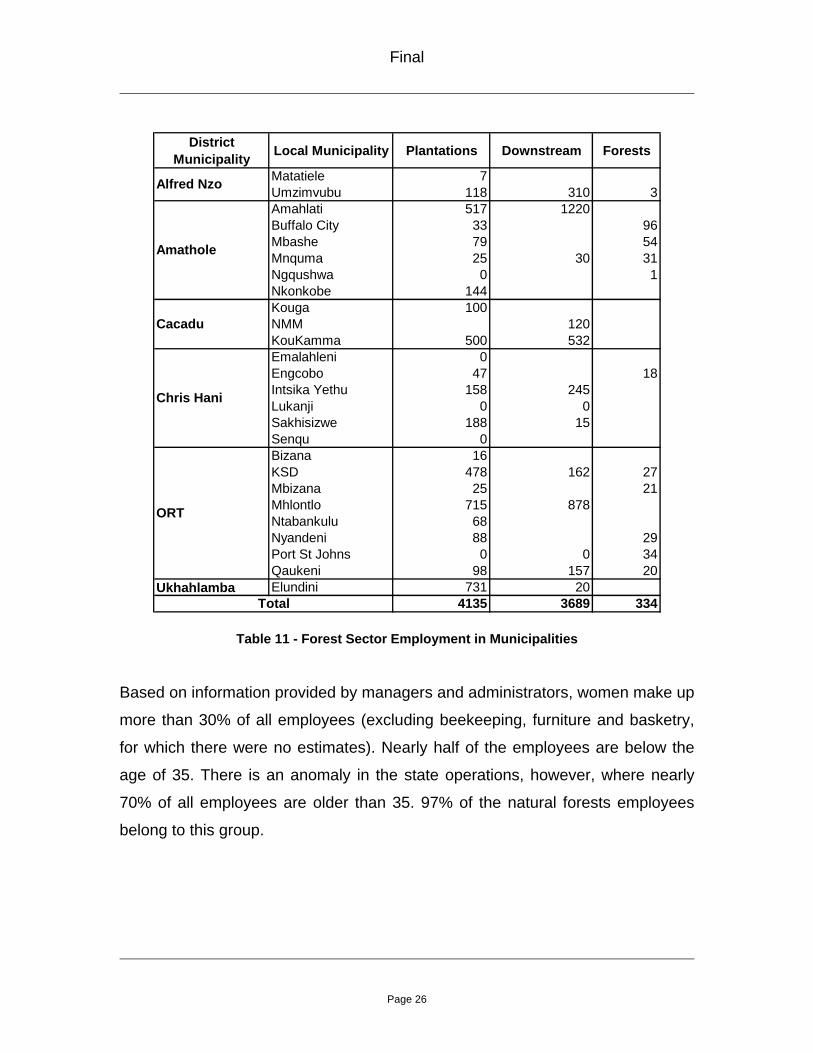
District Municipality Local Municipality Plantations Downstream Forests
Matatiele 7Umzimvubu 118 310 3Amahlati 517 1220Buffalo City 33 96Mbashe 79 54Mnquma 25 30 31Ngqushwa 0 1Nkonkobe 144Kouga 100NMM 120KouKamma 500 532Emalahleni 0Engcobo 47 18Intsika Yethu 158 245Lukanji 0 0Sakhisizwe 188 15Senqu 0Bizana 16KSD 478 162 27Mbizana 25 21Mhlontlo 715 878Ntabankulu 68Nyandeni 88 29Port St Johns 0 0 34Qaukeni 98 157 20
Ukhahlamba Elundini 731 204135 3689 334
ORT
Total
Alfred Nzo
Amathole
Cacadu
Chris Hani
Table 11 - Forest Sector Employment in Municipalities Based on information provided by managers and administrators, women make up
more than 30% of all employees (excluding beekeeping, furniture and basketry,
for which there were no estimates). Nearly half of the employees are below the
age of 35. There is an anomaly in the state operations, however, where nearly
70% of all employees are older than 35. 97% of the natural forests employees
belong to this group.

Final
Page 27
<35 yrs >35yrs <35 yrs >35yrsTimber Processing 1540 1168 534 447 3689State Plantations 227 568 331 634 1760Private Plantations 861 878 191 445 2375Natural Forests 5 190 2 137 334
Total 2633 2804 1058 1663 8158
Men Women EmployeesSegment
Table 12 - Gender and Age Analysis
It is well known that significant portions of forestry plantations in the Eastern
Cape have been subject to damage by fire and sub-optimal management over
the past few decades. In spite of the credible efforts at rehabilitation of these
plantations, particularly by privately managed operations, it will take some time
for all to be rehabilitated and to realise their yield potential. A large plantation
(nearly 35 000 ha) is only now reaching maturity. Once the existing forestry
plantations have been rehabilitated and are being harvested on a sustainable
basis, they are likely to employ over 5 000 people (excluding processing).

Final
Page 28
8. CONTRIBUTION TO THE ECONOMY
The contribution of the forestry sector to the province’s economy has yet to be
fully established. Without detailed analysis of the income statements and
costing reports of companies and government departments, the impact can be
partially estimated with regard to revenues generated, and salaries and wages.
Based on conversion recoveries of between 40% and 50%, and product prices
as shown in Table 13, it is estimated that annual revenues of R 612 million are
generated from the primary conversion of plantation products within the forestry
sector in the province.
Table 13 Revenue Generated in Forestry Sector
Sawmill Indigenous 2000 3000 6.0Sawmill Large 191250 2000 382.5Sawmill Medium 38900 1900 73.9Sawmill Small 39750 1500 59.6Chipboard 14000 1500 21.0Pole Treatment 30400 1200 36.5Veneer 10000 3000 30.0Charcoal 9600 210 2.0
Total 611.5
Sector ComponentAnnual
Production (t,m3/a)
Price (R/t,m3)
Revenue (R mil)
Final
Page 29
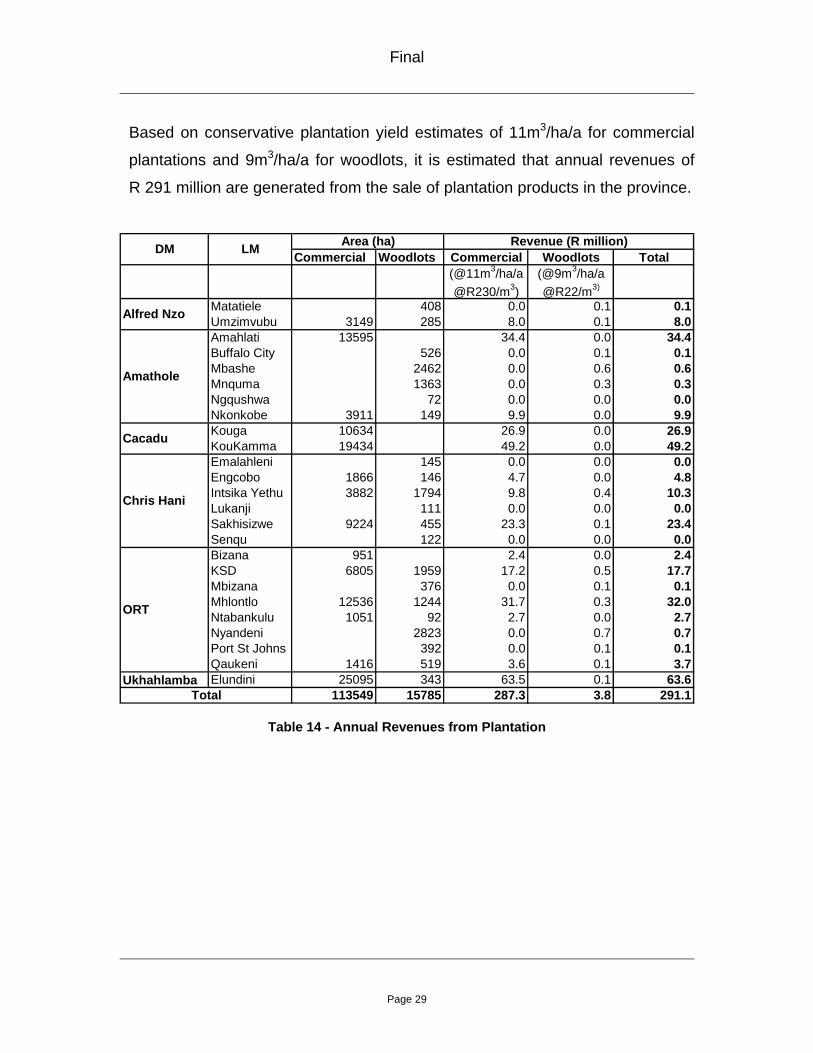
Based on conservative plantation yield estimates of 11m3/ha/a for commercial
plantations and 9m3/ha/a for woodlots, it is estimated that annual revenues of
R 291 million are generated from the sale of plantation products in the province.
Commercial Woodlots Commercial Woodlots Total
Matatiele 408 0.0 0.1 0.1Umzimvubu 3149 285 8.0 0.1 8.0Amahlati 13595 34.4 0.0 34.4Buffalo City 526 0.0 0.1 0.1Mbashe 2462 0.0 0.6 0.6Mnquma 1363 0.0 0.3 0.3Ngqushwa 72 0.0 0.0 0.0Nkonkobe 3911 149 9.9 0.0 9.9Kouga 10634 26.9 0.0 26.9KouKamma 19434 49.2 0.0 49.2Emalahleni 145 0.0 0.0 0.0Engcobo 1866 146 4.7 0.0 4.8Intsika Yethu 3882 1794 9.8 0.4 10.3Lukanji 111 0.0 0.0 0.0Sakhisizwe 9224 455 23.3 0.1 23.4Senqu 122 0.0 0.0 0.0Bizana 951 2.4 0.0 2.4KSD 6805 1959 17.2 0.5 17.7Mbizana 376 0.0 0.1 0.1Mhlontlo 12536 1244 31.7 0.3 32.0Ntabankulu 1051 92 2.7 0.0 2.7Nyandeni 2823 0.0 0.7 0.7Port St Johns 392 0.0 0.1 0.1Qaukeni 1416 519 3.6 0.1 3.7
Ukhahlamba Elundini 25095 343 63.5 0.1 63.6113549 15785 287.3 3.8 291.1
(@9m3/ha/a @R22/m3)
Revenue (R million)LMDM Area (ha)
(@11m3/ha/a @R230/m3)
Alfred Nzo
Amathole
Total
ORT
Chris Hani
Cacadu
Table 14 - Annual Revenues from Plantation

Final
Page 30
At current employee levels, Table 15 shows that remuneration of R 277 million
per annum is generated within the sector, most of it in the rural areas.
Table 15 - Employee Remuneration in Forestry Sector
On the conservative assumption that 20% of revenue is expended within the
province on non-employee costs, a further R 180 million could be contributed to
the economy.
In total, it is estimated that annual revenues of almost R1 billion (R 902 million),
are generated, with R 277 million spent on employee costs and R 180 million
spent on local supplies and services (a total of R 457 million).
Taking into consideration the coming on stream of the new chipboard plant, and
the possible new afforestation of 100 000 ha (almost doubling the existing
plantation area), the sector has the potential to contribute at least a further
R 1 billion per annum to the provincial economy.
Commercial Plantations 1920 2500 58Woodlot Plantations 2207 3500 93Natural Forests 334 3500 14Sawmill Indigenous 23 2500 1Sawmill Large 1263 3000 45Sawmill Medium 583 2500 18Sawmill Small 975 2000 23Chipboard 158 3000 6Pole Treatment 342 2500 10Veneer 106 3000 4Charcoal 240 2000 6
Total 8150 277
RemunerationNo of
EmployeesSector Component Employee Ave. (R/month) Total (Rmil/a)
Final
Page 31
The impact of NTFP’s has not been quantified. Shackleton et al (DWAF, 2006)
estimate that the use of natural resources is valued at an average of R 3 154
per household (in 2001), now estimated to be worth about R 4 349.

Final
Page 32
Indig Large Medium SmallPrice/t,m3 3000 2000 1900 1500 1500 1200 3000 210Matatiele 0.0Umzimvubu 13500 3600 31.1Amahlati 2000 47500 14000 18350 7200 2400 164.3Buffalo City 0.0Mbashe 0.0Mnquma 1200 0.3Ngqushwa 0.0Nkonkobe 0.0Kouga 0.0KouKamma 68750 11400 6800 167.3NMM 4800 1.0Emalahleni 0.0Engcobo 0.0Intsika Yethu 9800 14.7Lukanji 0.0Sakhisizwe 600 0.1Senqu 0.0Bizana 0.0KSD 14400 17.3Mbizana 0.0Mhlontlo 75000 1800 14000 10000 600 203.8Mhontlo 0.0Ntabankulu 0.0Nyandeni 0.0Port St Johns 0.0Qaukeni 5400 2000 10.5
Ukhahlamba Elundini 800 1.2Total (cubic m or tons) 2000 191250 38900 39750 14000 30400 10000 9600 611.5
Cacadu
ORT
Chris Hani
Total Revenue (R mil)
Local Municipality
Amathole
Alfred Nzo
CharcoalSawmills Chip board
Treated Poles VeneerDistrict
Municipality
Table 16 – Annual Revenues from Processing

Final
Page 33
8 TRENDS IN THE SECTOR
8.1 Forestry Licences
Plantation forestry is considered by DWAF as a Stream Flow Reduction
Activity (SFRA), which means that any new afforestation requires a license
to be issued by DWAF. The licensing process is comprehensive in that it
assesses the impact of the new afforestation on the hydrology of the water
catchment, the natural environment, and the local socio- economy. It
requires approval from the Department of Land Affairs (DLA), DEDEA,
Department of Agriculture and the Forestry Branch of DWAF. While this
licensing process is a mechanism for ensuring that forestry is applied in a
responsible manner, it is seen by proponents and applicants as frustrating.
Between 1997, when the new licensing process was introduced, and the
end of July 2007, there have been a total of 204 licensing applications in the
Eastern Cape, covering 19 560 ha.
The applications for new plantations cover a total of 8 053 ha, of which 65%
are for Pine plantations, 33% for Gum plantations, and the balance for
Wattle. 82 (11 507ha) of the applications are to convert from Pine to Gum
species.
Over the past 10 years, a total of 70 licenses (of the 204 applications) have
been issued. The average number of months taken for a license to be
issued is 21, although some have taken up to 89 months. At the time of this
report, 128 applications were “In Progress”, with the average having been in
the process for 9 months.
Final
Page 34
The momentum for forestry applications picked up considerably during
2006, when 36 applications (5 083 ha) were made. A further 87 (12 338 ha)
were made between January and the end of July 2007. These applications
represent a total of 17 421 ha.

Final
Page 35
8.2 Fire Damage
Plantations are at risk from various factors, including disease, drought,
wind, snow, flooding, fire, livestock and vandalism.
The most critical factor is fire. Over the past 10 years, the province has
recorded the burning of some 44 690 ha of plantations. The worst fires were
in 2005, when nearly 15 000 ha in the Koukamma and Kouga Local
Municipalities were burnt.
The economic losses that result from fires are not limited to the wood that is
burnt. If plantations are old enough, some of the burnt timber may even be
harvested, although in some cases the timber is damaged beyond
utilisation. In forestry, with rotations of between 10 and 30 years, the
burning of plantations which are younger than harvesting age require felling,
clearing and replanting (cost duplications), and incur the loss of growth that
has already taken place. Processing enterprises that are dependent on the
timber resource are adversely affected if the timber supplies become
unsustainable or sub-optimal.
There are many plantations in the Eastern Cape that are no longer able to
sustain the production of wood (eg. Nomadamba, Katberg, Ntsubane
Amanzamnyama block). The economic impact on employees, contractors
and small sawmillers will be sorely felt in the near future.
According to information from the forestry operators, some 44 472 ha have
been replanted over the past decade. Although much of this replanting has
been in areas damaged by fires, the figure also includes those plantations
that were harvested according to normal management practices. The
private companies and MTO have been planting at accelerated rates to
Final
Page 36
ensure the re-establishment of burnt areas and areas left unplanted by
DWAF management prior to the restructuring of plantations.
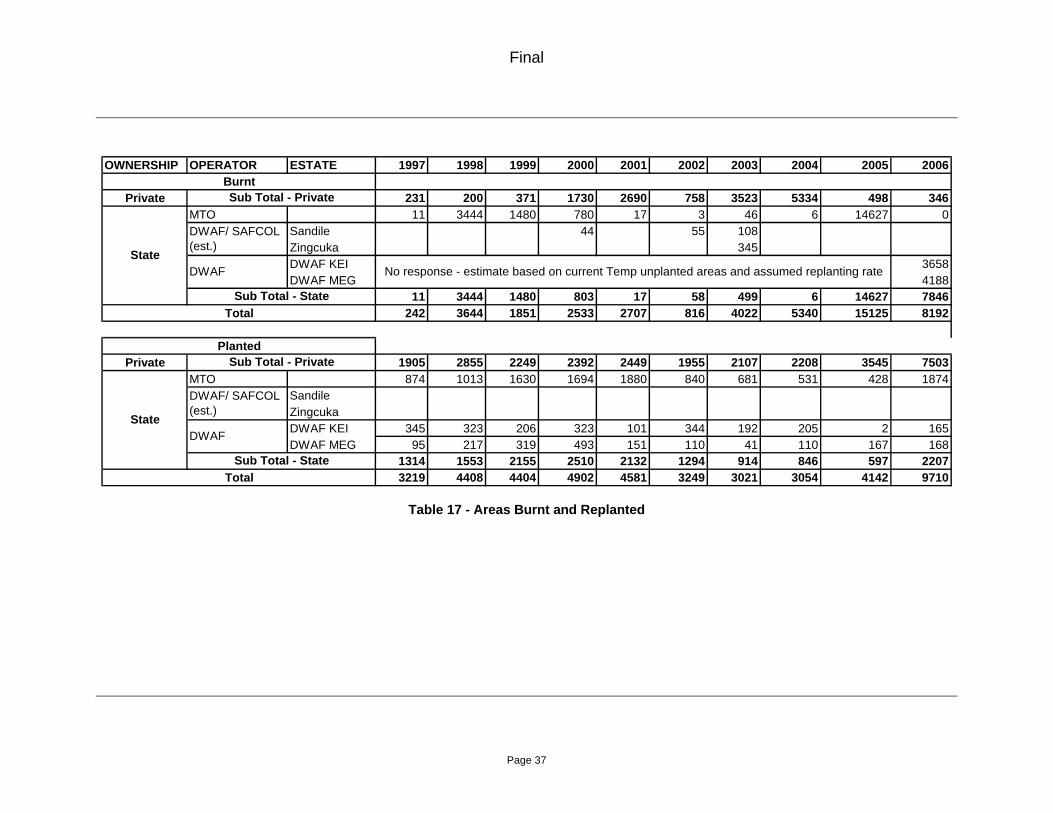
Table 17 shows the areas burnt and replanted over the past 10 years.
Final
Page 37
OWNERSHIP OPERATOR ESTATE 1997 1998 1999 2000 2001 2002 2003 2004 2005 2006
Private 231 200 371 1730 2690 758 3523 5334 498 346MTO 11 3444 1480 780 17 3 46 6 14627 0
Sandile 44 55 108Zingcuka 345DWAF KEI 3658DWAF MEG 4188
11 3444 1480 803 17 58 499 6 14627 7846242 3644 1851 2533 2707 816 4022 5340 15125 8192
Private 1905 2855 2249 2392 2449 1955 2107 2208 3545 7503MTO 874 1013 1630 1694 1880 840 681 531 428 1874
SandileZingcukaDWAF KEI 345 323 206 323 101 344 192 205 2 165DWAF MEG 95 217 319 493 151 110 41 110 167 168
1314 1553 2155 2510 2132 1294 914 846 597 22073219 4408 4404 4902 4581 3249 3021 3054 4142 9710Total
Sub Total - Private
Sub Total - Private
DWAF/ SAFCOL (est.)
DWAF
Sub Total - State
State
No response - estimate based on current Temp unplanted areas and assumed replanting rate
Planted
Burnt
Total
State
DWAF/ SAFCOL (est.)
DWAF
Sub Total - State
Table 17 - Areas Burnt and Replanted
Final
Page 38
8.3 Reforestation and New Plantations
As indicated in the previous section, some 44 472 ha have been planted
over the past decade. The bulk of this planting has been to re-establish
areas after harvesting or fire damage. Planting of new plantations has been
minimal, although it is expected that the pace will increase over the next
decades.
Extensive replanting has been undertaken by private companies and MTO
in order to replant burnt areas, rehabilitate burnt and felled areas left
unplanted by DWAF before restructure, and replant areas felled after
normal harvesting.
Large areas managed by DWAF have been unplanted after fire damage
and harvesting operations. Despite valiant attempts by management to
correct this situation, the constraints imposed by departmental bureaucracy
and budget limitations have frustrated successful implementation.
It has not been possible, from the information available, to reflect levels of
plantation reductions or new plantations over the past 10 years. However,
given the low number of forestry licenses granted (1037 ha in the past 10
years), the new plantation establishment levels are likely to be relatively
insignificant.

Final
Page 39
8.4 Deforestation of Indigenous Forests
It is generally known that many of the province’s indigenous forests have
incurred damage as a result of the over-harvesting of resources, and
clearing for agricultural and residential purposes.
DWAF, which is responsible for the management of the majority of forests,
has initiated a programme through which damage and deforestation is
quantified. The results as yet are inconclusive, due to the methodological
challenges associated with this type of assessment.
One of the requirements of this assignment was to collate the scale of
natural forest deforestation. There was unfortunately insufficient information
to do so.
Final
Page 40
8.5 Plantation Yields
It is well known in the sector that most of the plantations in the province
have, over the past decade, been managed in ‘abnormal’ (in technical
forestry terminology) situations. It thus follows that plantation yields do not
reflect the yield potential of the land or desirable management practices.
Reasons for this situation include the following:
• The integration of restructured state plantations into private sector
management units required rehabilitation and re-planning to move
towards normal yields and sustainable harvesting regimes.
• Some areas in one of the largest plantation resources (NECF) are
reaching maturity, with the only harvesting to date being that of
burnt plantations.
• DWAF plantation harvesting has largely been in areas that have
been burnt, and many areas have been subject to unplanned over-
harvesting;
• In the Koukamma and Kouga Local Municipalities, virtually all of
the harvesting over the past 2-3 years has been of burnt trees.
A recurring theme arising from discussions with forestry managers has
been the sub-optimal yield resulting from the impact of fires and from
management weaknesses over the past decade.

Final
Page 41
9 MUNICIPALITIES
One of the purposes of this sector profile is to provide information about the
forestry enterprises, activities and potential within local municipalities for
economic development planning purposes.
The municipalities that are described below are those which have been
identified as having significant areas of land with commercial forestry potential
within their boundaries.
The tables below summarises the extent of existing and potential forestry, and
the numbers and scale of forestry activities. They also provide estimates of
employment numbers and revenue generation within the plantations and
existing wood processors.
Final
Page 42
9.1 Amathole District Municipality
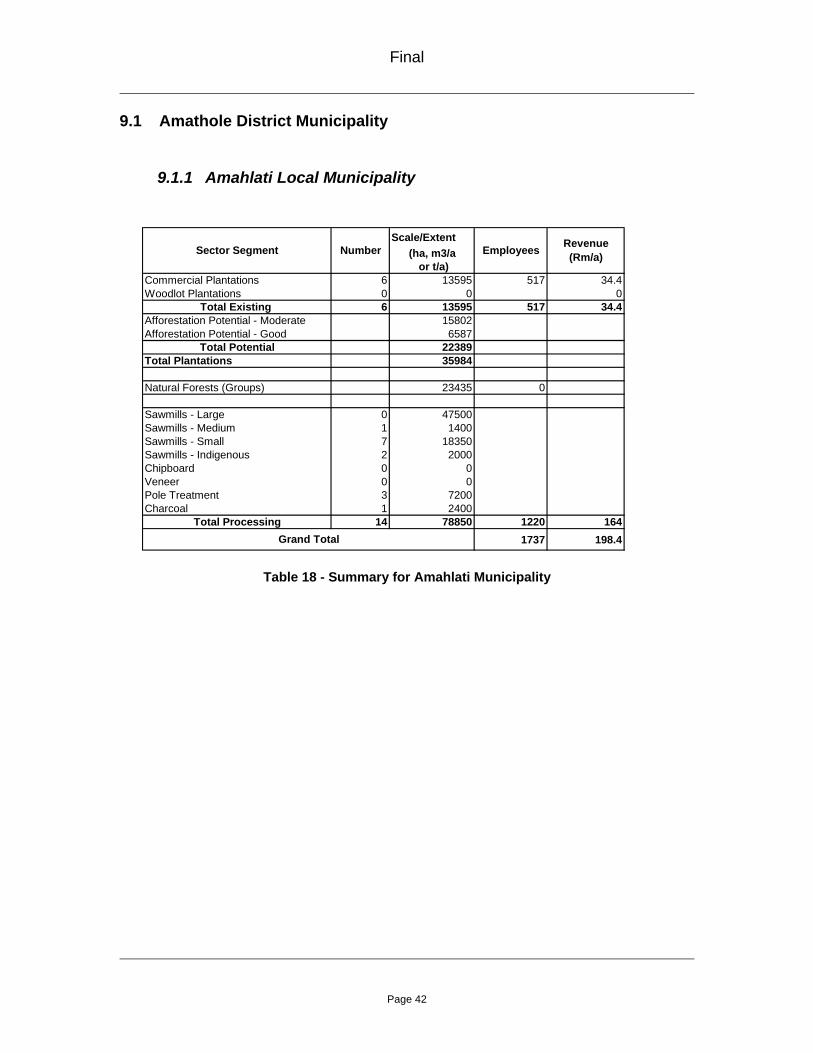
9.1.1 Amahlati Local Municipality
Scale/Extent(ha, m3/a
or t/a)Commercial Plantations 6 13595 517 34.4Woodlot Plantations 0 0 0
Total Existing 6 13595 517 34.4Afforestation Potential - Moderate 15802Afforestation Potential - Good 6587
Total Potential 22389Total Plantations 35984
Natural Forests (Groups) 23435 0
Sawmills - Large 0 47500Sawmills - Medium 1 1400Sawmills - Small 7 18350Sawmills - Indigenous 2 2000Chipboard 0 0Veneer 0 0Pole Treatment 3 7200Charcoal 1 2400
Total Processing 14 78850 1220 1641737 198.4
Revenue (Rm/a)
Grand Total
Sector Segment Number Employees
Table 18 - Summary for Amahlati Municipality

Final
Page 43
9.1.2 Great Kei Local Municipality
Scale/Extent(ha, m3/a
or t/a)Commercial Plantations 0Woodlot Plantations 0
Total Existing 0 0 0Afforestation Potential - Moderate 23192Afforestation Potential - Good 0
Total Potential 23192Total Plantations 23192
Natural Forests (Groups) 4660 0
Sawmills - Large 0 0Sawmills - Medium 0 0Sawmills - Small 0 0Sawmills - Indigenous 0 0Chipboard 0 0Veneer 0 0Pole Treatment 0 0Charcoal 0 0
Total Processing 0 0 0 00 0
Revenue (Rm/a)
Grand Total
Sector Segment Number Employees
Table 19 - Summary for Great Kei Municipality
Final
Page 44
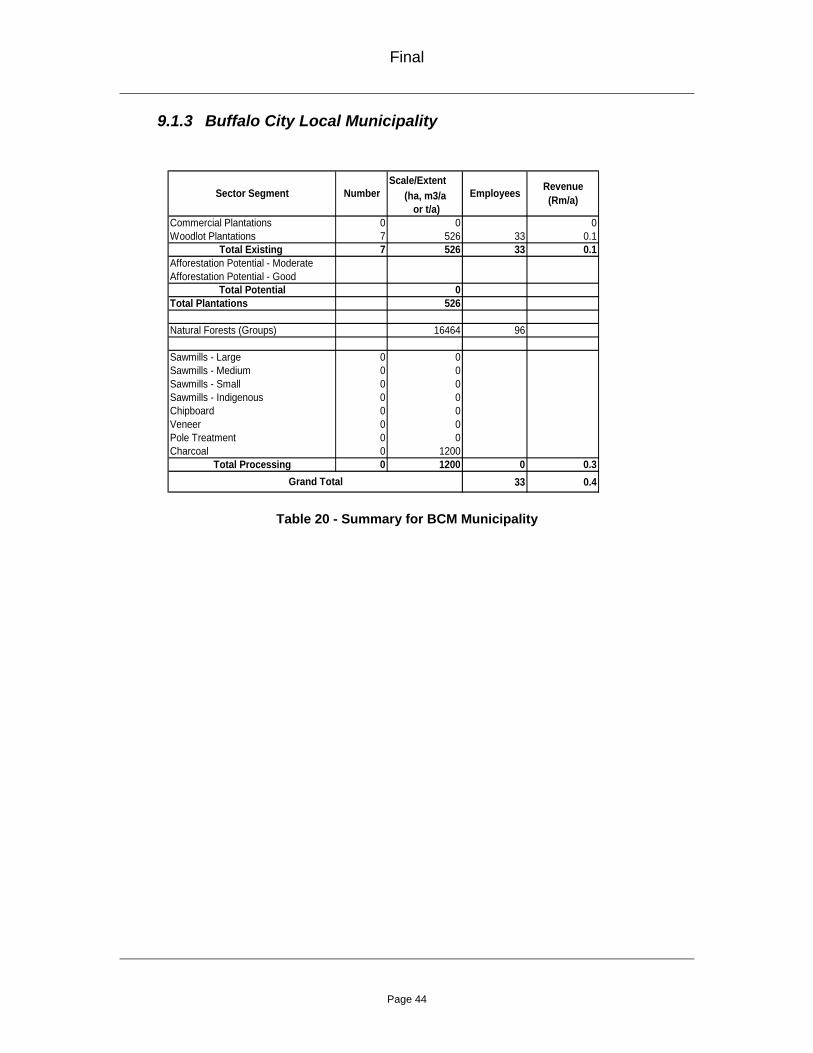
9.1.3 Buffalo City Local Municipality
Scale/Extent(ha, m3/a
or t/a)Commercial Plantations 0 0 0Woodlot Plantations 7 526 33 0.1
Total Existing 7 526 33 0.1Afforestation Potential - ModerateAfforestation Potential - Good
Total Potential 0Total Plantations 526
Natural Forests (Groups) 16464 96
Sawmills - Large 0 0Sawmills - Medium 0 0Sawmills - Small 0 0Sawmills - Indigenous 0 0Chipboard 0 0Veneer 0 0Pole Treatment 0 0Charcoal 0 1200
Total Processing 0 1200 0 0.333 0.4
Revenue (Rm/a)
Grand Total
Sector Segment Number Employees
Table 20 - Summary for BCM Municipality

Final
Page 45
9.1.4 Mbashe Local Municipality
Scale/Extent(ha, m3/a
or t/a)Commercial Plantations 0 0 0Woodlot Plantations 28 2462 79 0.6
Total Existing 28 2462 79 0.6Afforestation Potential - Moderate 50982Afforestation Potential - Good 0
Total Potential 50982Total Plantations 53444
Natural Forests (Groups) 14281 54
Sawmills - Large 0 0Sawmills - Medium 0 0Sawmills - Small 0 0Sawmills - Indigenous 0 0Chipboard 0 0Veneer 0 0Pole Treatment 0 0Charcoal 0 0
Total Processing 0 0 0 079 0.6
Revenue (Rm/a)
Grand Total
Sector Segment Number Employees
Table 21 - Summary for Mbashe Municipality

Final
Page 46
9.1.5 Mnquma Local Municipality
Scale/Extent(ha, m3/a
or t/a)Commercial Plantations 0 0 0Woodlot Plantations 41 1363 25 0.3
Total Existing 41 1363 25 0.3Afforestation Potential - Moderate 65640Afforestation Potential - Good 35
Total Potential 65675Total Plantations 67038
Natural Forests (Groups) 9418 31
Sawmills - Large 0 0Sawmills - Medium 0 0Sawmills - Small 0 0Sawmills - Indigenous 0 0Chipboard 0 0Veneer 0 0Pole Treatment 0 0Charcoal 1 1200
Total Processing 1 1200 30 0.355 0.6
Revenue (Rm/a)
Grand Total
Sector Segment Number Employees
Table 22 - Summary for Mnquma Municipality
Final
Page 47
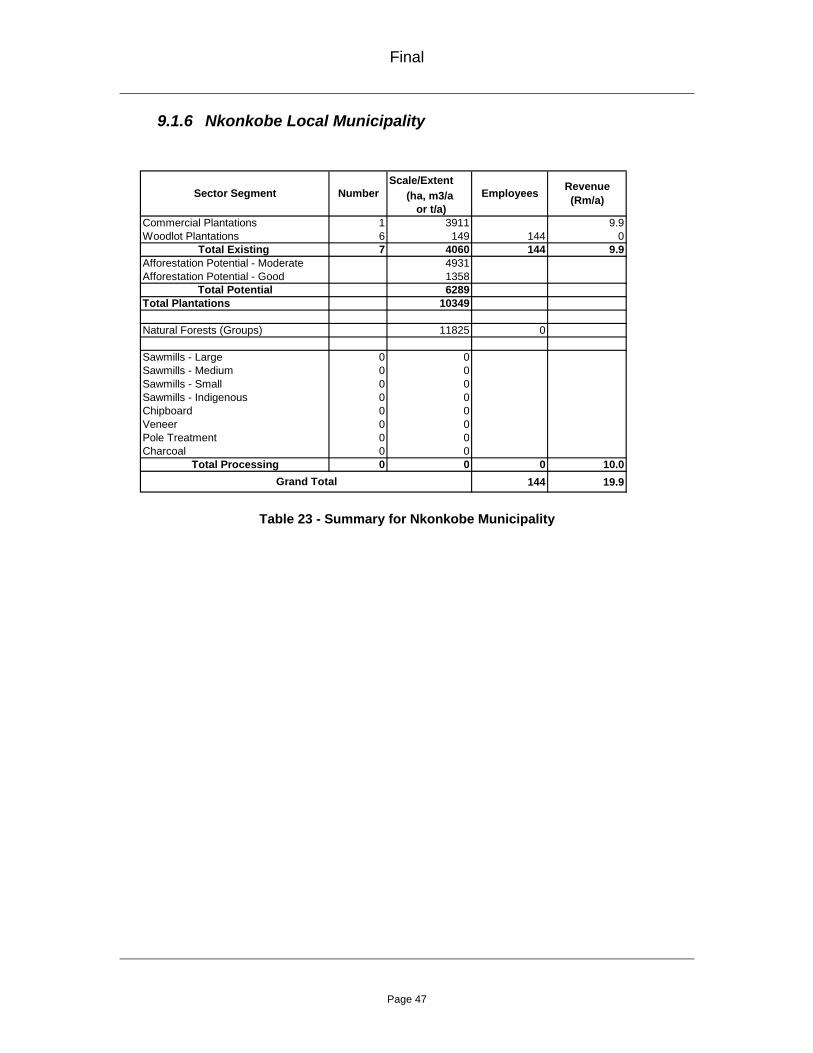
9.1.6 Nkonkobe Local Municipality
Scale/Extent(ha, m3/a
or t/a)Commercial Plantations 1 3911 9.9Woodlot Plantations 6 149 144 0
Total Existing 7 4060 144 9.9Afforestation Potential - Moderate 4931Afforestation Potential - Good 1358
Total Potential 6289Total Plantations 10349
Natural Forests (Groups) 11825 0
Sawmills - Large 0 0Sawmills - Medium 0 0Sawmills - Small 0 0Sawmills - Indigenous 0 0Chipboard 0 0Veneer 0 0Pole Treatment 0 0Charcoal 0 0
Total Processing 0 0 0 10.0144 19.9
Revenue (Rm/a)
Grand Total
Sector Segment Number Employees
Table 23 - Summary for Nkonkobe Municipality
Final
Page 48
9.2 Chris Hani District Municipality
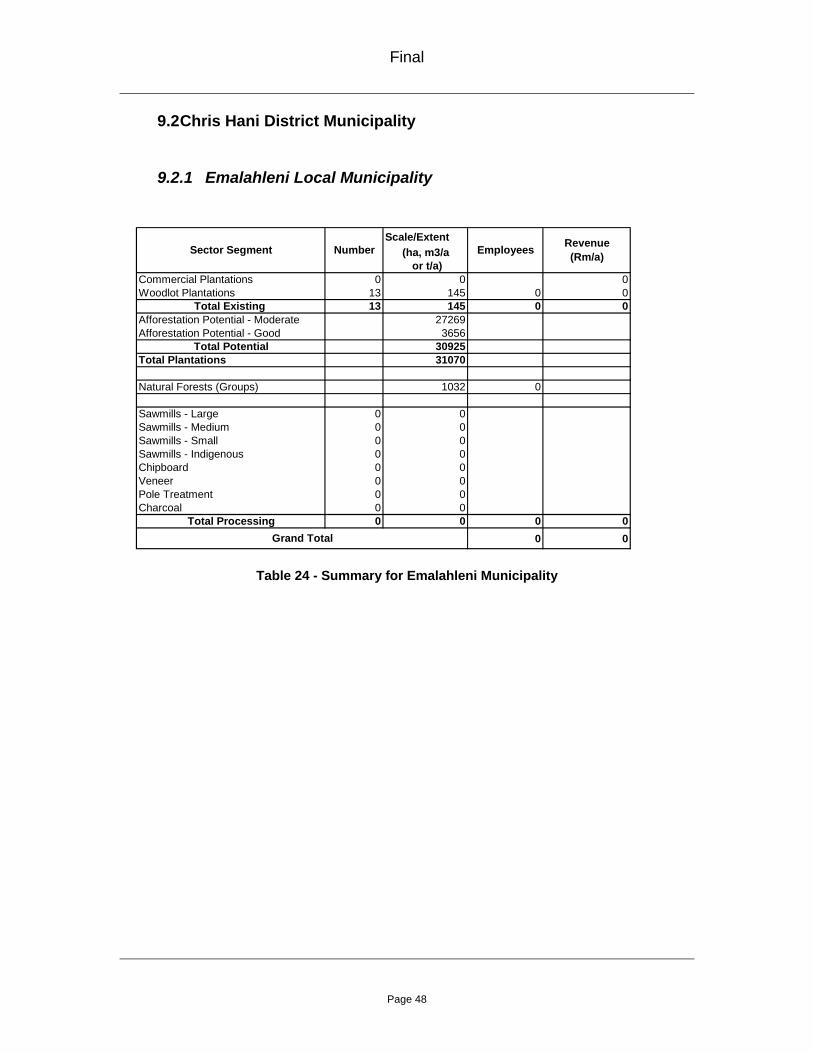
9.2.1 Emalahleni Local Municipality
Scale/Extent(ha, m3/a
or t/a)Commercial Plantations 0 0 0Woodlot Plantations 13 145 0 0
Total Existing 13 145 0 0Afforestation Potential - Moderate 27269Afforestation Potential - Good 3656
Total Potential 30925Total Plantations 31070
Natural Forests (Groups) 1032 0
Sawmills - Large 0 0Sawmills - Medium 0 0Sawmills - Small 0 0Sawmills - Indigenous 0 0Chipboard 0 0Veneer 0 0Pole Treatment 0 0Charcoal 0 0
Total Processing 0 0 0 00 0
Revenue (Rm/a)
Grand Total
Sector Segment Number Employees
Table 24 - Summary for Emalahleni Municipality
Final
Page 49
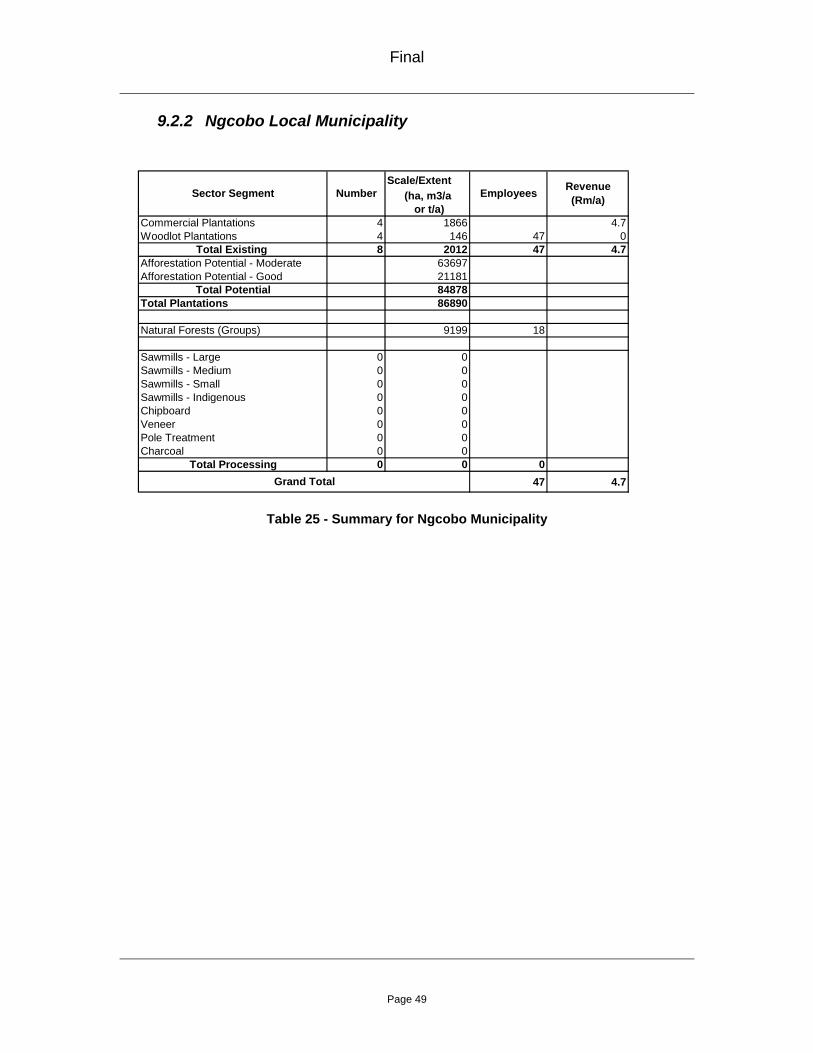
9.2.2 Ngcobo Local Municipality
Scale/Extent(ha, m3/a
or t/a)Commercial Plantations 4 1866 4.7Woodlot Plantations 4 146 47 0
Total Existing 8 2012 47 4.7Afforestation Potential - Moderate 63697Afforestation Potential - Good 21181
Total Potential 84878Total Plantations 86890
Natural Forests (Groups) 9199 18
Sawmills - Large 0 0Sawmills - Medium 0 0Sawmills - Small 0 0Sawmills - Indigenous 0 0Chipboard 0 0Veneer 0 0Pole Treatment 0 0Charcoal 0 0
Total Processing 0 0 047 4.7
Revenue (Rm/a)
Grand Total
Sector Segment Number Employees
Table 25 - Summary for Ngcobo Municipality
Final
Page 50
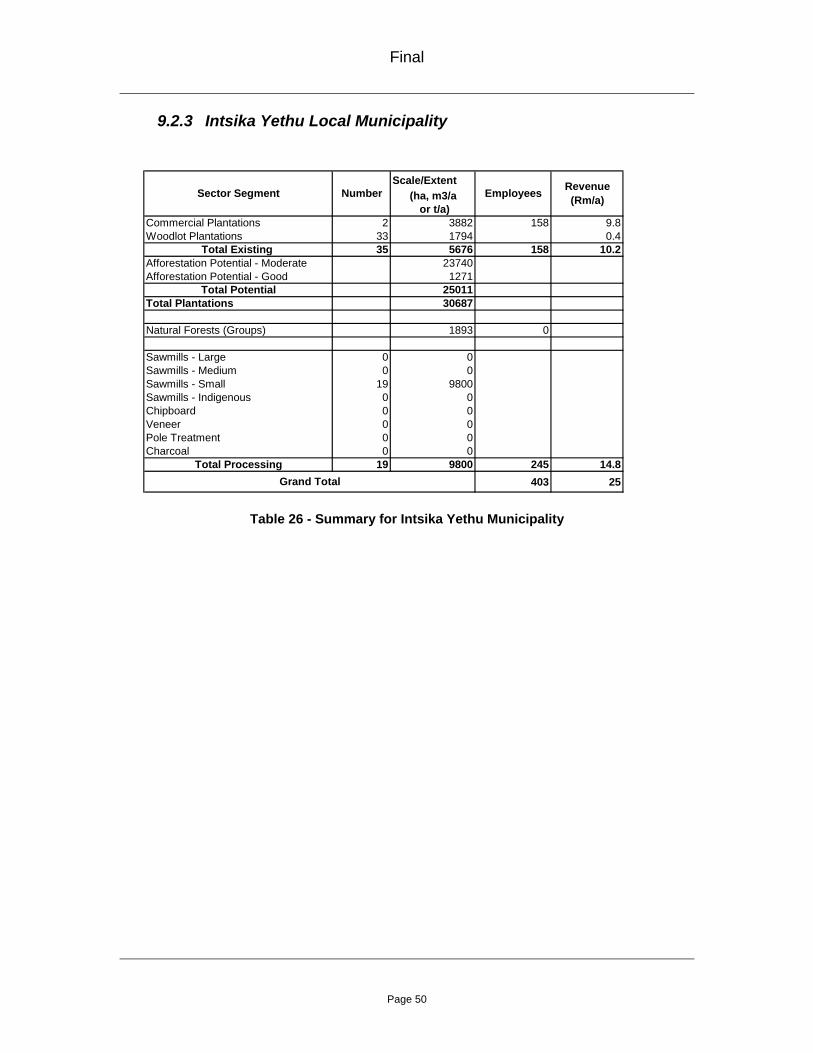
9.2.3 Intsika Yethu Local Municipality
Scale/Extent(ha, m3/a
or t/a)Commercial Plantations 2 3882 158 9.8Woodlot Plantations 33 1794 0.4
Total Existing 35 5676 158 10.2Afforestation Potential - Moderate 23740Afforestation Potential - Good 1271
Total Potential 25011Total Plantations 30687
Natural Forests (Groups) 1893 0
Sawmills - Large 0 0Sawmills - Medium 0 0Sawmills - Small 19 9800Sawmills - Indigenous 0 0Chipboard 0 0Veneer 0 0Pole Treatment 0 0Charcoal 0 0
Total Processing 19 9800 245 14.8403 25
Revenue (Rm/a)
Grand Total
Sector Segment Number Employees
Table 26 - Summary for Intsika Yethu Municipality

Final
Page 51
9.2.4 Sakhisizwe Local Municipality
Scale/Extent(ha, m3/a
or t/a)Commercial Plantations 1 9224 23.3Woodlot Plantations 2 455 188 0.1
Total Existing 3 9679 188 23.4Afforestation Potential - Moderate 56494Afforestation Potential - Good 987
Total Potential 57481Total Plantations 67160
Natural Forests (Groups) 468 0
Sawmills - Large 0 0Sawmills - Medium 0 0Sawmills - Small 0 0Sawmills - Indigenous 0 0Chipboard 0 0Veneer 0 0Pole Treatment 0 0Charcoal 1 600
Total Processing 1 600 15 0.1203 23.5
Revenue (Rm/a)
Grand Total
Sector Segment Number Employees
Table 27 - Summary for Sakhisizwe Municipality
Final
Page 52
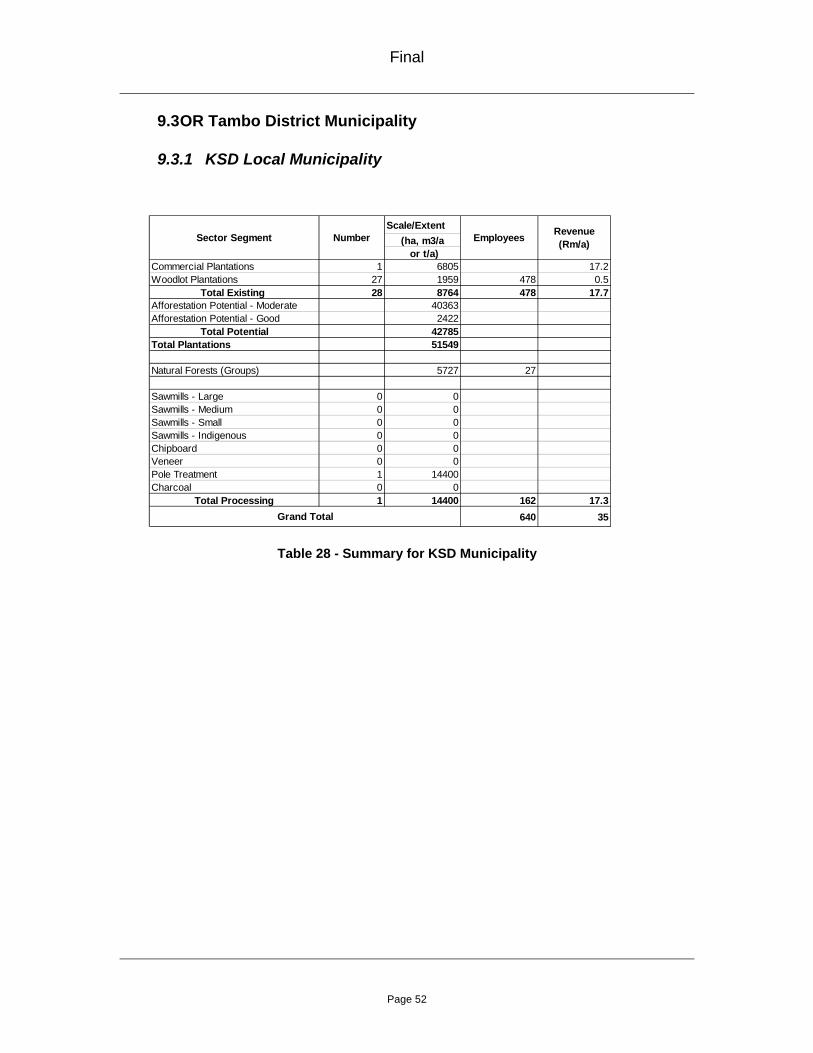
9.3 OR Tambo District Municipality
9.3.1 KSD Local Municipality
Table 28 - Summary for KSD Municipality
Scale/Extent(ha, m3/a
or t/a)Commercial Plantations 1 6805 17.2Woodlot Plantations 27 1959 478 0.5
Total Existing 28 8764 478 17.7Afforestation Potential - Moderate 40363Afforestation Potential - Good 2422
Total Potential 42785Total Plantations 51549
Natural Forests (Groups) 5727 27
Sawmills - Large 0 0Sawmills - Medium 0 0Sawmills - Small 0 0Sawmills - Indigenous 0 0Chipboard 0 0Veneer 0 0Pole Treatment 1 14400Charcoal 0 0
Total Processing 1 14400 162 17.3640 35
Revenue (Rm/a)
Grand Total
Sector Segment Number Employees
Final
Page 53
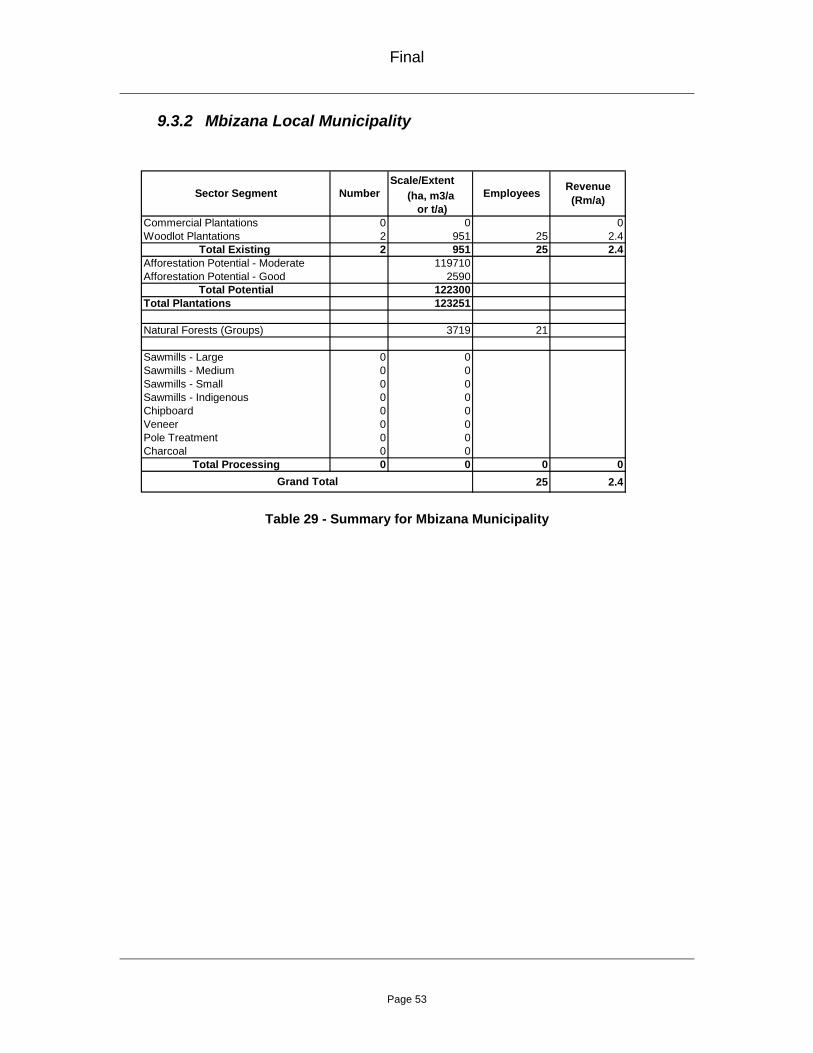
9.3.2 Mbizana Local Municipality
Scale/Extent(ha, m3/a
or t/a)Commercial Plantations 0 0 0Woodlot Plantations 2 951 25 2.4
Total Existing 2 951 25 2.4Afforestation Potential - Moderate 119710Afforestation Potential - Good 2590
Total Potential 122300Total Plantations 123251
Natural Forests (Groups) 3719 21
Sawmills - Large 0 0Sawmills - Medium 0 0Sawmills - Small 0 0Sawmills - Indigenous 0 0Chipboard 0 0Veneer 0 0Pole Treatment 0 0Charcoal 0 0
Total Processing 0 0 0 025 2.4
Revenue (Rm/a)
Grand Total
Sector Segment Number Employees
Table 29 - Summary for Mbizana Municipality
Final
Page 54
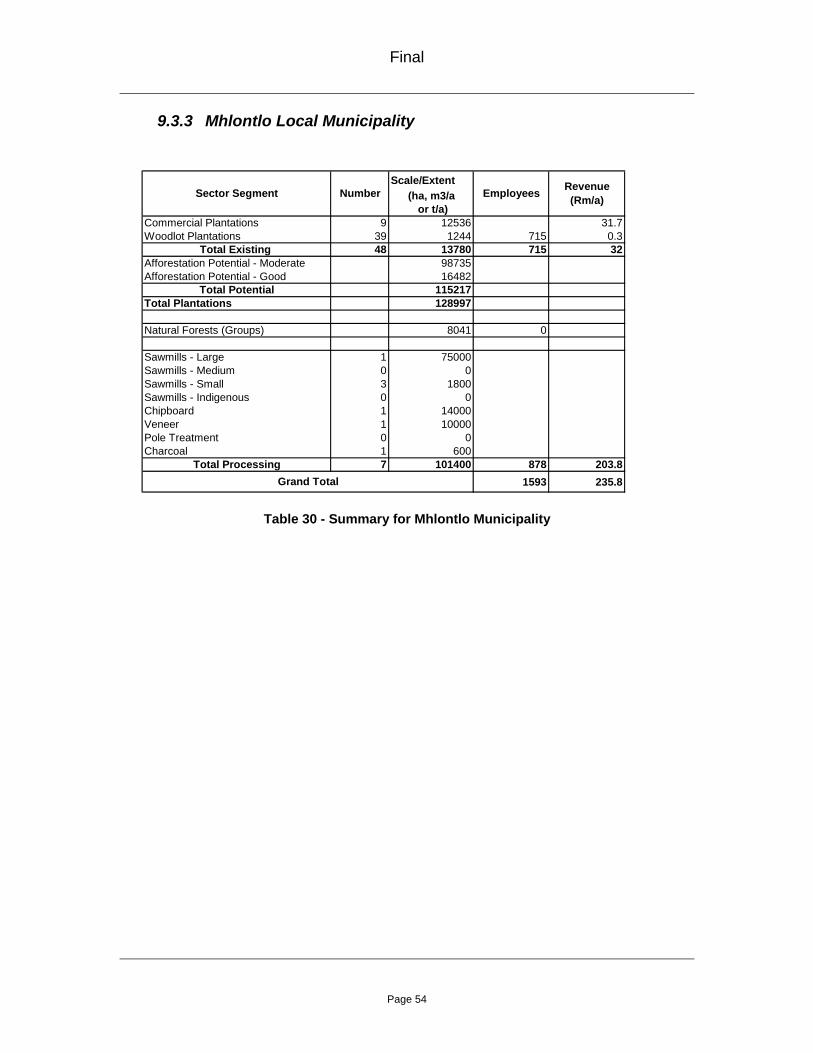
9.3.3 Mhlontlo Local Municipality
Scale/Extent(ha, m3/a
or t/a)Commercial Plantations 9 12536 31.7Woodlot Plantations 39 1244 715 0.3
Total Existing 48 13780 715 32Afforestation Potential - Moderate 98735Afforestation Potential - Good 16482
Total Potential 115217Total Plantations 128997
Natural Forests (Groups) 8041 0
Sawmills - Large 1 75000Sawmills - Medium 0 0Sawmills - Small 3 1800Sawmills - Indigenous 0 0Chipboard 1 14000Veneer 1 10000Pole Treatment 0 0Charcoal 1 600
Total Processing 7 101400 878 203.81593 235.8
Revenue (Rm/a)
Grand Total
Sector Segment Number Employees
Table 30 - Summary for Mhlontlo Municipality
Final
Page 55
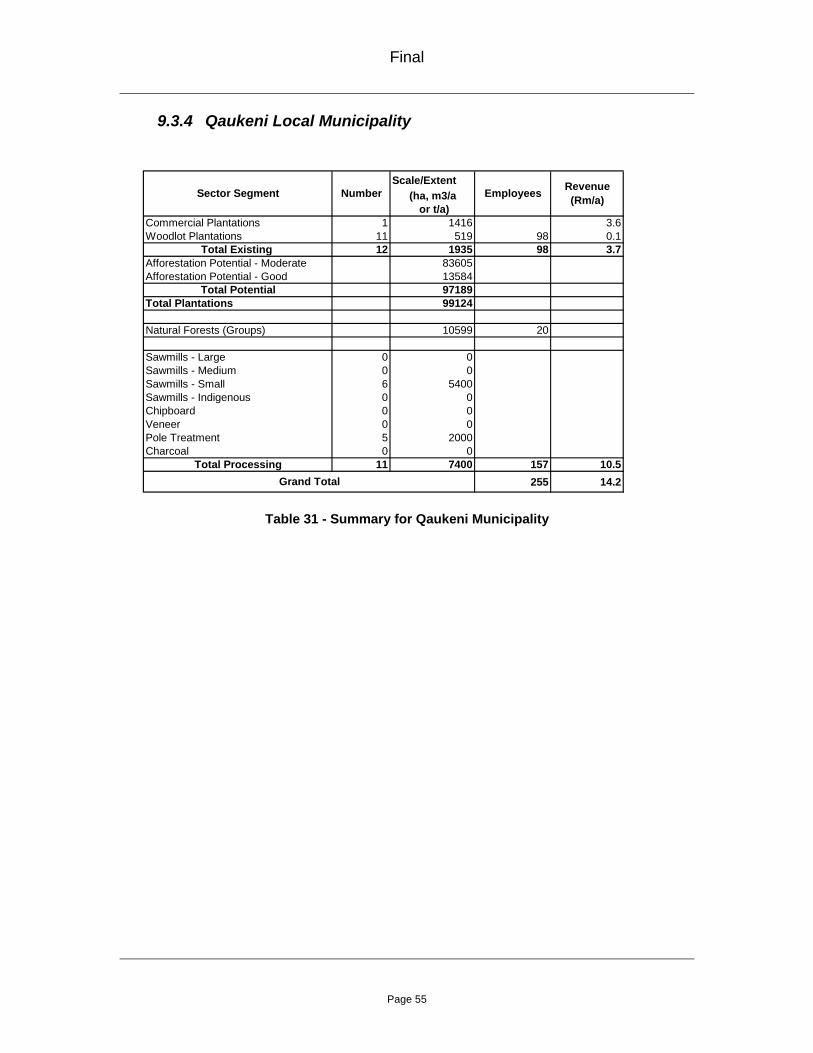
9.3.4 Qaukeni Local Municipality
Scale/Extent(ha, m3/a
or t/a)Commercial Plantations 1 1416 3.6Woodlot Plantations 11 519 98 0.1
Total Existing 12 1935 98 3.7Afforestation Potential - Moderate 83605Afforestation Potential - Good 13584
Total Potential 97189Total Plantations 99124
Natural Forests (Groups) 10599 20
Sawmills - Large 0 0Sawmills - Medium 0 0Sawmills - Small 6 5400Sawmills - Indigenous 0 0Chipboard 0 0Veneer 0 0Pole Treatment 5 2000Charcoal 0 0
Total Processing 11 7400 157 10.5255 14.2
Revenue (Rm/a)
Grand Total
Sector Segment Number Employees
Table 31 - Summary for Qaukeni Municipality
Final
Page 56
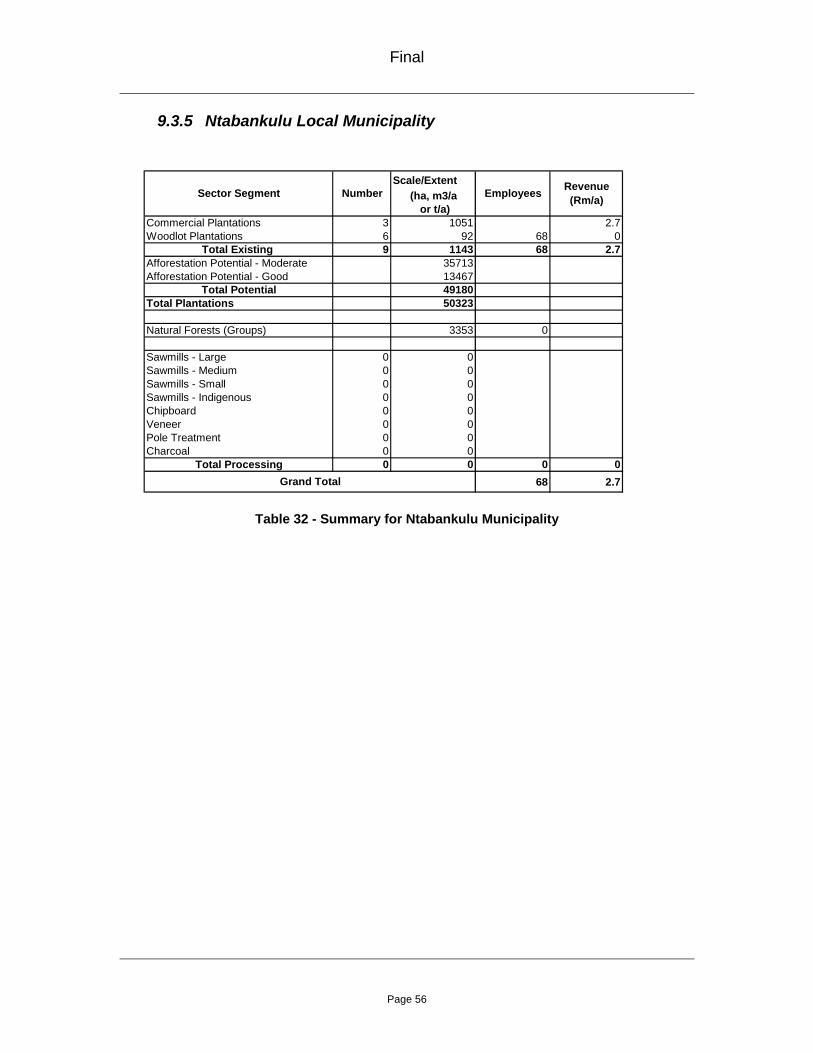
9.3.5 Ntabankulu Local Municipality
Scale/Extent(ha, m3/a
or t/a)Commercial Plantations 3 1051 2.7Woodlot Plantations 6 92 68 0
Total Existing 9 1143 68 2.7Afforestation Potential - Moderate 35713Afforestation Potential - Good 13467
Total Potential 49180Total Plantations 50323
Natural Forests (Groups) 3353 0
Sawmills - Large 0 0Sawmills - Medium 0 0Sawmills - Small 0 0Sawmills - Indigenous 0 0Chipboard 0 0Veneer 0 0Pole Treatment 0 0Charcoal 0 0
Total Processing 0 0 0 068 2.7
Revenue (Rm/a)
Grand Total
Sector Segment Number Employees
Table 32 - Summary for Ntabankulu Municipality

Final
Page 57
9.3.6 Nyandeni Local Municipality
Scale/Extent(ha, m3/a
or t/a)Commercial Plantations 0 0 0Woodlot Plantations 25 2853 88 0.7
Total Existing 25 2853 88 0.7Afforestation Potential - Moderate 101392Afforestation Potential - Good 3659
Total Potential 105051Total Plantations 107904
Natural Forests (Groups) 13199 29
Sawmills - Large 0 0Sawmills - Medium 0 0Sawmills - Small 0 0Sawmills - Indigenous 0 0Chipboard 0 0Veneer 0 0Pole Treatment 0 0Charcoal 0 0
Total Processing 0 0 0 088 0.7
Revenue (Rm/a)
Grand Total
Sector Segment Number Employees
Table 33 - Summary for Nyandeni Municipality

Final
Page 58
9.3.7 Port St Johns Local Municipality
Scale/Extent(ha, m3/a
or t/a)Commercial Plantations 0 0 0Woodlot Plantations 2 392 0 0.1
Total Existing 2 392 0 0.1Afforestation Potential - Moderate 50532Afforestation Potential - Good 3984
Total Potential 54516Total Plantations 54908
Natural Forests (Groups) 18714 34
Sawmills - Large 0 0Sawmills - Medium 0 0Sawmills - Small 0 0Sawmills - Indigenous 0 0Chipboard 0 0Veneer 0 0Pole Treatment 0 0Charcoal 0 0
Total Processing 0 0 0 00 0.1
Revenue (Rm/a)
Grand Total
Sector Segment Number Employees
Table 34 - Summary for Port St Johns Municipality

Final
Page 59
9.4 Ukhahlamba District Municipality
9.4.1 Elundini Local Municipality
Scale/Extent(ha, m3/a
or t/a)Commercial Plantations 8 25095 63.5Woodlot Plantations 7 343 731 0.1
Total Existing 15 25438 731 63.6Afforestation Potential - Moderate 331406Afforestation Potential - Good 23987
Total Potential 355393Total Plantations 380831
Natural Forests (Groups) 757 0
Sawmills - Large 0 0Sawmills - Medium 0 0Sawmills - Small 1 800Sawmills - Indigenous 0 0Chipboard 0 0Veneer 0 0Pole Treatment 0 0Charcoal 0 0
Total Processing 1 800 20 1.2751 64.8
Revenue (Rm/a)
Grand Total
Sector Segment Number Employees
Table 35 - Summary for Elundini Municipality
Final
Page 60
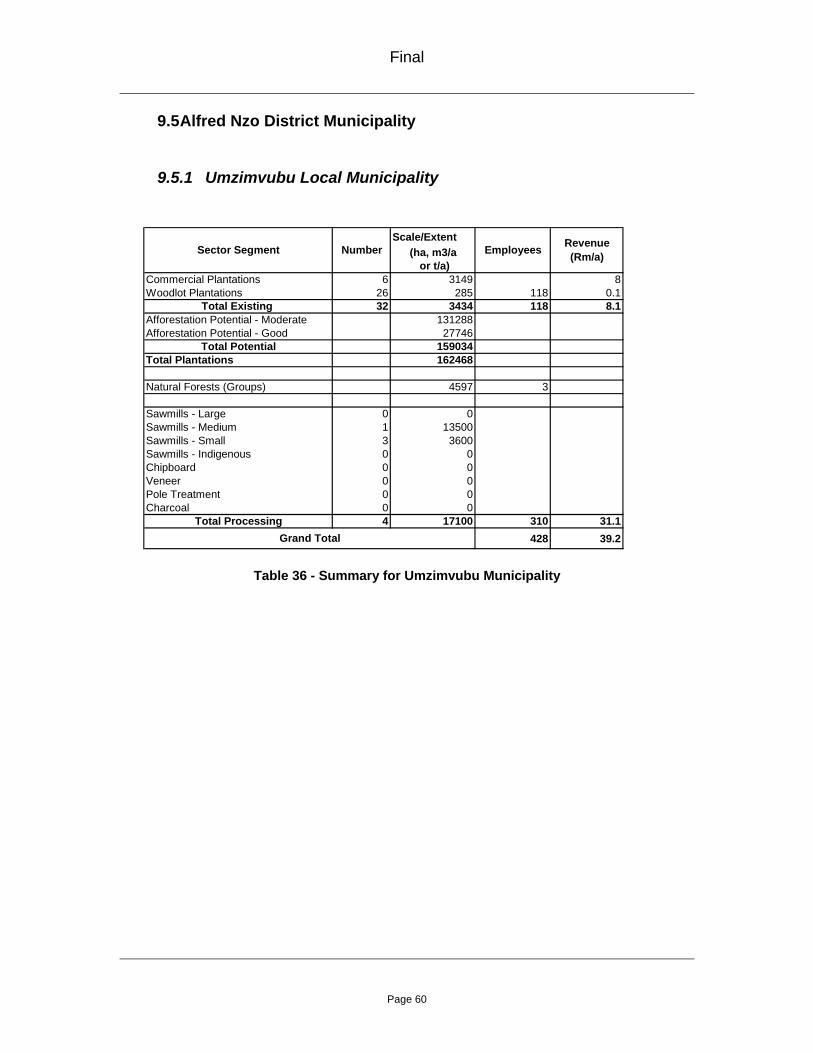
9.5 Alfred Nzo District Municipality
9.5.1 Umzimvubu Local Municipality
Scale/Extent(ha, m3/a
or t/a)Commercial Plantations 6 3149 8Woodlot Plantations 26 285 118 0.1
Total Existing 32 3434 118 8.1Afforestation Potential - Moderate 131288Afforestation Potential - Good 27746
Total Potential 159034Total Plantations 162468
Natural Forests (Groups) 4597 3
Sawmills - Large 0 0Sawmills - Medium 1 13500Sawmills - Small 3 3600Sawmills - Indigenous 0 0Chipboard 0 0Veneer 0 0Pole Treatment 0 0Charcoal 0 0
Total Processing 4 17100 310 31.1428 39.2
Revenue (Rm/a)
Grand Total
Sector Segment Number Employees
Table 36 - Summary for Umzimvubu Municipality

Final
Page 61
9.5.2 Matatiele Local Municipality
Scale/Extent(ha, m3/a
or t/a)Commercial Plantations 0 0 0Woodlot Plantations 5 408 7 0.1
Total Existing 5 408 7 0.1Afforestation Potential - Moderate 250928Afforestation Potential - Good 18310
Total Potential 269238Total Plantations 269646
Natural Forests (Groups) 1684 0
Sawmills - Large 0 0Sawmills - Medium 0 0Sawmills - Small 0 0Sawmills - Indigenous 0 0Chipboard 0 0Veneer 0 0Pole Treatment 0 0Charcoal 0 0
Total Processing 0 0 0 07 0.1
Revenue (Rm/a)
Grand Total
Sector Segment Number Employees
Table 37 - Summary for Matatiele Municipality

Final
Page 62
10 SOURCES AND REFERENCES
Willis, C (2002). Baseline Study on Woodlands in South Africa. Unpublished report ENV-P-C 2002-021, CSIR, Pretoria. DWAF (2005). A Woodlands Strategic Framework for the Department of Water Affairs and Forestry. Unpublished document, Department of Water Affairs and Forestry, Pretoria. DWAF (2006). Strategic Environmental Assessment Technical Reports, Volume 2. Unpublished document, Department of Water Affairs and Forestry, Pretoria. FAO (2005) Global Forest Resources Assessment. Progress Towards Sustainable Forest Management. FAO Forestry Paper 147. INR and Ukwasizwa Consulting (2003), South African Indigenous Fruit Sector Analysis and Proposed Way Forward. Unpublished document, Department of Water Affairs and Forestry, Pretoria. INR and Sonqoba Consulting (2003), Investigation Into The Ferns, Foliage & Foliage Industry In South Africa. Unpublished document, Department of Water Affairs and Forestry, Pretoria. INR (2003), Investigation Into The Ferns, Foliage & Foliage Industry In South Africa. Unpublished document, Department of Water Affairs and Forestry, Pretoria. INR (2003), Indigenous Medicinal Plant Trade. Unpublished document, Department of Water Affairs and Forestry, Pretoria. INR (2003), Forest Mushrooms. Unpublished document, Department of Water Affairs and Forestry, Pretoria. LHA (2003), Charcoal Production. Unpublished document, Department of Water Affairs and Forestry, Pretoria.
LHA (2004), Roundwood Supply and Demand to 2030. Unpublished document, WFSP Forestry Programme, Pretoria.

Final
Page 63
Appendix A Forestry Plantations
Appendix B Natural Forests
Appendix C Employees in Plantations
Appendix D Utilisation Activities


