Page 1
Eastern Maine
Healthcare Systems Non-Profit Health Care Investor Conference
May 21, 2014
0
M. Michelle Hood, FACHE
President and Chief Executive Officer
Derrick O. Hollings, CPA
Senior Vice President, Treasurer/CFO
Page 2
Together We’re Stronger 1
OUTLINE
System Overview Michelle Hood
Leadership Michelle Hood
Financials Derrick Hollings
Page 3
Together We’re Stronger 2
Presented by Michelle Hood
SYSTEM OVERVIEW
Page 4
Together We’re Stronger
‒ 10,301 employees
‒ 8 hospitals located across Maine
‒ 621 employed physicians
‒ 43 primary care practice locations
‒ 4 retail pharmacies
‒ 5 emergency transport units
‒ 9 nursing homes
‒ 5 home health locations
‒ integrated EMR
‒ freestanding cancer center
‒ 1.8 million outpatient visits annually
EMHS Provider Network
3
Page 5
Together We’re Stronger
EMHS MARKET
SHARE
4
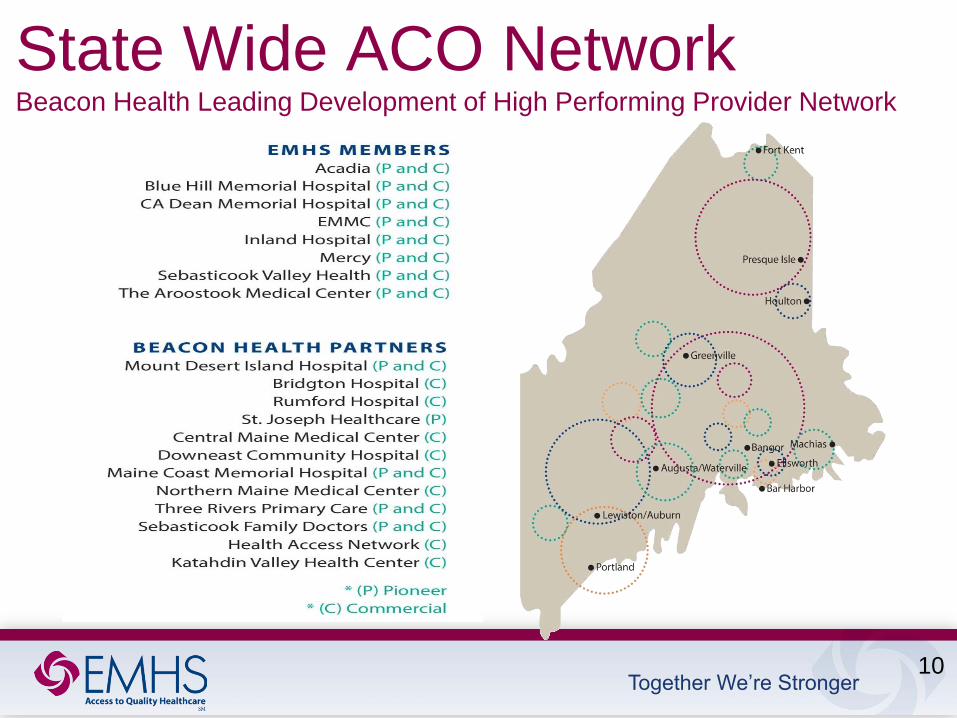
• EMHS exceeds 30% market share
across 2/3 of Maine’s geography
• 70% market share in Bangor
service area
• 25% market share in Portland
service area
Page 6
Together We’re Stronger 5
Presented by Michelle Hood
LEADERSHIP
Page 7
Together We’re Stronger
Leadership Engine
6
Passion Innovation Integrity Respect Partnership Accountability
EMHS partners with individuals and communities to improve health and
well-being by providing high quality, cost effective services.
EMHS will be a nationally recognized model of excellence in healthcare.
Mission
Vision
Values
Page 8
Together We’re Stronger
Governance Structure
Committees of the Board of Directors
Clinical Coordinating
Governance Nomination Strategic Planning
Executive Management Performance
Finance Audit and
Compliance
Investment Function
Team
• Board Chair: Jim Nicholson, CPA
• Board Size: At least 15 and not more than 25 directors
• Board Committee: Representation from across market service area
• Board Term: 3 year term and maximum of 4 full consecutive terms
Council of Chairs
7
Page 9
Together We’re Stronger 8
EMHS Board Exclusive
•System Level Budget
•Exercise rights as sole member or shareholder
Joint Board Initiatory Powers
•Member actions subjected to EMHS approval
•EMHS can act after consultation with Member
Member Board Exclusive
•Privileging and credentialing of medical staff
EMHS CEO
•Hiring of Member CEO
•Hiring of EMHS executive team
Member Organization CEO
•Hiring of Member Organization executive team
New Governance Model Joint & Exclusive Initiatory Powers
Integrated Member
Organizations subject to
EMHS, can initiate joint
strategic deliberation
and action
EMHS
President has
management
control of all
operations
EMHS, acting
independently,
can initiate
action at any
level
Page 10
Together We’re Stronger
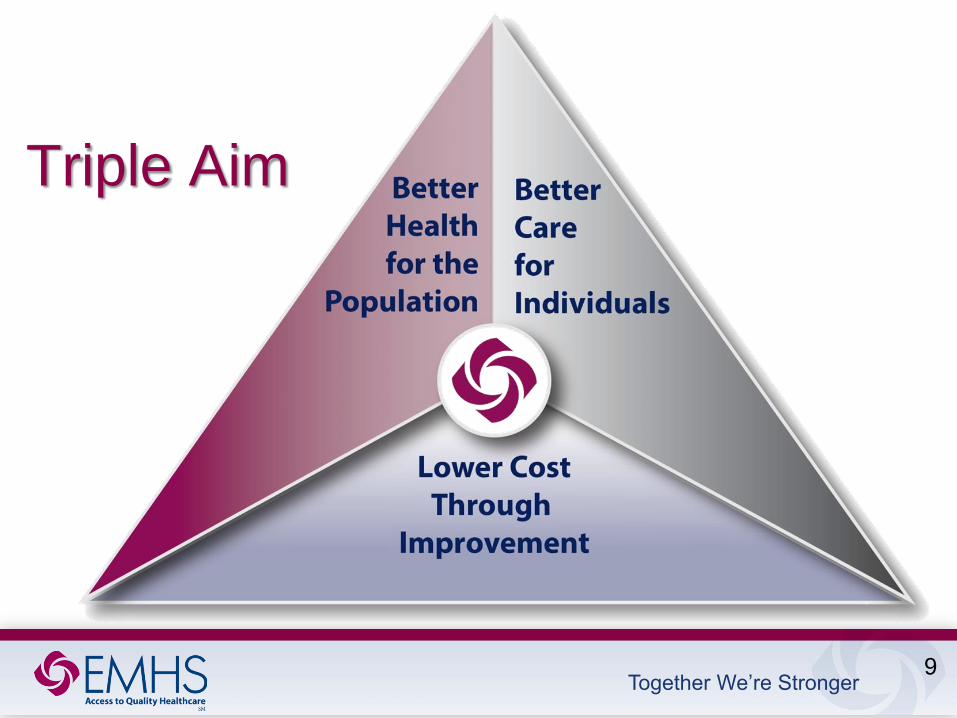
Triple Aim
9
Page 11
Together We’re Stronger 10
State Wide ACO Network Beacon Health Leading Development of High Performing Provider Network
Page 12
Together We’re Stronger
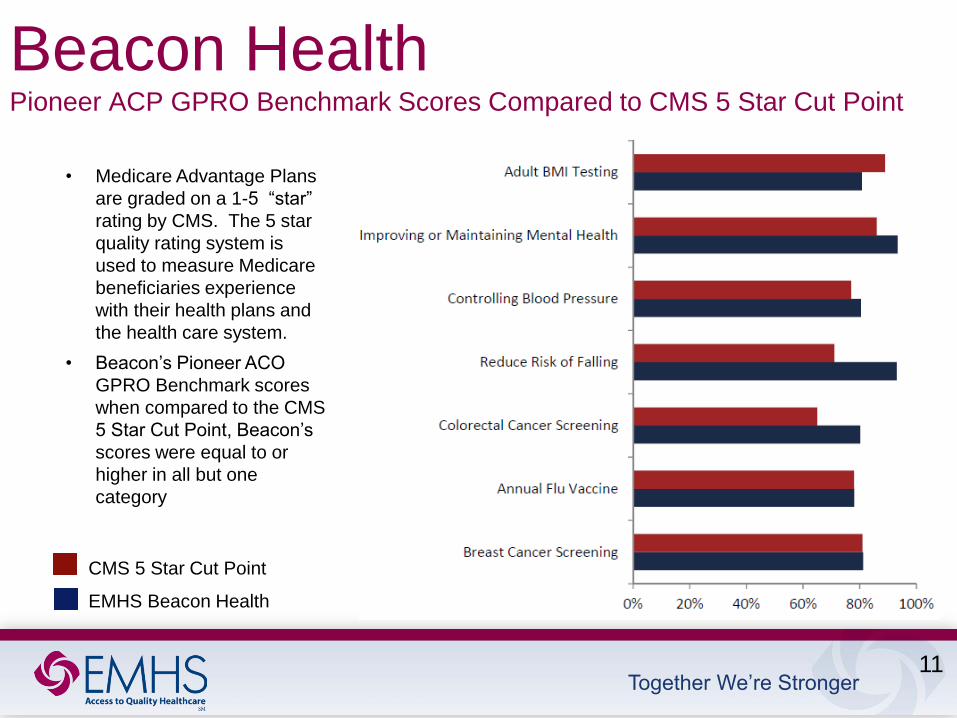
Beacon Health Pioneer ACP GPRO Benchmark Scores Compared to CMS 5 Star Cut Point
11
CMS 5 Star Cut Point
EMHS Beacon Health
• Medicare Advantage Plans
are graded on a 1-5 “star”
rating by CMS. The 5 star
quality rating system is
used to measure Medicare
beneficiaries experience
with their health plans and
the health care system.
• Beacon’s Pioneer ACO
GPRO Benchmark scores
when compared to the CMS
5 Star Cut Point, Beacon’s
scores were equal to or
higher in all but one
category
Page 13
Together We’re Stronger
Brand Architecture Reinforce the strategy behind our statewide integrated care delivery system
12
Page 14
Together We’re Stronger
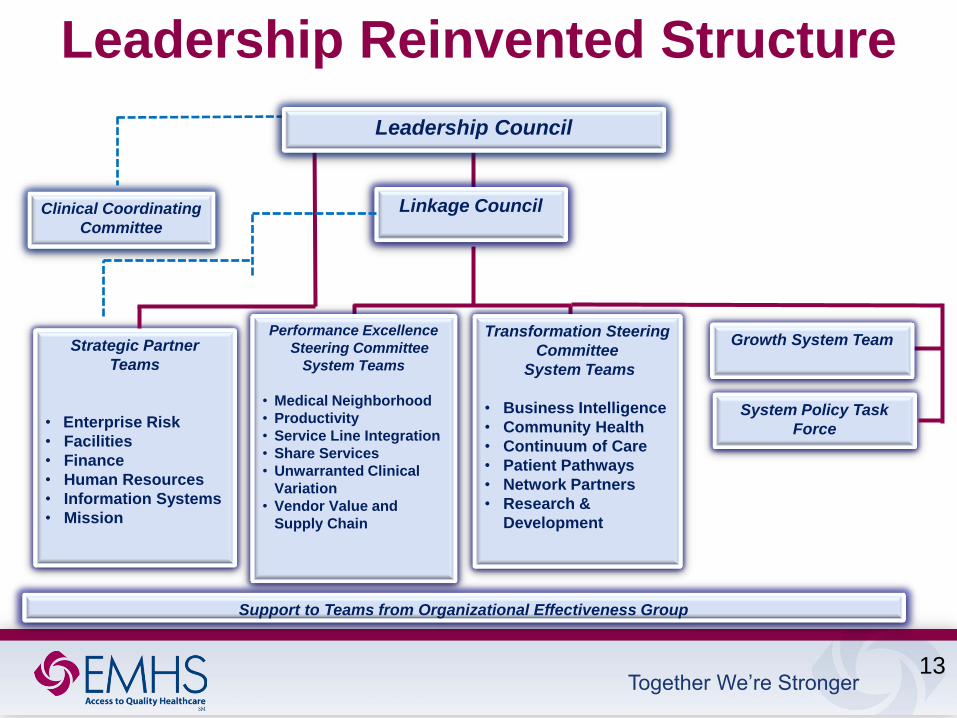
Leadership Reinvented Structure
Transformation Steering
Committee
System Teams
• Business Intelligence
• Community Health
• Continuum of Care
• Patient Pathways
• Network Partners
• Research &
Development
Strategic Partner
Teams
• Enterprise Risk
• Facilities
• Finance
• Human Resources
• Information Systems
• Mission
Leadership Council
Linkage Council Clinical Coordinating
Committee
Performance Excellence
Steering Committee
System Teams
• Medical Neighborhood
• Productivity
• Service Line Integration
• Share Services
• Unwarranted Clinical
Variation
• Vendor Value and
Supply Chain
Support to Teams from Organizational Effectiveness Group
Growth System Team
System Policy Task
Force
13
Page 15
Together We’re Stronger
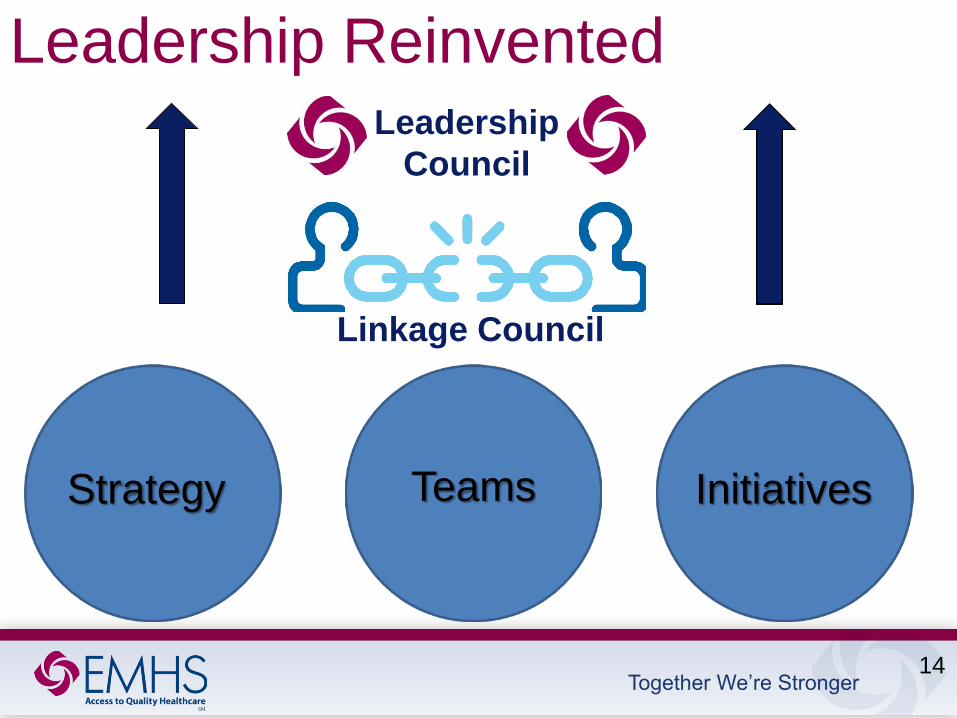
Leadership Reinvented
Strategy Teams Initiatives
Linkage Council
Leadership
Council
14
Page 16
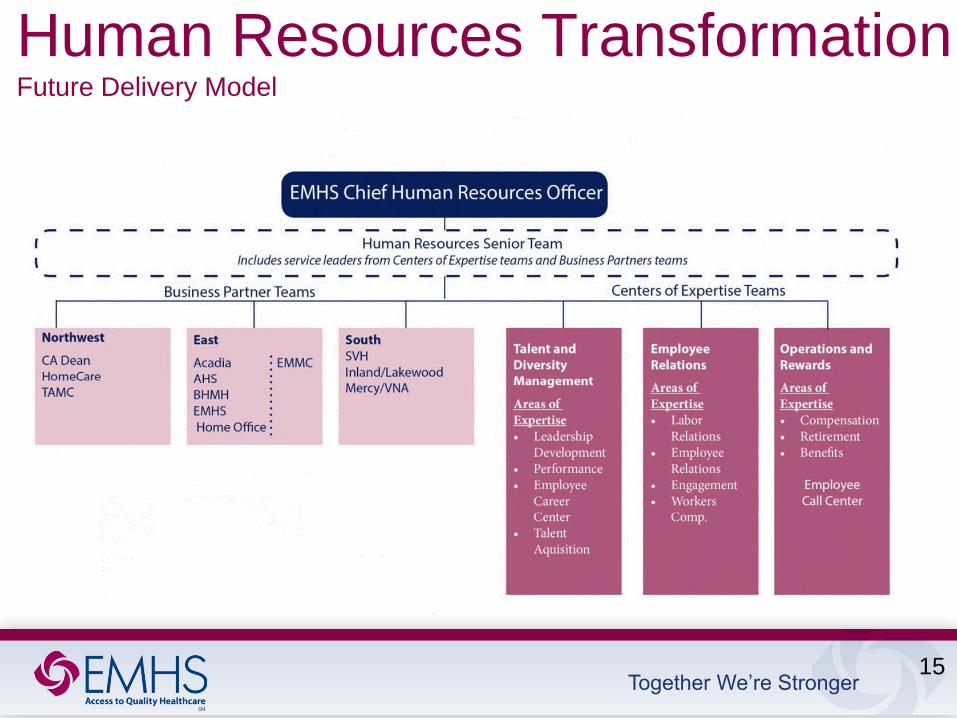
Together We’re Stronger 15
Human Resources Transformation Future Delivery Model
Page 17
Together We’re Stronger
Nursing doc.
Doc. imaging CPOE/orders
Financial
Reporting
Medical Records
ED
Pharmacy
Surgery
EMPI
Device Integration
(from home)
OB Cardiology
Secure Messaging to Physician
(referrals, consults, notes)
ICU Oncology
Registration
Eligibility
ePrescribing
Patient
Education
Results
Review
Document Image Scanning CPOE/Orders
Protocols
Documentation Templates
Automated Faxing
Scanning
Patient
Messaging
EMPI
Chronic
Disease Registries PACS
P4P Reporting
PQRI / MU
Health
Maintenance
Office Device
Integration
Workflow
Task Queue
Appointment
Scheduling
Billing
AR
Charge
Capture
Bi Directional
Orders
Physician
Portal
Secure Messaging to Physician
(referrals, consults, notes)
Data Exchange
Community Viewer
NHIN
Personal Health
Record (PHR)
State Immunization
Registry
Patient Portal
eVisits
State
HIE
Enterprise Supply Chain & HRIS Enterprise Revenue
Foundation and
pathways
Enhanced data
capture and workflow
Interoperability/
Connectivity
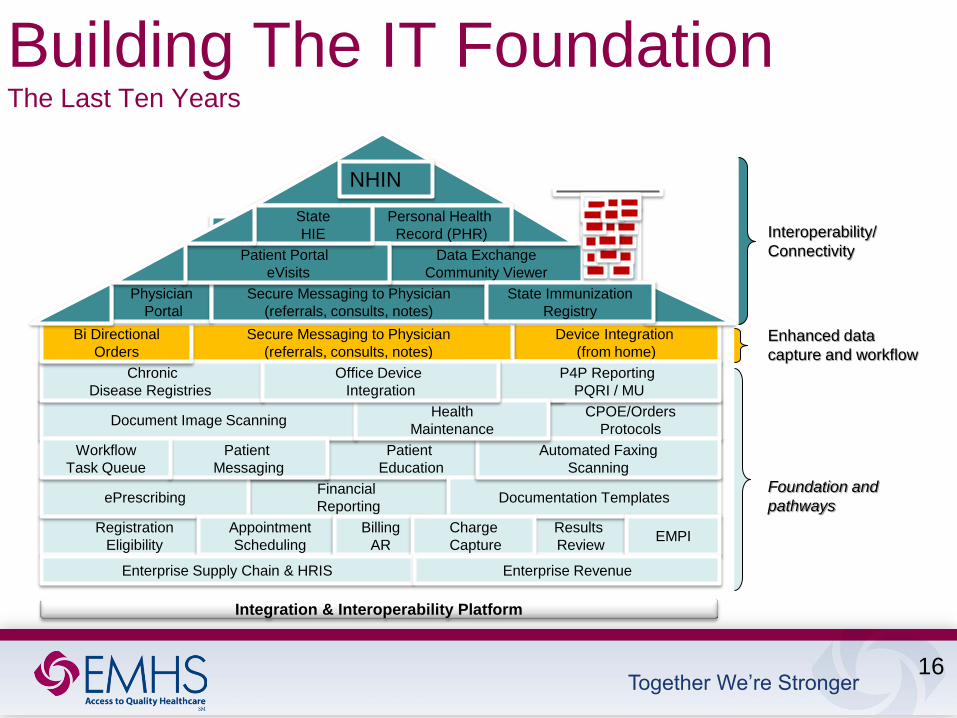
Building The IT Foundation The Last Ten Years
Integration & Interoperability Platform
16
Page 18
Together We’re Stronger
Future IT Architecture Delivery Model
Future Source Data Source Data
PHR Referral Patient
Satisfaction Lab PBM (Rx)
EPM Practice
Demographics
Payer
Non-Affiliate
EHR
Public
Health
Single
EHR
Population Health
Data Warehouse
Network
Practice
HIEs
Quality
Mgmt Physician
Profiling Payer/Contract
Analytics Network
Mgmt
Analytics
Physician
Portal
Patient
Portal
Registry
Integration & Interoperability Platform
HIEs Medical
Devices Data
Other Data
TBD
Care Management
Medical
Economics Patient/Physician
Engagement
<Internal Data
Research
External Data>
17
Page 19
Together We’re Stronger
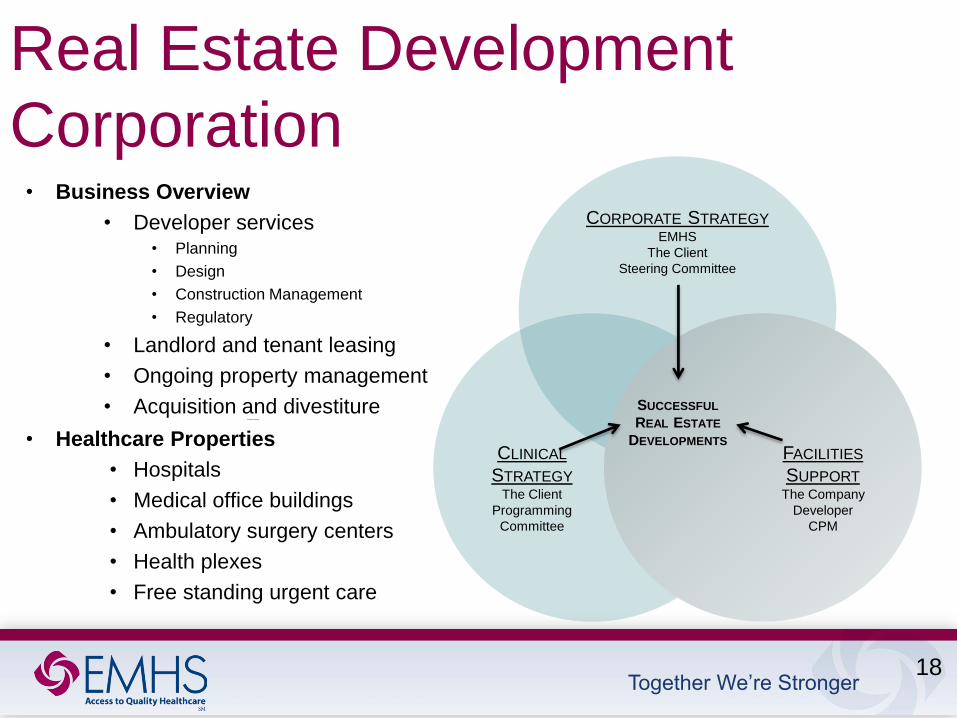
Real Estate Development
Corporation • Business Overview
• Developer services • Planning
• Design
• Construction Management
• Regulatory
• Landlord and tenant leasing
• Ongoing property management
• Acquisition and divestiture •Business Overview
• Healthcare Properties
• Hospitals
• Medical office buildings
• Ambulatory surgery centers
• Health plexes
• Free standing urgent cares
CORPORATE STRATEGY EMHS
The Client
Steering Committee
CLINICAL
STRATEGY The Client
Programming
Committee
FACILITIES
SUPPORT The Company
Developer
CPM
SUCCESSFUL
REAL ESTATE
DEVELOPMENTS
18
Page 20
Together We’re Stronger
Transforming Payment Models Declining Dollars Entering Healthcare Will Trigger Reallocation of Existing Payments
• Episodic treatments and reactive approach
• Employed physicians with very little incentive for population health management
Patient Experience
Hospital Role
Health Plan
• Economics largely inpatient based
• Disjointed approach to cost reductions
• Infancy state of reducing variation in clinical care
• EMHS negotiating individual contracts for hospitals and physicians
• Reimbursements are based on number of transactions and gross charges
• Proactive wellness management , and care coordination for all illnesses
• Culture of personal accountability with incentives for care management
• Most care delivery in ambulatory settings
• Bed utilization management across health system to achieve maximum efficiency
• Care coordination strategies across patient care continuum
• Joint ventures with health plans
• EMHS at greater risk for managing costs in fixed budget arrangements
• Data collaborations with payers, patients and employers
Physician Alignment
• Low productivity in physician practices
• Fragmented medical groups across EMHS
• Lots of closed physician panels
• Real time tools tracking and measuring productivity
• Reduced clinical variations
• System wide product/service lines
EMHS Today EMHS Tomorrow
19
Page 21
Together We’re Stronger
Treasury Transformation Future Delivery Model
Centralized Platform
Capital Allocation
Invested Asset
Cash Management
Cash
Investments • Assets are managed and
controlled at System level
• Allocation of cash resources
occurs across System
• Invested asset purpose and
policies and risk tolerance
set and then maintained at
System level
Financial Management
• Centralized Balance
Sheet
• Decentralized Income
Statements
• Business Unit
Model
• Performance
Centric Design
20
Cash Management • Pooling cash into single account at
System level
• Endowment remain aligned with Member
• Disbursements for payroll and vendors
occur at System level
Debt Management • All debt issued under single Obligated
Group
• System-wide capital structure that relates
to a System-wide risk point of view
• Allows capital market access for all
Members
Page 22
Together We’re Stronger
Integrated Planning The whole is greater than sum of its parts
21
Demand • Trends rates /1000 populations • Clinical capacity • Competitive landscape • Service offering • Environmental impact Fiscal Year 15
Annual Budget
Fiscal Years 16-19 Financial Plan
Strategic Plan Capital Expenditures
Annual Budget Financial Plan
Planning
Business
Plans
Centralized
Budgeting
Process
5 Year Plan
Driven By
Performance
Metrics
Combination
of System &
Member
Prioritization
Page 23
Together We’re Stronger
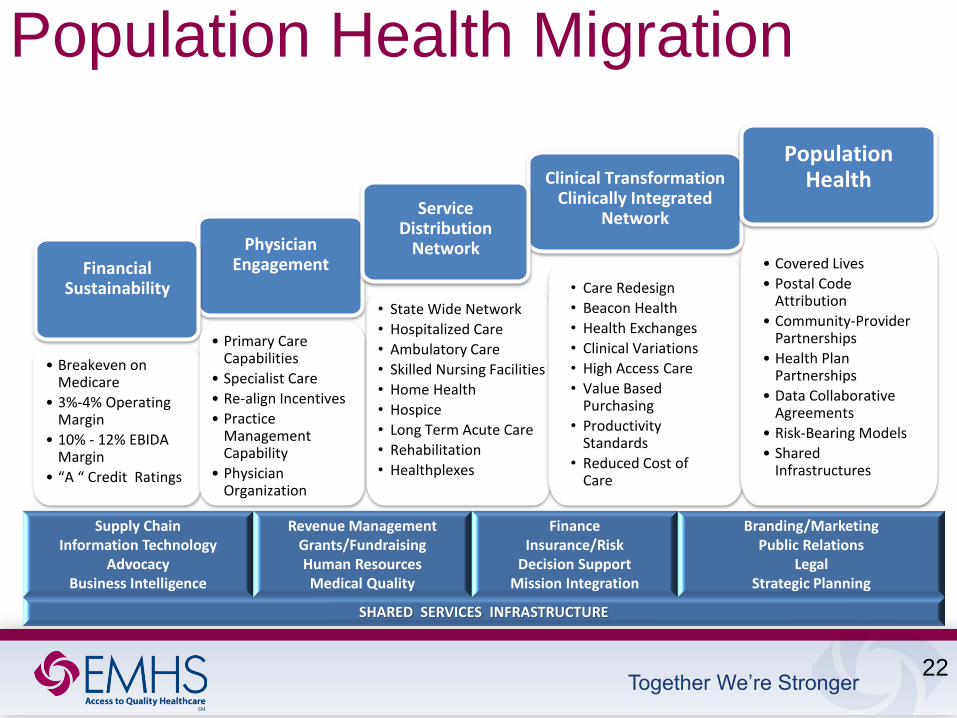
Population Health Migration
Physician Engagement
Clinical Transformation Clinically Integrated
Network Service
Distribution Network
• Breakeven on Medicare
• 3%-4% Operating Margin
• 10% - 12% EBIDA Margin
• “A “ Credit Ratings
• State Wide Network
• Hospitalized Care
• Ambulatory Care
• Skilled Nursing Facilities
• Home Health
• Hospice
• Long Term Acute Care
• Rehabilitation
• Healthplexes
• Care Redesign
• Beacon Health
• Health Exchanges
• Clinical Variations
• High Access Care
• Value Based Purchasing
• Productivity Standards
• Reduced Cost of Care
Financial Sustainability
• Primary Care Capabilities
• Specialist Care
• Re-align Incentives
• Practice Management Capability
• Physician Organization
Population Health
• Covered Lives
• Postal Code Attribution
• Community-Provider Partnerships
• Health Plan Partnerships
• Data Collaborative Agreements
• Risk-Bearing Models
• Shared Infrastructures
Supply Chain
Information Technology Advocacy
Business Intelligence
Revenue Management Grants/Fundraising Human Resources Medical Quality
Finance Insurance/Risk
Decision Support Mission Integration
Branding/Marketing Public Relations
Legal Strategic Planning
SHARED SERVICES INFRASTRUCTURE
22
Page 24
Together We’re Stronger 23
Presented by Derrick Hollings
FINANCIALS
Page 25
Together We’re Stronger
Debt Structure
1- As of June 1, 2014
1
24
* - Private Placement Debt
Debt
Par
Outstanding 1
Final
Maturity Coupon Enhancement Call Status
2014 Mercy* 8,450,000 2024 4.53% N/A 7/1/2014 @ 3%
2014 Mercy* 61,055,000 2036 3.07% N/A 7/1/2014 @ 3%
2013 EMMC $143,900,000 2043 3%-5% N/A 7/1/2023 @ par
2013 SVH* 9,924,999 2029 2.87%-3.41% N/A 1/1/2014 @ 5%
2012A TAMC 5,365,000 2022 2.5%-5.05 N/A 7/1/2022 @ par
2010B BHMH 2,130,000 2028 3.0%-5.25% N/A 7/1/2020 @ par
2010B TAMC 5,065,000 2019 3.0%-5.25% N/A Non-Callable
2010A Acadia 9,855,000 2021 3.0%-5.0% N/A 7/1/2020 @ par
2010A EMMC 64,730,000 2040 3.0%-5.25% N/A 7/1/2020 @ par
2007B Inland 2,845,000 2037 4.0%-5.0% FGIC 7/1/2018 @ par
2007B Lakewood 6,255,000 2037 4.0%-5.0% FGIC 7/1/2018 @ par
2006A Inland 1,135,000 2030 4.0%-5.0% MBIA 7/1/2015 @ par
2004B SVH 185,000 2015 3.625%-3.75% Ambac 7/1/2015 @ par
$320,894,999
Page 26
Together We’re Stronger
Debt Dashboard
Bond Interest Mix
As of June 1, 2014
25
Maximum Annual Debt Service
Bond Debt Mix
Bond Debt Security
EMMC 67%
Acadia 2%
BHMH 1%
TAMC 2%
SVH 2%
Inland 4%
CA Dean 0%
Home Office
7%
Mercy 15%
Obligated Group,
64%
Non-Obligated
Group, 21%
Private 25%
Public 75%
Private Fixed, 28%
Public Fixed, 62%
Variable , 2%
Synthetic Fixed, 8%
Page 27
Together We’re Stronger
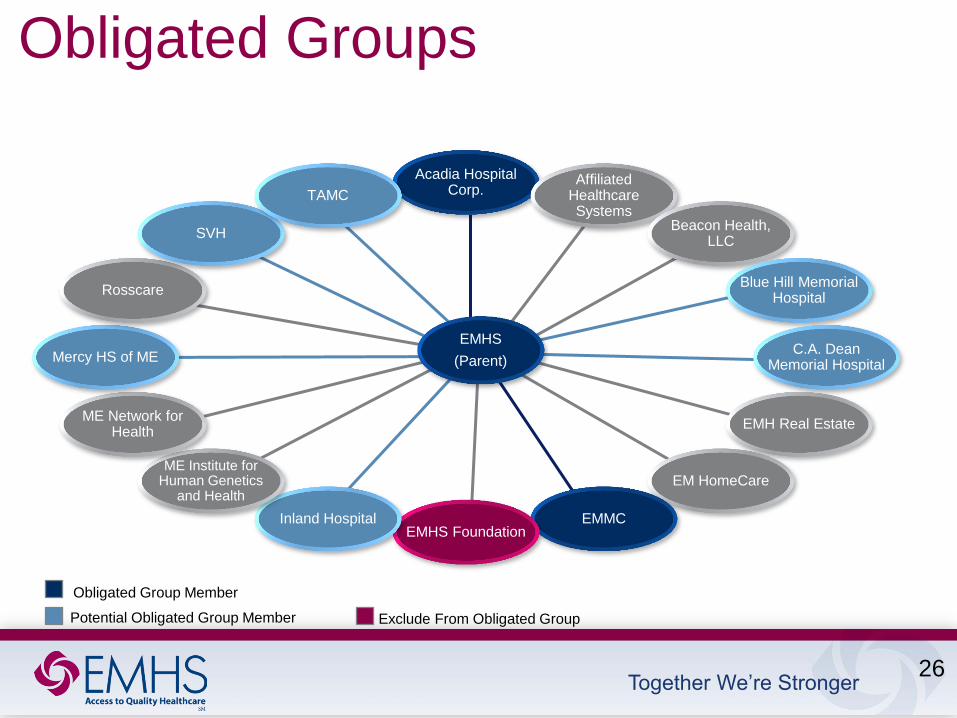
Obligated Groups
Potential Obligated Group Member
EMHS
(Parent)
Acadia Hospital Corp.
Affiliated Healthcare Systems
Beacon Health, LLC
Blue Hill Memorial Hospital
C.A. Dean Memorial Hospital
EMH Real Estate
EM HomeCare
EMMC EMHS Foundation
Inland Hospital
ME Institute for Human Genetics
and Health
ME Network for Health
Mercy HS of ME
Rosscare
SVH
TAMC
Obligated Group Member
26
Exclude From Obligated Group
Page 28
Together We’re Stronger
Revenue Growth
27
-
200,000
400,000
600,000
800,000
1,000,000
1,200,000
1,400,000
2008 2009 2010 2011 2012 2013 2014
Total Revenue
(1)
Note 1: Forecast
Page 29
Together We’re Stronger
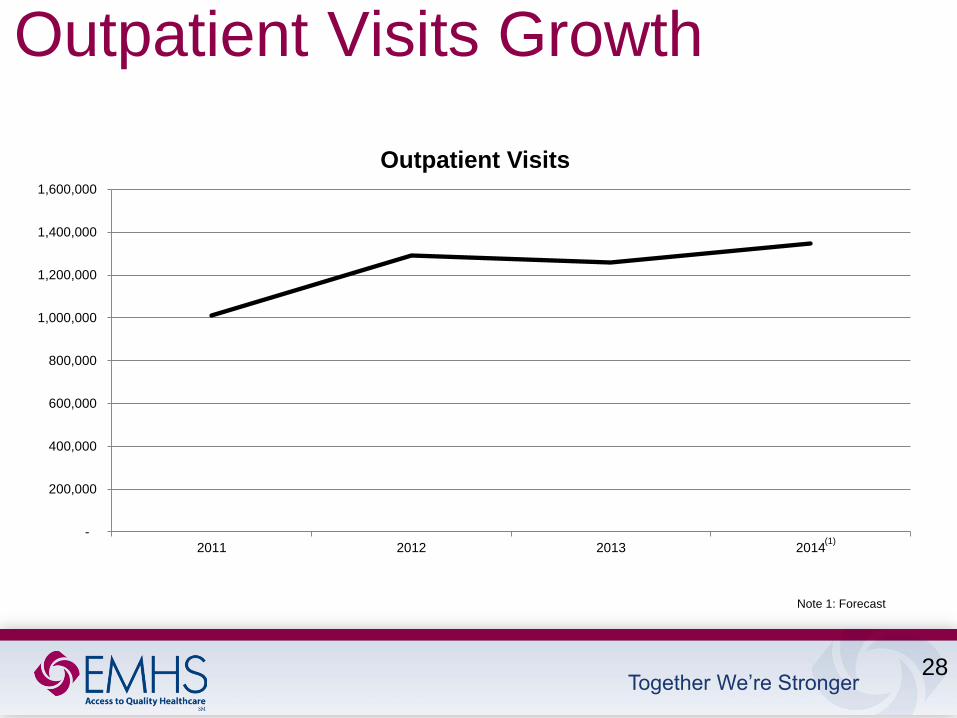
Outpatient Visits Growth
28
-
200,000
400,000
600,000
800,000
1,000,000
1,200,000
1,400,000
1,600,000
2011 2012 2013 2014
Outpatient Visits
(1)
Note 1: Forecast
Page 30
Together We’re Stronger
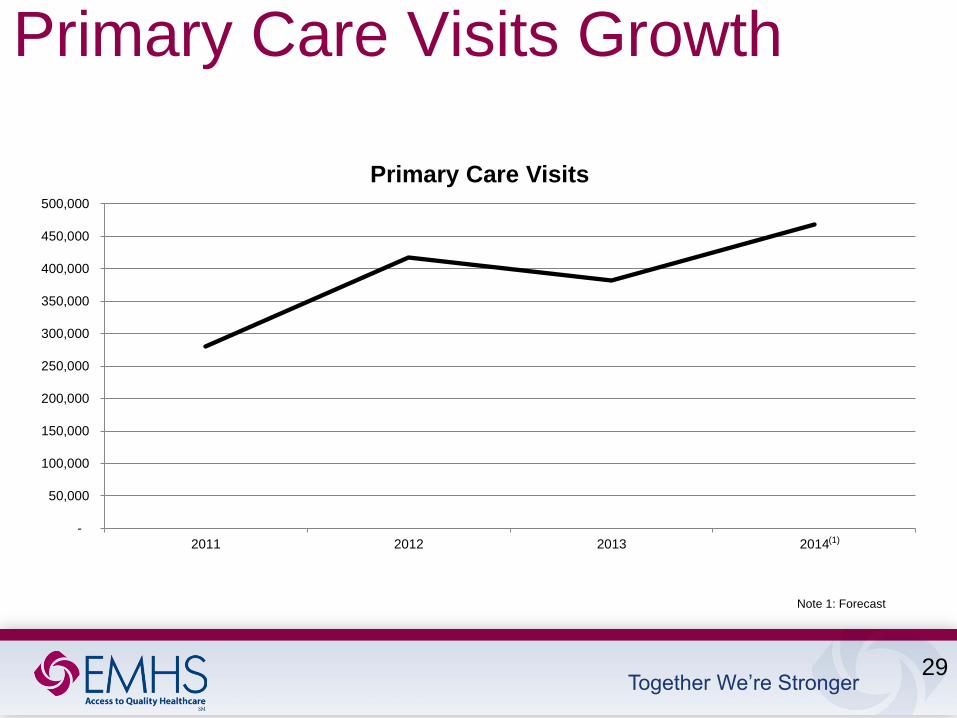
Primary Care Visits Growth
29
-
50,000
100,000
150,000
200,000
250,000
300,000
350,000
400,000
450,000
500,000
2011 2012 2013 2014
Primary Care Visits
Note 1: Forecast
(1)
Page 31
Together We’re Stronger
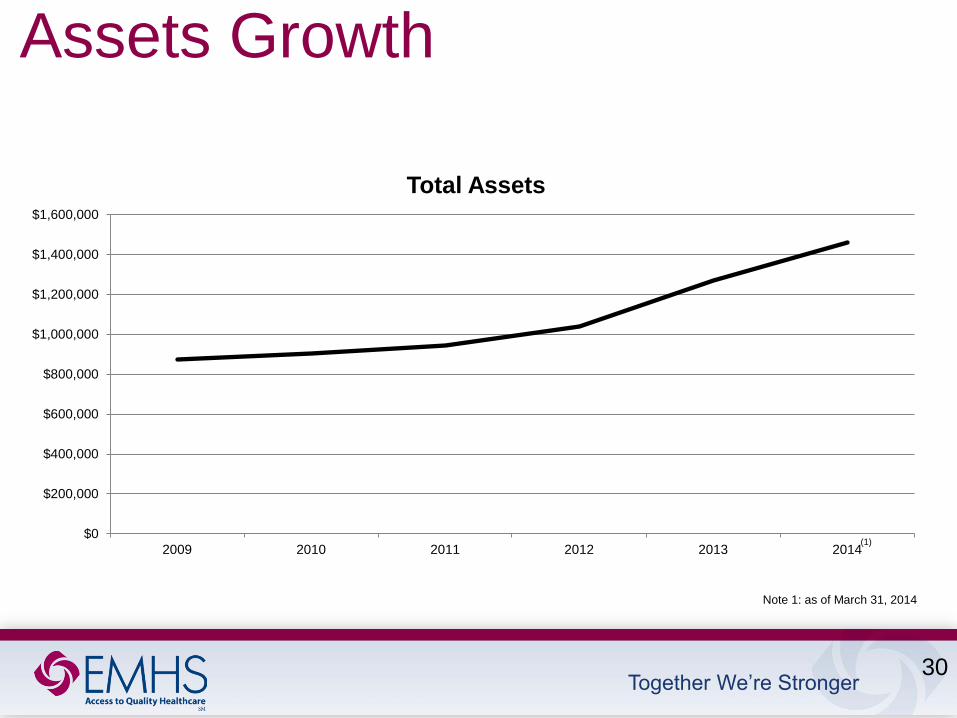
Assets Growth
30
$0
$200,000
$400,000
$600,000
$800,000
$1,000,000
$1,200,000
$1,400,000
$1,600,000
2009 2010 2011 2012 2013 2014
Total Assets
Note 1: as of March 31, 2014
(1)
Page 32
Together We’re Stronger
Key Performance Indicators
Description 2011 2012 2013 2014 (1)
Debt Position:
Debt Service Coverage 4.4 6.0 6.5 2.8
LTD to Capitalization 29.6% 25.1% 36.8% 36.4%
Debt Service as % of Revenue 1.9% 1.8% 1.7% 2.2%
Cushion Ratio 15.1 16.6 21.9 15.4
Liquidity:
Cash to Long Term Debt 167% 200% 122% 120%
Days Cash on Hand 113 124 146 134
Days in A/R, net 38.4 33.4 38.4 41
Performance:
Operating Margin 2.2% 5.9% 3.7% -1.6%
EBIDA Margin 7.6% 10.7% 8.6% 2.9%
Total Margin 3.1% 6.1% 6.2% -1.3%
Note 1: as of March 31, 2014
31
Page 33
Together We’re Stronger
Thank You
32