47
How is Eating the O11y World May 8, 2020
How is
Eating the O11y WorldMay 8, 2020
2
Agenda
● Introduction● Architecture● Specifications● Collector● Client Libraries● Demo

Introduction
@smflanders
flands
https://sflanders.net
Steve FlandersDirector of Engineering, SplunkOpenTelemetry Collector ApproverCNCF SIG-Observability Chair Nominee
Previously:
● Head of Product, Omnition● Global Engineering Manager for Logs,
VMware
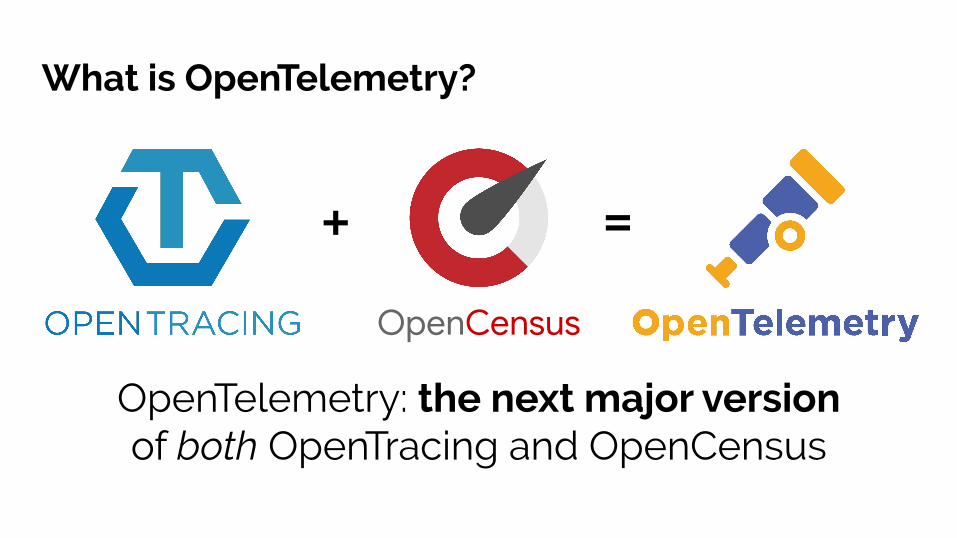
What is OpenTelemetry?
OpenCensus
+ =
OpenTelemetry: the next major versionof both OpenTracing and OpenCensus

Cloud Native Telemetry
foreach(language)
foreach(language)
collectors, sidecars, etc
w3c trace-context, wire formats fortrace data, metrics, logs, etc
Telemetry “verticals”
Tele
me
try
“lay
ers
”
Tracing Metrics Logs, etc
Instrumentation APIs
Canonical implementations
Data infrastructure
Interop formats

7
Project Stats
● CNCF DevStats○ General: 104 members (245+ active contributors) from 45+ companies and 40+ countries○ Contributors: 660+ unique contributors and 60K+ contributions
● Community Stats○ Cloud Providers: Azure and GCP○ Vendors: Datadog, Dynatrace, Honeycomb, Lightstep, New Relic, Splunk, Stackdriver○ Users (and contributors): Mailchimp, Postmates, Shopify, Zillow
● CNCF Project Collaboration○ Fluentbit: Potential log agent for OpenTelemetry○ Jaeger: Plan to leverage client libraries and collector (collector already announced)
8
is the second most active project in CNCF today!
�� ��(per CNCF DevStats)

Architecture
10
Components
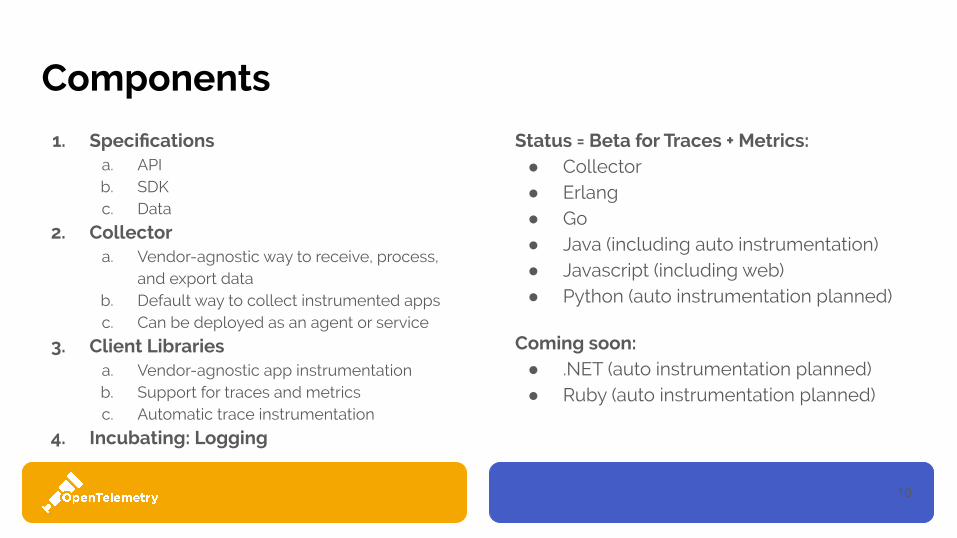
1. Specificationsa. APIb. SDKc. Data
2. Collectora. Vendor-agnostic way to receive, process,
and export datab. Default way to collect instrumented appsc. Can be deployed as an agent or service
3. Client Librariesa. Vendor-agnostic app instrumentationb. Support for traces and metricsc. Automatic trace instrumentation
4. Incubating: Logging
Status = Beta for Traces + Metrics:● Collector● Erlang● Go● Java (including auto instrumentation)● Javascript (including web)● Python (auto instrumentation planned)
Coming soon:● .NET (auto instrumentation planned)● Ruby (auto instrumentation planned)
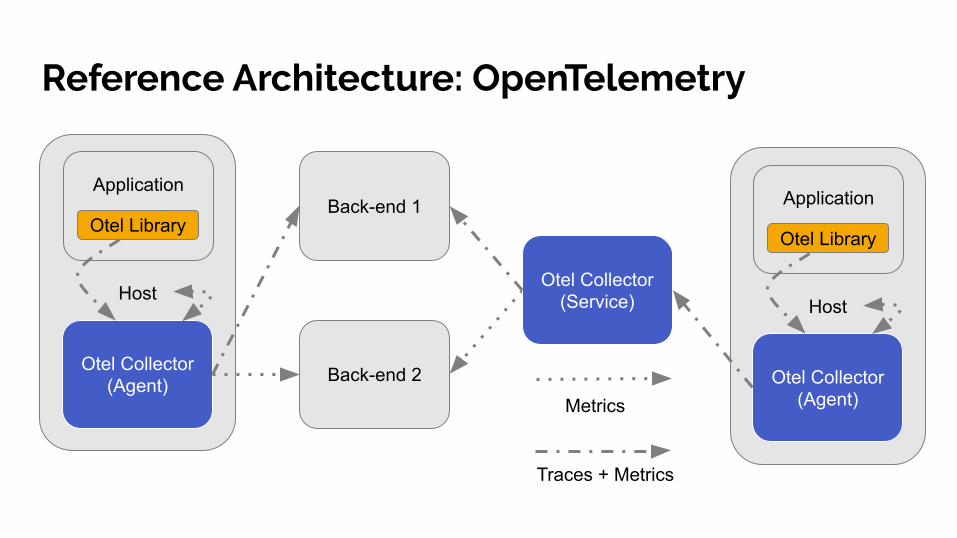
Reference Architecture: OpenTelemetry
Host
Application
Otel Library
Otel Collector(Agent)
Traces + Metrics
Metrics
Back-end 1
Back-end 2
Host
Application
Otel Library
Otel Collector(Agent)
Otel Collector(Service)
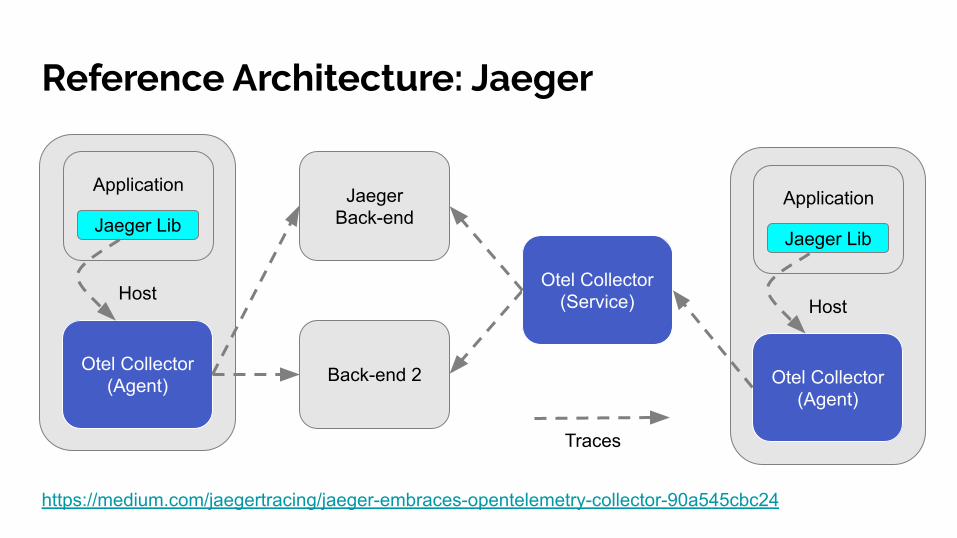
Reference Architecture: Jaeger
Host
Application
Jaeger Lib
Otel Collector(Agent)
Traces
Jaeger Back-end
Back-end 2
Host
Application
Jaeger Lib
Otel Collector(Agent)
Otel Collector(Service)
https://medium.com/jaegertracing/jaeger-embraces-opentelemetry-collector-90a545cbc24

Specifications

14
Tracing Basics
● Context: W3C trace-context, B3, etc.● Tracer: get context● Spans: “call” in a trace
○ Kind: client/server, producer/consumer, internal○ Attributes: key/value pairs; tags; metadata○ Events: named strings○ Links: useful for batch operations
● Sampler: always, probabilistic, etc.● Span processor: simple, batch, etc.● Exporter: OTLP, Jaeger, Prometheus, Zipkin, etc.

15
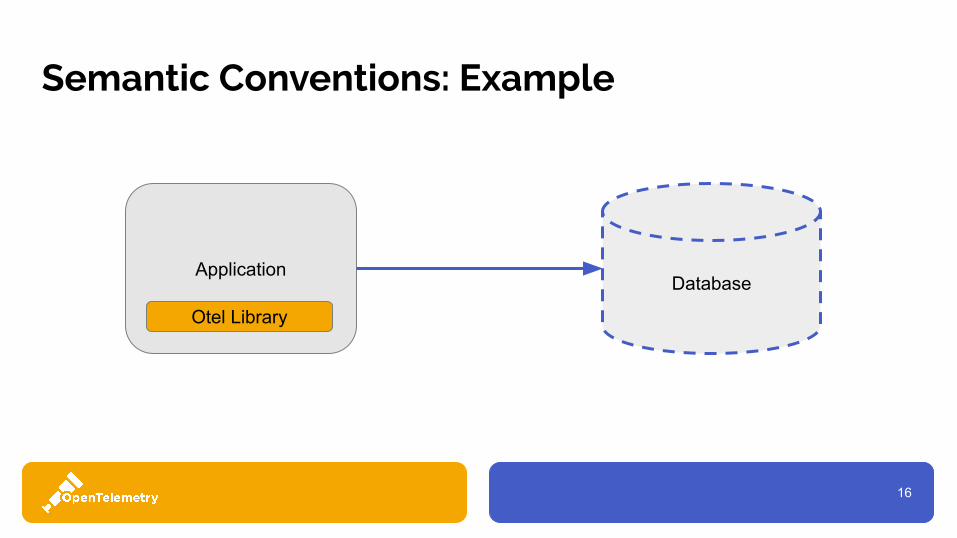
Tracing Semantic Conventions
In OpenTelemetry, spans can be created freely and it’s up to the implementor to annotate them with attributes specific to the represented operation. Some span operations represent calls that use well-known protocols like HTTP or database calls. It is important to unify attribution.
● HTTP: http.method, http.status_code● Database: db.type, db.instance, db.statement● Messaging: messaging.system, messaging.destination● FaaS: faas.trigger
16
Semantic Conventions: Example
ApplicationDatabase
Otel Library
17
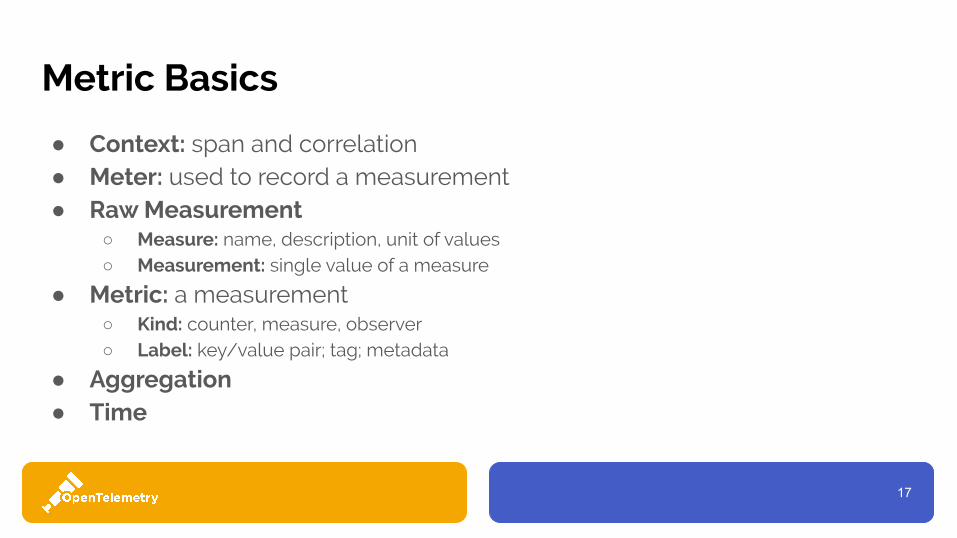
Metric Basics
● Context: span and correlation● Meter: used to record a measurement● Raw Measurement
○ Measure: name, description, unit of values○ Measurement: single value of a measure
● Metric: a measurement○ Kind: counter, measure, observer○ Label: key/value pair; tag; metadata
● Aggregation ● Time
18
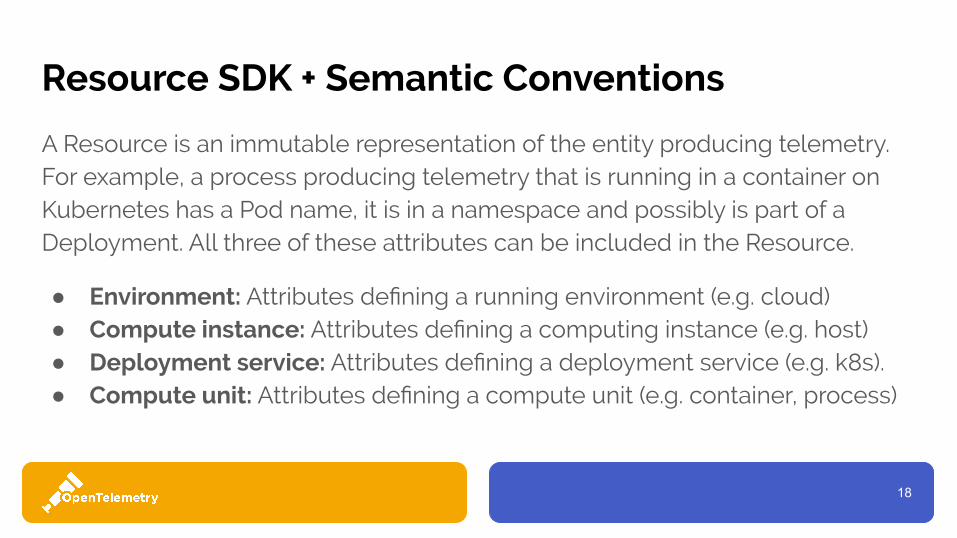
Resource SDK + Semantic Conventions
A Resource is an immutable representation of the entity producing telemetry. For example, a process producing telemetry that is running in a container on Kubernetes has a Pod name, it is in a namespace and possibly is part of a Deployment. All three of these attributes can be included in the Resource.
● Environment: Attributes defining a running environment (e.g. cloud)● Compute instance: Attributes defining a computing instance (e.g. host)● Deployment service: Attributes defining a deployment service (e.g. k8s).● Compute unit: Attributes defining a compute unit (e.g. container, process)

Collector
20
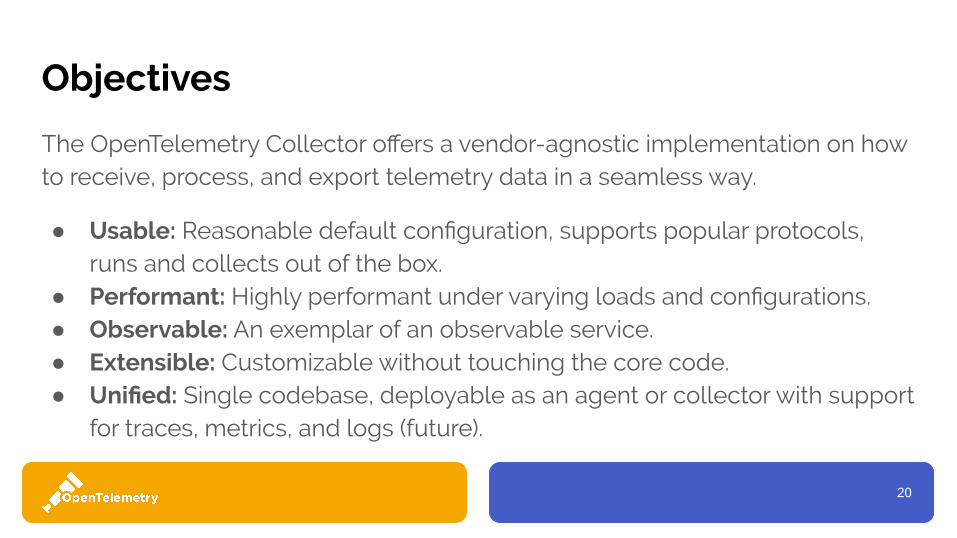
Objectives
The OpenTelemetry Collector offers a vendor-agnostic implementation on how to receive, process, and export telemetry data in a seamless way.
● Usable: Reasonable default configuration, supports popular protocols, runs and collects out of the box.
● Performant: Highly performant under varying loads and configurations.● Observable: An exemplar of an observable service.● Extensible: Customizable without touching the core code.● Unified: Single codebase, deployable as an agent or collector with support
for traces, metrics, and logs (future).

21
But why?
● Offload responsibility from the application○ Compression○ Encryption○ Retry○ Tagging / Redaction○ Vendor-specific exporting
● Time-to-value○ Language-agnostic; makes changes easier○ Set it and forget it; instrumentation that is ready for the Collector○ Vendor-agnostic and easily extensible
22
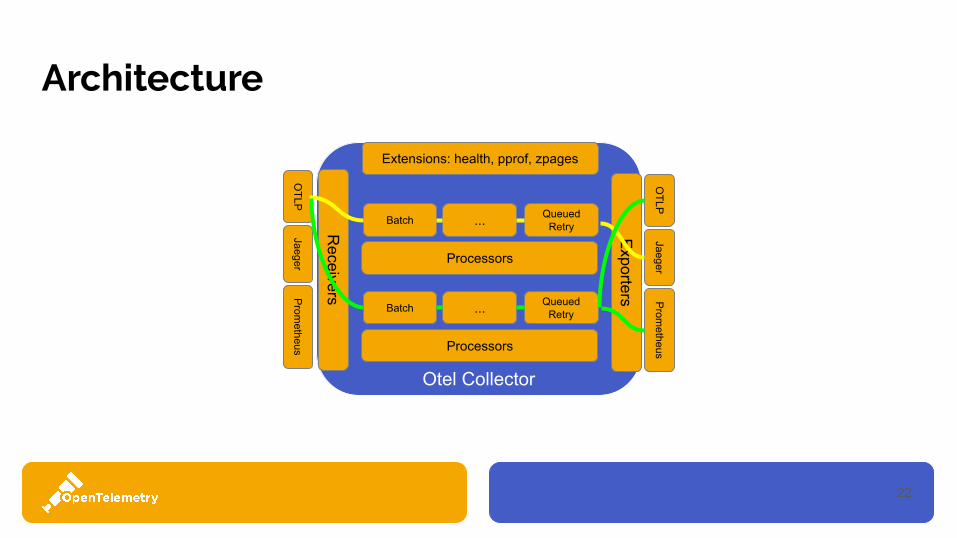
Architecture
Otel Collector
Receivers
Exporters
Batch ... Queued Retry
Processors
Extensions: health, pprof, zpages
OTLP
JaegerP
rometheus
OTLP
JaegerP
rometheus
Batch ... Queued Retry
Processors
23
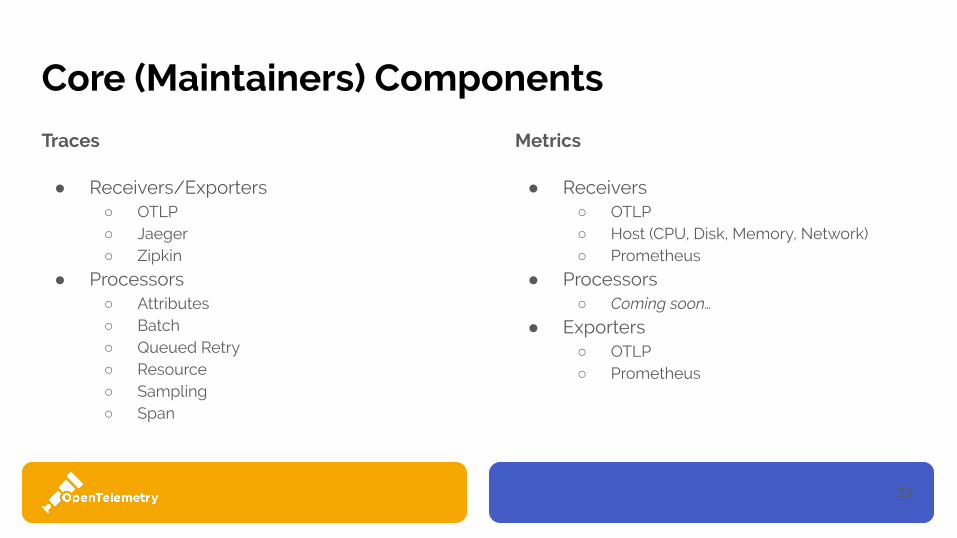
Core (Maintainers) Components
Traces
● Receivers/Exporters○ OTLP○ Jaeger○ Zipkin
● Processors○ Attributes○ Batch○ Queued Retry○ Resource○ Sampling○ Span
Metrics
● Receivers○ OTLP○ Host (CPU, Disk, Memory, Network)○ Prometheus
● Processors○ Coming soon…
● Exporters○ OTLP○ Prometheus
24
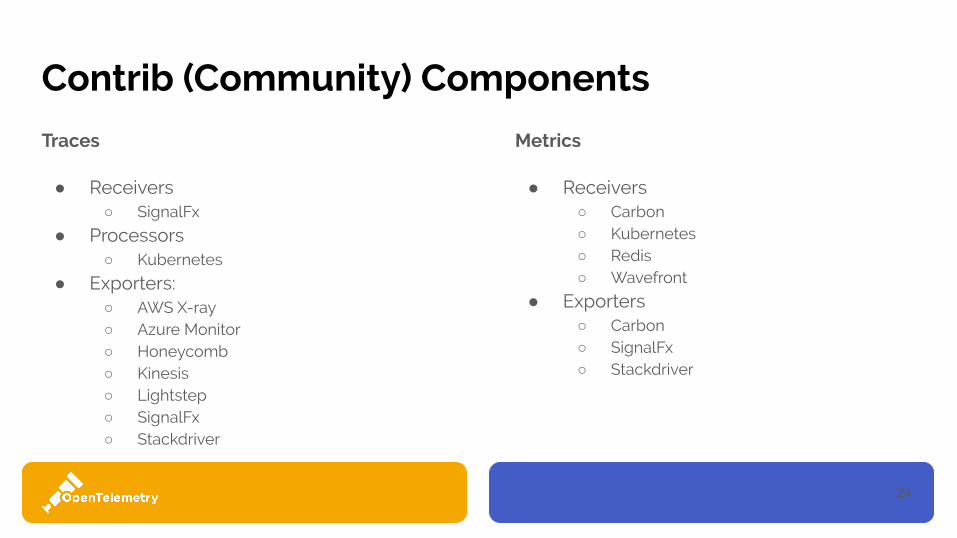
Contrib (Community) Components
Traces
● Receivers○ SignalFx
● Processors○ Kubernetes
● Exporters:○ AWS X-ray○ Azure Monitor○ Honeycomb○ Kinesis○ Lightstep○ SignalFx○ Stackdriver
Metrics
● Receivers○ Carbon○ Kubernetes○ Redis○ Wavefront
● Exporters○ Carbon○ SignalFx○ Stackdriver
Client Libraries: Java

26
Getting Started
Traces
1. Instantiate a tracer2. Create spans3. Enhance spans4. Configure SDK
Metrics
1. Instantiate a meter2. Create metrics3. Enhance metrics4. Configure observer

27
Getting Started: Traces (Manual)
# Instantiate tracerTracer tracer = OpenTelemetry.getTracer("instrumentation-library-name","semver:1.0.0");
# Create spanSpan span = tracer.spanBuilder("my span").startSpan();try (Scope scope = tracer.withSpan(span)) {
// your use case# Enhance spanspan.setAttribute("version", "1.2");
} catch (Throwable t) { Status status = Status.UNKNOWN.withDescription("Change it to your error message"); span.setStatus(status);} finally { span.end(); // closing the scope does not end the span, this has to be done manually}
28
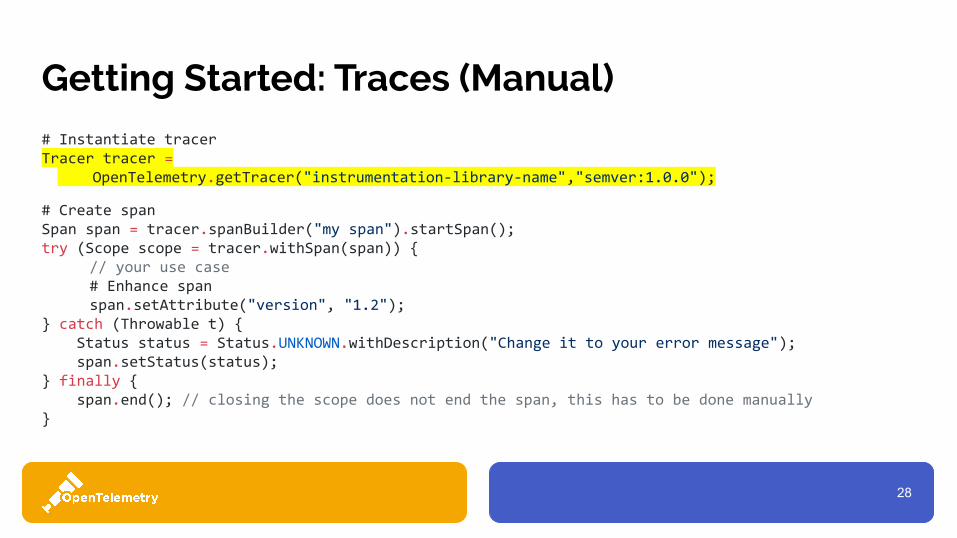
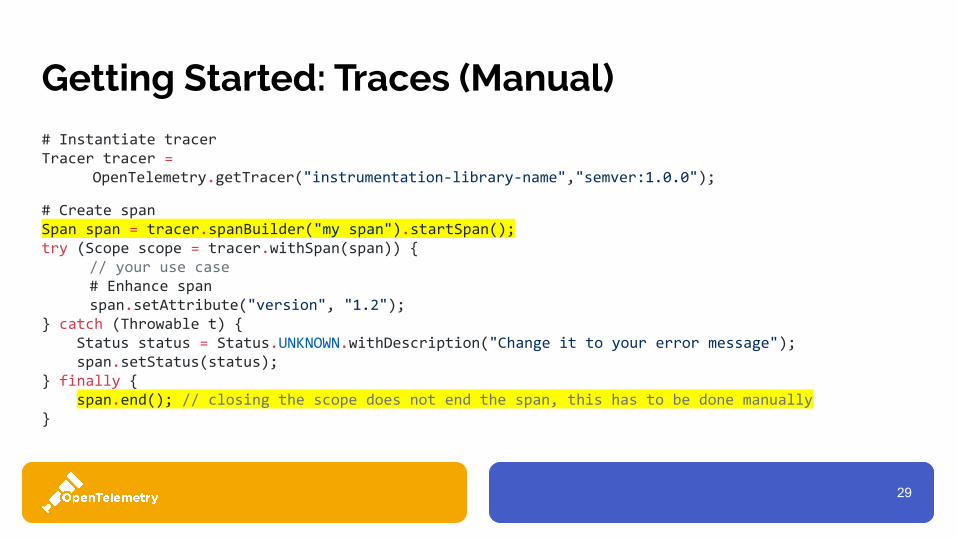
Getting Started: Traces (Manual)
# Instantiate tracerTracer tracer = OpenTelemetry.getTracer("instrumentation-library-name","semver:1.0.0");
# Create spanSpan span = tracer.spanBuilder("my span").startSpan();try (Scope scope = tracer.withSpan(span)) {
// your use case# Enhance spanspan.setAttribute("version", "1.2");
} catch (Throwable t) { Status status = Status.UNKNOWN.withDescription("Change it to your error message"); span.setStatus(status);} finally { span.end(); // closing the scope does not end the span, this has to be done manually}
29
Getting Started: Traces (Manual)
# Instantiate tracerTracer tracer = OpenTelemetry.getTracer("instrumentation-library-name","semver:1.0.0");
# Create spanSpan span = tracer.spanBuilder("my span").startSpan();try (Scope scope = tracer.withSpan(span)) {
// your use case# Enhance spanspan.setAttribute("version", "1.2");
} catch (Throwable t) { Status status = Status.UNKNOWN.withDescription("Change it to your error message"); span.setStatus(status);} finally { span.end(); // closing the scope does not end the span, this has to be done manually}
30
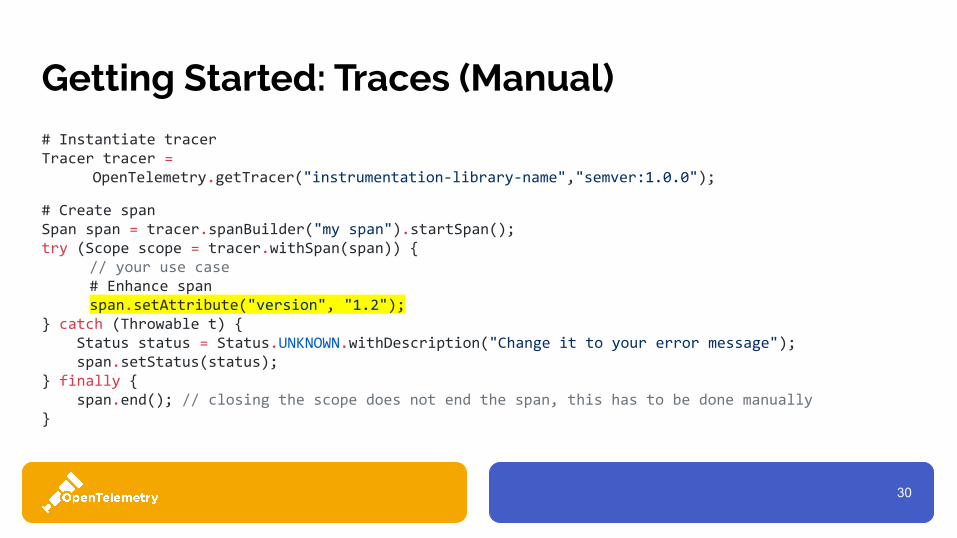
Getting Started: Traces (Manual)
# Instantiate tracerTracer tracer = OpenTelemetry.getTracer("instrumentation-library-name","semver:1.0.0");
# Create spanSpan span = tracer.spanBuilder("my span").startSpan();try (Scope scope = tracer.withSpan(span)) {
// your use case# Enhance spanspan.setAttribute("version", "1.2");
} catch (Throwable t) { Status status = Status.UNKNOWN.withDescription("Change it to your error message"); span.setStatus(status);} finally { span.end(); // closing the scope does not end the span, this has to be done manually}
31
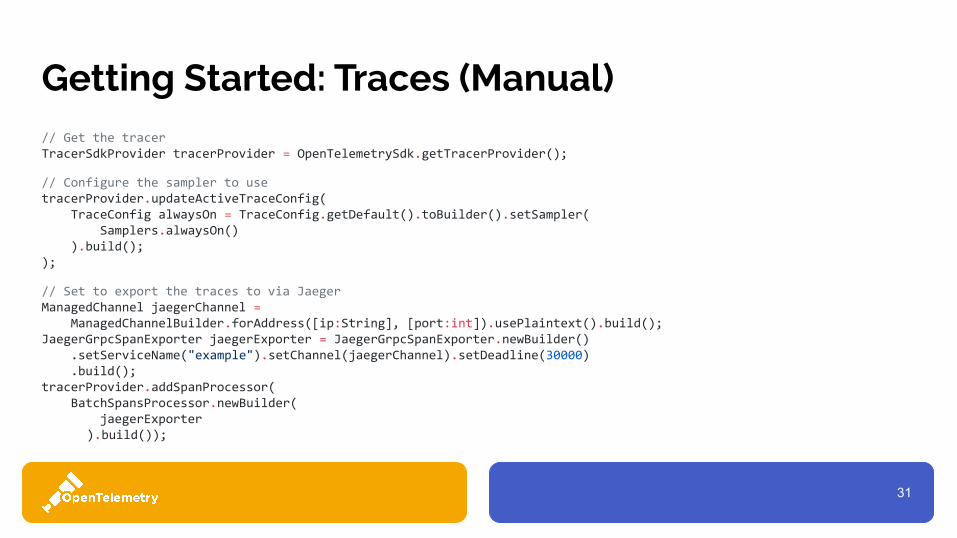
Getting Started: Traces (Manual)// Get the tracerTracerSdkProvider tracerProvider = OpenTelemetrySdk.getTracerProvider();
// Configure the sampler to usetracerProvider.updateActiveTraceConfig( TraceConfig alwaysOn = TraceConfig.getDefault().toBuilder().setSampler( Samplers.alwaysOn() ).build(););
// Set to export the traces to via JaegerManagedChannel jaegerChannel = ManagedChannelBuilder.forAddress([ip:String], [port:int]).usePlaintext().build();JaegerGrpcSpanExporter jaegerExporter = JaegerGrpcSpanExporter.newBuilder() .setServiceName("example").setChannel(jaegerChannel).setDeadline(30000) .build();tracerProvider.addSpanProcessor( BatchSpansProcessor.newBuilder( jaegerExporter
).build());
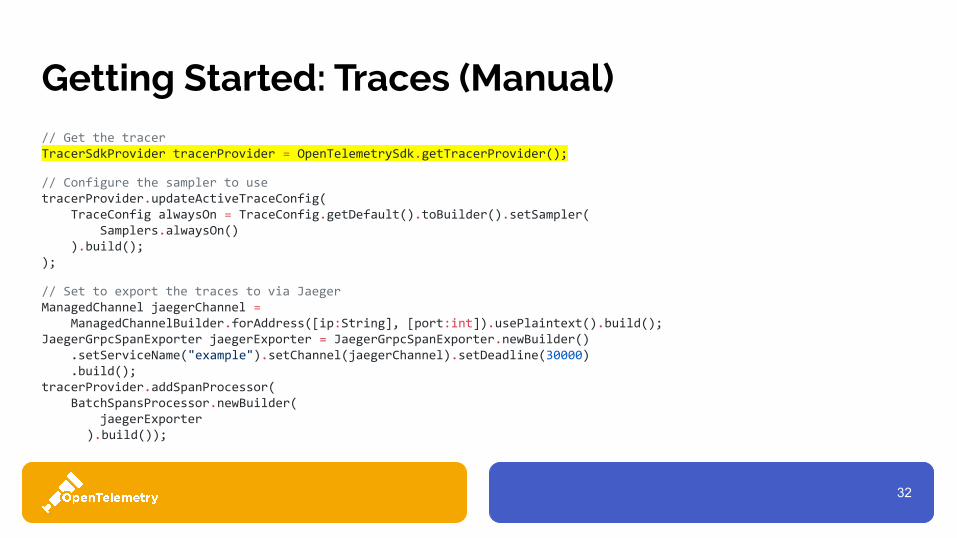
32
Getting Started: Traces (Manual)// Get the tracerTracerSdkProvider tracerProvider = OpenTelemetrySdk.getTracerProvider();
// Configure the sampler to usetracerProvider.updateActiveTraceConfig( TraceConfig alwaysOn = TraceConfig.getDefault().toBuilder().setSampler( Samplers.alwaysOn() ).build(););
// Set to export the traces to via JaegerManagedChannel jaegerChannel = ManagedChannelBuilder.forAddress([ip:String], [port:int]).usePlaintext().build();JaegerGrpcSpanExporter jaegerExporter = JaegerGrpcSpanExporter.newBuilder() .setServiceName("example").setChannel(jaegerChannel).setDeadline(30000) .build();tracerProvider.addSpanProcessor( BatchSpansProcessor.newBuilder( jaegerExporter
).build());

33
Getting Started: Traces (Manual)// Get the tracerTracerSdkProvider tracerProvider = OpenTelemetrySdk.getTracerProvider();
// Configure the sampler to usetracerProvider.updateActiveTraceConfig( TraceConfig alwaysOn = TraceConfig.getDefault().toBuilder().setSampler( Samplers.alwaysOn() ).build(););
// Set to export the traces to via JaegerManagedChannel jaegerChannel = ManagedChannelBuilder.forAddress([ip:String], [port:int]).usePlaintext().build();JaegerGrpcSpanExporter jaegerExporter = JaegerGrpcSpanExporter.newBuilder() .setServiceName("example").setChannel(jaegerChannel).setDeadline(30000) .build();tracerProvider.addSpanProcessor( BatchSpansProcessor.newBuilder( jaegerExporter
).build());

34
Getting Started: Traces (Manual)// Get the tracerTracerSdkProvider tracerProvider = OpenTelemetrySdk.getTracerProvider();
// Configure the sampler to usetracerProvider.updateActiveTraceConfig( TraceConfig alwaysOn = TraceConfig.getDefault().toBuilder().setSampler( Samplers.alwaysOn() ).build(););
// Set to export the traces to via JaegerManagedChannel jaegerChannel = ManagedChannelBuilder.forAddress([ip:String], [port:int]).usePlaintext().build();JaegerGrpcSpanExporter jaegerExporter = JaegerGrpcSpanExporter.newBuilder() .setServiceName("example").setChannel(jaegerChannel).setDeadline(30000) .build();tracerProvider.addSpanProcessor( BatchSpansProcessor.newBuilder( jaegerExporter
).build());

35
Getting Started: Traces (Manual)// Get the tracerTracerSdkProvider tracerProvider = OpenTelemetrySdk.getTracerProvider();
// Configure the sampler to usetracerProvider.updateActiveTraceConfig( TraceConfig alwaysOn = TraceConfig.getDefault().toBuilder().setSampler( Samplers.alwaysOn() ).build(););
// Set to export the traces to via JaegerManagedChannel jaegerChannel = ManagedChannelBuilder.forAddress([ip:String], [port:int]).usePlaintext().build();JaegerGrpcSpanExporter jaegerExporter = JaegerGrpcSpanExporter.newBuilder() .setServiceName("example").setChannel(jaegerChannel).setDeadline(30000) .build();tracerProvider.addSpanProcessor( BatchSpansProcessor.newBuilder( jaegerExporter
).build());

Still with me?
There must be an easier way...
39
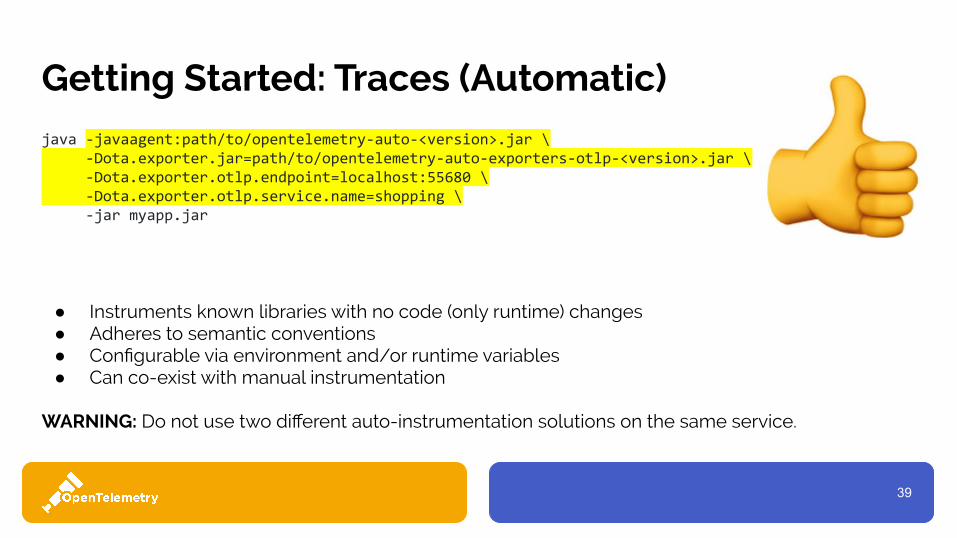
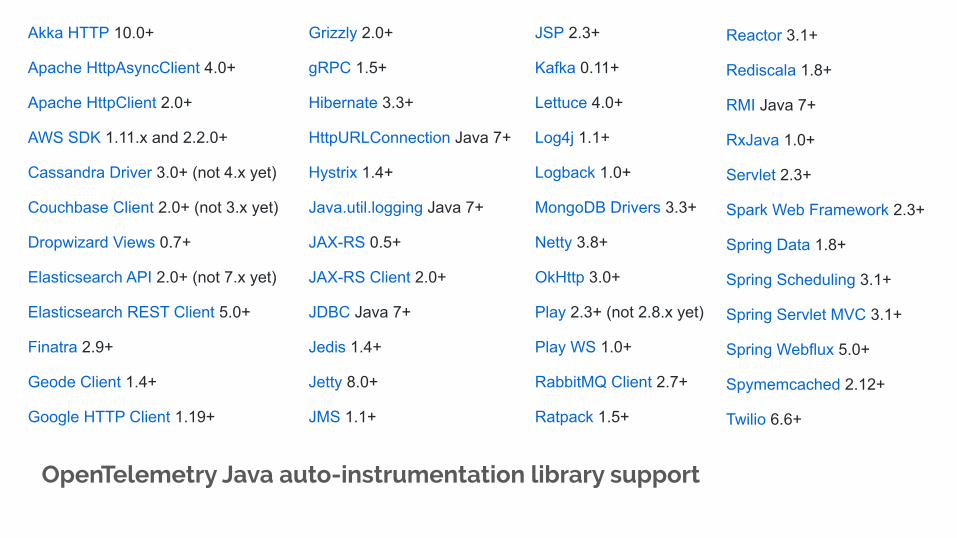
Getting Started: Traces (Automatic)
java -javaagent:path/to/opentelemetry-auto-<version>.jar \ -Dota.exporter.jar=path/to/opentelemetry-auto-exporters-otlp-<version>.jar \ -Dota.exporter.otlp.endpoint=localhost:55680 \ -Dota.exporter.otlp.service.name=shopping \ -jar myapp.jar
● Instruments known libraries with no code (only runtime) changes● Adheres to semantic conventions● Configurable via environment and/or runtime variables● Can co-exist with manual instrumentation
WARNING: Do not use two different auto-instrumentation solutions on the same service.
Akka HTTP 10.0+
Apache HttpAsyncClient 4.0+
Apache HttpClient 2.0+
AWS SDK 1.11.x and 2.2.0+
Cassandra Driver 3.0+ (not 4.x yet)
Couchbase Client 2.0+ (not 3.x yet)
Dropwizard Views 0.7+
Elasticsearch API 2.0+ (not 7.x yet)
Elasticsearch REST Client 5.0+
Finatra 2.9+
Geode Client 1.4+
Google HTTP Client 1.19+
Grizzly 2.0+
gRPC 1.5+
Hibernate 3.3+
HttpURLConnection Java 7+
Hystrix 1.4+
Java.util.logging Java 7+
JAX-RS 0.5+
JAX-RS Client 2.0+
JDBC Java 7+
Jedis 1.4+
Jetty 8.0+
JMS 1.1+
JSP 2.3+
Kafka 0.11+
Lettuce 4.0+
Log4j 1.1+
Logback 1.0+
MongoDB Drivers 3.3+
Netty 3.8+
OkHttp 3.0+
Play 2.3+ (not 2.8.x yet)
Play WS 1.0+
RabbitMQ Client 2.7+
Ratpack 1.5+
Reactor 3.1+
Rediscala 1.8+
RMI Java 7+
RxJava 1.0+
Servlet 2.3+
Spark Web Framework 2.3+
Spring Data 1.8+
Spring Scheduling 3.1+
Spring Servlet MVC 3.1+
Spring Webflux 5.0+
Spymemcached 2.12+
Twilio 6.6+
OpenTelemetry Java auto-instrumentation library support
41
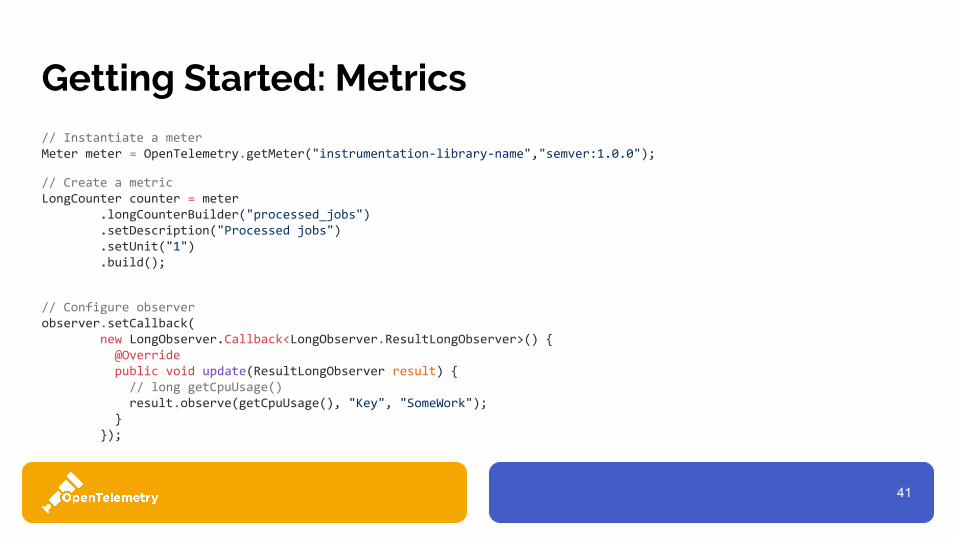
Getting Started: Metrics// Instantiate a meterMeter meter = OpenTelemetry.getMeter("instrumentation-library-name","semver:1.0.0");
// Create a metricLongCounter counter = meter .longCounterBuilder("processed_jobs") .setDescription("Processed jobs") .setUnit("1") .build();
// Configure observerobserver.setCallback( new LongObserver.Callback<LongObserver.ResultLongObserver>() { @Override public void update(ResultLongObserver result) { // long getCpuUsage() result.observe(getCpuUsage(), "Key", "SomeWork"); } });

Demo!
43
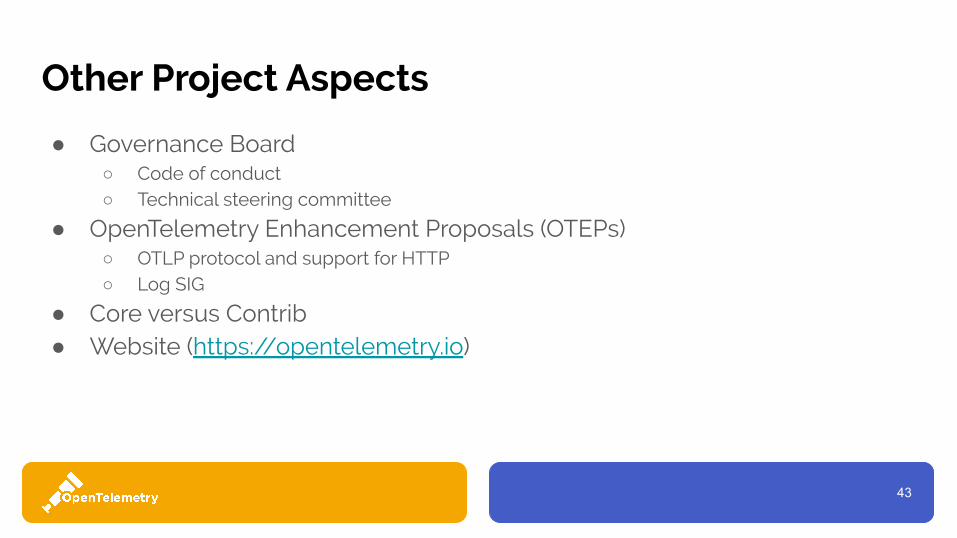
Other Project Aspects
● Governance Board○ Code of conduct○ Technical steering committee
● OpenTelemetry Enhancement Proposals (OTEPs)○ OTLP protocol and support for HTTP○ Log SIG
● Core versus Contrib● Website (https://opentelemetry.io)

44
Roadmap
● Rest of client libraries to beta ASAP● Move to GA later this year for traces and metrics
● Tracing auto instrumentation for all languages● Add initial log support (goal of beta later this year)
● Improve documentation● Increase adoption; get case studies● Make getting started really easy

45
Next Steps
● Join the conversation: https://gitter.im/open-telemetry/community ● Join a SIG:
https://github.com/open-telemetry/community#special-interest-groups ● Submit a PR (consider good-first-issue and help-wanted labels)
○ I will be submitting a PR for this template!
46
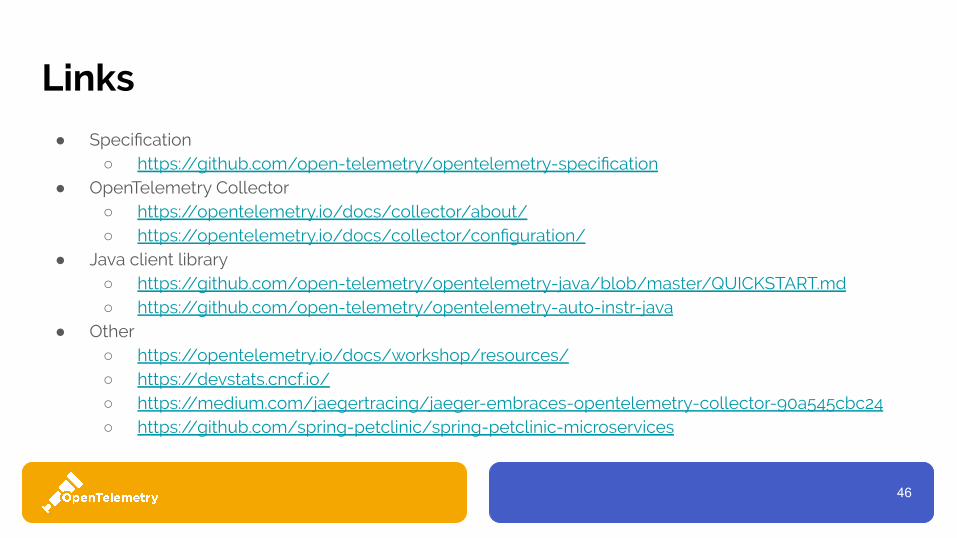
Links
● Specification○ https://github.com/open-telemetry/opentelemetry-specification
● OpenTelemetry Collector○ https://opentelemetry.io/docs/collector/about/ ○ https://opentelemetry.io/docs/collector/configuration/
● Java client library○ https://github.com/open-telemetry/opentelemetry-java/blob/master/QUICKSTART.md ○ https://github.com/open-telemetry/opentelemetry-auto-instr-java
● Other○ https://opentelemetry.io/docs/workshop/resources/ ○ https://devstats.cncf.io/ ○ https://medium.com/jaegertracing/jaeger-embraces-opentelemetry-collector-90a545cbc24○ https://github.com/spring-petclinic/spring-petclinic-microservices

Thank You!


