electrification of the U.S. economy. One explicitly
recognizes the reality of climate change, the threat that
it poses, and the importance of electrification as a means
to substantially decarbonize the economy. Viewing
electrification through this lens allows the Commission
to better advance the public interest, which is at the core
of its statutory mission. 1 Given the overlap between
energy and environmental policy, FERC has a critical
role in facilitating the U.S. response to climate change.
Today, transportation, not the power industry, emits
the most greenhouse gas in the U.S. economy. 2 Many
policymakers recognize that the on-going
decarbonization of the power industry can be leveraged
through electrification to reduce emissions from other
sectors of the economy, including surface
transportation, space heating, and industrial processes. 3
As a result, FERC will have to plan for the grid of the
future − one in which there is a far greater demand for
electricity.
Over the last decade, few issues have been as
polarizing as climate change. For several reasons,
however, there may come a time when it is possible to
achieve modest bipartisan agreement on policies that
address climate change. In 2019, then-Director of
National Intelligence Daniel R. Coats warned of the
national security risks posed by climate change:
Global environmental and ecological degradation, as well as climate change, are likely to fuel competition for resources, economic distress, and social discontent
Editorial Team
Editors-in-Chief John McCaffrey
Nicholas J. Pascale
Articles Editor Donna M. Byrne
Assistant Articles Editors
Lisa S. Gast Jehmal Hudson
Floyd Self Holly R. Smith
Energy Law Journal Liaisons
Robert Fleishman Immediate Past ELJ Editor-in-Chief
Harvey L. Reiter ELJ Editor-in-Chief
GW Law Student Editors
Laura M. Martin Sean P. O'Neill Lesley Morton
Timothy P. Scanlan, Jr.
www.eba-net.org 3
through 2019 and beyond. Climate hazards such as extreme weather, higher temperatures, droughts, floods, wildfires, storms, sea- level rise, soil degradation, and acidifying oceans are intensifying, threatening infrastructure, health, and water and food security. Irreversible damage to ecosystems and habitats will undermine the economic benefits they provide, worsened by air, soil, water, and marine pollution. 4
Similarly, the Department of Defense has long
recognized that “climate change could have significant
geopolitical impacts around the world, contributing to
poverty, environmental degradation, and the further
weakening of fragile governments,” which “may act as
an accelerant of instability or conflict.” 5
The five hottest years in recorded history were
the last five, 6 and record warmth this past winter has
2020 on track to be one of the hottest ever. 7 Pacific Gas
& Electric (PG&E) has been described as the first climate
when FERC certificates their projects and can rely on
eminent domain to acquire easements. In effect, this
confers a significant competitive advantage to gas
infrastructure over electric infrastructure. Gas
generators, in turn, benefit from ample pipeline
capacity. The implicit costs of this advantage are
disproportionately borne by renewable generation,
given the distances between the renewables-rich
regions of the United States and load centers. It may be
far easier for a utility to build a gas plant in its service
territory than to build a distant wind farm that requires
new transmission. Legislation that proposes to confer
transmission siting authority on the Commission would
create a level playing field but would undoubtedly run
www.eba-net.org 11
into a buzz saw of opposition from states and local
governments. Politically, it is unclear whether such
legislation could be enacted.
A third option would realize the promise of
National Renewable Energy Laboratory’s (NREL)
Interconnection Seams Study. This study examined the
benefits and costs of increasing transmission capacity
across the Eastern and Western Interconnections. The
scenarios included a range of options such as increasing
the capacity of existing high voltage, direct current
(HVDC) ties across the seam, adding a number of AC
lines, adding new HVDC lines across the seams plus AC
lines, and building a national HVDC grid along with
AC lines. 55 Significantly, regardless of the scenario
modeled, the benefits far outweighed the costs.
Nevertheless, under the current framework for
transmission development, it is impossible to envision
any of the scenarios being realized, despite their
compelling economics, reliability, and public policy
benefits. 56
One policy response may be for Congress to
treat transmission as a public good, much like the
interstate highway system, and, as former Chairman Jon
Wellinghoff has argued, to develop a national
transmission plan. With congressional authorization,
the Commission is uniquely positioned to help create
and implement such a plan. Legislation should also
provide siting authority and perhaps even funding or
tax credits for the transmission. Such funding could
alleviate cost allocation issues and recognize the value
that high voltage transmission provides in achieving
critical public policies that benefit all Americans.
Innovation and Distributed Energy Resources
Electrification also gives the Commission the
opportunity to support innovation. In November 2016,
the Commission issued a NOPR to remove barriers to
participation for energy storage and distributed energy
resources (DER) in the RTO/ISO markets. 57 Chairman
Chatterjee deserves credit for completing the energy
storage rulemaking in February 2018. 58 This
www.eba-net.org 12
rulemaking sent an important signal to the power
industry, provided regulatory certainty to storage
resources, and allowed compensation for services that
storage is technically capable of providing in the
wholesale markets. In September 2020, the
Commission completed the DER rulemaking and issued
the long-awaited Order No. 2222, which recognizes
the benefit DER will provide to consumers,
competition, and the grid.
Order No. 2222 will likely prove to be a
landmark order. DER is happening, and it is real.
According to the Solar Energy Industry Association
(SEIA), there are now more than two million PV solar
installations. 59 Residential energy storage has had
record growth, 60 and aggregated residential storage
successfully bid into the ISO-NE capacity market. 61
Similarly, demand response providers have been able to
use networks of smart thermostats to aggregate load
reductions across thousands of homes. Microgrids can
support resiliency, especially during extreme weather
events, and can provide valuable capacity to the grid.
DER can also alleviate congestion on a localized basis.
Flexible resources are more important than ever during
the energy transition, and DER can provide that
flexibility. Similarly, by providing additional resources
to the grid, DER promotes competition.
While some stakeholders opposed the DER
rulemaking on jurisdictional grounds, those arguments
are all but certain to fail on appeal. FERC v. Electric
Power Supply Ass’n and National Association of
Regulatory Utility Commissioners v. FERC provide
powerful support for allowing DER to participate in the
wholesale markets. 62 In EPSA, the Supreme Court
upheld Order No. 745, which allowed demand response
to participate in the wholesale markets. The Supreme
Court held that the Commission may regulate practices
directly affecting wholesale rates even if the practices
affect retail rates. 63 Moreover, while Order No. 745
included an opt-out provision for the states, the
Commission was not required as a matter of law to
provide one. In NARUC, the D.C Circuit followed
EPSA and upheld the Commission’s energy storage rule
(Order No. 841), which allows distribution-level
storage resources to participate in the wholesale markets
and which does not contain an opt-out provision for
states. 64 Similarly, in Advanced Energy Economy, the
Commission foreclosed the argument that wholesale
energy efficiency programs were required to have a
state opt-out provision, noting that in EPSA “the
Supreme Court’s findings that the ‘rules governing
wholesale demand response programs meet [the
standard of section 824(b) of the FPA] with room to spare’
and address only transactions occurring on the
wholesale market.” 65
Electric Reliability
In a world of advancing electrification,
reliability will be more essential than ever. The
COVID-19 crisis has been a stark reminder of the
necessity of electricity to modern life. Despite the
terrible human and economic toll taken by COVID-19,
it was a comfort to all Americans to know that, no
matter what else was going wrong, the lights stayed on,
as we retreated to our residences to comply with stay-
at-home orders. Working remotely is impossible
www.eba-net.org 13
without the internet, and the internet cannot function
without electricity. Industry deserves the gratitude of
all Americans for maintaining reliability amidst an
unprecedented challenge. To protect reliability, the
Commission must continue its decade-long focus on
cybersecurity, where, in light of evolving threats, there
is always more work to be done. On June 18, 2020, the
Commission concurrently issued a Notice of Inquiry
that explores potential enhancements to the Critical
Infrastructure Protection Standards 66 and a staff white
paper that examines ways to incentivize cybersecurity
investment. 67 The Commission will also have to
further its work on geomagnetic disturbances,
especially as the science develops, 68 and identify and
assess other threats to the grid, including pandemics and
extreme weather events, the frequency and severity of
which have been linked to climate change. 69
Conclusion
Setting an agenda based on electrification builds
on the Commission’s traditional support for markets,
infrastructure, and innovation. Undoubtedly, there are
many policies the Commission should consider, and this
article is not intended to be comprehensive. 70 Instead,
these are the views of one former Commissioner;
undoubtedly, the current Commission and its successors
will have their own views on how best to advance the
1 See Rich Glick & Matthew Christiansen, FERC and Climate Change, 40 ENERGY L.J. 1, 2 (2019) (“climate change increases the stakes of many Commission actions, making it all the more important that the Commission carry out its existing obligations”). 2 See Sources of Greenhouse Gas Emissions, UNITED STATES ENVIRONMENTAL PROTECTION AGENCY (Apr. 11, 2020) https://www.epa.gov/ghgemissions/sources-greenhouse-gas-emissions. 3 See STAFF OF H. SELECT COMMITTEE ON THE CLIMATE CRISIS, 116TH CONG., SOLVING THE CLIMATE CRISIS 4 (“Decarbonization of the electricity sector is the linchpin of any national strategy to achieve net-zero emissions economy-wide by no later than
public interest. The discussion is likely to be an on-
going one, as it should be. Bill Gates famously said,
“We always overestimate the change that will occur in
the next two years and underestimate the change that
will occur in the next ten. Don’t let yourself be lulled
into inaction.” The pace of electrification is likely to
accelerate, and the Commission has the opportunity to
plan and prepare for the grid of the future. This
planning and preparation is particularly important
given the economic forces, innovation, public policies
driving the change, the pace of change, and the timeline
to complete rulemakings and to build infrastructure.
Consistent with its past, the Commission can once
again help enable the future.
2050. Electrification of key end uses in the transportation, buildings, and industrial sectors will be essential to cut emissions from those sectors.”); INTERGOVERNMENTAL PANEL ON CLIMATE CHANGE, GLOBAL WARMING OF 1.5°C 15 (Valérie Masson-Delmotte et al. eds., 2018). 4 DANIEL R. COATS, STATEMENT FOR THE RECORD: WORLDWIDE THREAT ASSESSMENT OF THE U.S. INTELLIGENCE COMMUNITY 23 (2019) (emphasis in original). 5 DEPARTMENT OF DEFENSE, QUADRENNIAL DEFENSE REVIEW 85 (2010); see also DEPARTMENT OF DEFENSE, REPORT ON EFFECTS OF A CHANGING CLIMATE TO THE DEPARTMENT OF DEFENSE 2 (2019) (climate change is “a
www.eba-net.org 14
national security issue that poses potential impacts to . . . missions, operational plans, and installations”). 6 See 2019 Was Second Hottest Year on Record for Earth, Say NOAA, NASA, NATIONAL OCEANIC AND ATMOSPHERIC ADMINISTRATION (Jan. 15, 2020), https://www.noaa.gov/news/2019-was-2nd-hottest-year-on-record-for-earth-say-noaa-nasa. 7 See Henry Fountain, Warmest January Ever Puts 2020 on Track to Be One of Top 10 Hottest Years, N.Y. TIMES (Feb. 21, 2020), https://www.nytimes.com/2020/02/20/climate/global-temperatures-climate-change.html; see also Tom Di Liberto, Winter and February 2020 End as Second Warmest on Record for the Globe, CLIMATE.GOV (Mar. 16, 2020) https://www.climate.gov/news-features/understanding-climate/winter-and-february-2020-end-second-warmest-record-globe. 8 See Russell Gold, PG&E: The First Climate-Change Bankruptcy, Probably Not the Last, THE WALL STREET JOURNAL (Jan. 18, 2019), https://www.wsj.com/articles/pg-e-wildfires-and-the-first-climate-change-bankruptcy-11547820006. 9 See Naomi Oreskes et al., Scientists Have Been Underestimating the Pace of Climate Change, SCIENTIFIC AMERICAN (Aug. 19, 2019) https://blogs.scientificamerican.com/observations/scientists-have-been-underestimating-the-pace-of-climate-change/. 10 See Cary Funk & Meg Hefferon, Millennial and Gen Z Republicans Stand Out from Their Elders on Climate and Energy Issues, PEW RESEARCH CENTER (June 24, 2020), https://www.pewresearch.org/fact-tank/2019/11/25/younger-republicans-differ-with-older-party-members-on-climate-change-and-energy-issues/. 11 See Amy Harder, Exclusive: What’s in Republicans’ New Climate-Change Push, AXIOS (Jan. 21, 2020), https://www.axios.com/climate-change-house-republicans-trees-plastic-3a6a5695-2f92-4173-8693-800500bef500.html. 12 Commission Guidance Regarding Disclosure Related to Climate Change, 17 C.F.R. § § 211, 231, 241, Release Nos. 33-9106, 34-61469; FR-82, 27 (Feb. 8, 2010). 13 Ann Saphir, Fed Has a Role in Combating Climate Change Risk, Powell Says, REUTERS (Jan. 29, 2020), https://www.reuters.com/article/us-usa-fed-climatechange/fed-has-a-role-in-combating-climate-change-risk-powell-says-idUSKBN1ZT031. 14 Commodity Futures Trading Comm’n, Climate-Related Market Risk Subcomm., Managing Climate Risk in the U.S. Financial System i (2020), https://www.cftc.gov/sites/default/files/2020-09/9-9-20%20Report%20of%20the%20Subcommittee%20on%20Climate-Related%20Market%20Risk%20-%20Managing%20Climate%20Risk%20in%20the%20U.S.%20Financial%20System%20for%20posting.pdf. 15 Electric Transmission Incentives Policy Under Section 219 of the Federal Power Act, 170 F.E.R.C. ¶ 61,204, 85 Fed. Reg. 18,784 (proposed Apr. 2, 2020) (to be codified at 18 C.F.R. pt. 35), P 27 [hereinafter Transmission Incentives NOPR]. 16 Id. at P 29. 17 See U.S. ENERGY INFO. ADMIN., MARCH 2020 MONTHLY ENERGY REVIEW, Table 11.6 (Mar. 2020) (showing 2416 million metric tons of carbon emissions from the power industry in 2005 and 1620 million metric tons in 2020, for a 33 percent reduction). 18 See U.S. ENERGY INFO. ADMIN., U.S. Electricity Generation from Renewables Surpassed Coal in April (June 26, 2019), (23 percent of total electricity generation from renewables and 20 percent from coal) https://www.eia.gov/todayinenergy/detail.php?id=39992. 19 See FED. ENERGY REGULATORY COMM’N, Office of Energy Projects Infrastructure Update for May 2019 5 (July 5, 2019), (installed capacity for coal was 257.54 GW; installed renewable capacity was 257.64 GW). 20 See U.S. ENERGY INFO. ADMIN., Today in Energy: U.S. Renewable Energy Consumption Surpasses Coal for the First Time in Over 130 years (May 28, 2020), https://www.eia.gov/todayinenergy/detail.php?id=43895. 21 See U.S. ENERGY INFO. ADMIN., More U.S. Coal-Fired Power Plants Are Decommissioning as Retirements Continue (July 26, 2019), https://www.eia.gov/todayinenergy/detail.php?id=40212.
22 See LAZARD, LAZARD’S LEVELIZED COST OF ENERGY ANALYSIS – VERSION 13.0 7 (Nov. 2019). 23 Wayne Hicks, Declining Renewable Costs Drive Focus on Energy Storage, NAT’L RENEWABLE ENERGY LAB. (Jan. 2, 2020), https://www.nrel.gov/news/features/2020/declining-renewable-costs-drive-focus-on-energy-storage.html. 24 Wesley Cole & A. Will Frazier, COST PROJECTIONS FOR UTILITY-SCALE BATTERY STORAGE (2019). 25 See Lori Bird & Tyler Clevenger, 2019 Was a Watershed Year for Clean Energy Commitments from U.S. States and Utilities (Dec. 20, 2019), https://www.wri.org/blog/2019/12/2019-was-watershed-year-clean-energy-commitments-us-states-and-utilities. 26 Id. 27 See GOLDMAN SCHOOL FOR PUBLIC POLICY, UNIVERSITY OF CALIFORNIA BERKELEY, 2035 REPORT: PLUMMETING WIND, SOLAR, AND BATTERY COSTS CAN ACCELERATE OUR CLEAN ENERGY FUTURE (June 2020) (finding that 90 percent clean energy in the U.S. by 2035 is technically and economically feasible). 28 Cary Funk & Meg Hefferon, U.S. Public Views on Climate and Energy, PEW RESEARCH CENTER 16 (Nov. 25, 2019), https://www.pewresearch.org/science/2019/11/25/u-s-public-views-on-climate-and-energy/. 29 SOLAR ENERGY INDUS. ASS’N, United States Surpasses 2 Million Solar Installations (May 9, 2019), https://www.seia.org/news/united-states-surpasses-2-million-solar-installations. 30 See RE100, Companies, http://there100.org/companies. 31 See RENEWABLE ENERGY BUYER’S ALL., Corporate Renewable Deals 2014-2018, https://businessrenewables.org/corporate-transactions/. 32 WESTERN ENERGY IMBALANCE MARKET, Benefits, (Apr. 30, 2020), https://www.westerneim.com/Pages/About/QuarterlyBenefits.aspx (estimating $919.69 million in gross benefits). 33 See, e.g., Niraj Chokshi, The United States of Subsidies: The Biggest Corporate Winners in Each State, WASH. POST, March 18, 2015; Good Jobs First, Megadeals: The Largest Economic Development Subsidy Packages Ever Awarded by State and Local Governments in the United States (April 2020), https://www.goodjobsfirst.org/megadeals. 34 Carbon Pricing in Organized Wholesale Electricity Markets, Docket No. AD20-14-000 (Fed. Energy Reg. Comm’n June 17, 2020). 35 Carbon Pricing in Organized Wholesale Electricity Markets, Supplemental Notice of Technical Conference, Docket No. AD20-14-000 (Fed. Energy Reg. Comm’n Aug. 5, 2020). 36 NYISO, IPPTF Carbon Pricing Proposal (Dec. 7, 2018), https://www.nyiso.com/documents/20142/2244202/IPPTF-Carbon-Pricing-Proposal.pdf/60889852-2eaf-6157-796f-0b73333847e8. 37 Susan F. Tierney & Paul J. Hibbard, Clean Energy in New York State: The Role and Economic Impacts of a Carbon Price in NYISO’s Wholesale Electricity Markets 55 (2019). 38 See WSPP Inc., 139 F.E.R.C. ¶ 61,061 at P 24 (2012) (“In a bundled REC transaction . . . where a wholesale energy sale and a REC sale take place as part of the same transaction, RECs are charges in connection with a jurisdictional service that affect the rates for wholesale energy.”). 39 See also Matt Butner et al., Carbon Pricing in Wholesale Electricity Markets 31-40 (March 2020) (arguing that FERC has the authority to approve carbon pricing); Bethany A. Davis Noll and Burcin Unel, Markets, Externalities, and the Federal Power Act: The Federal Energy Regulatory Commission’s Authority to Price Carbon Dioxide Emissions, 27 N.Y.U. ENVTL. L. J. 1 (2019) (same). 40 The Brattle Group, The Coming Electrification of the North American Economy, WIRES, ii (March 2019). 41 Id. at iv. 42 See Transmission Incentives NOPR, supra note 15, at P 9. 43 Richard Glick, Commissioner Richard Glick Dissent in Part Regarding Electric Transmission Incentives Policy Under Section 219 of the Federal Power Act, (Mar. 25, 2020) https://www.ferc.gov/news-events/news/commissioner-richard-glick-dissent-part-regarding-electric-
transmission-incentives (“Given the low capital cost of these projects, handing out extra basis points, even a hundred extra basis points, is unlikely to do much to encourage small-capital investments that enhance the existing grid.”). 44 For a thoughtful and timely overview of the benefits and challenges of building high voltage transmission, see FERC Staff, Report on Barriers and Opportunities for High Voltage Transmission (June 2020), https://cleanenergygrid.org/wp-content/uploads/2020/08/Report-to-Congress-on-High-Voltage-Transmission_17June2020-002.pdf. See also SOLVING THE CLIMATE CRISIS, supra note 3, at 51-64, for an extensive discussion of policy building blocks to develop a National Supergrid. 45 Transmission Planning and Cost Allocation by Transmission Owning and Operating Public Utilities, 136 F.E.R.C. ¶ 61,051 (July 21, 2011) (to be codified at 18 C.F.R. pt. 35) [hereinafter “Order No. 1000”]. 46 Herman K. Trabish, Has FERC’s Landmark Transmission Planning Effort Made Transmission Planning Harder?, Utility Dive (July 17, 2018), https://www.utilitydive.com/news/has-fercs-landmark-transmission-planning-effort-made-transmission-building/527807/. 47 Kelly Andrejasich, Pointing to ‘Perverse Incentive’ Under Order 1000, FERC’s Glick Calls for Changes, S&P Global (Oct. 11, 2019), https://www.spglobal.com/platts/en/market-insights/latest-news/electric-power/101119-pointing-to-perverse-incentive-under-order-1000-fercs-glick-calls-for-changes. 48 Glick, supra note 43, at 15-23. 49 See Illinois Commerce Commission v. FERC, 576 F.3d 470 (7th Cir. 2009); Illinois Commerce Commission v. FERC, 756 F.3d 556 (7th Cir. 2014). 50 See DEP’T OF ENERGY, DOE and FERC Joint Public Statement on Back Stop Siting, Oct. 11, 2011, https://www.energy.gov/articles/doe-and-ferc-joint-public-statement-back-stop-siting. 51 Piedmont Environmental Council v. FERC, 558 F.3d 304 (4th Cir. 2009). 52 Id. at 320. 53 Id. at 321, 325-26 (Traxler, J., dissenting). 54 Id. at 323 (Traxler, J., dissenting). 55 Dave Roberts, We’ve Been Talking About a National Grid for Years. It Might Be Time to Do It, Vox, (Aug. 3, 2018), https://www.vox.com/energy-and-environment/2018/8/3/17638246/national-energy-grid-renewables-transmission. 56 On June 17, 2020, the American Council on Renewable Energy (ACORE) and Americans for a Clean Energy Grid launched a Macro Grid Initiative that relies on the NREL study and that proposes as a priority the development of a new FERC transmission planning rule. See ACORE, Macro Grid Initiative, https://acore.org/macro-grid-initiative/.
57 Electric Storage Participation in Markets Operated by Regional Transmission Organizations and Independent System Operators, 157 F.E.R.C. ¶ 61,121 (2016). The author was the Chairman when the NOPR was issued. 58 Electric Storage Participation in Markets Operated by Regional Transmission Organizations and Independent System Operators, 162 F.E.R.C. ¶ 61,127 (2018) [hereinafter Order No. 841]. 59 Solar Energy Indus. Ass’n, United States Surpasses 2 Million Solar Installations (May 9, 2019), https://www.seia.org/news/united-states-surpasses-2-million-solar-installations. 60 Emma Penrod, U.S. Residential Energy Storage Posts Record Quarter, but COVID-19 Threat Looms: Report, Utility Dive (June 3, 2020), https://www.utilitydive.com/news/us-residential-energy-storage-posts-record-quarter-but-covid-19-threat-loo/579092/. 61 Julia Gheorghiu, Residential Solar+Storage Breaks New Ground as Sunrun Wins ISO-NE Capacity Contract, Utility Dive (Feb. 18, 2019), https://www.utilitydive.com/news/residential-solarstorage-breaks-new-ground-as-sunrun-wins-iso-ne-capacity/547966/. 62 See FERC v. Electric Power Supply Ass’n., 136 S. Ct. 760 (2016); National Ass’n of Regulatory Comm’rs v. FERC, No. 19-1142 (D.C. Circuit July 10, 2020). 63 EPSA, 136 S. Ct. at 776 (“When FERC regulates what takes place on the wholesale market, as part of carrying out its charge to improve how that market runs, then no matter the effect on retail rate, § 824(b) [of the FPA] imposes no bar.”). 64 See NARUC, No. 19-1142. 65 Advanced Energy Economy, 163 F.E.R.C. ¶ 61,030 at P 40 (2018). 66 Potential Enhancements to the Critical Infrastructure Protection Reliability Standards, 171 F.E.R.C. ¶ 61,215 (2020). 67 FERC, Cybersecurity Incentives Policy White Paper (June 18, 2020). 68 See G. M. Lucas, J. J. Love, A. Kelbert, P.A. Bedrosian & E. J. Rigler, A 100-Year Geoelectric Hazard Analysis for the U.S. High-Voltage Power Grid,18 Space Weather (Jan. 2020) (identifying four regions of the U.S. with“particularly notable” geoelectric hazard, including the East Coast, Pacific Northwest, Upper Midwest, and the Denver Metropolitan area). 69 Adam B. Smith, 2018’s Billion Dollar Disasters in Context, NAT’L OCEANIC AND ATMOSPHERIC ADMIN. (Feb. 7, 2019) (“The number and cost of disasters are increasing over time due to a combination of increased exposure, vulnerability, and the fact that climate change is increasing the frequency of some types of extremes that lead to billion-dollar disasters.”). 70 See, e.g., Sonia Aggarwal & Mike O’Boyle, How FERC and RTO/ISO Operators Can Ensure Plummeting Solar, Wind, and Battery Costs Accelerate Our Clean Energy Future (June 2020) (offering policy recommendations).
www.eba-net.org 16
RESTORING CONSENSUS AND BALANCE TO FERC'S MARKET POLICIES
- BY HARVEY REITER, JONATHAN SCHNEIDER AND ABRAHAM SILVERMAN
In the absence of federal policy addressing
climate change, and in the wake of the federal
government's decision to roll back an administrative
solution, 1 states around the country have taken the
lead in advancing a clean economy, centered around
reducing greenhouse gas emissions from our electric
and natural gas sectors. New Jersey has been among
the nation's leaders in this respect, with core elements
of its policy including an ambitious 100% clean energy
goal by 2050, an 80% reduction in CO2 levels by 2040,
an aggressive Renewable Portfolio Standard (RPS), and
incentives directly targeted at nuclear, solar, energy
efficiency, and offshore wind.
Recent decisions by the Federal Energy
Regulatory Commission (FERC) on the Minimum
Offer Price Rule (MOPR) administered by PJM
Interconnection, L.L.C. (PJM) are a surprisingly blunt
assault on state-based policy initiatives. 2 Initially
state energy policy initiatives. These initiatives include
long-standing and widely-supported state RPSs that
have served as a mainstay of state-based support for
renewable generation for decades.
In the inaugural edition of this publication,
former Chairman Cheryl LaFleur advised energy
regulators to “seek compromise whenever possible
with colleagues holding different views.” 3 She also
wisely commented that “consensus decisions . . . are
often the strongest decisions.” 4 The recriminations
between FERC Commissioners associated with
issuance of the PJM MOPR Orders suggests that these
decisions are on shaky ground, vulnerable if not in
court (where the decisions are now on appeal), then to
the next policy swing with a change in administrations.
The electric industry depends on steady signals to make
long-term investments, and policy swings of this
nature serve the industry poorly.
This state of affairs is not inevitable. In the near
term, whatever one's policy preferences with respect to
measures addressing climate control and carbon
emissions, a sustainable center of gravity is within reach
at FERC if the Commission returns to two core
fundamentals: (1) respect for competitive resource
adequacy markets (as opposed to the chase for an
elusive perfect market); and (2) respect for state
demands for a greener grid.
A reinvigorated emphasis on resource
adequacy 5 calls for the Commission to remind itself
why capacity markets were conceived to begin with:
to ensure that sufficient capital is devoted to generation
needed to serve load. No matter the resource adequacy
market design—a Texas-style energy-only market, a
Midcontinent ISO bilateral market, or a fully
centralized market like PJM – we believe that all
reasonable stakeholders should agree that the
Commission's current unwillingness to respond to
www.eba-net.org 17
clean energy demands in major regions of the nation
undermines support for FERC-administered markets.
This forces states interested in clean energy to consider
an end-run around the wholesale market. Since
participation in these markets is not and cannot be
mandatory, FERC’s current approach may ultimately
be self-defeating, as states choose to vote with their
feet.
Looking ahead, we can envision market-based
solutions that embody cooperative federalism, where
states set enforceable clean energy targets and federal
markets assist – rather than stymie – those efforts. At
some juncture, both FERC and the courts may find that
FERC-approved rates cannot be just and reasonable if
they do not reflect environmental externalities. Can
rates truly be just and reasonable if the result is a
generation mix that makes our coastal cities
uninhabitable?
Efforts in the previous administration to establish
a social cost of carbon provide a conceptual basis for
valuing carbon-emitting and non-carbon-emitting
resource bids in organized markets. Alternatively,
objective megawatt targets for zero carbon resources
may be established, and markets designed to elicit the
most economical response. In both cases, we can see a
path to bipartisan consensus forming around the
premise that market-based solutions offer the most
efficient and cost-effective path to accomplishing
shared environmental objectives.
Regulatory stability in the fundamentals
underlying the investment climate for long-term
energy resources is essential to robust investment. The
payoff of a bipartisan, consensus-driven approach to
energy markets, is an industry that respects state
autonomy while producing electricity more
economically. Load is potentially growing for the first
time in a generation, driven by the electrification of
our building and transportation sectors. The ability of
broad sectors of the economy to rely on a cleaner
electric industry holds the potential to drive billions of
dollars in new infrastructure spending. This spending
comes at a perfect time to bring America back from the
COVID-19 driven recession while also addressing
environmental justice for communities of color.
How Did Things Get This Crazy?
A key benefit of restructuring of the electric
industry, FERC reported in 2007, "has been to shift the
risk of investment from customers to shareholders." 6
FERC stated more than 20 years ago that the key to the
success of restructured markets administered by RTOs
was reliance on locational marginal pricing (“LMP”) of
energy. LMP was designed to "send price signals that
are likely to encourage efficient location of new
generating resources, dispatch of new and existing
generating resources, and expansion of the
"Can rates truly be just and reasonable if the
result is a generation mix that makes our coastal cities uninhabitable?"
www.eba-net.org 18
transmission system." 7 But as one of the authors of this
article recounted a few years ago:
[T]he use of LMP was not unqualified. To protect ratepayers in the restructured wholesale market environments…from market power abuses, the newly-formed ISOs proposed caps on the prices of energy sold in their markets. These price caps, however, themselves soon prompted complaints from generators. With caps on energy prices mandated by ISO market rules, generators successfully argued, they would be undercompensated if they could not be paid for their capacity to make up the revenue shortfall created by these energy price caps. The first capacity markets proposed by the eastern ISOs were a direct response to the so-called "missing money" problem posed by these very caps. 8
The capacity markets themselves had certain
core common elements. To promote competition,
sellers (and later buyers, through demand response)
would bid through clearing mechanisms that co-
optimized reliability and cost, with the ultimate
compensation determined by an administrative
demand curve. Each ISO developed a market construct
that was designed to reach economic equilibrium,
allowing generators a reasonable opportunity, on
average and over time, to recover and earn a return on
investment.
But it was not long after the establishment of
these capacity markets that merchant generators
expressed concern that "net buyers" (market
participants whose interests lay predominantly in
purchases in the market, not sales) might introduce
new generation resources into the market at below cost
in order to depress auction prices artificially. This
would be a profitable strategy, the generators argued,
because the net buyers could make up for sales losses
with the savings they'd enjoy on their purchases of
capacity at suppressed prices. 9
PJM's response, approved by FERC in 2006,
was the adoption of a MOPR that would set floors on
seller offers. The offer floor initially applied only to
new gas-fired generation affiliated or involved in a
commercial relationship with net buyers. This was
because, FERC reasoned, only net buyers had the
motive to suppress prices artificially. 10
Since then, FERC has expanded application of
the MOPR in numerous respects, among other things
eliminating MOPR exemptions for self-supply by load
serving entities, and for state resource procurement
programs. And it broadened the MOPR's application
beyond gas-fired generation to capacity resources of all
technologies, including renewable resources. In its
latest set of decisions broadly expanding the MOPR in
PJM's capacity market, FERC has embraced a nearly
www.eba-net.org 19
unbounded and ambiguously defined range of state
subsidies, triggering mitigation that threatens market
participation.
What Are the States Up To?
In the absence of federal climate leadership,
New Jersey and like-minded states across the country
have been developing clear goals of decarbonizing
their transportation, building, and energy sectors. State
legislatures and public utility commissions are
promoting a broad-based green revolution through
RPSs, clean energy standards, and direct subsidies to
carbon-reducing technologies. Until recently, these
programs have been substantially responsible for the
nation-wide development of wind and solar resources,
although current economics in renewables-rich
portions of the country make investment in clean
energy the smart financial (as well as environmental)
move. Berkeley Labs reported that by the end of 2018,
29 states (and the District of Columbia) had adopted
RPSs and that roughly half of all renewable
development has been associated with state-based
RPSs. 11 The creation in many states of tradable
Renewable Energy Credits (RECs) and the first
mandatory carbon cap and trade program in the
Northeast (The Northeast Regional Greenhouse Gas
Initiative (RGGI)) 12 are aimed at further spurring
renewable development.
For its part, New Jersey has developed a clear
path to meeting its 80% reduction in CO2 levels and
100% clean energy by 2050, as part of a year-long
collaborative process that looked at all sectors of the
economy. 13 In addition to the existing RPS, solar,
www.eba-net.org 20
nuclear subsidies, and offshore wind statutes, New
Jersey's 2019 State Energy Master plan suggests that the
state needs 900 MW of new solar a year, plus aggressive
investment in energy efficiency, storage and other
clean energy resources. 14 One critical finding from
New Jersey’s study is that it expects a near doubling of
electricity usage over the next thirty years, as the state
switches the transportation sector over to electricity
and plans to use electricity to heat, cool and power
homes and businesses. 15 We fully expect that states
around the nation aiming to achieve deep
decarbonization will support similar strategies and will
see similar trends.
How Do We Fix It?
States like New Jersey were drawn into
ISO/RTO participation in the hope that multi-state
markets would advance the health and welfare of each
state better than each acting on its own. In PJM,
significant financial savings and an excellent reliability
track record have largely fulfilled this expectation.
Yet, FERC now puts PJM participants in the
untenable position of having to choose between
market savings and widely supported clean energy
objectives. In the PJM MOPR Orders, FERC's
breathtakingly broad definition of a market subsidy
requires mitigation of any "mandated" or "sponsored"
state-based process. 16 FERC goes so far as expressly
including RPSs, 17 the programs associated with
roughly half of the nation's renewable generation
development since 2000. 18
If the price of continued participation in an
ISO/RTO includes surrender of environmental
objectives shared across the political spectrum and
expressed in state law, 19 we wonder whether
participation in interstate markets will become a
casualty. Indeed, states as diverse as Illinois, Maryland,
Ohio and New Jersey, are asking whether to pull back
from the ISO/RTO capacity construct in favor of state-
based resource adequacy planning. 20
It doesn’t have to be this way. There is no
reason why interstate markets cannot make room for
environmental concerns. Nothing bars FERC from
crafting resource adequacy regimes that
“accommodate” or even “achieve” state policies. 21 The
statutory just and reasonable standard is capacious
enough to support markets aimed at achieving reliable,
low cost outcomes while accommodating state-based
environmental priorities. FERC has itself incorporated
respect for state-based policies into regulatory
constructs in the past. Certainly, FERC’s decision on
ISO-New England's Competitive Auctions with
Sponsored Policy Resources (CASPR) comes to mind,
as a vehicle expressly designed to accommodate state-
based programs to procure identified resources. 22 And
in Order 1000, the Commission expressly required
regional planning entities to build state policy
preferences into the planning processes it announced it
would approve. 23 Thus, FERC's unwillingness in the
“There is no reason why interstate markets cannot
make room for environmental concerns.”
www.eba-net.org 21
name of market efficiency to accommodate state-based
policies in the PJM MOPR Orders is more a policy
choice than one driven by economic or legal
imperative.
Curiously, the PJM MOPR Orders are also at
odds with two fundamental conservative principles: the
belief in market-based solutions and respect for state’s
rights. One would think these principles provide
building blocks for a return to FERC's historically
bipartisan, consensus-driven approach to regulation, a
policy that “accommodates, adapts, and achieves” state
policy goals. 24 A decision reversing the vastly
overbroad definition of subsidies in the PJM MOPR
Orders, if not by FERC than by the courts, would be a
positive step in this direction.
It likewise seems reasonable to permit the
incorporation of carbon constraints into wholesale
markets by allowing states to mandate that a certain
percentage of their capacity be delivered from zero
carbon resources. What’s wrong with a federal
program that uses FERC-administered markets to help
states achieve environmental objectives from which we
will all benefit in the most economical way possible?
Looking further ahead, we can envision
market-based solutions to federally articulated carbon
policy objectives. These objectives may be detailed in
federal legislation specifying sector-specific or
economy-wide carbon reduction objectives, or they
may be established by administrative rule.
We also do not rule out the possibility that
FERC and the courts may at some juncture find that
rates cannot be just and reasonable if they do not reflect
environmental externalities. The Supreme Court's
decision in NAACP v. Federal Power Commission 25 is
sometimes cited as authority for the proposition that it
is beyond FERC's authority to address carbon
reduction as a policy objective. Yet, impact on the
nation's health and safety of the generation mix that
results from FERC’s rate policies seems closely tied to
FERC’s core statutory mission: safe and reliable service
at the lowest reasonable cost. 26 Recent FERC decisions
suggesting that rates cannot be just and reasonable
unless they promote a resilient grid 27 certainly support
the conclusion that FERC must be concerned with
more than the lowest possible cost of electricity. And
if, as scientific consensus clearly suggests, extreme
weather events threatening the nation's electric grid are
the consequence of anthropogenic climate change,
there is a good argument that it is within FERC's
mission to address the generation sector's contribution
to global warming and thus the effect on grid
resilience. 28
Wither Now and Tomorrow
There was certainly a time when the nation
stood to benefit from national bipartisan support for
market-based solutions to a commonly understood
climate threat. We are optimistic that we will someday
“Curiously, the PJM MOPR Orders are also at odds with
two fundamental conservative principles: the
belief in market-based solutions and respect for
state's rights."
www.eba-net.org 22
return to that political environment. In the meantime,
there is no reason we cannot come to bipartisan
agreement that states should be given the flexibility to
address the climate challenge with the resources they
believe are needed, without foregoing the benefit of
1 Repeal of the Clean Power Plan; Emission Guidelines for Greenhouse Gas Emissions from Existing Electric Utility Generating Units; Revisions to Emission Guidelines Implementing Regulations, 84 Fed. Reg. 32520 (July 8, 2019). 2 See Calpine Corp. v. PJM Interconnection, L.L.C., 163 F.E.R.C. ¶ 61,236 (2018), reh'g den, 171 F.E.R.C. ¶ 61,034 (2020); Calpine Corp. v. PJM Interconnection, L.L.C., 169 F.E.R.C. ¶ 61,239 (2019), reh'g den, 171 F.E.R.C. ¶ 61,035 (2020) (together, "the PJM MOPR Orders"). 3 Cheryl A. LaFleur, You Can’t Always Get What You Want: Finding Consensus in Regulatory Decision Making, 1 EBA BRIEF 1, 6-7 (2020). 4 Id. at p. 7. 5 “Resource Adequacy” is FERC-speak for ensuring that there is sufficient generation supply, in the right areas, to meet customer demand and satisfy reliability criteria. As the D.C. Circuit noted, there must be “an adequate supply of generation or demand responsive resources to support safe and reliable operation of the transmission grid." Sacramento Mun. Util. Dist. v. FERC, 616 F.3d 520, 526 (D.C. Cir. 2010).6 Wholesale Competition in Regions with Organized Electric Markets, 119 F.E.R.C. ¶ 61,306 at P 20 (2007) ("According to data from the Energy Information Administration (EIA), the percentage of generating capacity in the United States owned by independent power producers has grown from less than 2 percent in 1990 to more than 35 percent by 2005. A result has been to shift the risk of investment from customers to shareholders."); see also 2006 Report to Congress on Competition in Wholesale and Retail Markets for Electric Energy, p. 6. 7 Pennsylvania-New Jersey-Maryland Interconnection, L.L.C., 81 F.E.R.C. ¶ 61,257, at 62,253 (1997). 8 Delia Patterson and Harvey Reiter, CHASING THE UNCATCHABLE: Why Trying to Fix Mandatory Capacity Markets is Like Trying to Win a Game of Whack-a-Mole, Public Utilities Fortnightly (May-June 2016). https://www.fortnightly.com/fortnightly/2016/06/chasing-uncatchable?authkey=3d2731c2dc2856f13f36b01521a2e4ffaffbef294f4b55f4c8b35ef078595c92 (internal citations omitted). The authors do not mean to suggest that energy price caps are the sole cause or that capacity markets are the sole solution to the "missing money" issue. See, e.g., Michael
participation in federally administered markets. That
modest goal ought to be within reach, with a little
imagination.
Hogan, Follow the Missing Money: Ensuring Reliability at Least Cost to Consumers in the Transition to a Low-Carbon Power System, 30 THE ELECTRICITY J. 55 (2017). Rather, our point is that price caps were the prime driver for the creation of capacity markets at their inception. 9 See, e.g., PJM Interconnection, L.L.C., 137 F.E.R.C. ¶ 61,145 at P 2 (2011). 10 Id. 11 LAWRENCE BERKELEY NATIONAL LABORATORY, U.S. Renewable Portfolio Standards 2018 Annual Status Report, https://emp.lbl.gov/publications/us-renewables-portfolio-standards-1 ("Berkeley Labs Renewable Report"). 12 THE REGIONAL GREENHOUSE GAS INITIATIVE, Program Overview and Design, https://www.rggi.org/program-overview-and-design/elements. 13 2019 New Jersey Energy Master Plan; Pathway to 2050, p. 17, https://nj.gov/emp/docs/pdf/2020_NJBPU_EMP.pdf 14 2019 New Jersey Energy Master Plan, at p. 13 (noting that “…energy system modeling further supports that New Jersey should optimally build 17,000 MW of solar energy … by 2035,” or approximately 900 MW per year.) 15 Id. at p. 53 (noting that aggressive end-use electrification of the transportation and building sectors “has the effect of more than doubling demand for electricity compared to 2020 levels…”) 16 Calpine Corp. et al., 171 F.E.R.C. ¶ 61,035 at P 83 (2020). 17 The Commission exempted existing but not new RPS programs from the definition of a subsidy. Id. at P 2. 18 Berkeley Labs Renewable Report, p. 13. 19 This consensus is shared across party affiliations. See https://www.pewresearch.org/fact-tank/2020/04/21/how-americans-see-climate-change-and-the-environment-in-7-charts/. 20 See IHS Markit, Five PJM States Suggest FERC Order Could Prompt Exit from Regional Market, https://ihsmarkit.com/research-analysis/five-pjm-states-suggest-ferc-order-could-prompt-exit.html (January 31, 2020); Ari Peskoe, Energy Law Initiative, available at http://eelp.law.harvard.edu/wp-content/uploads/ISONexit-Memo.pdf (citing to January 15, 2020) Letter From Katie Dykes to ISO-NE President and CEO Gordon van Welie. See
www.eba-net.org 23
also, Patrick Skahill, “CT Taking ‘Serious Look’ at Exiting Regional Power Market,” The CT Mirror, Jan. 16, 2020, (quoting Commissioner Dykes saying that she is “tak[ing] a serious look at the cost and benefits of participating in the ISO New England markets”). Connecticut DEEP, Agenda of January 22, 2020 Technical Meeting; See, e.g., New Jersey Board of Public Utilities, In the Matter of BPU Investigation of Resource Adequacy Alternatives, Docket No. EO20030203, Mar. 27, 2020 (launching an inquiry into whether the state should order its utilities to procure capacity outside of the PJM capacity construct). For Maryland - https://www.utilitydive.com/news/maryland-taking-a-serious-look-at-exiting-pjm-through-frr-says-psc-chair/576957/ For Illinois: https://energynews.us/2019/01/29/midwest/whats-at-stake-for-illinois-as-ferc-considers-pjm-capacity-market-changes/. 21 In mid-2017, FERC convened a technical conference addressing to what extent ISO/RTO markets should be designed to accommodate state-based policy initiatives or achieve them. See, Notice Inviting Post-Technical Conference Comments, Docket No. AD17-11-000 (May 23, 2017).
22 ISO New England Inc., 162 F.E.R.C. ¶ 61,205 (2018). 23 See South Carolina Pub. Serv. Auth. v. FERC, 762 F.3d 41, 52 (D.C. Cir. 2014). 24 Supra, n.19. 25 425 U.S. 662 (1976). 26 San Diego Gas & Elec. Co. v. Sellers of Energy and Ancillary Services, 93 F.E.R.C. ¶ 61,121 at 61,379 (2000). 27 ISO New England Inc., 164 F.E.R.C. ¶ 61,003 (2018) (finding tariff unjust and unreasonable because it fails to address fuel security); ISO New England Inc. 171 F.E.R.C. ¶ 61,235 (2020) (accepting tariff revisions aimed at addressing fuel security issues). 28 For further discussion of the Commission's authority to advance grid resilience through ratemaking under FPA sections 205 and 206 see Schneider, Trotta, What We Talk About When We Talk About Resilience, 39 Energy Law Journal, 353, 384-387 (2018),//www.eba-net.org/assets/1/6/17-353-400-Schneider_[FINAL].pdf.
www.eba-net.org 24
MARKET-BASED RATES IN THE WESTERN ENERGY IMBALANCE
AND EXTENDED DAY-AHEAD MARKETS
- BY DAVID HUNGER, EDO MACON, GORAN VOJVODIC AND ALEXIA DUPUIS
The Western Energy Imbalance Market (EIM)
has grown from two Balancing Authority Areas (BAAs)
in 2014—the California Independent System Operator
(CAISO) and PacifiCorp—to eleven participating BAAs
in 2020, with nine more planning to join by 2022.
CAISO and the EIM entities are working on developing
an Extended Day Ahead Market (EDAM). EDAM
would cover the day-ahead energy market, which
accounts for the majority of the load in CAISO. This
article will discuss the evolution of market-based rates in
the Western EIM and what that evolution suggests for
considering market-based rate issues in the Western
EDAM.
Market Description
CAISO uses its real-time market to dispatch
imbalance energy to meet the difference between real-
time demand and generation scheduled in CAISO’s day-
ahead market and the EIM entities’ balanced base
schedules. In other words, imbalance energy for CAISO
is based on the difference between day-ahead and real-
time actual generation and demand; whereas, imbalances
for EIM entities are based on the differences between the
balanced base schedules for generation and demand and
actual quantities. CAISO’s real-time market dispatches
this imbalance energy on a fifteen-minute and five-
minute basis through its fifteen-minute unit
commitment and five-minute dispatch, respectively.
Each run of CAISO’s real-time market simultaneously
determines the necessary output of dispatchable
resources to meet forecasted net load over multiple
intervals, not just in the next “financially binding”
interval.
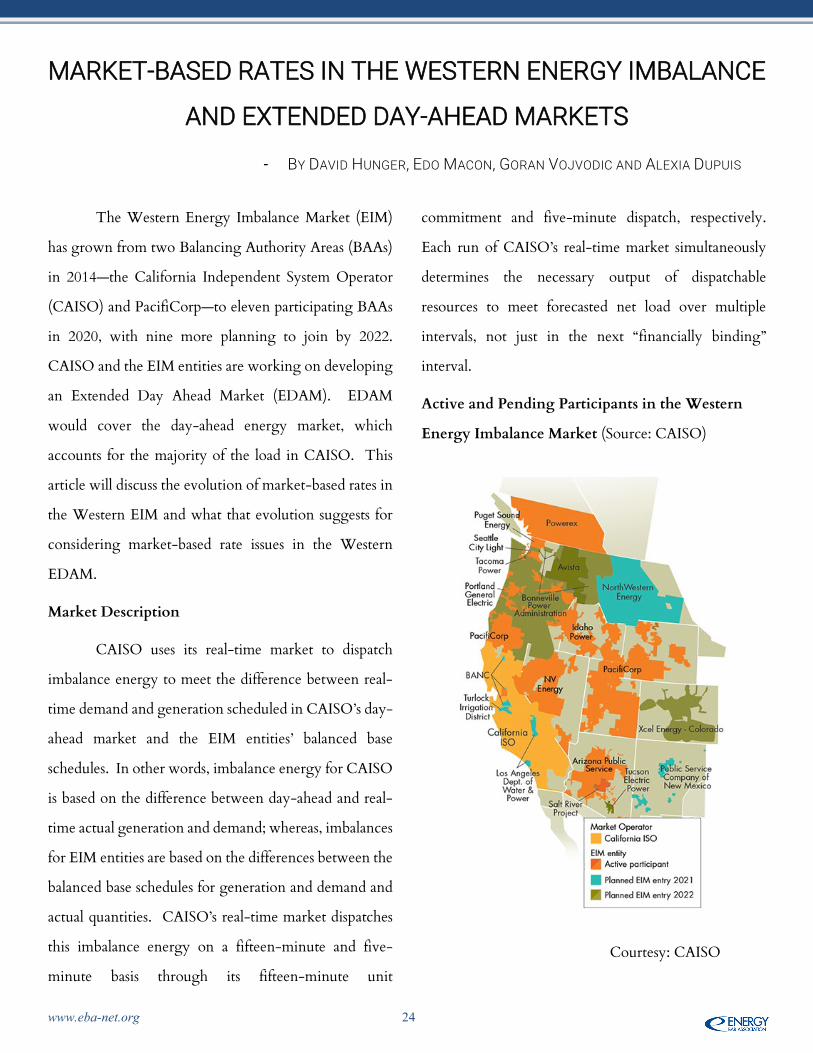
Active and Pending Participants in the Western
Energy Imbalance Market (Source: CAISO)
Courtesy: CAISO
www.eba-net.org 25
EIM: Defining the relevant product and geographic
market
In 2015, the Federal Energy Regulatory
Commission (FERC or Commission) restricted entities
outside of the CAISO footprint to submitting only cost-
based offers in the EIM due to concerns that the sellers
might exercise horizontal market power. 1 Since then,
seven entities have been authorized to sell at market-
based rates (MBR). 2 FERC’s review has focused on an
MBR Seller’s ability and incentive to economically or
physically withhold output in the EIM in order to drive
up the market price. The analysis has focused on the
presence of sufficient transmission and the lack of
persistent transmission constraints between CAISO and
the other participating BAAs. In other words, does any
BAA or group of BAAs become an “island” isolated from
the rest of the EIM footprint? Through a series of cases,
FERC established a framework for determining whether
or not a seller had market power and could be granted
MBR authorization for the EIM. 3 As with any market
power analysis, the first step in FERC’s analytical
framework is defining the relevant product and
geographic market.
Relevant Product
The relevant product in the EIM MBR screens is
not total energy or capacity, as is the case in FERC’s
traditional MBR screens, 4 but only imbalance energy.
The need for imbalance energy stems from two sources:
(1) the additional actual, or realized, demand for
electricity in excess of the scheduled quantity (Imbalance
Demand), and (2) the shortage in actual generation from
renewable resources, which are intermittent and
therefore characterized by an uncertain output,
compared to the expected, or scheduled, quantity. 5
There is also the question of which generating resources
constitute the potential supply of imbalance energy. For
resources located within CAISO, those resources that
participate in the real-time markets are also designated as
EIM Participating Units. For resources located in BAAs
outside of CAISO, EIM Participating Resources include
generators that are registered to participate in the EIM,
have the appropriate technical capability and telemetry
as required by CAISO, and are capable of supplying
imbalance energy. More specifically, the supply available
for CAISO real-time dispatch consists of the residual
capacity of non-wind and non-solar EIM Participating
Resources and CAISO Participating Units. The residual
capacity represents the capacity in excess of day-ahead or
base schedules.
Relevant Geographic Market
The EIM footprint currently covers the CAISO
footprint and eleven separate BAAs in the West, five of
which are directly interconnected with CAISO
(PacifiCorp-West, NV Energy, Arizona Public Service,
Balancing Authority of Northern California, and Salt
River Project) and six of which are second-tier to
CAISO (PacifiCorp-East, Puget Sound Energy,
Portland General Electric, Powerex, Idaho Power
Company, and Seattle City Light). The market
definition turns on whether there is persistent
congestion that would isolate one BAA or a set of BAAs
from CAISO and the rest of the EIM footprint. The EIM
www.eba-net.org 26
pricing data lends itself to an accurate market definition
based on historical congestion. Congestion has both
physical and financial elements. The presence of
congestion is a physical phenomenon, occurring when
there are lower cost supplies that are physically unable to
reach the relevant market due to transmission
limitations. That element of congestion is characterized
by a difference in market clearing prices in any pair of
BAAs and it is registered in the historical market data.
The financial impact of congestion is measured by the
magnitude of the price difference.
In 2017, the Berkshire Hathaway MBR Sellers
(PacifiCorp and NV Energy) provided an analysis
focusing on the number of congested intervals and the
level of price separation in those congested intervals. 6
The analysis showed congestion in 0.7 – 2.4% of the
fifteen-minute intervals and 0.3 – 6.2% of the five-
minute intervals. 7 In terms of price separation, the
analysis showed a positive spread of $5/megawatt (MW)
hour or more in 0.4 – 1.5% of the fifteen-minute
intervals, and 0.1 – 2.4% of the five-minute intervals —
indicating that none of the three BAAs, nor any
combination of those BAAs, should be considered a
submarket separate from the broader EIM footprint. 8
PacifiCorp and NV Energy concluded that the entire
EIM footprint should be considered the relevant
geographic market for the purpose of determining the
market shares and the Commission agreed. 9
A different methodology has been used in cases
where historical EIM pricing data are not available to
identify and quantify congestion. For example, in July
2016, Puget Sound Energy filed an analysis with the
Commission that was based on the amount of EIM-
dedicated transfer capacity connecting the Puget Sound
Energy BAA to the rest of the EIM, relative to the
estimated EIM demand in the BAA. The analysis showed
that there was on average 43.2 MWs of Imbalance
Demand and, in all but 18 of the 35,040 fifteen-minute
intervals in the year-long study period, the demand for
imbalance energy was expected to be less than the 300
MWs of transmission capacity dedicated to the EIM.
Based on this analysis, Puget Sound Energy argued that
its BAA should not be treated as a submarket but, rather,
should be considered to be part of the entire EIM
footprint. The Commission agreed with that
approach. 10
EDAM: Defining the relevant product and
geographic market
The goal of the EDAM is to “improve market
efficiency by integrating renewable resources using day-
ahead unit commitment and scheduling across a larger
area.” 11 To achieve an efficient market, the sellers in the
www.eba-net.org 27
EDAM will need to participate with MBR authorization.
To analyze eligibility for MBR authorization in the
EDAM, the same basic questions that are relevant with
respect to the EIM would apply: what is the relevant
product and would persistent congestion isolate a BAA,
or groups of BAAs, from the rest of the market?
Relevant Product
As the name implies, the product in EDAM is
Day-Ahead energy. 12 As with the EIM, the resources
that are available to participate in the EDAM need to be
identified. Unlike the EIM, the EDAM is not currently
operative, so identifying the units that will be included
in the new market is dependent in part on the
requirements that will be agreed upon in the stakeholder
process and ultimately approved in the future tariff.
According to the publicly available information, the
“Qualifying Supply”—consisting of resources both inside
and outside of the CAISO footprint—will need to be
established. 13 This set of resources will constitute the
“denominator” when calculating market shares of the
individual sellers for the purpose of the MBR analysis.
Relevant Geographic Market
In terms of the relevant geographic market,
historical congestion data will not be available for
EDAM as it has been for the EIM. For the traditional
MBR screens, the Commission uses the individual BAA
as the default market and simultaneous import limit (SIL)
studies for the defined BAA. 14 The SIL does not appear
to be the relevant congestion measure for the geographic
market definition in the EDAM because the SIL limits
the amount of imports into a BAA once it has been
determined that a given BAA is the relevant geographic
market. The question will be whether a BAA or a set of
BAAs should be considered a separate market or part of
the broader EDAM footprint. One way to analyze the
likelihood of congestion is to look at available
transmission capacity relative to the demand and supply
of energy for the EDAM for a given BAA or set of BAAs
as in the Puget Sound Energy methodology described
above.
Conclusion
As with the EIM, there is the prospect of
significant efficiency gains from market-based
participation in the EDAM. FERC has established a
framework for analyzing whether sellers could have
market power in the EIM, and that framework can be
useful in analyzing the EDAM in order to grant MBR
authority.
“As with the [Energy Imbalance Market], there is the prospect of significant efficiency gains from market-based participation in the
[Extended Day Ahead Market]."
www.eba-net.org 28
1 Nevada Power Company et al., 153 F.E.R.C. ¶ 61,206 at P 51 (2015). 2 Those entities are PacifiCorp, NV Energy, Portland General, Arizona Public Service, Idaho Power, Puget Sound Energy, and Powerex. See, e.g., Robert Mullin, PacifiCorp, NV Energy Gain EIM Market-Based Rate Authority, RTO Insider (Nov. 13, 2017), https://rtoinsider.com/pacificorp-nv-energy-market-based-rate-authority-79122/; FERC Accepts Puget Sound Energy’s EIM Filing and Authorizes Market-Based Rate Transaction Ability, Transmissives (Oct. 10, 2016), https://transmissives.com/2016/10/10/ferc-accepts-puget-sound-energys-eim-filing-and-authorizes-market-based-rate-transaction-ability/ . 3 See, e.g., Nevada Power Company, et al., 161 F.E.R.C. ¶ 61,117 (2017); Arizona Public Service Company, 164 F.E.R.C. ¶ 61,169 (2018); Puget Sound Energy, Inc., 156 F.E.R.C. ¶ 61,242 (2016). 4 See Market-Based Rates for Wholesale Sales of Elec. Energy, Capacity & Ancillary Servs. by Pub. Utils., Order No. 697, 119 F.E.R.C. ¶ 61,295, clarified, 121 F.E.R.C. ¶ 61,260 (2007), order on reh'g, Order No. 697-A, 123 F.E.R.C. ¶ 61,055, clarified, 124 F.E.R.C. ¶ 61,055, order on reh'g, Order No. 697-B, 125 F.E.R.C. ¶ 61,326 (2008), order on reh'g, Order No. 697-C, 127 F.E.R.C. ¶ 61,284 (2009), order on reh'g, Order No. 697-D, 130 F.E.R.C. ¶ 61,206 (2010), aff'd sub nom. Mont. Consumer Counsel v. FERC, 659 F.3d 910 (9th Cir. 2011), cert denied, 567 U.S. 934, 133 S. Ct. 26, 183 L. Ed. 2d 676 (2012)). 5 The imbalance may occur in either direction for these two sources of imbalance energy (e.g., the actual renewable generation can either be greater or less than the expected renewable generation). However, it is more likely that a market participant will take advantage of conditions of high demand to exercise market power. Because, in this article, we discuss market power, we focus on situations
where either a surplus demand, a shortage in renewable generation, or both occur. 6 Nevada Power Company, et al., 161 F.E.R.C. ¶ 61,117. 7 Id. at P 22. Congestion was identified for each of the three BAAs (PacifiCorp-East, PacifiCorp-West, and Nevada Energy) by the presence of any positive price separation between the BAA and CAISO, as indicated by a positive shadow price on the power balance constraint for the BAA. 8 Id. at P 23. 9 Nevada Power Company, et al., 161 F.E.R.C. ¶ 61,117 at PP 16 – 23. 10 Puget Sound Energy, Inc., 156 F.E.R.C. ¶ 61,242 at PP 11-12. 11 California ISO, Initiative: Extended Day-Ahead Market, CAISO (Oct. 3, 2019) http://www.caiso.com/StakeholderProcesses/Extended-day-ahead-market. 12 CAISO explains that “[t]he day-ahead market is made up of three market processes that run sequentially.” See id. First, the ISO runs a market power mitigation test. Bids that fail the test are revised to predetermined limits. Then the integrated forward market establishes the generation needed to meet forecast demand. And last, the residual unit commitment process designates additional power plants that will be needed for the next day and must be ready to generate electricity. Market prices set are based on bids. 13 CAISO Stakeholder Process Update: Day-Ahead Market Enhancements and Extended Day-Ahead Market Initiatives (Apr. 16, 2020). 14 In RTOs, the RTO is the default relevant geographic market, but the Commission also looks at frequently congested areas within the RTO as a separate relative geographic market. Examples include the PJM-East, 5004/5005 and AP South submarkets in PJM and Zones J and K (NY City and Long Island) in the NYISO.