eBAY INC. ANNOUNCES FOURTH QUARTER AND FULL YEAR 2003 FINANCIAL RESULTS -- Company Reports Record Q4 Net Revenues of $648 Million -- -- Achieves Q4 GAAP Diluted EPS of $0.21 and Pro Forma Diluted EPS of $0.24 -- -- Raises 2004 Net Revenue Guidance to $3 Billion -- San Jose, CA, January 21, 2004 – eBay Inc. (Nasdaq: EBAY; www.ebay.com ), The World’s Online Marketplace, reported financial results for its quarter and full year ended December 31, 2003. eBay reported record consolidated Q4-03 net revenues of $648.4 million, up 57% year over year; record operating income of $203.1 million, up 78% year over year; and record pro forma operating income of $218.5 million, up 65% year over year. Operating income was 31% of net revenues and pro forma operating income was 34% of net revenues. Consolidated net income in Q4-03 was $142.5 million, or $0.21 per diluted share. eBay’s pro forma consolidated net income, excluding certain items, was a record $157.0 million, or $0.24 per diluted share. These results exceeded the company’s guidance of $590 million for net revenues, $0.19 for earnings per diluted share and $0.21 for pro forma earnings per diluted share. For the full year, eBay generated consolidated net revenues of $2.17 billion, a 78% increase over the $1.21 billion reported in 2002. Consolidated net income increased 77% year over year to $441.8 million, or $0.67 per diluted share. On a pro forma basis, eBay reported a 94% increase in consolidated net income year over year to $494.6 million, or $0.75 per diluted share. "eBay's outstanding fourth quarter demonstrates yet again the extraordinary power of our community." said Meg Whitman, President and CEO of eBay. "Across every important metric, eBay's global momentum is rapidly accelerating. The business is delivering tremendous results and our long-term prospects couldn't be brighter." Full Year Key Financial and Operating Metrics Consolidated Net Revenues - Consolidated net revenues totaled a record $2.17 billion, which represented an increase of 78% from the $1.21 billion reported in the full year 2002. Listings - Listings totaled a record 971 million in the full year 2003, 52% higher than the 638 million listings reported in the full year 2002. – 1 –
Transcript
eBAY INC. ANNOUNCES FOURTH QUARTER AND FULL YEAR 2003 FINANCIAL RESULTS
-- Company Reports Record Q4 Net Revenues of $648 Million --
-- Achieves Q4 GAAP Diluted EPS of $0.21 and Pro Forma Diluted EPS of $0.24 -- -- Raises 2004 Net Revenue Guidance to $3 Billion --
San Jose, CA, January 21, 2004 – eBay Inc. (Nasdaq: EBAY; www.ebay.com), The World’s Online Marketplace, reported financial results for its quarter and full year ended December 31, 2003. eBay reported record consolidated Q4-03 net revenues of $648.4 million, up 57% year over year; record operating income of $203.1 million, up 78% year over year; and record pro forma operating income of $218.5 million, up 65% year over year. Operating income was 31% of net revenues and pro forma operating income was 34% of net revenues. Consolidated net income in Q4-03 was $142.5 million, or $0.21 per diluted share. eBay’s pro forma consolidated net income, excluding certain items, was a record $157.0 million, or $0.24 per diluted share. These results exceeded the company’s guidance of $590 million for net revenues, $0.19 for earnings per diluted share and $0.21 for pro forma earnings per diluted share. For the full year, eBay generated consolidated net revenues of $2.17 billion, a 78% increase over the $1.21 billion reported in 2002. Consolidated net income increased 77% year over year to $441.8 million, or $0.67 per diluted share. On a pro forma basis, eBay reported a 94% increase in consolidated net income year over year to $494.6 million, or $0.75 per diluted share. "eBay's outstanding fourth quarter demonstrates yet again the extraordinary power of our community." said Meg Whitman, President and CEO of eBay. "Across every important metric, eBay's global momentum is rapidly accelerating. The business is delivering tremendous results and our long-term prospects couldn't be brighter." Full Year Key Financial and Operating Metrics Consolidated Net Revenues - Consolidated net revenues totaled a record $2.17 billion, which represented an increase of 78% from the $1.21 billion reported in the full year 2002. Listings - Listings totaled a record 971 million in the full year 2003, 52% higher than the 638 million listings reported in the full year 2002.
eBay Announces Q4-03 Earnings (cont.) Gross Merchandise Sales (GMS) - GMS, the total value of items sold, was a record $24 billion, representing a 60% year-over-year increase from the $15 billion reported in the full year 2002. Key Q4 Financial and Operating Metrics Consolidated Net Revenues - Consolidated net revenues totaled a record $648.4 million, which represented an increase of 57% from the $413.9 million reported in Q4-02. Transaction Revenues - Consolidated net transaction revenues totaled a record $632.6 million, which represented an increase of 60% from the $396.5 million reported in Q4-02.
• eBay U.S. Net Transaction Revenues - eBay U.S. net transaction revenues totaled $291.6
million in Q4-03, reflecting 38% year-over-year growth.
• eBay International Net Transaction Revenues - eBay International net transaction revenues totaled $210.5 million in Q4-03, representing 96% year-over-year growth.
• Payments Net Transaction Revenues – Payments net transaction revenues totaled $130.6
million in Q4-03, representing 68% year-over-year growth.
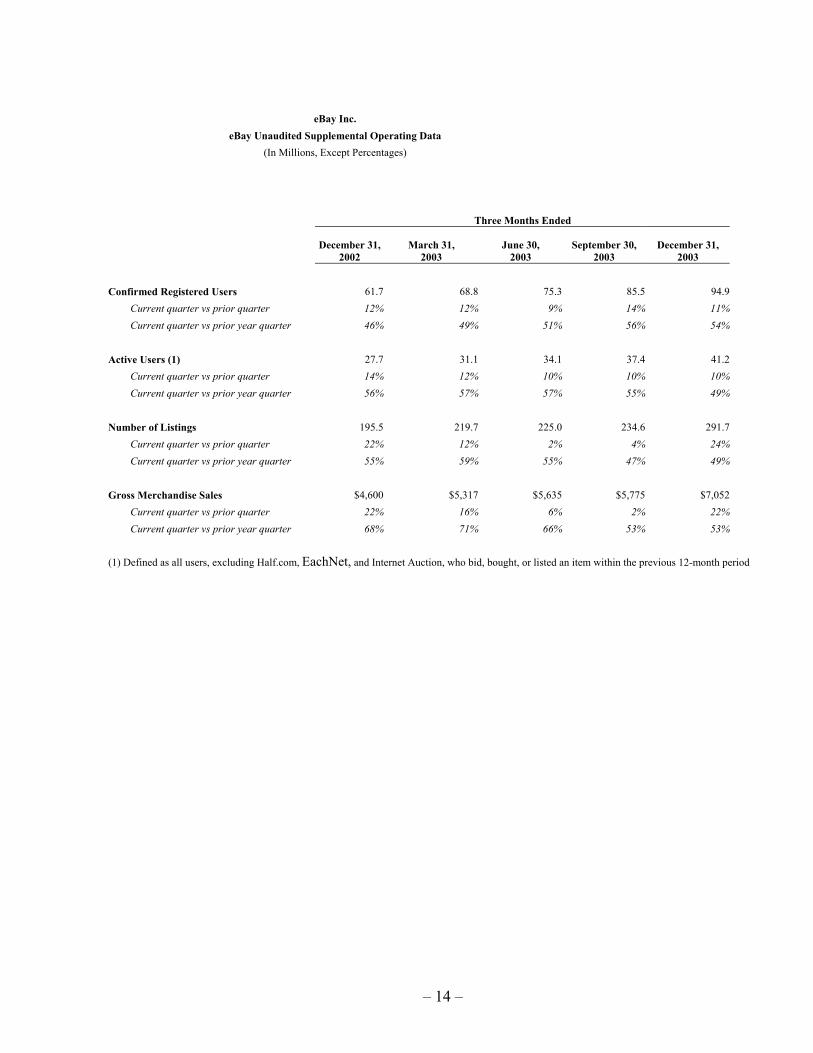
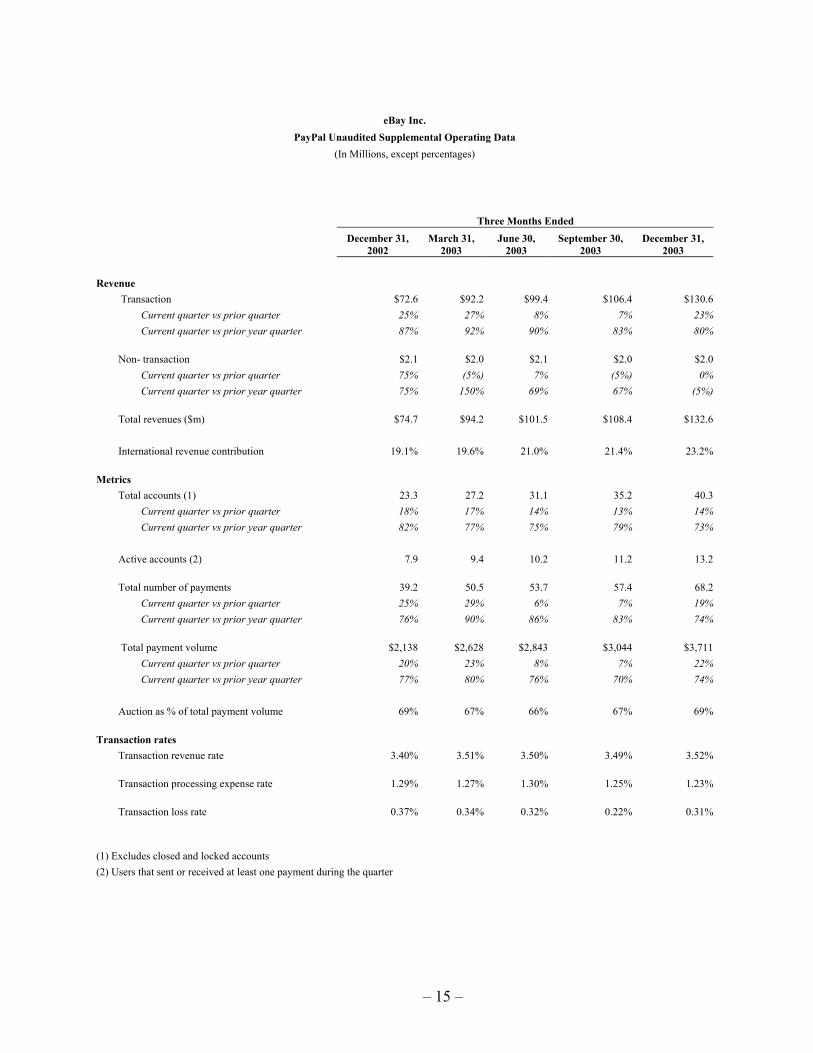
Confirmed Registered Users - Cumulative confirmed registered users at the end of Q4-03 totaled a record 94.9 million. This was a record sequential organic increase of 9.4 million users and a 54% increase over the 61.7 million users reported at the end of Q4-02. Active Users - Active users, the number of users on the eBay platform who bid, bought or listed over the trailing 12 months, increased to 41.2 million, a 49% increase over the 27.7 million active users reported in the same period a year ago. Listings - Listings totaled a record 292 million in Q4-03, 49% higher than the 195 million listings reported in Q4-02. GMS - GMS, the total value of items sold, was a record $7.1 billion, representing a 53% year-over-year increase from the $4.6 billion reported in Q4-02. Total Payments Accounts – The company’s PayPal business had 40.3 million total accounts at the end of Q4-03, a 73% increase from the 23.3 million reported in Q4-02. Total Payment Volume (TPV) – TPV, the total payment volume in the company’s PayPal business, was $3.7 billion in Q4-03, a 74% increase in the $2.1 billion reported in Q4-02. Gross Profit - Gross profit was a record $532.9 million, or 82% of net revenues, which was up from the 80% level reported in Q4-02.
– 2 –
eBay Announces Q4-03 Earnings (cont.) Operating Income - Operating income was a record $203.1 million, or 31% of net revenues, a 78% increase over the $113.9 million reported in Q4-02. Pro forma operating income increased 65% year over year to a record $218.5 million, or 34% of net revenues, versus the reported 32% in Q4-02. GAAP Net Income - GAAP net income increased 64% year over year to $142.5 million, or $0.21 per diluted share. Pro Forma Net Income - Pro forma net income increased 79% year over year to a record $157.0 million, or $0.24 per diluted share. Operating and Free Cash Flows - Operating cash flows totaled $267.4 million. Free cash flows, representing operating cash flows less capital expenditures, totaled $171.7 million. Key Category Performance - Based on Q4-03 GMS, eBay now has ten categories that deliver $1 billion or more in worldwide annualized GMS: eBay Motors at $7.5 billion; Consumer Electronics at $2.6 billion; Computers at $2.4 billion; Books/Movies/Music at $2.0 billion; Clothing and Accessories at $1.8 billion; Sports at $1.8 billion; Collectibles at $1.5 billion; Toys at $1.5 billion; Home & Garden at $1.3 billion; and Jewelry & Gemstones at $1.3 billion. Fixed Price Trading - eBay’s fixed price trading contributed approximately $2.0 billion or 28% of total GMS during Q4-03, primarily from eBay’s “Buy It Now” feature. eBay Stores – eBay hosts approximately 154,000 stores worldwide. However, the company initiated store fees for the first time for certain of its international websites in early Q1-04, therefore, the number of eBay stores worldwide may decrease in future periods. Consolidated Financial and Operating Summary eBay reported record consolidated net revenues of $648.4 million in Q4-03, representing a 57% year-over-year increase. On a year-over-year basis, consolidated net revenues reflected a foreign exchange benefit in Q4-03 of approximately $26.7 million. Gross profit as a percentage of net revenues was 82%, a 2 percentage point improvement from the 80% level reported in Q4-02, primarily reflecting improved cost leverage and cost savings from its recently launched eBay Picture Services. Sales and marketing expenses totaled $172.8 million, or 27% of net revenues, up from the 26% reported in Q4-02. The year-over-year increase as a percentage of net revenues primarily reflects increases in international marketing efforts combined with expanded television advertising campaigns.
– 3 –
eBay Announces Q4-03 Earnings (cont.) Product development expenses totaled $46.4 million, or approximately 7% of net revenues, down from the 8% of net revenues reported in Q4-02. Total product development expenses in Q4-03 do not include $9.2 million of required cost capitalization for major site and other product development efforts. General and administrative costs totaled $96.0 million, or about 15% of net revenues, consistent with the 15% of net revenues reported in Q4-02. The incremental dollar change in general and administration costs primarily reflects the resolution of various legal matters, headcount and insurance. Income from operations totaled a record $203.1 million during Q4-03, a 78% increase over the $113.9 million reported in Q4-02. On a pro forma basis, income from operations totaled a record $218.5 million, a 65% increase over the $132.4 million reported in Q4-02. Included in both the GAAP and pro forma Q4-03 results were $10.6 million of incremental costs related to the resolution of various legal matters primarily relating to PayPal and $11.4 million of year-over-year effect on operating expenses from changes in foreign exchange rates. Net interest and other income totaled $9.4 million in Q4-03, up from the $5.5 million reported in Q3-03. The increase was primarily the result of Q4-03 foreign currency gains and additional investment income. The GAAP and pro forma effective tax rates for Q4-03 were 32% and 30% respectively, a decrease from the 36% GAAP and pro forma effective tax rate in Q4-02. The lower rate reflects an increased profit contribution from the company’s international operations. eBay’s balance sheet remains strong. At the end of Q4-03, the company had $2.8 billion in aggregate cash and investments and more than $5.8 billion in total assets. The company reported $267.4 million in operating cash flows and $95.7 million of capital expenditures in Q4-03, resulting in free cash flows of $171.7 million. Business Outlook Net Revenues – The company expects that net revenues for 2004 could be as high as $3.0 billion. On a quarterly basis, eBay expects consolidated net revenues could be as high as $700 million in Q1-04, $720 million in Q2-04, $725 million in Q3-04 and $855 million in Q4-04. eBay’s guidance is based on an assumed 2004 quarterly weighted average exchange rate of US$1.20 per Euro. GAAP Diluted EPS – eBay expects that GAAP earnings per diluted share for the full year 2004 could be as high as $0.99. From a quarterly perspective, eBay estimates GAAP earnings per diluted share could be as high as $0.24 in Q1-04, $0.23 in Q2-04, $0.23 in Q3-04 and $0.29 in Q4-04.
– 4 –
eBay Announces Q4-03 Earnings (cont.) Pro Forma Diluted EPS – eBay expects that pro forma earnings per diluted share for the full year 2004 could be as high as $1.04. From a quarterly perspective, eBay estimates pro forma earnings per diluted share could be as high as $0.25 in Q1-04, $0.25 in Q2-04, $0.24 in Q3-04 and $0.30 in Q4-04. Effective Tax Rate – eBay expects its 2004 effective tax rate could be 30% on a GAAP basis and 31% on a pro forma basis. This effective tax rate estimate reflects anticipated increased profit contribution from the company's international operations. Capital Expenditures – eBay expects its capital expenditures to total $250 million for the full year 2004, without taking into account acquisitions. Non-GAAP Measures To supplement the company’s consolidated financial statements presented in accordance with GAAP, eBay uses non-GAAP measures of certain components of financial performance, including gross profit, operating income, net income, earnings per share, cash flows, and effective tax rate, which are adjusted from results based on GAAP to exclude certain expenses, gains and losses. These non-GAAP measures are provided to enhance investors’ overall understanding of the company’s current financial performance and the company’s prospects for the future. Specifically, the company believes the non-GAAP results provide useful information to both management and investors by excluding certain expenses, gains and losses that may not be indicative of its core operating results. In addition, because eBay has historically reported certain non-GAAP results to investors, the company believes the inclusion of non-GAAP measures provides consistency in the company’s financial reporting. These measures should be considered in addition to results prepared in accordance with generally accepted accounting principles, but should not be considered a substitute for, or superior to, GAAP results. Consistent with the company’s historical practice, the non-GAAP measures included in this press release have been reconciled to the nearest GAAP measure. About eBay eBay is The World’s Online Marketplace®. Founded in 1995, eBay created a powerful platform for the sale of goods and services by a passionate community of individuals and businesses. On any given day, there are millions of items across thousands of categories for sale on eBay. eBay enables trade on a local, national and international basis with customized sites in markets around the world. Through an array of services, such as its payment solution provider PayPal, eBay is enabling global e-commerce for an ever-growing online community.
– 5 –
eBay Announces Q4-03 Earnings (cont.) Forward-Looking Statements This press release contains forward-looking statements relating to the future performance of eBay and its consolidated subsidiaries. Those statements involve risks and uncertainties, and the company’s actual results could differ materially from those discussed. Factors that could cause or contribute to such differences include, but are not limited to: the company’s need to manage an increasingly large company with a broad range of businesses; the company’s ability to deal with the increasingly competitive environment for online trading, including competition for its sellers from other trading sites and other means of selling, and competition for its buyers from other merchants, online and offline; the litigation, regulatory, credit card association, and other risks specific to PayPal; the company’s need to manage other regulatory, tax, and litigation risks even as its product offerings expand and its services are offered in more jurisdictions; the company’s ability to upgrade and develop its systems, infrastructure and customer service capabilities to accommodate growth at a reasonable cost; the company’s ability to maintain site stability on all of its sites; the company’s ability to continue to expand its model to new types of merchandise and sellers; the company’s ability to continue to expand outside of the US; fluctuations in foreign exchange rates; and the costs and benefits of announced and prospective acquisitions and other commercial transactions. More information about factors that could affect the company’s operating results is included under the captions “Risk Factors That May Affect Results of Operations and Financial Condition” and “Management's Discussion and Analysis of Financial Condition and Results of Operations” in the company’s most recent annual report on Form 10-K and quarterly reports on Form 10-Q, copies of which may be obtained by visiting the company’s investor relations site at http://investor.ebay.com. Undue reliance should not be placed on the forward-looking statements in this release, which are based on information available to the company on the date hereof. eBay assumes no obligation to update such statements.
###
Investor Relations Contacts: David Joseph 408-376-7057 Tracey Ford 408-376-7205 Media Relations Contact: Hani Durzy 408-376-7458 Investor Information Request: 408-376-7493 Company News: http://www.businesswire.com Investor Relations Website: http://investor.ebay.com
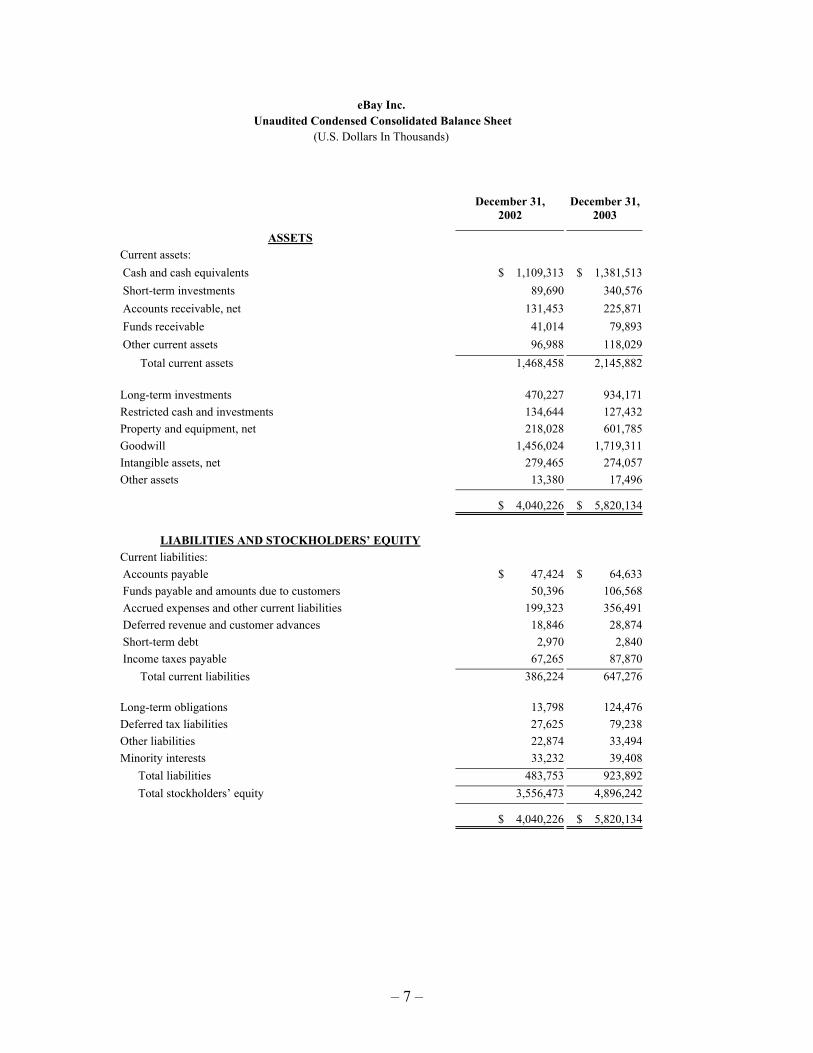
eBay Inc. Unaudited Condensed Consolidated Balance Sheet
(U.S. Dollars In Thousands)
December 31, 2002
December 31, 2003
ASSETS Current assets:
Cash and cash equivalents $ 1,109,313 $ 1,381,513
Short-term investments 89,690 340,576
Accounts receivable, net 131,453 225,871
Funds receivable 41,014 79,893
Other current assets 96,988 118,029
Total current assets 1,468,458 2,145,882 Long-term investments 470,227 934,171 Restricted cash and investments 134,644 127,432 Property and equipment, net 218,028 601,785 Goodwill 1,456,024 1,719,311 Intangible assets, net 279,465 274,057 Other assets 13,380 17,496
$ 4,040,226 $ 5,820,134
LIABILITIES AND STOCKHOLDERS’ EQUITY Current liabilities:
Accounts payable $ 47,424 $ 64,633
Funds payable and amounts due to customers 50,396 106,568
Accrued expenses and other current liabilities 199,323 356,491
Deferred revenue and customer advances 18,846 28,874
Short-term debt 2,970 2,840
Income taxes payable 67,265 87,870
Total current liabilities 386,224 647,276 Long-term obligations 13,798 124,476 Deferred tax liabilities 27,625 79,238 Other liabilities 22,874 33,494 Minority interests 33,232 39,408
Total liabilities 483,753 923,892 Total stockholders’ equity 3,556,473 4,896,242
$ 4,040,226 $ 5,820,134
– 7 –
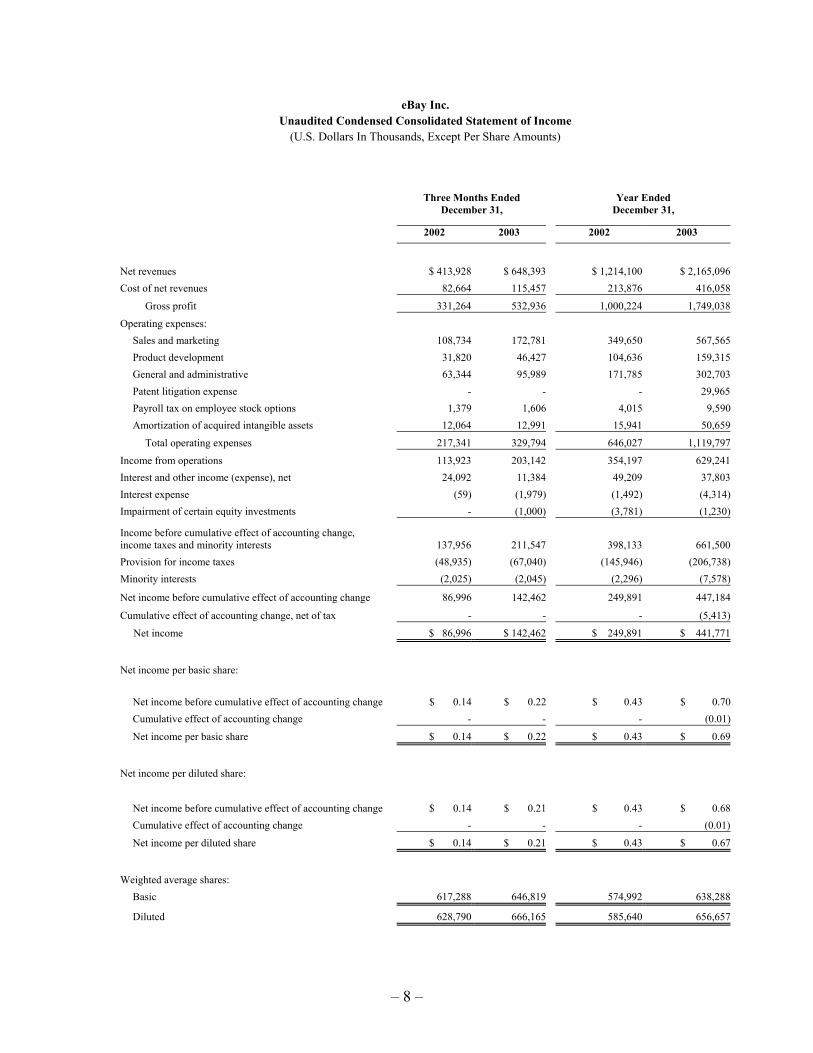
eBay Inc. Unaudited Condensed Consolidated Statement of Income
(U.S. Dollars In Thousands, Except Per Share Amounts) Three Months Ended
December 31, Year Ended
December 31,
2002 2003 2002 2003
Net revenues $ 413,928 $ 648,393 $ 1,214,100 $ 2,165,096 Cost of net revenues 82,664 115,457 213,876 416,058
Gross profit 331,264 532,936 1,000,224 1,749,038
Operating expenses: Sales and marketing 108,734 172,781 349,650 567,565 Product development 31,820 46,427 104,636 159,315 General and administrative 63,344 95,989 171,785 302,703 Patent litigation expense - - - 29,965 Payroll tax on employee stock options 1,379 1,606 4,015 9,590 Amortization of acquired intangible assets 12,064 12,991 15,941 50,659
Total operating expenses 217,341 329,794 646,027 1,119,797
Income from operations 113,923 203,142 354,197 629,241 Interest and other income (expense), net 24,092 11,384 49,209 37,803 Interest expense (59) (1,979) (1,492) (4,314)Impairment of certain equity investments - (1,000) (3,781) (1,230)
Income before cumulative effect of accounting change, income taxes and minority interests 137,956 211,547 398,133 661,500 Provision for income taxes (48,935) (67,040) (145,946) (206,738)Minority interests (2,025) (2,045) (2,296) (7,578)
Net income before cumulative effect of accounting change 86,996 142,462 249,891 447,184
Cumulative effect of accounting change, net of tax - - - (5,413)
Net income $ 86,996 $ 142,462 $ 249,891 $ 441,771
Net income per basic share:
Net income before cumulative effect of accounting change $ 0.14 $ 0.22 $ 0.43 $ 0.70 Cumulative effect of accounting change - - - (0.01)
Net income per basic share $ 0.14 $ 0.22 $ 0.43 $ 0.69
Net income per diluted share:
Net income before cumulative effect of accounting change $ 0.14 $ 0.21 $ 0.43 $ 0.68 Cumulative effect of accounting change - - - (0.01)
Net income per diluted share $ 0.14 $ 0.21 $ 0.43 $ 0.67
Weighted average shares: Basic 617,288 646,819 574,992 638,288
Diluted 628,790 666,165 585,640 656,657
– 8 –
eBay Inc. Unaudited Pro Forma Condensed Consolidated Statement of Income
(U.S. Dollars In Thousands, Except Per Share Amounts) Three Months Ended Three Months Ended December 31, 2002 December 31, 2003
Reported Pro Forma
Entries Pro Forma Reported Pro Forma
Entries Pro Forma Net revenues $ 413,928 $ - $ 413,928 $ 648,393 $ - $ 648,393 Cost of net revenues 82,664 (106) (a) 82,558 115,457 (32) (a) 115,425
Total operating expenses 217,341 (18,360) 198,981 329,794 (15,325) 314,469
Income from operations 113,923 18,466 132,389 203,142 15,357 218,499 Interest and other income (expense), net 24,092 (17,459) (d) 6,633 11,384 - 11,384 Interest expense (59) - (59) (1,979) - (1,979)Impairment of certain equity investments - - - (1,000) 1,000 (e) -
Income before cumulative effect of accounting change, income taxes and minority interests 137,956 1,007 138,963 211,547 16,357 227,904 Provision for income taxes (48,935) (363) (f) (49,298) (67,040) (1,836) (f) (68,876)Minority interests (2,025) - (2,025) (2,045) - (2,045)Net income before cumulative effect of accounting change 86,996 644 87,640 142,462 14,521 156,983 Cumulative effect of accounting change, net of tax - - - - - -
Net income $ 86,996 $ 644 $ 87,640 $ 142,462 $ 14,521 $ 156,983
Net income per share:
Basic $ 0.14 $ 0.14 $ 0.22 $ 0.24
Diluted $ 0.14 $ 0.14 $ 0.21 $ 0.24
Weighted average shares:
Basic 617,288 617,288 646,819 646,819
Diluted 628,790 628,790 666,165 666,165
Operating margin 28% 4% 32% 31% 2% 34% Notes: (a) Non-cash stock based compensation expense (b) Employer payroll taxes on employee non-qualified stock option gains (c) Amortization of acquired intangible assets (d) Gain on sale of certain real estate properties and recovery of fully reserved receivables (e) Impairment of certain equity investments (f) Income taxes associated with certain pro forma entries
– 9 –
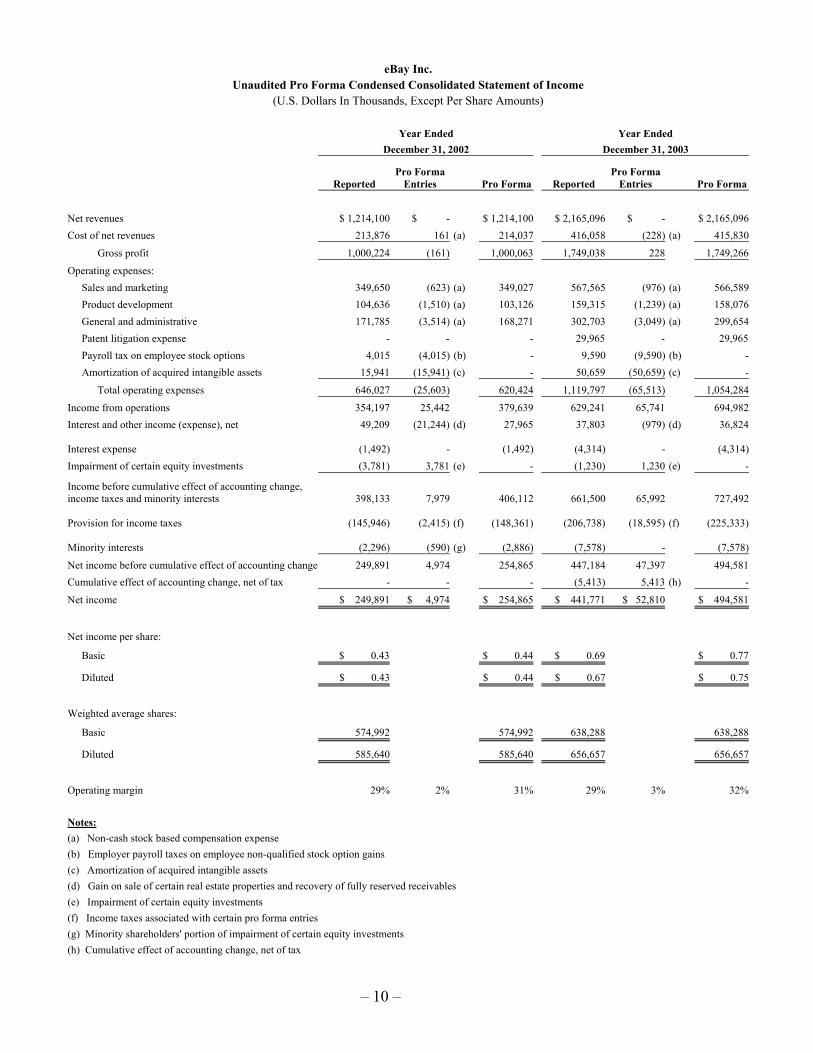
eBay Inc. Unaudited Pro Forma Condensed Consolidated Statement of Income
(U.S. Dollars In Thousands, Except Per Share Amounts) Year Ended Year Ended December 31, 2002 December 31, 2003
Reported Pro Forma
Entries Pro Forma Reported Pro Forma
Entries Pro Forma Net revenues $ 1,214,100 $ - $ 1,214,100 $ 2,165,096 $ - $ 2,165,096 Cost of net revenues 213,876 161 (a) 214,037 416,058 (228) (a) 415,830
Total operating expenses 646,027 (25,603) 620,424 1,119,797 (65,513) 1,054,284
Income from operations 354,197 25,442 379,639 629,241 65,741 694,982 Interest and other income (expense), net 49,209 (21,244) (d) 27,965 37,803 (979) (d) 36,824
Interest expense (1,492) - (1,492) (4,314) - (4,314)Impairment of certain equity investments (3,781) 3,781 (e) - (1,230) 1,230 (e) -
Income before cumulative effect of accounting change, income taxes and minority interests 398,133 7,979 406,112 661,500 65,992 727,492
Provision for income taxes (145,946) (2,415) (f) (148,361) (206,738) (18,595) (f) (225,333)
Net income before cumulative effect of accounting change 249,891 4,974 254,865 447,184 47,397 494,581 Cumulative effect of accounting change, net of tax - - - (5,413) 5,413 (h) -
Net income $ 249,891 $ 4,974 $ 254,865 $ 441,771 $ 52,810 $ 494,581
Net income per share:
Basic $ 0.43 $ 0.44 $ 0.69 $ 0.77
Diluted $ 0.43 $ 0.44 $ 0.67 $ 0.75
Weighted average shares:
Basic 574,992 574,992 638,288 638,288
Diluted 585,640 585,640 656,657 656,657
Operating margin 29% 2% 31% 29% 3% 32% Notes: (a) Non-cash stock based compensation expense (b) Employer payroll taxes on employee non-qualified stock option gains (c) Amortization of acquired intangible assets (d) Gain on sale of certain real estate properties and recovery of fully reserved receivables (e) Impairment of certain equity investments (f) Income taxes associated with certain pro forma entries (g) Minority shareholders' portion of impairment of certain equity investments (h) Cumulative effect of accounting change, net of tax
– 10 –
eBay Inc. Unaudited Condensed Consolidated Statement of Cash Flows
(U.S. Dollars In Thousands)
Three Months Ended December 31,
Twelve Months Ended December 31,
2002 2003 2002 2003 Cash flows from operating activities:
Net income $ 86,996 $ 142,462 $ 249,891 $ 441,771 Adjustments: Cumulative effect of accounting change - - - 5,413
Provision for doubtful accounts and authorized credits 6,538 14,085 25,455 46,049 Provision for transaction losses 7,832 11,510 7,832 36,401 Depreciation and amortization 28,016 45,118 76,576 159,003 Stock-based compensation 5,226 760 5,953 5,492 Tax benefit on the exercise of employee stock options (5,349) 24,991 91,237 130,638 Impairment of certain equity investments - 1,000 3,781 1,230 Minority interests 5,896 3,802 1,324 7,784 Gain on sale of assets (21,378) - (21,378) -Changes in assets and liabilities:
Accounts receivable (562) (82,723) (54,583) (153,373)Funds receivable (11,819) 4,766 (11,819) (38,879)Other current assets 17,652 (3,835) 10,716 (13,133)Other non-current assets 2,867 2,313 (1,195) (4,111)Deferred tax assets, net 4,716 57,172 8,134 69,770 Accounts payable 12,671 10,795 14,631 17,348 Due to customers and funds payable (6,027) (3,502) (6,027) 56,172 Accrued expenses and other liabilities 3,328 35,980 35,481 85,704 Deferred revenue and customer advances 2,127 2,626 2,780 8,864 Income taxes payable 44,132 98 41,114 11,976
Net cash provided by operating activities 182,862 267,418 479,903 874,119
Cash flows from investing activities:
Purchases of property and equipment (44,250) (95,768) (138,670) (365,384)Purchases of investments (145,225) (554,006) (723,307) (2,035,053)Maturities and sales of investments 190,988 165,264 727,455 1,297,262 Proceeds from sale of assets 26,645 - 36,174 -Acquisitions, net of cash acquired (4,801) (109,206) (59,411) (216,367)
Net cash provided by (used in) investing activities 23,357 (593,716) (157,759) (1,319,542)
Cash flows from financing activities:
Proceeds from issuance of common stock, net 148,005 130,628 252,131 700,817 Proceeds from long-term debt 3,768 - 3,768 -Principal payments on long-term debt (39) (10,224) (3,832) (11,951)
Net cash provided by financing activities 151,734 120,404 252,067 688,866
Effect of exchange rate changes on cash and cash equivalents 2,737 3,532 11,133 28,757
Net increase in cash and cash equivalents 360,690 (202,362) 585,344 272,200 Cash and cash equivalents at beginning of period 748,623 1,583,875 523,969 1,109,313
Cash and cash equivalents at end of period $ 1,109,313 $ 1,381,513 $ 1,109,313 $ 1,381,513
Net cash provided by operating activities $ 182,862 $ 267,418 $ 479,903 $ 874,119
Less: Purchases of property and equipment (44,250) (95,768) (138,670) (365,384)
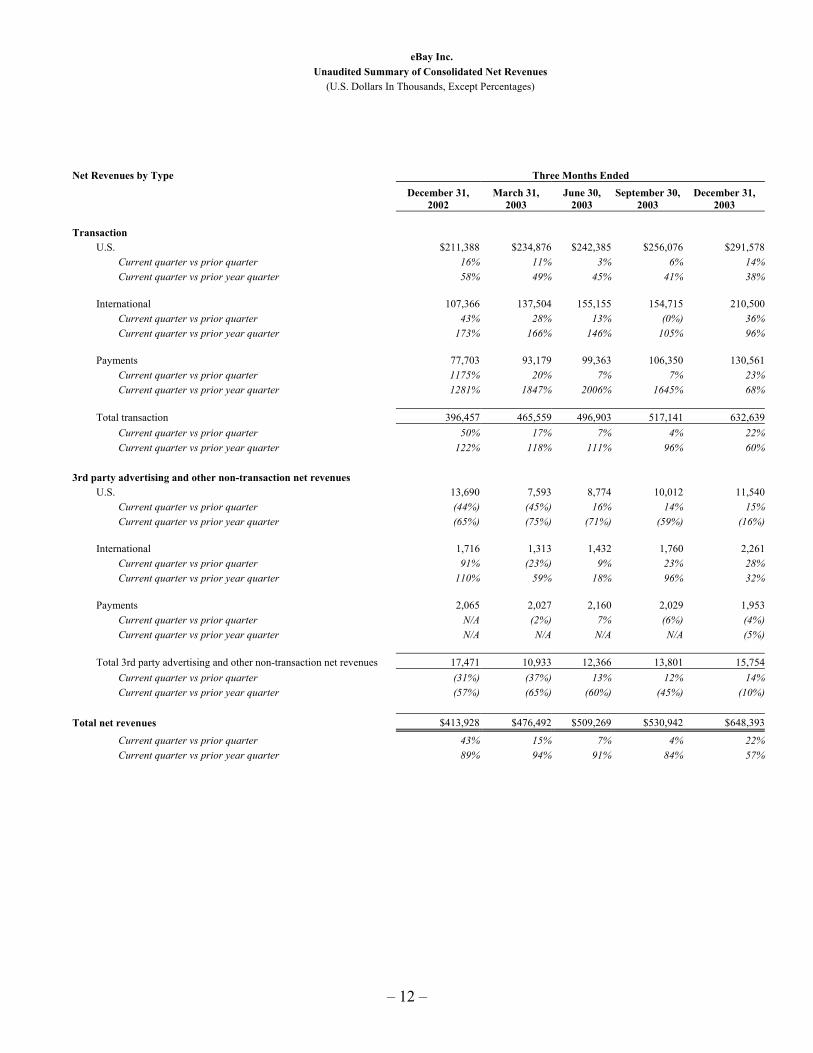
eBay Inc. Unaudited Summary of Consolidated Net Revenues (U.S. Dollars In Thousands, Except Percentages) Net Revenues by Type Three Months Ended
December 31,
2002 March 31,
2003 June 30,
2003 September 30,
2003 December 31,
2003 Transaction U.S. $211,388 $234,876 $242,385 $256,076 $291,578 Current quarter vs prior quarter 16% 11% 3% 6% 14% Current quarter vs prior year quarter 58% 49% 45% 41% 38% International 107,366 137,504 155,155 154,715 210,500 Current quarter vs prior quarter 43% 28% 13% (0%) 36% Current quarter vs prior year quarter 173% 166% 146% 105% 96% Payments 77,703 93,179 99,363 106,350 130,561 Current quarter vs prior quarter 1175% 20% 7% 7% 23% Current quarter vs prior year quarter 1281% 1847% 2006% 1645% 68% Total transaction 396,457 465,559 496,903 517,141 632,639 Current quarter vs prior quarter 50% 17% 7% 4% 22% Current quarter vs prior year quarter 122% 118% 111% 96% 60% 3rd party advertising and other non-transaction net revenues U.S. 13,690 7,593 8,774 10,012 11,540 Current quarter vs prior quarter (44%) (45%) 16% 14% 15% Current quarter vs prior year quarter (65%) (75%) (71%) (59%) (16%) International 1,716 1,313 1,432 1,760 2,261 Current quarter vs prior quarter 91% (23%) 9% 23% 28% Current quarter vs prior year quarter 110% 59% 18% 96% 32% Payments 2,065 2,027 2,160 2,029 1,953 Current quarter vs prior quarter N/A (2%) 7% (6%) (4%) Current quarter vs prior year quarter N/A N/A N/A N/A (5%) Total 3rd party advertising and other non-transaction net revenues 17,471 10,933 12,366 13,801 15,754 Current quarter vs prior quarter (31%) (37%) 13% 12% 14% Current quarter vs prior year quarter (57%) (65%) (60%) (45%) (10%) Total net revenues $413,928 $476,492 $509,269 $530,942 $648,393
Current quarter vs prior quarter 43% 15% 7% 4% 22% Current quarter vs prior year quarter 89% 94% 91% 84% 57%
– 12 –
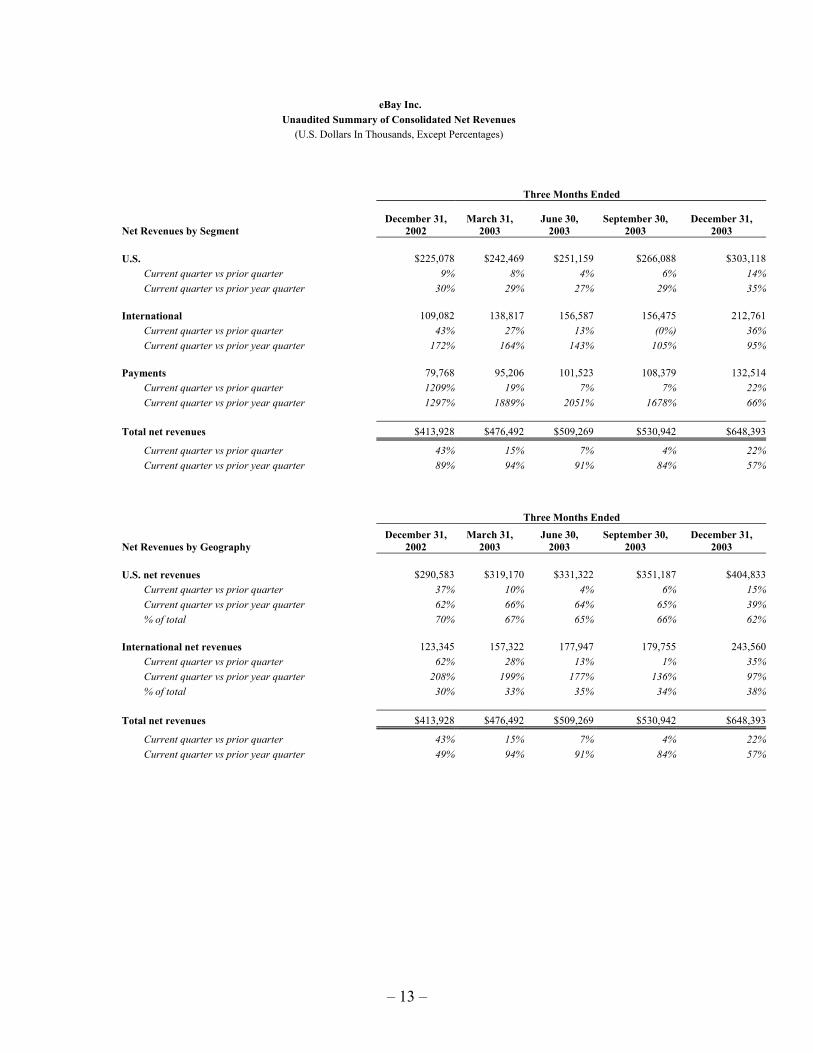
eBay Inc. Unaudited Summary of Consolidated Net Revenues (U.S. Dollars In Thousands, Except Percentages) Three Months Ended
Net Revenues by Segment December 31,
2002 March 31,
2003 June 30,
2003 September 30,
2003 December 31,
2003 U.S. $225,078 $242,469 $251,159 $266,088 $303,118 Current quarter vs prior quarter 9% 8% 4% 6% 14% Current quarter vs prior year quarter 30% 29% 27% 29% 35% International 109,082 138,817 156,587 156,475 212,761 Current quarter vs prior quarter 43% 27% 13% (0%) 36% Current quarter vs prior year quarter 172% 164% 143% 105% 95% Payments 79,768 95,206 101,523 108,379 132,514 Current quarter vs prior quarter 1209% 19% 7% 7% 22% Current quarter vs prior year quarter 1297% 1889% 2051% 1678% 66% Total net revenues $413,928 $476,492 $509,269 $530,942 $648,393
Current quarter vs prior quarter 43% 15% 7% 4% 22% Current quarter vs prior year quarter 89% 94% 91% 84% 57%
Three Months Ended
Net Revenues by Geography December 31,
2002 March 31,
2003 June 30,
2003 September 30,
2003 December 31,
2003 U.S. net revenues $290,583 $319,170 $331,322 $351,187 $404,833 Current quarter vs prior quarter 37% 10% 4% 6% 15% Current quarter vs prior year quarter 62% 66% 64% 65% 39% % of total 70% 67% 65% 66% 62% International net revenues 123,345 157,322 177,947 179,755 243,560 Current quarter vs prior quarter 62% 28% 13% 1% 35% Current quarter vs prior year quarter 208% 199% 177% 136% 97% % of total 30% 33% 35% 34% 38% Total net revenues $413,928 $476,492 $509,269 $530,942 $648,393
Current quarter vs prior quarter 43% 15% 7% 4% 22% Current quarter vs prior year quarter 49% 94% 91% 84% 57%
– 13 –
eBay Inc.
eBay Unaudited Supplemental Operating Data (In Millions, Except Percentages)
(1) Excludes closed and locked accounts (2) Users that sent or received at least one payment during the quarter
– 15 –
eBay Inc. Guidance Summary
(In Millions, Except Per Share Amounts And Percentages)
The guidance figures provided below and elsewhere in this press release are approximate in nature because eBay’s future performance is difficult to predict. Such guidance is based on information available on the date hereof, and eBay assumes no obligation to update it. eBay’s future performance involves risks and uncertainties, and the company’s actual results could differ materially from such guidance. Some of the factors that could affect the company’s operating results are set forth under the caption "Forward-Looking Statements" above in this press release. More information about factors that could affect eBay’s operating results is included under the captions “Risk Factors That May Affect Results of Operations and Financial Condition” and “Management's Discussion and Analysis of Financial Condition and Results of Operations” in its most recent annual report on Form 10-K and quarterly reports on Form 10-Q, copies of which may be obtained by visiting the company’s investor relations site at http://investor.ebay.com.
Three months ending March 31, 2004 GAAP Adjustments Pro Forma (a)
Net revenue $ 700 - $ 700
Diluted EPS $ 0.24 $ 0.01 (b) $ 0.25
Three months ending June 30, 2004 GAAP Adjustments Pro Forma (a)
Net revenue $ 720 - $ 720
Diluted EPS $ 0.23 $ 0.02 (b) $ 0.25
Three months ending September 30, 2004 GAAP Adjustments Pro Forma (a)
Net revenue $ 725 - $ 725
Diluted EPS $ 0.23 $ 0.01 (b) $ 0.24
Three months ending December 31, 2004 GAAP Adjustments Pro Forma (a)
Net revenue $ 855 - $ 855
Diluted EPS $ 0.29 $ 0.01 (b) $ 0.30
Year ending December 31, 2004 GAAP Adjustments Pro Forma (a)
Net revenue $ 3,000 - $ 3,000
Diluted EPS $ 0.99 $ 0.05 (b) $ 1.04
Effective Tax Rate 30% 1% (c) 31% (a) Pro forma guidance reflects estimated quarterly adjustments for amortization of acquired intangible
assets of approximately $13 - $14 million, payroll taxes on employee stock options of approximately $2 million, stock based compensation of approximately $300 - $600 thousand and other adjustments estimated to result in an operating margin adjustment of 2 - 3% for each of the quarters in the year ending December 31, 2004.
– 16 –
(b) Net of tax, the above pro forma items are estimated to result in a $ 0.01 - $ 0.02 per diluted share adjustment for each of the quarters in the year ending December 31, 2004.
(c ) Adjustments to the pro forma effective tax rate reflect the impact on the effective tax rate of the pro