56
Investigating the transmission pathways of porcine epidemic diarrhea virus (PEDV) using outbreak incidence and virus sequence data Eamon O’Dea Department of Biology Georgetown University
| Date post: | 15-Jul-2015 |
| Category: |
Science |
| Upload: | eamon-odea |
| View: | 197 times |
| Download: | 0 times |

Investigating the transmission pathways ofporcine epidemic diarrhea virus (PEDV) usingoutbreak incidence and virus sequence data
Eamon O’Dea
Department of BiologyGeorgetown University

A large foot and mouth disease virus (FMDV) outbreak inthe U.S. could cause a large economic shock
data from Paarlberg et al., 2005

Expected losses are due in large part to expected loss inexports
Center for International Development at Harvard University / Atlas of Economic Complexity / CC-BY-SA 3.0

Key parameters for models are often uncertain
APHIS Overview of Modeling and Assessment Tools:
The data and information needed to properly estimateparameters are often sparse, dated, and not readilyavailable. Researchers typically address these shortcomingswith expert opinion and informed assumptions.

Key parameters for models are often uncertain
McReynolds et al., 2014:
The estimates of the probability of indirect transmissionand achievable movement controls are uncertainparameters, based solely on USDA subject matter expertopinion. Model outputs are quite sensitive to theseparameters and an improved knowledge of the efficacy ofbiosecurity practices and the ability to achieve movementcontrols to limit direct and indirect transmission arenecessary for more focused planning of optimal controlefforts.

PEDV provides an example of a rapidly spreading pathogenRed text gives positive accessions as of Jan. 2014.
AL:0AZ:0 AR:0
CA:1
CO:35CT:0
DE:0
FL:0
GA:0
ID:0
IL:71IN:67
IA:770
KS:143KY:4
LA:0
ME:0
MD:1
MA:0MI:12
MN:217
MS:0
MO:18
MT:0
NE:5
NV:0
NH:0
NJ :0
NM:0
NY:2
NC:301
ND:0
OH:60
OK:272
OR:0
PA:28 RI:0
SC:0
SD:5
TN:6
TX:26
UT:0
VT:0
VA:0
WA:0
WV:0
WI:4WY:1
[10 to 74) [74 to 166) [166 to 728) [728 to 7,550]
Farm count
data from USDA APHIS VS NVSL National Animal Health Laboratory Network

PEDV kills by destroying villi
NIH

Affected farms have lowered production for weeks
data from Ackerman 2013

A production problem occurred at the national level
USDA

Transportation is believed to be important in spread
I Believed to be important for TGEV, and other diseasesI Trucks delivering to harvest plants can pick up virus
Photo © User:Izvora / Wikimedia Commons / CC-BY-SA-4.0Lowe et al., 2014

Several states require imported swine to be fromPEDV-free premises
AASV

Outline
I Do pairs of states with large flows have similar case dynamics?I What variables seem relevant for predicting PEDV burdens?I Do flows improve the fit of an epidemiological model?I What do sequence data tell us about transmission routes?

Do pairs of states with large flows have similarcase dynamics?

AASV has been publishing weekly counts of positive testresults
MN KS
IL OK
IA NC
01020
05
10
0
10
0
10
20
0
50
0
10
20
Jul Oct Jan Jul Oct JanDate
Cas
es

These cases correlate with more accurate data

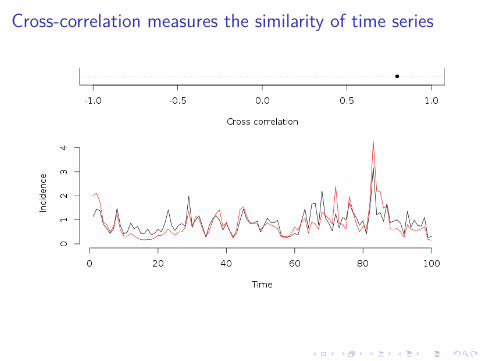
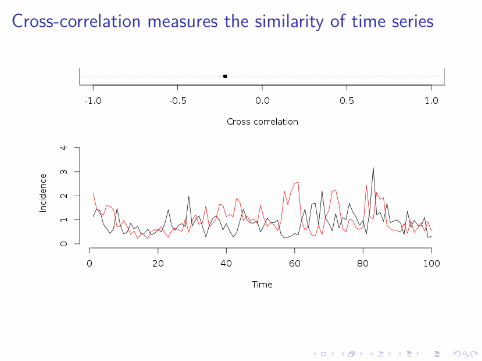
Cross-correlation measures the similarity of time series

Cross-correlation measures the similarity of time series
Cross-correlation measures the similarity of time series

Cross-correlation measures the similarity of time series

Cross-correlation measures the similarity of time series

Cross-correlation measures the similarity of time series

Cross-correlation measures the similarity of time series
Cross-correlation measures the similarity of time series

Cross-correlation measures the similarity of time series

Cross-correlation measures the similarity of time series

Estimated flows are available
data from USDA

We found that cross-correlations increase with flows

It is a significant association according to a Mantel test
log10 flow
0 2 4 6
0.4 *** 0.43 ***
CC0
0.3
0.6
0 0.3 0.6
0.26 *
−GCD−3
−2
−1
−4

Conclusions
I Pairs of states with large flows do have similar case dynamics.I The similarity increases more with flows than with distance.

What variables seem relevant for predictingPEDV burdens?

We used total cases and litter size changes as burdens

It is not easy to identify the best predictors
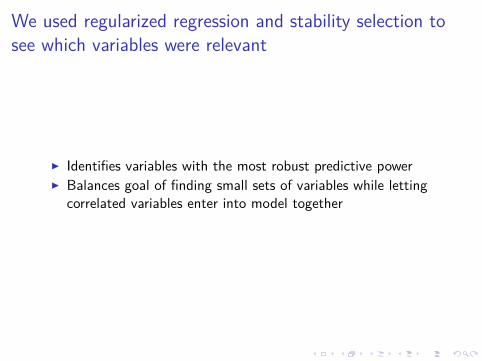
We used regularized regression and stability selection tosee which variables were relevant
I Identifies variables with the most robust predictive powerI Balances goal of finding small sets of variables while letting
correlated variables enter into model together
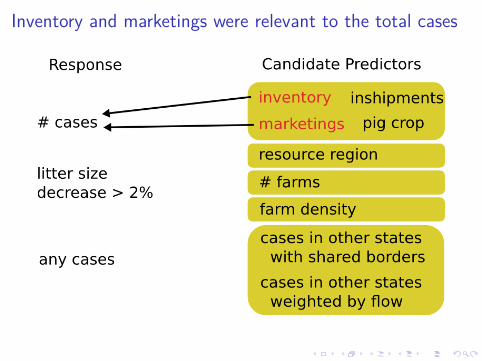
Inventory and marketings were relevant to the total cases

Inventory was relevant to litter size decreases

The number of farms and was relevant to whether anycases were reported

Conclusion
Balance sheet variables and total number of farms had the mostrobust associations with PEDV burdens.

Do flows improve the fit of an epidemiologicalmodel?

We calculated internal flows using interstate flows, balancesheet, and census sales data

Internal flows make up a large proportion of the total

Cases seem to increase with flows
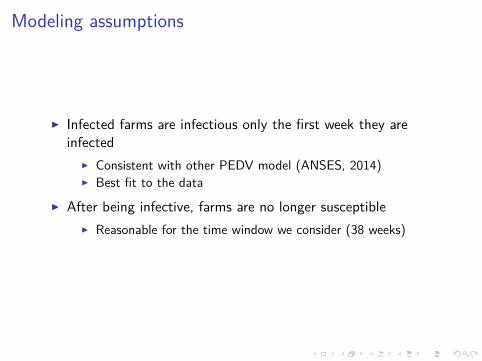
Modeling assumptions
I Infected farms are infectious only the first week they areinfected
I Consistent with other PEDV model (ANSES, 2014)I Best fit to the data
I After being infective, farms are no longer susceptibleI Reasonable for the time window we consider (38 weeks)

Our time-series susceptible-infected-recovered model
E(infectivesi ,t+1) = (transmission rate)i ,t
× [∑
jweighti ,j (infectives)j,t + (other risks)]b0
× (susceptibles)i ,t
E(Ii ,t+1) = βi ,t(∑
jwi ,j Ij,t + η)b0Si ,t
(transmission rate)i ,t = exp(b1 + Zi + b2t)× (N2
i farmdensityi)b3
× flowb4i N−2
i
with Si ,t = Ni −∑t−1
n=0 Ii ,n and η,b,Z unknown.
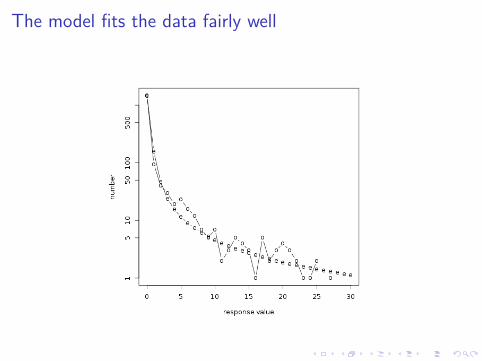
The model fits the data fairly well

Flows improve the fit, undirected flows fit best

Flows have about as large of an effect as density

Conclusions
I Including estimates of flows significantly improves the fit of amodel of PEDV spread among farms.
I Undirected flows fit better than directed flows, which suggestswe are not seeing the effects of the movement of live animals.

What do the sequence data tell us abouttransmission routes?
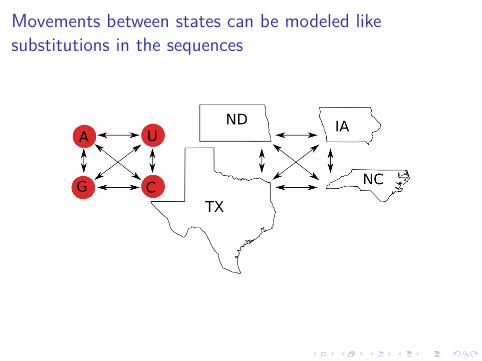
Movements between states can be modeled likesubstitutions in the sequences

In a preliminary analysis, we found that some pairs ofstates have significantly higher transition rates

We are developing methods to efficiently estimate theeffects of candidate predictors on these transition rates

Overall conclusions
I The incidence data support a model in which flows of animalsare correlated with transmission routes.
I Time- and location-tagged sequence data contains additionalinformation about transmission routes, which we are developingmethods to extract more easily.

Acknowledgments
My supervisor Shweta Bansal has played a large part in thedevelopment of this work.
We thank John Korslund and Harry Snelson for useful feedback onveterinary and swine industry subject matter.
This work was supported by DHS Contract # HSHQDC-12-C-0014and the RAPIDD Program of the Science & Technology Directorate,Department of Homeland Security and the Fogarty InternationalCenter, National Institutes of Health.
The views and conclusions contained in this document are those ofthe author and should not be interpreted as necessarily representingthe official policies, expressed or implied, of the US Department ofHomeland Security.

Any questions?
Thank you.
This document is licensed under a Creative Commons Attribution-ShareAlike 4.0 International License.

Supplement

Regression model
Assuming
Ii ,t ∼ NegativeBinomial(E (Ii ,t), θ)Zi ∼ Normal(0, σ)
and log transforming our transmission model, we obtain a mixedeffects regression model with linear predictor
logE(Ii ,t+1) = b1 + Zi + b2t + b3 log(N2i farmdensityi)
+ b4 log flowi + b0 log(∑
jwi ,j Ii ,t + η)+ log Si ,t − 2 logNi


