43
Report on recovery plans July 2018
ECB-RESTRICTED until
B-PUBLIC
Report on recovery plans
July 2018

The report presents the ECB’s lessons learned and some of the best practices observed after three successive cycles of recovery plan assessments. It aims to help significant institutions (SIs) further improve their plans and make them more operational. Accordingly, the report does not impose any additional requirements on banks, nor does it create new supervisory expectations. It makes reference to existing requirements only, as set by the Bank Recovery and Resolution Directive (BRRD), the relevant Commission Delegated Regulation and European Banking Authority (EBA) guidelines.

Report on recovery plans – Contents 1
Contents
1 Introduction 3
1.1 Purpose 3
1.2 Scope 3
1.3 Background 3
1.4 Overview of the report 4
1.5 How to read the report 5
2 Recovery options 7
2.1 Selection and presentation of a broad range of recovery options 7
2.2 Quantifying the impact of recovery options through reliable valuations 10
2.3 Feasibility assessment: “usage-proof” recovery options 12
Box 1 Elements to consider when analysing the feasibility of recovery options 15
3 Overall recovery capacity 16
3.1 Quantifying ORC through a realistic analysis 17
3.2 Presenting overall recovery capacity: examples 19
Box 2 ORC – interaction between recovery options and contingency measures 22
4 Recovery indicators 23
4.1 Usage of indicators: the EBA minimum list 23
Box 3 Benchmarking analysis: deep-dive on asset quality and operational risk indicators 25
4.2 Recovery indicator framework: selecting indicators is crucial for effective recovery 26
Box 4 Deep-dive: the asset encumbrance indicator 28
4.3 Calibrating indicator thresholds to foster adequate reaction time and capacity 28
4.4 The recovery indicator framework as an integral part of the overall risk management framework 30

Report on recovery plans – Contents 2
5 Recovery plans: playbooks and dry runs 32
5.1 Playbooks – facilitating the usability of recovery plans during a crisis situation 33
5.2 Dry runs – testing whether the processes for implementing the recovery plan can work when needed 36
6 Conclusion: recovery planning is a continuous effort 40
7 Annex 41
7.1 Standardised reporting template 41

Report on recovery plans – Introduction 3
1 Introduction
1.1 Purpose
The purpose of this report is to share the lessons ECB Banking Supervision has learned and the best practices it has identified after three successive cycles of analysing recovery plans in order to help significant institutions (SIs) further shape their plans and make them even more operational.
1.2 Scope
The report does not aim to impose additional requirements on banks. However, it makes reference to specific requirements set by the Bank Recovery and Resolution Directive (BRRD), the relevant Commission Delegated Regulation1 and European Banking Authority (EBA) guidelines. The ECB expects banks to comply with all these requirements in line with the law. Overall, the report:
• clarifies the supervisory experience in relation to certain recovery plan-related requirements that have already been set by existing legislation;
• provides additional insights into a selection of practices adopted by some banks that may help other institutions further improve their recovery plans.
The scope of the report is limited to SIs.
1.3 Background
ECB Banking Supervision has conducted three cycles of recovery plan assessments since the Single Supervisory Mechanism was established, and has performed comprehensive benchmarking analyses that were used to identify the lessons learned and best practices presented in this report.
One of the key conclusions of the benchmarking analyses was that recovery plans are not always operational during a stress situation and, thus, their usability could be improved. Recovery plans are useful tools that bank managers can employ in order to overcome crisis situations, but only if they are properly designed. When the ECB
1 Commission Delegated Regulation (EU) 2016/1075 of 23 March 2016 supplementing Directive
2014/59/EU of the European Parliament and of the Council with regard to regulatory technical standards specifying the content of recovery plans, resolution plans and group resolution plans, the minimum criteria that the competent authority is to assess as regards recovery plans and group recovery plans, the conditions for group financial support, the requirements for independent valuers, the contractual recognition of write-down and conversion powers, the procedures and contents of notification requirements and of notice of suspension and the operational functioning of the resolution colleges, OJ L 184, 8.7.2016, p. 1 – hereinafter the “Delegated Regulation”.

Report on recovery plans – Introduction 4
assesses recovery plans in future, it will increasingly focus its assessment on whether there is sufficient evidence that the recovery plan and individual recovery options can be implemented in a timely and effective manner, even in situations of severe stress.2
The ECB encourages banks to consider the general lessons learned and best practices presented in this report when updating their recovery plans. However, for bank-specific feedback they receive individual feedback letters from the Joint Supervisory Teams. When reading the report, banks should also bear in mind the principle of proportionality, as the general considerations presented in this report depend on many factors, such as the nature of the banks’ business, the risks they are exposed to, their size and complexity and their capacity to react to a crisis in a timely and effective way.
1.4 Overview of the report
The report presents the ECB’s lessons learned and best practices for the following key components and aspects of Sis’ recovery plans.
1.4.1 Recovery options
Despite the fact that the BRRD and the relevant Commission Delegated Regulation already provide a description of the main aspects of recovery options that banks should include in their recovery plans, the ECB has observed that not all banks adequately comply with these requirements and that there is room for improvement. Chapter 2 presents the ECB’s experience on how banks could improve their presentation of recovery options, including the impact and feasibility assessments, and provides some examples of best practices.
1.4.2 Overall recovery capacity
Chapter 3 deals with overall recovery capacity (ORC). Despite the fact that the relevant Commission Delegated Regulation3 requires that banks present a credible overview of their recovery capacity in their recovery plans, the ECB’s experience has shown that banks tend to overstate their ORC. To address this issue, this chapter presents possible elements that banks could take into account when estimating their ORC, including examples of best practices.
2 Article 19(1) of the Delegated Regulation. 3 Article 12(3) of the Delegated Regulation.
Report on recovery plans – Introduction 5
1.4.3 Recovery indicators
Chapter 4 focuses on recovery indicators. The ECB’s experience has shown that not all banks comply with the EBA Guidelines on recovery plan indicators4, as some banks fail to reflect in their indicator frameworks the risks and vulnerabilities that are most relevant to them. This chapter elaborates on how banks could select their set of recovery indicators and calibrate their capital and liquidity indicators, and includes some examples of good practices.
1.4.4 Making recovery plans operational
Chapter 5 focuses on making the recovery plans easier to use and presents two best practices that the ECB considers useful for making recovery plans more operational: playbooks and dry runs. Developing a playbook or performing dry-run exercises are not mandatory activities and banks may use different approaches to make their plans more usable. More specifically, the chapter presents the key elements that playbooks could cover, building on the experience of several banks that have already implemented similar approaches. It also elaborates on useful elements for dry runs that banks could take into account when designing such exercises.
1.5 How to read the report
The report focuses on specific topics; this does not imply that other topics are less relevant.
The report should be read in combination with all requirements set by the BRRD, the Delegated Regulation and EBA guidelines. The ECB expects banks to comply with all these requirements. However, the report does not analyse all aspects covered by the legal texts. For example, the report does not address any aspects related to the relationship between parent institutions and their subsidiaries. In this respect, the ECB expects banks to make every effort to comply with the EBA Recommendation on the coverage of entities in a group recovery plan5, acknowledging that this recommendation also provides for an adjustment phase to ensure the smooth migration to the group level of recovery planning information currently available at the local level.
4 EBA Guidelines on the minimum list of qualitative and quantitative recovery plan indicators
(EBA/GL/2015/02) – hereinafter “EBA Guidelines”. 5 EBA/Rec/2017/02 of 1 November 2017.

Report on recovery plans – Introduction 6
The graphs and tables in this report are merely illustrative examples. Their use is not compulsory.
This report contains numerous tables and graphs to depict how information could be summarised. These are all merely examples and not intended to constrain banks’ own ideas for systematically presenting the information that they consider relevant for their management in their recovery plan. In fact, as recovery planning is an iterative process, banks are invited to develop approaches that go further than these examples.
The report aims to make plans more operational and concise.
The aim of the report is to help banks improve the quality of the information provided – not to impose additional information requirements or to increase the size of their recovery plans. Thus, a request for comprehensive information should not be misinterpreted as a request for banks to provide more unedited information without taking sufficient time to reflect on whether it is useful (i.e. copy-pasting should be avoided). Good examples show the opposite – that comprehensive information can be provided in a concise manner.

Report on recovery plans – Recovery options 7
2 Recovery options
Recovery options6 are defined as the measures that a bank can take in order to restore its financial position in a crisis situation. Ensuring that a bank has sufficient recovery options is one of the main purposes of recovery planning.
Despite the fact that the BRRD and the Delegated Regulation already provide a description of the main aspects of recovery options that banks should include in their recovery plans, the ECB has observed that not all banks adequately comply with these requirements and that there is room for improvement. This chapter presents the ECB’s experience on how banks could improve their presentation of recovery options, including the impact and feasibility assessments, and provides some examples of best practices.
2.1 Selection and presentation of a broad range of recovery options
Each bank’s recovery plan should include a sufficiently wide range of recovery options in line with the nature of its business, its size and its interconnectedness to the financial system7. The number of options might vary depending on the bank, but banks can only maximise the probability that enough options can be implemented under different stress situations if the available options are as diverse as possible (see Chart 1). In any case, banks should not limit themselves to one option or only a few types of option, and they should not limit the selection of options to those that are easily implementable ones but also include options that are extraordinary in nature8. The fact that a recovery option may require a change to the current nature of the bank’s business should not be considered as a reason for dismissing it9.
6 The relationship between options in the recovery plan is explained in the next chapter of this report,
which focuses on overall recovery capacity. 7 Article 8(2) and 17(3)(b) of the Delegated Regulation. 8 Article 8(4) and (5) of the Delegated Regulation. 9 Article 8(5) of the Delegated Regulation.

Report on recovery plans – Recovery options 8
Chart 1 Benchmarking analysis: average number of recovery options by category of SIs
Source: Based on recovery plan data from the standardised reporting templates submitted by SIs in 2017. Notes: G-SIB = globally systemically important bank. Categorisation based on internal business model classification. Size measured as total assets (in EUR billions).
A comprehensive presentation of options in line with Article 19 of the Delegated Regulation is a key element in enhancing a recovery plan’s credibility. Experience has shown that the consistent presentation of options throughout the recovery plan improves the overall credibility of the plan. For example, using the same template/structure for the description of each option ensures that all the requirements of the Delegated Regulation10 are adequately covered, while also providing the bank with an easy-to-use overview of all relevant information for a recovery option. Table 1 presents an example of what such a template/structure could cover, on the basis of banks’ best practices.
10 Articles 8 to 11 of the Delegated Regulation.
0 10 20 30 40
All banks
Universal bankG-SIB
Retail lenderCorporate/wholesale lender
Diversified lenderSmall domestic lender
Sectoral lenderCustodian and asset management
Total assets <30Total assets 30-100
Total assets 100-300Total assets >300
capital-raising optionsasset salesrisk reductiondisposal optionsliability managementaccess to standard central bank facilities
access to wholesale fundingcost savingsearnings retentioncommercial measuresother options

Report on recovery plans – Recovery options 9
Table 1 Example of which elements to include when presenting recovery options
Title Description
Overview of the option General description of the recovery option, its scope and purpose and implementation timeline.
Financial impact assessment
Presentation of the main figures related to the financial effect of the option on capital, risk-weighted assets, liquidity and profitability. Impact assessments take into account different market conditions and present maximum and minimum achievable results in terms of both capital and liquidity.
Feasibility assessment Includes: the identification of the main risks associated with the option, making a distinction between financial, operational, reputational, legal and business model risks; considerations of possible rating downgrades as a result of implementing the option; possible legal constraints that could affect the implementation of the option; considerations of the impact of the structure of the group and any intragroup arrangements on the implementation of the option (any practical or legal impediments to the prompt transfer of own funds or the repayment of liabilities or assets within the group); and key regulatory and legal issues (shareholder/third-party approval, pre-emption rights, breach of contractual covenant, stopping a service line, competition law contractual obstacles, tax issues, pensions issues and human resources issues).
Assumptions underlying impacts
Description of the main assumptions relating to the feasibility of the option and its impacts, including on the marketability of core business lines, operations and assets to be sold or the behaviour of other financial institutions.
Governance and implementation
Description of the internal decision-making process, including the timeline and the different steps involved in deciding on the option and implementing it. Description of the information required in order to implement the option and the availability of this information. For groups only, presentation of the legal entities within the group which would be involved in implementing the option.
Impact on critical shared services, critical functions and core business lines
Description of the impact on critical shared services of implementing the option and assessment of how the continuity of operations can be maintained if the recovery option is implemented. Description of any measures necessary to maintain continuous access to relevant financial market infrastructures, to preserve the continuous functioning of the bank's operational processes (including infrastructure and IT services) and, where the option involves the separation of an entity from the group, an explanation of the impact on the group.
Description of the expected impact of implementing the option on the capacity of the bank to perform critical functions as well as on its core business lines, franchise value/reputation and business model.
Impact on stakeholders and systemic consequences
Description of the impact of the option on external stakeholders (shareholders, customers, counterparties, etc.) and analysis of any potential system-wide implications associated with its implementation.
Communication plan Description of any internal or external communication plans specific to the option (where relevant). Explanation of how any potential reaction could be managed.
Preparatory measures Overview of preparatory measures that could be taken for the successful implementation of the option, including specific follow-up actions.
Source: Based on compilation of best practices adopted by several SIs.
As an introduction to their list of recovery options, some banks have also included a detailed analysis of the selection criteria for recovery options. Presenting the rationale behind the inclusion or rejection of each option can be useful for getting a comprehensive picture of all potential options and the reasons behind the rejection/unavailability of specific options. Banks have used both quantitative and qualitative criteria in their methodology/rationale, such as impact on capital/liquidity, complexity/feasibility, time to see the benefit of the option and experience with the option. In addition, some banks have considered de minimis thresholds below which options are dismissed, i.e. banks do not think they should expend senior management time and other resources on options which would have a negligible impact. Chart 2 presents an illustrative example of the selection criteria some banks use in order to assess individual options.

Report on recovery plans – Recovery options 10
Chart 2 Example of how to present the selection criteria for recovery options
Source: Based on compilation of best practices adopted by several SIs. Notes: All data are fictitious. The x-axis depicts the time needed to implement an option (in months), while the y-axis depicts the impact of each recovery option (ranging from low to high). Circles labelled A to V indicate different recovery options.
2.2 Quantifying the impact of recovery options through reliable valuations
Banks should provide a comprehensive impact assessment of their recovery options in line with Articles 8(3) and 10 of the Delegated Regulation, including, in particular, the impact of each recovery option on solvency, liquidity, funding positions, profitability and operations. Moreover, the recovery plan could – where relevant – highlight the impact of the options on recovery indicators, and especially on the relevant capital, liquidity and profitability indicators.11
Impact estimates should be supported by adequate justification as well as realistic and plausible valuation assumptions in order to support the credibility of recovery options.12 It is important that the key assumptions underpinning the options’ values are identified and their rationale explained, including how the assumptions chosen lead to realistic and plausible valuations. More specifically, it is essential to reflect the marketability of assets under different conditions.13 Merely presenting the impacts of a recovery option without any justification is not considered credible.14 More specifically, it is essential to reflect market conditions as the recovery option would be activated under stress situations. It is therefore useful to also provide a range of
11 Article 10 of the Delegated Regulation. 12 Articles 10(3), 17(1)(c) and 18(1)(h) of the Delegated Regulation. 13 Article 10(3) of the Delegated Regulation. 14 Often this will only be high-level calculations, but some options might need more detailed background
information. This information could also be included in an annex.
A
BC D
E
F
G H
I
J
K
L
M
N
O
P
QR
S
T
U
V
W
X
0 1 2 3 4 5 6 7 8 9 10 11 12
Impa
ct
Implementation timeline (months)
low complexitymedium complexityhigh complexity
Recovery options: summary of the individual assessment

Report on recovery plans – Recovery options 11
impacts for the individual options under different stress conditions.15 Table 2 presents an illustrative example.
Table 2 Example of how to present an overview of the impact of each recovery option
Impact on capital, liquidity and RWAs; implementation timeline; impact on profitability and business model
High / fast / low
Medium / medium / neutral
Low / slow / significant
Option
Capital
Liquidity (EUR
millions)
RWAs (EUR
millions)
Impact on profitability
Impact on
business model
Implementation timeline (days)
Owner (function)
Min. (EUR
millions/ basis
points)
Max. (EUR
millions/ basis
points) Min. Max. Min. Max. Prep. Effects
A 1,378 164 1,726 188 1,000 2,100 n.a. n.a. Low Low 119 112 Treasury
B 174 12 1,189 82 400 420 n.a. n.a. Neutral Neutral 60 10 Treasury
C 1,493 103 3,176 219 3,260 6,500 -4,800 -7,000 Low Low 119 30 Treasury
D 1,306 297 1,480 300 5,800 7,000 n.a. n.a. Low Low 119 112 Treasury
E 1,740 120 1,131 78 3,600 4,300 -5,100 -7,400 Low Low 28 5 Mgmt Board
F 58 4 218 15 100 400 n.a. n.a. Low Low 32 3 Mgmt Board
G 667 46 899 131 n.a. n.a. n.a. n.a. Neutral Low 90 10 Mgmt Board
H 116 8 319 22 400 -2,000 -5,900 Neutral Neutral 25 7 Mgmt Board
I 0 0 479 33 17,000 -4,800 -6,800 Low Low 90 5 Treasury
J 276 19 276 19 n.a. n.a. -5,800 -5,800 Low Low 92 59 Treasury
K 276 19 421 29 1,900 2,180 -2,000 -5,900 Neutral Neutral 25 59 HR
L 232 16 304 21 2,000 5,000 -5,700 -7,000 Low Low 25 25 HR
Source: Based on compilation of best practices adopted by several SIs. Note: All data are fictitious.
A good practice adopted by several banks relates to the justification of the assumptions for recovery option valuations based on the banks’ past experience in implementing the same or similar options and/or on actual values achieved by peer institutions in similar situations. In addition, recovery option valuations can include an analysis of the quality of assets driving the option’s value, for example analysis of the
15 So far, we have not observed banks calculating the cost of implementing options (too) late or back-
testing with indicator calibrations, even though some of them floated these ideas as possibilities.
Report on recovery plans – Recovery options 12
mortgages that make up a potential loan portfolio sale option. An additional good practice with respect to valuations involves close collaboration between the recovery plan experts and different departments within the bank. In particular, the back-testing of valuation assumptions by the respective business lines, divisions, branches or subsidiaries is a good practice. For example, cooperation with the treasury department when assessing capital-raising options under different scenarios, or with the corporate development (or portfolio management) department for asset sales, could make the valuations more reliable.
2.3 Feasibility assessment: “usage-proof” recovery options
Banks should provide clear evidence/justification to support the feasibility of their recovery options in line with Articles 8(3) and 11 of the Delegated Regulation. Such evidence could include the bank’s past experience in implementing an option, information on market intelligence or experience from peers – see Box 1 for more details. The mere statement of feasibility without any justification is considered insufficient. Feasibility analysis also includes anticipating potential impediments to implementing their recovery options.16 These impediments might take various forms (including legal, operational and financial)17 and it is important that banks analyse and describe in detail whether and how they could be overcome.18 The majority of banks have used some sort of qualitative assessment of the feasibility of each recovery option. Including an overview table that summarises the feasibility assessment of each option in the recovery plan under each situation has proven to be a good practice – see Table 3 for an illustrative example. Overall, presenting the potential risk factors that could impact the feasibility of each option allows banks to easily reassess the feasibility of each option when facing a real crisis.
16 Article 11(1) of the Delegated Regulation. 17 For example, relying on IT systems that are not back-to-back and require a fair amount of manual work,
being overly dependent on specific people within the organisation, or changes in market sentiment if the options rely on external parties.
18 Article 11(1)(b) of the Delegated Regulation.

Report on recovery plans – Recovery options 13
Table 3 Example of how to present the feasibility of recovery options
Impediments / feasibility
Low / high
Medium / medium
High / low
Option Experience
Possible impediments/risk factors
Implementation timeline Feasibility Legal Operational Financial Reputational
Business/ group
structure
Medium High Low Medium Low immediate Low
B Yes Low Low Medium Medium Low immediate Medium
C Yes Low Low Low Low Low immediate High
D No Low High Low Low Low 1-2 months Low
E Yes Medium High High Medium Low 1-2 months Low
F No Low Low Low Medium Medium 2-3 months Low
G No Low Low Low Medium Low 2-3 months Low
H Yes Medium Low Low Medium Low 3-6 months Medium
I Yes Low Medium Medium Low Low 3-6 months Medium
J Theoretical Low Low High Low Low 9 months Low
K Theoretical Low Low Low Medium Low 12 months Medium
L Yes Low Low Low Low Low 12 months High
Source: Based on compilation of best practices adopted by several SIs. Note: All data are fictitious.
Moreover, in line with Article 18(1)(d) of the Delegated Regulation, banks should consider in their feasibility assessment a realistic timeline for implementing their options.19 As a good practice, some banks also report how much time they would need to prepare the implementation of each option. Merely providing timelines for the stated duration without any justification is not deemed adequate. As another good practice, banks have developed a comprehensive implementation plan for each option, breaking them down into specific actions, the approvals required and detailed timelines for each step. This has proven to be useful for substantiating the time needed to implement each option. Some banks with several similar options (e.g. disposals) have prepared an even more detailed action plan for this particular category of options.
A good practice observed by several banks is to explicitly take into account in the feasibility analysis the potential situation of the market and the extent to which the implementation of the option depends on third parties. For example, some options, such as asset sales or the disposal of subsidiaries, may be more strongly affected by severe stress factors in the overall market environment. On the other hand, options such as cancelling dividends may be easier to implement without any reputational
19 Article 18(1)(d) of the Delegated Regulation.

Report on recovery plans – Recovery options 14
effects under certain systemic scenarios. Moreover, even if an option remains feasible under different market conditions, its timeline may be affected. Presenting such options without taking these effects into account is not deemed adequate. Conversely, summarising the above considerations in a table can be very effective for providing bank management with a clear overview of the feasibility of each option under different scenarios. Furthermore, as the timeline for implementing some options may depend on market conditions, banks could, where relevant, provide a range of timelines for the implementation of recovery options. Table 4 presents an example of how to present an overview of the feasibility analysis of recovery options under different scenarios.
Table 4 Example of how to present the feasibility of recovery options under different scenarios
Obstacles / attractiveness of the measure
Low / high
Medium / medium
High / low
Option Experience
with measure Obstacles
Feasibility of the measure
Idiosyncratic, fast
Idiosyncratic, slow
Market-wide, fast
Market-wide, slow
A Practical i
Low Medium High Medium High
B Practical i
Low High Medium Medium Medium
C Practical i
Low Low Medium Low Medium
D Theoretical i
Medium High Medium Medium High
E Theoretical i
High High High Medium High
F Theoretical i
High High Low Low Low
G Practical i
Low High High Medium High
H Theoretical i
Medium Low Medium Low Medium
I Practical i
Low Medium High High Medium
J No experience No experience Low Medium High Medium
K Practical i
Low Medium Low Low Medium
L Practical i
Low High High Medium High
Source: Based on compilation of best practices adopted by several SIs. Note: All data are fictitious.
Another good practice relates to banks highlighting when implementing certain recovery options would likely cause a fundamental change in their business model, franchise and strategy, or a significant shift in the scale of their activities. In particular, the impact assessment could also include an analysis of the potential impact of each recovery option on the bank’s profitability20, which could include future profitability prospects, i.e. how it affects the long-term viability of its business model.
20 Article 10(1) of the Delegated Regulation.

Report on recovery plans – Recovery options 15
Box 1 Elements to consider when analysing the feasibility of recovery options
This box presents some elements that banks could take into account to support the assessment of the feasibility of their recovery options for certain categories of options.
Table A Elements that support the credibility and feasibility of recovery options by category of option
Source: Based on compilation of best practices adopted by several SIs. Note: Access to central bank facilities does not include access to emergency liquidity assistance (ELA).
Overall, the latest benchmarking has shown that improving the feasibility of options remains a key issue. If an institution is exposed to fast-moving adverse events such as cyber-attacks, recovery options should be designed to respond to this type of stress.21
21 Article 8(2) of the Delegated Regulation.
Capital-raising options • Recent experience of the bank or its peers (e.g. with regard to amount raised and price)
• Possible transaction time frames that take into account a variety of factors that could affect the placement of shares in the market (e.g. the publication of quarterly results)
• Conservative pricing assumptions (taking into account stressed market conditions)
Disposal options • Potential purchasers (at least by type) and assessment of the availability of strategic investors
• Any third-party consent/approvals or notices required (e.g. consideration of necessary authorisations)
• Potential competition issues (where relevant) and tax implications
• Availability of due diligence information within the foreseen time frame
• Any interconnectedness issues, e.g. separability analysis and existing intragroup guarantees
Asset sales • The depth and liquidity of the market for different asset classes (marketable assets, legacy assets, etc.) and its impact on the price of selling assets as well as on the timeline for the sale
• Possible changes in accounting treatment which would involve the reclassification of some assets and book impairments following the asset sale (where relevant)
• Potential tax implications
• For the winding-down of a trading portfolio: operational impacts (i.e. the capacity to handle increased volumes of transactions, possible portfolio segmentation analysis in order to identify positions which are linked and others that may be transferrable or sold, etc.)
Access to standard central bank facilities1 • Operational aspects (including testing the speed of collateral processing)
• Analysis of eligible assets and the drawing capacity against these assets, i.e. “haircuts” (taking into account the asset encumbrance of the bank’s portfolio)
Reduction of riskiness/improvement of risk profile
• Potential reputational impacts and impact on franchise value
• Market conditions under financial stress (i.e. behaviour of risk transfer markets under stress, such as credit default swaps, hedge instruments and securitisation)
• Impact on critical functions and future profitability

Report on recovery plans – Overall recovery capacity 16
3 Overall recovery capacity
An adequate estimate of the overall recovery capacity (ORC) of a bank is crucial for supervisors to be able to assess whether it could overcome crisis situations by implementing suitable recovery options. The ORC provides an overview of the extent to which the bank could restore its financial position following a significant deterioration of its financial situation.
Chart 3 Benchmarking analysis: average ORC
Capital (x-axis: time in months; y-axis: CET1 change in percentage points)
Liquidity (x-axis: time in months; y-axis: LCR change in percentage points)
Source: Based on recovery plan data from the standardised reporting templates submitted by SIs in 2017.
0
2
4
6
8
10
12
14
0 6 12
capital raising optionsasset salesrisk reductiondisposal optionsliability managementaccess to standard central bank facilities
access to wholesale fundingcost savingsearnings retentioncommercial measuresother options
0
50
100
150
200
250
0 6 12
capital raising optionsasset salesrisk reductiondisposal optionsliability managementaccess to standard central bank facilities
access to wholesale fundingcost savingsearnings retentionCommercial measuresother options

Report on recovery plans – Overall recovery capacity 17
Experience from the previous assessment cycles has shown that banks tend to overestimate their ORC. Based on data included in the 2017 recovery plans, on average banks assume that, by implementing their recovery options (see Chart 3), over the course of one year they could increase their CET1 ratio by 13 percentage points and their liquidity coverage ratio (LCR) by 220 percentage points. However, the fact that the expected capital increase is close to SIs’ current average CET1 level and the expected liquidity increase is almost equal to 1.5 times their current LCR level could indicate that banks are overestimating their ORC.
Calculating the ORC and adequately describing the recovery options are closely linked and overlap to some extent, but simply adding all the options together will not usually provide an adequate overview of the ORC.
3.1 Quantifying ORC through a realistic analysis
Banks should present a credible overview of their recovery capacity in their recovery plans.22 Based on the ECB’s experience a realistic overview of banks’ ORC usually considers mutual exclusivity, interdependencies, constraints from idiosyncratic or system-wide events, reputational effects, operational capability, consequences for the business model, proper testing of the options and optimising for the different requirements of a capital or liquidity-driven crisis situation (see Box 2 for the potential overlap between recovery options and contingency measures). As a consequence, the ORC could present possible ranges of recovery capacity for both capital and liquidity-related crises. The various considerations are described in more detail below.
• Mutual exclusivity Some recovery options are fully or partially mutually exclusive, i.e. one option cannot be implemented if another option is implemented. For example, a portfolio which would be sold cannot be securitised (again) at a later date, yet cases like this were described in some plans.
• Interdependencies between various recovery options Activating one recovery option could affect the subsequent implementation of another option. For example, cancelling dividends or distributions on AT1 instruments may affect subsequent CET1 or AT1 issuances. Likewise, raising a large amount of capital via CET1 might have a knock-on effect on planned AT1 and T2 issuances. Such constraints are not always reflected in all plans; some plans often assume unrestricted access to all options at all times and without considering any haircuts.
• Capacity under idiosyncratic versus system-wide events Interrelations and interdependencies between recovery options could differ
22 Article 12(3) of the Delegated Regulation.

Report on recovery plans – Overall recovery capacity 18
under different types of stress (idiosyncratic versus system-wide). As a result, ORC could be a range rather than a specific number.
• Reputational effects Implementing several recovery options in combination could reduce their impact and lead to impediments or relevant reputational effects. For example, Chart 4 shows that more than 20 banks assume they could dispose of seven or more subsidiaries simultaneously, often without considering the potential effects on price or the feasibility of the options, and without acknowledging the potential reputational impacts due to market-signalling effects.
Chart 4 Benchmarking analysis: how many disposals banks believe they can implement simultaneously
(x-axis: number of simultaneous disposals; y-axis: number of banks)
Source: Based on recovery plan data from the standardised reporting templates submitted by SIs in 2017.
• Operational capability The operational capability to implement a multitude of recovery options simultaneously can also affect the ORC. For example, depending on the size and experience of the bank, preparing the securitisation of several asset portfolios in parallel might run up against operational constraints, as there may only be a limited number of staff with the required expertise. Moreover, the same staff may be tasked with implementing other options in parallel and external resources might be too constrained, unless adequate preparatory measures have been considered.
• Consequences for the business model A comprehensive assessment of potential options could take into account the consequences for the bank’s business model and profitability, i.e. to consider whether the bank would still have a viable business after implementing the recovery options. While some or all of the options might not have a negative impact on the business model when taken in isolation, there may be a negative impact when several options are implemented at the same time. Some recovery plans do not take this into account.
32
14
7 52 4
1
28
0
10
20
30
40
0 1 2 3 4 5 6 7 or moredisposals

Report on recovery plans – Overall recovery capacity 19
• Proper testing of the set of options Taking into account the above-mentioned constraining factors, it is important that ORC is properly tested in order to describe the extent to which the bank can recover under different scenarios.23 In line with the Delegated Regulation, banks are required to describe their ORC and the extent to which the recovery options allow them to recover in a range of scenarios24, which should be based on events and factors that are most relevant to them.25 Analysing the impact of only a few options in each scenario would not describe the full extent of the ORC. At the same time, this does not mean that all analysed options would be necessary or actually used to recover from the specific scenario (in the event that the ORC is higher than what is needed to recover).
• Optimising for capital and liquidity crisis situations It can be reasonably assumed that solvency or liquidity-induced crises will result in different recovery capacity needs. A good practice observed by some banks is distinguishing between ORC in terms of capital and ORC in terms of liquidity (e.g. optimising the selection of options that can be simultaneously implemented in order to either raise as much capital as possible or increase liquidity as fast as possible).
3.2 Presenting overall recovery capacity: examples
The ECB has identified several examples of good practices that banks have adopted when presenting their ORC. For example, in order to assess the qualitative interrelations/interdependencies between individual recovery options, it is considered a good practice to display the recovery options in a matrix, as shown in Table 5. This allows banks to have a very clear overview of which options are mutually exclusive (red boxes) or which options are connected and thus might be affected when implemented simultaneously (yellow boxes).
23 Article 8(3) of the Delegated Regulation. 24 Article 12(3)(2) of the Delegated Regulation. 25 Paragraphs 6 and 9 of the EBA Guidelines on the range of scenarios to be used in recovery plans
(EBA/GL/2014/06).

Report on recovery plans – Overall recovery capacity 20
Table 5 Example of how to present the qualitative interrelations/interdependencies between individual recovery options
Legend
Possible
Connected
Excluded
Execute second
Execute in a capital stress environment Execute in a liquidity stress environment
Option A B C D E F G H I J K L
Exec
ute
first
Execute in a capital stress environment
A
B
C
D
E
F
Execute in a liquidity stress environment
G
H
I
J
K
L
Source: Based on compilation of best practices adopted by several SIs. Note: All data are fictitious.
Another good practice is presented in Chart 5, which shows the build-up of the recovery capacity over time. This graph will be provided in the standardised reporting templates as of this year to allow for a graphical presentation.

Report on recovery plans – Overall recovery capacity 21
Chart 5 Example of how to present the aggregate impact of ORC in terms of the CET1 ratio
(x-axis: months; y-axis: percentages)
Source: Based on compilation of best practices adopted by several SIs. Note: All data are fictitious.
An additional good practice is to show the build-up of the recovery capacity over time and its estimated range (see Chart 6).
Chart 6 Example of how to present the build-up of ORC over time
(x-axis: timeline for implementing recovery options (d=day(s), w=week(s), m=month(s) and y=year; y-axis: LCR increase in percentage points)
Source: Based on compilation of best practices adopted by several SIs. Note: All data are fictitious
0.0
0.5
1.0
1.5
2.0
0 2 4 6 8 10 12 14 16 18
capital-raising optionsasset salesrisk reductiondisposalsliability managementaccess to standard central bank facilities
access to wholesale fundingcost savingsearnings retentioncommercial measuresother options
0
10
20
30
40
50
60
1 d 1 w 2 w 3 w 4 w 2 m 4 m 6 m 9 m 1 y
worst casebest case

Report on recovery plans – Overall recovery capacity 22
Box 2 ORC – interaction between recovery options and contingency measures
Some banks’ recovery plans seem to either overestimate or, in a few cases, understate their liquidity recovery capacity.
Based on the ECB’s experience, this could be related to the fact that banks may use different definitions of (i) measures which could also be taken in a business-as-usual environment, (ii) contingency measures as listed in the liquidity contingency plan, and (iii) recovery measures. For example, some banks include measures from their liquidity contingency plans in their recovery plan without eliminating the overlap – which might lead to double-counting – while others fully exclude them from their recovery plans.
However, as specified in the Delegated Regulation, recovery plans go above and beyond capital and contingency plans26 and should include (i) measures which are extraordinary in nature and which might even change the current nature of the business, and (ii) measures which could be taken in the course of normal business.27 Moreover, according to the Delegated Regulation, the supervisor has to assess whether the available recovery options, i.e. both the extraordinary and more “normal” ones, would be likely to maintain the viability of the bank and restore its financial soundness. Without information about the full set of potential measures which might be taken once the situation starts deteriorating and a clear description of potential overlaps, this assessment would not be possible.
Likewise, it is important that this interaction between contingency and recovery planning is reflected in the recovery plan. As a best practice, some banks present a prioritisation of their recovery options under each scenario, taking into account that measures that are difficult to implement, that would change the business model or that would have market-signalling effects would usually be taken only after implementing easy-to-achieve options with no or limited impact on the bank’s business model or reputation. As such, it is a best practice to start from a list of all potential options that a bank could take under each scenario, and then as a second step to highlight those that would typically only be taken when a recovery indicator is breached.
26 The capital plan and funding plan, including the liquidity contingency plan, are central parts of the
ICAAP and ILAAP. They cover the processes a bank has implemented to identify, measure, manage and monitor capital and liquidity.
27 Articles 8(4) and 9(1)(c) and (e) of the Delegated Regulation and Section A (11) of the Annex to the BRRD.

Report on recovery plans – Recovery indicators 23
4 Recovery indicators
Recovery indicators are qualitative and quantitative metrics that identify the points at which a bank has to decide whether an action referred to in the recovery plan should be taken or whether to refrain from taking such an action.28
4.1 Usage of indicators: the EBA minimum list
The EBA Guidelines already specify the requirements for designing a bank’s recovery indicator framework, which should be in line with its business model, strategy, risk profile, size and complexity.29 The EBA Guidelines also provide a minimum list of 15 indicators, of which ten are part of the four mandatory categories that banks are expected to use, unless they can justify that an indicator would not be relevant for them or could be replaced by a more relevant one.30
Overall, the ECB’s experience has shown that some banks do not include all indicators from the EBA minimum list in their recovery framework while not providing adequate justification (in line with the principle of rebuttable presumption) (see Table 6). This is not in line with the EBA Guidelines. Moreover, specific risks and vulnerabilities that are relevant for the bank are often not adequately reflected. For example, a number of banks facing high credit risks do not include an asset quality indicator in their recovery framework. Similarly, a number of banks which have incurred significant operational risk losses do not consider indicators for operational risk (see Box 3 for a more detailed analysis). Moreover, many banks do not consider including market-based indicators in their recovery framework even though they are dependent on ratings and/or listed on a stock exchange.
28 There is no automatic system for implementing recovery options once an indicator is breached
according to Article 9 of the BRRD. Whether to take action, and what action to take in a real crisis situation, is at the bank’s discretion and depends on its specific needs in the crisis situation.
29 Paragraph 15 of the EBA Guidelines. 30 Annex II of the Minimum list of recovery plan indicators of the EBA Guidelines.

Report on recovery plans – Recovery indicators 24
Table 6 Benchmarking analysis: heatmap of the use of recovery indicators from the EBA minimum list
Capital Liquidity Profitability Asset quality Market-based
Macro-economic
Bank category CET
1 ra
tio
TC ra
tio
Leve
rage
ratio
LCR
NSF
R
Cos
t of w
hole
sale
fu
ndin
g
RoE
or R
oA
Sign
ifica
nt
oper
atio
nal l
osse
s
NPL
gro
wth
rate
Cov
erag
e ra
tio
Rat
ing
dow
ngra
de/
nega
tive
revi
ew
CD
S sp
read
Stoc
k pr
ice
varia
tion
GD
P va
riatio
ns
CD
S of
sov
erei
gns
All banks
Retail lender
G-SIB
Small domestic lender
Corporate-/ Wholesale-lender
Sectoral lender
Universal bank
Diversified lender
Custodian and asset management
Total assets < 30
Total assets 30-100
Total assets 100-300
Total assets > 300
Source: Based on recovery plan data from the standardised reporting templates submitted by SIs in 2017. Notes: Dark green indicates full usage (by all banks in the category) and dark red indicates no usage (by any bank in the category). Other colours indicate various intermediate levels of usage.

Report on recovery plans – Recovery indicators 25
Box 3 Benchmarking analysis: deep-dive on asset quality and operational risk indicators
The ECB benchmarking analysis has shown that banks often do not adequately reflect their key vulnerabilities and risks in their recovery indicator framework. This box focuses on two indicative examples for operational and credit risk to show that recovery plans could be better adapted to banks’ risk profiles and business models.
Looking at a sample of the banks with the highest operational risk losses31, less than 40% included recovery indicators to capture “significant operational risk losses”. The majority of them did not consider such an indicator (see Chart A).
Chart A Use of the “significant operational risk losses” (OpRisk) indicator
Source: Based on recovery plan data from the standardised reporting templates submitted by SIs in 2017 and the common reporting framework (COREP). Note: Sample includes banks with high operational losses. RIT = recovery indicator.
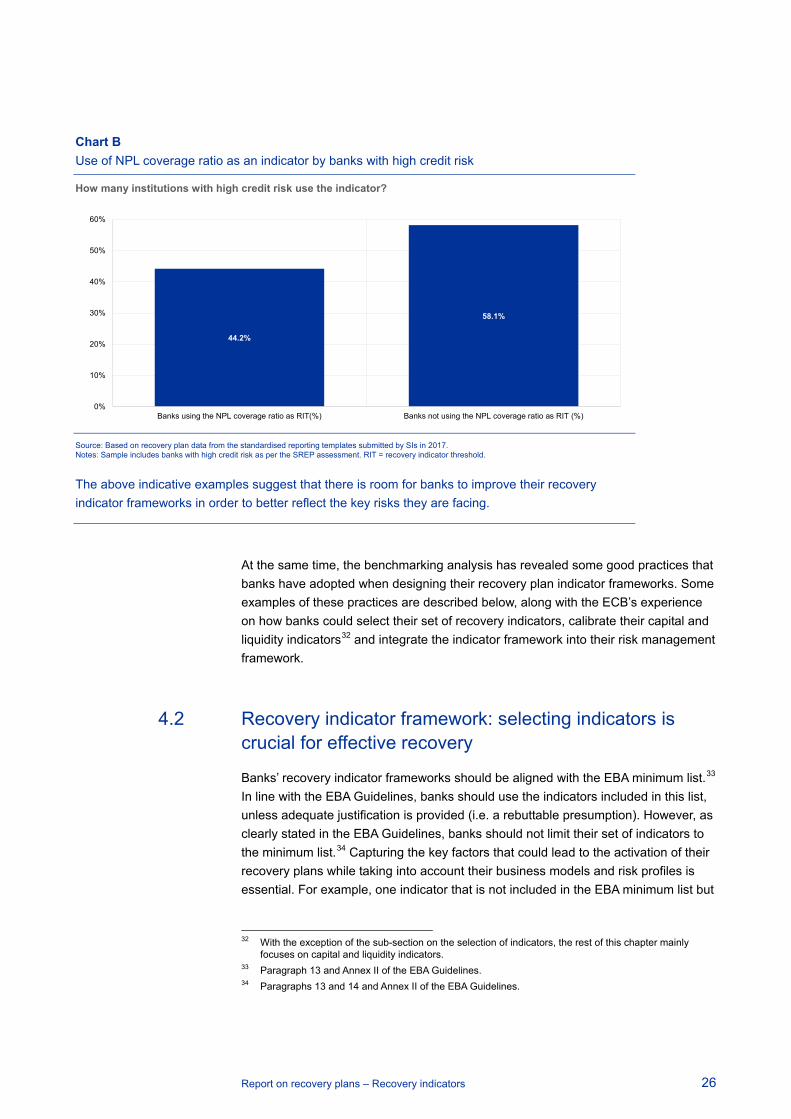
Looking at the asset quality indicators and, in particular, the coverage ratio, the benchmarking results indicate that only 44% of the banks with significant credit risk (as per the Supervisory Review and Evaluation Process (SREP) assessment) used the coverage ratio of non-performing loans (NPLs) as a recovery indicator (see Chart B).
31 The total sample comprised 22 SIs.
How many institutions with operational losses use the indicator?
43.8%
56.3%
0%
10%
20%
30%
40%
50%
60%
Banks using OpRisk losses as RIT (%) Banks not using OpRisk losses as RIT (%)
Report on recovery plans – Recovery indicators 26
Chart B Use of NPL coverage ratio as an indicator by banks with high credit risk
How many institutions with high credit risk use the indicator?
Source: Based on recovery plan data from the standardised reporting templates submitted by SIs in 2017. Notes: Sample includes banks with high credit risk as per the SREP assessment. RIT = recovery indicator threshold.
The above indicative examples suggest that there is room for banks to improve their recovery indicator frameworks in order to better reflect the key risks they are facing.
At the same time, the benchmarking analysis has revealed some good practices that banks have adopted when designing their recovery plan indicator frameworks. Some examples of these practices are described below, along with the ECB’s experience on how banks could select their set of recovery indicators, calibrate their capital and liquidity indicators32 and integrate the indicator framework into their risk management framework.
4.2 Recovery indicator framework: selecting indicators is crucial for effective recovery
Banks’ recovery indicator frameworks should be aligned with the EBA minimum list.33 In line with the EBA Guidelines, banks should use the indicators included in this list, unless adequate justification is provided (i.e. a rebuttable presumption). However, as clearly stated in the EBA Guidelines, banks should not limit their set of indicators to the minimum list.34 Capturing the key factors that could lead to the activation of their recovery plans while taking into account their business models and risk profiles is essential. For example, one indicator that is not included in the EBA minimum list but
32 With the exception of the sub-section on the selection of indicators, the rest of this chapter mainly
focuses on capital and liquidity indicators. 33 Paragraph 13 and Annex II of the EBA Guidelines. 34 Paragraphs 13 and 14 and Annex II of the EBA Guidelines.
44.2%
58.1%
0%
10%
20%
30%
40%
50%
60%
Banks using the NPL coverage ratio as RIT(%) Banks not using the NPL coverage ratio as RIT (%)

Report on recovery plans – Recovery indicators 27
is included in the list of additional indicators, and which the ECB has identified as very useful in crisis situations, is the asset encumbrance indicator (see Box 4 for more details).
In a robust recovery plan, the ECB would also welcome the use of forward-looking elements in the indicator or early warning signals framework.35 According to the benchmarking analysis, only a few banks have so far included forward-looking aspects in their indicator framework. Such indicators could, for example, be related to profitability retracement forecasts, major (and repeated) deviations from budgeting projections, stressed capital ratio shortfall predictions, or developments in the employment rate, inflation, or consumer or investor activity. As an example, if a bank has a relevant exposure to adjustable rate or foreign currency mortgages, monitoring exchange rate fluctuations and relevant interest rate developments could indicate potential deterioration before actual losses occur.
When selecting the most relevant recovery indicators, a good practice is to include an analysis of how the chosen indicators capture all the key risks of the bank, including adequate justification. This analysis is usually supported by information about how specific indicators have developed in the past, (including graphs showing this past development, where available) and how they managed to capture actual past stress situations. It could also be back-tested to assess how quickly the relevant indicator had signalled deteriorating conditions.
Looking at capital and liquidity indicators, banks’ recovery indicator frameworks should include, as a minimum, all the indicators that are based on regulatory requirements (as included in the EBA minimum list unless it is not relevant for the specific bank). This applies for example, to the leverage ratio and the net stable funding ratio (NSFR) as soon as they become binding. In the meantime, in line with the EBA Guidelines banks should capture mid- to longer-term liquidity and funding needs using a relevant indicator36 or already the NSFR itself. While the inclusion of the minimum requirement for own funds and eligible liabilities indicator (MREL) in recovery planning is not required by the EBA Guidelines, banks are nevertheless encouraged to include the MREL indicator in their recovery plans, at the latest when the MREL becomes binding and applicable to them.
35 Paragraph 15(f) of the EBA Guidelines. 36 Paragraph 27 of the EBA Guidelines.

Report on recovery plans – Recovery indicators 28
Box 4 Deep-dive: the asset encumbrance indicator
Recent experience with crisis situations has highlighted the usefulness of asset encumbrance as a liquidity indicator. This indicator could allow banks to assess their ability to withstand funding stress using eligible and available collateral to access secured wholesale funding and standard central bank facilities, and can be considered complementary to the LCR.
The benchmarking analysis has shown that around 20% of the banks included some form of asset encumbrance indicator in their recovery framework. Overall, banks used different types of asset encumbrance indicators based on various definitions, with the majority considering the stock of unencumbered assets (with haircuts) available to the bank (see Table A). A well-chosen asset encumbrance indicator could allow banks to assess their ability to withstand funding stress. Its significant deterioration, which can be monitored with high frequency (up to daily) in the context of an operational short-term liquidity risk framework, is usually indicative of liquidity stress.
Table A Asset encumbrance indicators in recovery plans
Source: Based on recovery plan data from the standardised reporting templates submitted by SIs in 2017.
Some banks provided additional information in the form of a summary of the group’s unencumbered assets as of the recovery plan reference date, with a level of granularity covering (i) central bank eligibility, held/not held within the central bank liquidity pool, pre-positioned or available for pre-positioning, and (ii) currencies and legal entities. This information is useful in liquidity crisis.
4.3 Calibrating indicator thresholds to foster adequate reaction time and capacity
It is particularly important that banks set their indicator thresholds at adequate levels in order to ensure the timely and effective activation of their recovery plans when necessary. The ECB does not set prescriptive calibration thresholds, but expects full compliance with the EBA Guidelines, i.e. the thresholds (i) should be calibrated based on the institution’s risk profile and on the time needed to activate the recovery measures; (ii) should consider the recovery capacity resulting from those measures; and (iii) should take into account how quickly the capital situation may change, given the institution's individual circumstances. Moreover, thresholds for indicators based on regulatory capital requirements should be calibrated at adequate levels in order to ensure a sufficient distance from a breach of the capital requirements applicable to
Amount of
unencumbered assets
Unencumbered assets divided by eligible deposits for Deposit
Guarantee Scheme EBA asset
encumbrance ratio Encumbered
assets/total assets Cash buffer
% of all institutions
12% 4% 2% 2% 1%

Report on recovery plans – Recovery indicators 29
the bank. Similarly, thresholds for liquidity indicators should be calibrated at adequate levels in order to be able to inform the bank of potential and/or actual risks of not complying with those minimum requirements.37 Overall, in line with the EBA Guidelines a bank should be able to provide an explanation of how the calibrations of the recovery indicators have been determined and to demonstrate that the thresholds would be breached early enough for the measures to be effective.38 In this context, the magnitude and speed of the breach of the threshold should be taken into account39 (see also Chapter 2 of this report). Based on the ECB’s experience, when the CET1 indicator is calibrated within the combined buffer requirement, the potential usability of some recovery options may be limited, once the maximum distributable amount is breached.
37 Paragraphs 24, 25, 30 and 31 of the EBA Guidelines. 38 Paragraph 18 of the EBA Guidelines. 39 Even though Article 24 of the EBA Guidelines explicitly mentions that recovery capacity should be used
as a factor when calibrating the capital indicator, this is not observed based on the benchmarking data. The analysis shows that banks fail to consider ORC when calibrating indicators as there is no observable correlation between the distance of the indicator to the regulatory minimum and the relative amount of ORC.

Report on recovery plans – Recovery indicators 30
Chart 7 Benchmarking analysis – calibration of CET1 indicator for 2016 and 2017
Source: Based on recovery plan data from the standardised reporting templates submitted by SIs in 2016 and 2017. Note: “Within” includes at the relevant threshold.
4.4 The recovery indicator framework as an integral part of the overall risk management framework
A bank’s recovery indicator framework can only serve its purpose of alerting the bank to the need to possibly activate the recovery plan if it is integrated into the bank’s risk management framework and is part of its monitoring processes.40 In accordance with the EBA Guidelines, a bank’s recovery framework should be aligned with its overall risk management framework and with existing liquidity contingency plan or capital plan thresholds.41 Moreover, the ECB encourages banks to consider a “traffic light approach” with respect to indicators.42 Banks can use progressive metrics to improve
40 Article 6(4) of the Delegated Regulation. 41 Paragraph 15(d) of the EBA Guidelines. 42 Paragraph 16 of the EBA Guidelines.
0
5
10
15
All b
anks
Sect
oral
lend
er
Ret
ail l
ende
r
Cus
todi
an a
nd a
sset
man
agem
ent
G-S
IB
Smal
l dom
estic
lend
er
Uni
vers
al b
ank
Div
ersi
fied
lend
er
Cor
pora
te/w
hole
sale
lend
er
P1+P2R+CB+ P2G
Recovery Indicator ThresholdEarly Warning Threshold
1%
32%
38%
29%
0% 25% 50%
CET1 threshold 2017
4%
15%
53%
28%
0% 25% 50%
CET1 threshold 2016
Above Guidance
Within Guidance
Within Buffers
Below/at P1 + P2R

Report on recovery plans – Recovery indicators 31
the consistency between their risk management frameworks and their recovery indicator frameworks.
At the same time, the ECB considers important that banks have adequate escalation processes in place that ensure that any information about recovery indicator breaches is escalated without delay, to both their management board and the relevant supervisors.43 Establishing appropriate systems for monitoring recovery indicators and choosing an adequate monitoring frequency ensures that banks can take appropriate measures in a timely manner to restore their financial position following a significant deterioration.44 Experience has shown that the monitoring frequency usually increases as conditions deteriorate.
Moreover, it is a good practice to allow for escalation not only after one or more indicators are breached, but also based on qualitative expert judgement (“expert call”). Experience has shown that even with a comprehensive indicator framework there might be elements that can only be captured with an expert call.
43 Article 9(1) of the BRRD. 44 Paragraphs 19 and 20 of the EBA Guidelines and Article 9 of the BRRD.

Report on recovery plans – Recovery plans: playbooks and dry runs 32
5 Recovery plans: playbooks and dry runs
Based on the ECB’s experience, making recovery plans more operational ensures that recovery plans and options can be implemented in a timely and effective manner in a stress situation.45 The ECB has identified playbooks and dry runs as best practices for achieving this.
Based on three years of experience with assessing recovery plans, the ECB is doubtful that every bank’s plan could be implemented in a timely and effective manner in a crisis situation. The lack of usability of some recovery plans can be related to their size, their complexity or the fact that the information they include is sometimes scattered throughout the plan. This makes it challenging for the bank’s management to take swift decisions on the basis of the recovery plan, especially under time pressure. A simple comparison of the size of SIs’ recovery plans (see Chart 8) suggests that some plans might be too large to actually be used in a crisis.46 Moreover, some banks with crisis management experience have observed that inadequate integration of the recovery plan processes within the organisation can further undermine the usability of the recovery plan.
Chart 8 Benchmarking analysis – size of recovery plans (in number of pages)
Source: Based on recovery plan data from the standardised reporting templates submitted by SIs in 2016.
Developing a playbook or performing dry-run exercises are not mandatory activities and banks may use different approaches to making their plans more usable.
45 Articles 5(6) and 6(2)(b) of the BRRD; and Article 19(1) of the Delegated Regulation. 46 As already communicated following the previous benchmarking analysis, the ECB has reviewed its
comments on recovery plans with a view to not contributing to an increase in the size of recovery plans, where possible. As part of that review, the option of cross-referencing to information which has already been submitted to resolution authorities will be considered in the future, with the aim of shortening recovery plans pursuant to Article 13 of the Delegated Regulation.
0
500
1,000
1,500
2,000
corporate/wholesale lenderdiversified lenderG-SIBretail lendersmall domestic lender
sectoral lendercustodian and AMuniversal banknot classified

Report on recovery plans – Recovery plans: playbooks and dry runs 33
5.1 Playbooks – facilitating the usability of recovery plans during a crisis situation
A playbook47 is understood as a concise implementation guide48 for the recovery plan that promotes swift and effective decision-making by the bank’s management and the timely implementation of one or more recovery options, if relevant.
In order to be effective, it is important that a playbook strikes a balance between providing all the relevant information while allowing the bank’s management to easily and quickly digest and navigate through the information.
The ECB has identified the following aspects as indicative of good playbooks.49
Clear crisis management governance
A playbook usually presents roles, escalation procedures and reaction timelines, i.e. who is responsible for doing what, by when and where, and who is responsible for escalating issues and to whom. This could be presented, for example, using a concise flowchart with information about who is responsible for (i) calling a crisis management meeting, (ii) making decisions, and (iii) gathering and preparing key information as well as timelines (with clear deadlines).
Swift and effective decision-making processes
A playbook could also present clearly defined decision-making processes that can ensure that decisions can be taken swiftly and effectively during a crisis. Key elements that could be covered include:
• Standard agenda points for the first meeting of the management board in “crisis mode”, where it has to decide on whether to activate the playbook. Table 7 illustrates how such an agenda could look.
47 The ECB’s preferred term is “playbook”, as this is the most commonly used term within the banking
regulation community. However, many other terms can be used, for example “run book” or “quick guide”.
48 In line with the principle of proportionality, a playbook can only be effective if it is tailored to the needs of the bank and useful for its management board. So a bank’s playbook can take different forms: it can be a separate document, integrated into the recovery plan as part of the executive summary, or have its own dedicated chapter/annex within the plan. The ECB has no preference for how a playbook is linked to the recovery plan. Regardless of the form it takes, a playbook is a dynamic document that needs to be maintained and updated regularly.
49 These are not supervisory requirements, but merely examples of good practices.

Report on recovery plans – Recovery plans: playbooks and dry runs 34
Table 7 Example of potential agenda items
No Agenda point Person to act
1 Summarise current situation (potential severity, known facts) Person/function X
2 Discuss relevant report summarising the situation, including the following aspects: Person/function Y
I Status of indicators
II Possible causes for recovery indicators breaching threshold(s)
III Comprehensive information on specific weaknesses
IV Assessment of possible crisis scenarios and the consequences thereof
V Initial assessment of possible measures to be taken
VI Summary of the potential immediate consequences of the decision to initiate crisis processes/recovery options
VII Advice on whether disclosure is necessary
3 Take a decision based on the operating environment, the financial position, viability and recoverability
Person/function Y
4 Document the decision of whether or not to activate the recovery plan in the minutes along with supporting arguments
Person/function Z
5 If decision is made to initiate the recovery plan, implement crisis processes/playbook Person/function Y
Source: Based on compilation of best practices adopted by several SIs. Note: All data are fictitious.
• Standard agenda points for ensuing meetings of teams/committees/functions tasked with investigating the situation further, if needed (e.g. for the following topics: capital, liquidity, IT/operations, communication, legal/compliance and logistics/assistance).
• Standard agenda items for follow-up meetings of the management board if a decision was not or could not be taken in the first meeting.
• An easy-to-digest table which summarises, for the main recovery options: (i) the impact on capital and liquidity, (ii) the expected implementation timeline, and (iii) the likely success rate in a stress situation (based on previous experiences or expert judgement). Table 8 provides an example of how this information could be presented in a useful way, and there are further examples in Chapter 2 of this report.

Report on recovery plans – Recovery plans: playbooks and dry runs 35
Table 8 Example of how to present an overview of recovery options
Option
Experience with
measure
Min - max impact capital (EUR
billions)
Min - max impact
liquidity (EUR
billions) Time to prepare
Time to implement
Applicability in stress
Applicability in stress
Responsible for
execution
Bank-specific System-wide
Fast Slow Fast Slow
A Practical experience
2,378 - 2,726
150 - 210 3 months 2 weeks Treasury
B Practical experience
174 - 1,189 400 - 420 1 day O/N Treasury
C Practical experience
1,493.5 - 3,175.5
3,260 - 6,500
< 1 month < 4 weeks Treasury
D Theoretical experience
4,306.5 - 6,380
9,800 - 13,000
< 1 month < 4 weeks Treasury
E No experience
1,740 - 1,131
3,600 - 4,300
< 2 month < 1 week Management Board
F Theoretical experience
58 - 217.5 100 - 400 O/N O/N Management Board
G Practical experience
667 - 1,899.5
n.a. - n.a. < 4 month < 1 week Management Board
H Theoretical experience
116 - 319 0 - 400 < 2 weeks < 1 day Management Board
I Practical experience
0 - 478.5 0 - 17,000 < 2 days < 2 weeks Treasury
J No experience
275.5 - 275.5
n.a. - n.a. < 1 week < 1 day Treasury
K Practical experience
275.5 - 420.5
1900 - 2,180
< 1 month < 1 day HR
L Practical experience
232 - 304.5 12,000 - 15,000
< 1 month < 4 weeks Treasury
Source: Based on compilation of best practices adopted by several SIs. Notes: All data are fictitious. Applicability ranges from very fast (dark green) to very slow (dark red).
• A list of who is responsible for assessing whether the latest developments require changes to:
• the list of available recovery options (for instance, because certain options were used before the recovery indicator breach);
• the assumptions made about the impact of the options (including on the bank’s business model), their implementation timelines and any impediments to implementing them.
A timeline for those responsible to assess potential changes and present them to the management board could also be included, as this is essential information for the board to be able to make effective decisions when selecting the recovery options.

Report on recovery plans – Recovery plans: playbooks and dry runs 36
• A list of items on which the management board has to take a decision once it has decided to implement one or more recovery options, such as:
• an action list for the first 48 hours, including who is responsible for implementing which action point at what time;
• whether to disclose or delay communication on implementing the option (see also below).
Key information about the relevant stakeholders
A playbook could also provide a contact list which includes the names, functions and contact details for relevant internal and external stakeholders, who may include the staff of the teams/committees supporting the management board in managing the crisis, the board members of the bank’s subsidiaries and the supervisors.
Communication
A playbook could also cover communication elements in order to ensure that critical communication requirements and strategies are identified. Special focus could be given to immediate requirements that may run in parallel to the information-gathering and decision-making processes (e.g. social media).
It could also identify internal and external stakeholders who are relevant from a communications perspective, including customer-facing staff, and establish specific communication requirements for recovery options, where relevant.
The playbook could also contain guidance on the potential information disclosure requirements and possible options for delaying disclosure, including an assessment of the bank’s disclosure requirements related to recovery indicators being breached and in case of recovery options being activated.
Quick reference to the recovery plan
To make it easy for the management board and relevant staff to quickly navigate the recovery plan and find relevant information, it could be useful to include an overview of the building blocks of the recovery plan and links to where crucial information in the recovery plan can be found.
5.2 Dry runs – testing whether the processes for implementing the recovery plan can work when needed
Dry-run exercises are “live” simulation exercises where banks test (selected) key parts of their recovery plan based on a test crisis event.

Report on recovery plans – Recovery plans: playbooks and dry runs 37
5.2.1 Purpose, design and scope of dry runs
The purpose of dry runs is (i) to test and demonstrate whether the selected key parts of the recovery plan could be implemented in a timely and effective manner in situations of financial stress, (ii) to train relevant staff to achieve and maintain proficiency in reacting to crisis situations using the recovery plan (based on a simulated event), and (iii) to identify areas for improvement.
The ECB’s experience has shown that dry runs are usually designed to test one or more of the following four key areas:
• escalation and decision-making procedures, including coordination between the parent organisation and its subsidiaries;
• whether sufficient information for decision-making is immediately available, including from management information systems;
• operational aspects, e.g. testing whether the assumed timelines for implementing the most relevant options are plausible (based on simulated activation);
• whether there are fast, reliable communication strategies for both external and internal stakeholders, even when they only have access to limited information and must act within a short period of time.
Experience of dry-run tests of banks’ recovery plans has shown that using these plans in a “real time”, live, stressed simulation for the first time is often challenging. Further, while specific elements of banks’ recovery plans may already have been tested in different contexts (e.g. business continuity of technical components, such as IT services), these tests usually only focus on individual and often technical sub-areas.
In contrast, recovery plan dry runs usually go one step further and have a broader scope. They test whether the bank would be able to operationalise and coordinate multiple crisis reaction processes when the viability of the whole bank is at risk. Dry runs usually simulate very fast-moving shocks, when decisions must be made on the basis of imperfect information and all relevant stakeholders in the organisation are involved. In short, dry runs simulate a potential real crisis situation.
For example, dry runs can be very useful for testing a bank’s preparedness to deal with severe IT/cyber-related incidents, as such events are usually very fast-moving and require an immediate reaction from the bank (including a good communication plan), and may require options that can be implemented quickly. Depending on their size and complexity, banks can take a proportionate approach to choosing whether a dry run is suitable for them, which aspects of their recovery plan they want to test, how they want to conduct these tests and how often.

Report on recovery plans – Recovery plans: playbooks and dry runs 38
5.2.2 The following best practice principles have been identified:
Clear ownership
Experience has shown that successful dry runs have the support and active participation of the bank’s management body.
Defined scope and objective
Experience has shown that it is important that the scope and objective of the dry run are clearly defined and communicated in advance to the management body. For the initial exercise(s) in particular, it is recommended that the scope of the dry run is not too broad. For example, it is considered a good starting point to test whether the escalation or decision-making procedures work effectively. As recovery planning becomes more integrated into the governance of the bank, dry runs can evolve into broader simulation exercises and involve more content-oriented exercises.
Proper preparation
Dry-run exercises require adequate preparation to ensure that the assumptions underpinning the simulation are sufficiently detailed. Input from specialists in each business area can prove useful for this preparation.
Prior awareness and clear communication
Experience has shown that informing everyone involved in the dry run in advance that a dry run will take place helps to avoid rumours that could cause negative market reactions. Particular consideration of the communication aspects of the dry run is therefore essential. Where supervisory involvement would be needed in the real-life scenario (such as notifying the competent authority of an indicator being breached), this communication could be tested as well.
Realistic, stressed timelines during the exercise
Setting realistic timelines that fit the scope of the exercise and are adhered to is important in order to create a realistic, stressed test environment.

Report on recovery plans – Recovery plans: playbooks and dry runs 39
Independent observers
The presence during the dry run of an independent observer, such as the internal audit function, an independent executive director or an external party, can make the assessment of the outcome of the exercise more objective.
Timely follow-up
An adequate, timely follow-up that addresses the deficiencies identified by the dry run is essential for improving the usability of the bank’s recovery plan. In particular, banks are encouraged to identify specific follow-up actions to address deficiencies (including preparatory measures, where relevant) and incorporate the related improvements into their updated recovery plans.
Time allowed for integration into the regular update process
The time needed to incorporate the findings/corrective actions from the dry run into the regular recovery plan update process could be considered when deciding when the dry run will take place.
Regular recurrence
Dry-run exercises are most effective when carried out on a regular basis, e.g. annually. One best practice that some banks have adopted is drawing up a road map for topics of future dry runs.
Timely communication of the outcome to the supervisor
Communication of the outcome of the dry run to the supervisor has proven to be effective. The key information could be included in the recovery plan itself (e.g. in the form of a concise appendix).This can include details on (i) the design and operationalisation of the exercise, (ii) a self-assessment about what worked and what needs to be improved further, including the lessons learned, (iii) planned follow-up actions, and (iv) deadlines.

Report on recovery plans – Conclusion: recovery planning is a continuous effort 40
6 Conclusion: recovery planning is a continuous effort
As a final point, the ECB highlights that, under the EU legal framework, recovery planning is designed to be an ongoing process. It does not stop once the bank’s management has approved the recovery plan but requires adequate maintenance of the plan. The overarching goal of both banks and supervisors is to achieve and maintain adequate preparedness for exceptional but plausible severe stress events.
Going forward, the ECB’s main focus when assessing recovery plans will be on ensuring that they can fulfil their purpose of enhancing the resilience of banks. Having operational and effective recovery plans in place is crucial for enhancing the European crisis management framework and, thus, is a priority for supervisors.

Report on recovery plans – Annex 41
7 Annex
7.1 Standardised reporting template
In 2015 the ECB introduced a standardised template for SIs in order to improve the quality and consistency of reported recovery plan data. The template is based on experience with existing national templates.
The standardised reporting template is limited to the existing minimum requirements and reflects the mandatory data for recovery plans in a structured way. It does not set additional requirements (i.e. it provides a full set of data fields for ease of use but only the applicable fields have to be filled in) and is limited to the core parts of recovery plans. It also only ensures consistent coverage of quantitative aspects of recovery plans.
The standardised template is beneficial for both banks and supervisors and has been designed to minimise data burden. The template is prefilled as much as possible to make it easier to complete (e.g. the EBA indicator list, regulatory reporting references and the automatic updating of values from other templates), and inputs are standardised to ensure that the reported data are unambiguous and to minimise the need for follow-up clarifications.
Overall, the analysis indicates that the data quality of recovery plans in the submission cycles following the introduction of the template has improved significantly.
© European Central Bank, 2018
Postal address 60640 Frankfurt am Main, Germany Telephone +49 69 1344 0 Website www.ecb.europa.eu
All rights reserved. Reproduction for educational and non-commercial purposes is permitted provided that the source is acknowledged.
For specific terminology please refer to the SSM glossary.


