12/1/13 1 ECG Filtering Willem Einthoven’s EKG machine, 1903 ECG Filtering Three common noise sources Baseline wander Power line interference Muscle noise When filtering any biomedical signal care should be taken not to alter the desired information in any way A major concern is how the QRS complex influences the output of the filter; to the filter they often pose a large unwanted impulse Possible distortion caused by the filter should be carefully quantified
Transcript
12/1/13
1
ECG Filtering
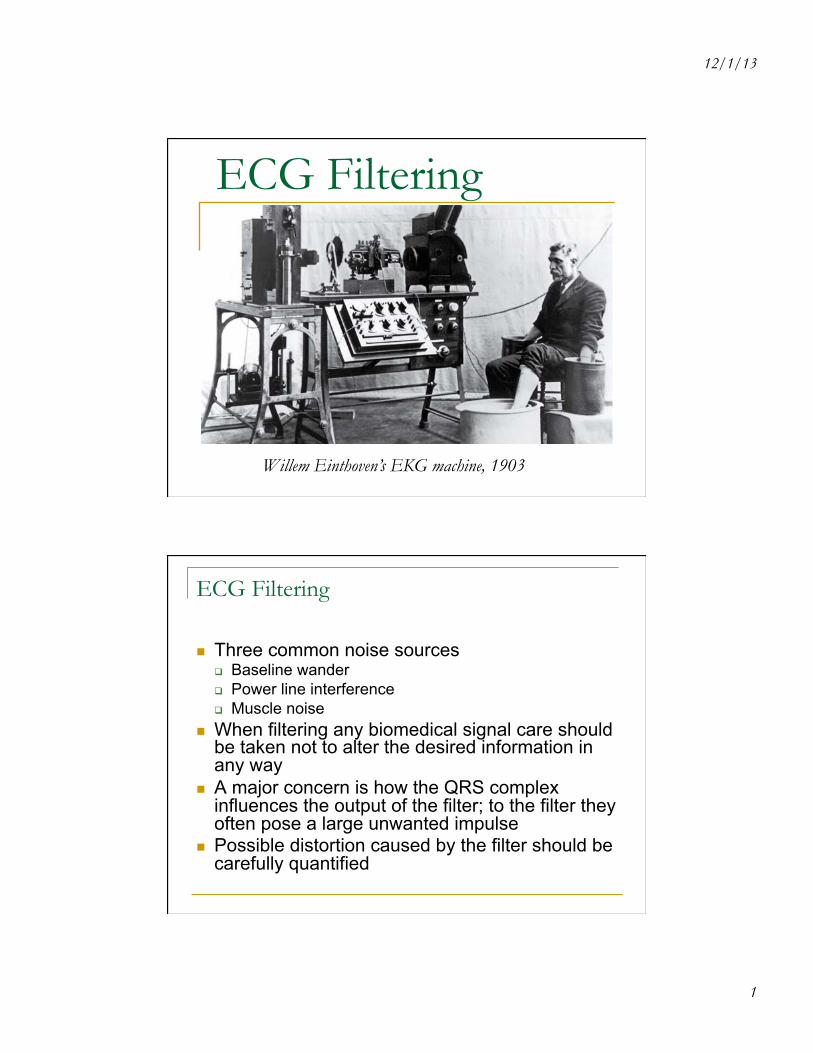
Willem Einthoven’s EKG machine, 1903
ECG Filtering
n Three common noise sources q Baseline wander q Power line interference q Muscle noise
n When filtering any biomedical signal care should be taken not to alter the desired information in any way
n A major concern is how the QRS complex influences the output of the filter; to the filter they often pose a large unwanted impulse
n Possible distortion caused by the filter should be carefully quantified
12/1/13
2
Baseline Wander
Baseline Wander
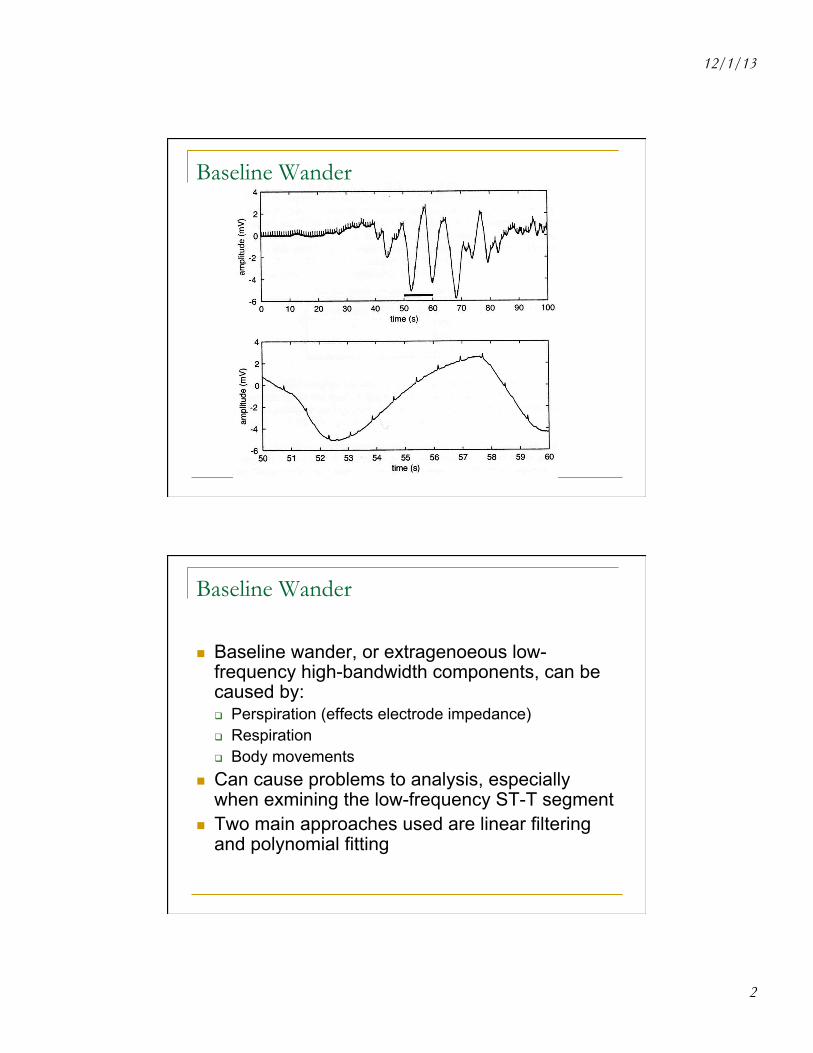
n Baseline wander, or extragenoeous low-frequency high-bandwidth components, can be caused by: q Perspiration (effects electrode impedance) q Respiration q Body movements
n Can cause problems to analysis, especially when exmining the low-frequency ST-T segment
n Two main approaches used are linear filtering and polynomial fitting
12/1/13
3
BW – Linear, time-invariant filtering
n Basically make a highpass filter to cut of the lower-frequency components (the baseline wander)
n The cut-off frequency should be selected so as to ECG signal information remains undistorted while as much as possible of the baseline wander is removed; hence the lowest-frequency component of the ECG should be saught.
n This is generally thought to be definded by the slowest heart rate. The heart rate can drop to 40 bpm, implying the lowest frequency to be 0.67 Hz. Again as it is not percise, a sufficiently lower cutoff frequency of about 0.5 Hz should be used.
n A filter with linear phase is desirable in order to avoid phase distortion that can alter various temporal realtionships in the cardiac cycle
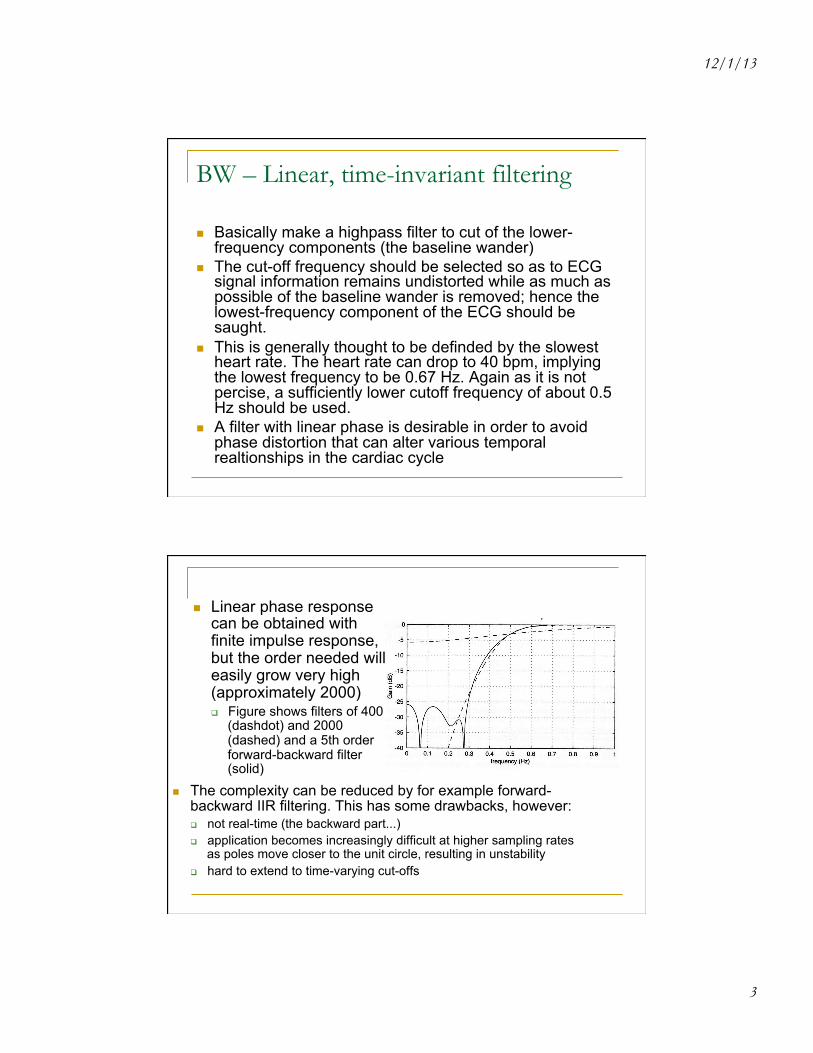
n Linear phase response can be obtained with finite impulse response, but the order needed will easily grow very high (approximately 2000) q Figure shows filters of 400
(dashdot) and 2000 (dashed) and a 5th order forward-backward filter (solid)
n The complexity can be reduced by for example forward-backward IIR filtering. This has some drawbacks, however: q not real-time (the backward part...) q application becomes increasingly difficult at higher sampling rates
as poles move closer to the unit circle, resulting in unstability q hard to extend to time-varying cut-offs
12/1/13
4
n Another way of reducing filter complexity is by first decimating and then again interpolating the signal
n Decimation removes the high-frequency content, and now a lowpass filter can be used to output an estimate of the baseline wander
n The estimate is interpolated back to the original sampling rate and subtracted from the original signal
BW – Linear, time-variant filtering
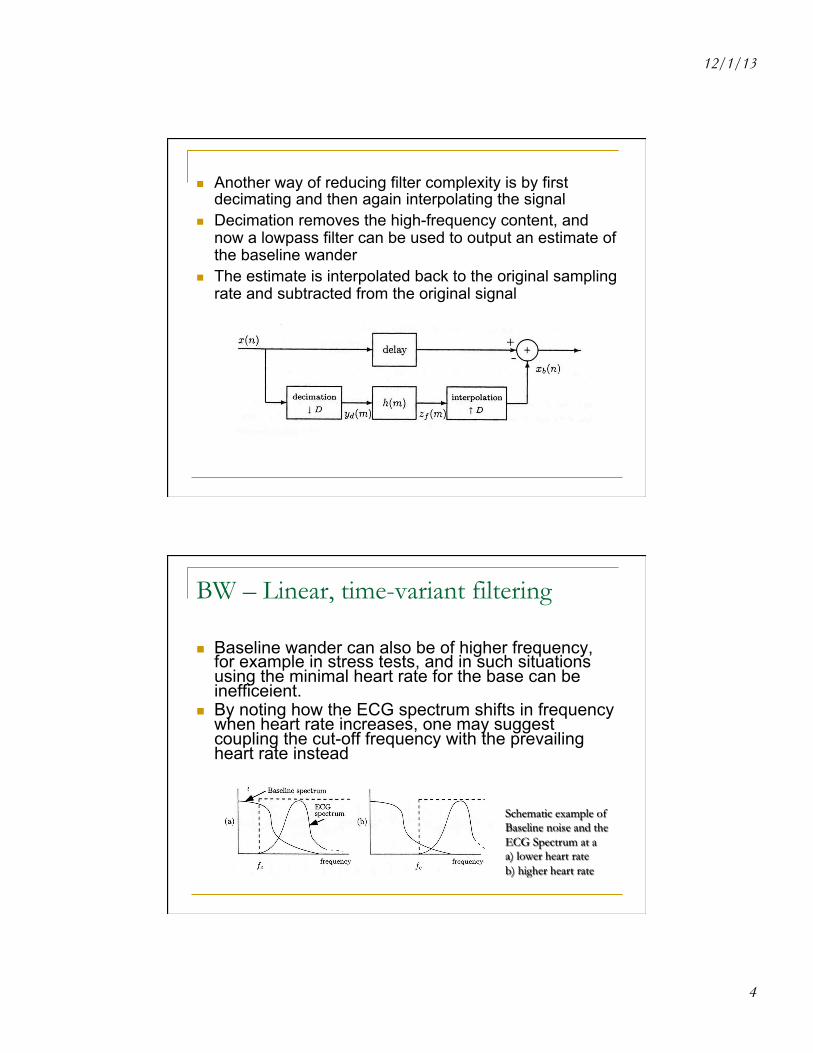
n Baseline wander can also be of higher frequency, for example in stress tests, and in such situations using the minimal heart rate for the base can be inefficeient.
n By noting how the ECG spectrum shifts in frequency when heart rate increases, one may suggest coupling the cut-off frequency with the prevailing heart rate instead
Schematic example of Baseline noise and the ECG Spectrum at a a) lower heart rate b) higher heart rate
12/1/13
5
n Time-varying cut-off frequency should be inversely proportional to the distance between the RR peaks q In practise an upper limit must be set to avoid distortion in very
short RR intervals n A single prototype filter can be designed and subjected
to simple transformations to yield the other filters
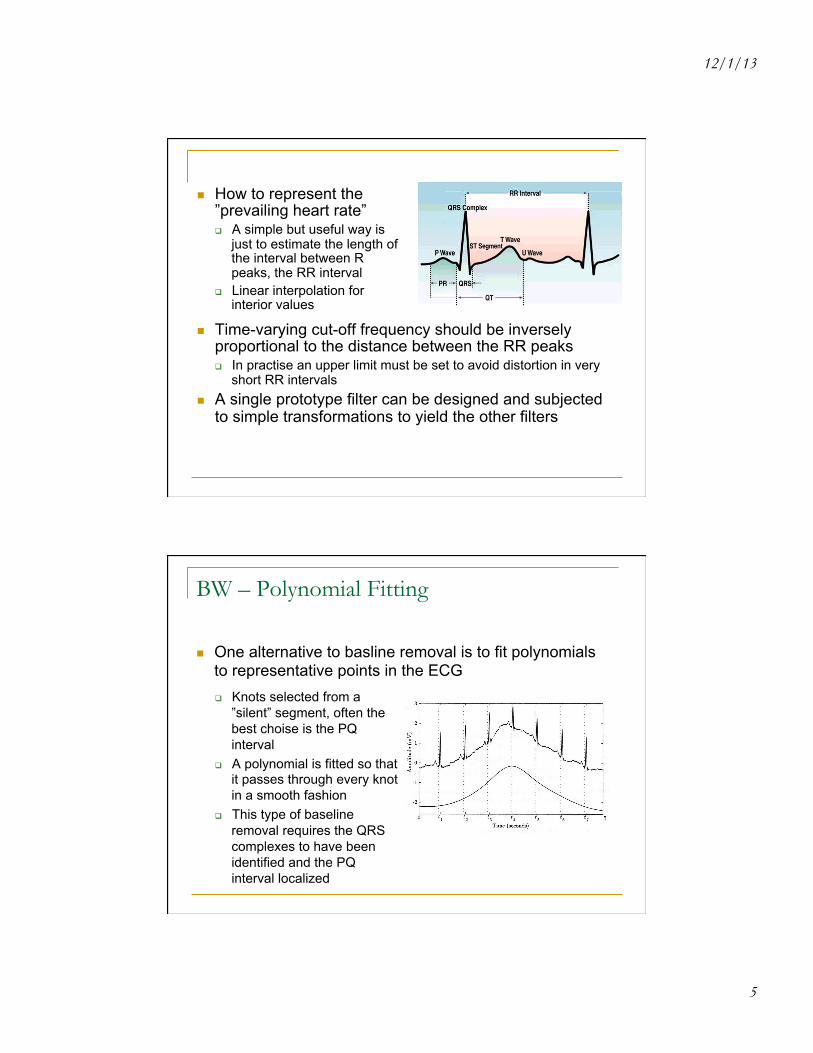
n How to represent the ”prevailing heart rate” q A simple but useful way is
just to estimate the length of the interval between R peaks, the RR interval
q Linear interpolation for interior values
BW – Polynomial Fitting
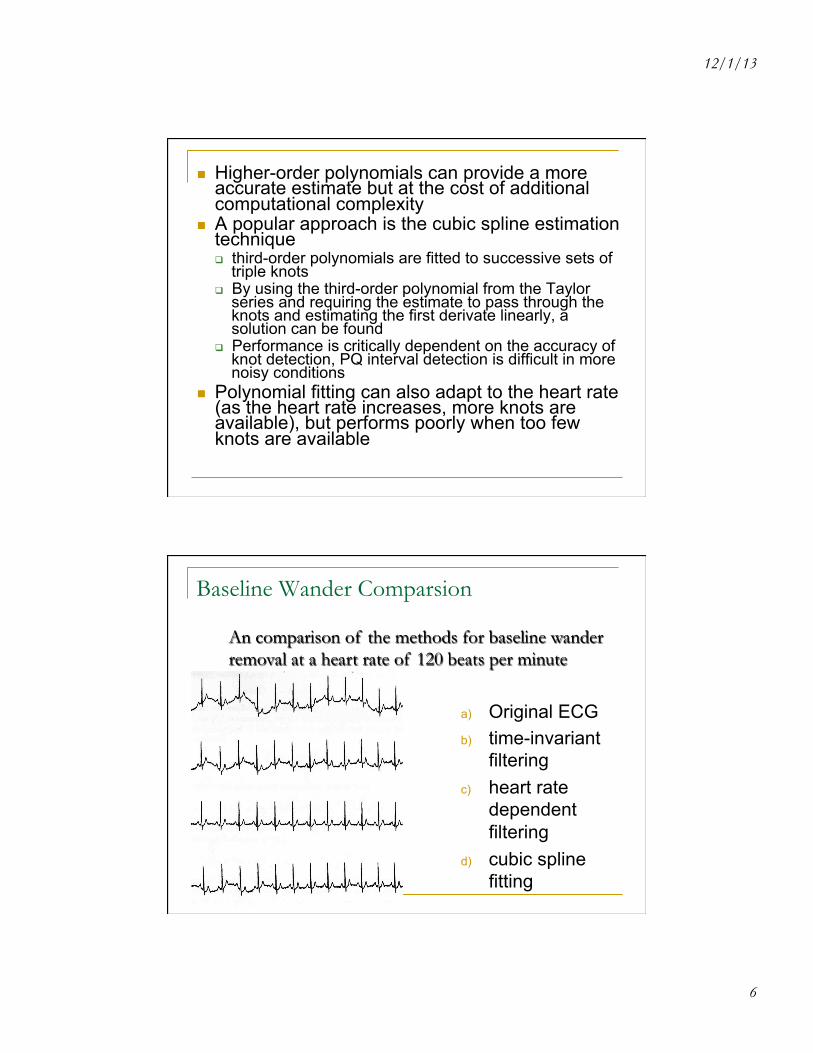
n One alternative to basline removal is to fit polynomials to representative points in the ECG q Knots selected from a
”silent” segment, often the best choise is the PQ interval
q A polynomial is fitted so that it passes through every knot in a smooth fashion
q This type of baseline removal requires the QRS complexes to have been identified and the PQ interval localized
12/1/13
6
n Higher-order polynomials can provide a more accurate estimate but at the cost of additional computational complexity
n A popular approach is the cubic spline estimation technique q third-order polynomials are fitted to successive sets of
triple knots q By using the third-order polynomial from the Taylor
series and requiring the estimate to pass through the knots and estimating the first derivate linearly, a solution can be found
q Performance is critically dependent on the accuracy of knot detection, PQ interval detection is difficult in more noisy conditions
n Polynomial fitting can also adapt to the heart rate (as the heart rate increases, more knots are available), but performs poorly when too few knots are available
Baseline Wander Comparsion
a) Original ECG b) time-invariant
filtering c) heart rate
dependent filtering
d) cubic spline fitting
An comparison of the methods for baseline wander removal at a heart rate of 120 beats per minute
12/1/13
7
Power Line Interference
n Electromagnetic fields from power lines can cause 60 Hz sinusoidal interference, possibly accompanied by some of its harmonics
n Such noise can cause problems interpreting low-amplitude waveforms and spurious waveforms can be introduced.
n Naturally precautions should be taken to keep power lines as far as possible or shield and ground them, but this is not always possible
PLI – Linear Filtering
n A very simple approach to filtering power line interference is to create a filter defined by a comple-conjugated pair of zeros that lie on the unit circle at the interfering frequency ω0 q This notch will of course also attenuate ECG
waveforms constituted by frequencies close to ω0 q The filter can be improved by adding a pair of
complex-conjugated poles positioned at the same angle as the zeros, but at a radius. The radius then determines the notch bandwidth.
q Another problem presents; this causes increased transient response time, resulting in a ringing artifact after the transient
12/1/13
8
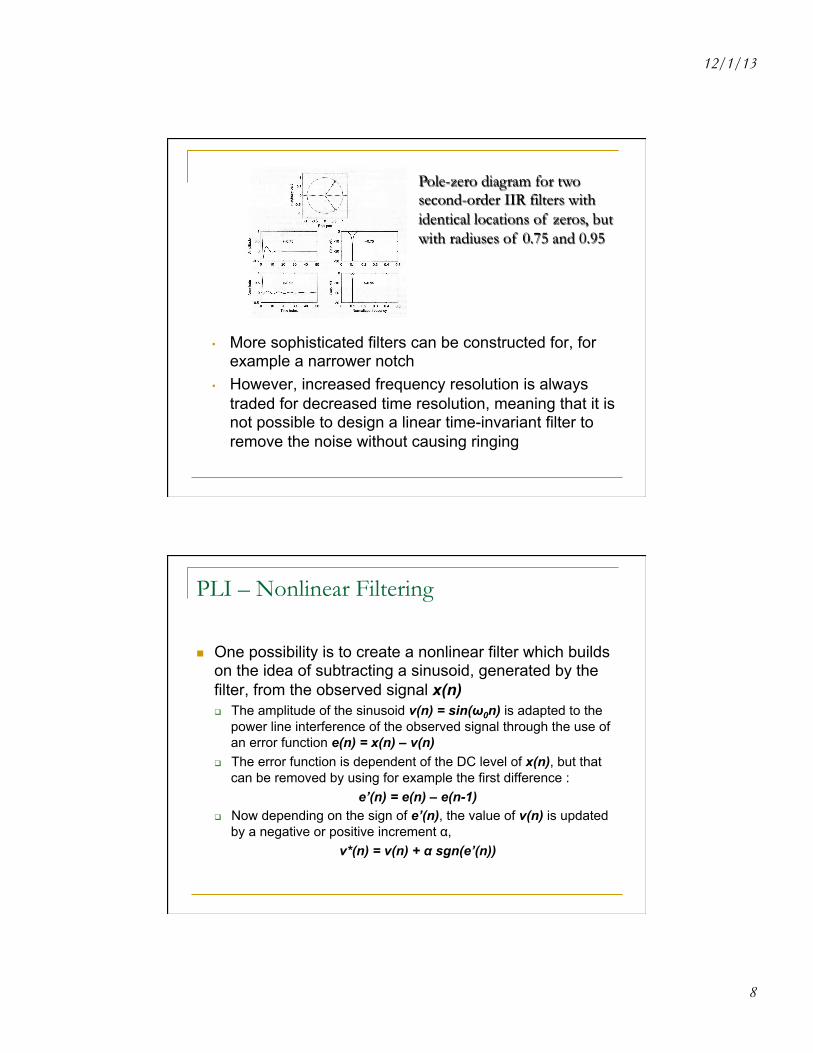
• More sophisticated filters can be constructed for, for example a narrower notch
• However, increased frequency resolution is always traded for decreased time resolution, meaning that it is not possible to design a linear time-invariant filter to remove the noise without causing ringing
Pole-zero diagram for two second-order IIR filters with identical locations of zeros, but with radiuses of 0.75 and 0.95
PLI – Nonlinear Filtering
n One possibility is to create a nonlinear filter which builds on the idea of subtracting a sinusoid, generated by the filter, from the observed signal x(n) q The amplitude of the sinusoid v(n) = sin(ω0n) is adapted to the
power line interference of the observed signal through the use of an error function e(n) = x(n) – v(n)
q The error function is dependent of the DC level of x(n), but that can be removed by using for example the first difference :
e’(n) = e(n) – e(n-1) q Now depending on the sign of e’(n), the value of v(n) is updated
by a negative or positive increment α, v*(n) = v(n) + α sgn(e’(n))
12/1/13
9
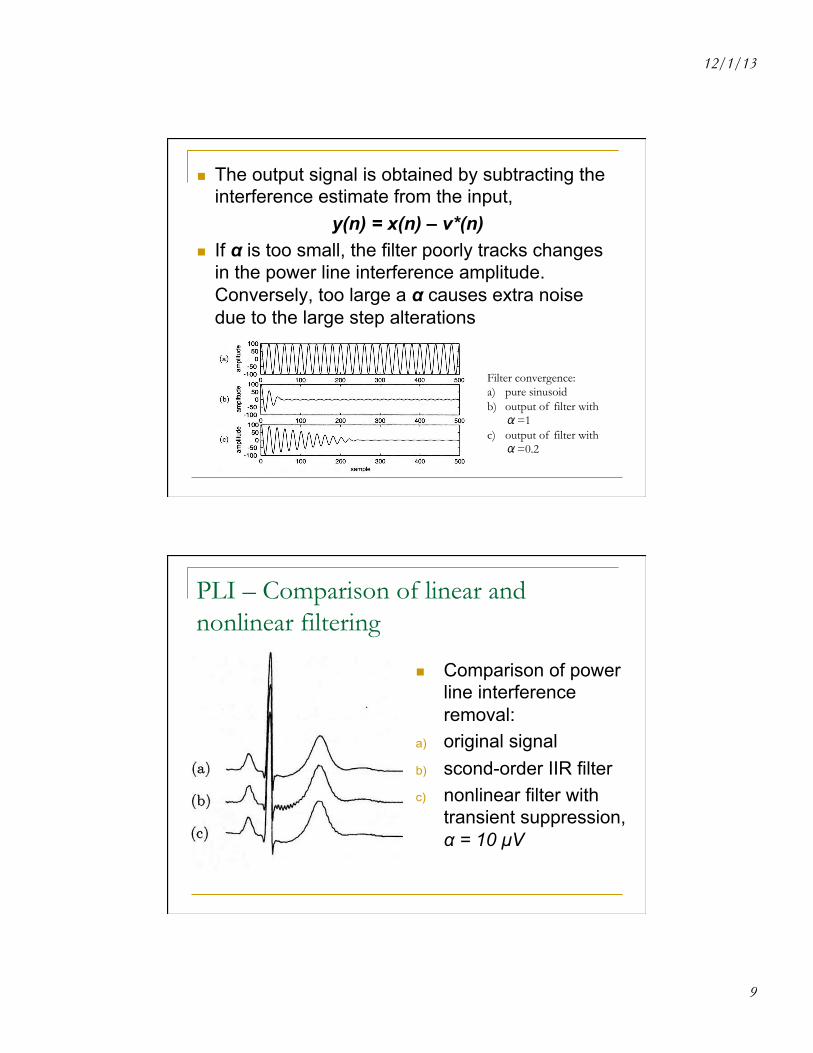
n The output signal is obtained by subtracting the interference estimate from the input,
y(n) = x(n) – v*(n) n If α is too small, the filter poorly tracks changes
in the power line interference amplitude. Conversely, too large a α causes extra noise due to the large step alterations
Filter convergence: a) pure sinusoid b) output of filter with α=1
c) output of filter with α=0.2
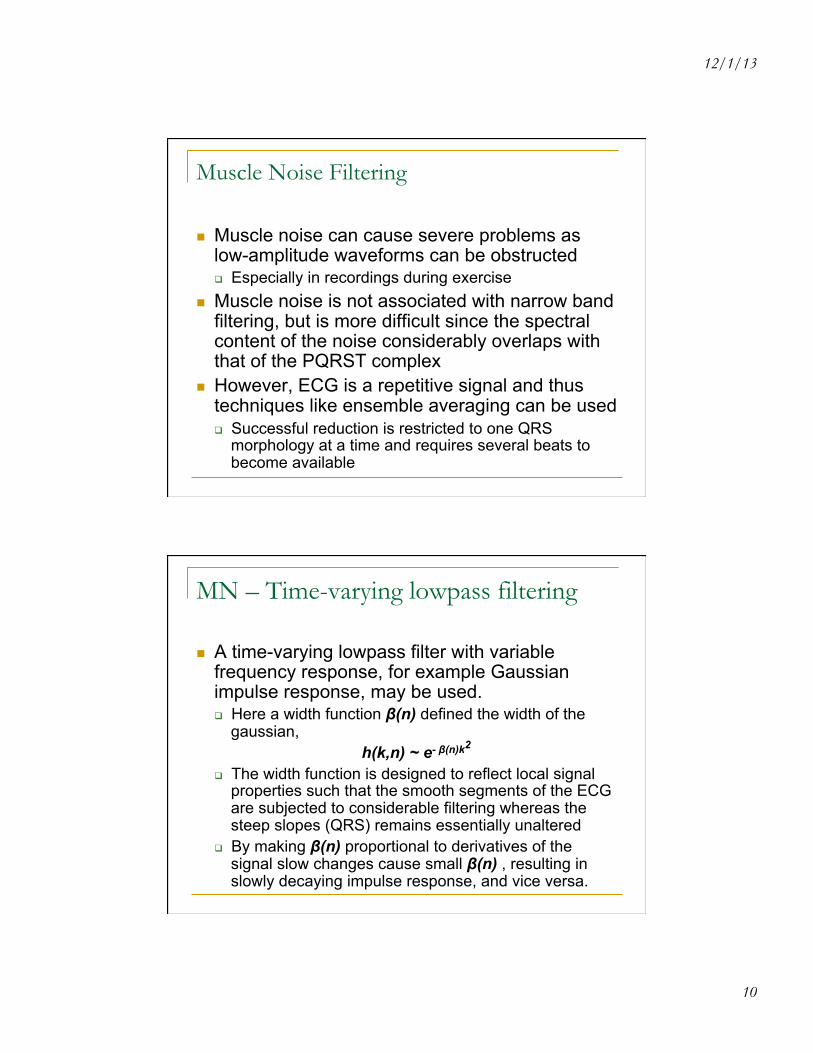
PLI – Comparison of linear and nonlinear filtering
n Comparison of power line interference removal:
a) original signal b) scond-order IIR filter c) nonlinear filter with
transient suppression, α = 10 µV
12/1/13
10
Muscle Noise Filtering
n Muscle noise can cause severe problems as low-amplitude waveforms can be obstructed q Especially in recordings during exercise
n Muscle noise is not associated with narrow band filtering, but is more difficult since the spectral content of the noise considerably overlaps with that of the PQRST complex
n However, ECG is a repetitive signal and thus techniques like ensemble averaging can be used q Successful reduction is restricted to one QRS
morphology at a time and requires several beats to become available
MN – Time-varying lowpass filtering
n A time-varying lowpass filter with variable frequency response, for example Gaussian impulse response, may be used. q Here a width function β(n) defined the width of the
gaussian, h(k,n) ~ e- β(n)k2
q The width function is designed to reflect local signal properties such that the smooth segments of the ECG are subjected to considerable filtering whereas the steep slopes (QRS) remains essentially unaltered
q By making β(n) proportional to derivatives of the signal slow changes cause small β(n) , resulting in slowly decaying impulse response, and vice versa.
12/1/13
11
MN – Other considerations
n Also other already mentioned techniques may be applicable; q the time-varying lowpass filter examined with baseline
wander q the method for power line interference based on
trunctated series expansions n However, a notable problem is that the methods
tend to create artificial waves, little or no smoothing in the QRS complex or other serious distortions
n Muscle noise filtering remains largely an unsolved problem
Conclusions
n Both baseline wander and powerline interference removal are mainly a question of filtering out a narrow band of lower-than-ECG frequency interference. q The main problems are the resulting artifacts and how to
optimally remove the noise n Muscle noise, on the other hand, is more difficult as it
overlaps with actual ECG data n For the varying noise types (baseline wander and muscle
noise) an adaptive approach seems quite appropriate, if the detection can be done well. For power line interference, the nonlinear approach seems valid as ringing artifacts are almost unavoidable otherwise
12/1/13
12
Arrhythmias
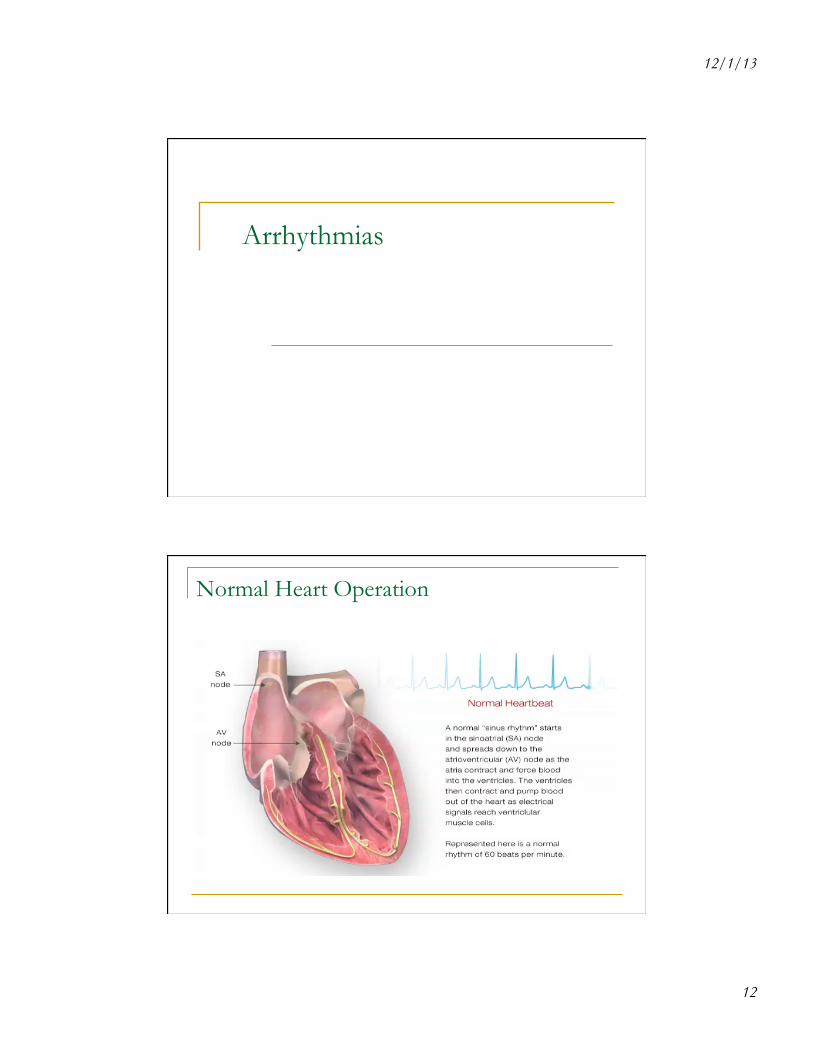
Normal Heart Operation
12/1/13
13
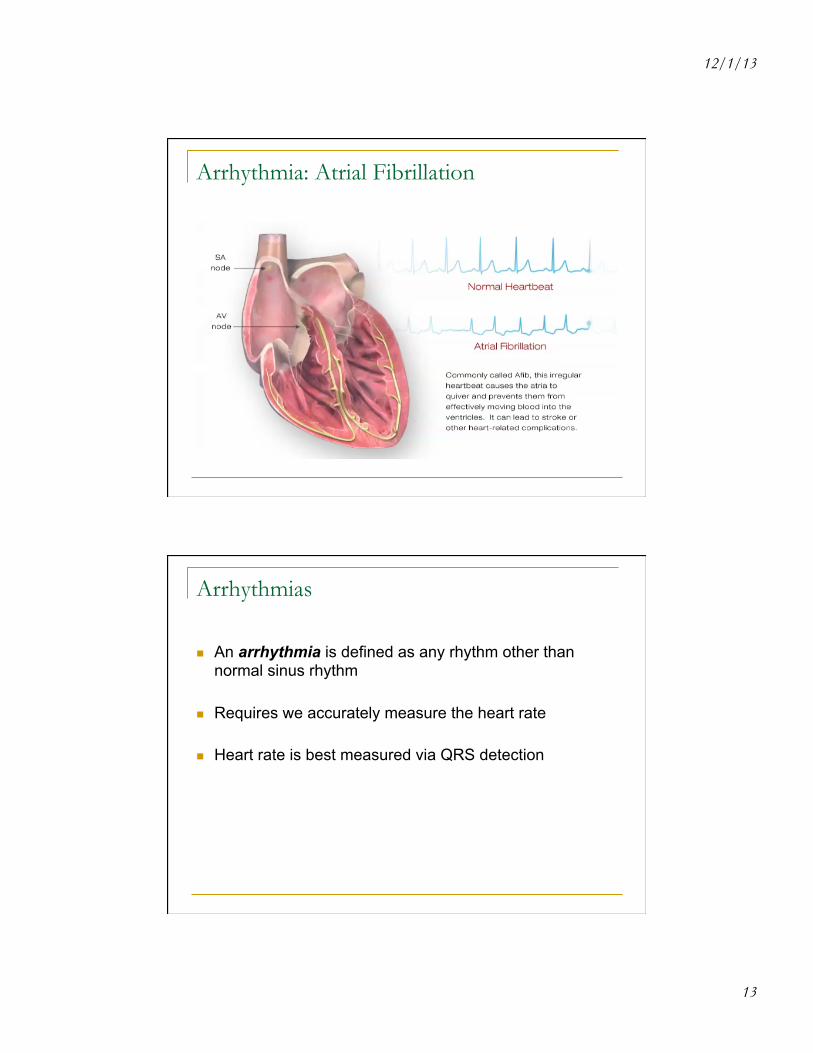
Arrhythmia: Atrial Fibrillation
Arrhythmias
n An arrhythmia is defined as any rhythm other than normal sinus rhythm
n Requires we accurately measure the heart rate
n Heart rate is best measured via QRS detection
12/1/13
14
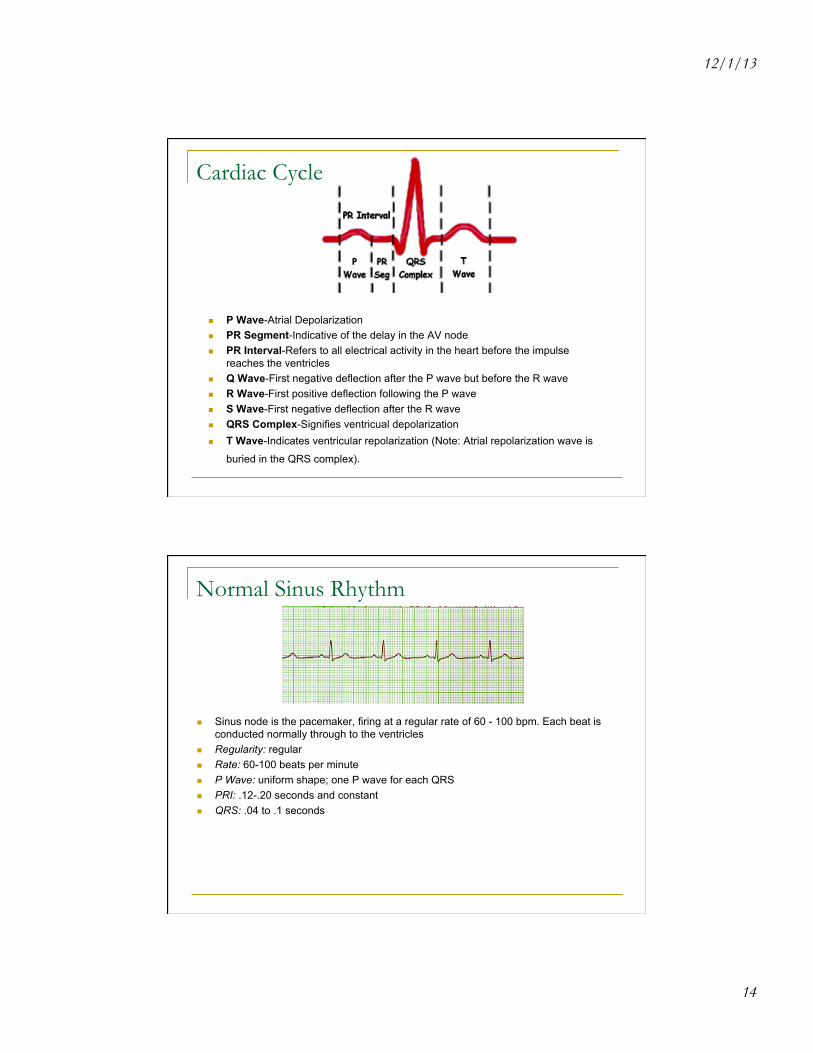
Cardiac Cycle
n P Wave-Atrial Depolarization n PR Segment-Indicative of the delay in the AV node n PR Interval-Refers to all electrical activity in the heart before the impulse
reaches the ventricles n Q Wave-First negative deflection after the P wave but before the R wave n R Wave-First positive deflection following the P wave n S Wave-First negative deflection after the R wave n QRS Complex-Signifies ventricual depolarization n T Wave-Indicates ventricular repolarization (Note: Atrial repolarization wave is
buried in the QRS complex).
Normal Sinus Rhythm
n Sinus node is the pacemaker, firing at a regular rate of 60 - 100 bpm. Each beat is conducted normally through to the ventricles
n Regularity: regular n Rate: 60-100 beats per minute n P Wave: uniform shape; one P wave for each QRS n PRI: .12-.20 seconds and constant n QRS: .04 to .1 seconds
12/1/13
15
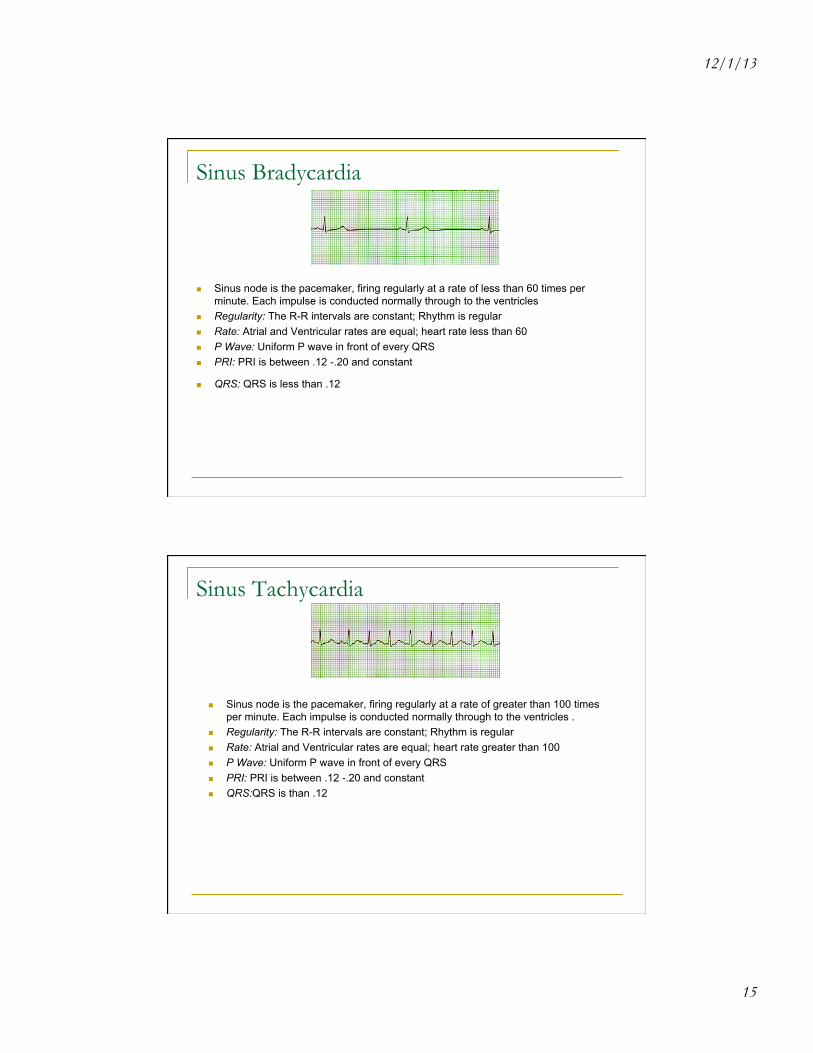
Sinus Bradycardia
n Sinus node is the pacemaker, firing regularly at a rate of less than 60 times per minute. Each impulse is conducted normally through to the ventricles
n Regularity: The R-R intervals are constant; Rhythm is regular n Rate: Atrial and Ventricular rates are equal; heart rate less than 60 n P Wave: Uniform P wave in front of every QRS n PRI: PRI is between .12 -.20 and constant
n QRS: QRS is less than .12
Sinus Tachycardia
n Sinus node is the pacemaker, firing regularly at a rate of greater than 100 times per minute. Each impulse is conducted normally through to the ventricles .
n Regularity: The R-R intervals are constant; Rhythm is regular n Rate: Atrial and Ventricular rates are equal; heart rate greater than 100 n P Wave: Uniform P wave in front of every QRS n PRI: PRI is between .12 -.20 and constant n QRS:QRS is than .12
12/1/13
16
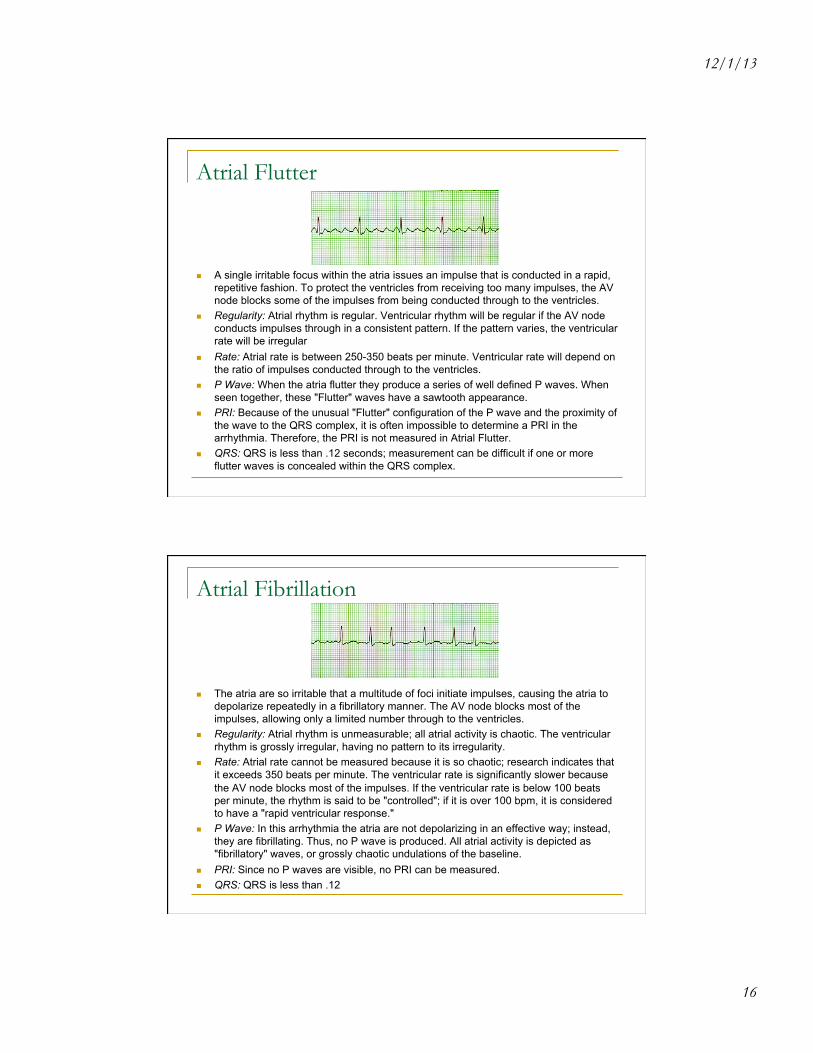
Atrial Flutter
n A single irritable focus within the atria issues an impulse that is conducted in a rapid, repetitive fashion. To protect the ventricles from receiving too many impulses, the AV node blocks some of the impulses from being conducted through to the ventricles.
n Regularity: Atrial rhythm is regular. Ventricular rhythm will be regular if the AV node conducts impulses through in a consistent pattern. If the pattern varies, the ventricular rate will be irregular
n Rate: Atrial rate is between 250-350 beats per minute. Ventricular rate will depend on the ratio of impulses conducted through to the ventricles.
n P Wave: When the atria flutter they produce a series of well defined P waves. When seen together, these "Flutter" waves have a sawtooth appearance.
n PRI: Because of the unusual "Flutter" configuration of the P wave and the proximity of the wave to the QRS complex, it is often impossible to determine a PRI in the arrhythmia. Therefore, the PRI is not measured in Atrial Flutter.
n QRS: QRS is less than .12 seconds; measurement can be difficult if one or more flutter waves is concealed within the QRS complex.
Atrial Fibrillation
n The atria are so irritable that a multitude of foci initiate impulses, causing the atria to depolarize repeatedly in a fibrillatory manner. The AV node blocks most of the impulses, allowing only a limited number through to the ventricles.
n Regularity: Atrial rhythm is unmeasurable; all atrial activity is chaotic. The ventricular rhythm is grossly irregular, having no pattern to its irregularity.
n Rate: Atrial rate cannot be measured because it is so chaotic; research indicates that it exceeds 350 beats per minute. The ventricular rate is significantly slower because the AV node blocks most of the impulses. If the ventricular rate is below 100 beats per minute, the rhythm is said to be "controlled"; if it is over 100 bpm, it is considered to have a "rapid ventricular response."
n P Wave: In this arrhythmia the atria are not depolarizing in an effective way; instead, they are fibrillating. Thus, no P wave is produced. All atrial activity is depicted as "fibrillatory" waves, or grossly chaotic undulations of the baseline.
n PRI: Since no P waves are visible, no PRI can be measured. n QRS: QRS is less than .12
12/1/13
17
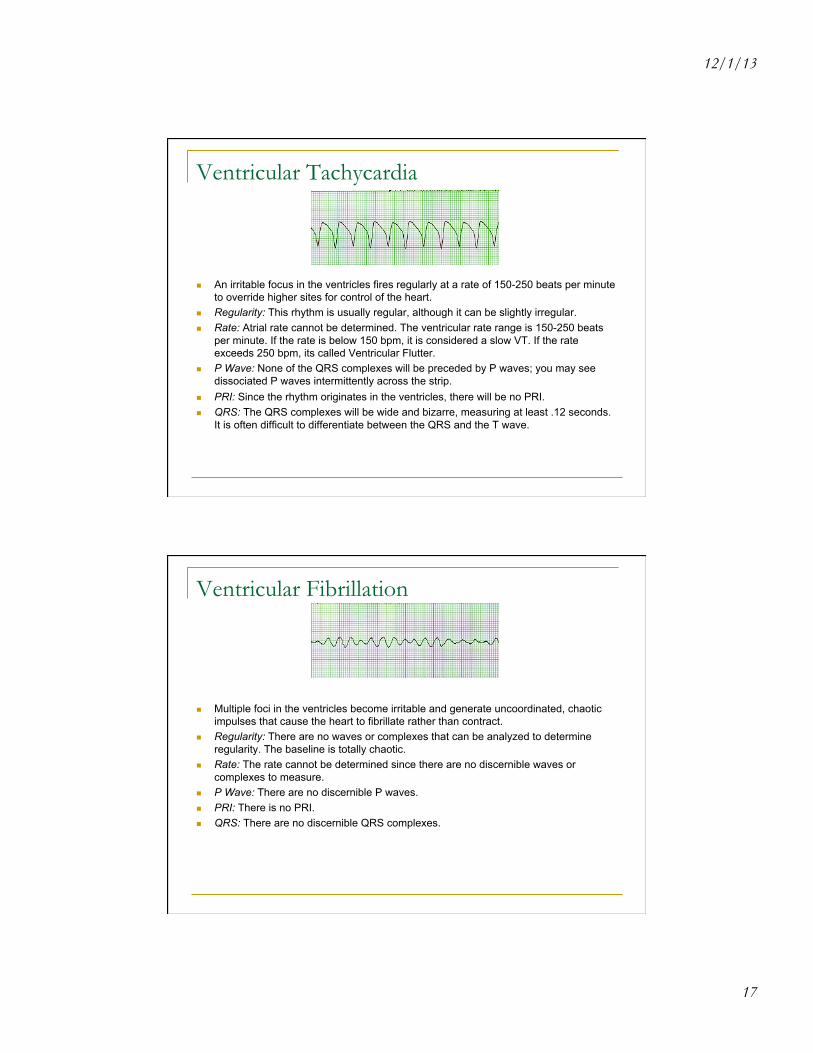
Ventricular Tachycardia
n An irritable focus in the ventricles fires regularly at a rate of 150-250 beats per minute to override higher sites for control of the heart.
n Regularity: This rhythm is usually regular, although it can be slightly irregular. n Rate: Atrial rate cannot be determined. The ventricular rate range is 150-250 beats
per minute. If the rate is below 150 bpm, it is considered a slow VT. If the rate exceeds 250 bpm, its called Ventricular Flutter.
n P Wave: None of the QRS complexes will be preceded by P waves; you may see dissociated P waves intermittently across the strip.
n PRI: Since the rhythm originates in the ventricles, there will be no PRI. n QRS: The QRS complexes will be wide and bizarre, measuring at least .12 seconds.
It is often difficult to differentiate between the QRS and the T wave.
Ventricular Fibrillation
n Multiple foci in the ventricles become irritable and generate uncoordinated, chaotic impulses that cause the heart to fibrillate rather than contract.
n Regularity: There are no waves or complexes that can be analyzed to determine regularity. The baseline is totally chaotic.
n Rate: The rate cannot be determined since there are no discernible waves or complexes to measure.
n P Wave: There are no discernible P waves. n PRI: There is no PRI. n QRS: There are no discernible QRS complexes.
12/1/13
18
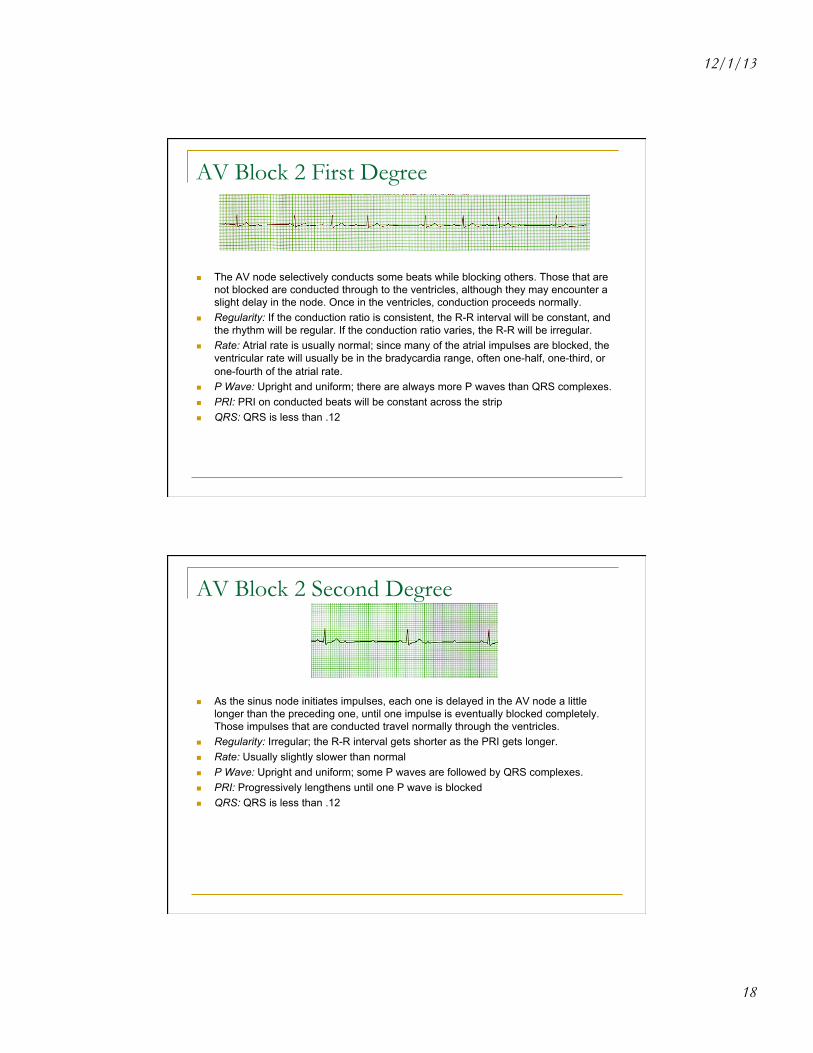
AV Block 2 First Degree
n The AV node selectively conducts some beats while blocking others. Those that are not blocked are conducted through to the ventricles, although they may encounter a slight delay in the node. Once in the ventricles, conduction proceeds normally.
n Regularity: If the conduction ratio is consistent, the R-R interval will be constant, and the rhythm will be regular. If the conduction ratio varies, the R-R will be irregular.
n Rate: Atrial rate is usually normal; since many of the atrial impulses are blocked, the ventricular rate will usually be in the bradycardia range, often one-half, one-third, or one-fourth of the atrial rate.
n P Wave: Upright and uniform; there are always more P waves than QRS complexes. n PRI: PRI on conducted beats will be constant across the strip n QRS: QRS is less than .12
AV Block 2 Second Degree
n As the sinus node initiates impulses, each one is delayed in the AV node a little longer than the preceding one, until one impulse is eventually blocked completely. Those impulses that are conducted travel normally through the ventricles.
n Regularity: Irregular; the R-R interval gets shorter as the PRI gets longer. n Rate: Usually slightly slower than normal n P Wave: Upright and uniform; some P waves are followed by QRS complexes. n PRI: Progressively lengthens until one P wave is blocked n QRS: QRS is less than .12
12/1/13
19
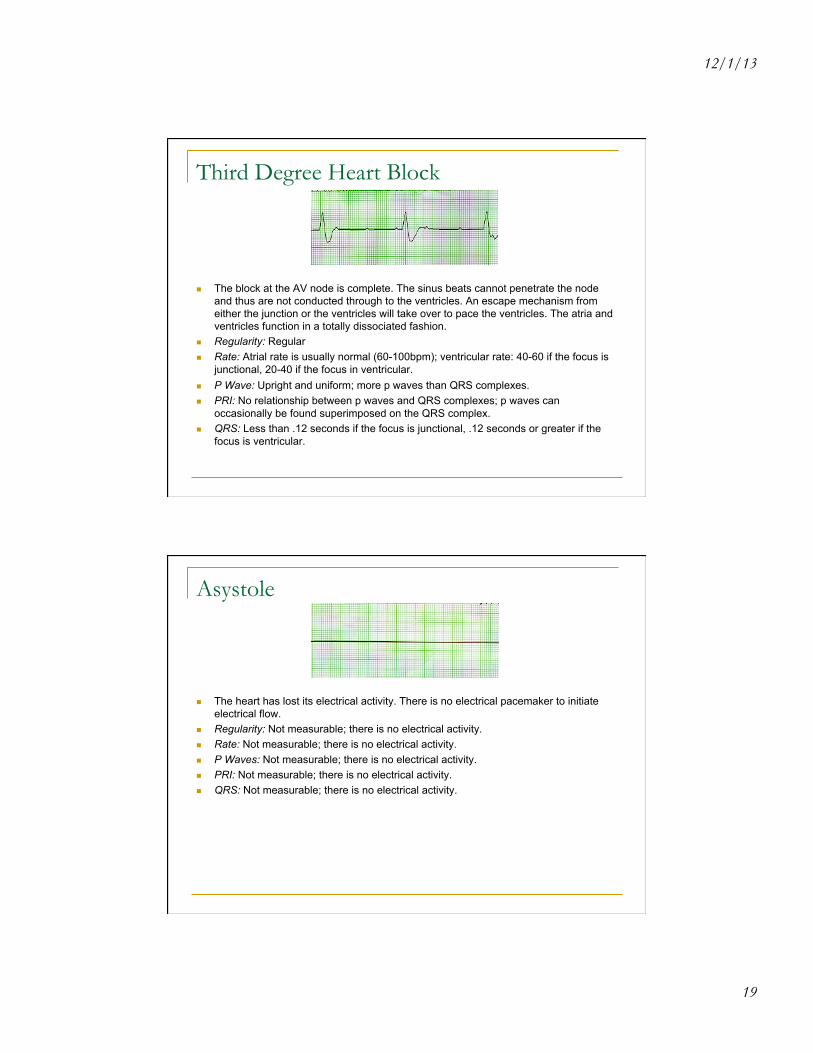
Third Degree Heart Block
n The block at the AV node is complete. The sinus beats cannot penetrate the node and thus are not conducted through to the ventricles. An escape mechanism from either the junction or the ventricles will take over to pace the ventricles. The atria and ventricles function in a totally dissociated fashion.
n Regularity: Regular n Rate: Atrial rate is usually normal (60-100bpm); ventricular rate: 40-60 if the focus is
junctional, 20-40 if the focus in ventricular. n P Wave: Upright and uniform; more p waves than QRS complexes. n PRI: No relationship between p waves and QRS complexes; p waves can
occasionally be found superimposed on the QRS complex. n QRS: Less than .12 seconds if the focus is junctional, .12 seconds or greater if the
focus is ventricular.
Asystole
n The heart has lost its electrical activity. There is no electrical pacemaker to initiate electrical flow.
n Regularity: Not measurable; there is no electrical activity. n Rate: Not measurable; there is no electrical activity. n P Waves: Not measurable; there is no electrical activity. n PRI: Not measurable; there is no electrical activity. n QRS: Not measurable; there is no electrical activity.
12/1/13
20
39
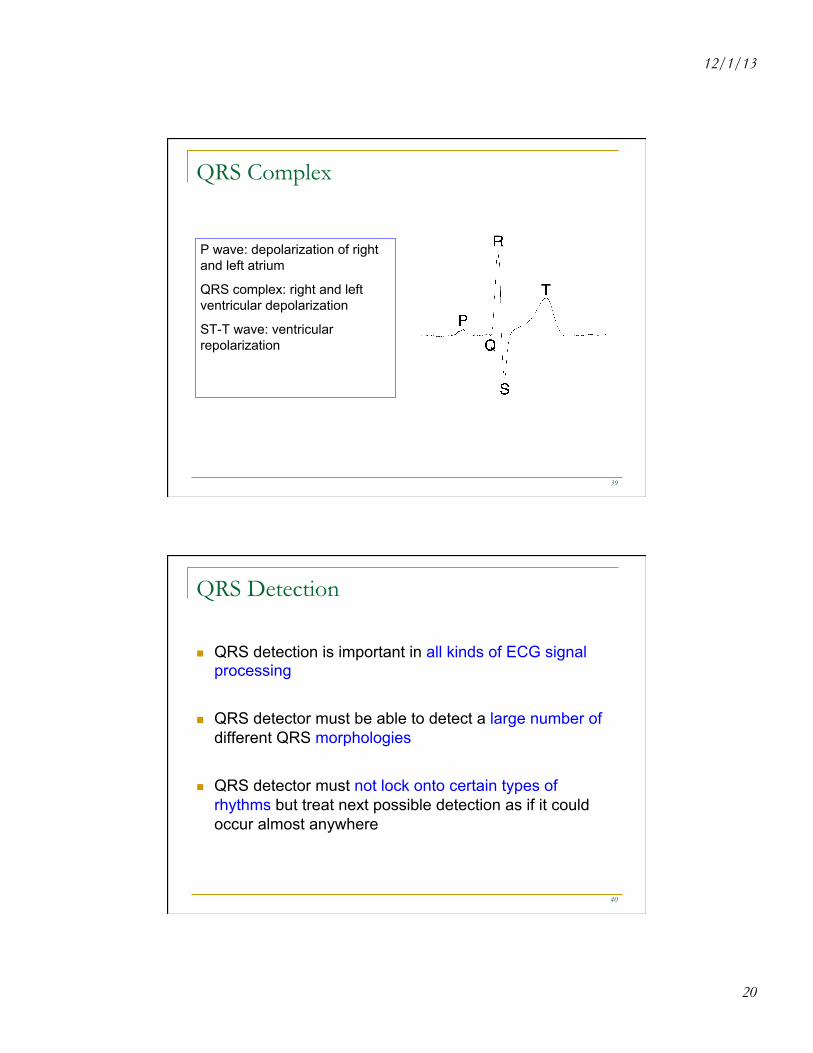
QRS Complex
P wave: depolarization of right and left atrium
QRS complex: right and left ventricular depolarization
ST-T wave: ventricular repolarization
40
QRS Detection
n QRS detection is important in all kinds of ECG signal processing
n QRS detector must be able to detect a large number of different QRS morphologies
n QRS detector must not lock onto certain types of rhythms but treat next possible detection as if it could occur almost anywhere
12/1/13
21
41
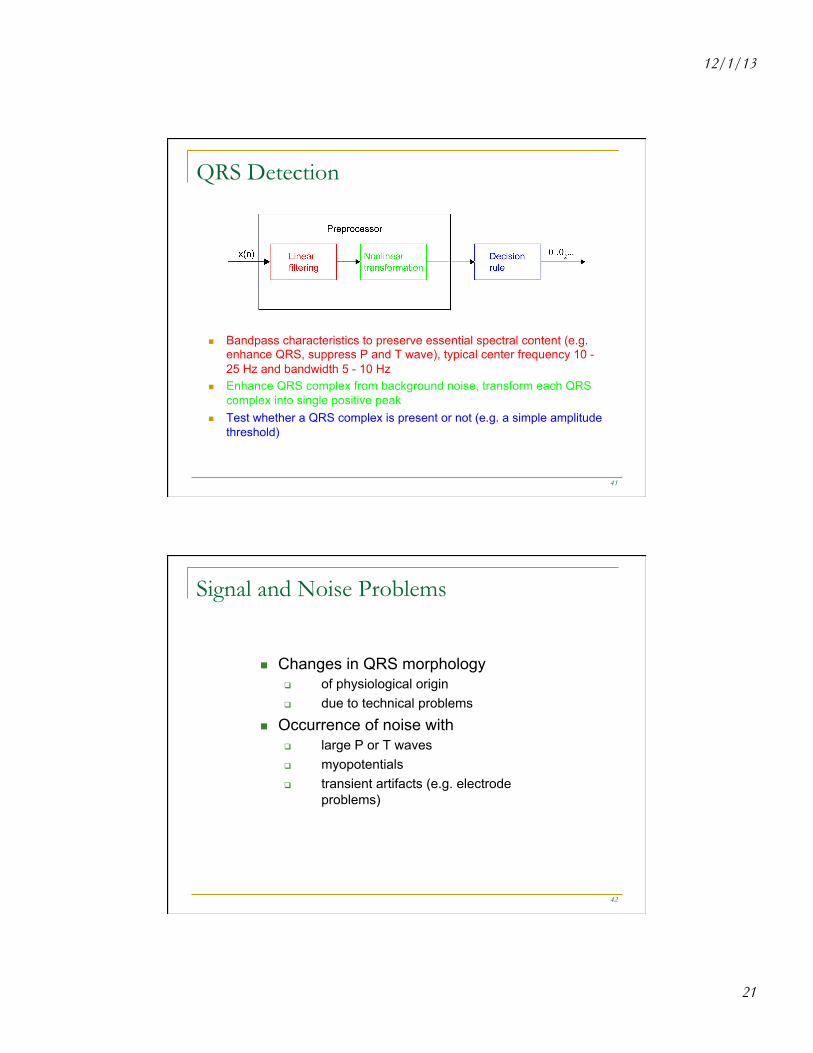
QRS Detection
n Bandpass characteristics to preserve essential spectral content (e.g. enhance QRS, suppress P and T wave), typical center frequency 10 - 25 Hz and bandwidth 5 - 10 Hz
n Enhance QRS complex from background noise, transform each QRS complex into single positive peak
n Test whether a QRS complex is present or not (e.g. a simple amplitude threshold)
42
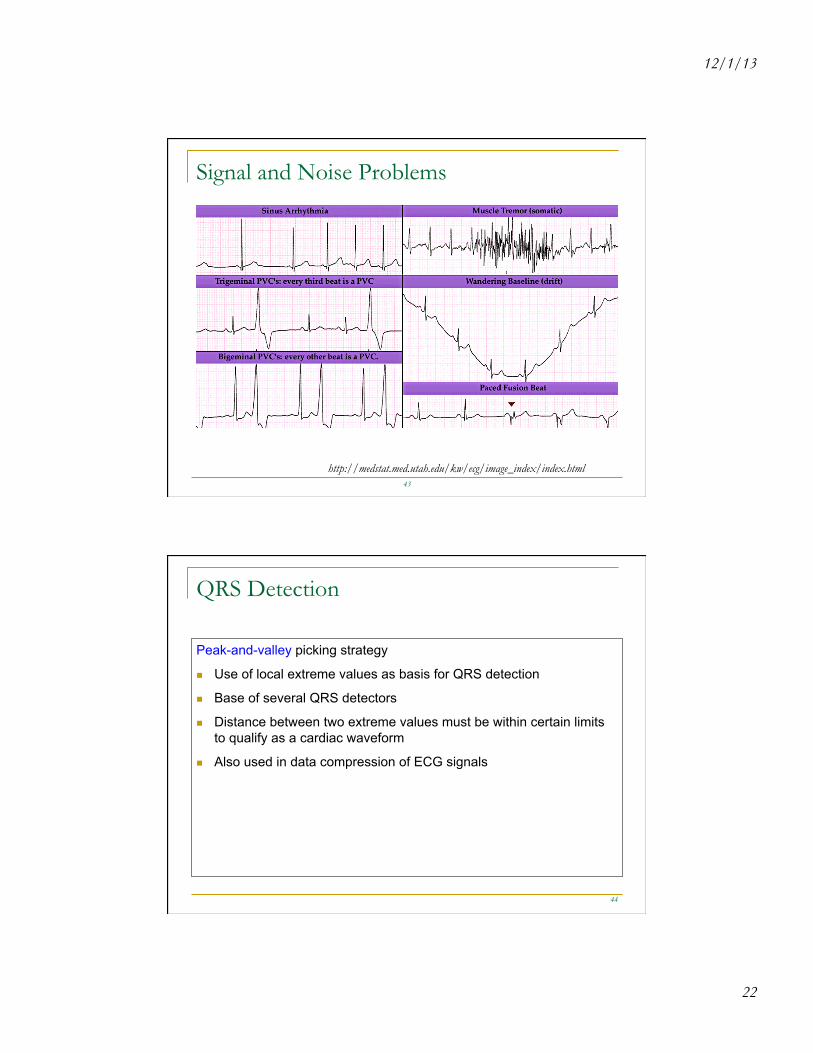
Signal and Noise Problems
n Changes in QRS morphology q of physiological origin q due to technical problems
n Occurrence of noise with q large P or T waves q myopotentials q transient artifacts (e.g. electrode
n Use of local extreme values as basis for QRS detection
n Base of several QRS detectors
n Distance between two extreme values must be within certain limits to qualify as a cardiac waveform
n Also used in data compression of ECG signals
12/1/13
23
45
Linear Filtering
n To enhance QRS from background noise n Examples of linear, time-invariant filters for QRS
detection: q Filter that emphasizes segments of signal containing rapid
transients (i.e. QRS complexes)
n Only suitable for resting ECG and good SNR
q Filter that emphasizes rapid transients + lowpass filter
46
Linear Filtering
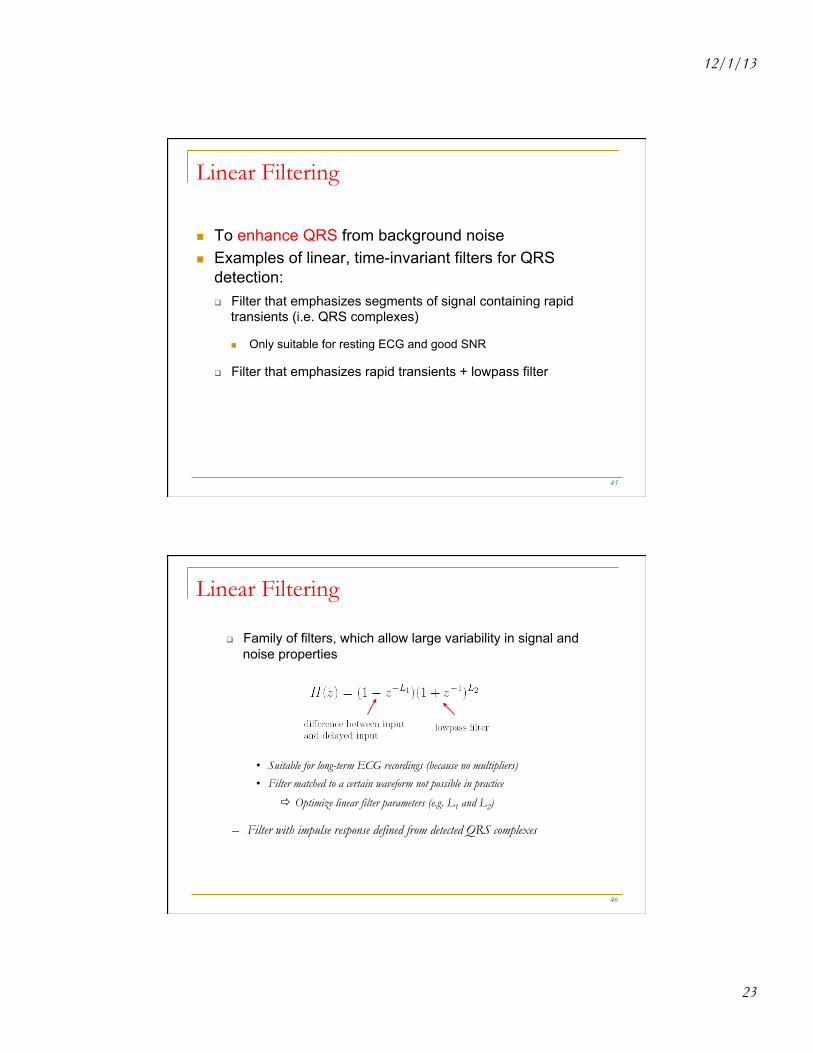
q Family of filters, which allow large variability in signal and noise properties
• Suitable for long-term ECG recordings (because no multipliers)
• Filter matched to a certain waveform not possible in practice
ð Optimize linear filter parameters (e.g. L1 and L2)
– Filter with impulse response defined from detected QRS complexes
12/1/13
24
47
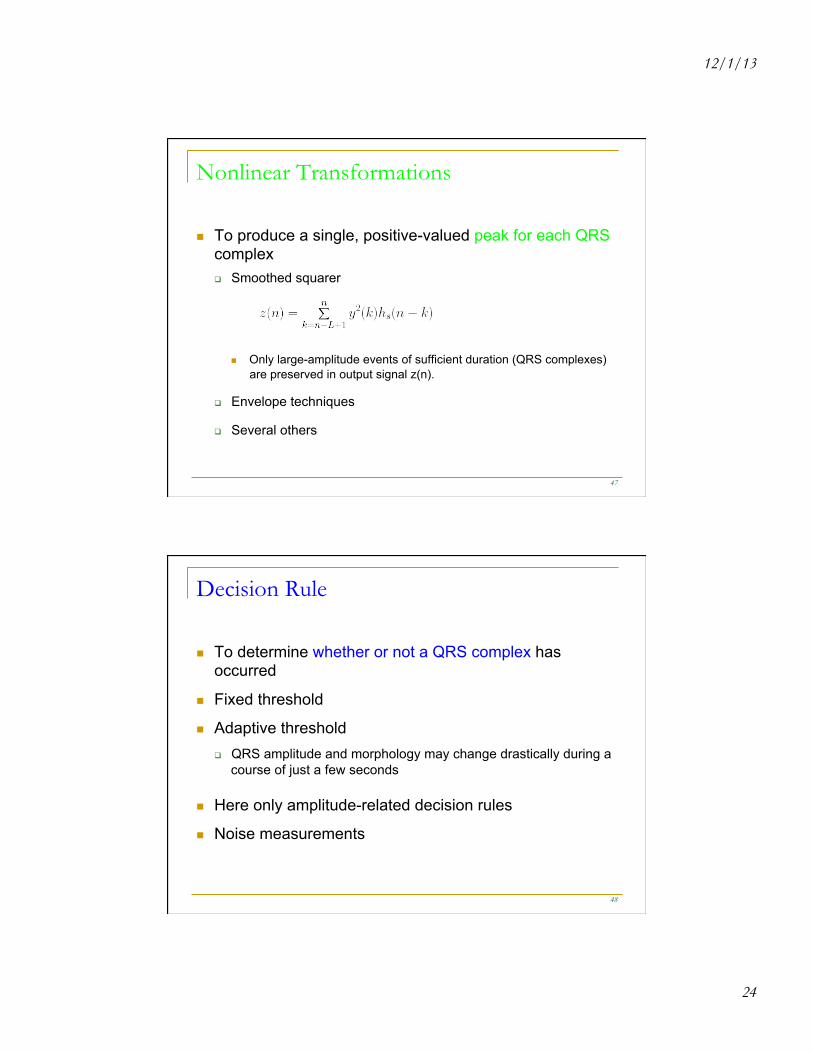
Nonlinear Transformations
n To produce a single, positive-valued peak for each QRS complex q Smoothed squarer
n Only large-amplitude events of sufficient duration (QRS complexes) are preserved in output signal z(n).
q Envelope techniques
q Several others
48
Decision Rule
n To determine whether or not a QRS complex has occurred
n Fixed threshold
n Adaptive threshold q QRS amplitude and morphology may change drastically during a
course of just a few seconds
n Here only amplitude-related decision rules
n Noise measurements
12/1/13
25
49
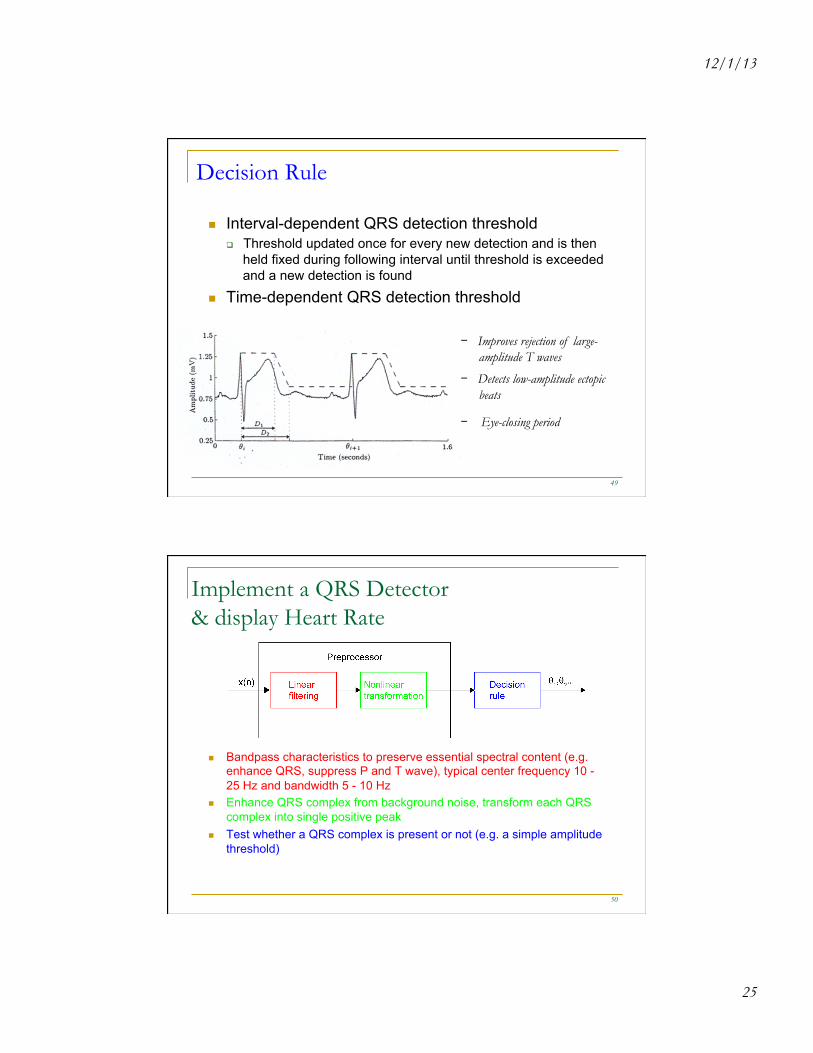
Decision Rule
n Interval-dependent QRS detection threshold q Threshold updated once for every new detection and is then
held fixed during following interval until threshold is exceeded and a new detection is found
n Time-dependent QRS detection threshold
- Improves rejection of large-amplitude T waves
- Detects low-amplitude ectopic beats
- Eye-closing period
50
Implement a QRS Detector & display Heart Rate
n Bandpass characteristics to preserve essential spectral content (e.g. enhance QRS, suppress P and T wave), typical center frequency 10 - 25 Hz and bandwidth 5 - 10 Hz
n Enhance QRS complex from background noise, transform each QRS complex into single positive peak
n Test whether a QRS complex is present or not (e.g. a simple amplitude threshold)