27
Echographic and thermographic examination of bull testis György Gábor, DVM, Ph.D senior scientist Res. Inst. For Animal Breeding and Nutr. HERCEGHALOM, HUNGARY
| Date post: | 13-Dec-2015 |
| Category: |
Documents |
| Upload: | gordon-bruce |
| View: | 220 times |
| Download: | 5 times |

Echographic and thermographic examination of bull testis
György Gábor, DVM, Ph.D senior scientistRes. Inst. For Animal Breeding and Nutr.
HERCEGHALOM, HUNGARY
Introduction
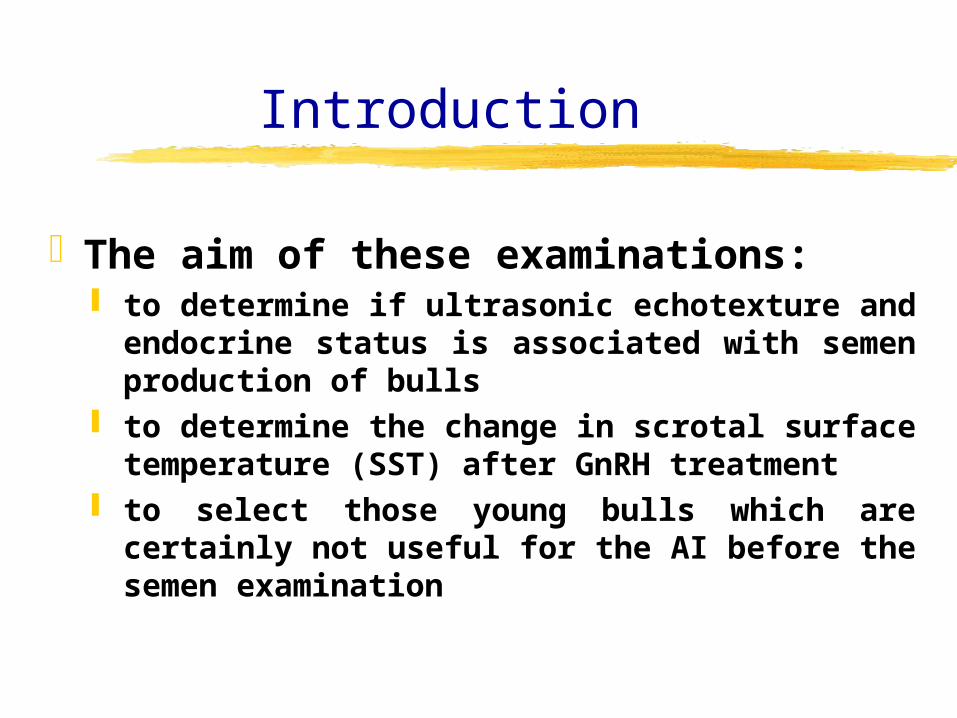
The aim of these examinations: to determine if ultrasonic echotexture and
endocrine status is associated with semen production of bulls
to determine the change in scrotal surface temperature (SST) after GnRH treatment
to select those young bulls which are certainly not useful for the AI before the semen examination
Material and Methods
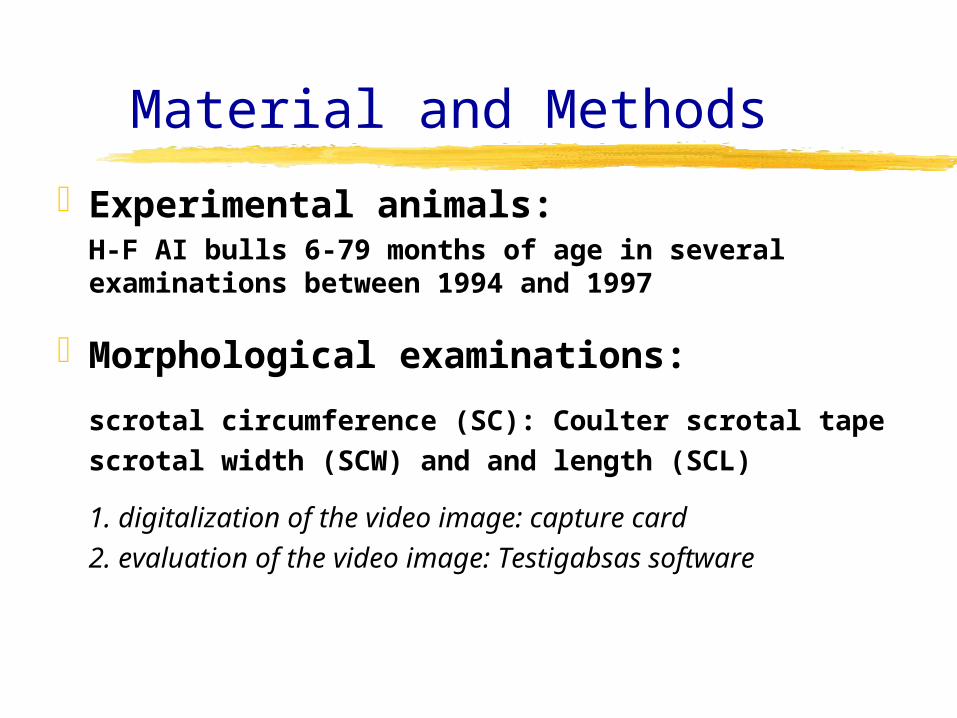
Experimental animals:H-F AI bulls 6-79 months of age in several examinations between 1994 and 1997
Morphological examinations:
scrotal circumference (SC): Coulter scrotal tapescrotal width (SCW) and and length (SCL)
1. digitalization of the video image: capture card2. evaluation of the video image: Testigabsas software
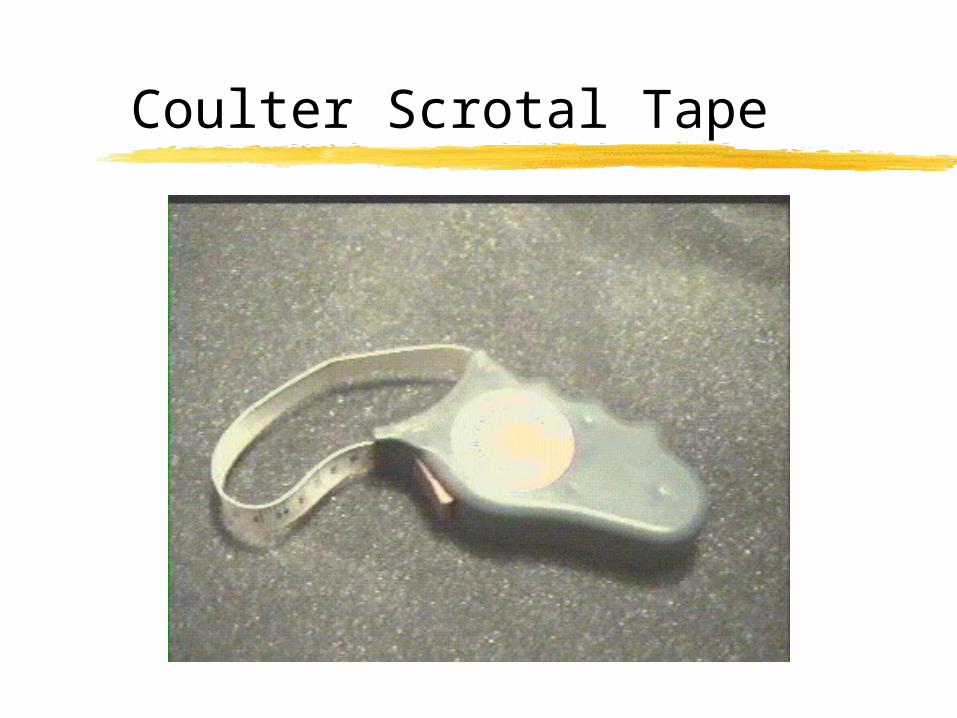
Coulter Scrotal Tape
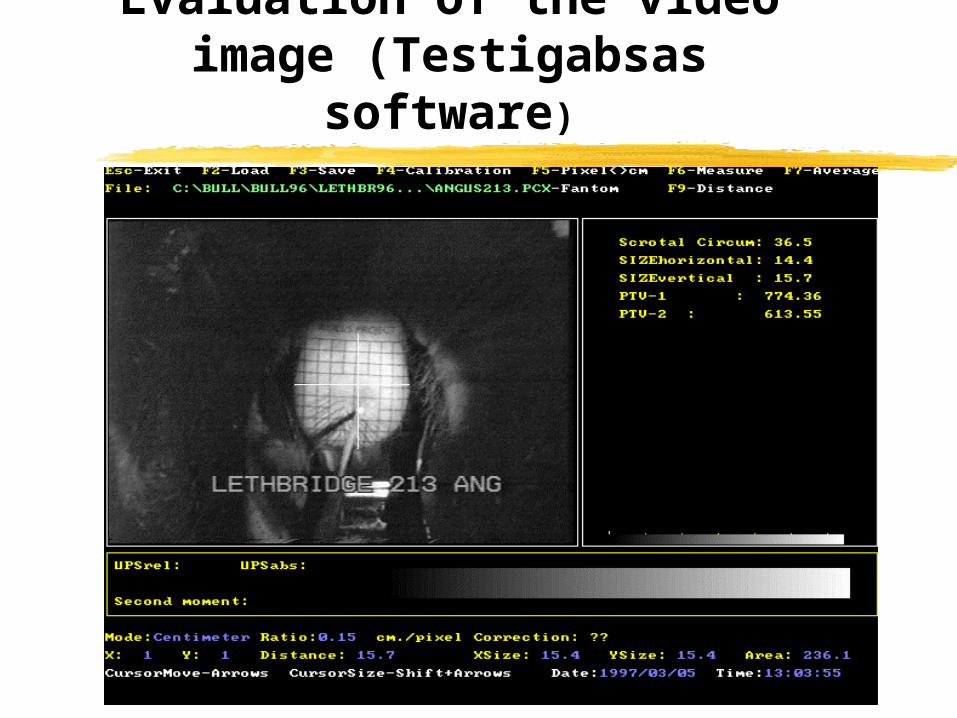
Evaluation of the video image (Testigabsas
software)
Examination of echotexture 1.
The ultrasonic examination of the testes was done with a B-mode scanner (Pie Medical, Model 450) with a 7.5 MHz linear-array transducer. Gain was held constant for all examinations.
The transducer was aligned at the center of each testis and perpendicular to the vertical axis. A custom, electromechanical device for holding the probe was used to assure that the same pressure was applied by the probe against tissues upon which liberal amounts of ultrasound coupling gel had been applied.
At approximately 0.76 kg/cm2 pressure, an indicator lamp lighted as a spring-loaded switch was compressed. At that instance the ultrasound-image was frozen on the scanner console and the image was captured and stored.
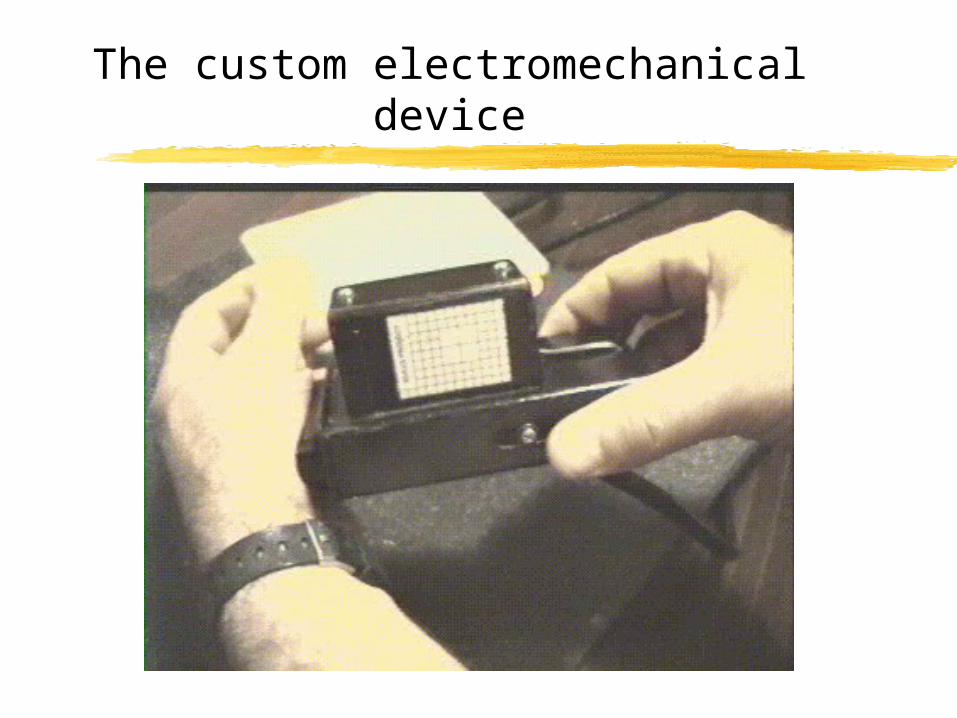
The custom electromechanical device
Examination of echotexture 2.(Testigabsas software)
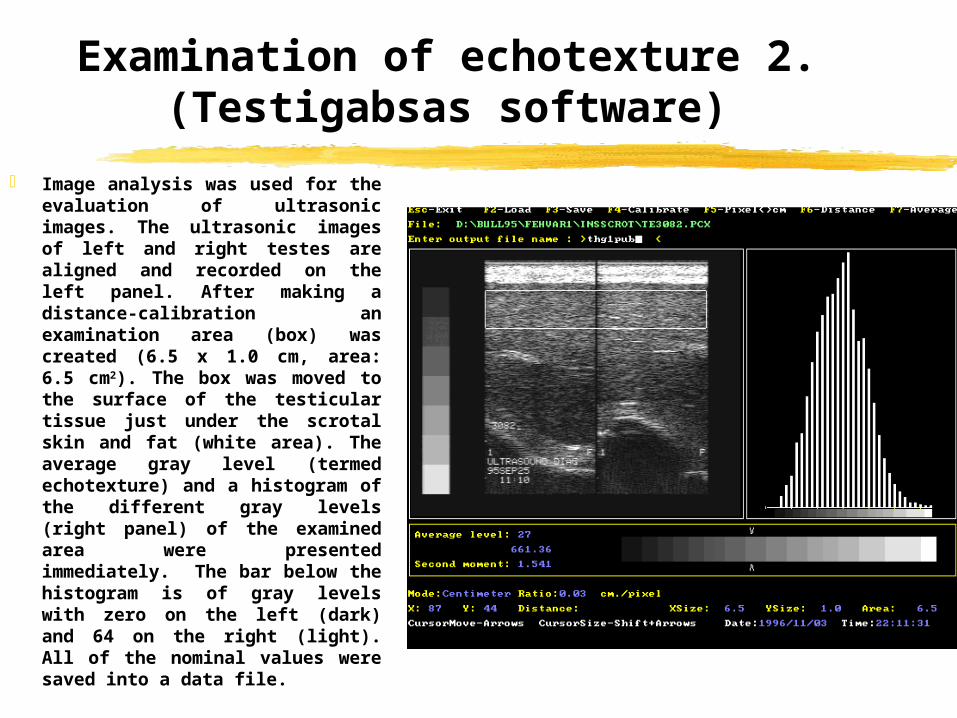
Image analysis was used for the evaluation of ultrasonic images. The ultrasonic images of left and right testes are aligned and recorded on the left panel. After making a distance-calibration an examination area (box) was created (6.5 x 1.0 cm, area: 6.5 cm2). The box was moved to the surface of the testicular tissue just under the scrotal skin and fat (white area). The average gray level (termed echotexture) and a histogram of the different gray levels (right panel) of the examined area were presented immediately. The bar below the histogram is of gray levels with zero on the left (dark) and 64 on the right (light). All of the nominal values were saved into a data file.
Examination of the scrotal surface temperature (SST)
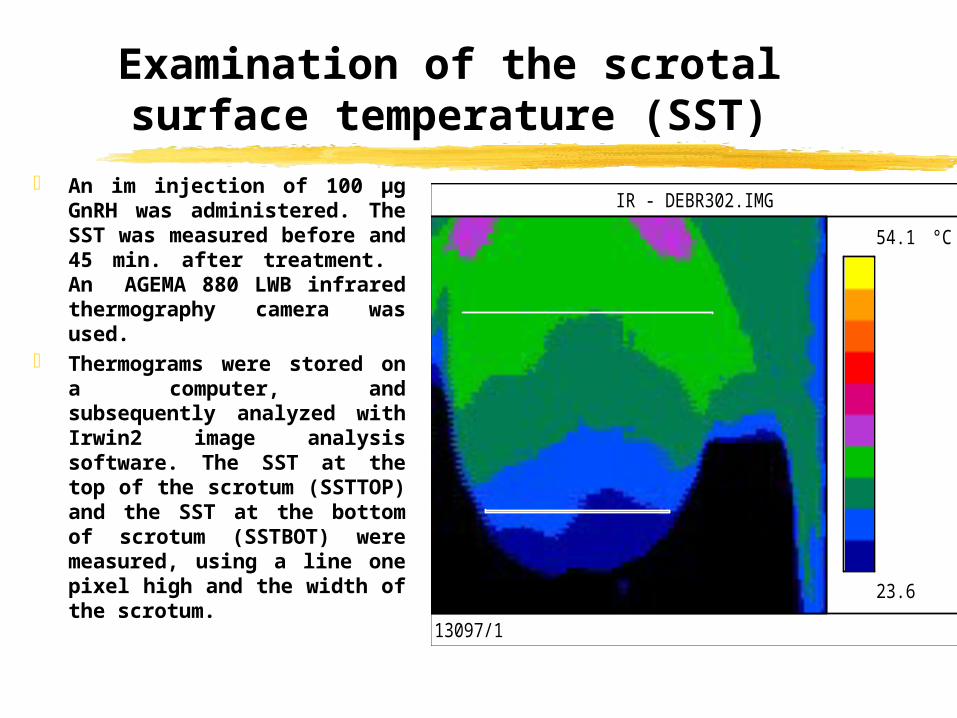
An im injection of 100 μg GnRH was administered. The SST was measured before and 45 min. after treatment. An AGEMA 880 LWB infrared thermography camera was used.
Thermograms were stored on a computer, and subsequently analyzed with Irwin2 image analysis software. The SST at the top of the scrotum (SSTTOP) and the SST at the bottom of scrotum (SSTBOT) were measured, using a line one pixel high and the width of the scrotum.
IR - DEBR302.IMG
13097/1
23.6
54.1 °C
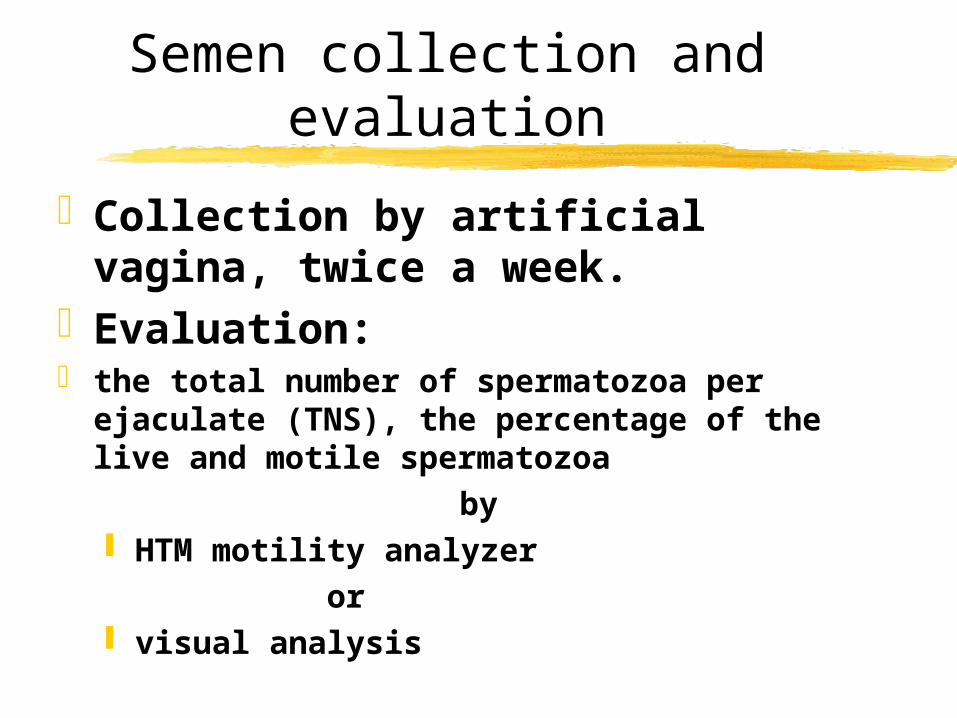
Semen collection and evaluation
Collection by artificial vagina, twice a week.
Evaluation: the total number of spermatozoa per
ejaculate (TNS), the percentage of the live and motile spermatozoa
by HTM motility analyzer
or visual analysis
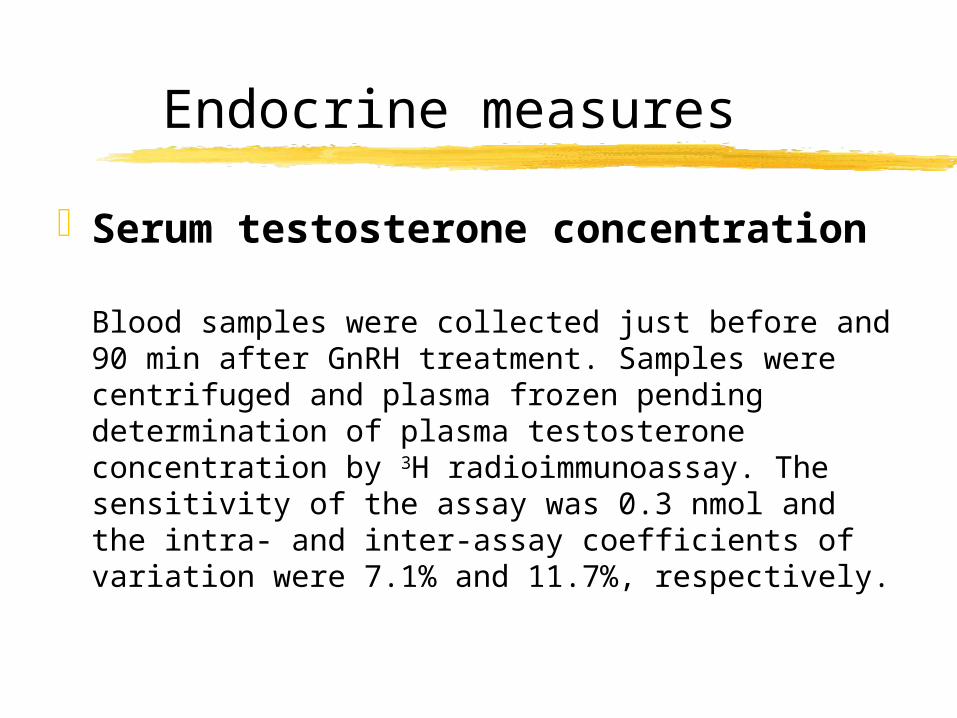
Endocrine measures
Serum testosterone concentration
Blood samples were collected just before and 90 min after GnRH treatment. Samples were centrifuged and plasma frozen pending determination of plasma testosterone concentration by 3H radioimmunoassay. The sensitivity of the assay was 0.3 nmol and the intra- and inter-assay coefficients of variation were 7.1% and 11.7%, respectively.
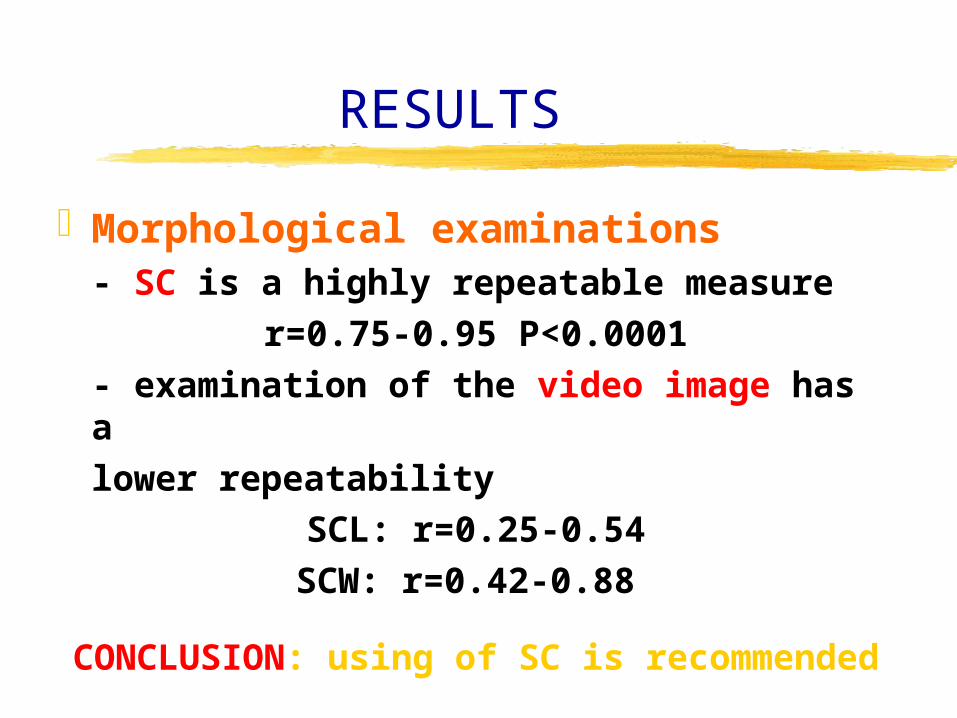
RESULTS
Morphological examinations - SC is a highly repeatable measure
r=0.75-0.95 P<0.0001- examination of the video image
has alower repeatability
SCL: r=0.25-0.54SCW: r=0.42-0.88
CONCLUSION: using of SC is recommended

Testicular echotexture 1
Relatively high repeatability in both, young and older bulls
r=0.53-0.86; P<0.01-0.001
Good correlation with the total number of spermatozoa per ejaculate in young bulls
r= between -0.29 and -0.70 P= between 0.001 and 0.11
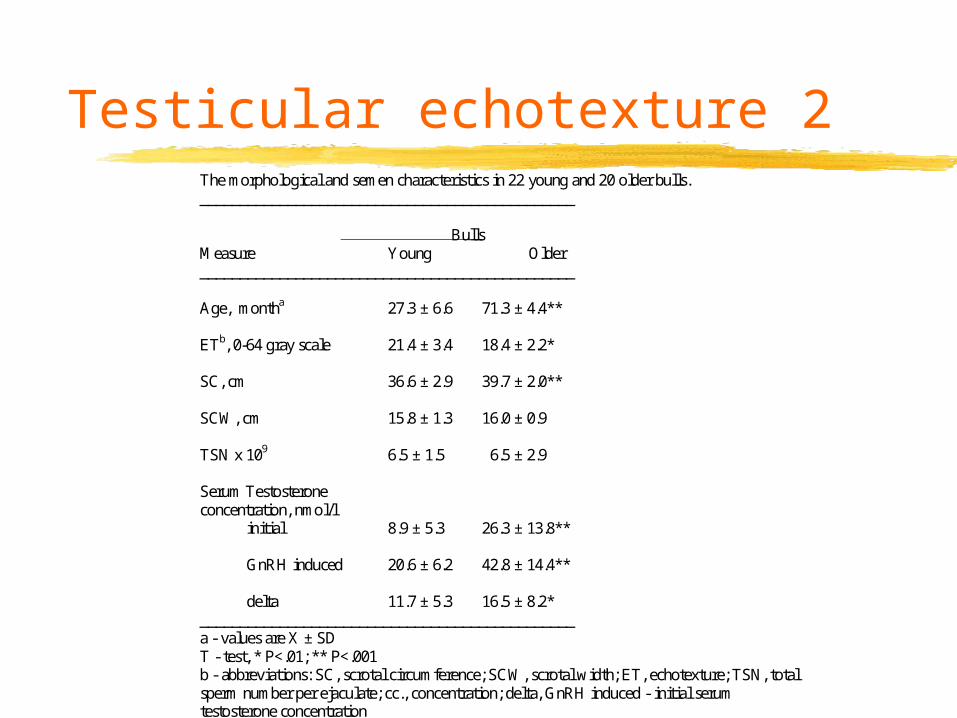
Testicular echotexture 2The morphological and semen characteristics in 22 young and 20 older bulls._______________________________________________
BullsMeasure Young Older_______________________________________________
Age, montha 27.3 ± 6.6 71.3 ± 4.4**
ETb, 0-64 gray scale 21.4 ± 3.4 18.4 ± 2.2*
SC, cm 36.6 ± 2.9 39.7 ± 2.0**
SCW, cm 15.8 ± 1.3 16.0 ± 0.9
TSN x 109 6.5 ± 1.5 6.5 ± 2.9
Serum Testosteroneconcentration, nmol/l initial 8.9 ± 5.3 26.3 ± 13.8**
GnRH induced 20.6 ± 6.2 42.8 ± 14.4**
delta 11.7 ± 5.3 16.5 ± 8.2*_______________________________________________a - values are X ± SDT - test, * P<.01; ** P<.001b - abbreviations: SC, scrotal circumference; SCW, scrotal width; ET, echotexture; TSN, totalsperm number per ejaculate; cc., concentration; delta, GnRH induced - initial serumtestosterone concentration
Testicular echotexture 3
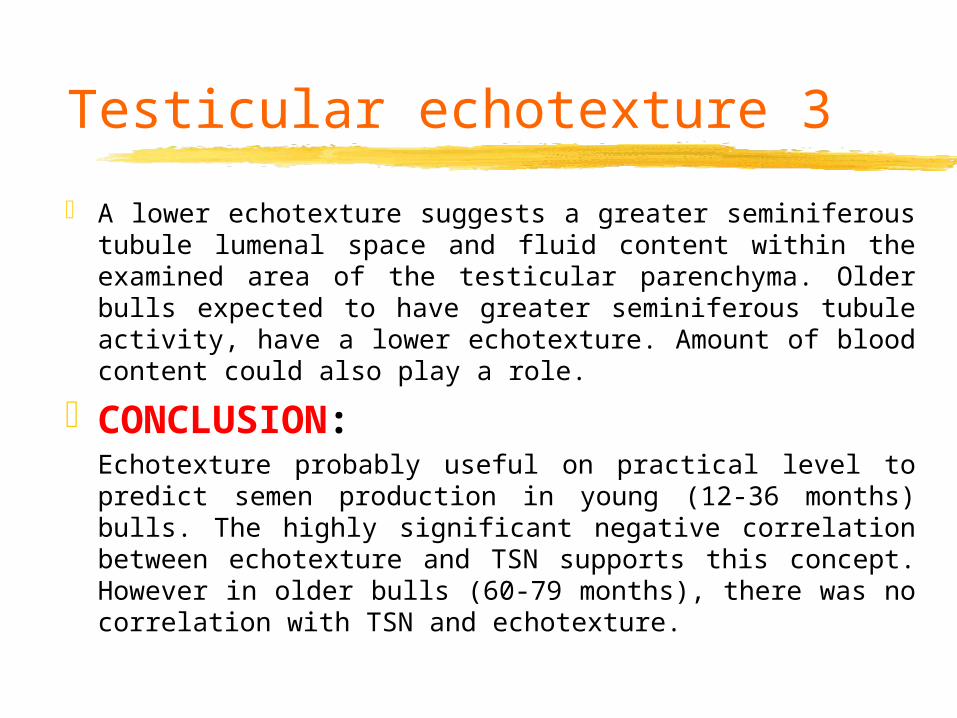
A lower echotexture suggests a greater seminiferous tubule lumenal space and fluid content within the examined area of the testicular parenchyma. Older bulls expected to have greater seminiferous tubule activity, have a lower echotexture. Amount of blood content could also play a role.
CONCLUSION:Echotexture probably useful on practical level to predict semen production in young (12-36 months) bulls. The highly significant negative correlation between echotexture and TSN supports this concept. However in older bulls (60-79 months), there was no correlation with TSN and echotexture.
Change of SST after GnRH challenge 1
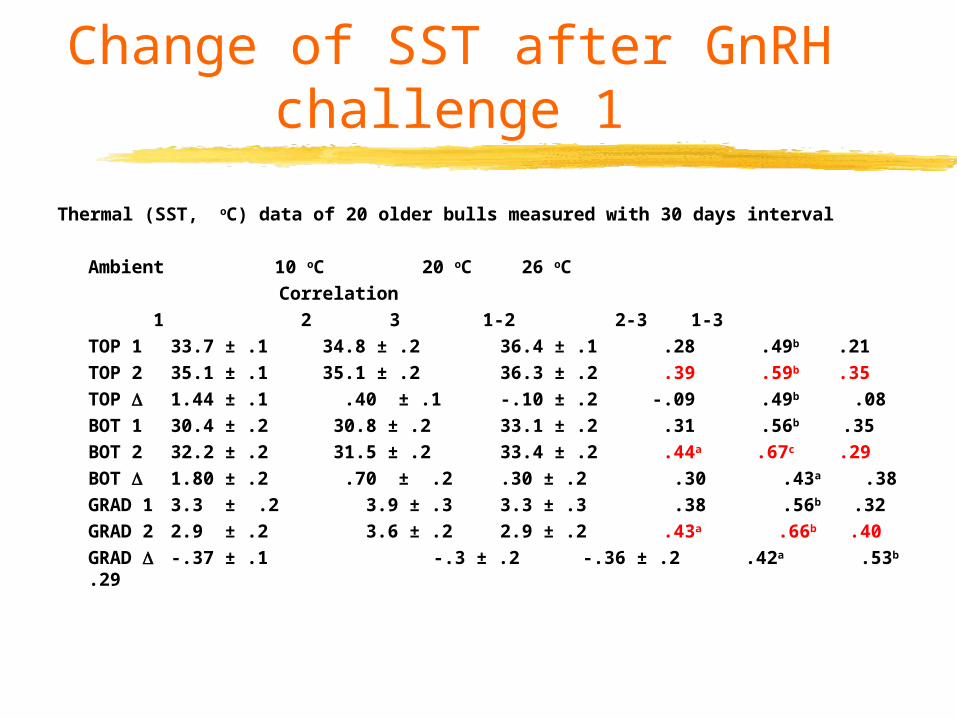
Thermal (SST, oC) data of 20 older bulls measured with 30 days interval
Ambient 10 oC 20 oC 26 oC Correlation
1 2 3 1-2 2-3 1-3TOP 1 33.7 ± .1 34.8 ± .2 36.4 ± .1 .28 .49b .21TOP 2 35.1 ± .1 35.1 ± .2 36.3 ± .2 .39 .59b .35TOP 1.44 ± .1 .40 ± .1 -.10 ± .2 -.09 .49b .08BOT 1 30.4 ± .2 30.8 ± .2 33.1 ± .2 .31 .56b .35BOT 2 32.2 ± .2 31.5 ± .2 33.4 ± .2 .44a .67c .29BOT 1.80 ± .2 .70 ± .2 .30 ± .2 .30 .43a .38GRAD 1 3.3 ± .2 3.9 ± .3 3.3 ± .3 .38 .56b .32GRAD 2 2.9 ± .2 3.6 ± .2 2.9 ± .2 .43a .66b .40GRAD -.37 ± .1 -.3 ± .2 -.36 ± .2 .42a .53b .29
Change of SST after GnRH challenge 2
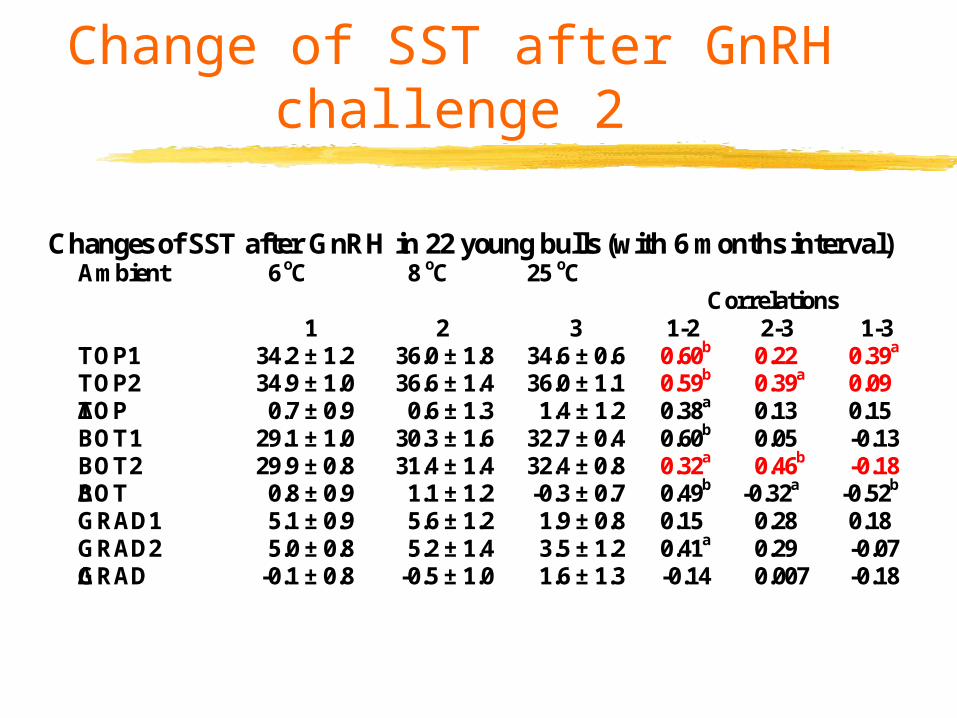
Changes of SST after GnRH in 22 young bulls (with 6 months interval)Ambient 6 oC 8 oC 25 oC
Correlations1 2 3 1-2 2-3 1-3
TOP1 34.2 ± 1.2 36.0 ± 1.8 34.6 ± 0.6 0.60b 0.22 0.39a
TOP2 34.9 ± 1.0 36.6 ± 1.4 36.0 ± 1.1 0.59b 0.39a 0.09TOPΔ 0.7 ± 0.9 0.6 ± 1.3 1.4 ± 1.2 0.38a 0.13 0.15BOT1 29.1 ± 1.0 30.3 ± 1.6 32.7 ± 0.4 0.60b 0.05 -0.13BOT2 29.9 ± 0.8 31.4 ± 1.4 32.4 ± 0.8 0.32a 0.46b -0.18BOTΔ 0.8 ± 0.9 1.1 ± 1.2 -0.3 ± 0.7 0.49b -0.32a -0.52b
GRAD1 5.1 ± 0.9 5.6 ± 1.2 1.9 ± 0.8 0.15 0.28 0.18GRAD2 5.0 ± 0.8 5.2 ± 1.4 3.5 ± 1.2 0.41a 0.29 -0.07GRADΔ -0.1 ± 0.8 -0.5 ± 1.0 1.6 ± 1.3 -0.14 0.007 -0.18
Change of SST after GnRH challenge 3
SST increased following GnRH treatment. SST measurements (after GnRH treatment) in
young bulls were of some value in predicting the number of spermatozoa that could be collected.
However the ambient temperature has a greater effect on basal (pre-treatment) SST than SST following GnRH. These results support the combination of infrared thermography of SST and the GnRH challenge in order to decrease the effect of the ambient temperature.
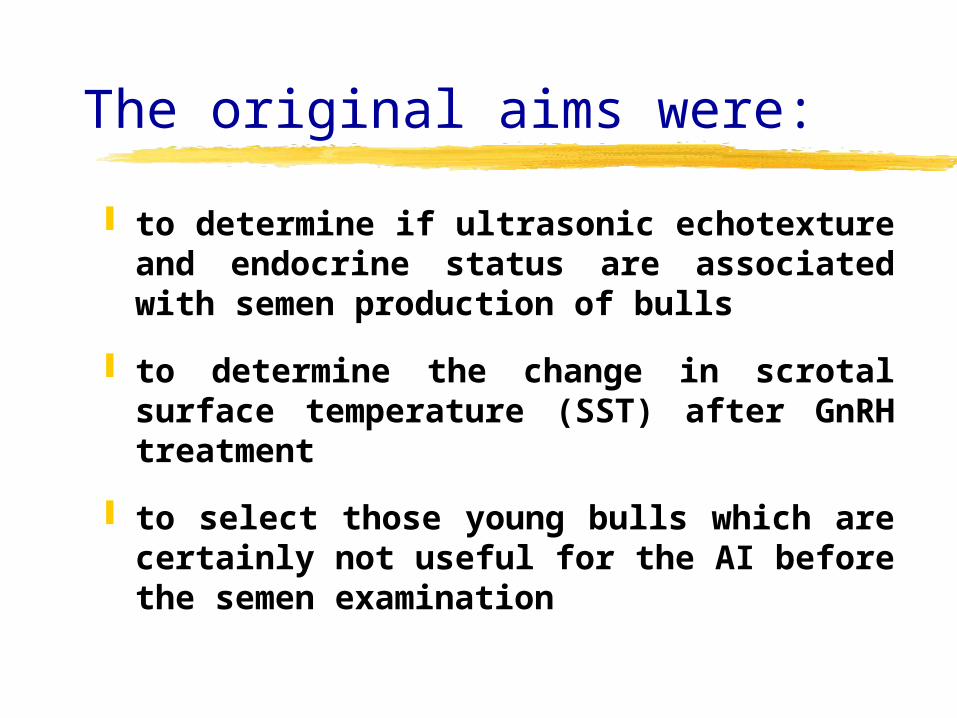
The original aims were:
to determine if ultrasonic echotexture and endocrine status are associated with semen production of bulls
to determine the change in scrotal surface temperature (SST) after GnRH treatment
to select those young bulls which are certainly not useful for the AI before the semen examination
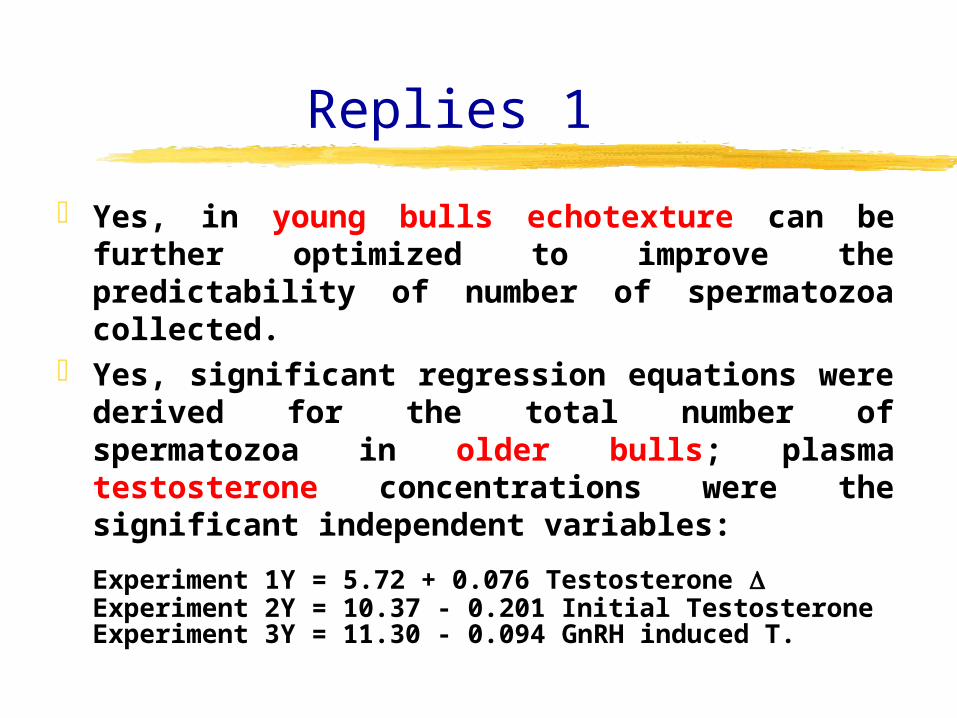
Replies 1
Yes, in young bulls echotexture can be further optimized to improve the predictability of number of spermatozoa collected.
Yes, significant regression equations were derived for the total number of spermatozoa in older bulls; plasma testosterone concentrations were the significant independent variables:
Experiment 1 Y = 5.72 + 0.076 Testosterone Experiment 2 Y = 10.37 - 0.201 Initial TestosteroneExperiment 3 Y = 11.30 - 0.094 GnRH induced T.
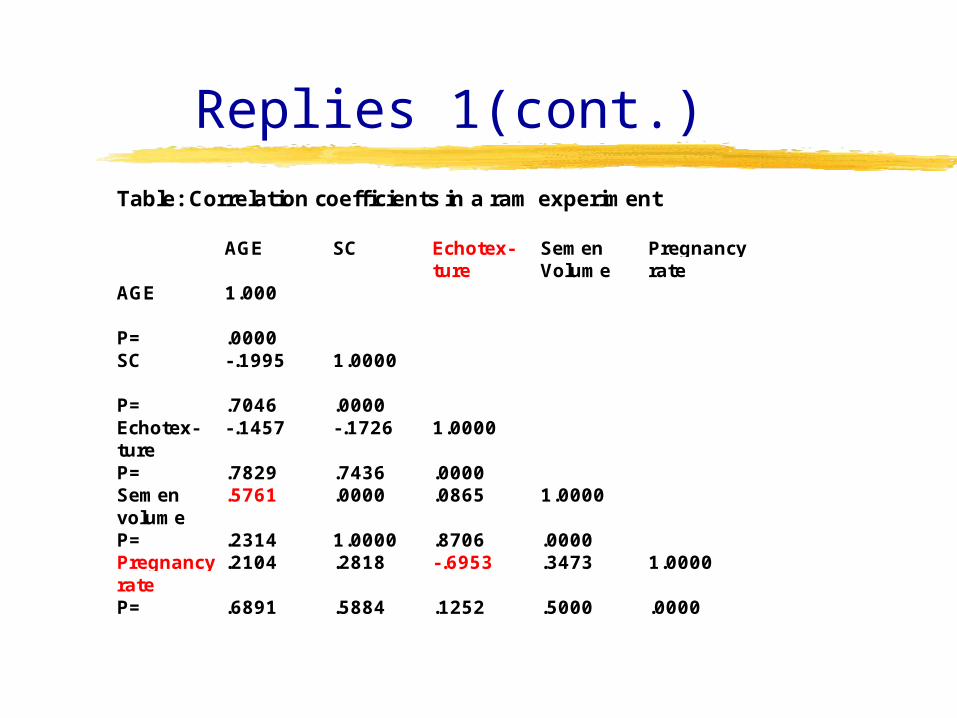
Replies 1(cont.)Table: Correlation coefficients in a ram experiment
AGE SC Echotex-ture
SemenVolume
Pregnancyrate
AGE 1.000
P= .0000SC -.1995 1.0000
P= .7046 .0000Echotex-ture
-.1457 -.1726 1.0000
P= .7829 .7436 .0000Semenvolume
.5761 .0000 .0865 1.0000
P= .2314 1.0000 .8706 .0000Pregnancyrate
.2104 .2818 -.6953 .3473 1.0000
P= .6891 .5884 .1252 .5000 .0000
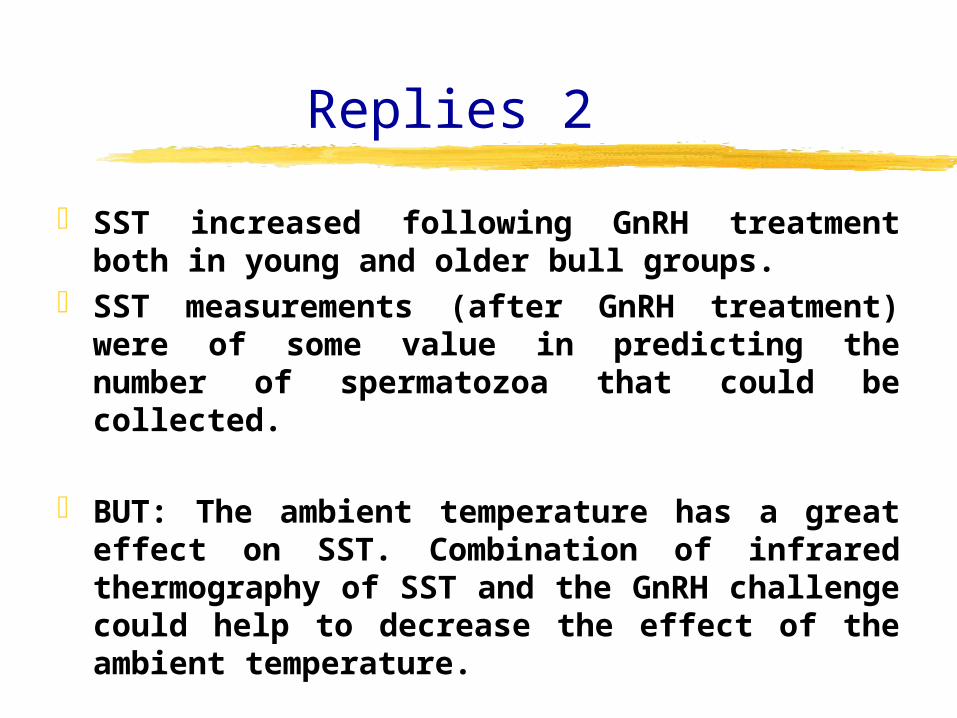
Replies 2
SST increased following GnRH treatment both in young and older bull groups.
SST measurements (after GnRH treatment) were of some value in predicting the number of spermatozoa that could be collected.
BUT: The ambient temperature has a great effect on SST. Combination of infrared thermography of SST and the GnRH challenge could help to decrease the effect of the ambient temperature.
Final conclusions
SC, ET, and SST represent the scrotal and testicular characteristics referring to semen and endocrine measures
An andrological data base for males (bulls) may help to find those markers which are the most typical for the selection of those young bulls before the semen examination which are certainly not useful for the AI.

The future….
New devices or improvement of the old ones?
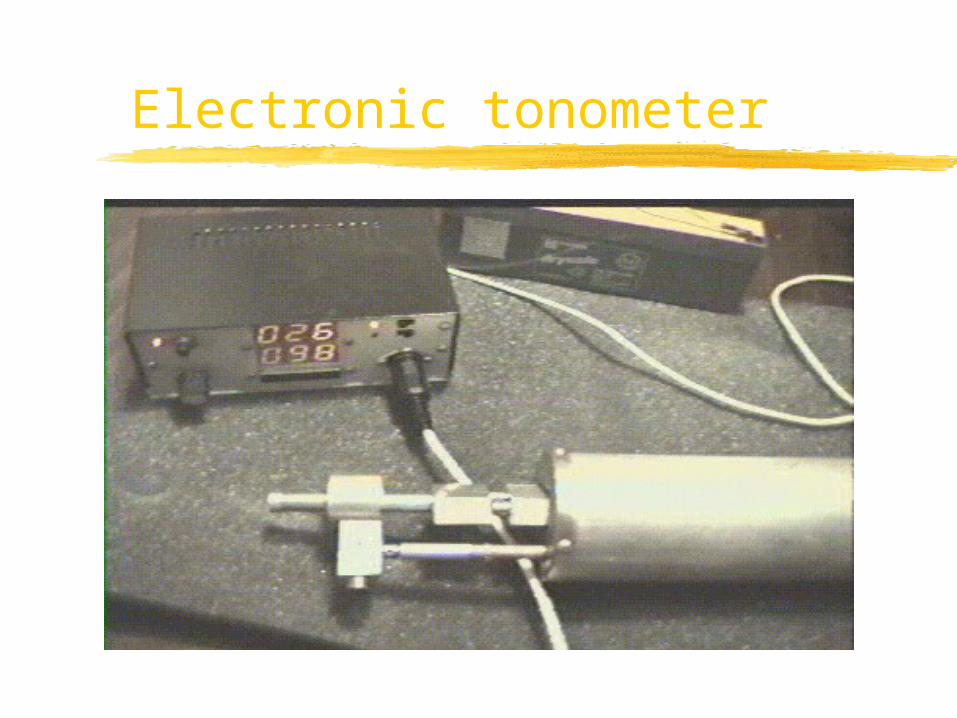
Electronic tonometer
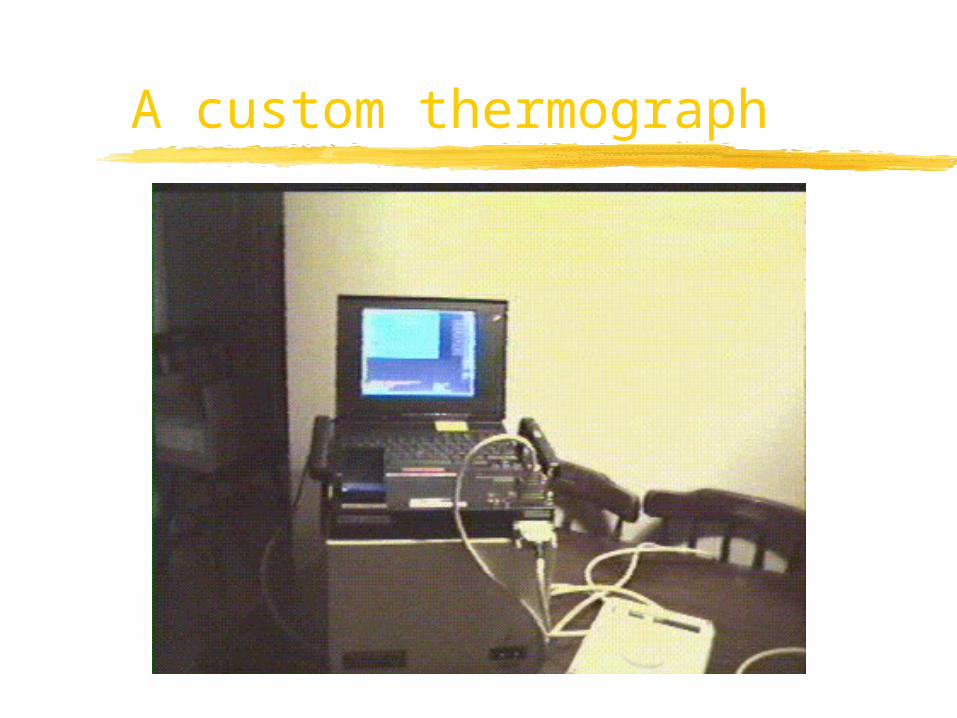
A custom thermograph
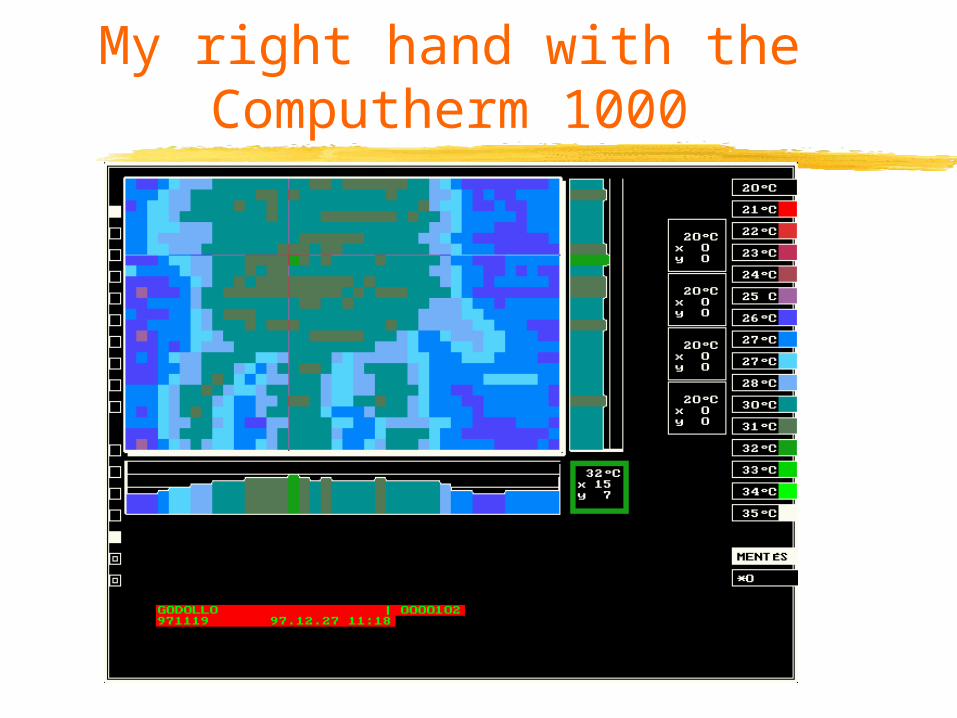
My right hand with the Computherm 1000


