Efficient Remote Profiling for Resource-Constrained Devices Priya Nagpurkar, Hussam Mousa, Chandra Krintz, and Timothy Sherwood University of California, Santa Barbara {priya,husmousa,ckrintz,sherwood}@cs.ucsb.edu The widespread use of ubiquitous, mobile, and continuously-connected computing agents has inspired software developers to change the way they test, debug, and optimize software. Users now play an active role in the software evolution cycle by dynamically providing valuable feedback about the execution of a program to developers. Software developers can use this information to isolate bugs in, maintain, and improve the performance of a wide-range of diverse and complex embedded device applications. The collection of such feedback poses a major challenge to systems researchers since it must be performed without degrading a user’s experience with, or consuming the severely restricted resources of the mobile device. At the same time, the resource constraints of embedded devices prohibit the use of extant software profiling solutions. To achieve efficient remote profiling of embedded devices, we couple two efficient hardware/soft- ware program monitoring techniques: Hybrid Profiling Support(HPS) and Phase-Aware Sampling. HPS efficiently inserts profiling instructions into an executing program using a novel extension to Dynamic Instruction Stream Editing(DISE). Phase-aware sampling exploits the recurring behavior of programs to identify key opportunities during execution in order to collect profile information (i.e. sample). Our prior work on phase-aware sampling required code duplication to toggle sampling. By guiding low-overhead, hardware-supported sampling according to program phase behavior via HPS, our system is able to collect highly accurate profiles transparently. We evaluate our system assuming a general purpose configuration as well as a popular hand- held device configuration. We measure the accuracy and overhead of our techniques and quantify the overhead in terms of computation, communication, and power consumption. We compare our system to random and periodic sampling for a number of widely used performance profile types. Our results indicate that our system significantly reduces the overhead of sampling while maintaining high accuracy. Categories and Subject Descriptors: C [3]: 0—Computer Systems Organization - Special-Purpose and Application-Based Systems General Terms: Performance Additional Key Words and Phrases: profiling, sampling, resource-constrained devices, phased behavior 1. INTRODUCTION The explosive growth and widespread use of the Internet has precipitated a signifi- cant change in the way that software is bought, sold, used, and maintained. Users are no longer disconnected individuals that passively execute disks from a shrink- wrapped box, but are instead often far more involved in the software development and improvement process. Users currently demand bug fixes, patches, upgrades, forward compatibility, and security updates served to them over the ever-present network. Moreover, this ubiquity of access allows users to participate directly in the evolution process of deployed software. Users currently transmit error reports upon program failure in modern operating systems [MicrosoftErrorReporting ] and allow remote monitoring of their applications by software engineers for use in coverage ACM Transactions on Architecture and Code Optimization, Vol. TBD, No. TDB, Month Year, Pages 1–31.
Transcript
Efficient Remote Profiling
for Resource-Constrained Devices
Priya Nagpurkar, Hussam Mousa, Chandra Krintz, and Timothy Sherwood
University of California, Santa Barbara
{priya,husmousa,ckrintz,sherwood}@cs.ucsb.edu
The widespread use of ubiquitous, mobile, and continuously-connected computing agents has
inspired software developers to change the way they test, debug, and optimize software. Users
now play an active role in the software evolution cycle by dynamically providing valuable feedback
about the execution of a program to developers. Software developers can use this information to
isolate bugs in, maintain, and improve the performance of a wide-range of diverse and complex
embedded device applications. The collection of such feedback poses a major challenge to systems
researchers since it must be performed without degrading a user’s experience with, or consumingthe severely restricted resources of the mobile device. At the same time, the resource constraints
of embedded devices prohibit the use of extant software profiling solutions.To achieve efficient remote profiling of embedded devices, we couple two efficient hardware/soft-
ware program monitoring techniques: Hybrid Profiling Support(HPS) and Phase-Aware Sampling.HPS efficiently inserts profiling instructions into an executing program using a novel extension toDynamic Instruction Stream Editing(DISE). Phase-aware sampling exploits the recurring behaviorof programs to identify key opportunities during execution in order to collect profile information(i.e. sample). Our prior work on phase-aware sampling required code duplication to toggle
sampling. By guiding low-overhead, hardware-supported sampling according to program phasebehavior via HPS, our system is able to collect highly accurate profiles transparently.
We evaluate our system assuming a general purpose configuration as well as a popular hand-
held device configuration. We measure the accuracy and overhead of our techniques and quantifythe overhead in terms of computation, communication, and power consumption. We compareour system to random and periodic sampling for a number of widely used performance profile
types. Our results indicate that our system significantly reduces the overhead of sampling whilemaintaining high accuracy.
Categories and Subject Descriptors: C [3]: 0—Computer Systems Organization - Special-Purpose
and Application-Based Systems
General Terms: PerformanceAdditional Key Words and Phrases: profiling, sampling, resource-constrained devices, phasedbehavior
1. INTRODUCTION
The explosive growth and widespread use of the Internet has precipitated a signifi-cant change in the way that software is bought, sold, used, and maintained. Usersare no longer disconnected individuals that passively execute disks from a shrink-wrapped box, but are instead often far more involved in the software developmentand improvement process. Users currently demand bug fixes, patches, upgrades,forward compatibility, and security updates served to them over the ever-presentnetwork. Moreover, this ubiquity of access allows users to participate directly in theevolution process of deployed software. Users currently transmit error reports uponprogram failure in modern operating systems [MicrosoftErrorReporting ] and allowremote monitoring of their applications by software engineers for use in coverage
ACM Transactions on Architecture and Code Optimization, Vol. TBD, No. TDB, Month Year, Pages 1–31.
2 · P. Nagpurkar et. al
testing [Orso et al. 2002] and bug isolation [Liblit et al. 2003].The goal of our work is to extend remote monitoring so that it can be used
on resource-constrained devices, e.g., hand-helds and cellular phones, and to in-vestigate its efficacy for performance profiling. Performance profiling offers soft-ware engineers a unique opportunity to employ feedback from actual users to guideprogram optimizations that improve software performance and minimize resourceconsumption. Such optimization is vital since mobile device software has becomeincreasingly complex and is commonly released with performance bottlenecks or in-sufficient optimization, since developers cannot know exactly how the software willbe used in the wild. This problem is compounded by the infeasibility of providingextensive testing and optimization for all possible device configurations on whichthe programs will run.
In this paper, we present a hardware/software system for efficient remote per-formance profiling of resource-constrained systems. Our system collects sample-based profiles of program execution from user devices and transmits them back toan optimization center for analysis, possible re-coding, and re-compilation usingfeedback-based optimization, as part of the software evolution process.
Our system samples the program execution stream by turning profiling on andoff dynamically (i.e. toggling) using Hybrid Profiling Support (HPS). HPS is anextension of dynamic instruction stream editing (DISE) [Corliss et al. 2003b] ahardware approach for macro-expansion, i.e., automatic replacement of executinginstructions. HPS is very flexible (similar to extant software sampling systems) inthat it can implement a wide-range of different profile types and sampling scenariosdynamically (e.g., random, periodic, and program-aware [Arnold and Ryder 2001])via a flexible software interface. In addition, HPS is highly efficient (similar toextant hardware sampling systems) since it does not require code duplication orimpose any overhead other than for the execution of the instructions required forprofile collection (instrumentation).
We couple HPS with a novel and intelligent mechanism for toggling profile col-lection that achieves efficiency and accuracy through the exploitation of programphases. Using program phase behavior, we can summarize a software system asa minimal but diverse set of program behaviors in a manner that is distributed,dynamic, efficient, and that accurately reflects overall program behavior. Thisphase-aware mechanism also consists of both hardware and software components.The hardware efficiently monitors program execution behavior and makes predic-tions about when a new phase will occur. A software profiling daemon triggers HPSsample collection for each previously unseen phase.
Our work contributes a system that combines hybrid profiling support and phase-aware sampling. Prior to this work, phase-aware sampling relied on code duplica-tion to enable toggling of profile collection. HPS enables us to avoid code dupli-cation and to implement efficient phase sampling that imposes overhead only forthe instrumentation instructions that collect the profile data during sampling. Wedescribe how we combine these systems and use them study a number of differentprofile types that were previously shown to be important for feedback-directed op-timization, e.g. hot methods, hot call pairs, and hot code regions. We evaluateboth the profile accuracy and overhead of our system and compare our approachto commonly used periodic and random sampling strategies using a wide range of
ACM Transactions on Architecture and Code Optimization, Vol. TBD, No. TDB, Month Year.
Efficient Remote Profiling for Resource-Constrained Devices · 3
benchmarks (those developed for general purpose as well as embedded systems). Wealso evaluate the efficiency and battery consumption of our system for a resource-constrained environment. We consider both the computation and communicationrequired for remote profile collection and its transmission to an optimization center.
In the sections that follow, we first overview extant approaches to program sam-pling in hardware and software. We then describe our remote profiling system andits two primary components: Hybrid Profiling Support and Phase Aware Sampling.We then detail the design and implementation of each of these components in sec-tions 3 and 4, respectively. Finally, we present an extensive empirical evaluation ofour system in section 5 and conclude in section 6.
2. PROGRAM SAMPLING
The goal of our work is efficient performance profiling using a combination of hard-ware and software. We focus on techniques for the collection of incomplete infor-mation about program execution, i.e. program sampling. Sampling introduces lessoverhead than exhaustive profile collection at a cost of reduced profile accuracy.Profile accuracy is the degree to which a sample-based profile is similar to a com-plete, exhaustive profile. Sample-based profiling systems attempt to achieve thehighest accuracy with the least overhead.
Sample-based techniques have been shown to be effective when implemented ineither hardware or software. Examples of hardware-based profiling systems includecustom hardware that collects specific profile types [Dean et al. 1997; Gordon-Rossand Vahid 2003; Heil and Smith 2000; Merten et al. 1999], systems that utilizeexisting hardware to collect application-specific performance data [Anderson et al.1997; Itzkowitz et al. 2003; Peri et al. 1999], and programmable co-processors forprofiling [Zilles and Sohi 2001] and profile compression [Sastry et al. 2001].
These approaches require no modification to application code, are highly efficient,and in most cases, avoid adverse, indirect performance effects such as memory hi-erarchy pollution. The disadvantage to such approaches in addition to increasedhardware complexity and die area, is a lack of flexibility, i.e., the inability or dif-ficulty to re-program the hardware. For example, most approaches implement asingle profile type, e.g., instructions executed, branches, or memory accesses.
Software sampling systems offer improved flexibility, portability, and accuracyover hardware-based systems. Moreover, software systems can collect application-specific information easily without help from the operating system since they oper-ate at a much higher level of abstraction. Hardware systems, on the other hand, col-lect full system profiles, i.e., they are program-agnostic. Software systems, however,suffer from additional limitations. In particular, software systems introduce signif-icant overhead due to the instrumentations that gathers profile data and decideswhen to sample. Moreover, software profiling systems introduce indirect overheadin the form of memory hierarchy pollution, increased virtual memory paging, andfrequent CPU pipeline stalling. In addition to degrading performance, the indirecteffect of the profiling instrumentation can change the runtime application behaviorand further reduce the accuracy of the gathered information.
To design a sample-based profiling system we must answer three primary ques-tions: (1) how to toggle profiling on and off, (2) when to sample, and (3) how longto sample. One way to answer the first question is to simply insert the instrumen-
ACM Transactions on Architecture and Code Optimization, Vol. TBD, No. TDB, Month Year.
4 · P. Nagpurkar et. al
tation necessary to collect a profile of the events of interest immediately prior toall such events in the program [Grove et al. 1995; Holzle and Ungar 1994]. We canperform such instrumentation at the source, bytecode, or binary level.
One method that reduces the overhead of this exhaustive instrumentation is codepatching [Suganuma et al. 2002; Tikir and Hollingsworth 2002; Traub et al. 2000].Code patching is a dynamic instrumentation technique that modifies the execut-ing program binary to execute (or stop executing) the code for profile collection.In [Suganuma et al. 2002] for example, the compilation system inserts instrumen-tation into the prolog of methods. The instrumentation is a call to a procedurethat records method invocation (call path) events. After a fixed number of methodinvocations (samples), the system overwrites the profiling instructions so that fu-ture invocations execute unimpeded; eliminating all profiling overhead for uninstru-mented code. Unfortunately, code patching is error prone, significantly complicatesthe compilation and runtime system, and the process can impose additional over-heads (e.g. to flush the instruction cache).
An alternative approach to dynamic instrumentation for software sampling em-ploys code duplication [Arnold and Ryder 2001; Hauswirth and Chilimbi 2004;Hirzel and Chilimbi 2001; Nagpurkar et al. 2005]. Such systems duplicate someor all of the program binary (bytecode or native executable). The system insertsinstrumentations into the duplicate copy to collect the appropriate profile type(s),e.g. hot methods, memory accesses, etc. The original copy is also instrumentedwith a set of counters that decide when to transition to the instrumented profilingcode region. The system inserts these instrumentations at compile time [Arnoldand Ryder 2001; Nagpurkar et al. 2005], or at load time via static binary instru-mentation [Hirzel and Chilimbi 2001; Hauswirth and Chilimbi 2004].
To decide when to sample, sampling systems commonly employ random or pe-riodic sampling intervals [Sastry et al. 2001; Liblit et al. 2003; Orso et al. 2002;Whaley 2000; Arnold et al. 2000; Hazelwood and Grove 2003; SunHotSpot ; Arnoldet al. 2000; Cierniak et al. 2000]. Random sampling ensures that samples are statis-tically distributed over the execution of a program. Periodic sampling systems turnprofile collection on using timer interrupts from the execution environment. Thefrequency with which periodic and random samples are taken, however, does notaccount for repeating patterns in program execution. As a result, such schemes cancollect redundant profile information and can miss important events (code regions)completely.
Other sampling systems attempt to sample more intelligently – according to thedynamic program behavior [Arnold and Ryder 2001; Hirzel and Chilimbi 2001;Hauswirth and Chilimbi 2004; Arnold and D.Grove 2005; Nagpurkar et al. 2005].Such systems employ the code duplication model described above. These systemsinsert instructions in the uninstrumented code that manipulate counters to causecontrol to transfer to the instrumented copies when a threshold is reached. We re-fer to the overhead that these checks impose as the basic overhead. Basic overheadis introduced by these sampling systems constantly, regardless of weather profileinformation is actually being collected. Basic overhead accounts for 1-10% of ex-ecution time in a Java virtual machine sampling system [Arnold and Ryder 2001]and 6-35% in a binary instrumentation system (3-18% using overhead reductiontechniques that reduce the number of dynamic checks) [Hirzel and Chilimbi 2001].
ACM Transactions on Architecture and Code Optimization, Vol. TBD, No. TDB, Month Year.
Efficient Remote Profiling for Resource-Constrained Devices · 5
The final question a sampling system must answer is how long to profile oncesampling commences. Random and periodic sampling systems commonly collectinformation about a single event [Whaley 2000], an intelligent set of events [Arnoldand D.Grove 2005], or a fixed set of events (e.g. instructions or branches executed)immediately following the sampling trigger [Nagpurkar et al. 2005]. Systems thatrely on code duplication to toggle profile collection, commonly execute within theinstrumented code for a single pass (until the next loop back-edge or method in-vocation) [Arnold and Ryder 2001; Mousa and Krintz 2005] or for multiple passesdepending upon the profile type [Hirzel and Chilimbi 2001; Hauswirth and Chilimbi2004; Mousa and Krintz 2005].
2.1 Our Approach
As we describe above, each existing approach to program sampling has its strengthsand weaknesses. Hardware approaches are inflexible in terms of their configurationand types of profiles they collect. Software approaches enable flexibility but canintroduce significant overhead or employ methodologies that are infeasible for re-source constrained devices, e.g., code duplication. To address these limitations, wedesigned a novel sampling system that combines and extends extant technologiesin a way that is appropriate for embedded systems such as cellular phones andpersonal digital assistants (PDAs). The goal of our work is to enable remote per-formance profiling of deployed software in these environments that is transparent,efficient, and accurate.
The profiling system that we propose uses a hardware/software (hybrid) approachfor its implementation. It consists of two main components: Hybrid Profiling Sup-port(HPS) and Phase-Aware Sampling. HPS employs dynamic instruction streamediting [Corliss et al. 2003b] to turn profile collection on and off, i.e., to sample theexecuting instruction stream.
To enable efficient remote collection of accurate profile information, our mech-anism for deciding when to sample (i.e., when to turn on HPS profile collection)exploits program phase information. The way a program’s execution changes overtime is not random, but is often structured into repeating behaviors, i.e., phases.Using the description of phases from our previous work [Sherwood et al. 2001], aphase is a set of dynamic instructions(intervals) during program execution thathave similar behavior, regardless of temporal adjacency. Prior work [Sherwoodet al. 2001; Sherwood et al. 2002; Sherwood et al. 2003; Dhodapkar and Smith 2002;Duesterwald et al. 2003] has shown that it is possible to identify, predict, and createmeaningful classifications of phases in program behavior accurately. Phase behaviorhas been used in the past to reduce the overhead of architectural simulation [Sher-wood et al. 2002; Pereira et al. 2005] and to guide online optimizations [Dhodapkarand Smith 2002; Duesterwald et al. 2003; Sherwood et al. 2003].
In this paper, we employ program phase behavior in a novel way: to identifyintelligently a representative set of profiling points. The advantage we gain byusing phase information is that we only need to gather information about part ofthe phase and then use that information to approximate overall profile behavior.By carefully selecting a representative from each phase, we can drastically reducethe number of times that we need to sample and the amount of total communicationrequired for profile transmission to the optimization center. Since an interval will
ACM Transactions on Architecture and Code Optimization, Vol. TBD, No. TDB, Month Year.
6 · P. Nagpurkar et. al
0 1 2 3 4 5Instructions Executed (Billions)
0.00.10.20.30.4
uJ/In
str
Fig. 1. The figure shows the run-time power usage of the full execution of the program mpeg
encode.The program exhibits different phases, marked by periods of high and low power. A
random or periodic sampling method (the white triangles) will continue to take samples over the
full execution of the program. A more intelligent sampling technique based on phase information
(shown as black triangles) can achieve the same profile accuracy, by taking fewer key samples from
each phase.
be similar to all other intervals in a phase, it can serve as a representative ofthe entire phase. As such, only select intervals of the program’s phases need tobe collected (instrumented, communicated, and analyzed) in order to capture thebehavior of the entire program. This will make more efficient use of those limitedresources available on mobile devices. Furthermore, these low-overhead profiles willbe highly accurate (very similar to exhaustive profiles of the same program).
Figure 1 exemplifies our approach using actual energy data gathered from theexecution of the mpeg encoding utility. The execution of mpeg exhibits a smallnumber of distinct phases during execution that repeat multiple times. A randomor periodic sampling method will continue to take samples over the full execution ofthe program regardless of any repeating behavior. In Figure 1, the white trianglesshow where samples would be taken if sampling is done periodically to achieve anaccuracy error of 5% (i.e. the resulting basic block count profile is within 5% of theexhaustive profile). This has the unfortunate drawback that most of the sampleswill not provide any new information because they are so similar to samples seen inthe past. A more intelligent sampling technique based on phase information (shownas black triangles) can achieve the same error rate with significantly fewer samples.This is done by taking only key samples from each phase.
Figure 2 provides an overview of the interactions among the primary componentsof our system. The phase-aware sampler consists of a hardware phase trackerthat monitors the execution stream and predicts, for each interval in the program,whether the interval is in a previously seen or unseen phase. A software profilingdaemon triggers profile collection by the hybrid profiling support (HPS) systemfor representative intervals from as-yet-unsampled phases. We can also triggercollection directly via a connection between the phase tracker and HPS; we avoidthis approach since it restricts flexibility and system modularity.
HPS intercepts the instruction stream to dynamically insert instrumentation codefor instructions of interest (those to be profiled) when its sampling flag is set bythe phase-aware sampler. At the end of an interval, the profiling daemon clearsthe HPS sampling flag and all instructions execute unimpeded. The system storessamples locally for aggregation and transmission by the profiling daemon to theoptimization center, as needed. In the sections that follow, we first detail the HPSsystem (section 3) and then present phase-aware profiling and the interaction ofthese two components (section 4).
ACM Transactions on Architecture and Code Optimization, Vol. TBD, No. TDB, Month Year.
Efficient Remote Profiling for Resource-Constrained Devices · 7
Execution Pipeline
OS
Profiledata
Profile datastorage and aggregation
Code
HPSHybrid system to toggle the dynamically insertion
pf profiling code
ExtendedDISE
ProfilingProductions
Phase-Aware Sampling
Hybrid system to track recurring program phases to decide when to profile
PhaseTracker
ProfilingDaemon
Profiling Control
S/W
H/W
Fig. 2. Overview of the main components of our efficient profiling system for remote embedded
devices. The HPS system (section 3) is responsible for the dynamic insertion and toggling ofprofiling instructions. The phase tracking system (section 4) is responsible for deciding when togather profile information.
3. HYBRID PROFILING SUPPORT FOR TOGGLING PROFILE COLLECTION
To efficiently toggle profile collection, our system employs HPS, a hardware/software(hybrid) approach for dynamic profiling. HPS is an application and extension ofDynamic Instruction Stream Editing(DISE) [Corliss et al. 2003b]. DISE is a hard-ware mechanism that dynamically and transparently inserts instructions into theexecution stream thereby enabling semantics similar to macro expansion in the Cprogramming language.
Figure 3 is an overview of our HPS design. HPS consists of an extension to DISE(dark grey region in the hardware (H/W) section) that enables highly efficient, con-ditional, dynamic profile collection. HPS supports the toggling of profile collectionvia external triggers such as timer interrupts or periodic events. HPS also includesan internal flexible, program driven, triggering mechanism based on the samplingframework proposed by [Arnold and Ryder 2001] and extended by [Hirzel andChilimbi 2001]. Furthermore, HPS enables the profile consumer to specify arbi-trary instructions of interest and associate them with profile collection actions viaHPS and DISE based semantics. We next overview the DISE system and thendescribe how we extend DISE and apply it for efficient profiling in HPS.
3.1 Dynamic Instruction Stream Editing (DISE)
Hardware architects implement dynamic instruction stream editing by extendingthe decode stage of a processor pipeline. The extensions identify interesting instruc-tions and replace them with an alternate stream of instructions.
To enable this, DISE stores encoded instruction patterns and pre-decoded re-placement sequences in individual DISE-private SRAMs called the pattern table
(PT) and the replacement table (RT) respectively. The hardware compares (inparallel) each instruction that enters the decode stage against the entries in thePT. On a match, DISE replaces the original instruction with an alternate streamof instructions that commonly includes the original instruction. DISE retrieves thisstream of instructions from the RT according to an index generated by the PT.
ACM Transactions on Architecture and Code Optimization, Vol. TBD, No. TDB, Month Year.
8 · P. Nagpurkar et. al
Execution Pipeline
Application
SampleTrigger
Mechanism
DISE with HPSextensions
ProfileSpecifications
ProfilingParameters
ProfileConsumer S/W
H/W
Fig. 3. The Hybrid Profiling Support (HPS) system. HPS contains a hardware component which
is an extension of Dynamic Instruction Stream Editing(DISE). Software level mechanisms control
the profiling framework and provide facilities for the profile consumer to define their profiling
specifications (including instructions of interest and actions to be taken). HPS allows the profileconsumer to set the profiling strategy (e.g. triggering policy – exhaustive, periodic, programdriven, ...) and control the profiling parameters.
An Instantiation Logic (IL) unit is employed by DISE to parameterize thereplacement sequence according to specific information extracted from the originalmatched instruction. DISE also supports a small number of DISE-private hardwareregisters to enable efficient and transparent execution of the replacement sequenceinstructions without impacting the registers that an application uses.
The DISE mechanism operates within the single cycle bounds of the decode stageand imposes no overhead on instructions that are not replaced. For instructionsthat are replaced, DISE imposes a 1 cycle delay. DISE utilities operate concurrentlywith and transparently to the executing program and avoid polluting the memoryhierarchy in use by the program for instructions and data. Moreover, DISE is anabstract hardware mechanism for general purpose instruction stream editing. Usersof this mechanism can customize the operational design parameters and componentsof DISE to fit the needs and limitations of a particular architecture.
DISE users build utilities called Application Customization Functions(ACFs).Users define ACFs by writing a set of DISE productions each of which consists of apattern specification and a parameterized replacement sequence. The pattern spec-ification includes a binary function computed from the various instruction fields.The parameterized replacement sequence is a list of instructions with fields thatmay contain either precise values or directives for dynamically computing the valuebased on the matched instruction. The IL unit processes the directives dynamicallyas it generates the replacement sequence.
The progenitors of DISE have built DISE utilities for software fault isolation [Corlisset al. 2003b], dynamic debugging [Corliss et al. 2003b; 2005], and dynamic codedecompression [Corliss et al. 2003a; 2003b]. The authors also suggest and eval-uate a preliminary utility that uses DISE for exhaustive path profiling and codegeneration [Corliss et al. 2002; 2003b].
The wide range of supported utilities makes DISE a prime candidate for con-sideration in embedded architectures. By including a DISE mechanism, embeddedsystem designers can support a wide range of common runtime utilities simultane-ously. This can reduce the memory footprint of applications, since many of these
ACM Transactions on Architecture and Code Optimization, Vol. TBD, No. TDB, Month Year.
Efficient Remote Profiling for Resource-Constrained Devices · 9
utilities are otherwise supported through static software instrumentation. Suchinstrumentation increases the code size of the application and can degrade per-formance. By building on the general purpose framework of DISE, HPS bringsefficient profiling support to embedded systems with only incremental hardwarerequirements to the general purpose mechanism provided by DISE.
3.2 Hybrid Profiling Support using DISE
To profile exhaustively, HPS dynamically replaces instructions to be profiled witha replacement sequence consisting of the instrumentation, i.e., the profile collectioninstructions (or procedure call that implements them), followed by the originalinstruction. To enable this, we define a DISE pattern/replacement productionpair for each profile type: The pattern is the instruction type of interest and thereplacement is the profiling instrumentation and original instruction.
We perform sample-based profiling by guarding the instrumentation in the re-placement sequence with a check that first verifies whether sampling is turned on oroff, i.e., whether a sampling flag is set or not. The instrumentation is only executedwhen the sampling flag is set.
A limitation of this implementation is that each time an instruction of interestis executed, the instruction is replaced regardless of whether the sampling flag isset. This is due to the fact that the replacement sequence itself checks the flagfollowing replacement. This can result in a very large number of replacementsbeing performed which can introduce significant runtime overhead: a single cyclepenalty for each replacement and 2-5 additional instructions (and potentially apipeline flush) per profiled instruction. To reduce this overhead, we optimize andextend the DISE design.
3.3 Optimizing DISE for Efficient Sampling
To reduce the number of replacements that DISE performs, we extend DISE with anew functionality called conditional control. Conditional control, in essence, movesthe check of the sampling flag out of the replacement sequence (software) andinto the DISE engine (hardware). Conditional control enables HPS to instrumentprofiled instructions only while the sampling flag is set. To enable conditionalcontrol, we modify the DISE engine and production specification.
Figure 4 shows the DISE extensions that enable our efficient implementation ofHPS. Instead of requiring that pattern specifications in the DISE ACF be imple-mented using unconditional matches, we allow conditional pattern specification. Weadd a masking layer which implements conditional matching based on the statusflags of internal counters (we currently consider only overflow and zero status flags).
HPS manages internal counters using micro-instructions that are defined as partof the DISE productions. HPS stores these microinstructions in an associativetable that we have defined called the Conditionals Table (CT). The CT is similarin structure (but smaller in size) to the pattern table (PT) defined as part of theoriginal DISE infrastructure. The RT is part of the original DISE implementationand holds the replacement instruction sequences.
We define a set of lightweight micro-instructions to manage the internal countersand extend the pattern specification language to allow for checking of the statusbits. The operations include only those that can be implemented with simple logic
ACM Transactions on Architecture and Code Optimization, Vol. TBD, No. TDB, Month Year.
10 · P. Nagpurkar et. al
Fetch ExecuteNative decoder
Extended PT
RTI L
“Extended” DI SE EngineFor Hybrid Profiling
Support (HPS)
PT
Fetched instructions
Original or original & instrumented
instructions
CountersStatus Flags
ConditionalController
CT
Pipeline Components
Base DISE Components
Extended DISE Components
Fig. 4. HPS extensions to DISE. HPS moves conditional control of instrumentation out of the
Fig. 5. HPS pattern and replacement specification grammar (extended from the original DISE
production specification grammar).
and executed within the cycle bounds of the decode stage. These include increment,decrement, checking of status (zero and overflow) flags, and copying a value froma HPS-internal register to a counter.
Figure 5 shows the extended DISE production specification that enables condi-tional control within a DISE ACF. We extend the root production, (DISE Production)and the Pattern production to implement conditional control. We added Condi-tional Control and Conditional productions that allow the ACF writer to specifysimple conditional expressions. These expressions check the status flags for a partic-ular counter for overflow and zero. The microinstructions that we defined are inc Nand dec N which increment and decrement DISE counter N, respectively (where Nvaries between 0 and the number of DISE-private counters). The microinstructionset N (dise reg) sets counter N with a value retrieved from the DISE-private reg-ister dise reg. A production can set the Conditional Control section to null if noconditional microinstruction is required.
Although we allow for arbitrary logic expression on the status bits associatedwith each counter, in actuality, the number of possible logic functions for a finiteset of counters is limited to:
(numberOfCounters ∗ numberOfStatusBits)2
We only consider two status bits: overflow and zero. The number of counters is adesign parameter, and can be as small as 2 (e.g., to implement bursty tracing), orsome higher number to allow for more elaborate profiling schemes or functionality.HPS designs with a small number of counters can be efficiently implemented using
ACM Transactions on Architecture and Code Optimization, Vol. TBD, No. TDB, Month Year.
Efficient Remote Profiling for Resource-Constrained Devices · 11
a simple truth-table stored in a small n × 1 memory (n is 16 for our particulardesign instance). This small lookup table implements the functionality of the CTand allows us to constrain the processing delay to within the cycle bounds of thedecode stage. The PT processing delay is also within the single cycle bounds of thedecode stage as described in the original DISE architecture [Corliss et al. 2003b].
Another DISE extension that we make for HPS is to enable specification of pat-tern productions without replacement sequences. This change is reflected in theoptional Replacement production: null. When HPS encounters a pattern pro-duction rule with a null replacement specification, the pattern match fails uponcompletion. As a result, HPS simply forwards the current instruction through thedecode stage unimpeded, while still permitting local conditional microinstructions.This implementation (match failure upon encountering a null replacement) is keyto enabling low overhead in HPS, since the 1-cycle penalty is imposed only whenan instruction is replaced.
3.4 Taking Samples
HPS is flexible in that it can implement a number of different, existing or novel,simple or complex, sample triggering strategies. We use HPS for two different typesof sample triggers: an external trigger or an internal HPS-managed trigger.
External Sampling Triggers
To take periodic or random samples, we can trigger sampling by HPS using anexternal signal such as a timer or randomly generated interrupt. To do so requiresthat authorized software be able to set and unset the sampling flag. To enable this,we use a variation of the Aware ACF described in [Corliss et al. 2003b]. We definean HPS production that is matched by a special purpose no-op instruction (usuallyone of the reserved instructions in the instruction set architecture (ISA)). We referto this instruction as on trig inst. The execution of this special instruction willcause the sampling flag (in this instance the zero status flag of counter number 0)to be turned on.
P0 : T.OP == on trig inst → set 0(HPS R0), null (1)
This production specifies the pattern T.OP == trig inst as a successful match.T.OP is an attribute of the instruction being decoded that identifies the opera-tion code of the instruction. On a match, HPS attempts to use the replacement(set 0(HPS R0), null). set 0(HPS R0) is a conditional microinstruction whichcauses HPS to copy the contents of the DISE-private register HPS-R0 to counter0. HPS R0 holds the constant 0. Since the replacement also contains null, theproduction fails and the original instruction executes unimpeded. We can use a dif-ferent special instruction to turn off the sampling flag (in this case the HPS registerHPS-R1 holds the value 1:
P0 : T.OP == off trig inst → set 0(HPS R1), null (2)
(We can also use the microinstruction inc 0 to increment the counter and implicitlyclear the zero flag causing sampling to stop).
Profile consumers make use of these status bits as part of their profiling (in-strumentation) productions. For example, if we are interested in profiling method
ACM Transactions on Architecture and Code Optimization, Vol. TBD, No. TDB, Month Year.
12 · P. Nagpurkar et. al
invocations, we use the following production:
P0 : T.OPCLASS == proc call&&zero 0 → null, RO
R0 : call(HotMethod Handler);T.INSN
In the above example, whenever the instruction of interest is encountered (pro-cedure call) and if the zero flag of HPS counter number 0 (also referred to as thesampling flag) is true (on), the replacement sequence R0 is streamed into the exe-cutions stream. R0 is simply a call to the profile handler and the original matchedinstruction (T.INSN). When the sampling flag is off (i.e. zero 0 is false), the pat-tern of P0 will fail and the original instruction is forwarded through the pipelineunimpeded.
Internal Sampling Triggers
The HPS design also supports the implementation of more complex sampling schemes,such as the sampling framework introduced by Arnold et al. [Arnold and Ryder2001] and extended in [Hirzel and Chilimbi 2001; Hauswirth and Chilimbi 2004].The sampling framework uses code duplication, instruments one copy with pro-filing instructions and transfers control from the uninstrumented to the instru-mented copy according to a counter and conditional checks. The counter (samplingcounter(s)), maintained in the uninstrumented code, is incremented on each loopback edge (backward branch) and method invocation. When it exceeds a giventhreshold, control is transfered to the instrumented code. While in the instru-mented code, profiling data is collected, usually at the expense of reduced perfor-mance. Control is transfered back to uninstrumented code at the next backwardbranch or method invocation. The extension to the sampling framework is calledbursty tracing and allows the system to remain in the instrumented code regionfor a variable burst length, i.e. multiple passes through the checking boundaries(method invocations and loop backedges). Longer bursts are enabled by insertingburst counters and conditional checks in the instrumented copy. In addition, mul-tiple counters can be used in the uninstrumented code to allow for more complexprofiling coverage [Hauswirth and Chilimbi 2004].
We can use HPS to implement the sampling framework without code duplica-tion and without introducing any checking overhead (the cost of incrementing andchecking the sampling flag in the uninstrumented code and of the burst flag ininstrumented code - also known as the basic overhead [Arnold and Ryder 2001]).We articulate the details of doing so and the necessary productions that enable thisin [Mousa and Krintz 2005]. In summary, we implement the sampling and burstflag manipulation as HPS counters (in hardware). When sampling is turned offand a backward branch or method invocation is encountered, HPS increments thesampling flag counter. When that counter overflows (implicitly setting the overflowflag), sampling commences. When this flag is set and HPS encounters an instruc-tion of interest, HPS replaces the instruction with the profiling instrumentation aspreviously described. When sampling is turned on and HPS encounters a back-ward branch or method invocation, HPS increments the burst counter. When theburst counter overflows, HPS resets the sampling and the burst counter to theirinitial values (turning off the overflow bit of the sampling counter and terminat-
ACM Transactions on Architecture and Code Optimization, Vol. TBD, No. TDB, Month Year.
Efficient Remote Profiling for Resource-Constrained Devices · 13
ing the sampling session). The initial values of the sampling and burst flag is themaximum counter value minus the sampling and burst threshold, respectively.
This HPS implementation of the sampling framework eliminates all basic over-head from the maintenance and checking of sampling and burst counters in software.We evaluate the benefits of using HPS for sample-based profiling in [Mousa andKrintz 2005]. We show that by using HPS we reduce the cost of profiling by upto 19% (average 11%) as compared to software-based sampling techniques [Arnoldand Ryder 2001; Hirzel and Chilimbi 2001]. We achieve these reductions whileeliminating the need for code duplication and while maintaining the flexibility andease of use characteristic of a software system.
Furthermore, for any sample triggering strategy, internal or external, HPS im-poses no profiling overhead on the executing program, weather direct or indirect,when the sampling flag is unset (i.e. sampling is turned off). The only sourceof overhead HPS imposes on program execution is the profiling overhead. Profil-ing overhead is the cost of executing additional instructions for profile collection.The amount of profile overhead imposed by HPS depends on the duration of thesampling period and the profile type. The profile type dictates which instructionsare inserted into the code and the points at which this code is inserted. We nextdescribe how to specify productions for different profile types.
3.5 Specifying Profile Types in HPS
HPS is flexible in that it can implement any instruction-based profiling technique byspecifying an ACF for each profile type. We use HPS to implement three differentprofile types: hot code region, hot call pair, and hot method. These profile typesare widely used in dynamic and adaptive optimization systems [Arnold et al. 2000;Cierniak et al. 2000; SunHotSpot ].
Code regions are profiles that estimate basic block behavior and are generallyefficient to collect. Each event in the profile is a dynamic branch; the data value forwhich is the cumulative number of instructions since the previous dynamic branch.Method profiles estimate the time spent in a method; for each method, we recordthe number of invocations as well as the number of backward branches taken. Callpair profiles are invocation counts for each caller-callee pair executed. We use theterm “hot” to indicate that we are interested in the events with the highest values(i.e. that are most frequently occurring).
We show the HPS productions for each of these profile types in Figure 6. Asbefore, P identifies a pattern production and R identifies a replacement production.These ACFs execute no conditional microinstructions. They do employ conditionalreplacement however – only when the zero status register of HPS internal counter0 is set, will HPS replace a matched instruction. These productions are controlledby the external trigger sampling strategy described above.
Currently we insert a call to the profile collection routine for each profile type.The typical size of a profile handler is a few hundred bytes. As such, severalprofile types can be implemented at once. We consider only a single profile typeat a time in our evaluation of HPS. The only additional change required to enablecollection of multiple profile types at once is to have multiple profile productionsactive simultaneously while merging the pattern specifications and replacementsequences of overlapping profiles.
ACM Transactions on Architecture and Code Optimization, Vol. TBD, No. TDB, Month Year.
14 · P. Nagpurkar et. al
Profile Type Productions
Hot Code Region AnalysisP1: T.OPCLASS == branch && zero_0 R1, nullR1: call(Branch_handler,T.INSN);
Fig. 6. Pattern and replacement productions for the three different profile types that we investi-gated for remote performance profiling of deployed, embedded device software: hot code region,
hot method, and hot call pair profiling.
In the next section, we detail how we set the HPS sampling flag (i.e. apply anexternal trigger). Specifically, we use intelligent, phase-based, selection of profilingpoints to guide HPS sample toggling. When the phase-aware sampler designates aprogram execution interval to sample, it sets the HPS sampling flag (moves 0 intoHPS counter number 0 to set the counter’s zero status). The sampler unsets thecounter at the end of the interval – thus imposing no overhead on the execution ofunsampled intervals.
4. PHASE-AWARE SAMPLING
Figure 7 depicts our implementation of Phase-Aware Profiling. The system con-siders individual, fixed-length periods of program execution at at time. We usean interval length of 10 million instructions in this paper. To predict the phasein which a future interval will be, we employ the Phase Tracker hardware that weproposed in prior work [Sherwood et al. 2003]. The Phase Tracker is a small, lowarea, low overhead hardware resource that consumes approximately 4 picojoules ofenergy per dynamic branch (this means that on a high speed machine that executes1 branch every 2ns, it will consume around 2 mW). The Phase Tracker (figure 7:A)collects the dynamic branch behavior of a program into intervals and segregates theintervals into phases according to a similarity threshold computed from the intervalexecution characteristics.
The Phase Tracker uses a similarity threshold to govern the number of phasesgenerated from the set of intervals executed by the program. A higher thresholdvalue will generate fewer phases, each consisting of more intervals, but with ahigher similarity variance across the intervals of any single phase. The thresholdcan therefore be adjusted according to the desired sampling rate, and the resultingprofile will represent the most diverse and relevant sets of dynamic behavior.
The Phase Tracker uses the program counter value of branch instructions, alongwith the number of executed instructions between branches, to produce a predictionfor the phase of the next interval (the complete details on the prediction processcan be found in [Sherwood et al. 2003]). Prior work has shown the accuracy of thePhase Tracker phase prediction to be 85-90% [Sherwood et al. 2003]. We assumea prediction accuracy of 100% in this work; as such, our results indicate an upperbound on the potential of phase-aware profiling performance. [Pereira et al. 2005]
ACM Transactions on Architecture and Code Optimization, Vol. TBD, No. TDB, Month Year.
Efficient Remote Profiling for Resource-Constrained Devices · 15
Phase Tracker
ID Sam ple? Count
#inst
PC
Phase ID
WirelessNetworkInterface
A
B E
Hybrid Profiling Support (HPS)
OS
Code
C
Profile Buffer
Phase T
race
D
Fig. 7. Overview of the phase-aware profiling scheme. Phases are tracked in hardware (A) and the
results are fed to a small table that tracks the state of each phase (B). When a phase is deemed
to be important, the profiler (HPS) is notified and a sample is taken (C). The sample is stored in
a small profile buffer (D). This information is then transmitted back to a trace aggregation center
(E).
use a similar methodology to our phase-aware sampling system to significantly re-duce the overhead of cycle-accurate architectural simulation. The phase tracker inthis work identifies and simulates intervals that represent unique (per-phase) execu-tion behaviors. This prior work does not assume perfect Phase Tracker predictionand achieves a 3.2% error in cycle count on average over exhaustive simulation.
Since the Phase Tracker is in hardware, it monitors the entire system, i.e. it isshared by multiple processes (much like hardware performance monitors (HPMs)).In our system we use the Phase Tracker to monitor a single process at a time. Todistinguish per-process phase data, the operating system toggles phase tracking, viaa register in the Phase Tracker hardware, upon a context switch. We only considersingle-process phase tracking in this work; we plan to consider concurrent phasetracking as part of future work.
The Phase Tracker outputs a phase ID, which is a unique identifier for the be-havior likely to be observed in the next interval. We store the phase IDs in a smalltable which tracks each phase and identifies when a sample should be taken. Wehave found that a fully associative table of size 20 is sufficient to minimize the num-ber of misses using random replacement. In general, the worst case is one in whichtwo similar behaviors are sampled more than once as a result of a table miss. Theperformance effects from such misses, however, are negligible for tables of this size.The table tracks a list of phase IDs and stores a “sampled bit” that indicates if thephase has already been sampled. Additionally, we record a count of the number oftimes this phase has been seen in the past.
When the Phase Tracker predicts that the next interval is one from a previouslyunseen phase, it signals a lightweight profiling daemon (background thread). Thedaemon tracks the number of intervals encountered for newly executed phases andselects the most appropriate one for sampling.
Ideally, the most representative interval - i.e. most similar to the phase’s otherintervals - should be selected for profiling. Doing so online, however, is a challengebecause we are not aware of the occurrence of future phase intervals. Therefore,we use a heuristic that quickly identifies a representative interval so that we do notmiss the profiling of important phases. In our evaluation section, we consider usingone of the first initial intervals encountered for a new phase and compare this pol-
ACM Transactions on Architecture and Code Optimization, Vol. TBD, No. TDB, Month Year.
16 · P. Nagpurkar et. al
icy to oracle-based approaches (centroid and random) that use future knowledge toidentify the best representative interval of a phase. In general, we find that the firstinterval encountered is not a good representative since it commonly contains exe-cution behaviors from the previous phase or a phase transition. The third intervalis commonly sufficient to avoid this “warm-up” period.
Once the daemon identifies an interval to sample, it executes a special profile-toggling instruction. This instruction is equivalent to a no-op (it performs no workand imposes a single cycle pipeline performance penalty). Only authorized agents(processes that are granted such permission by the Operating System, e.g. theprofiling daemon) may execute this instruction. Consuming this instruction causesHPS to set the sampling flag (figure 7:C). This is the external trigger scenariodescribed in section 3.4. This simple mechanism is implemented using a singleHPS-private counter and requires a single instruction to turn profiling on and off.
When HPS encounters this instruction during the decode stage of the pipeline,it will match it against the pattern in production P0 from Equation 1. This pat-tern causes HPS to execute the microinstruction set 0 specified in the conditionalcontrol section of P0. This will set the zero status flag in HPS-private counter 0.This status bit acts as the HPS sampling flag. When HPS encounters the nextinstruction of interest (event to be sampled), it replaces the instruction with thecall to the profiling event handler as defined by the productions in figure 6. HPSdoes so dynamically for each instruction of interest until the sampling flag is turnedoff. At which time HPS simply forwards the instructions of interest through thepipeline unimpeded. The instructions of interest are those for which there are pro-filing production sequences such as those described in section 3.5 for the externaltoggle HPS scenario.
Once the profile has been generated, the profile daemon stores it in a specializedprofile buffer and tags the profile with the phase identifier (figure 7:D). In additionto the profile data, the daemon records a trace of phase IDs from intervals inpreviously seen phases. This enables us to reconstruct accurate a time-varyingbehavior of the program if necessary.
Once the buffer fills, we must empty it via network transmission. At this point,the profile daemon transfers the profile over a wireless network back to some datacenter for further study and analysis (figure 7:E). In our embedded system study(section 5.4), we evaluate the efficacy of transferring data intermittently while theprogram is executing (e.g. when storage is limited) as well as transferring the com-plete phase trace once the program terminates. Since communication consumessignificant battery power in mobile devices, we must ensure that we minimize thenumber of bytes transfered. As such, in addition to using phase behavior to reduceprofile size, we also incorporate compression of the trace prior to transmission.However, the application of compression consumes computational resources. Weinclude the effect of this tradeoff (increased computation for decreased communi-cation due to compression) as part of the empirical evaluation of our approach. Ingeneral, we found that the benefit of compression due to the reduced communica-tion overhead far outweighs the computational overhead we introduce in terms ofbattery power.
ACM Transactions on Architecture and Code Optimization, Vol. TBD, No. TDB, Month Year.
Efficient Remote Profiling for Resource-Constrained Devices · 17
5. EMPIRICAL EVALUATION
In this section, we evaluate the efficacy of our remote profiling system. We firstoverview our empirical methodology. We then present an evaluation of our DISEextensions that enable HPS (subsection 5.2), and of the accuracy and overhead ofour system (subsection 5.3) using a general-purpose benchmark suite and processor.In subsection 5.4 we evaluate our system in the context of a resource-constraineddevice, its applications, and its power consumption.
5.1 Methodology
We employ a cycle-accurate simulation platform and simulator parameterizationidentical to that used in the original DISE studies [Corliss et al. 2002; 2003a; 2003b;2005]. The platform is an extension to SimpleScalar [Burger and Austin 1997] forthe Alpha processor instruction set and system call definitions.
Our simulation environment models a 4-way superscalar MIPS R10000-like pro-cessor. It simulates a 12 stage pipeline with 128 entry reorder buffers and 80reservation stations. Aggressive branch and load speculation is performed and anon-chip memory with 32KB instruction and data caches and a unified 1MB L2cache is modeled. The DISE mechanism (and HPS system) is configured with 32PT entries and 2K RT entries each occupying 8 bytes. We also modified the simu-lator to emulate the capture of phase information as described in [Sherwood et al.2003] with an interval size of 10 million instructions. We extend the DISE simu-lation engine to export the semantics of the conditional controls that we define insection 3.
To generate the instructions for profile collection using each of our three profiletypes (section 3.5), we write the code using the C language and compile it forour target platform (Alpha EV6). We hand-optimize the generated assembly toensure compactness. We also insert a no-op instruction to simulate the single cyclestall associated with each replacement. The no-op instruction produces the desiredresult since the stall due to DISE replacements only affects the decode stage (i.e.delays the propagation of the single instruction that is macro-replaced) and doesnot impact the later pipeline stages.
We evaluate the performance and profile quality of our system using the bench-marks of the SPECINT2000. We compile the benchmarks for the Alpha EV6platform using GCC 3.2.2 with the -O4 optimization flag. We report results forcomplete runs on the train input set. We considered other inputs and found thetrends in our data to be the same as that we present herein.
Figure 8 shows some of the dynamic behavior metrics for the SPECINT2000benchmarks used in our empirical studies. Method count is the number of uniquemethods in the benchmark while Call sites is the number of static call operations.Call Pairs is the number of unique call site and target address pairing observed inthe dynamic execution of the benchmark. The extra number of call pairs beyondthe number of call sites indicates a number of indirect jumps. Call count is thenumber of dynamic calls made during the benchmark’s execution. Dynamic BranchCount and Dynamic Instructions is the the number of branches and instructionsexecuted, respectively. These dynamic metrics are relevant to the performanceprofiles we investigate: hot code region (branches), hot method, and hot call pair
ACM Transactions on Architecture and Code Optimization, Vol. TBD, No. TDB, Month Year.
Fig. 8. Select Benchmark statistics relevant to the profiles collected.
profiles.
5.2 HPS Performance
We first evaluate the performance impact of our HPS extensions that enable condi-tional control within the DISE engine. Figure 9 shows the overhead of sample-basedhot code region (top graph) and hot call pair (bottom graph) profiling using DISEwithout conditional controls (left bar) and with our HPS optimizations (right bar).Each bar is the execution time for each program normalized to execution withoutDISE and without profiling. For this data, we use periodic sampling at a frequencyof 1/100 events.
The data shows that HPS (i.e. DISE with conditional controls) significantly re-duces the overhead of a naive, DISE sampling strategy. The overhead that HPSintroduces is profiling overhead alone – the cost of executing the extra instrumen-tation instructions for each event of interest. The DISE data includes this overheadas well as the basic overhead for manipulating the sampling flag and the cost ofchecking that flag as part of the unconditional replacement sequences.
On average, DISE sampling introduces a 120% increase in execution time for hotcode region (branch) profiling, while HPS only introduces a 24% increase. For hotcall pair profiling the overhead of DISE sampling is 18%, while HPS’s overheadis only 1.3%. Hot method profiling exhibits performance characteristics that aresimilar to hot call pair profiling. As such, we omit this data for brevity.
5.3 Phase-Aware Sampling
To evaluate the impact of remote profiling, we examine its accuracy versus itsoverhead using four different profile collection strategies:
—Exhaustive - gather an exact profile for each interval. We use this strategy toevaluate the accuracy of the other policies.
—Periodic Sampling - gather a profile every Nth interval, for N in [3,100].
ACM Transactions on Architecture and Code Optimization, Vol. TBD, No. TDB, Month Year.
Efficient Remote Profiling for Resource-Constrained Devices · 19
Hot Code Region (Branch) Profiling
Hot Call Pair Profiling
Fig. 9. DISE vs HPS for performance sampling: The overhead introduced by eachof the individual profile types. The DISE data is the overhead of sampling withoutour HPS extensions (i.e. moving sampling flag manipulation and checking intothe DISE engine). The right bar is the overhead introduced by HPS (i.e only theprofiling overhead). The top graph is the overhead for profiling code regions (anestimation of basic block behavior). The bottom graph is the overhead for profilingcall pairs. We omit the graph for method profiling for brevity since it is similar tothat for call pair profiling. On average DISE introduces 120% overhead for coderegion profiling and 18% for call pair profiling. HPS introduces 23% and 1.3%overhead, on average, for these profile types respectively.
ACM Transactions on Architecture and Code Optimization, Vol. TBD, No. TDB, Month Year.
20 · P. Nagpurkar et. al
Fig. 10. Evaluation of representative selection policies. The graph shows the average error in block
counts at 1% sample rate for different representative selection schemes. The black bar shows theperformance of average random sampling (non-phase-based).
—Random Sampling - gather a profile for interval i with a probability of 1/P forsome P
—Phase-based - gather a profile for every interval that is dissimilar from all previ-ously gathered intervals, given some threshold of similarity.
For the periodic and random strategies, we gather data for different samplingfrequencies. The number of intervals we profile, and therefore the percentage oftotal execution that we profile, depends on the sampling period N. We performexperiments for a range of sampling frequencies which correspond to a range ofoverheads and accuracies. Because a truly random strategy is at the whim ofchance as to whether or not it performs well, we characterize two aspects of randomprofiling for each of the different percent-sampled values: 1) we compute the averageerror across 10 runs (avg random), and 2) we compute the maximum error seenacross 10 runs (max random). To get a range of accuracies and overheads, we adjustthe parameter P and examine the effect.
For phase-aware profiling, as we have described previously, we begin with animplementation of the phase prediction system that we have developed in priorwork [Sherwood et al. 2003]. We identify empirically, the best interval from eachphase to act as the representative from that phase. Figure 10 shows the percentageerror at 1% sampled for four different representative selection policies for phase-based profiling. The y axis shows percentage error in basic block counts. Thedifferent polices for representative selection that we evaluate are (a) first: selectthe first interval as the representative, (b) centroid: select the centroid of theintervals in the phase as the representative, (c) third: select the third interval asthe representative. (d) random: randomly select one representative from all intervalsin the phase (we report performance for this strategy as the average performanceof 5 selections). For comparison, we also show the error that the random samplingstrategy, that we describe above, produces. This strategy chooses random samplesfrom the entire program (black bar on far right).
ACM Transactions on Architecture and Code Optimization, Vol. TBD, No. TDB, Month Year.
Efficient Remote Profiling for Resource-Constrained Devices · 21
0 5 10 15 20 25% Program Sampled
0
5
10
15
20
% E
rror
in C
ode
Reg
ion
Pro
file
avg randommax randomperiodicphaseaware
Fig. 11. Average error in code region profile for various sampling percentages.
As expected, the centroid method, centroid, performs the best: its error remainslow even when we sample very little of the program. First and random performthe worst. This happens since the first is not representative of the steady state (thephase is just warming up) and because selecting randomly can result in selectionof a representative that is dissimilar to all others. Third enables accuracy that isbetween that of best and first/random. That is, third is able to select an intervalthat is more representative of the steady state of the phase than first and random.Moreover, third is simple and can be implemented without additional overhead.As such, we use third for the rest of the results in the paper.
Unlike the random and periodic sampling approaches, there is no sampling fre-quency variable that we can vary to get different tradeoff points between accuracyand overhead. Instead, we achieve a similar effect by dynamically tuning the simi-larity threshold. The similarity threshold determines the cutoff point at which twointervals are said to be similar and hence are part of the same phase. As we lowerthe threshold, the system detects more unique phases, each with a fewer numberof intervals. As this occurs, the system takes more samples (since there are moreunique phases). This both increases the percentage of the program’s execution thatthe system samples and improves the accuracy of the resulting profile.
Profile Accuracy vs Overhead
To measure profile accuracy, we compare each sampled profile to the exhaustiveprofile. We compute the percentage error in the code region profiles as our accuracymetric. The code region profiles contain counts for each dynamic branch. Wecompute the element-wise difference in branch counts between a sampled profileand the exhaustive profile. We then divide this value by the total counts in theexhaustive profile to produce the error percentage. The best sampling strategy isthe one that produces the least amount of error for the smallest percentage of theprogram that is sampled.
Figure 11 shows the average error across benchmarks using the third intervalof each phase as the phase representative. The graph compares the accuracy ofeach of the different sampling strategies, avg random, max random, periodic, andphase-aware. The y-axis is the error percentage in total branch counts (not just
ACM Transactions on Architecture and Code Optimization, Vol. TBD, No. TDB, Month Year.
22 · P. Nagpurkar et. al
the hot branches which we study later) and the x-axis is the percentage of theprogram that was sampled for a given parameterization of each strategy.
The data indicates that on average, phase-aware profiling achieves lower errorfor small percent-sampled values than the other strategies. The error for periodicsampling approaches that of phase-aware sampling for some percentages sampled– both approaches require 10% of the program to be sampled to achieve 5% orless error. The random strategy requires that 20% of the program be sampled toachieve an error of less than 5%. For lower percent sampled values, the benefitsfrom our system increase substantially.
We next demonstrate that phase-aware sampling is not restricted to any singleprofile type by showing that it performs well for others. We evaluate the efficacyof each of the sampling strategies in identifying frequently executing parts of theprogram. Profiles that capture frequently executing parts are commonly used forfeedback directed optimization, e.g., hot code regions, hot methods, and hot call-pairs, and as such are important profile types for our distributed optimizationsystem. We measure the error produced by each of the profiling strategies for theseprofile types. We define “hot” as the top 15% of the most frequently executedevents.
Figure 12 shows the results. The x axis is the percent of the program that wassampled, and the y axis is the percentage error in identifying hot branches, hotcall-pairs and hot methods, on average across benchmarks. We omit max randomand average random data from the hot call pair graph since both were in a rangesignificantly larger than the other strategies. Average random ranges from 33-53%error and max random ranges from 49-64% error.
The graphs show that the phase-aware strategy performs considerably betterthan both random and periodic sampling for all three profile types. Assuming anerror of 5%, the phase aware strategy needs only to sample 5% for hot methods andhot branches, and 20% for hot call pairs. Periodic sampling performs similarly tophase-aware sampling for call pairs, but requires that we sample 10% of the programfor hot methods and 20% of the program for hot branches. Random sampling rarelyachieves an error of 5% or less; however, it does so for hot methods for which itrequires that we sample 20% of the program.
In Figure 13, we quantify these overhead percentages (assuming 5% error) forindividual benchmarks using three tables. The top table is for hot code region(dynamic branch) profiling, the middle table is for hot method profiling, and thebottom table is for hot call-pairs. We chose 5% error as our cutoff arbitrarily;however, we selected a value that we believe to be tolerable and amortized bycommonly used, profile-based, dynamic optimizations. For lower error values, thebenefits of our system increase significantly since phase aware profiling is able toextract unique and important program behaviors by sampling only a very smallportion of the execution.
Each table reports data for the three profiling strategies: phase-based, periodic,and (averaged) random sampling. For average random, if the error does not reach5% or less, we use a percent sampled value of 25%. The data in columns two, three,and five show profiling overhead in millions of cycles for each of the benchmarks.Columns four and six show the percent reduction in this overhead due to phase-aware sampling.
ACM Transactions on Architecture and Code Optimization, Vol. TBD, No. TDB, Month Year.
Efficient Remote Profiling for Resource-Constrained Devices · 23
0 5 10 15 20 25% Program Sampled
0
5
10
15
20
25
% E
rror
in C
ode
Reg
ion
Hot
ness
avg randommax randomperiodicphaseaware
(1) Hot Code Region Profiling
0 5 10 15 20 25% Program Sampled
0
5
10
15
20
25
% E
rror
in M
etho
d H
otne
ss
avg randommax randomperiodicphaseaware
0 5 10 15 20 25% Program Sampled
0
5
10
15
20
25
% E
rror
in C
allp
air
Hot
ness
periodicphaseaware
(2) Hot Method Profiling (3) Hot Call-pair Profiling
Fig. 12. Efficacy of different sampling strategies for different profile types. We omitmax random and average random data from the hot call pair graph since both werein a range significantly larger than the other strategies. Average random rangesfrom 33-53% error and max random ranges from 49-64% error.
The final row in each table shows the average across benchmarks. For hot code re-gions, phase-aware profiling reduces the overhead of periodic and random samplingby 76% and 80%, respectively, on average. This reduction is 50% and 76%, respec-tively, for hot methods. The primary reasons for these benefits are two-fold: (1)Random and periodic sampling collect redundant information (i.e. profiles of theexecution that they have already collected); and (2) random and periodic samplingtechniques miss important behaviors (which degrades accuracy) which phase-awaresampling is able to capture.
For hot call pairs, phase-aware sampling reduces the overhead of random sam-pling by 22% on average. However, as visible in the graphs in Figure 12, phase andperiodic sampling perform similarly for this profile type. For some benchmarks,periodic sampling for hot call pairs outperforms phase-based sampling. One reasonfor this is that the absolute number of hot call pairs is very small for most bench-marks. As a result, one or two missed pairs can result in a significant increase inpercentage error. This is the case for bzip2.
ACM Transactions on Architecture and Code Optimization, Vol. TBD, No. TDB, Month Year.
24 · P. Nagpurkar et. al
(1) Hot Code Region Profiling
(2) Hot Method Profiling
(3) Hot Call Pair Profiling
Fig. 13. Overhead of different sampling strategies for different profile types, assum-ing a 5% error rate. The data in columns 2, 3, and 5 is the profiling overhead inmillions of cycles. Columns 4 and 6 show the percent reduction in this overheaddue to phase-aware sampling.
ACM Transactions on Architecture and Code Optimization, Vol. TBD, No. TDB, Month Year.
Efficient Remote Profiling for Resource-Constrained Devices · 25
�������������������������Dynamic�Statistics Average Instr�/�sStatic� Branches Instructions Cache Energy Time Instr�Type Joules�/�s (Millions)
Fig. 14. StrongARM methodology. (a) shows the general MediaBench benchmarkstatistics. (b) shows the empirical data that we use to estimate energy consumption.The second column is Joules per second and the final column is instructions persecond for the instruction types and bandwidth for wireless transmission.
5.4 Phase-Aware Remote Profiling for Embedded Devices
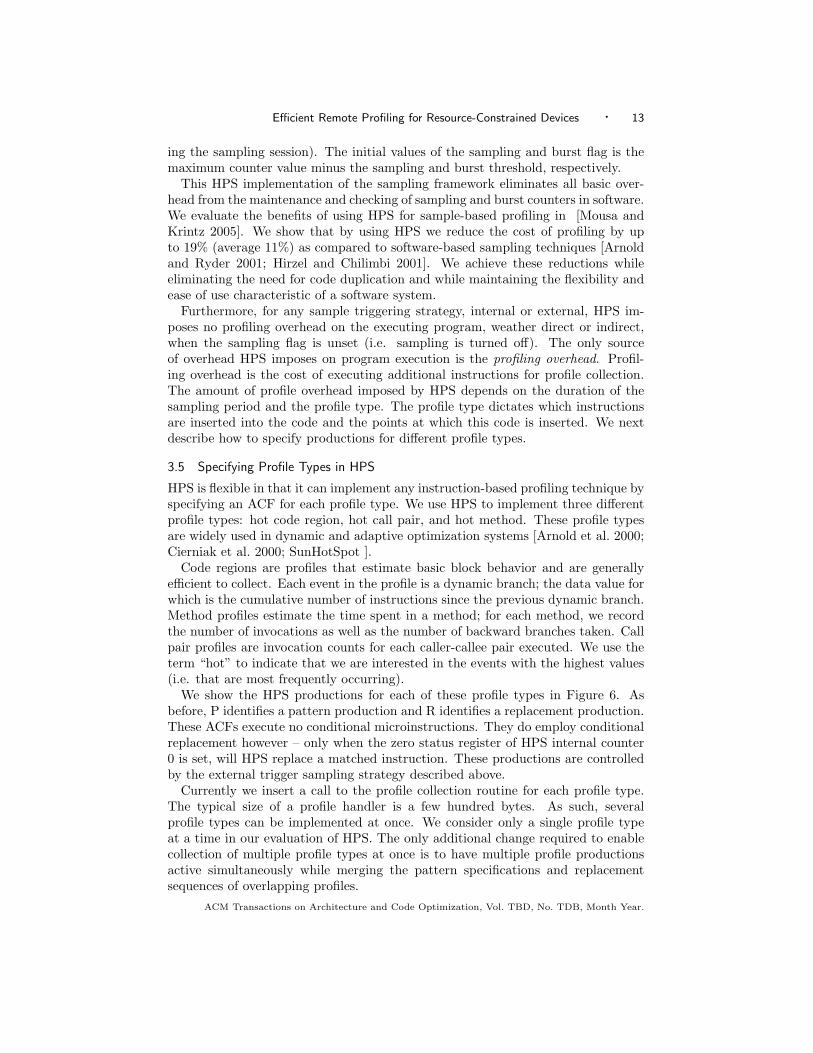
To investigate the efficacy of phase-aware remote profiling for embedded devices,we also evaluate our approach for a popular hand-held device processor, the IntelStrongARM. We employ SimpleScalar to emulate a StrongARM processor. As inthe prior section, we modify the simulator to emulate the capture of phase infor-mation as described in [Sherwood et al. 2003] with an interval size of 10 millioninstructions. The authors in [Lau et al. 2005] explore the overhead/accuracy trade-offs and efficacy of using variable sized intervals. Our large, fixed-size intervals arepractical for resource constrained systems since they minimize sample storage andmaintenance overhead and simplify phase prediction. Since we are interested inthe efficacy of remote profiling for mobile devices, we estimate the overhead of oursystem in terms of power consumption.
We evaluate our system using six benchmarks from the MediaBench benchmarksuite [Lee et al. 1997], a suite designed for the empirical evaluation of media ap-plications. The benchmarks we use include encoding and decoding programs formpeg (movie), jpeg (picture), and gsm (voice). We show the basic statistics forthe programs and the inputs we used in this study in table (a) of Figure 14. Thesecond column in the table is the number of static branches in the program, whichcorrelates with the size of the branch profiles generated. The next five columnsshow the dynamic statistics: number of branches executed (in millions), numberof instructions executed (in millions), the cache miss rate assuming a 64K, 4-wayset associative, instruction and data cache, the energy consumed by executing theprogram (in Joules), and the execution time (in seconds). Since the inputs thatare provided with MediaBench are very short, and because these applications aretypically used in a streaming fashion, it was necessary to find more substantialinputs to analyze the realistic long term effects of profiling. We plan to make theseinputs available via our web page.
To compute energy consumption and execution time, we use a model that wegenerate from an actual hardware system. We compute the energy (Joules persecond) consumed per-instruction (including events such as cache misses), per-byte-transmitted energy consumed, and instructions per second. We summarize thevalues in table (b) of Figure 14. We generate these values using an HP iPAQ H3835
ACM Transactions on Architecture and Code Optimization, Vol. TBD, No. TDB, Month Year.
26 · P. Nagpurkar et. al
0 5 10 15 20 25% Program Sampled
0
10
20
30
40%
Err
or in
Blo
ck C
ount
savg randommax randomperiodicphaseaware
Sampling Overhead For Accuracy Error of 5%% Sampled: Periodic: 11% AvgRand: 20% Phase: 4%
EnergyJoules Percent Reduction
Protocol Periodic AvgRandom vs Periodic vs ARandAt End 7.75 15.02 58.97 78.83Interleaved 8.24 16.03 58.90 78.86
Protocol Periodic AvgRandom vs Periodic vs ARandAt End 265.61 514.20 58.84 78.74Interleaved 280.48 545.46 57.58 78.190.00 0.00
Communication Overhead (Compressed) Bytes Transfered Percent Reduction
Protocol Periodic AvgRandom vs Periodic vs ARandAt End 2217.83 2217.83 0.00 0.00Interleaved 27095.50 51683.97 51.36 74.50
(a) (b)
Fig. 15. Evaluation of phase-aware sampling using the StrongARM environment and benchmarks.The graph in (a) shows the error in branch counts (code region profiling) over the percentageof the program sampled for each of the four sampling strategies. The table in (b) shows theimpact of each of the sampling strategies (we omit max random) on energy, computation, andcommunication when we transmit the samples all at once at the end (At End) or intermittently
during execution (Interleaved). On average, phase aware sampling eliminates 51 to 79% of theoverhead imposed by the periodic and random strategies.
running Familiar Linux v0.6.1, a Lucent/Orinoco Gold wireless card, and hand-coded benchmarks. We periodically (every 10 seconds) measure battery voltageand current levels from those exported via the Linux /proc/battery interface. Wecalibrate our model and validate it using a variety of benchmarks in [Krintz et al.2004].
In the table ((b) in Figure 14), we report the average Joules per second con-sumed by each of these latter, single-instruction programs (IREG: integer registeroperations, IMEM-R: load operations that miss in the L1 cache, IMEM-W: storeoperations that miss in the L1 cache, and FPREG: floating point operations). Wecompute instructions per second of each benchmark in a similar fashion using theinstructions per second measurement of each constituent instruction type (reportedvia simulation). To compute the power consumption for transfer, we compute thenumber of Joules per byte transfered (assuming 11Mb/s bandwidth) using the spec-ifications of our wireless card. We show the Joules per second of transfer in thefinal row of the table.
We first evaluate the accuracy of the different sampling techniques for the Stron-gARM benchmarks and environment. Figure 15(a) shows the percentage error be-tween the sample-based and exhaustive code region profiles for each of the profilingstrategies. As before, we calculate the error in branch counts for the different sam-pled percentages of program execution. The y-axis is error and the x-axis is percentof the program that was sampled for a given parameterization of each technique.
The graph shows that on average, phase-aware profiling results in significantlylower error for a very small sampled percentage than both random and periodicprofiling. The difference between the phase-aware and periodic strategies for this
ACM Transactions on Architecture and Code Optimization, Vol. TBD, No. TDB, Month Year.
Efficient Remote Profiling for Resource-Constrained Devices · 27
empirical setup (embedded device) is more pronounced than it was for the generalpurpose applications (section 5.3). Phase aware sampling produces very high ac-curacy profiles, e.g., less than 5% error, by sampling a very small amount of theprogram’s execution (4%). To achieve the same accuracy, periodic sampling requiresthat 11% be sampled, average random sampling requires that 20% be sampled, andmax random is never able to achieve an error of less than 5%.
We next evaluate the overhead of our system in terms of power consumptionfor each of the sampling strategies, assuming a maximum error of 5%. We omitmax random since it is unable to achieve an error of 5%. We calculate the overallpower consumption for each profiling strategy for all of the required remote profilecollection functions: computation overhead for instrumentation, communicationoverhead (using compression), and computation overhead for applying compression.
We present the results in Figure 15(b). We show how 5% error translates intoenergy, computation, and communication overhead in the three sections of the table.In each section, we show the average overhead for each metric across benchmarksfor periodic and average random sampling in columns 2 and 3. In column 4 and 5,we show the percent reduction enabled by phase-based profiling over each of thesetechniques, respectively.
Each section in the table contains two rows of data for the two different communi-cation protocols that we studied. For “At End”, we combine the basic block vectorsof each profiled interval into a single vector; upon program termination, we com-press the vector and transmit it. Using this protocol, phase-aware profiling reducesenergy consumption by 75% over random sampling. Phase-aware profiling reducescomputation overhead by requiring 72% fewer instructions for instrumentation overrandom sampling.
Given this “At End” approach, the communication cost is the same across pro-filing techniques since we are communicating a single profile vector in either case(though the counts will be different). However, we investigated another protocol,one in which we compress and transmit the basic block vector after each inter-val. This protocol reduces the amount of device storage required (which may behighly constrained for real devices); as such, it is a realistic alternative that weshould consider. Using this “Interleaved” protocol, phase-based remote profilingcan also reduce communication overhead since fewer intervals are communicatedto achieve the same 5% accuracy. These results are shown in the second row ofeach section. The reductions in overhead for energy and computation are similarto the “At End” protocol. However, phase-based profiling requires less than 1/4 ofthe number of bytes be transmitted to communicate the same information as therandom approach.
In summary, our remote performance profiling achieves high accuracy with lowoverhead by using an efficient hybrid profiling support system that toggles profilecollection and an intelligent phase-aware sampler that determines when samplesshould be taken. Our data indicates that our techniques are effective in a generalpurpose setting as well as for resource-constrained, battery-powered systems.
6. CONCLUSIONS AND FUTURE WORK
In this paper, we couple hardware and software techniques to enable efficient collec-tion of remote profiles from resource-restricted devices. The key to our approach is
ACM Transactions on Architecture and Code Optimization, Vol. TBD, No. TDB, Month Year.
28 · P. Nagpurkar et. al
the combination of hybrid profiling support (HPS) and phase-aware sample trigger-ing. HPS is a hardware/software system that dynamically inserts profiling instru-mentation into a program’s execution stream. By extending and applying dynamicinstruction stream editing (DISE) [Corliss et al. 2003b], HPS is able to gatherruntime profiles without code duplication or any overhead other than that of theprofiling instrumentations.
The phase-aware sampling component exploits repeating patterns in programbehavior, i.e., program phase behavior, to intelligently identify execution intervals(fixed-length periods) that represent each phase. By only sampling one interval foreach unique phase in the program, we can collect accurate sample-based profileswhile introducing significantly less overhead. To enable this, the sampler employsspecial phase tracking hardware that predicts when a previously unseen phase willoccur. The sampler selects a representative interval from each new phase andtriggers the HPS profiling instrumentation for its duration.
We demonstrate the generality of our system and evaluate techniques for effectiveidentification of interval representatives of phases. Our system is general in thatit can implement a number of diverse and popular sampling strategies of varyingcomplexity, including phase-based, random, periodic, and program driven [Arnoldand Ryder 2001] (including the variable burst extension [Hirzel and Chilimbi 2001])sampling. In addition, we can use the system to collect a wide range of importantprofiles including all instruction-based profiling types popular for feedback-directeddynamic optimization systems.
We present an extensive empirical evaluation of our approach using simulationsthat includes a general-purpose benchmark suite and execution environment as wellas that for a popular embedded device. We evaluate the accuracy and the overheadof our system in terms of computation, communication, and battery power for anumber of different profile types, including hot call-pairs, hot methods, and hotcode regions. We compare our system to popular random and periodic samplingstrategies and show that we are able to reduce the overhead of these strategies ina general-purpose setting by 6-80% on average and in an embedded device settingby 50-75%, assuming an error rate of 5%.
Phase-based remote profiling requires that users consent to allow transparentsampling of the execution of their software. Though there are many security andprivacy concerns for such a system, we believe that users will be incentivized toparticipate since doing so will enable software vendors to automatically improveperformance, fix bugs, and upgrade their software transparently. As part of futurework, we plan to investigate novel techniques that ensure that the information thatwe transmit is secure or obfuscated.
We also plan to investigate dynamic, phase-aware optimizations that we canuse both online and at the dynamic optimization center to improve program per-formance. In addition, we plan to investigate techniques for dynamic softwareupdating in a mobile environment. In terms of future work on the system itself,we are investigating the impact of prediction accuracy of the Phase Tracker on re-sulting profile accuracy and sampling overhead. Moreover, we plan to investigatetechniques for combining phase samples from multiple users and program inputs.
ACM Transactions on Architecture and Code Optimization, Vol. TBD, No. TDB, Month Year.
Efficient Remote Profiling for Resource-Constrained Devices · 29
ACKNOWLEDGMENT
We thank the anonymous reviewers for providing useful comments on this paper.This work was funded in part by Intel, Microsoft, and NSF grants Nos. ST-HEC-0444412, ITR/CCF-0205712, and CNF-0423336.
REFERENCES
Anderson, J., Weihl, W., Berc, L., Dean, J., Ghemawat, S., Henzinger, M., Leung, S., Sites,
R., Vandevoorde, M., and Waldspurger, C. 1997. Continuous profiling: Where Have all the
Cycles Gone? In Symposium on Operating Systems Principles (SOSP). 1–14.
Arnold, M. and D.Grove. 2005. Collecting and Exploiting High-Accuracy Call Graph Profiles
in Virtual Machines. In Conference on Code Generation and Optimization (CGO). 51–62.
Arnold, M., Fink, S., Grove, D., Hind, M., and Sweeney, P. 2000. Adaptive optimization in
the jalapeno jvm. In ACM SIGPLAN Conference on Object-Oriented Programming Systems,
Languages, and Applications (OOPSLA). 47–65.
Arnold, M. and Ryder, B. 2001. A Framework for Reducing the Cost of Instrumented Code.
In Conference on Programming Language Design and Implementation (PLDI). 168–179.
Burger, D. C. and Austin, T. M. 1997. The SimpleScalar tool set, version 2.0. Technical ReportCS-TR-97-1342, University of Wisconsin, Madison. June.
Cierniak, M., Lueh, G., and Stichnoth, J. 2000. Practicing JUDO: Java Under DynamicOptimizations. In ACM SIGPLAN Conference on Programming Language Design and Imple-mentation (PLDI). 13–26.
Corliss, M., Lewis, E., and Roth, A. 2002. DISE: Dynamic Instruction Stream Editing. Tech.Rep. MS-CIS-02-24, Department of Computer and Information Science, University of Pennsyl-vania, Philadelphia, PA. Jul.
Corliss, M., Lewis, E., and Roth, A. 2003a. A DISE Implementation of Dynamic Code Decom-
pression. In Conference on Languages, Compilers, and Tools for Embedded Systems (LCTES).232–243.
Corliss, M., Lewis, E., and Roth, A. 2003b. DISE: A Programmable Macro Engine for Cus-
tomizing Applications. In International Symposium on Computer Architecture (ISCA). 362–373.
Corliss, M., Lewis, E., and Roth, A. 2005. Low-Overhead Interactive Debugging via Dy-
namic Instrumentation with DISE. In Symposium on High Performance Computer Architecture(HPCA). 303–314.
Dean, J., Hicks, J., Waldspurger, C., Weihl, W., and Chrysos, G. 1997. ProfileMe: Hard-
ware Support for Instruction-Level Profiling on Out-of-Order Processors. In Symposium onMicroarchitecture (MICRO). 292–302.
Dhodapkar, A. and Smith, J. 2002. Managing multi-configuration hardware via dynamic working
set analysis. In Annual International Symposium on Computer Architecture (ISCA). 233–244.
Duesterwald, E., Cascaval, C., and Dwarkadas, S. 2003. Characterizing and predicting pro-gram behavior and its variability. In Proceedings of the Symposium on Architectural Support
for Programming Languages and Operating Systems (ASPLOS). 220–231.
Gordon-Ross, A. and Vahid, F. 2003. Frequent Loop Detection Using Efficient Non-Intrusive
On-Chip Hardware. In Conference on Compilers, Architecture, and Synthesis for Embedded
Systems (CASES). 117–124.
Grove, D., Dean, J., Garrett, C., and Chambers, C. 1995. Profile-guided receiver class pre-
Hauswirth, M. and Chilimbi, T. M. 2004. Low-overhead memory leak detection using adaptive
statistical profiling. In Symposium on Architectural Support for Programming Languages and
Operating Systems (ASPLOS). 156–164.
Hazelwood, K. and Grove, D. 2003. Adaptive online context-sensitive inlining. In InternationalSymposium on Code Generation and Optimization (CGO). 253–264.
Heil, T. and Smith, J. 2000. Relational Profiling: Enabling Thread-Level Parallelism in Virtual
Machines. In Symposium on Microarchitecture (MICRO). 281–290.
ACM Transactions on Architecture and Code Optimization, Vol. TBD, No. TDB, Month Year.
30 · P. Nagpurkar et. al
Hirzel, M. and Chilimbi, T. 2001. Bursty Tracing: A Framework for Low-Overhead Temporal
Profiling. In ACM Workshop on Feedback-Directed and Dynamic Optimization (FDDO-4).
Holzle, U. and Ungar, D. 1994. Optimizing dynamically-dispatched calls with run-time type
Itzkowitz, M., Wylie, B., Aoki, C., and Kosche, N. 2003. Memory Profiling using Hardware
Counters. In Supercomputing Conference (SC). 17–30.
Krintz, C., Wen, Y., and Wolski, R. 2004. Application-level Prediction of Battery Dissipation.
In International Symposium on Low Power Electronics and Design (ISLPED). 224–229.
Lau, J., Perelman, E., Sherwood, G. H. T., and Calder, B. 2005. Motivation for variable
length intervals and hierarchical phase behavior. In International Symposium on Performance
Analysis of Systems and Software (ISPASS).
Lee, C., Potkonjak, M., and Mangione-Smith, W. 1997. Mediabench: A tool for evaluating
and synthesizing multimedia and communicatons systems. In International Symposium on
Microarchitecture (MICRO). 330–335.
Liblit, B., Aiken, A., Zheng, A., and Jordan, M. 2003. Bug Isolation via Remote Program Sam-
pling. In ACM SIGPLAN Conference on Programming Language Design and Implementation(PLDI). 141–154.
Merten, M., Trick, A., George, C., Gyllenhaal, J., and Hwu, W. 1999. A Hardware-DrivenProfiling Scheme for Identifying Program Hot Spots to Support Runtime Optimization. In
International Symposium on Computer Architecture (ISCA). 136–147.
MicrosoftErrorReporting. XP error reporting. http://support.microsoft.com/default.aspx?
scid=kb;en-us;310414.
Mousa, H. and Krintz, C. 2005. HPS: Hybrid Profiling Support. In Conference on ParallelArchitectures and Compilation Techniques (PACT). 38–50.
Nagpurkar, P., Krintz, C., and Sherwood, T. 2005. Phase-Aware Remote Profiling. In Con-
ference on Code Generation and Optimization (CGO). 191–202.
Orso, A., Liang, D., Harrold, M., and Lipton, R. 2002. GAMMA System: Continous Evolution
for Software After Deployment. In Proceedings of International Symposium on Software Testingand Analysis (ISSTA). 65–69.
Pereira, C., Lau, J., Calder, B., and Gupta, R. 2005. Dynamic Phase Analysis for Cycle-CloseTrace Generation. In International Conference on Hardware/Software Codesign and System
Synthesis. 321–326.
Peri, R. V., Jinturkar, S., and Fajardo, L. 1999. A novel technique for profiling programs
in embedded systems. In ACM Workshop on Feedback-Directed and Dynamic Optimization(FDDO-2).
Sastry, S., Bodık, R., and Smith, J. 2001. Rapid Profiling via Stratified Sampling. In Annual
International Symposium on Computer Architecture (ISCA). 278–289.
Sherwood, T., Perelman, E., and Calder, B. 2001. Basic block distribution analysis to find
periodic behavior and simulation points in applications. In International Conference on ParallelArchitectures and Compilation Techniques (PACT). 3–14.
Sherwood, T., Perelman, E., Hamerly, G., and Calder, B. 2002. Automatically characterizing
large scale program behavior. In 10th International Conference on Architectural Support for
Programming Languages (ASPLOS). 45–57.
Sherwood, T., Sair, S., and Calder, B. 2003. Phase tracking and prediction. In AnnualInternational Symposium on Computer Architecture (ISCA). 336–349.
Suganuma, T., Yasue, T., and Nakatani, T. 2002. An empirical study of method inlining for
a Java just-in-time compiler. In Proceedings of the 2nd Java Virtual Machine Research and
Technology Symposium (JAVAVM). 91–104.
SunHotSpot. Sun Microsystems, The Java HotSpot Virtual Machine, Techni-cal White Paper. http://java.sun.com/ products/hotspot/docs/whitepaper/
Java_HotSpot_WP_Final_4_30_01.ps.
Tikir, M. and Hollingsworth, J. 2002. Efficient Instrumentation for Code Coverage Testing.
In International Symposium on Software Testing and Analysis (ISSTA). 86–96.
ACM Transactions on Architecture and Code Optimization, Vol. TBD, No. TDB, Month Year.
Efficient Remote Profiling for Resource-Constrained Devices · 31
Traub, O., Schecter, S., and Smith, M. 2000. Ephemeral Instrumentation for Lightweight
Program Profiling. Tech. Rep. Technical Report, Department of Electrical Engineering and