Since reaching a peak in 1997, the number of listed firms in the U.S. has fallen in every year but one. During this same period, public firms have been net purchasers of $3.6 trillion of equity (in 2015 dollars) rather than net issuers. The propensity to be listed is lower across all firm size groups, but more so among firms with less than 5,000 employees. Relative to other countries, the U.S. now has abnormally few list-ed firms. Because markets have become unattractive to small firms, existing listed firms are larger and older. We argue that the importance of intangible investment has grown but that public markets are not well-suited for young, R&D-intensive companies. Since there is abundant capital available to such firms without going public, they have little incentive to do so until they reach the point in their lifecycle where they focus more on payouts than on raising capital.
Craig DoidgeProfessor of FinanceUniversity of Toronto, Rotman School of Management105 St. George StreetToronto, Ontario M5S 3E6, Canadaphone: e-mail: [email protected]
Kathleen M. KahleProfessor of FinanceUniversity of Arizona, Eller College of ManagementMcClelland Hall 315RTucson, Arizona 85721-0108, United Statesphone: +1 520 621 7489e-mail: [email protected]
G. Andrew KarolyiProfessor of FinanceCornell University, SC Johnson College of Business221 Sage HallIthaca, NY 14853, United Statesphone: +1 607 255 2153e-mail: [email protected]
René M. Stulz*Professor of FinanceThe Ohio State University, Fisher College of Business806A Fisher Hall, 2100 Neil Avenue Columbus, OH 43210, United Statesphone: +1 614 292 1970e-mail: [email protected]
*Corresponding Author
Eclipse of the public corporation or eclipse of the public markets?
Craig Doidge, Kathleen M. Kahle, G. Andrew Karolyi, and René M. Stulz∗
January 2018
ABSTRACT
Since reaching a peak in 1997, the number of listed firms in the U.S. has fallen in every year but one. During this same period, public firms have been net purchasers of $3.6 trillion of equity (in 2015 dollars) rather than net issuers. The propensity to be listed is lower across all firm size groups, but more so among firms with less than 5,000 employees. Relative to other countries, the U.S. now has abnormally few listed firms. Because markets have become unattractive to small firms, existing listed firms are larger and older. We argue that the importance of intangible investment has grown but that public markets are not well-suited for young, R&D-intensive companies. Since there is abundant capital available to such firms without going public, they have little incentive to do so until they reach the point in their lifecycle where they focus more on payouts than on raising capital.
∗ Doidge is from the Rotman School of Management at the University of Toronto, Kahle is from the Eller School of Management at the University of Arizona, Karolyi is from the Cornell S.C. Johnson College of Business at Cornell University, and Stulz is from the Fisher College of Business at The Ohio State University, NBER, and ECGI. Parts of this paper update and discuss results from Doidge, Karolyi, and Stulz (2017) and Kahle and Stulz (2017). Other parts are new.
1
1. Introduction
In 1989, Jensen wrote that “the publicly held corporation has outlived its usefulness in many sectors of
the economy.” He published in the Harvard Business Review an article titled “The Eclipse of the Public
Corporation.” There, Jensen argued that the conflict between owners and managers can make public
corporations an inefficient form of organization. He made the case that new private organizational forms
promoted by private equity firms reduce this conflict and are more efficient for firms in which agency
problems are severe. In 1989, there were 5,895 U.S. domiciled listed firms on the U.S. exchanges. This
number reached a peak in 1997 at 7,509. As of the end of 2016, the number of U.S. listed firms was down
to 3,618. Though the number of listed firms did not initially fall as predicted by Jensen, it eventually did,
and dramatically so. Since 1997, the number of listed firms has fallen every year but 2014.
One might easily conclude that this dramatic drop in the number of public corporations represents the
eclipse of the public corporation predicted by Jensen in the late 1980s. However, at the same time, hugely
profitable and successful public companies such as Google, Apple, Amazon, Microsoft, and Facebook, with
market capitalizations that could conceivably reach $1 trillion in the not too distant future, have arisen and
flourished. Paradoxically, we seem to have some of the most profitable and successful companies in the
history of U.S. capital markets and, at the same time, a collapse in the number of public firms. One common
characteristic of Google, Apple, Amazon, Microsoft, and Facebook is that these companies have vastly
more intangible than tangible capital. In this article, we argue that U.S. public markets have shown
themselves not well-suited to satisfy the financing needs of young firms with mostly intangible capital. In
that sense, what we are really witnessing is an eclipse not of public corporations, but of the public markets
as the place where young successful American companies seek their funding.
In this paper, we first show how the number of listed firms has evolved in the U.S. and abroad. We next
show that in the U.S. small firms have left the exchanges and that the propensity of these small firms to list
has fallen sharply since 1997. We then show how listed firms have changed in the U.S. In the last section
of the paper, we investigate whether the changes that have taken place represent an eclipse of the public
corporation in the U.S., an eclipse of the public exchanges, or whether we need a different explanation to
make sense of them.
2
2. The drop in U.S. listings in perspective
Figure 1 shows the evolution of the number of U.S. domiciled firms listed on the NYSE, Amex, and
Nasdaq from 1975 to 2016.1 In 1975, the U.S. had 4,818 listed firms. The figure shows that this number
increased rather steadily until 1997, when it reached 7,509 listed firms. From that year onward, the number
fell rapidly until 2003 and then at a slower pace. However, the number of listed firms kept falling until
2013, when it reached 3,657. From 2013 to 2014, the number of listed firms increased by 128, but then it
fell again, so that in 2016 it was 3,618. As of the end of 2016, the number of listed firms was 25% less than
in 1975 and 52% less than its peak in 1997. It is especially striking that the number of firms has fallen so
much given that during this time the population of the U.S. increased from 215 million in 1975 to 323
million in 2016. In 1975, the U.S. had 22.4 listed firms per million inhabitants. By 2016, it had just 11.2.
Figure 1 also shows the evolution of the aggregate market capitalization of listed firms, or the sum of
the market value of all listed firms. In 2015 dollars, the aggregate market capitalization of listed firms was
7.4 times higher in 2016 compared to 1975. However, in contrast to the evolution of the number of listed
firms, the aggregate market capitalization does not evolve smoothly. This is especially true after 1999. In
constant dollars, the aggregate market capitalization of listed firms was only $434 billion dollars higher at
the end of 2016 than it was at the end of 1999. It is common to look at the aggregate market capitalization
of stocks compared to GDP. Many academic studies use this ratio as a measure of financial development.2
This ratio was 38.3% in 1975. It peaked at 153.5% in 1999, dropped to 69.2% in 2008, and increased back
to 124.0% in 2016. The ratio in 2016 is 19% lower than at its peak.
1 We use two main data sources for our analysis of U.S. firms: CRSP and Compustat. From CRSP, we obtain all U.S. firms listed on the NYSE, AMEX, and Nasdaq, excluding investment companies, mutual funds, REITs, and other collective investment vehicles. When we examine Compustat data, we use the intersection of CRSP and Compustat firms. For non-U.S. firms, we use data from the World Bank’s World Development Indicators database and from the World Federation of Exchanges. The construction of the database for foreign exchanges is described in Doidge, Karolyi, and Stulz (2017). To update the database, we follow the approach described in that paper. Note that while it seems easy to figure out the number of listed firms in a country, it is not always so as a number of data choices must be made. For example, updates of public databases such as CRSP and Compustat can make retroactive changes to past counts that can lead to different estimates for the U.S. 2 See, for example, Levine (1997).
3
The fact that the market capitalization of the U.S. markets is not higher partly reflects the same
phenomenon as the decrease in the number of listed firms. Since the peak in listings in 1997, U.S. firms
have been repurchasing dramatically more equity than they have issued. The excess of the amount spent on
repurchases over the amount received from equity issuance since 1997 is $3.6 trillion. In other words, U.S.
public firms returned significantly more equity capital to shareholders than they raised from the capital
markets.
To understand the drop in the number of listed firms since 1997, it is important to understand whether
this is a global phenomenon. Another way to frame the question is to ask whether, as a result of this drop,
the U.S. now has too few listed firms relative to other countries. Doidge, Karolyi, and Stulz (2017) compile
a database of listings across the world since 1990. Figure 2 updates that database and shows the evolution
of the number of listed firms in the U.S. compared to the number of listed firms in non-U.S. countries and
in non-U.S. developed countries. Neither the number of listed firms in non-U.S. countries nor the number
of listed firms in non-U.S. developed countries exhibits a dramatic drop since the late 1990s. In fact, the
number of listed firms increases for all non-U.S. countries and even increases among non-U.S. developed
countries, but in these latter countries it has been fairly stagnant since 2003. The law and economics
literature argues that more prosperous countries, faster growing countries, and countries that protect
investor rights better have more listed firms per capita (for example, Djankov, La Porta, Lopez-de-Silanes,
and Shleifer, 2008). Using a regression model that relates the number of listed firms to these and other
country characteristics, Doidge, Karolyi, and Stulz (2017) confirm that the U.S. indeed has relatively fewer
listed firms than other countries with similar characteristics. They refer to this deficit of listed firms in the
U.S. as “the U.S. listing gap.” Importantly, the existence of a U.S. listing gap does not mean that no other
country has a listing gap. What it does mean, however, is that the shortage of listed firms observed in the
U.S. is not a global phenomenon. The magnitude of this gap is large and it persists since 2002. Doidge,
Karolyi, and Stulz (2017) predict that if the U.S. had as many listed firms per capita as countries with
similar GDP per capita, GDP growth, and quality of protection of investor rights, in 2012 it would have had
9,538 listings instead of 4,102.
4
3. Disappearing small firms
For the number of listed firms to fall, there must be fewer new lists and/or more delists. In other words,
firms must be leaving public stock exchanges faster than others enter exchanges. The number of new lists
in the U.S. has been extremely low for the last fifteen years and especially so since 2008. The average
annual number of new lists from 2009 to 2016 is 179, according to the Center for Research in Security
Prices (CRSP). In contrast, the average annual number of new lists from 1995 to 2000 is 683.5. In other
words, since the global financial crisis, the average annual number of new lists is less than one third of what
it was between 1995 and 2000.
Delisting counts have fallen also, but less than new lists. Firms delist because their performance does
not allow them to remain listed, because they voluntarily choose to delist, or because they are acquired. The
most important cause of delists since the listing peak is mergers and acquisitions. Since the listing peak,
there have been 8,620 delists, according to CRSP. Of these delists, CRSP reports that 5,274, or 61.2% of
the total, are due to mergers, 3,060, or 35.5%, are delists due to performance, and only 286, or 3.3%, are
voluntary delists. Until the listing peak, both mergers and voluntarily delists were relatively less important
as they account for 55.2% and 1.7% of delists, respectively, from 1975 to 1997. Though much has been
made of voluntarily delists in the media and popular press, there are simply too few firms that leave the
exchanges because they want to, and do so without being acquired, for them to be an important part of the
explanation for the overall drop in listed firms.
Everything else equal, research shows new lists are smaller firms and smaller firms are more likely to
delist. Hence, a drop in new lists means relatively fewer small young firms. As a result of fewer new lists
and of delists, the disappearance of small firms from public exchanges has been dramatic. As shown in
Figure 3, the percentage of firms with market capitalization below $100 million in 2015 dollars has
collapsed over the last forty years. From 1975 to 1991, more than 50% of firms had a market capitalization
of less than $100 million. After 1991, this percentage drops steadily. In 1997, it falls below 40% for the
first time over our sample period. Since 2003, that percentage never exceeds 30%. In 2016, it is 22%. If
there are fewer small firms on public exchanges, the average market capitalization must have increased.
5
Indeed, it has done so dramatically. In 2015 dollars, the average market capitalization in 1975 was $662
million. At the peak of listings, it was about $2 billion. Since the number of listings started collapsing, the
average market capitalization has basically tripled as it now exceeds $6 billion.
Having more delists than new lists implies that small young firms drop off exchanges faster than others
enter. It is therefore not surprising that the average age of a listed firm has increased substantially. At the
peak of listings, the average age of a listed firm was 12 years. In 2016, the average age was 20 years. Older
firms tend to be less dynamic and more set in their ways (see, for example, Loderer, Stulz, and Walchli,
2016).
This disappearance of small firms on U.S. exchanges and the associated increase in the size of listed
firms is not accompanied by a disappearance of small firms outside the exchanges. In contrast, however,
firms are becoming older both on exchanges and outside exchanges (Hathaway and Litan, 2014). Data on
private firms is hard to come by, but there is good data for the distribution of firm size, when size is
measured by the number of employees. Doidge, Karolyi, and Stulz (2017) show that the main driver of the
drop in listings is not a shift in the population of firms but rather a drop in the propensity of firms to be
listed. Their data starts in 1977 and stops in 2012. We update this data through 2015, which is the last year
for which it is available from the Longitudinal Business Database (LBD) of the U.S. Census Bureau. Tiny
firms with fewer than 20 employees are extremely unlikely to be listed at any point in time. In 2015, the
U.S. had almost 4.5 million firms with less than 20 employees and 615,048 firms with more than 20
employees. Since tiny firms are not relevant for our analysis of the overall propensity to list on major
exchanges, we exclude tiny firms from our analysis.
In aggregate, the number of firms with more than 20 employees has increased since the listing peak. In
1997, the U.S. had 560,861 firms with more than 20 employees. By 2015, this number increased to 615,048.
At the same time, the rate of increase in new firms has been dramatically slower since the listing peak.
From 1977 to 1997, the number of firms with 20 employees or more increased at an average annual rate of
3.2% per year. From 1998 to 2015, the average annual rate of increase is half a percent per year. The drop
in the average annual rate of increase in firms after the listing peak gives an excessively pessimistic view
6
of the growth in the number of firms because the financial crisis adversely impacted the number of firms.
The number of firms with 20 employees or more reached a peak of 636,904 in 2007. It then fell to a trough
of 569,569 in 2011. From 2011 to 2015, the number of firms increased at the rate of 2% per year, which is
slightly larger than the average rate of increase of 1.5% from the peak to the crisis.
The important takeaway from these counts is that, excluding tiny firms, the propensity to be listed on a
major exchange fell by 54% from the listing peak to 2015. Figure 4 shows the drop in the propensity to list
across firm size categories. Though the drop in the propensity to list is smaller for the largest firms, the
propensity has fallen for all firm sizes since the listing peak. This evolution implies that the distribution of
firm size for listed firms has distinctly tilted more towards large firms than before the listing peak. In 1997,
0.23% of the firms with 20 to 99 employees were listed on exchanges. By the end of 2015, that percentage
fell by 67% to 0.076%. The percentage of firms that choose to list has fallen by more than 60% for firms
with less than 1,000 employees. It has fallen for larger firms as well, but by a slower rate. For instance, by
1997, 58% of firms with more than 10,000 employees were listed. This percentage has fallen to 44% by
2015, or by 24% since 1997.
The same U.S. Census data that we use to estimate the listing propensity across firm size also has
information that allows us to estimate the listing propensity by coarse industry categories up to 2014. The
propensity to list falls across all industry categories.
4. How listed firms have changed
Listed firms are quite different now compared to listed firms in the 1970s. Looking at averages is
helpful to understand how firms have changed. Averaging across all listed U.S. firms covered by both CRSP
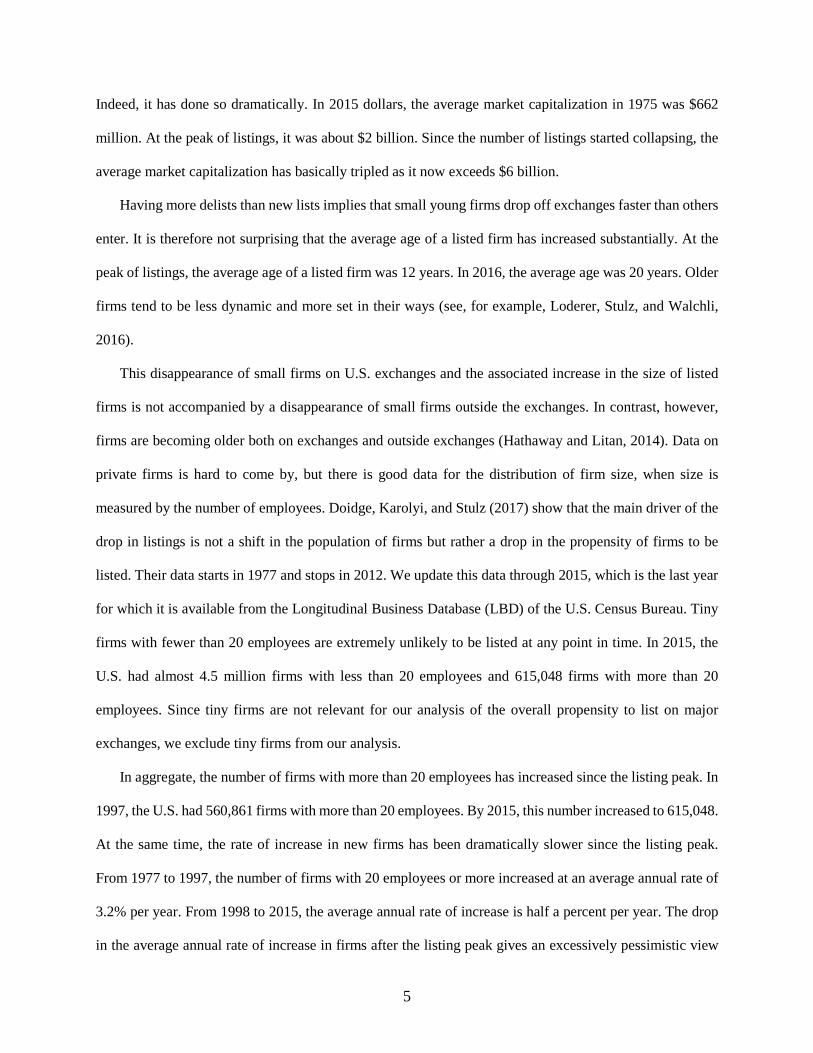
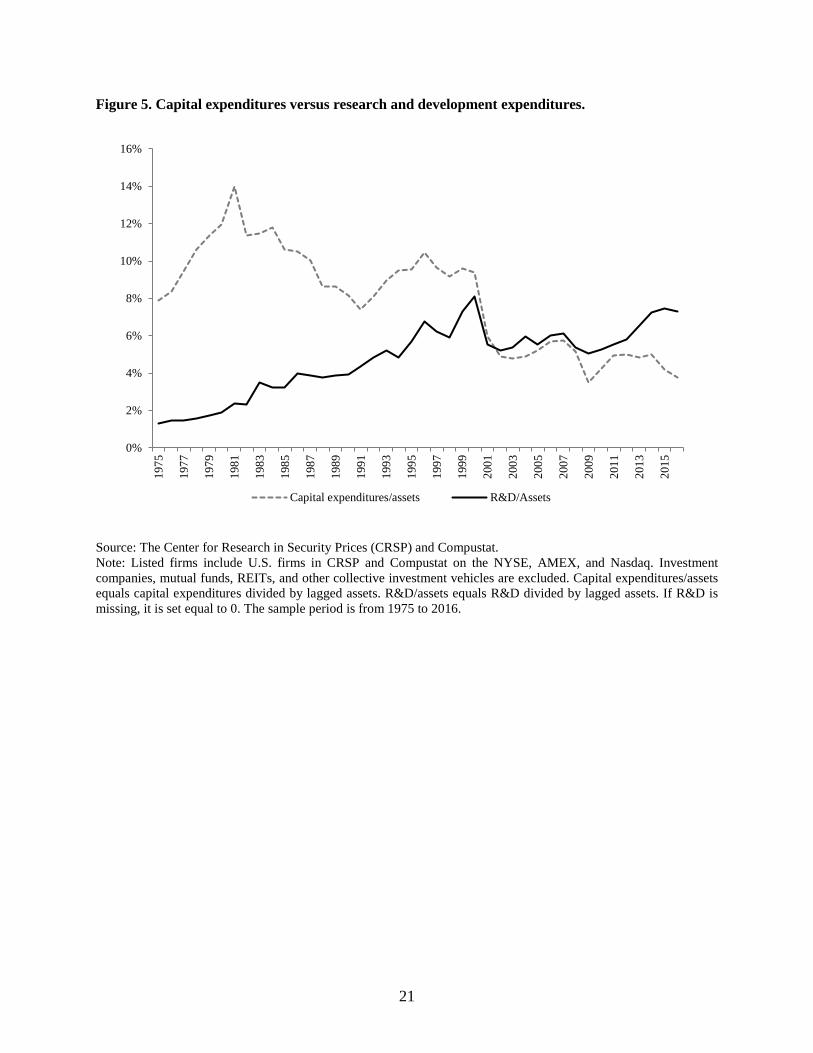
and Standard & Poor’s Compustat, the ratio of capital expenditures to research and development (R&D)
expenses was 6-to-1 in 1975. In other words, on average, firms spent 6 times more on capital expenditures
than they spent on R&D. Capital expenditures accumulate on a firm’s balance sheet as tangible assets. On
a balance sheet, fixed assets are assets that are purchased for long-term use, such as land, building, and
equipment. In other words, a firm in 1975 had fixed assets corresponding to 34.4% of its assets. If we now
7
look at 2016, on average R&D expenditures were 7.3% of assets in contrast to capital expenditures which
were only 3.8% of assets. In other words, capital expenditures were, on average, just 51% of a firm’s R&D
expenses. On average, fixed assets are now 19.6% of total assets.
As shown in Figure 5, R&D expenditures for the average firm exceeded capital expenditures for the
first time in 2002. And, since 2002, R&D expenditures have exceeded capital expenditures every year. The
ratio of average capital expenditures to average R&D expenditures was lowest in 2016. In contrast, from
1975 to 2016, the highest ratio was 6.85-to-1 in 1978. The decrease in the ratio of capital expenditures to
R&D expenditures can be explained by a decrease in capital expenditures as well as by an increase in R&D
expenditures. The ratio of capital expenditures to assets fell sharply starting in 2001. In 2016, average
capital expenditures to assets was 3.8% which is the lowest ratio in any year since 1975 except for 2009. In
contrast, the average ratio of R&D expenditures to assets was 7.3% in 2016, which is the second highest
ratio in any year, but just slightly lower than the 7.4% of 2015.
Though we focused on firm averages, it is important to note that there is large variation across firms in
how much they spend on R&D. Many very large firms spend hardly anything on R&D (including Walmart,
Berkshire Hathaway, AT&T, Verizon, and Exxon). It follows that looking at averages across firms can
overstate the importance of R&D compared to capital expenditures for the economy as a whole, because
the ratio of R&D to assets is negatively correlated with size. In dollar terms, R&D expenditures are still
less than capital expenditures. What the averages do show is that this is not so for the average firm – there
are large numbers of small public firms for which R&D is much more important than capital expenditures.
The evolution of the ratio of capital expenditures to R&D expenditures is indicative of an important
transformation of public firms in the U.S. They have become firms for which intangible assets are typically
more important than tangible assets. U.S. Generally Accepted Accounting Principles (GAAP) makes it
difficult to assess the value of a firm’s intangible assets. Firms invest in intangible assets when they train
their employees, when they improve their organizational structure, when they develop new systems, when
they build their brand, and so on. U.S. GAAP generally requires such transactions to be expensed.
Abstracting from taxes, if a firm spends $1 on research that could lead to a profitable new product, its
8
current profitability falls by $1 and its assets fall by $1 because it spent cash. If a firm spends an additional
$1 on new machinery, its total assets are unaffected as the decrease in cash is offset by an increase in fixed
assets. Further, ignoring tax considerations, spending an additional $1 on capital expenditures has no impact
on current profitability as that expenditure is capitalized instead of being treated as an expense. Economists
have worked hard to estimate the intangible assets of firms. Falato, Kadyrzhanova, and Sim (2013) estimate
that, on average across firms, intangible assets accounted for 10% of net assets (assets minus cash holdings)
in 1970, but exceeded 50% in 2010.
When Jensen wrote his article in 1989, he was concerned that managers would hoard and waste
resources rather than return cash to shareholders. He called this problem “the agency cost of free cash flow.”
Back in 1989, U.S. firms held on average 13.6% of their assets in cash. In contrast, in 2016, the average
ratio of cash holdings to assets was 21.5%, which was the highest ratio from 1975 to 2016. The increase in
cash holdings of U.S. firms is an important change in the composition of assets of these firms, the cause of
which has been widely debated. One possible explanation is consistent with Jensen’s concerns, namely,
CEOs may want to hoard resources rather than pay out profits to shareholders that they cannot reinvest
profitably. There are two reasons to be skeptical of this explanation. First, as intangible assets become more
important, one would expect firms to hold more cash (Bates, Kahle, and Stulz, 2009). A firm can use
tangible assets as collateral to borrow, but it may find it much more difficult, if not impossible, to use
intangible assets. With this logic, the increase in the importance of intangible assets predictably leads to an
increase in cash holdings.
A second key reason to be skeptical about the importance of agency costs associated with resource
hoarding is that U.S. firms have extremely high payout rates in recent years, which represents another
important way in which firms have changed. In 1975, 63% of firms paid dividends and on average
dividends were 1.3% of assets. In 2000, the percentage of firms paying dividends reached a low point of
30%. Since then, the percentage of firms paying dividends has increased, and it was 42.4% in 2016. Further,
while in the early 2000s, average dividend payouts to assets were 0.4%, they are now approximately 1%.
In 1975, payouts were almost exclusively in the form of dividends. In 2016, repurchases represented a
9
larger proportion of payouts than dividends. Throughout the 2000s, as shown in Figure 6, repurchases have
exceeded dividends as a fraction of assets, typically by a ratio of more than two to one.
Another useful way to see the change in the extent to which U.S. firms pay out their profits to
shareholders is to look at payouts relative to net income. Figure 6 also shows the ratio of payouts to net
income. In 1975, the average percentage of net income paid out by firms was 26.8%. This percentage
reached a low of 20.1% in 1994, only a few years after Jensen’s article was published. After 1994, the
percentage increased but then fell again to 20.9% in 2001. However, the percentage in 2016 was 44.6%. To
put this number in perspective, the first year since 1975 that the payout to net income ratio exceeded 30%
was in 2004. Since 2004, this ratio has fallen below the 30% threshold only once (2009). In recent years,
this ratio has always been above 40%.
In this analysis, we have focused much on averages across firms and over time. Such an analysis does
not give a good understanding of the magnitude of the flows from corporations to shareholders through
repurchases in the years since the listing peak. First, in four of the twenty years since 1997, U.S. firms have
repurchased more equity than they have issued. The net amount of repurchases over issuance from 1997 to
2016, which represents the net flows going from all corporations to shareholders, amounted to $3.6 trillion
in 2015 dollars. In other words, in the typical year since the listing peak, the corporate sector has returned
equity capital to shareholders. From 1975 to 1996, the corporate sector issued more equity than it
repurchased in 15 years out of 22, so that in a typical year before the listing peak the corporate sector issued
more equity than it repurchased. Since 1996, it has repurchased more equity than it issued. Such a shift
makes it hard to believe that hoarding of resources by empire-building CEOs is a concern for the corporate
sector as a whole and that this hoarding explains the drop in listings. Obviously, while free cash flow
concerns do not seem to be a useful explanation for the overall drop in listings, there are many firms where
increased ownership concentration or going private transactions were motivated by the existence of
important agency costs of free cash flow.
10
5. Which eclipse is the real one?
In 1975, the top five listed U.S. firms by market capitalization had a total market capitalization of half
a trillion in 2015 dollars. In 2016, the top five firms had a total market capitalization of $2.3 trillion. Such
evidence is hard to reconcile with a view that the public corporation is in eclipse. The winners in public
markets are doing very well indeed. At the same time, however, there are ever fewer public firms and the
firms that are public on balance return more equity to shareholders than they invest. This seems to imply
that small young firms do not want to use the public markets to obtain funding and believe that they can
obtain such funding on better terms elsewhere. It also means that these firms believe that their owners can
cash out on better terms by being acquired than going public. As a result, public markets are not attractive
for many of these firms and it may be that it is public markets that are in eclipse.
A persistent argument is that firms do not want to be public because of regulation. Those who advance
that argument often invoke the Sarbanes-Oxley Act of 2002, Regulation Fair Disclosure (Reg FD), and
other restrictions imposed on analysts and the financial services community in the early 2000s. The biggest
deficiency of this argument is that the peak for listings takes place in 1997, well before Sarbanes-Oxley and
these other major regulatory events. If any regulatory actions played a role in the decrease in listings in the
1990s, it was the deregulatory actions that increased the number of investors beyond which a firm has to
register its securities.3 In other words, this deregulation made it easier for firms to raise funds while staying
private. Further deregulatory actions took place after the 1990s.
Firms that go public may benefit from having securities registered with the U.S. Securities Exchange
Commission (SEC). It allows them to issue more shares, to issue public debt under favorable conditions,
and to use their equity as a form of currency to make acquisitions. It allows insiders to reduce their stakes
and to diversify their holdings. However, public firms are subject to strict disclosure rules and have to
3 See de Fontenay (2016). She points out that a 1996 change in section 3(c)(7) of the Investment Company Act effectively removed the 100-investor cap on private investment funds, which in turn made possible the existence of vastly larger funds.
11
follow U.S. GAAP accounting rules. Both the disclosure rules and GAAP accounting can be problematic
for firms that are heavy in intangible assets (see, for example, Leuz and Wysocki, 2016).
If a firm is building a new plant, it is easy for it to disclose that it is doing so. Nobody can steal the
plant. The same is not the case if the firm has an intensive R&D program. By disclosing details of that
program, a firm gives away some of its ideas. Other firms can build on what they learn. While a firm will
try to reveal as little as possible that could be appropriated, it faces the difficult issue that if it discloses too
little, outsiders cannot assess its value correctly and are likely to value it at a discount. As a result, the firm
is stuck between the proverbial rock and hard place. If it discloses too much, its value falls because outsiders
can use what it discloses to enrich themselves, but if it discloses too little, its shares are discounted due to
investor uncertainty.
GAAP creates problems of its own. Accounting rules, by definition, are conservative. If a firm acquires
a building, it will record it at cost. The belief is that the building was acquired at a market price and could
be sold at that market price. However, if a firm spends a lot of money on salaries of researchers, accounting
does not treat these salaries as an investment in a research project that is an asset on its balance sheet.
Rather, these salaries are treated as a cost that decreases the profitability of the firm. It follows that GAAP
may have an inherent bias against intangible assets (Lev and Gu, 2016). Accounting is not as informative
for firms with intangible assets as it is for firms with tangible assets. Public investors rely, among other
things, on accounting data to assess the value of a firm. If that accounting data is not very informative, these
investors will be more skeptical about the value of a firm. Conservative accounting is valuable for firms
that want to issue public debt as it provides a better approximation of the collateral available to protect the
debtholders. However, firms with large amounts of intangible assets typically do not issue public debt.
Intangible assets are usually poor collateral for loans.
Jensen believed that concentrated ownership is valuable in reducing agency costs of free cash flow.
Concentrated ownership helps resolve other issues as well. A firm with valuable intangible assets can better
convey information about the value of these assets without worrying about expropriation when it can do so
for large potential investors in its equity rather than when it has to do so through mandated public
12
disclosures via the SEC. It can do so even better if the potential investors have specialized knowledge about
the type of intangible capital the firm is developing, which would generally be the case for venture
capitalists and private equity investors. Hence, private forms of equity financing are likely to be preferred
by non-public firms that are involved in building intangible assets because they can provide better
information to non-public capital providers and these non-public capital providers are in a better position
to assess the value of the intangible assets the firm is building. Viewed from this perspective, accessing the
public markets to obtain equity capital can only be a second-best solution.
If private funding were not easily available, there would be more public offerings. However, having
more public offerings because of a lack of private funding would likely be bad for innovation since public
funding involves important frictions that make it less attractive than private funding. Private funding has
not been limited in such a way that it has pushed firms to public markets early in their lives. There are at
least three reasons for that. First, as already discussed regulatory changes have made it easier to raise funds
privately (see, for example, de Fontenay, 2016). Second, technological changes have made it much easier
to search for investors and to gather information. Third, young firms do not require as much capital in their
build-up phase as they used to (among others, see Davis, 2016). In light of these developments, it is perhaps
not surprising that Ewens and Farre-Mensa (2017) document that privately-held startups can now “achieve
capital raising (…) historically available only to their public peers.”
The internet has dramatically reduced the costs of search. This applies to finding investors. However,
perhaps more importantly, it has made it possible for young firms to find and contract for a wide variety of
services that they would have had to build in-house at great expense in the past. A firm with a good idea
for a manufacturing product can easily get it produced abroad without having to build a plant. A firm that
needs lots of computing power can lease it at low cost. A firm can now more easily rent a back office. All
these changes mean that the early stages of the life of a firm require much less capital than they used to. To
see this, think of a world where a young firm has to manufacture products on its own. Such a firm would
have to raise a large amount of capital to build and outfit a plant.
13
Gao, Ritter, and Zhang (2013) argue that economies of scope have become more important and that
firms have a shorter window to take advantage of them because of the widening threat of greater
competition. If this is true, firms may be better off to be acquired by a larger firm rather than to access the
public markets to raise capital. The role of economies of scope is closely tied in to the importance of
intangible capital. In reviewing the properties of intangible assets, Haskel and Westlake (2017) point out
that one key fact is that intangible assets are scalable in a way that tangible assets are not. If a car
manufacturer wants to produce twice as many cars, it has to double its manufacturing plant. Doing so
requires a large amount of capital. Being acquired by another car company would not make a manufacturing
plant available unless that company has an idle manufacturing plant. By contrast, a firm that has developed
a new software tool can increase its sales of that tool at a marginal cost that is close to zero. Hence, its main
concern is to sell as much of that tool as possible until it is replaced by a better tool. Having access to a
platform with broader visibility and distribution ability would be valuable to such a firm.
Exit through acquisition rather than exit through public markets has another important advantage for a
firm rich in hard-to-value intangible assets. In accessing public markets, the firm has to convince dispersed
shareholders of its value without giving away too much information about its intangible assets. After all,
other competitor firms can exploit that public information to gain an advantage. In contrast, in being
acquired, a firm has to convince potential acquirers of its value. It can be a setting in which the firm can
disclose more with less risk and generally can disclose to potential buyers with specialized knowledge that
are in a good position to assess the value of the firm’s intangible assets with greater precision than dispersed
shareholders.
Other developments have also played a role in the decrease in the number of listed firms. As we saw,
mergers are the main factor leading to an increase in delistings. While historically the literature in financial
economics has emphasized the role of mergers in improving efficiency by creating synergies, it is not clear
how well this view of mergers applies to the kind of mergers that took place in the 2000s. For instance, an
important paper by Blonigen and Pierce (2016) uncovers evidence that gains from mergers are due to
increased margins, which means the benefits come from a decrease in competition. There is increasing
14
evidence of a decrease in competition in many industries in the U.S. (such as, the Council of Economic
Advisors, 2016; Grullon, Larkin, and Michaely, 2016). Such a decrease in competition might affect
adversely the ability of small firms to succeed on their own.
6. Some speculation about the future of public equity markets
Public markets are better suited for firms with mostly tangible assets than for firms with mostly
intangible assets. This is especially true when the usefulness of the intangible assets has yet to be proven
on a large scale. Sometimes the market is extremely optimistic about some intangible assets, which confers
a window of opportunity on firms with such assets to go public. But otherwise, firms with unproven
intangible assets may very well be better off to fund themselves privately. Accounting information
conveyed by U.S. GAAP for such firms is of limited use because GAAP treats investments in intangible
assets mostly as expenses, so that these assets may very well not show up on firms’ balance sheets. Private
funding allows firms to convey information about intangible assets more directly to potential investors who
often have specialized knowledge, something that they could not convey publicly.
Much of the public debate about the lack of new public offerings has focused on the intensity of capital
market regulation. One might be tempted to say that if part of the problem is disclosure, then we should
relax mandated disclosure rules. This would be a misreading of our argument. The issue with disclosure of
intangible assets is not what firms have to disclose. Rather, it has to do with the nature of the intangible
assets they need to disclose. Once an idea is made public it becomes possible for other firms to use it.
Deregulation that ends up reducing the trust that investors have in public markets will not lead to more new
offerings in the long run.
Investment in intangible assets is highly sensitive to the legal environment in which a firm operates and
to the pace of financial development it experiences. A plant is hard to steal. A new idea is not. The U.S. is
a country where some firms make massive investments in intangible assets. Empirically, the most R&D
intensive firms in U.S. public markets do not have counterparts in foreign public markets (see, among
others, Pinkowitz, Stulz, and Williamson, 2015). As intangible assets continue to increase in importance, it
should not surprise us to see a further eclipse of public markets. This stalling of public equity market
15
development should be more pronounced in a country like the U.S., where intangible assets are relatively
more important for the corporate sector. This evolution has a downside: investors limited to public markets
are cut off from investing in high intangible-asset firms. Another downside is that, as fewer firms remain
publicly listed on major exchanges, the transparency of public markets applies to fewer firms and more
firms are not transparent to society, which may limit overall support for the corporate sector in the long-
run. However, this evolution also reflects that U.S. financial development has evolved in such a way that
some types of firms can be financed more efficiently through private sources than through public capital
markets because the intrinsic properties of intangible assets make it harder for them to be financed in public
markets. No deregulatory action is likely to restore the public markets in this case. Instead, we should focus
on creating a fertile ground for investment in intangible assets by having appropriate laws, appropriate
financing mechanisms, and maybe new types of exchange markets, as these assets appear to be the way of
the future for corporations.
16
References
Bates, Thomas W., Kathleen M. Kahle, and René M. Stulz, 2009, Why do U.S. firms hold so much more cash than they used to?, The Journal of Finance 64, 1985-2021.
Blonigen, Bruce A., and Justin R. Pierce, 2016, Evidence for the effects of mergers on market power and efficiency, NBER working paper.
Davis, Gerald F., 2016, The vanishing American corporation, Berrett Koehler Publishers.
De Fontenay, Elisabeth, 2016, The deregulation of private capital and the decline of the public company, Hastings Law Journal 68, 445-502.
Djankov, Simeon., Rafael La Porta, Florencio Lopez-de-Silanes, and Andrei Shleifer, 2008. The law and economics of self-dealing, Journal of Financial Economics 88, 430-465.
Doidge, Craig, G. Andrew Karolyi, and René M. Stulz, 2017, The U.S. listing gap, Journal of Financial Economics 123, 464-487.
Falato, Antonio, Dalida Kadyrzhanova, and Jae W. Sim, 2013, Rising intangible capital, shrinking debt capacity, and the U.S. corporate saving glut, working paper, Federal Reserve Board.
Ewens, Michel, and Joan Farre-Mensa, 2017, The evolution of the private equity market and the decline in IPOs, unpublished working paper.
Gao, Xiaohui, Jay R. Ritter, and Zhongyan Zhu, 2013, Where have all the IPOs gone?, Journal of Financial and Quantitative Analysis 48, 1663-1692.
Grullon, Gustavo, Yelena Larkin, and Roni Michaely, 2016, Are U.S. industries becoming more concentrated?, working paper, Rice University.
Haskel, Jonathan, and Stian Westlake, 2017, Capitalism without capital, Princeton University Press.
Hathaway, Ian, and Robert Litan, 2014, The other aging of America: the increasing dominance of older firms, Brookings Working Paper.
Jensen, Michael C., 1989, Eclipse of the public corporation, Harvard Business Review 67, 61-74.
Kahle, Kathleen M., and René M. Stulz, 2017, Is the US public corporation in trouble, Journal of Economic Perspectives 31, 67-88.
Leuz, Christian, and Peter Wysocki, 2016, The economics of disclosure and financial reporting regulation: Evidence and suggestions for future research, Journal of Accounting Research 54, 525-622.
Lev, Baruch, and Feng Gu, 2016, The end of accounting and the path forward for investors and managers, John Wiley & Sons.
Levine, Ross, 1997, Financial development and economic growth: Views and agenda, Journal of Economic Literature 35, 688-726.
Loderer, Claudio, René M. Stulz, and Urs Waelchi, 2016, Firm rigidities and the decline of growth opportunities, Management Science, forthcoming.
Pinkowitz, Lee, René M. Stulz, and Rohan Williamson, 2015, Do US firms hold more cash than foreign firms do?, Review of Financial Studies 29, 309-348.
17
Figure 1. The number of listed U.S. firms and their aggregate market capitalization.
Source: The Center for Research in Security Prices (CRSP). Note: Listed firms include U.S. firms in CRSP that are listed on the NYSE, AMEX, and Nasdaq. Investment companies, mutual funds, REITs, and other collective investment vehicles are excluded. Aggregate market capitalization is in 2015 dollars. The sample period is from 1975 to 2016.
$0
$5,000,000
$10,000,000
$15,000,000
$20,000,000
$25,000,000
0
1,000
2,000
3,000
4,000
5,000
6,000
7,000
8,000
1975
1977
1979
1981
1983
1985
1987
1989
1991
1993
1995
1997
1999
2001
2003
2005
2007
2009
2011
2013
2015
Agg
rega
te m
arke
t cap
italiz
atio
n of
U.S
list
ed fi
rms
Num
ber o
f lis
ted
U.S
. firm
s
Aggregate market capitalization (in constant 2015 dollars)Number of listed firms
18
Figure 2. The number of listed firms.
Source: Center for Research in Security Prices (U.S. firms) and the World Bank’s World Development Indicators database and the World Federation of Stock Exchanges (non-U.S. firms). Notes: Listing counts include domestic firms. They exclude investment companies, mutual funds, REITs, and other collective investment vehicles. There are 71 non-U.S. countries. Countries are classified as developed based on the MSCI classification scheme as of 2014. There are 13 non-U.S. developed countries in the constant sample. The sample period is from 1975 to 2016.
0
5,000
10,000
15,000
20,000
25,000
30,000
35,000
40,000
45,000
0
1,000
2,000
3,000
4,000
5,000
6,000
7,000
8,000
9,000
10,000
1975
1977
1979
1981
1983
1985
1987
1989
1991
1993
1995
1997
1999
2001
2003
2005
2007
2009
2011
2013
2015
Num
ber o
f lis
ted
firm
s in
non
-U.S
. lis
tings
Num
ber o
f lis
ted
U.S
. firm
s
U.S. Non-U.S. countries Non-U.S. developed countries (constant sample)
19
Figure 3. The percentage of listed U.S. firms with market capitalization less than $100M and average market capitalization.
Source: The Center for Research in Security Prices (CRSP). Note: Listed firms include U.S. firms in CRSP on the NYSE, AMEX, and Nasdaq. Investment companies, mutual funds, REITs, and other collective investment vehicles are excluded. Market capitalization is in 2015 dollars. The sample period is from 1975 to 2016.
$0
$1,000,000
$2,000,000
$3,000,000
$4,000,000
$5,000,000
$6,000,000
$7,000,000
0%
10%
20%
30%
40%
50%
60%
70%
1975
1977
1979
1981
1983
1985
1987
1989
1991
1993
1995
1997
1999
2001
2003
2005
2007
2009
2011
2013
2015
Ave
rage
mar
ket c
apita
lizat
ion
Perc
ent o
f firm
s w
ith m
arke
t cap
italiz
atio
n <
$10
0M
Percent of firms with market capitalization < $100MAverage market capitalization (in constant 2015 dollars)
20
Figure 4. Firm size, industry, and listing propensity.
Source: The Center for Research in Security Prices (CRSP), Compustat, and the U.S. Census Bureau’s Longitudinal Business Database. Notes: Listed firms include U.S. firms in CRSP and Compustat on the NYSE, AMEX, and Nasdaq that we can assign to an employee size group. Investment companies, mutual funds, REITs, and other collective investment vehicles are excluded. The percentage of firms that are listed in each employee size group equals listed firms / total firms, where total firms includes public and private firms. The sample period is from 1977 to 2015.
0%
10%
20%
30%
40%
50%
60%
70%
80%
1977
1979
1981
1983
1985
1987
1989
1991
1993
1995
1997
1999
2001
2003
2005
2007
2009
2011
2013
2015
<20
29 to 99
100 to 249
250 to 499
500 to 999
1,000 to 2,499
2,500 to 4,999
5,000 to 9,999
>10,000
21
Figure 5. Capital expenditures versus research and development expenditures.
Source: The Center for Research in Security Prices (CRSP) and Compustat. Note: Listed firms include U.S. firms in CRSP and Compustat on the NYSE, AMEX, and Nasdaq. Investment companies, mutual funds, REITs, and other collective investment vehicles are excluded. Capital expenditures/assets equals capital expenditures divided by lagged assets. R&D/assets equals R&D divided by lagged assets. If R&D is missing, it is set equal to 0. The sample period is from 1975 to 2016.
0%
2%
4%
6%
8%
10%
12%
14%
16%19
75
1977
1979
1981
1983
1985
1987
1989
1991
1993
1995
1997
1999
2001
2003
2005
2007
2009
2011
2013
2015
Capital expenditures/assets R&D/Assets
22
Figure 6. Firm payout policy.
Source: The Center for Research in Security Prices (CRSP) and Compustat. Note: Listed firms include U.S. firms in CRSP and Compustat on the NYSE, AMEX, and Nasdaq. Investment companies, mutual funds, REITs, and other collective investment vehicles are excluded. Dividends/Assets equals ordinary cash dividends divided by lagged assets. Repurchases/Assets equals the purchase of stock minus any decrease in preferred stock, divided by lagged assets. Payout/Net income equals dividends plus repurchases, divided by net income. The sample period is from 1975 to 2016.
0%
1%
1%
2%
2%
3%
0%
10%
20%
30%
40%
50%
60%19
75
1977
1979
1981
1983
1985
1987
1989
1991
1993
1995
1997
1999
2001
2003
2005
2007
2009
2011
2013
2015
Div
iden
ds a
nd re
purc
hase
s as a
per
cent
of a
sset
s
Payo
ut/N
et in
com
e
Payout/Net income Dividends/Assets Repurchases/Assets
about ECGI
The European Corporate Governance Institute has been established to improve corpo-rate governance through fostering independent scientific research and related activities.
The ECGI will produce and disseminate high quality research while remaining close to the concerns and interests of corporate, financial and public policy makers. It will draw on the expertise of scholars from numerous countries and bring together a critical mass of expertise and interest to bear on this important subject.
The views expressed in this working paper are those of the authors, not those of the ECGI or its members.
www.ecgi.org
ECGI Working Paper Series in Finance
Editorial Board
Editor Ernst Maug, Professor of Corporate Finance, Mannheim Business School, University of Mannheim
Consulting Editors Franklin Allen, Nippon Life Professor of Finance, Professor of Economics, The Wharton School of the University of Pennsylvania Julian Franks, Professor of Finance, London Business School Marco Pagano, Professor of Economics, Facoltà di Economia Università di Napoli Federico II Xavier Vives, Professor of Economics and Financial Management, IESE Business School, University of Navarra
Luigi Zingales, Robert C. McCormack Professor of Entrepreneurship and Finance, University of Chicago, Booth School of Business
Editorial Assistants Tamas Barko, University of Mannheim Sven Vahlpahl, University of Mannheim Vanessa Wang, University of Mannheim
www.ecgi.org\wp
Electronic Access to the Working Paper Series
The full set of ECGI working papers can be accessed through the Institute’s Web-site (www.ecgi.org/wp) or SSRN:
Finance Paper Series http://www.ssrn.com/link/ECGI-Fin.html Law Paper Series http://www.ssrn.com/link/ECGI-Law.html