55
i t April 2015 ofgem.gov.uk Contact: Caroline Bradley Team: Energy efficiency and social programmes Email: [email protected]

i
t
April 2015 ofgem.gov.uk
Contact: Caroline Bradley
Team: Energy efficiency and social
programmes
Email: [email protected]
i
Foreword
Energy efficiency is a central part of the government’s policies for reducing UK
greenhouse gas emissions. Between January 2013 and March 2015 the Energy
Companies Obligation (ECO) was the main legislative driver for making British homes
more energy efficient. It was the successor to the Carbon Emissions Reduction Target
(CERT) and the Community Energy Savings Programme (CESP) and was designed to
work alongside the Green Deal.
The Department of Energy and Climate Change (DECC) was responsible for setting
the overall targets and designing the policy. We (Ofgem1) administered ECO on behalf
of the Gas and Electricity Markets Authority.
We administered ECO in line with The Electricity and Gas (Energy Companies
Obligation) Order 2012 as amended (referred to here as the ‘Order’ or the ‘ECO
Order’). A new Order, referred to as the ECO2 Order, was laid in December 2014
extending the scheme from April 2015 to March 2017.
Throughout the scheme the Order required us to report progress each month to the
Secretary of State. We also published monthly compliance reports from August 2013.
This report concludes the reporting requirements placed on us and details the final
position of ECO at the end of the obligation period (which covered January 2013 to
March 2015).
Managing Director of E-serve
Chris Poulton
1 The Office of Gas and Electricity Markets

ii
Contents
Foreword i
Contents ii
Associated Documents ii
Executive Summary iii
1. Legislative context 1
2. Overall performance 8
3. Energy company performance 19
4. Monitoring and compliance 31
5. Communication and engagement 43
Appendix 1: Supplier compliance positions 49
Associated Documents
The Electricity and Gas (Energy Companies Obligation) Order 2012
http://www.legislation.gov.uk/uksi/2012/3018/contents/made.
The Electricity and Gas (Energy Companies Obligation) (Determination of savings)
(Amendment) 2014
http://www.legislation.gov.uk/uksi/2014/2897/contents/made.
The Electricity and Gas (Energy Companies Obligation) (Amendment) Order 2014
http://www.legislation.gov.uk/uksi/2014/1131/contents/made.
The Electricity and Gas (Energy Companies Obligation) (Amendment) (No.2)
Order 2014
http://www.legislation.gov.uk/uksi/2014/3231/contents/made.
The Electricity and Gas (Energy Company Obligation) Order 2014
http://www.legislation.gov.uk/uksi/2014/3219/contents/made.
Energy Companies Obligation (ECO): Guidance for Energy Companies (Version
1.2)
https://www.ofgem.gov.uk/sites/default/files/docs/2014/12/eco_guidance_for_en
ergy companies_version_1_2_final.pdf.

iii
Executive Summary
i. The Energy Companies Obligation (ECO), which started in 2013, was a
Government scheme for Great Britain that placed legal obligations on larger
energy companies to deliver energy efficiency measures to domestic premises.
ii. There were three main obligations under ECO which energy companies were
required to meet. The obligations were the Carbon Emissions Reduction
Obligation (CERO), the Carbon Saving Community Obligation (CSCO) and the
Home Heating Cost Reduction Obligation (HHCRO). CSCO also had a sub-
obligation focused on rural areas (the CSCO rural sub-obligation).
Overall energy company performance
iii. The final position of the ECO scheme is summarised below:
every energy company met all of their ECO obligations and sub-obligations
the total lifetime carbon savings2 achieved under CERO were 18.33 MtCO2,
which is 131% of the target
the total lifetime carbon savings achieved under CSCO were 9.87 MtCO2,
including 1.79 MtCO2 achieved under the rural sub-obligation. These
constitute 145% of the CSCO target and 175% of the rural sub-obligation
target
the total lifetime cost savings achieved under HHCRO were 5.16 £Bn,
which is 123% of the target
iv. It is likely that the majority of any excess savings will be carried forward into
ECO2.
Table of energy company performance against obligations
Energy company CERO CSCO CSCO Rural HHCRO
British Gas 123% 134% 160% 115%
The Co-
operative
Energy 109% 114% 111% 109%
EDF Energy 128% 134% 142% 141%
E.ON 155% 177% 236% 127%
First Utility 141% 113% 176% 104%
npower 130% 148% 141% 124%
Scottish
Power 134% 127% 135% 127%
SSE 125% 157% 223% 118%
Utility
Warehouse 109% 106% 109% 107%
2 The CERO and CSCO targets were measured in the amount of carbon dioxide emissions that the measures will reduce over their lifetimes (ie ‘carbon savings’). The HHCRO target was measured in the amount of bill savings it will provide for consumers over the measures’ lifetimes (ie ‘cost savings’).
iv
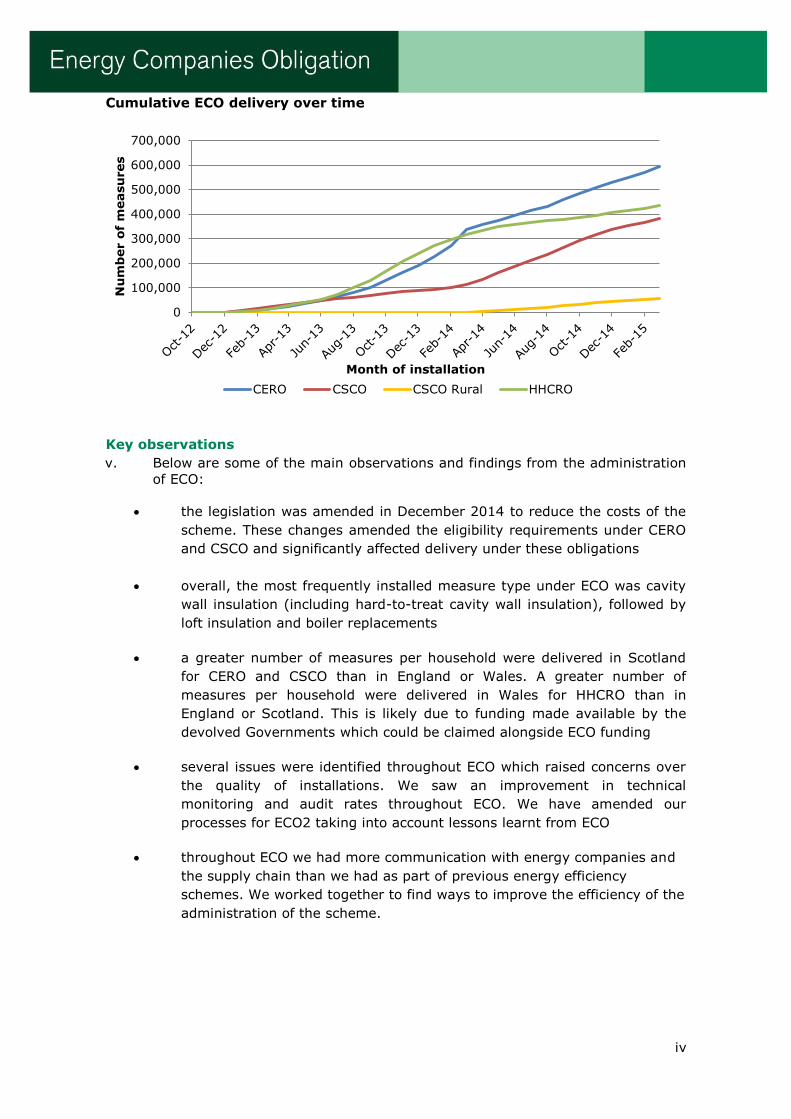
Cumulative ECO delivery over time
Key observations
v. Below are some of the main observations and findings from the administration
of ECO:
the legislation was amended in December 2014 to reduce the costs of the
scheme. These changes amended the eligibility requirements under CERO
and CSCO and significantly affected delivery under these obligations
overall, the most frequently installed measure type under ECO was cavity
wall insulation (including hard-to-treat cavity wall insulation), followed by
loft insulation and boiler replacements
a greater number of measures per household were delivered in Scotland
for CERO and CSCO than in England or Wales. A greater number of
measures per household were delivered in Wales for HHCRO than in
England or Scotland. This is likely due to funding made available by the
devolved Governments which could be claimed alongside ECO funding
several issues were identified throughout ECO which raised concerns over
the quality of installations. We saw an improvement in technical
monitoring and audit rates throughout ECO. We have amended our
processes for ECO2 taking into account lessons learnt from ECO
throughout ECO we had more communication with energy companies and
the supply chain than we had as part of previous energy efficiency
schemes. We worked together to find ways to improve the efficiency of the
administration of the scheme.
0
100,000
200,000
300,000
400,000
500,000
600,000
700,000
Nu
mb
er o
f m
easu
res
Month of installation
CERO CSCO CSCO Rural HHCRO
1
1. Legislative context
Introduction
1.1. ECO placed a legal obligation on larger energy companies to deliver energy
efficiency measures to domestic premises.3 Energy companies with more than
250,000 customers and that supplied more than a minimum amount of gas or
electricity in a specific period were obligated under ECO.4 The obligation period
for ECO began on 1 January 2013 and ended on 31 March 2015.
1.2. ECO was introduced as a successor to the Carbon Emissions Reduction Target
(CERT) and Community Energy Savings Programme (CESP) schemes which ran
from April 2008 to December 2012 and October 2009 to December 2012
respectively.
1.3. ECO had three distinct obligations, which were initially conceived as:
the Carbon Emissions Reduction Obligation (CERO) focused primarily on
the installation of insulation measures in hard-to-treat properties with a
target of 20.9MtCO2 lifetime savings
the Carbon Saving Community Obligation (CSCO) focused on low income
areas with a target of 6.8MtCO2 lifetime savings, 15% of which was to be
delivered in rural areas to consumers on certain types of benefits (the
rural sub-obligation), and
the Home Heating Cost Reduction Obligation (HHCRO)5 focused on
reducing heating costs for consumers on certain types of benefits as a way
of targeting vulnerable households. The HHCRO target was £4.2bn lifetime
savings.
1.4. The ECO Order established three phases for ECO:
3 Under the Order, obligations were imposed on individual gas or electricity licence holders
(referred to as ‘suppliers’) rather than on the parent company of a group of licence holders. The analysis presented throughout this report is aggregated at group level (referred to as an ‘energy company’). 4 See Chapter 2 of our guidance for energy companies for details of entry requirements. 5 DECC referred to this obligation as the ‘affordable warmth’ target. The policy intent was to make it more affordable for low-income and vulnerable consumers, also known as the Affordable Warmth Group (AWG), to heat their homes.
Chapter Overview
This chapter describes the background to the ECO legislation. It also summarises
the legislative changes that occurred during the obligation period and how they
affected delivery of measures.
2
phase 1: 1 January 2013 to 31 March 2013
phase 2: 1 April 2013 to 31 March 2014, and
phase 3: 1 April 2014 to 31 March 2015.
1.5. Energy companies’ obligations were determined for each phase of ECO. The
obligations did not need to be met separately for each phase, but cumulatively
for the overall obligation period.
1.6. The number of energy companies with obligated licences increased across the
three phases. Six energy companies were obligated from phase one, with two
additional energy companies (First Utility and The Co-operative Energy)
becoming obligated under phases two and three respectively. Utility
Warehouse purchased two obligated licences in December 2013.
1.7. Although the obligation period officially began on 1 January 2013, ECO
measures could be installed from 1 October 2012 when only draft legislation
was available. Ahead of the legislation coming into force, we published a series
of open letters to give energy companies guidance on ECO requirements and
how we would administer the scheme in this interim period until final guidance
was published.
1.8. 845 measures were installed in the period from 1 October 2012 to 1 January
2013. This low number was expected at the start of the scheme. It may have
been a result of energy companies continuing to focus on CERT and CESP in
order to meet their obligations for those schemes as well as them being
uncertain about the final ECO requirements.
1.9. The ECO Order came into force on 5 December 2012, following which we
published full guidance for energy companies on 13 March 2013, replacing the
open letters.
Amendments to the ECO Order
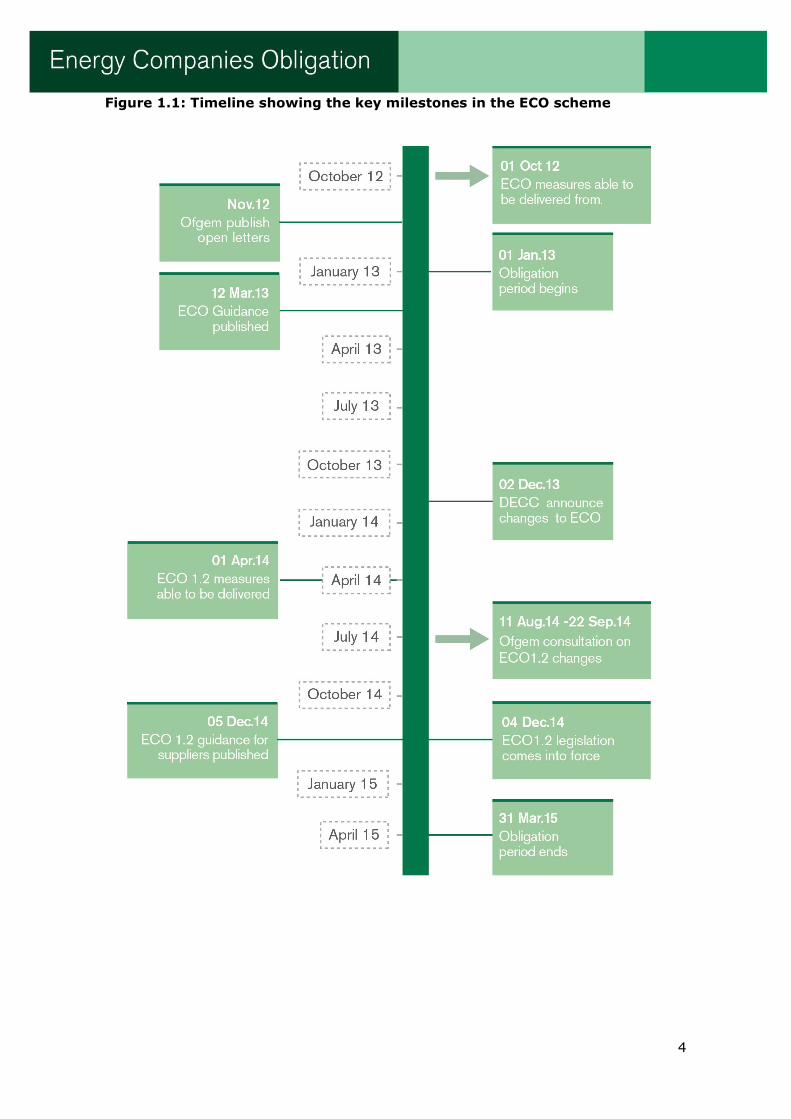
1.10. Over the course of ECO there were several legislative changes to reflect
amendments to the overall intent of the scheme and which affected the
eligibility criteria of measures (see ‘Associated documents’ for details of the
different ECO Orders). The timeline in Figure 1.1 further below shows the key
milestones for ECO.
1.11. Of the various legislative changes, the most significant was announced by
DECC in December 2013, which included:
a reduction of the CERO target by 33% from 20.9MtCO2 to 14MtCO2
changes to the requirements for carrying over savings from CERT and
CESP to ECO (excess actions)6
6 Excess actions are measures that were approved under CERT and CESP but were not required
3
a savings increase of 75% for CERO primary measures7 that energy
companies delivered before 31 March 2014 (the levelisation process). This
process was intended to reward early delivery under CERO
extending the eligibility for CSCO from 15% to 25% of the lowest income
areas on the Index of Multiple Deprivation, plus simplifying the qualifying
criteria for the rural sub-obligation, and
the introduction of roof insulation8, standard cavity wall insulation and
connections to district heating systems (DHS) as primary measures in
CERO.
1.12. These changes were largely the result of concerns around the cost to energy
companies of delivering the scheme, which were passed on to consumer fuel
bills. The changes reduced the cost of meeting the targets by reducing the
overall carbon savings to be achieved, allowing for wider delivery of lower cost
measures and simplification of some of the requirements.
1.13. Although the amending legislation for these changes did not come into force
until December 2014, many of these requirements applied to measures
installed from 1 April 2014. This group of legislative amendments and the
measures installed in accordance with them are referred to as ECO1.2.
to meet those obligations (ie were in excess of them). 7 Primary measures were intended to be the main measure types installed in CERO (solid wall insulation and hard-to-treat cavity wall insulation in the original Order), which could support secondary measures in the same property. 8 Roof insulation includes loft insulation as well as room-in-roof insulation, flat roof insulation and rafter insulation.
4
Figure 1.1: Timeline showing the key milestones in the ECO scheme

5
Impact of ECO1.2 legislative changes on delivery
1.14. Figures 1.2 to 1.4 below show the number of measures delivered over the
ECO obligation period for CERO, CSCO (including CSCO rural) and HHCRO
respectively. The figures exclude excess actions.
Figure 1.2: Monthly delivery of CERO measures in ECO
1.15. As shown in Figure 1.2 the delivery of CERO measures increased steadily until
November 2013. Following a small dip in December 2013, delivery increased to
a peak in March 2014. This peak coincided with the installation deadline for
measures eligible for the levelisation process. Following a significant drop in
installations from April 2014, delivery under CERO remained relatively steady
until the end of the obligation.
Figure 1.3: Monthly delivery of CSCO measures, including CSCO rural
measures
0
10,000
20,000
30,000
40,000
50,000
60,000
70,000
Nu
mb
er o
f m
easu
res
Month of installation
No. CERO measures installed 1.2 Legislation implementation date
0
5,000
10,000
15,000
20,000
25,000
30,000
35,000
40,000
Nu
mb
er o
f m
easu
res
Month of installation
No. CSCO Rural measures installed No. CSCO measures installed1.2 Legislation implementation date

6
1.16. Figure 1.3 shows the delivery of CSCO and CSCO rural sub-obligation
measures over the ECO obligation period. Delivery was relatively low until
March 2014, with delivery of CSCO rural sub-obligation measures extremely
low in this period.
1.17. The ECO1.2 legislative changes expanded the eligibility requirements for
measures installed from 1 April 2014 for both CSCO and the CSCO rural sub-
obligation. As shown in figure 1.3, the delivery of CSCO measures increased
significantly after the number of eligible low income areas was expanded.
1.18. 98% of measures in the CSCO rural sub-obligation were delivered in
accordance with the amended ECO1.2 requirements rather than the original
requirements. Enough measures were collectively installed to meet the rural
sub-obligation within seven months.
Figure 1.4: Monthly delivery of HHCRO measures
1.19. The ECO1.2 legislative changes did not affect any of the HHCRO requirements.
As such, there appears to have been no impact on the delivery profile of
HHCRO. Figure 1.4 shows that the delivery of HHCRO measures grew steadily
from the beginning of the obligation period until it peaked in November 2013.
Delivery then gradually dropped until September 2014 and continued steadily
thereafter.
Provision for a new obligation period
1.20. In December 2014 legislation was introduced for a new obligation period
starting on 1 April 2015 (referred to as ECO2). It included:
extending the scheme to 2017
0
5,000
10,000
15,000
20,000
25,000
30,000
35,000
40,000
45,000
Nu
mb
er o
f m
easu
res
Month of installation
No. HHCRO measures installed 1.2 Legislation implementation date
7
allowing energy companies to carry forward the majority of savings that
were not needed to achieve their obligations under EC’O towards their
ECO2 obligations (referred to as surplus actions)
introducing a provisional solid wall minimum requirement (PSWMR) of 4
MtCO2 carbon savings to be achieved across all energy companies between
January 2013 and March 2017, equivalent to approximately 100,000 solid
wall insulation measures9
making changes to HHCRO including:
- introducing uplifts in the cost savings for qualifying boiler
replacements and measures delivered to non-gas premises
- repair and replacement of qualifying electric storage heaters as a
new measure, and
- minimum warranty requirements for replacement boilers and
electric storage heaters.
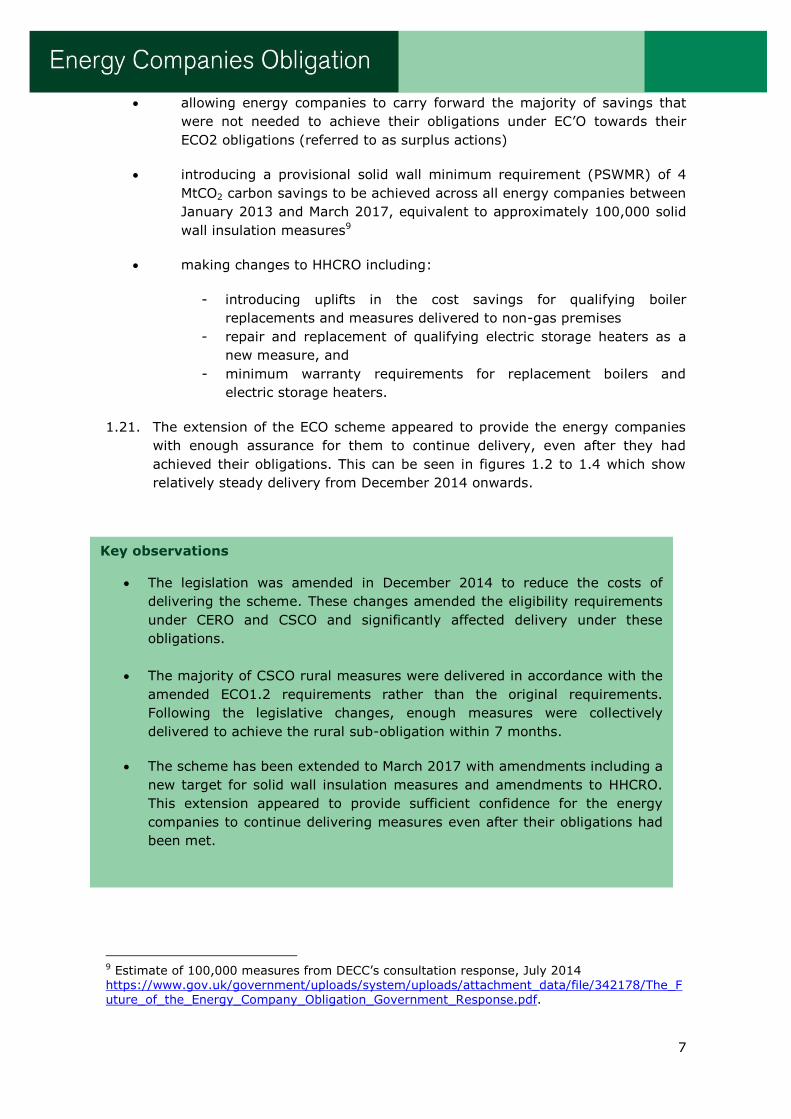
1.21. The extension of the ECO scheme appeared to provide the energy companies
with enough assurance for them to continue delivery, even after they had
achieved their obligations. This can be seen in figures 1.2 to 1.4 which show
relatively steady delivery from December 2014 onwards.
9 Estimate of 100,000 measures from DECC’s consultation response, July 2014 https://www.gov.uk/government/uploads/system/uploads/attachment_data/file/342178/The_Future_of_the_Energy_Company_Obligation_Government_Response.pdf.
Key observations
The legislation was amended in December 2014 to reduce the costs of
delivering the scheme. These changes amended the eligibility requirements
under CERO and CSCO and significantly affected delivery under these
obligations.
The majority of CSCO rural measures were delivered in accordance with the
amended ECO1.2 requirements rather than the original requirements.
Following the legislative changes, enough measures were collectively
delivered to achieve the rural sub-obligation within 7 months.
The scheme has been extended to March 2017 with amendments including a
new target for solid wall insulation measures and amendments to HHCRO.
This extension appeared to provide sufficient confidence for the energy
companies to continue delivering measures even after their obligations had
been met.

8
2. Overall performance
Introduction
2.1. Each ECO obligation had specific eligibility criteria for measures which could be
delivered under that obligation. The carbon and cost savings attributed to the
measures meeting those eligibility requirements contributed to an energy
company’s progress towards its obligations. Here we present the combined
performance of all energy companies towards the overall ECO targets.10
2.2. The ECO Order also set out limits which the energy companies could not
exceed. These were the proportion of boiler repairs conducted under HHCRO
and the proportion of measures claimed in adjoining areas11 in CSCO. This
chapter shows where the energy companies reached either of these limits.
2.3. Please note that, unless specified, the figures in this and the following chapters
do not include excess actions from CERT and CESP.
Figure 2.1: Overall achievement by energy companies of ECO targets
10 The progress towards obligations presented here is accurate as of 4 September 2015. Any information which came to light after this time, eg from a suspected fraud investigation (please see paragraph 4.41 for more information), is not reflected here. 11 Adjoining areas are those that share a border with an area of low income under CSCO. In England and Wales areas are described as lower super output areas (LSOA). In Scotland, areas are described as data zones.
0% 50% 100% 150% 200%
CERO14.0 MtCO2
CSCO6.8 MtCO2
CSCO Rural Sub-Obligation1.0 MtCO2
HHCRO4.2 £bn
Performance against obligation
Ob
lig
ati
on
% CERO Levelisation Uplift % Approved % Excess Actions
Chapter overview
This chapter gives a summary of the overall performance of energy companies
against the ECO targets. It also provides an overview of delivery under CERO,
CSCO, the CSCO rural sub-obligation and HHCRO.

9
2.4. Figure 2.1 above shows achievement against the overall ECO targets set for
all energy companies. All targets were exceeded and it is likely that many of
these excess savings will be taken forward into ECO2.
Figure 2.2: ECO delivery over time
2.5. Figure 2.2 above shows the delivery profile of measures in each obligation. It
shows that overall, energy companies focused on delivering HHCRO first,
followed by CERO and then CSCO and the CSCO rural sub-obligation.
Delivery mechanisms
2.6. Energy companies delivered ECO measures through a variety of mechanisms.
The most widely used methods were to contract work directly with installers or
to employ managing agents who represented a number of installers. A small
number (1% of total ECO measures, the majority of which were HHCRO) were
referred to the scheme by the Energy Savings Advice Service and the Home
Energy Service.
2.7. Energy companies could also use another mechanism called ‘brokerage’.
Brokerage was a blind auction platform developed by DECC where installers
could sell ‘lots’ of measures they would then be contracted to deliver to energy
companies in return for funding. This system was created in response to
requests from the energy efficiency industry to help smaller and newer
installers access the market and to facilitate blending of finance with the Green
Deal.12 13% of measures were delivered through this mechanism.
2.8. The supply chain was relatively long within ECO, ie there were often several
companies involved in the delivery of particular measures. As a result it was
12 The Green Deal is a government-backed scheme intended to work in conjunction with ECO to help fund energy-efficiency improvements to homes in Great Britain.
0
10,000
20,000
30,000
40,000
50,000
60,000
70,000
No.
measu
res i
nsta
lled
Month of installation
CERO CSCO HHCRO CSCO Rural

10
sometimes difficult to ensure that our requirements were fully understood by
all parties. In addition, it was sometimes challenging for suppliers to obtain
further documentation or information relating to measures from the supply
chain when we requested it.
CERO
2.9. The CERO obligation initially focused on insulating hard-to-treat properties
(through primary measures such as solid wall insulation and hard-to-treat
cavity wall insulation). Additional measures could be installed in these
properties by allowing secondary insulation measures. It enabled consumers
who were able to pay for the installation of measures, aiming to blend ECO
finance with Green Deal finance.
2.10. The ECO1.2 legislative changes expanded the range of permissible primary
measures introducing lower cost measures such as loft insulation and standard
cavity wall insulation.
2.11. A total of 593,042 measures were delivered under CERO with an additional
107,237 measures carried over from CERT and CESP. As shown in Figure 2.1,
the overall carbon savings achieved under CERO met 131% of the CERO
target, with 9% of this from carbon savings carried forward from CERT and
CESP and 12% resulting from the levelisation process introduced as part of the
ECO1.2 legislative changes. All of the energy companies met their CERO
obligation.13
Figure 2.3: Performance against the CERO target over time
13 The ECO2 Order gave us powers to increase an energy company’s CERO obligations in ECO2 if they did not achieve their CERO obligations in ECO. We will not need to amend any ECO2 obligations.
0%
50%
100%
150%
Percen
tag
e p
rog
ress t
ow
ard
s
targ
et
Month of installation
11
2.12. As shown in Figure 2.3, taking into account excess actions from CERT and
CESP and the levelisation process, enough measures were delivered to meet
the reduced overall CERO target (14 MtCO2) by the end of August 2014.
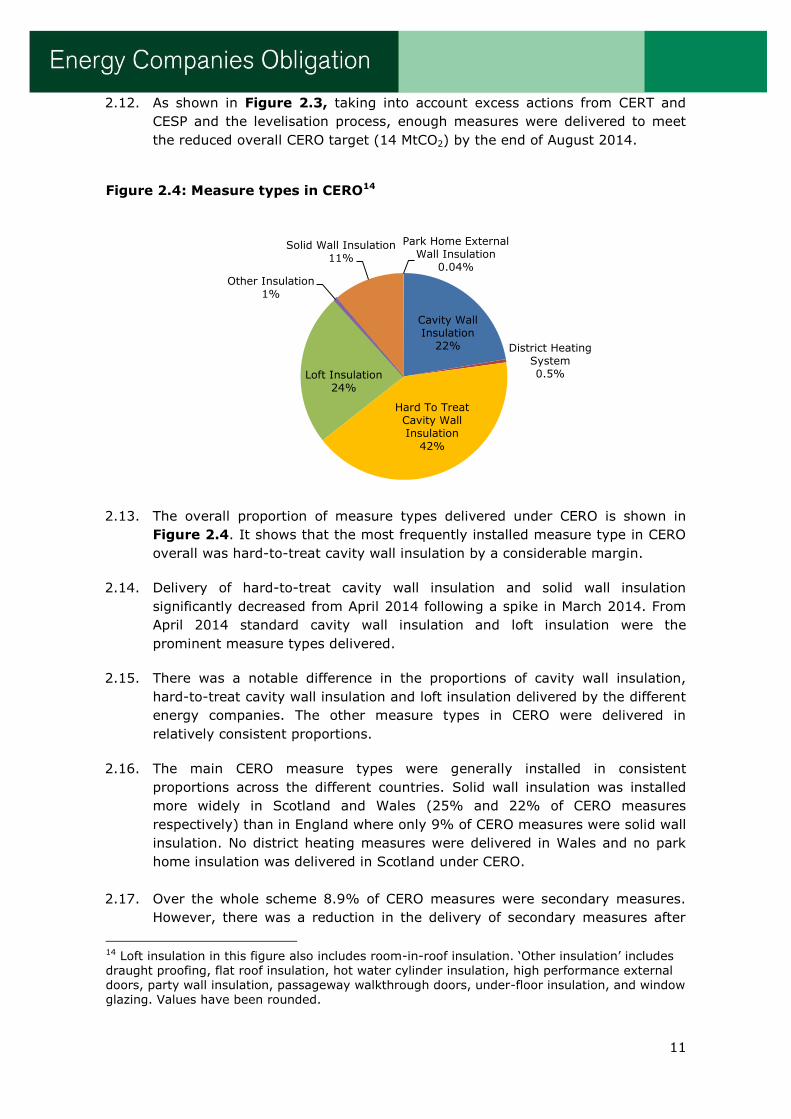
Figure 2.4: Measure types in CERO14
2.13. The overall proportion of measure types delivered under CERO is shown in
Figure 2.4. It shows that the most frequently installed measure type in CERO
overall was hard-to-treat cavity wall insulation by a considerable margin.
2.14. Delivery of hard-to-treat cavity wall insulation and solid wall insulation
significantly decreased from April 2014 following a spike in March 2014. From
April 2014 standard cavity wall insulation and loft insulation were the
prominent measure types delivered.
2.15. There was a notable difference in the proportions of cavity wall insulation,
hard-to-treat cavity wall insulation and loft insulation delivered by the different
energy companies. The other measure types in CERO were delivered in
relatively consistent proportions.
2.16. The main CERO measure types were generally installed in consistent
proportions across the different countries. Solid wall insulation was installed
more widely in Scotland and Wales (25% and 22% of CERO measures
respectively) than in England where only 9% of CERO measures were solid wall
insulation. No district heating measures were delivered in Wales and no park
home insulation was delivered in Scotland under CERO.
2.17. Over the whole scheme 8.9% of CERO measures were secondary measures.
However, there was a reduction in the delivery of secondary measures after
14 Loft insulation in this figure also includes room-in-roof insulation. ‘Other insulation’ includes draught proofing, flat roof insulation, hot water cylinder insulation, high performance external doors, party wall insulation, passageway walkthrough doors, under-floor insulation, and window glazing. Values have been rounded.
Cavity Wall Insulation
22% District Heating System 0.5%
Hard To Treat Cavity Wall Insulation
42%
Loft Insulation 24%
Other Insulation 1%
Solid Wall Insulation 11%
Park Home External Wall Insulation
0.04%
12
the implementation of the ECO1.2 legislative changes. 15% of measures
delivered up to March 2014 were secondary measures whereas 0.7% of
measures delivered from April 2014 onwards were secondary measures.
CSCO
2.18. CSCO focused on the installation of insulation measures and connections to
district heating systems at domestic premises within low income and rural
areas. A total of 382,982 measures were delivered under CSCO with an
additional 83,572 measures carried forward from CERT and CESP.
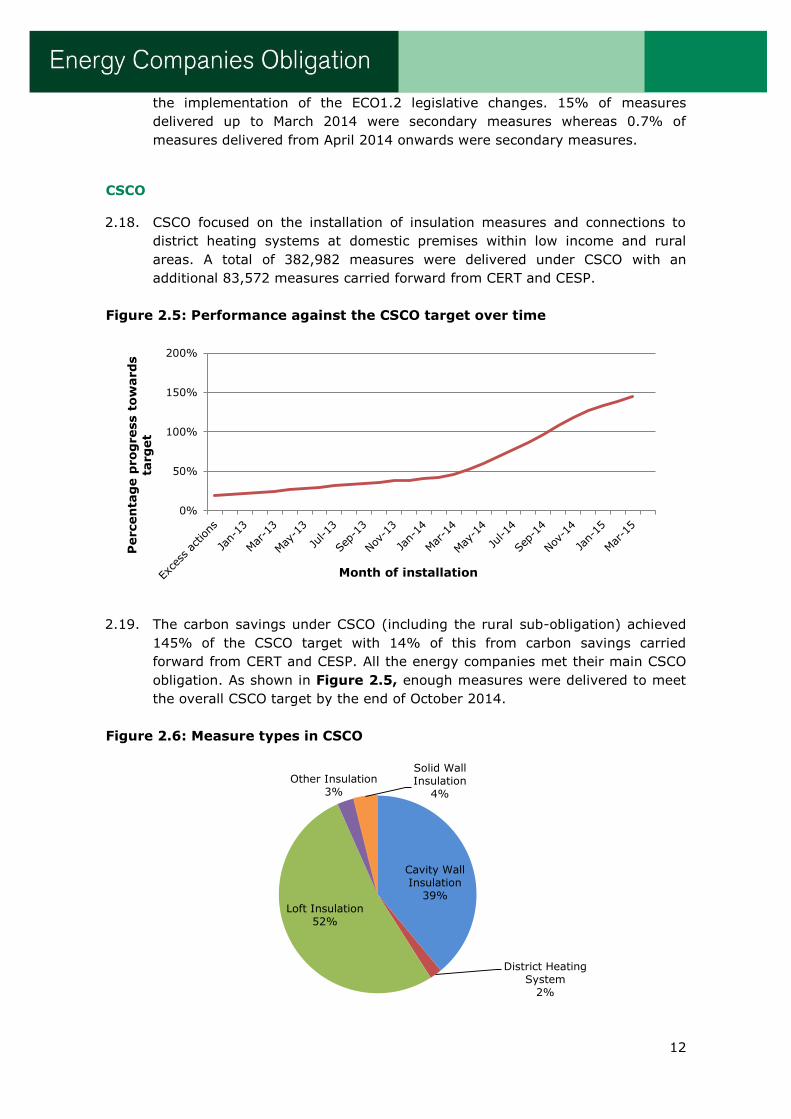
Figure 2.5: Performance against the CSCO target over time
2.19. The carbon savings under CSCO (including the rural sub-obligation) achieved
145% of the CSCO target with 14% of this from carbon savings carried
forward from CERT and CESP. All the energy companies met their main CSCO
obligation. As shown in Figure 2.5, enough measures were delivered to meet
the overall CSCO target by the end of October 2014.
Figure 2.6: Measure types in CSCO
0%
50%
100%
150%
200%
Percen
tag
e p
rog
ress t
ow
ard
s
targ
et
Month of installation
Cavity Wall Insulation
39%
District Heating System
2%
Loft Insulation 52%
Other Insulation 3%
Solid Wall Insulation
4%
13
2.20. Figure 2.6 shows that the majority of CSCO measures were loft insulation
measures (52%) with a further 39% being cavity wall insulation. The
remainder (9%) consisted of much smaller numbers of other insulation
measure types (including draught proofing, under floor insulation and window
glazing) and connections to district heating systems.
2.21. Generally, the different measure types were delivered in consistent proportions
by the energy companies. The energy companies with smaller obligations (The
Co-operative Energy, First Utility and Utility Warehouse) showed slightly more
variance than energy companies with larger obligations.
2.22. Cavity wall insulation and solid wall insulation was generally installed in
consistent proportions within each country. The proportion of loft insulation
delivered varied by around 20% between countries. Under floor insulation
(captured in the ‘other insulation’ group in Figure 2.6) comprised 12% of CSCO
installations in Scotland compared with around 1% of CSCO installations in
England and Wales. In addition, no connections to district heating systems
were delivered in Wales under CSCO.
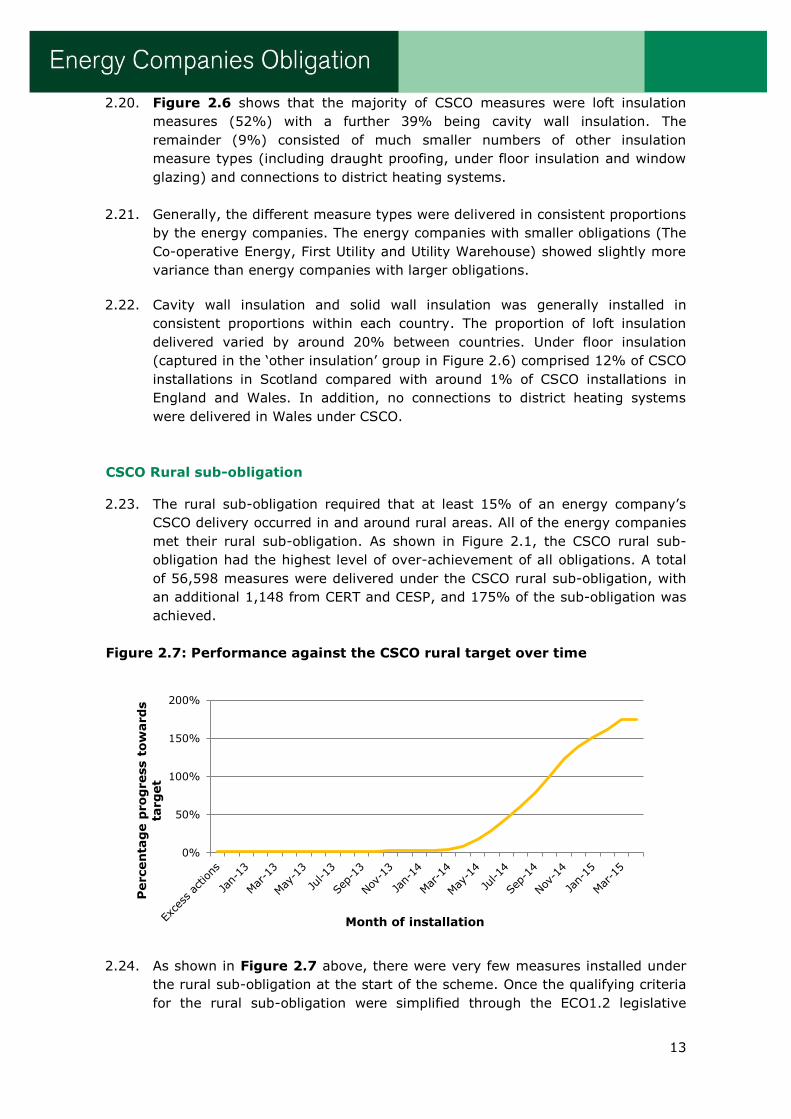
CSCO Rural sub-obligation
2.23. The rural sub-obligation required that at least 15% of an energy company’s
CSCO delivery occurred in and around rural areas. All of the energy companies
met their rural sub-obligation. As shown in Figure 2.1, the CSCO rural sub-
obligation had the highest level of over-achievement of all obligations. A total
of 56,598 measures were delivered under the CSCO rural sub-obligation, with
an additional 1,148 from CERT and CESP, and 175% of the sub-obligation was
achieved.
Figure 2.7: Performance against the CSCO rural target over time
2.24. As shown in Figure 2.7 above, there were very few measures installed under
the rural sub-obligation at the start of the scheme. Once the qualifying criteria
for the rural sub-obligation were simplified through the ECO1.2 legislative
0%
50%
100%
150%
200%
Percen
tag
e p
rog
ress t
ow
ard
s
targ
et
Month of installation
14
changes, the number of installations increased significantly. The overall rural
sub-obligation was met by the end of October 2014.
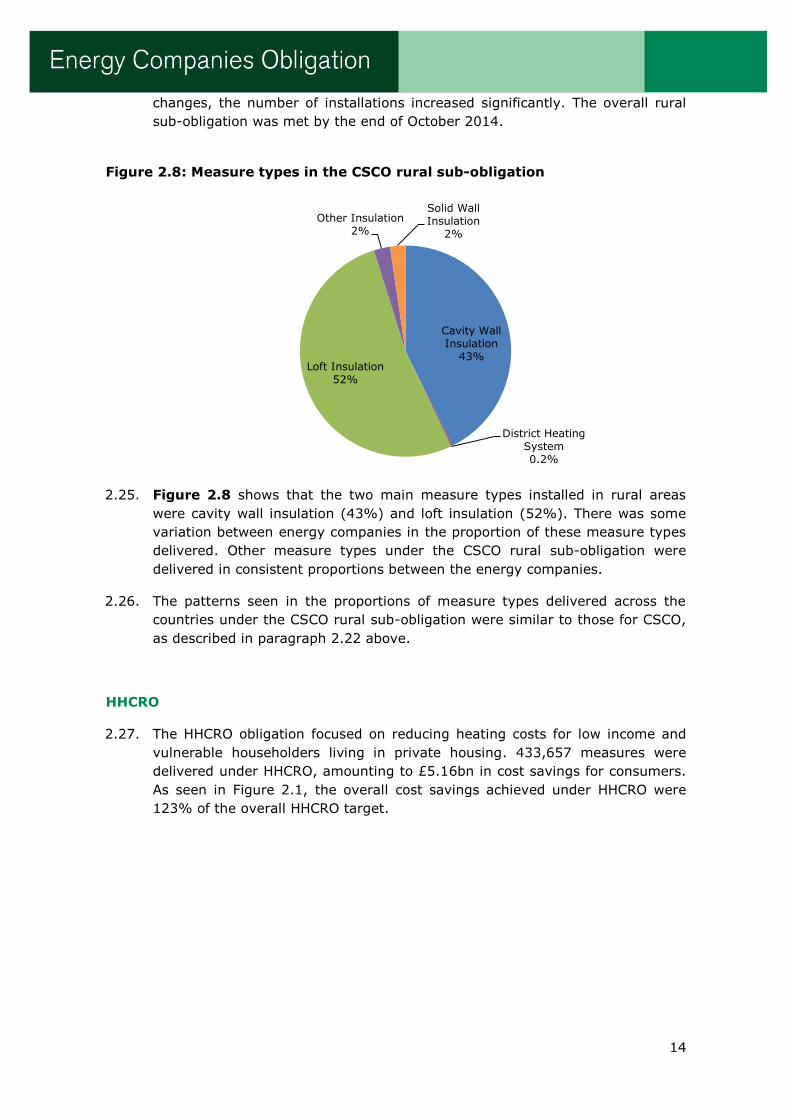
Figure 2.8: Measure types in the CSCO rural sub-obligation
2.25. Figure 2.8 shows that the two main measure types installed in rural areas
were cavity wall insulation (43%) and loft insulation (52%). There was some
variation between energy companies in the proportion of these measure types
delivered. Other measure types under the CSCO rural sub-obligation were
delivered in consistent proportions between the energy companies.
2.26. The patterns seen in the proportions of measure types delivered across the
countries under the CSCO rural sub-obligation were similar to those for CSCO,
as described in paragraph 2.22 above.
HHCRO
2.27. The HHCRO obligation focused on reducing heating costs for low income and
vulnerable householders living in private housing. 433,657 measures were
delivered under HHCRO, amounting to £5.16bn in cost savings for consumers.
As seen in Figure 2.1, the overall cost savings achieved under HHCRO were
123% of the overall HHCRO target.
Cavity Wall Insulation
43%
District Heating System 0.2%
Loft Insulation 52%
Other Insulation 2%
Solid Wall Insulation
2%
15
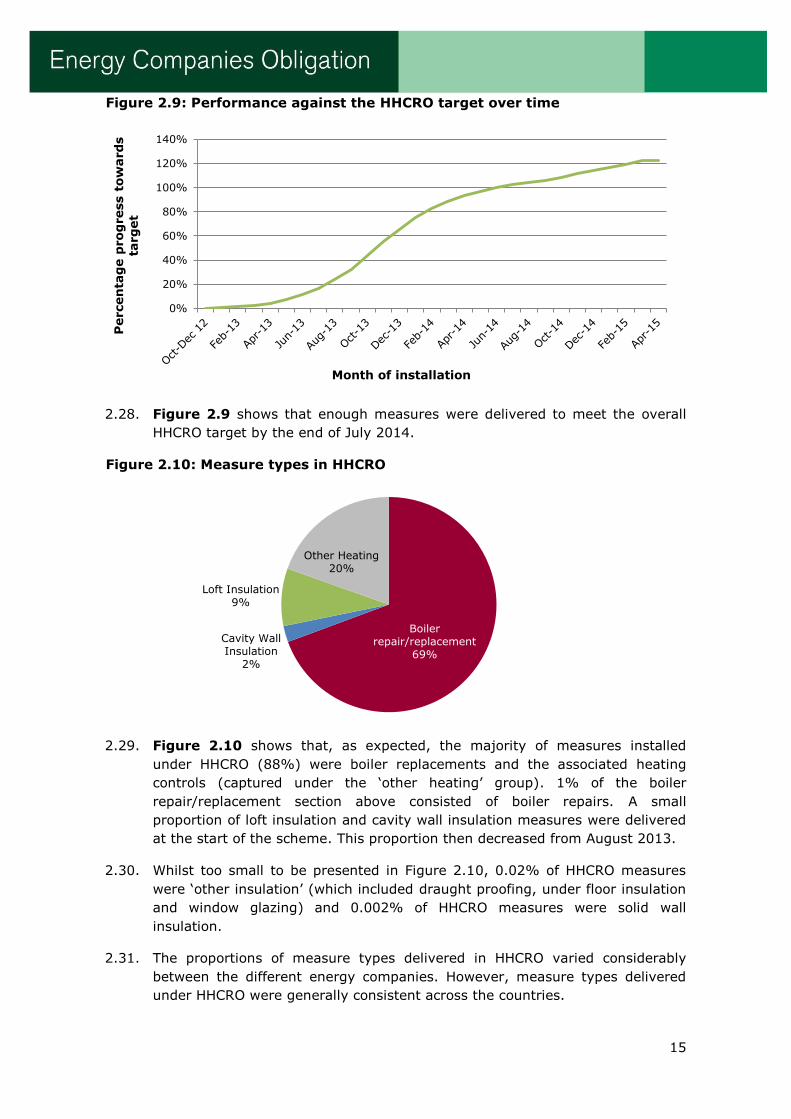
Figure 2.9: Performance against the HHCRO target over time
2.28. Figure 2.9 shows that enough measures were delivered to meet the overall
HHCRO target by the end of July 2014.
Figure 2.10: Measure types in HHCRO
2.29. Figure 2.10 shows that, as expected, the majority of measures installed
under HHCRO (88%) were boiler replacements and the associated heating
controls (captured under the ‘other heating’ group). 1% of the boiler
repair/replacement section above consisted of boiler repairs. A small
proportion of loft insulation and cavity wall insulation measures were delivered
at the start of the scheme. This proportion then decreased from August 2013.
2.30. Whilst too small to be presented in Figure 2.10, 0.02% of HHCRO measures
were ‘other insulation’ (which included draught proofing, under floor insulation
and window glazing) and 0.002% of HHCRO measures were solid wall
insulation.
2.31. The proportions of measure types delivered in HHCRO varied considerably
between the different energy companies. However, measure types delivered
under HHCRO were generally consistent across the countries.
0%
20%
40%
60%
80%
100%
120%
140%
Percen
tag
e p
rog
ress t
ow
ard
s
targ
et
Month of installation
Boiler repair/replacement
69%
Cavity Wall Insulation
2%
Loft Insulation 9%
Other Heating 20%

16
Boiler repairs
2.32. The Order required that no more than 5% of an energy company’s HHCRO
obligation could be achieved through savings from the repair of qualifying
boilers. Figure 2.11 below shows each energy company’s 5% limit and the
percentage they reached. None of the energy companies met or exceeded this
limit.
Figure 2.11: Percentage of boiler limit reached
Energy company 5% limit (£Bn savings) % of limit met
British Gas 0.07 1.57%
The Co-operative Energy 0.0001 0.00%
EDF Energy 0.02 0.01%
E.ON 0.03 0.18%
First Utility 0.001 0.00%
npower 0.02 0.03%
Scottish Power 0.02 0.12%
SSE 0.04 0.01%
Utility Warehouse 0.003 0.00%
Adjoining areas
2.33. Under CSCO, adjoining areas were those that shared a border with an area of
low income. As set out in the Order, the total carbon savings of measures
carried out in CSCO adjoining areas could not exceed 25% of the total savings
achieved in the related low income area. Any savings which exceeded the 25%
limit could not contribute to an energy company’s CSCO obligation.
2.34. Several energy companies did not engage in the delivery of measures in
adjoining areas. For those who did, we conducted indicative assessments of
notified adjoining installations in November 2014, February 2015 and March
2015. These results indicated that energy companies had not fully considered
the adjoining area limits from the start of the scheme. This early analysis
helped energy companies to make adjustments to the number of measures in
adjoining areas ahead of the final deadline.
2.35. In July 2015 we conducted the adjoining area determination. A total of 4,760
measures were subject to this determination. Figure 2.12 below shows that
many of these measures had their approval revoked in order for energy
companies to not exceed the 25% limit. The figure also shows these
revocations as a percentage of the savings subject to the determination.
Following the revocations, 2,292 CSCO adjoining installations remained under
ECO. This accounted for 0.4% of CSCO savings.
17
Figure 2.12: Adjoining area determination results
Energy company No. measures revoked % of adjoining area
savings revoked
British Gas 1,434 56.6%
The Co-operative Energy - -
EDF Energy 67 36.0%
E.ON - -
First Utility - -
npower 856 75.7%
Scottish Power 2 100.0%
SSE 108 38.1%
Utility Warehouse 1 100.0%
Measures delivered per country
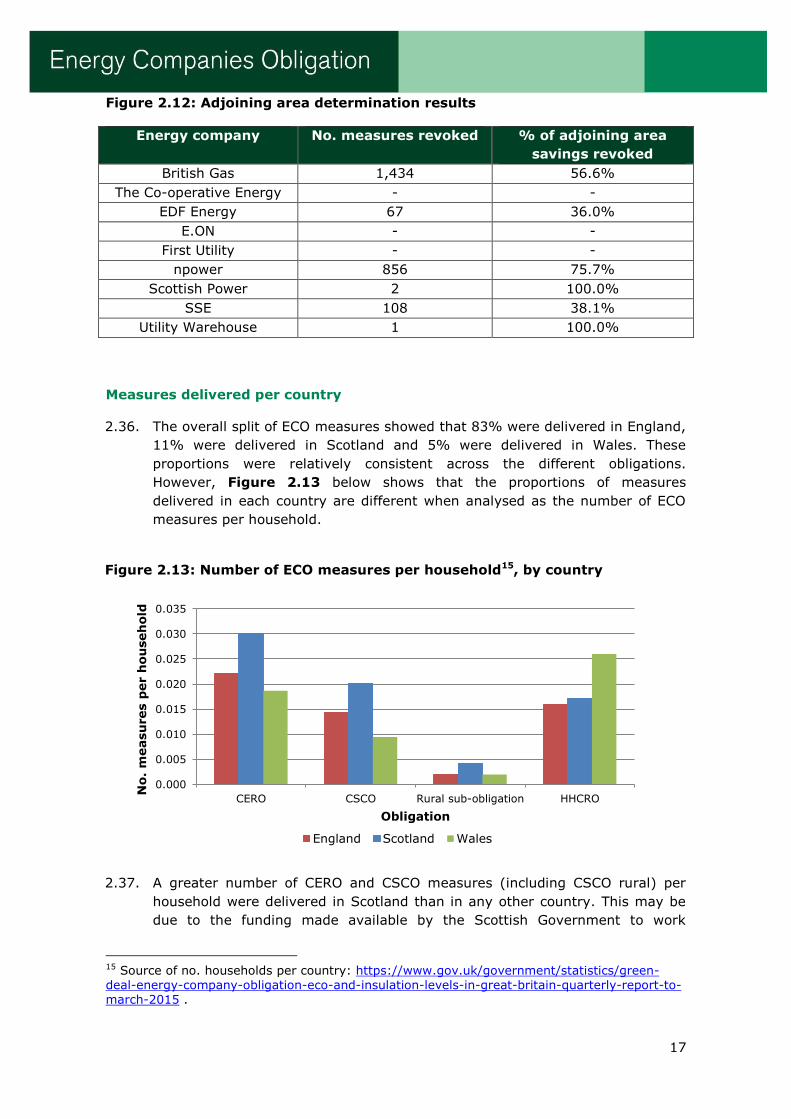
2.36. The overall split of ECO measures showed that 83% were delivered in England,
11% were delivered in Scotland and 5% were delivered in Wales. These
proportions were relatively consistent across the different obligations.
However, Figure 2.13 below shows that the proportions of measures
delivered in each country are different when analysed as the number of ECO
measures per household.
Figure 2.13: Number of ECO measures per household15, by country
2.37. A greater number of CERO and CSCO measures (including CSCO rural) per
household were delivered in Scotland than in any other country. This may be
due to the funding made available by the Scottish Government to work
15 Source of no. households per country: https://www.gov.uk/government/statistics/green-deal-energy-company-obligation-eco-and-insulation-levels-in-great-britain-quarterly-report-to-march-2015 .
0.000
0.005
0.010
0.015
0.020
0.025
0.030
0.035
CERO CSCO Rural sub-obligation HHCRO
No.
measu
res p
er h
ou
seh
old
Obligation
England Scotland Wales

18
alongside ECO, such as the Energy Assistance Scheme.16 A greater number of
HHCRO measures per household were delivered in Wales which may be due to
Welsh Government schemes such as Nest17, whose funding could be claimed
alongside ECO support.
16 The Energy Assistance Scheme provided funding from the Scottish Government for insulation and heating measures for those at risk of fuel poverty. http://www.gov.scot/Topics/Built-Environment/Housing/warmhomes/eap 17 Nest is a Welsh Government scheme intended to help reduce the number of households in fuel poverty by providing advice and support. http://www.nestwales.org.uk/home
Key observations
Overall, energy companies delivered savings significantly in excess of the
ECO targets. It is likely that the majority of the excess savings will be
carried forward into ECO2.
The majority of energy companies chose to deliver their obligations via
managing agents or direct contracts with installers as opposed to via the
brokerage mechanism.
Overall, the most frequently installed measure type under ECO was cavity
wall insulation (including hard-to-treat cavity wall insulation), followed by
loft insulation and boiler replacements.
A greater number of measures per household were delivered in Scotland for
CERO and CSCO than England and Wales. A greater number of measures
per household were delivered in Wales for HHCRO. These results may be
due to devolved government schemes which provided funding that could be
claimed alongside ECO funding.
19
3. Energy company performance
Introduction
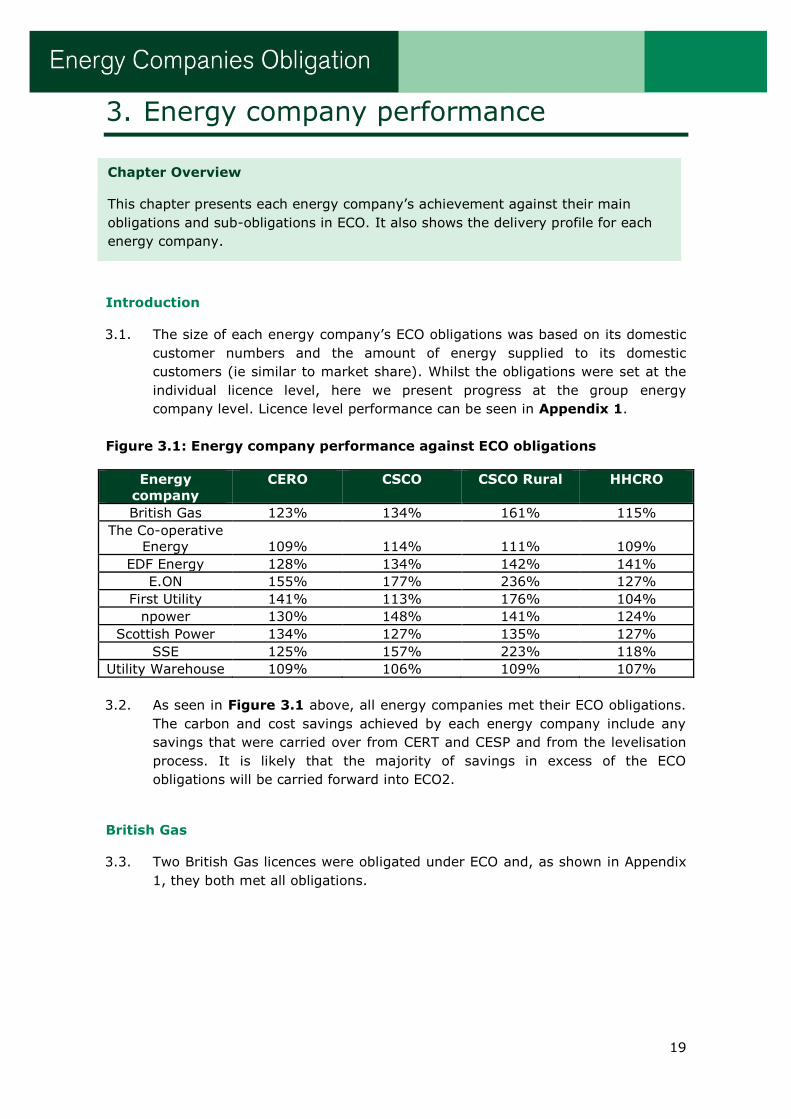
3.1. The size of each energy company’s ECO obligations was based on its domestic
customer numbers and the amount of energy supplied to its domestic
customers (ie similar to market share). Whilst the obligations were set at the
individual licence level, here we present progress at the group energy
company level. Licence level performance can be seen in Appendix 1.
Figure 3.1: Energy company performance against ECO obligations
Energy
company
CERO CSCO CSCO Rural HHCRO
British Gas 123% 134% 161% 115%
The Co-operative
Energy 109% 114% 111% 109%
EDF Energy 128% 134% 142% 141%
E.ON 155% 177% 236% 127%
First Utility 141% 113% 176% 104%
npower 130% 148% 141% 124%
Scottish Power 134% 127% 135% 127%
SSE 125% 157% 223% 118%
Utility Warehouse 109% 106% 109% 107%
3.2. As seen in Figure 3.1 above, all energy companies met their ECO obligations.
The carbon and cost savings achieved by each energy company include any
savings that were carried over from CERT and CESP and from the levelisation
process. It is likely that the majority of savings in excess of the ECO
obligations will be carried forward into ECO2.
British Gas
3.3. Two British Gas licences were obligated under ECO and, as shown in Appendix
1, they both met all obligations.
Chapter Overview
This chapter presents each energy company’s achievement against their main
obligations and sub-obligations in ECO. It also shows the delivery profile for each
energy company.
20
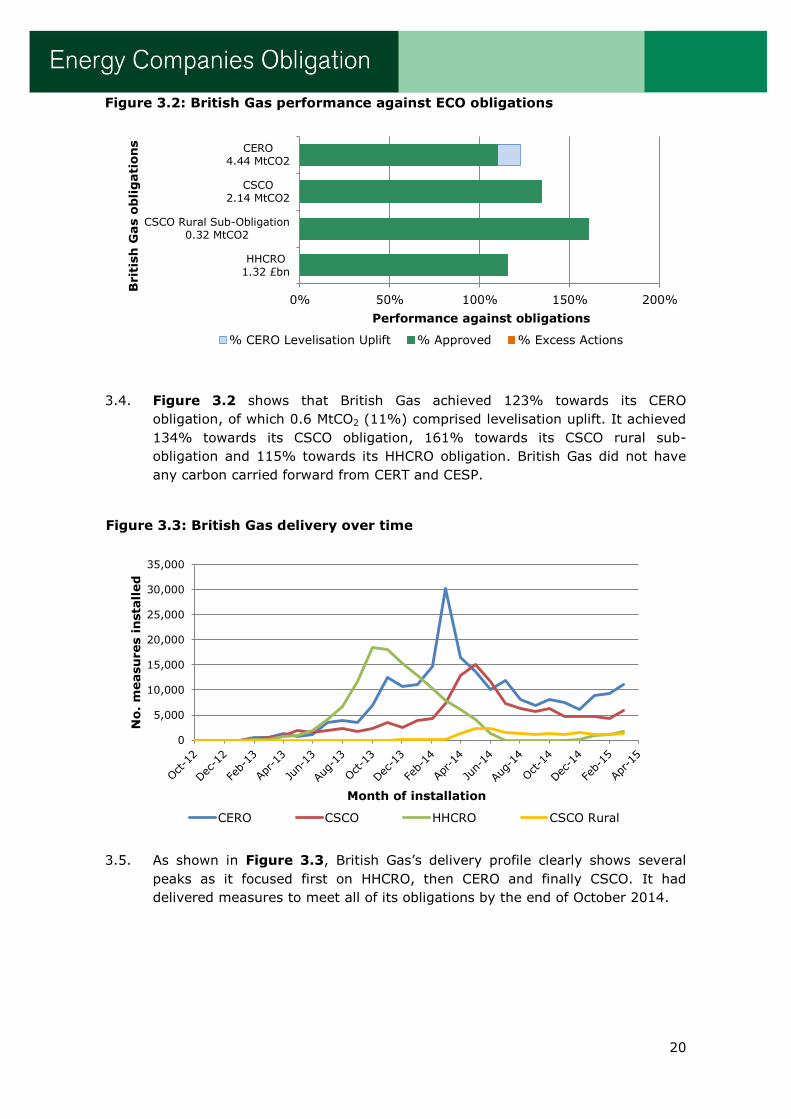
Figure 3.2: British Gas performance against ECO obligations
3.4. Figure 3.2 shows that British Gas achieved 123% towards its CERO
obligation, of which 0.6 MtCO2 (11%) comprised levelisation uplift. It achieved
134% towards its CSCO obligation, 161% towards its CSCO rural sub-
obligation and 115% towards its HHCRO obligation. British Gas did not have
any carbon carried forward from CERT and CESP.
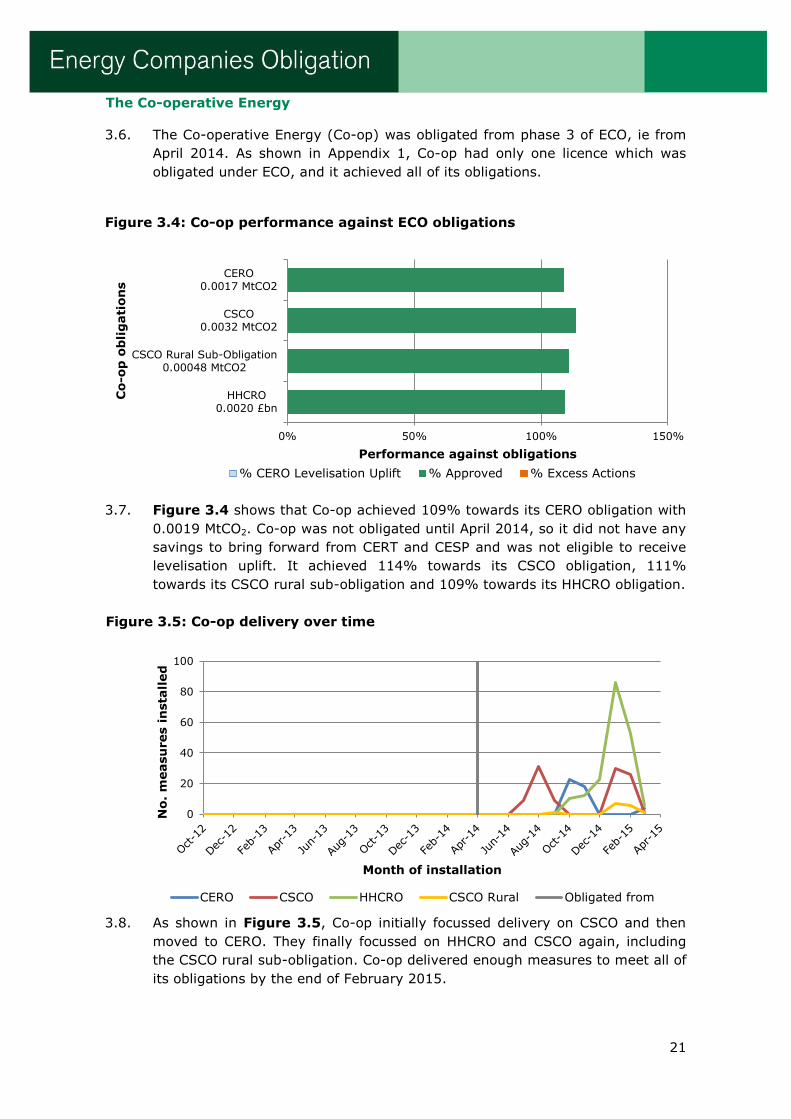
Figure 3.3: British Gas delivery over time
3.5. As shown in Figure 3.3, British Gas’s delivery profile clearly shows several
peaks as it focused first on HHCRO, then CERO and finally CSCO. It had
delivered measures to meet all of its obligations by the end of October 2014.
0% 50% 100% 150% 200%
CERO4.44 MtCO2
CSCO2.14 MtCO2
CSCO Rural Sub-Obligation0.32 MtCO2
HHCRO1.32 £bn
Performance against obligations
Brit
ish
Gas o
bli
gati
on
s
% CERO Levelisation Uplift % Approved % Excess Actions
0
5,000
10,000
15,000
20,000
25,000
30,000
35,000
No.
measu
res i
nsta
lled
Month of installation
CERO CSCO HHCRO CSCO Rural
21
The Co-operative Energy
3.6. The Co-operative Energy (Co-op) was obligated from phase 3 of ECO, ie from
April 2014. As shown in Appendix 1, Co-op had only one licence which was
obligated under ECO, and it achieved all of its obligations.
Figure 3.4: Co-op performance against ECO obligations
3.7. Figure 3.4 shows that Co-op achieved 109% towards its CERO obligation with
0.0019 MtCO2. Co-op was not obligated until April 2014, so it did not have any
savings to bring forward from CERT and CESP and was not eligible to receive
levelisation uplift. It achieved 114% towards its CSCO obligation, 111%
towards its CSCO rural sub-obligation and 109% towards its HHCRO obligation.
Figure 3.5: Co-op delivery over time
3.8. As shown in Figure 3.5, Co-op initially focussed delivery on CSCO and then
moved to CERO. They finally focussed on HHCRO and CSCO again, including
the CSCO rural sub-obligation. Co-op delivered enough measures to meet all of
its obligations by the end of February 2015.
0% 50% 100% 150%
CERO0.0017 MtCO2
CSCO0.0032 MtCO2
CSCO Rural Sub-Obligation0.00048 MtCO2
HHCRO0.0020 £bn
Performance against obligations
Co-o
p o
bli
gati
on
s
% CERO Levelisation Uplift % Approved % Excess Actions
0
20
40
60
80
100
No.
measu
res i
nsta
lled
Month of installation
CERO CSCO HHCRO CSCO Rural Obligated from

22
EDF Energy
3.9. Two EDF Energy licences were obligated under ECO and as shown in Appendix
1, they both met all obligations.
Figure 3.6: EDF Energy performance against ECO obligations
3.10. Figure 3.6 above shows that EDF Energy achieved 128% towards its CERO
obligation of which 0.24 MtCO2 (12%) comprised the levelisation uplift. It
achieved 134% towards its CSCO obligation, 142% towards its CSCO rural
sub-obligation and 141% towards its HHCRO obligation.
3.11. EDF Energy’s carbon savings in CERO, CSCO and the rural sub-obligation all
include carbon from measures carried forward from CERT and CESP. The total
value of savings from CERT and CESP was 0.81 MtCO2.
Figure 3.7: EDF Energy delivery over time
3.12. As shown in Figure 3.7 above, at the start of the scheme EDF Energy focused
on delivering CERO and HHCRO measures. During the second half of 2014,
0% 50% 100% 150%
CERO1.59 MtCO2
CSCO0.78 MtCO2
CSCO Rural Sub-Obligation0.12 MtCO2
HHCRO0.48 £bn
Performance against obligations
ED
F E
nerg
y o
bli
gati
on
s
% CERO Levelisation Uplift % Approved % Excess Actions
0
1,000
2,000
3,000
4,000
5,000
6,000
7,000
No.
measu
res i
nsta
lled
Month of installation
CERO CSCO HHCRO CSCO Rural
23
delivery of CSCO and CSCO rural measures spiked. EDF Energy delivered
enough measures to meet all of its obligations by the end of October 2014.
E.ON
3.13. Two E.ON licences were obligated under ECO and, as shown in Appendix 1,
they both met all obligations.
Figure 3.8: E.ON performance against ECO obligations
3.14. Figure 3.8 shows that E.ON achieved 155% towards its CERO obligation of
which 0.50 MtCO2 (14%) comprised the levelisation uplift. It achieved 177%
towards its CSCO obligation, 236% towards its CSCO rural sub-obligation and
127% towards its HHCRO obligation.
3.15. E.ON’s carbon savings in CERO, CSCO and the rural sub-obligation all include
carbon from measures carried forward from CERT and CESP. The total value of
savings from CERT and CESP was 0.6 MtCO2.
Figure 3.9: E.ON delivery over time
0% 50% 100% 150% 200% 250%
CERO2.23 MtCO2
CSCO1.07 MtCO2
CSCO Rural Sub-Obligation
0.16 MtCO2
HHCRO0.66 £bn
Performance against obligations
E.O
N o
bli
gati
on
s
% CERO Levelisation Uplift % Approved % Excess Actions
0
2,000
4,000
6,000
8,000
10,000
12,000
14,000
No.
measu
res i
nsta
lled
Month of installation
CERO CSCO HHCRO CSCO Rural
24
3.16. Figure 3.9 shows that E.ON delivered its HHCRO obligation consistently
following a spike in August 2013. The delivery of CSCO measures dropped
significantly during the winter of 2013/14. CERO delivery spiked in March 2014
and November 2014. E.ON delivered enough measures to meet all of its
obligations by the end of November 2014.
First Utility
3.17. The two First Utility licences were obligated from phase two of ECO (ie from
April 2013). As shown in Appendix 1, both licences met all of their obligations.
Figure 3.10: First Utility performance against ECO obligations
3.18. Figure 3.10 shows that First Utility achieved 141% towards its CERO
obligation of which 0.01 MtCO2 (40%) comprised the levelisation uplift. It
achieved 113% towards its CSCO obligation, 176% towards its CSCO rural
sub-obligation and 104% towards its HHCRO obligation.
3.19. First Utility was not obligated under CERT or CESP so did not have any carbon
savings from these schemes to carry forward.
Figure 3.11: First Utility delivery over time
0% 50% 100% 150% 200%
CERO0.02 MtCO2
CSCO0.03 MtCO2
CSCO Rural Sub-Obligation
0.004 MtCO2
HHCRO0.02 £bn
Performance against obligations
Fir
st
Uti
lity
ob
lig
ati
on
s
% CERO Levelisation Uplift % Approved
0
100
200
300
400
500
600
700
No.
measu
res i
nsta
lled
Month of installation CERO CSCO HHCRO CSCO Rural Obligated from
25
3.20. First Utility delivered enough measures to meet its CERO obligation in April
2014, delivering 71% of the CERO obligation in March 2014 alone. Figure
3.11 above shows that it focused on delivery of CSCO, CSCO rural sub-
obligation and HHCRO measures from late 2014 onwards and had delivered
measures to meet all of its obligations by the end of February 2015.
npower
3.21. Ten npower licences were obligated under ECO and, as shown in Appendix 1,
they met all obligations.
3.22. npower originally owned 12 licences obligated under ECO. The Electricity Plus
Supply Limited and Gas Plus Supply Limited licences were sold to Utility
Warehouse in December 2013 and the responsibility for meeting the
obligations on these licences was also transferred to Utility Warehouse.18 See
paragraph 3.34 below for further information.
Figure 3.12: npower performance against ECO obligations
3.23. Figure 3.12 shows that npower achieved 130% towards its CERO obligation of
which 0.27 MtCO2 (13%) comprised the levelisation uplift. It achieved 148%
towards its CSCO obligation, 141% towards its CSCO rural sub-obligation and
124% towards its HHCRO obligation.
3.24. npower’s carbon savings in CERO, CSCO and the rural sub-obligation all
include carbon savings from measures carried forward from CERT and CESP.
The total value of savings from CERT and CESP was 1.07 MtCO2.
18 Figures 3.12 and 3.13 exclude progress on Electricity Plus Supply Limited and Gas Plus Supply Limited licences.
0% 50% 100% 150%
CERO1.63 MtCO2
CSCO0.78 MtCO2
CSCO Rural Sub-Obligation
0.12 MtCO2
HHCRO0.48 £bn
Performance against obligations
np
ow
er o
bli
gati
on
s
% CERO Levelisation Uplift % Approved % Excess Actions
26
Figure 3.13: npower delivery over time
3.25. As shown in Figure 3.13, the most pronounced feature of the npower delivery
profile was the spike in CERO measures in February 2014. HHCRO delivery
peaked in September 2013 and then gradually decreased. Like other energy
companies, the majority of CSCO rural activity was after April 2014. CSCO
delivery was broadly consistent throughout, peaking in July 2014. npower had
delivered measures to meet all of its obligations by the end of November 2014.
Scottish Power
3.26. The two Scottish Power licences were obligated under ECO and, as shown in
Appendix 1, they met all of their obligations.
Figure 3.14: Scottish Power performance against ECO obligations
3.27. Figure 3.14 shows that Scottish Power achieved 134% towards its CERO
obligation of which 0.47 MtCO2 (23%) comprised the levelisation uplift. It
achieved 127% towards its CSCO obligation, 135% towards its CSCO rural
sub-obligation and 127% towards its HHCRO obligation.
0
2,000
4,000
6,000
8,000
10,000
12,000N
o.
measu
res i
nsta
lled
Month of installation
CERO CSCO HHCRO CSCO Rural
0% 50% 100% 150%
CERO1.50 MtCO2
CSCO0.75 MtCO2
CSCO Rural Sub-Obligation0.11 MtCO2
HHCRO0.46 £bn
Performance against obligations
Scott
ish
Pow
er o
bli
gati
on
s
% CERO Levelisation Uplift % Approved % Excess Actions

27
3.28. Scottish Power’s carbon savings in CERO, CSCO and the rural sub-obligation all
include carbon from measures carried forward from CERT and CESP. The total
value of savings from CERT and CESP was 0.45 MtCO2.
Figure 3.15: Scottish Power delivery over time
3.29. Figure 3.15 shows that Scottish Power started the scheme by delivering
towards all three main obligations. However, from July 2013 their delivery of
CSCO measures dropped to a very low volume whilst CERO and HHCRO
peaked at the start of 2014. Low and steady levels of delivery were seen for
the last few months of ECO across all obligations. Scottish Power delivered
enough measures to meet all of its obligations by the end of November 2014.
SSE
3.30. Two of the SSE licences were obligated under ECO and, as shown in Appendix
1, they met all of their ECO obligations.
Figure 3.16: SSE performance against ECO obligations
0
2,000
4,000
6,000
8,000
10,000
No.
measu
res i
nsta
lled
Month of installation
CERO CSCO HHCRO CSCO Rural
0% 50% 100% 150% 200% 250%
CERO2.4 MtCO2
CSCO1.15 MtCO2
CSCO Rural Sub-Obligation
0.17 MtCO2
HHCRO0.71 £bn
Performance against obligations
SS
E o
bli
gati
on
s
% CERO Levelisation Uplift % Approved % Excess Actions
28
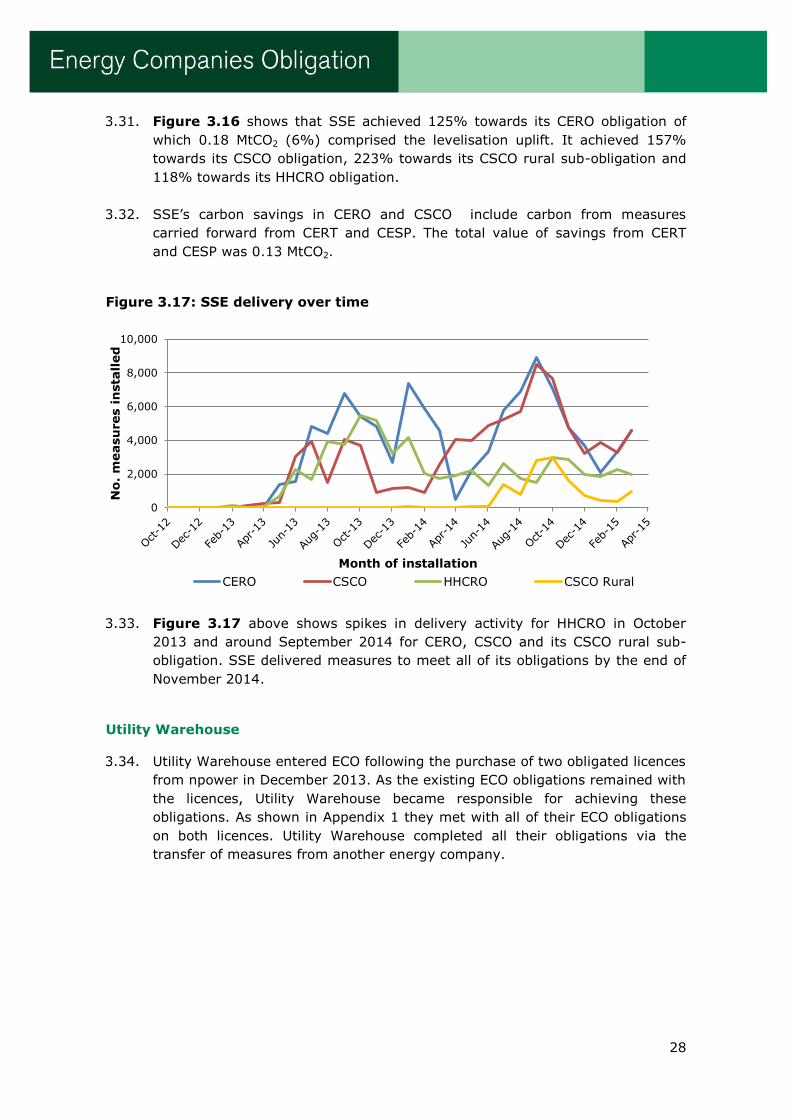
3.31. Figure 3.16 shows that SSE achieved 125% towards its CERO obligation of
which 0.18 MtCO2 (6%) comprised the levelisation uplift. It achieved 157%
towards its CSCO obligation, 223% towards its CSCO rural sub-obligation and
118% towards its HHCRO obligation.
3.32. SSE’s carbon savings in CERO and CSCO include carbon from measures
carried forward from CERT and CESP. The total value of savings from CERT
and CESP was 0.13 MtCO2.
Figure 3.17: SSE delivery over time
3.33. Figure 3.17 above shows spikes in delivery activity for HHCRO in October
2013 and around September 2014 for CERO, CSCO and its CSCO rural sub-
obligation. SSE delivered measures to meet all of its obligations by the end of
November 2014.
Utility Warehouse
3.34. Utility Warehouse entered ECO following the purchase of two obligated licences
from npower in December 2013. As the existing ECO obligations remained with
the licences, Utility Warehouse became responsible for achieving these
obligations. As shown in Appendix 1 they met with all of their ECO obligations
on both licences. Utility Warehouse completed all their obligations via the
transfer of measures from another energy company.
0
2,000
4,000
6,000
8,000
10,000
No.
measu
res i
nsta
lled
Month of installation
CERO CSCO HHCRO CSCO Rural
29
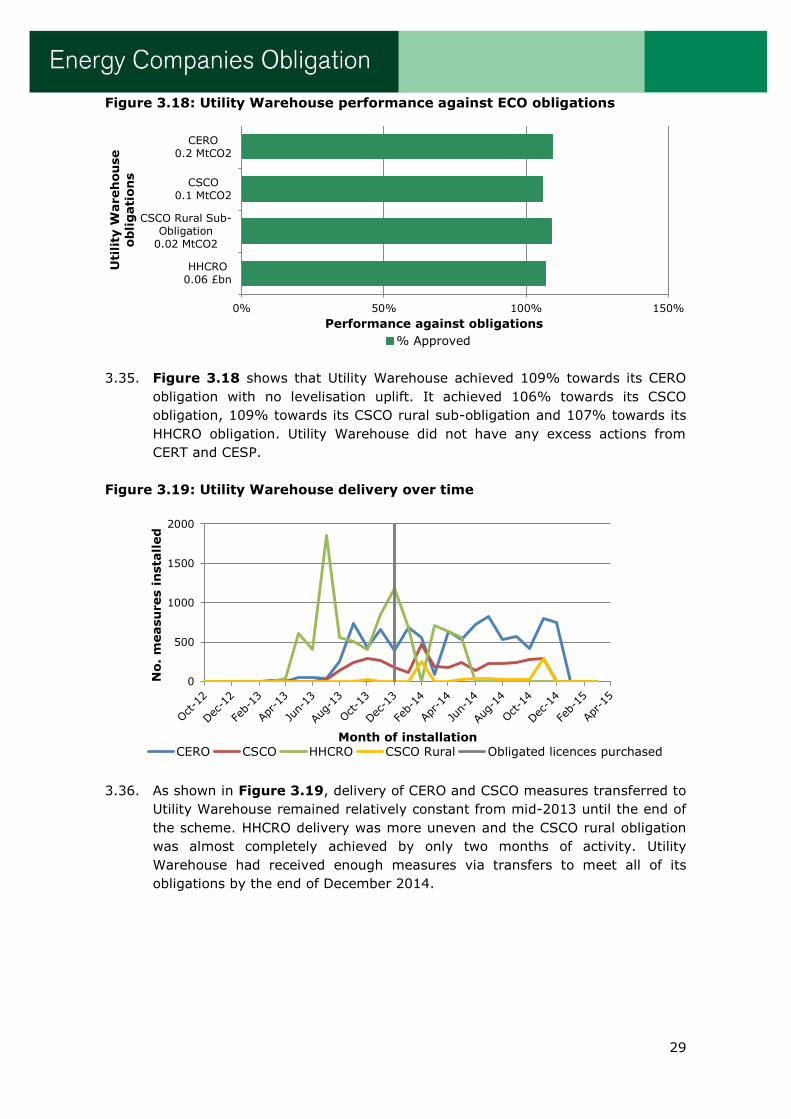
Figure 3.18: Utility Warehouse performance against ECO obligations
3.35. Figure 3.18 shows that Utility Warehouse achieved 109% towards its CERO
obligation with no levelisation uplift. It achieved 106% towards its CSCO
obligation, 109% towards its CSCO rural sub-obligation and 107% towards its
HHCRO obligation. Utility Warehouse did not have any excess actions from
CERT and CESP.
Figure 3.19: Utility Warehouse delivery over time
3.36. As shown in Figure 3.19, delivery of CERO and CSCO measures transferred to
Utility Warehouse remained relatively constant from mid-2013 until the end of
the scheme. HHCRO delivery was more uneven and the CSCO rural obligation
was almost completely achieved by only two months of activity. Utility
Warehouse had received enough measures via transfers to meet all of its
obligations by the end of December 2014.
0% 50% 100% 150%
CERO0.2 MtCO2
CSCO0.1 MtCO2
CSCO Rural Sub-Obligation
0.02 MtCO2
HHCRO0.06 £bn
Performance against obligations
Uti
lity
Wareh
ou
se
ob
lig
ati
on
s
% Approved
0
500
1000
1500
2000
No.
measu
res i
nsta
lled
Month of installation CERO CSCO HHCRO CSCO Rural Obligated licences purchased
30
Key observations
All obligated licence holders met all of their obligations and sub-obligations
under ECO.
The majority of energy companies had delivered enough measures to meet
their obligations several months ahead of the deadline. However, delivery
continued against all obligations even after the targets were met.
Whilst there was some variation in individual delivery profiles, the overall
trends show that HHCRO was delivered early and CSCO and CSCO rural
sub-obligation were delivered later.
31
4. Monitoring and compliance
Introduction
4.1. To ensure that all measures under ECO were valid and notified accurately, we
undertook a number of core compliance activities over the lifetime of the
scheme. These included the review of measures to ensure they complied with
the legislation and our guidance, requiring energy suppliers to conduct
technical monitoring of installations, auditing of energy companies,
investigating suspected fraudulent activity and verifying savings attributed to
measures.
Measure processing
4.2. Each month, after measures had been notified to us, we assessed the
information provided by the energy companies to check whether the measures
met the requirements set out in the legislation and our guidance. Checks were
conducted across all aspects of the information notified, including in relation to
the eligibility requirements for each obligation, carbon and cost scores19 and
checks for duplicated measures.
4.3. Errors in notification were sent back to energy companies for correction each
month. These related to either missing or incorrect information provided for a
measure and were often caused by administrative oversight. Error rates20 were
around 47% at the start of the scheme. From November 2013, and following
the provision of additional training for energy companies, the error rates
reduced to an average of 6% for the remainder of the scheme.
4.4. Whilst energy companies were required to notify measures to us the month
after they had been installed, there was a mechanism which allowed an
extension of this monthly deadline. Energy companies were granted an
extension if they were not able to notify a measure on time due to unforeseen
circumstances (excluding administrative oversight). We received 288 extension
requests covering 78,507 measures. 86% of these requests were approved.
19 Scores here refers to the annual carbon or cost savings multiplied by the lifetime and by the in-use factor to achieve a lifetime score. 20 The number of measures with one or more error as a percentage of the total number of measures processed per month.
Chapter Overview
This chapter explains the activities undertaken by us to support ECO compliance. It
includes an overview of the monitoring and compliance activities we required and
administered, along with the results and actions taken.
32
4.5. Another mechanism available to energy companies to manage compliance with
their obligations was transfer requests. The transfer of measures could occur
between licences of the same or different energy companies. We received a
total of 118 transfer requests, of which we approved 105. The majority of
approved transfers (79%) occurred between licences of the same energy
company in order to balance or optimise their savings. The remaining 21%
was between Utility Warehouse and another company, enabling Utility
Warehouse to deliver against their obligations.
Refused or revoked savings
4.6. Following all of our compliance checks, 51,203 measures (including excess
actions) were deemed to be ineligible under ECO and savings were not
attributed to these measures. These measures accounted for 3% of all
measures notified. Figure 4.1 below highlights the five main reasons for
refusing or revoking savings.
Figure 4.1: Five main reasons for refusing or revoking savings
Reason for
revoking/refusing savings
No. of measures Percentage of
notified ECO
measures
Invalid HTTC insulation
measure
11,991 0.7%
Duplicate measure 8,570 0.5%
Incorrect carbon/cost savings 7,624 0.5%
Ineligible secondary measure 5,488 0.3%
Measure not recommended21 4,878 0.3%
4.7. About 10,000 of the HTTC measures in figure 4.1 were eligible to be re-notified
as standard cavity wall insulation measures. Therefore, the installations may
have eventually been awarded savings.
4.8. Duplicate measures in figure 4.1 were where an ECO measure had been
notified more than once or where an excess action was then also notified as an
ECO measure. Energy companies resolved the duplicates between themselves
in the majority of cases and then notified us of the outcome; as a result the
valid measure was kept. The duplicates had their savings revoked and could
not be claimed under ECO.
Appropriate methodologies
4.9. Under ECO, carbon and cost savings were required to be calculated using the
Standard Assessment Procedure (SAP) or Reduced Standard Assessment
Procedure (RdSAP).22 In cases where these methodologies could not be used
21 Under the Order, all ECO measures with the exception of district heating connections must be recommended by a Green Deal report or a chartered surveyor’s report. 22 SAP is the methodology used by Government to assess the energy and environmental
33
to calculate the savings then energy companies could apply for an appropriate
methodology.
4.10. One appropriate methodology was submitted to us, which we approved as
meeting the requirements set out in the Order. This methodology enabled the
calculation of savings achieved by measures installed in multiple occupancy
premises, for example, student halls or hostels, where these premises meet
the ECO definition of domestic premises. These premises could not be
modelled in SAP or RdSAP, as such the Simplified Building Energy Model
(SBEM)23 could be used to calculate savings.
4.11. In ECO, 1.3% of measures were scored using SAP and 98.7% were scored
using RdSAP. The remainder (0.0004%) were scored using the above
appropriate methodology.
Technical monitoring
4.12. Technical monitoring was a requirement placed on energy companies by us to
ensure that ECO measures were installed to the required standards and scored
accurately. It consisted of on-site inspections conducted by independent,
suitably qualified technical monitoring agents. Energy companies were required
to commission technical monitoring on a 5% sample of the measures that they
had delivered. Where measures failed monitoring we required the energy
companies to resolve any issues discovered.
4.13. Technical monitoring agents assessed standards of installation and ECO
scoring inputs24 against a standard questionnaire25 provided by us. The results
were reported to us by energy companies on a quarterly basis. We then
analysed the information provided and published the results on our website.26
4.14. All energy companies achieved the required 5% monitoring rate. Figure 4.2
below shows the total number of measures monitored by each energy
company and their monitoring rate as a percentage of the total number of
measures notified that were eligible for monitoring.
performance of a dwelling. RdSAP is the lower cost version of SAP and is also used for domestic
Energy Performane Certificate ratings. 23 SBEM was developed by the BRE to assess the carbon emissions of non-domestic buildings. 24 A scoring input is a piece of information about the property which may affect the carbon or
cost score of a measure, eg floor area and fuel type. 25 https://www.ofgem.gov.uk/publications-and-updates/energy-companies-obligation-technical-monitoring-questions 26 The published technical monitoring reports can be found here:
https://www.ofgem.gov.uk/environmental-programmes/energy-company-obligation-eco/energy-company-obligation-eco-public-reports
34
Figure 4.2: Energy company monitoring rates27
Energy company Measures monitored Monitoring rate
British Gas 28,226 6%
The Co-operative Energy 20 6%
EDF Energy 15,865 12%
EON 17,029 6%
First Utility 148 5%
npower 7,549 5%
Scottish Power 9,123 6%
SSE 22,771 9%
Overall 100,731 7%
4.15. Figure 4.3 below shows the scoring and installation failure rates over time.
The quarters shown relate to the quarter in which the monitoring was
conducted. These failure rates exclude any reported fails that were
subsequently overturned.
4.16. Note that measures monitored during the first two quarters of ECO (January to
June 2013) were assessed against the standard questionnaire set used during
CERT and CESP and, as such, the monitoring rates for this period are not
directly comparable to those of later quarters. The questions were amended
based on feedback from the supply chain from CERT and CESP as well as to
reflect scoring of measures using SAP and RdSAP under ECO.
Figure 4.3: Technical monitoring failure rate over time
4.17. If a measure failed technical monitoring based on the standard of installation,
energy companies were required to remediate (ie correct) the measure. Once
this remediation had taken place, a further inspection had to be passed to
27 As Utility Warehouse completed all obligations via transfers from other energy companies and did not deliver any measures, they were not required to carry out technical monitoring.
0%
5%
10%
15%
20%
25%
30%
Jul-Sept2013
Oct-Dec2013
Jan-Mar2014
Apr-Jun2014
Jul-Sept2014
Oct-Dec2014
Jan-Mar2015
Fail
ure R
ate
Monitoring quarter
Total Fail Rate Install Fail Rate Scoring Fail Rate
35
ensure any fault with the measure had been properly remedied. Of the 9,963
measures that failed technical monitoring based on the standard of installation,
7,446 (75%) were remediated and passed re-inspection.
4.18. If a measure failed technical monitoring because of an inaccuracy in a scoring
input, the energy companies were required to review and provide a revised,
accurate score for the measure. Of the total 6,498 scoring fails, 5,331 (82%)
were rescored. This resulted in a net increase in scores of 850 tCO2 for CERO,
a decrease of 6,519 tCO2 for CSCO and a decrease of £1,287,371 cost savings
for HHCRO.
4.19. Where energy companies were unable to resolve an issue identified through
technical monitoring (eg they were unable to gain access to a property or
could not accurately score the measure) and did not meet our requirements,
we did not attribute savings to the measure. This meant that the measure
could not be counted towards an energy company’s obligations.
4.20. Where we did not attribute savings to a measure, we still expected the energy
company to seek to remedy any failures for the benefit of the consumer. For a
full breakdown of the types of fails reported as part of technical monitoring,
see our public technical monitoring reports on our website.
Audit
4.21. A key aspect of our administration of ECO was developing and managing an
effective auditing framework. The aim of the framework was to minimise the
risk and impact of non-compliance with ECO requirements on consumers. We
worked with all energy companies to detect and mitigate this risk.
4.22. A number of audit activities were conducted during ECO. These included a
mixture of process-based and measure-specific audits. Initial ‘health checks’
were conducted at the beginning of the scheme or when an energy company
became obligated. These assessed energy companies’ readiness for delivering
ECO and notifying the measures to us. Following the initial health checks,
annual process-based audits assessed energy companies’ procedures and
compliance checks for measures. These were complimented by measure-
specific audits, which included a mix of documentation reviews and on-site
monitoring activity.
Process audits
4.23. Our process audits focused on the controls energy companies had in place to
ensure they notified compliant measures. The reviews were wide-ranging and
benchmarked energy companies against good practice.28 We made
recommendations where relevant and worked with energy companies to
ensure they were implemented.
28 Prior to the audits we outlined to energy companies our perception of ‘good practice’.

36
4.24. After the first process audits in 2013 we asked the energy companies to
provide detailed plans as to how they intended to address the issues identified.
We tracked the progress and the areas of risk were audited again the following
year. The improvement in the average audit rating can be seen between the
first and second process audits in Figure 4.4 below.
Excess action audit
4.25. In addition to our energy company process audits, we also undertook two
audits on nominated excess actions from CERT and CESP (one before and one
after the ECO1.2 legislative changes). These confirmed that, where applicable,
relevant energy companies were only choosing to include eligible measures as
excess actions. They also checked that individual measure information
matched the records for CERT and CESP. All energy companies passed the
audit with a ‘good’ or ‘satisfactory’ rating.
HHCRO audit
4.26. The ECO team received a significant number of queries on HHCRO and AWG
eligibility over the first year of the scheme. Combined with the fact that there
were numerous ways of evidencing AWG/householder status, this area was
identified as a potential compliance risk. In April 2014, we conducted measure-
specific audits to assess the compliance of energy companies’ measures with
the HHCRO requirements.
4.27. The results of the audit showed that in many cases the recommended evidence
of HHCRO eligibility was not held by energy companies, particularly in relation
to the boiler checklist.29 However, alternative evidence subsequently provided
did reduce the initial failure rate.
4.28. Where sufficient evidence was not provided, measures were unable to have
savings attributed to them. In addition, where necessary, we sought
reassurance from energy companies regarding their procedures for checking
and storing evidence. Given the poor audit results, we will be conducting a
further audit on boiler measures in ECO2.
4.29. Audit results were classified into four categories to reflect energy company
performance. As shown in Figure 4.4 below, the average rating of energy
companies improved towards the end of the scheme. The results of all of the
ECO audits will inform our ECO2 audit strategy.
29 The boiler checklist was a tool to help installers to understand whether a boiler was ‘qualifying’ under ECO (ie was broken down or not functioning properly and could not be economically repaired).
37
Figure 4.4: Audit ratings in ECO
Audit rating key: 0= Unsatisfactory
1= Weak
2= Satisfactory
3= Good
Hard to treat cavity (HTTC) wall insulation review
4.30. One of the key eligibility requirements for CERO under the original ECO
legislation was that any cavity wall insulation measures intended as a primary
measure must be installed to walls that meet the definition of a ‘hard-to-treat’
cavity wall. In early 2013 we received information which cast doubt on the
eligibility of some HTTC wall insulation measures notified under ECO.
4.31. Following an internal assessment of a sample of measures, we decided it was
necessary to undertake a review of three categories of HTTCs installed in
2013: narrow cavities, cavities requiring remedial work and cavities requiring
the use of non-standard materials or techniques. The review assessed whether
the treated walls met the eligibility criteria set in legislation for the HTTC
category against which they were notified.
4.32. Approximately 63,000 HTTC measures were assessed through a document
review. Of these, at least 1% of ‘narrow’ measures were also subject to
independent site audits. The overall results are shown in Figure 4.5 below.
There is more information about the review and its results in the ECO HTTC
report on our website.30
30 https://www.ofgem.gov.uk/publications-and-updates/eco-httc-report
0
1
2
3
Excess actions(before 1.2)
HHCRO audit Process audit Excess actions(after 1.2)
Process audit
Averag
e a
ud
it r
ati
ng
Audit name
38
Figure 4.5: HTTC review results
Outcome Number of
measures
Percentage of
total
Pass 44,852 71%
Reclassify 16,276 26%
Fail 1,909 3%
4.33. As can be seen in Figure 4.6 below, there was a substantial variation in the
pass rate between the first and second half of the year. Measures installed
between January and June 2013 achieved a pass rate of just over 50%;
between July and December, 87% of measures passed the review. This shows
a significant improvement in the accuracy of measures notified by energy
companies from July 2013 onwards.
4.34. This improvement can be explained in part by our close engagement with
energy companies and industry to raise awareness of issues identified with the
delivery of HTTCs. We also consulted on and introduced new evidence
requirements for these measures.
Figure 4.6: Outcomes of HTTC review over time (2013)
4.35. Where the review showed that there was no evidence in support of the original
HTTC category, we permitted energy companies to reclassify measures to
another HTTC category (provided this was supported by documentary
evidence). For example, a measure originally notified as a ‘narrow’ HTTC could
be reclassified to a ‘remedial’ HTTC if there was a chartered surveyor report to
support this category. This approach ensured that measures with savings of
approximately 464,000 tCO2 initially notified incorrectly under ECO were not
lost and could contribute towards energy companies’ obligations.
4.36. Of the 1,909 measures that failed the review, the majority of these savings
were rejected. However, in a number of cases where measures were installed
in accordance with all other ECO requirements, energy companies were able to
0%
20%
40%
60%
80%
100%
Percen
tag
e o
f revie
wed
measu
res
Month of installation
Pass rate Reclassify rate Failure rate
39
move the measures to standard cavity wall insulation measures in CSCO or
HHCRO31 or to reclassify them as standard solid wall insulation measures.
4.37. In addition to the failure rate shown above, notified savings for narrow HTTCs
were reduced by approximately 61,000 tCO2 to take into account the results of
the site audits. In total, (when failed measures are included), the savings
attributed to all HTTC measures were reduced by approximately 101,000 tCO2
following the HTTC review. This is the equivalent of 0.72% of the CERO target.
4.38. The final numbers of HTTCs and their categories are shown in Figure 4.7
below.
Figure 4.7: HTTC classification
HTTC type Number of
measures
Percentage of total
HTTCs
3 storey and above 97,324 38%
Non-standard materials or
techniques 71,277 28%
Remedial work required 54,456 21%
Narrow cavity 27,719 11%
Prefabricated or metal
frame 670 0%
Natural stone 2,543 1%
4.39. HTTC wall insulation ceased to be an eligible measure under ECO following the
1.2 legislative changes. Therefore, this was no longer an issue towards the end
of the scheme.
Fraud prevention
4.40. The ECO scheme had long and complex supply chains which were vulnerable to
fraud. Our enforcement powers as administrator applied to the obligated
energy companies. We therefore required that energy companies had robust
controls in place for detecting and mitigating fraud within their supply chains.
4.41. We regarded fraudulent activity as covering any dishonesty or
misrepresentation in the context of the ECO Order or our guidance. We also
scrutinised behaviour which undermined the government’s policy intent or our
administration of the scheme.
4.42. Throughout the ECO scheme, we identified a number of fraud risks. We took
the following steps in order to mitigate these risks:
taking a zero tolerance approach to fraud by investigating all cases of
suspected/reported fraud
31Wall insulation measures under CSCO or HHCRO were not required to be delivered to hard-to-treat properties.
40
establishing the ECO Industry Fraud Prevention and Compliance
Committee to engage with energy companies, discussing common fraud
risks and driving best practice
reviewing energy companies’ fraud prevention strategies on an annual
basis and offering guidance on how these strategies could be strengthened
working with Action Fraud to improve our reporting of suspected fraud to
maximise the likelihood of police action
sharing of fraud risks and issues with DECC so that these could be
considered in future policy development
reviewing samples of supporting documentation for high risk measures to
ensure compliance with the Order and our guidance, and
developing relationships with external stakeholders including installer and
assessor accreditation bodies who could assist us with investigations into
suspected fraud.
Areas of concern
4.43. 26% of suspected fraud cases investigated were focused on documentation
issues, for example misrepresentation of the installation date or the
householders consent. We will continue to monitor this situation in ECO2 by
requesting and reviewing supporting documents in line with Ofgem guidance.
To support these checks we have invested in software to help us better identify
altered documentation.
4.44. 21% of suspected fraud cases investigated were focused on misrepresentation
of the ECO measure for example a loft top up measure being incorrectly
notified as a virgin loft measure. To address this, in parallel to these
investigations we issued guidance32 to clarify approaches for calculating the
savings for loft insulation and this is an area that we will continue to monitor
closely in ECO2.
4.45. 20% of suspected fraud cases investigated were due to the ECO score being
misrepresented, for example falsely claiming that guarantees have been
applied for to gain higher lifetimes or inflating EPC inputs to gain a higher
carbon score. We will continue to work with external bodies such as EPC
certification bodies and guarantee agencies to reduce the risk of fraud in this
area for ECO2.
4.46. As a result of our suspected fraud investigations into 10,256 measures, 7,827
measures were refused savings, 328 were amended and 2,101 remained
unchanged where we found the concerns not to be verified.
32https://www.ofgem.gov.uk/sites/default/files/docs/2015/06/loft_insulation_understated_levels_table_only_0.pdf.

41
4.47. Due to the timing of concerns being identified and conducting full
investigations, a number of suspected fraud investigations were ongoing at the
time of our final determination. This means a total of 2,830 measures that
have been approved may yet have savings amended or revoked. The carbon or
costs savings, which total 78,731 tCO2 and £4,553,070 respectively, would not
cause any energy company to fail their obligations.
4.48. The outcome of these fraud investigations may be relevant when applications
for surplus actions under ECO2 are considered. This would be the main reason
for any changes to ECO savings following final determination.
Score verification
4.49. One of our duties as the ECO administrator was to attribute carbon or cost
savings to notified measures once we were satisfied that they were correctly
calculated and accurate. We achieved this in two main ways, firstly through
technical monitoring, and secondly through our score verification process.
4.50. As part of the score verification process we assessed the carbon or cost
savings (collectively referred to as scores) for notified measures using a
dynamic scoring model which was based on RdSAP. This model allowed us to
identify scores that fell outside an expected range for that measure, property
and fuel type mix. We returned measures with scores that fell outside these
boundaries to energy companies, providing them the opportunity to confirm
the accuracy of the notified scores.
4.51. We selected a total of around 42,000 measures to be verified, of which 10,500
subsequently required an amendment to their score, fuel or measure type.
This resulted in a net decrease of around 580,000 tCO2 for CERO, a decrease
of 123,510 tCO2 for CSCO and a decrease of £30,000 for HHCRO. Where an
energy company was unable to provide us with sufficient evidence to verify a
score, we did not attribute savings to the measure. For this reason, we refused
or revoked savings of 87,530 tCO2 for CERO, 48,330 tCO2 for CSCO and £4.7m
for HHCRO.

42
Key observations
Several issues were identified throughout ECO which raised concerns over
the quality of installations. Technical monitoring failure rates were higher at
the start of the scheme for both installation and scoring issues. We saw an
improvement in technical monitoring failure rates throughout ECO and we
have amended our processes for ECO2 taking into account lessons learnt
from ECO.
We conducted several audits of energy companies to ensure they had
sufficient checks and processes in place to validate their measures. The
results from these audits improved throughout the scheme due to energy
companies’ improved understanding of the requirements and increased
controls.
We also observed difficulties with the accurate notification of measures
under ECO, for example the classification of hard-to-treat cavity wall
insulation measures and scoring. We worked with energy companies to
ensure that, where identified, any issues were corrected to minimise the
loss of carbon/cost savings towards obligations.
ECO had higher volumes of potential fraud when compared with other
environmental schemes. The majority of cases were regarding
documentation issues, misrepresentation of an ECO measure (eg top-up loft
insulation claimed as virgin loft insulation) or score misrepresentation. We
took a no tolerance approach and worked with a range of stakeholders to
try to mitigate risks.
Following our compliance checks, 51,203 measures had their carbon or cost
savings revoked under ECO. These did not contribute to any energy
company’s obligations.
43
5. Communication and engagement
Introduction
5.1. Throughout ECO we communicated much more with the supply chain than
under previous energy efficiency schemes. Unlike the CERT and CESP
schemes, measures were notified monthly under ECO which resulted in more
regular interaction between us and the energy companies and by extension,
the supply chain. This interaction was mostly in relation to measure validation
checks and our other compliance activities.
5.2. We also sought to be proactive in our engagement with the wider supply chain
over the course of the scheme. To support delivery of eligible measures and to
improve data quality, we provided additional information and guidance on
scheme requirements and worked with various industry groups to standardise
documentation.
Queries
5.3. In addition to our core compliance responsibilities, one of our main
administrative activities in ECO became answering queries from stakeholders.
Whilst such high volumes of queries were not originally anticipated we
recognised the importance of this service to consumers, the supply chain and
other interested parties as well as the lack of alternative routes for some
information.
5.4. We received 6,152 queries relating to the operation of ECO33 from a diverse
range of stakeholders. We aimed to respond to the majority of queries within
five working days. We continued to receive queries relating to ECO after March
2015, however Figure 5.1 below presents those received to the end of the
obligation period (March 2015).
33 From 1 September 2012 to 31 March 2015
Chapter Overview
This chapter outlines our engagement with stakeholders in ECO throughout the
scheme. It highlights some of the documents we published, the types of queries we
received and how we helped to simplify documentation requirements.
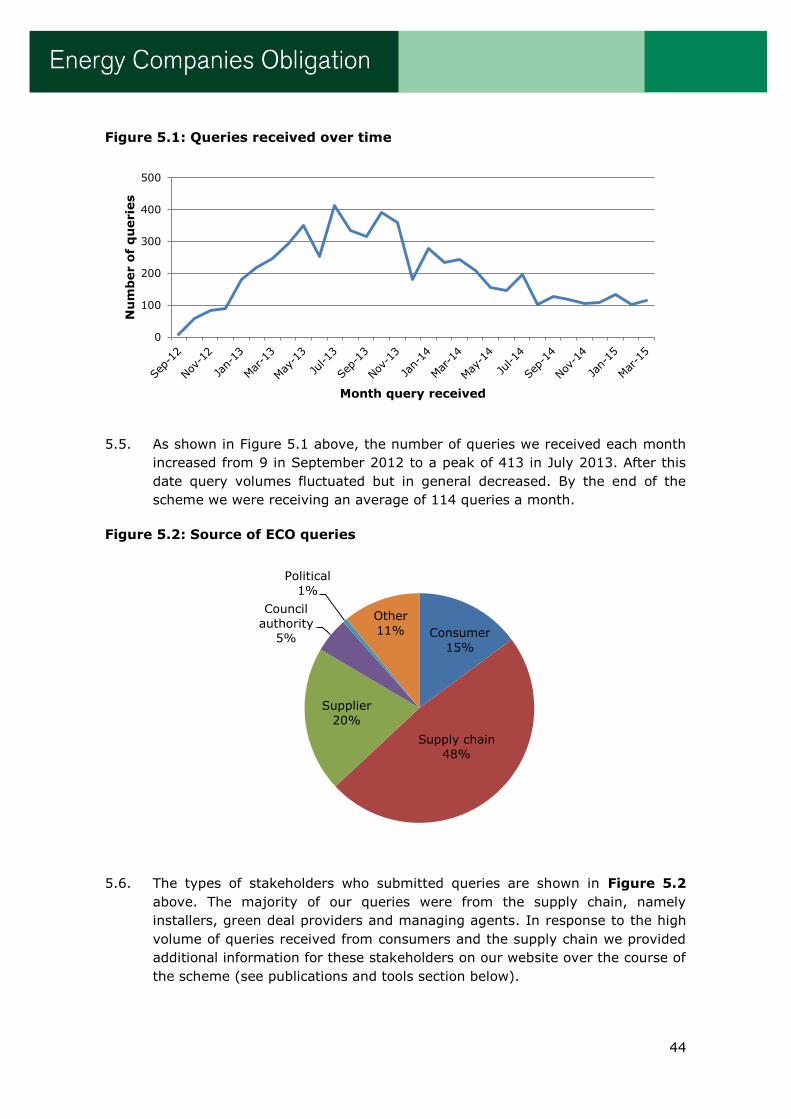
44
Figure 5.1: Queries received over time
5.5. As shown in Figure 5.1 above, the number of queries we received each month
increased from 9 in September 2012 to a peak of 413 in July 2013. After this
date query volumes fluctuated but in general decreased. By the end of the
scheme we were receiving an average of 114 queries a month.
Figure 5.2: Source of ECO queries
5.6. The types of stakeholders who submitted queries are shown in Figure 5.2
above. The majority of our queries were from the supply chain, namely
installers, green deal providers and managing agents. In response to the high
volume of queries received from consumers and the supply chain we provided
additional information for these stakeholders on our website over the course of
the scheme (see publications and tools section below).
0
100
200
300
400
500
Nu
mb
er o
f q
uerie
s
Month query received
Consumer
15%
Supply chain
48%
Supplier
20%
Council
authority 5%
Political
1%
Other
11%

45
Figure 5.3: Types of ECO queries
5.7. The broad subject matter of the queries received is shown in Figure 5.3
above. Most queries either related to the interpretation of our guidance and
the policy for the scheme or were of a technical nature (eg related to scoring,
warranties and industry standards).
Publications and tools
5.8. Throughout ECO we recognised the importance of providing information to our
stakeholders including the wider supply chain and consumers.
5.9. Some of the documents and tools we produced included:
Information about the pathway of a measure: in order to help installers
and other third parties involved in delivering ECO measures understand how
an ECO measure was processed, we published several documents on our
website. This included the ECO toolkit34 which contained frequently asked
questions and links to resources and information about the scheme as well as
a graphic to illustrate the pathway of an ECO measure. We also published
information such as how we administered requests for extensions to the
monthly notification deadlines35, and the process for refusing or revoking of
savings of a measure.36
Monthly compliance updates: from August 2013 we published monthly
reports showing energy companies’ progress towards their obligations. This
34 https://www.ofgem.gov.uk/publications-and-updates/energy-company-obligation-eco-toolkit 35 https://www.ofgem.gov.uk/publications-and-updates/eco1-notice-receipt-application-extension 36 https://www.ofgem.gov.uk/publications-and-updates/eco1-notifying-supplier-decision-refuse-or-revoke-approval-measure
Customer
Eligibility 2%
Other
2%
Policy/Guida
nce 56%
Reporting
1%
Supply
Chain 2%
Technical
37%
46
was aimed at increasing the transparency of energy company progress and
was the first time this had been done for any energy efficiency scheme.
CSCO tool37: we conducted a competitive tender process to procure a tool to
support the installation of measures under CSCO, and provide certainty to
energy companies and the supply chain that installations were delivered in
eligible areas. It allowed:
- consumers to establish if they lived in an eligible CSCO area
- the ECO supply chain to identify eligible CSCO areas including
adjoining areas
- energy companies (or the supply chain) to validate CSCO measure
data using fields that were part of the ECO notification template, and
- us to determine whether measures notified under CSCO were
eligible.
The tool went live in November 2014, taking into consideration the changes in
the ECO1.2 Order. To April 2015 there were 51,179 unique visits and
2,593,120 searches in the tool.
Affordable Warmth Group (AWG) guidance note38: this guidance note
aimed to assist energy companies and the supply chain in evidencing AWG
eligibility. It explained the requirements for the different AWG eligibility routes,
and which parts of each benefit letter could be used as evidence of eligibility.
The document reflected our experience of AWG related queries from energy
companies, installers, managing agents, consumers and feedback from our
audit of energy companies’ AWG documents.
Reporting simplification
5.10. Throughout ECO we maintained close engagement with DECC and relevant
supply chain groups to help drive improvements in the scheme administration
as well as quality and compliance. A key part of this work was leading the ECO
Reporting Working Group which was established by DECC in 2013.
5.11. Feedback from the supply chain indicated that the documentation
requirements for notifying ECO measures were too complicated and
inconsistently applied by energy companies. In some cases this caused
problems with notifying measures and delayed payments to installers. The ECO
Reporting Working Group and its associated sub-groups were intended to
improve consistency and promote the standardisation and simplification of
information collected from the supply chain. We also received valuable
suggestions for updates to some of our required forms.
5.12. We led regular meetings with representatives of these groups and worked with
energy companies to create a matrix of their requirements which they aligned
where possible. We also worked with the sub-groups to produce a series of
37 CSCO location centre: https://csco.locationcentre.co.uk/ 38https://www.ofgem.gov.uk/sites/default/files/docs/2014/11/guidance_note_the_affordable_warmth_group_0.pdf.

47
standardised reporting templates. These were designed to assist compliance
and improve efficiency, and resulted in a reduction of the number of forms to
be completed by the supply chain.
5.13. We established a new section on our website to host these documents and any
subsequent outputs of the Working Group39 to ensure the information was
readily accessible by all parties involved in ECO delivery. The key documents
reviewed by the groups are listed in Figure 5.4 below.
Figure 5.4: Documents reviewed by the ECO reporting working group
Documents produced by the ECO
Reporting Working Group
Ofgem documents (updated by the
working group)
Declaration of conformity and completed
installation
Boiler assessment checklist
Landlord and management company
permission
Chartered surveyor recommended
measure report
Landlord and management company
permission multiple premises spreadsheet
Narrow HTTC Declaration
AWG and householder checklist
File naming convention
A matrix of energy company requirements
5.14. In December 2014 we conducted a short survey to find out how successful
these forms had been and to identify any other issues that the group should be
aware of. The results indicated that this work helped the supply chain to
demonstrate compliance with scheme requirements more efficiently and
accurately.
5.15. We will continue to work closely with the supply chain and this Working Group
throughout ECO2 to help ensure that scheme requirements are met in the
most effective way.
39 https://www.ofgem.gov.uk/environmental-programmes/energy-company-obligation-eco/eco-reporting-working-group-simplification-and-standardisation

48
Key observations
Throughout ECO we had much more communication with the supply chain
than we had under previous energy efficiency schemes. This was partly in
relation to quality and notification issues but also working together to find
ways to improve the efficiency of the administration of the scheme.
We received a total of 6751 queries during ECO. The majority of these were
related to the eligibility of measures under the Order and our guidance.
We published many documents throughout ECO with the aim of aiding
compliance and improving transparency with stakeholders.
We worked closely with the supply chain to standardise and simplify
documentation requirements relating to ECO measures.
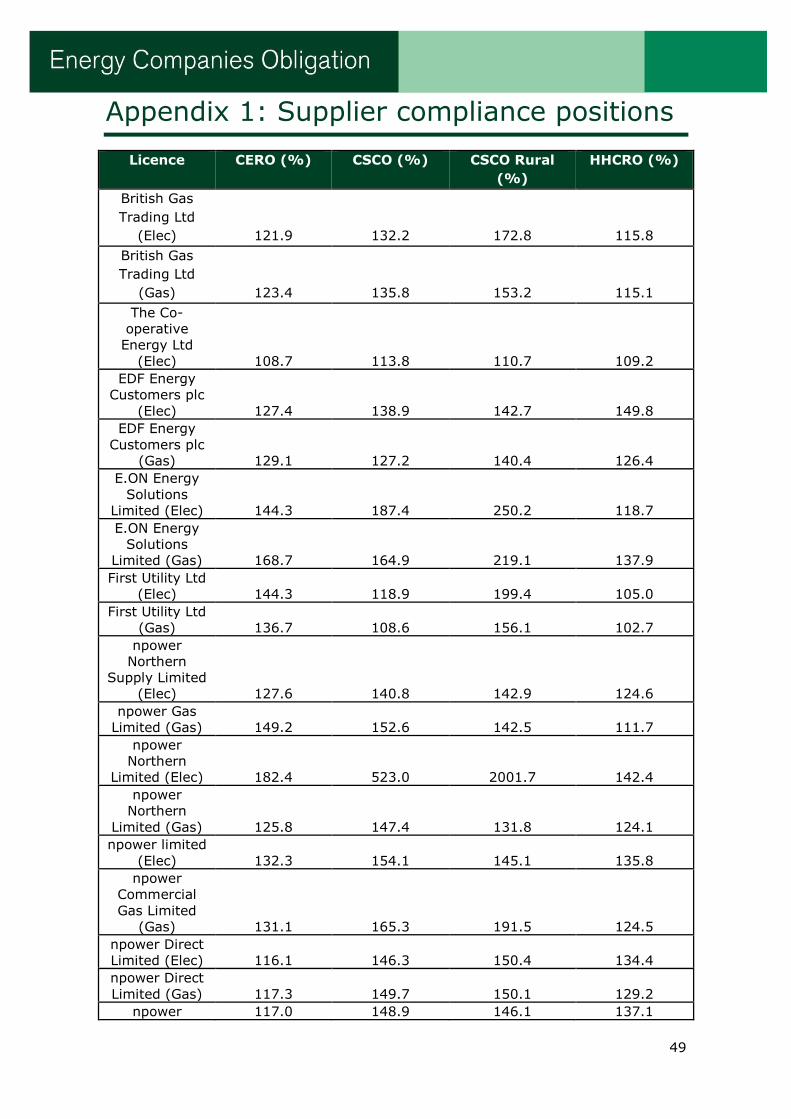
49
Appendix 1: Supplier compliance positions
Licence CERO (%) CSCO (%) CSCO Rural
(%)
HHCRO (%)
British Gas
Trading Ltd
(Elec) 121.9 132.2 172.8 115.8
British Gas
Trading Ltd
(Gas) 123.4 135.8 153.2 115.1
The Co-
operative
Energy Ltd
(Elec) 108.7 113.8 110.7 109.2
EDF Energy
Customers plc
(Elec) 127.4 138.9 142.7 149.8
EDF Energy
Customers plc
(Gas) 129.1 127.2 140.4 126.4
E.ON Energy
Solutions
Limited (Elec) 144.3 187.4 250.2 118.7
E.ON Energy
Solutions
Limited (Gas) 168.7 164.9 219.1 137.9
First Utility Ltd
(Elec) 144.3 118.9 199.4 105.0
First Utility Ltd
(Gas) 136.7 108.6 156.1 102.7
npower
Northern
Supply Limited
(Elec) 127.6 140.8 142.9 124.6
npower Gas
Limited (Gas) 149.2 152.6 142.5 111.7
npower
Northern
Limited (Elec) 182.4 523.0 2001.7 142.4
npower
Northern
Limited (Gas) 125.8 147.4 131.8 124.1
npower limited
(Elec) 132.3 154.1 145.1 135.8
npower
Commercial
Gas Limited
(Gas) 131.1 165.3 191.5 124.5
npower Direct
Limited (Elec) 116.1 146.3 150.4 134.4
npower Direct
Limited (Gas) 117.3 149.7 150.1 129.2
npower 117.0 148.9 146.1 137.1
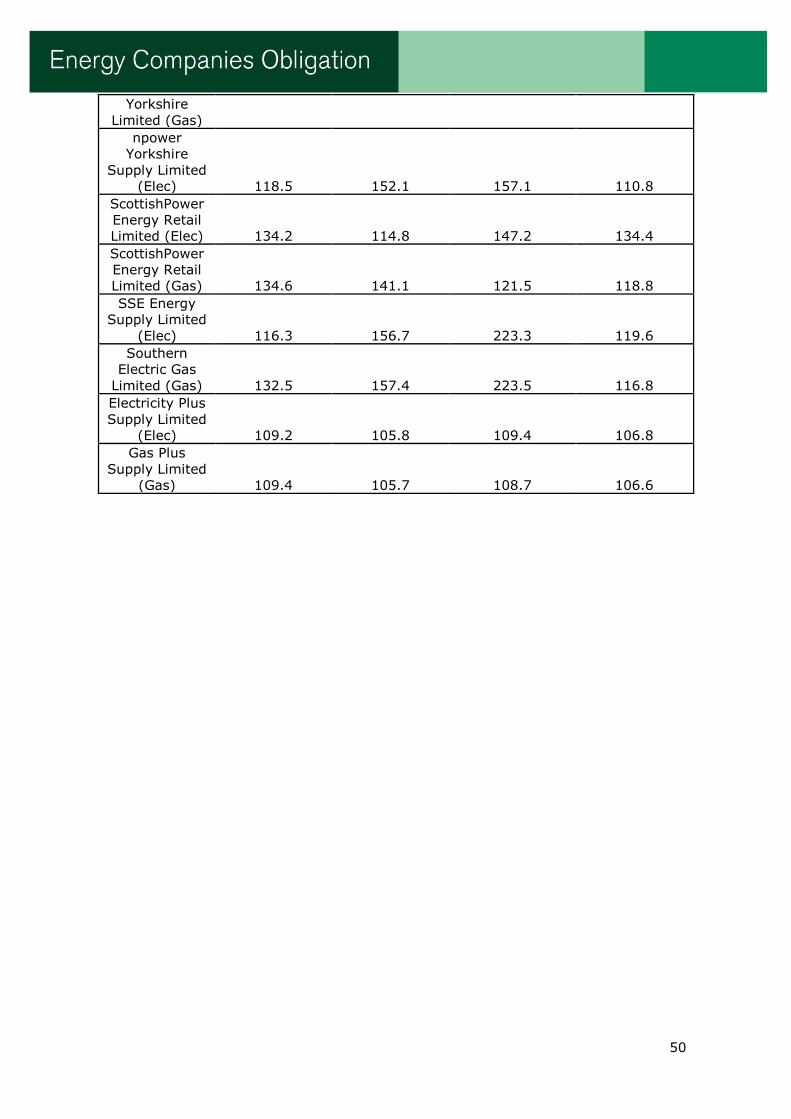
50
Yorkshire
Limited (Gas)
npower
Yorkshire
Supply Limited
(Elec) 118.5 152.1 157.1 110.8
ScottishPower
Energy Retail
Limited (Elec) 134.2 114.8 147.2 134.4
ScottishPower
Energy Retail
Limited (Gas) 134.6 141.1 121.5 118.8
SSE Energy
Supply Limited
(Elec) 116.3 156.7 223.3 119.6
Southern
Electric Gas
Limited (Gas) 132.5 157.4 223.5 116.8
Electricity Plus
Supply Limited
(Elec) 109.2 105.8 109.4 106.8
Gas Plus
Supply Limited
(Gas) 109.4 105.7 108.7 106.6


