Aalborg Universitet Eco Island Ferry Comparative LCA of island ferry with carbon fibre composite based and steel based structures Schmidt, Jannick Højrup; Watson, J. Publication date: 2014 Document Version Early version, also known as pre-print Link to publication from Aalborg University Citation for published version (APA): Schmidt, J. H., & Watson, J. (2014). Eco Island Ferry: Comparative LCA of island ferry with carbon fibre composite based and steel based structures. 2.0 LCA consultants. http://lca-net.com/publications/show/eco- island-ferry-comparative-lca-island-ferry-carbon-fibre-composite-based-steel-based-structures/ General rights Copyright and moral rights for the publications made accessible in the public portal are retained by the authors and/or other copyright owners and it is a condition of accessing publications that users recognise and abide by the legal requirements associated with these rights. ? Users may download and print one copy of any publication from the public portal for the purpose of private study or research. ? You may not further distribute the material or use it for any profit-making activity or commercial gain ? You may freely distribute the URL identifying the publication in the public portal ? Take down policy If you believe that this document breaches copyright please contact us at [email protected] providing details, and we will remove access to the work immediately and investigate your claim. Downloaded from vbn.aau.dk on: June 13, 2020
Transcript
Aalborg Universitet
Eco Island Ferry
Comparative LCA of island ferry with carbon fibre composite based and steel basedstructuresSchmidt, Jannick Højrup; Watson, J.
Publication date:2014
Document VersionEarly version, also known as pre-print
Link to publication from Aalborg University
Citation for published version (APA):Schmidt, J. H., & Watson, J. (2014). Eco Island Ferry: Comparative LCA of island ferry with carbon fibrecomposite based and steel based structures. 2.0 LCA consultants. http://lca-net.com/publications/show/eco-island-ferry-comparative-lca-island-ferry-carbon-fibre-composite-based-steel-based-structures/
General rightsCopyright and moral rights for the publications made accessible in the public portal are retained by the authors and/or other copyright ownersand it is a condition of accessing publications that users recognise and abide by the legal requirements associated with these rights.
? Users may download and print one copy of any publication from the public portal for the purpose of private study or research. ? You may not further distribute the material or use it for any profit-making activity or commercial gain ? You may freely distribute the URL identifying the publication in the public portal ?
Take down policyIf you believe that this document breaches copyright please contact us at [email protected] providing details, and we will remove access tothe work immediately and investigate your claim.
Mats Hjortberg, owner of Coriolis. Gothenberg, Sweden
Bjarne Moellgaard manager of Hov‐Tunø Ferry, Odder Municipal, Odder
Henrik Riisgaard, Teaching Associate Professor, Aalborg University, Aalborg Denmark
Magdalena Sandström, Group PDM Mgr, DIAB International AB. Laholm, Sweden
Christian Karlsson, Sales & Marketing Manager‐Europe/Africa, DIAB International AB. Laholm,
Sweden
2.‐0 LCA consultants, Aalborg, Denmark
When citing the current report, please use the following reference:
Schmidt J H and Watson J (2013), Eco Island Ferry ‐ Comparative LCA of island ferry with carbon fibre
composite based and steel based structures. 2.‐0 LCA consultants, Aalborg, Denmark
Aalborg, April 15th 2013
5
TableofContentsPreface 3
1. Introduction 7
2. Goal and scope definition 9
2.1 ISO 14040/44 on LCA 9
2.2 Critical review 9
2.3 Functional unit and purpose of the study 9
Functional unit 9
Purpose and type of study 9
Description of the ferries and their components 10
FRP composite and construction of the materials of the base design 12
2.4 Life cycle inventory modelling approach 13
Consequential and attributional modelling 13
Applied modelling approach 14
2.5 System boundaries 14
2.6 Description of the System 15
Production of Materials: 15
Shipyard/Ferry Construction: 15
Shipyard/Maintenance: 15
Ferry operation 16
Ferry disposal/recycling 16
Cut‐off criteria 16
2.7 Categories of activities and products and level of detail of data 16
2.8 Data sources for background data 17
Data sources for ferry construction, operation, maintenance and disposal 17
Data sources for background data: Ecoinvent and DK and EU27 hybrid IO‐database 17
2.9 Life cycle impact assessment (LCIA) method 18
3. Life cycle inventory: electricity, transport and fuels 19
3.1 Electricity 19
3.2 District heating 20
3.3 Transport 20
3.4 Marine diesel incl. combustion 20
3.5 Lubricants 21
3.6 Services 21
3.7 Capital goods, shipyard 23
4. Life cycle inventory: shipyard, ferry construction 25
4.1 Carbon fibre 27
4.2 Core: PVC foam 27
4.3 Aluminium sheet 28
4.4 Steel sheet and section bar 28
4.5 Engine 30
4.6 Insulation 30
4.7 Textiles 31
6
4.8 Wood products 31
4.9 Plastics products 31
4.10 Paint 31
5. Life cycle inventory: shipyard, maintenance 33
6. Life cycle inventory: Ferry operation 37
7. Life cycle inventory: Ferry disposal/recycling 39
7.1 Recycling 41
7.2 Incineration 42
7.3 Landfill 45
8. Results: Life Cycle Impact Assessment 47
8.1 Overall characterised and weighted results of the two ferry alternatives 47
8.2 Process contribution 50
9. Sensitivity analysis and uncertainties 55
9.1 Ferry life times 55
9.2 Modelling of electricity 55
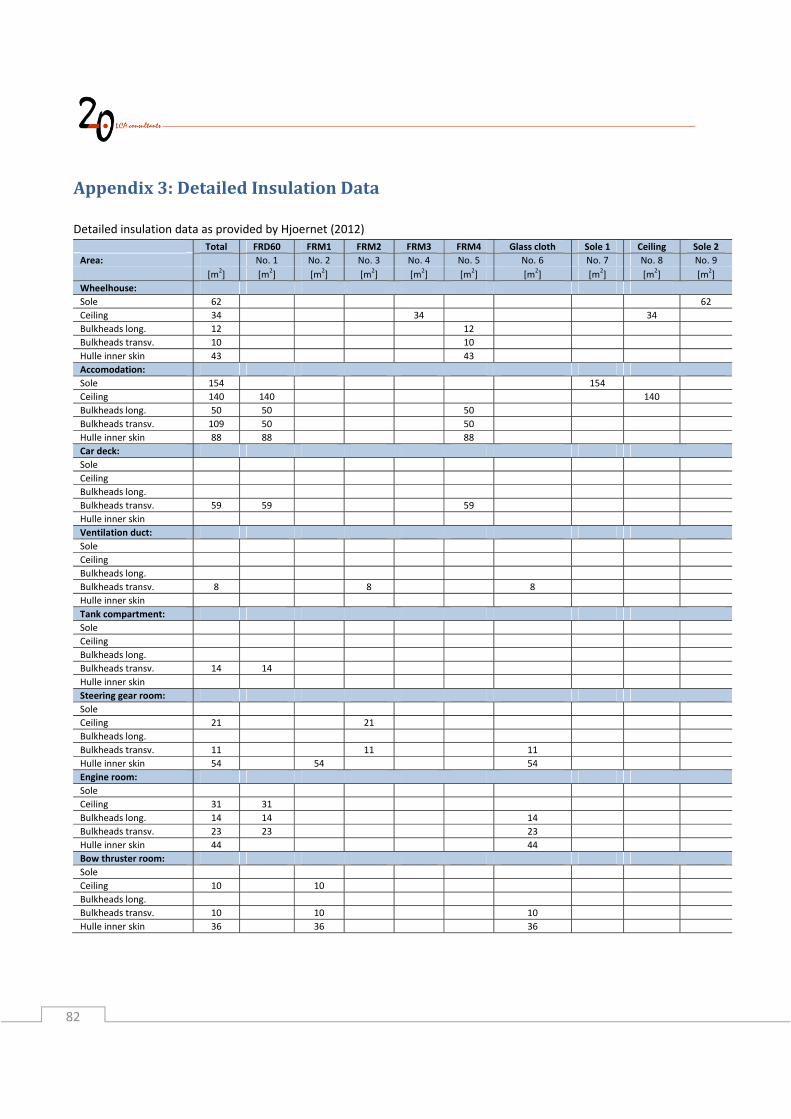
9.3 Quantity of insulation in Tun Island Ferry 56
9.4 Same amount of machinery and equipment in two ferries 56
9.5 Inconsistent modelling of wood 56
9.6 Same amount of paint for maintenance in two ferries 56
9.7 Zinc anode emissions 56
9.8 Anti‐fouling agent emissions 57
9.9 Diesel consumption 57
9.10 Marginal source of fuel for operation stage 57
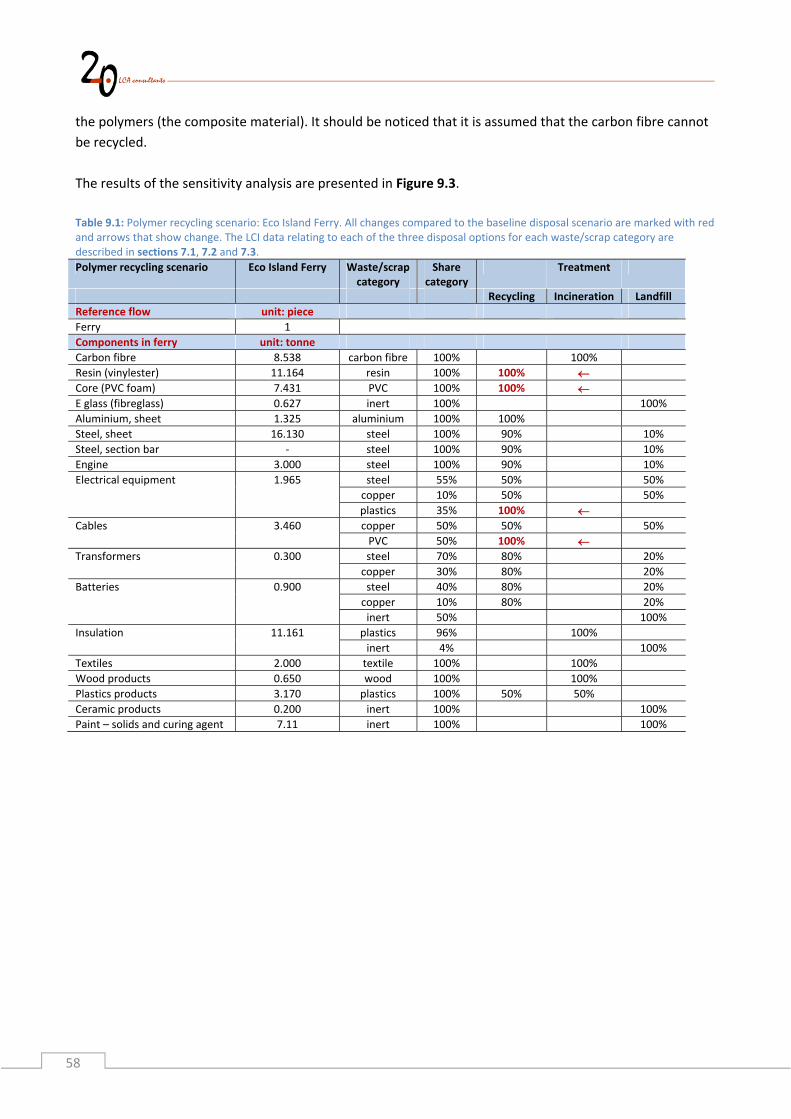
9.11 End‐of‐life scenarios 57
9.12 Concluding remark on the sensitivity analysis 60
10. Evaluation of sensitivity, completeness and consistency 63
10.1 Sensitivity check 63
10.2 Completeness check 63
10.3 Consistency check 63
11. Conclusions 65
12. References 67
Appendix 1: Detailed Components Lists 72
Appendix 2: Paint and zinc anode calculations 78
Detailed Paint Calculations for Eco Island Ferry 78
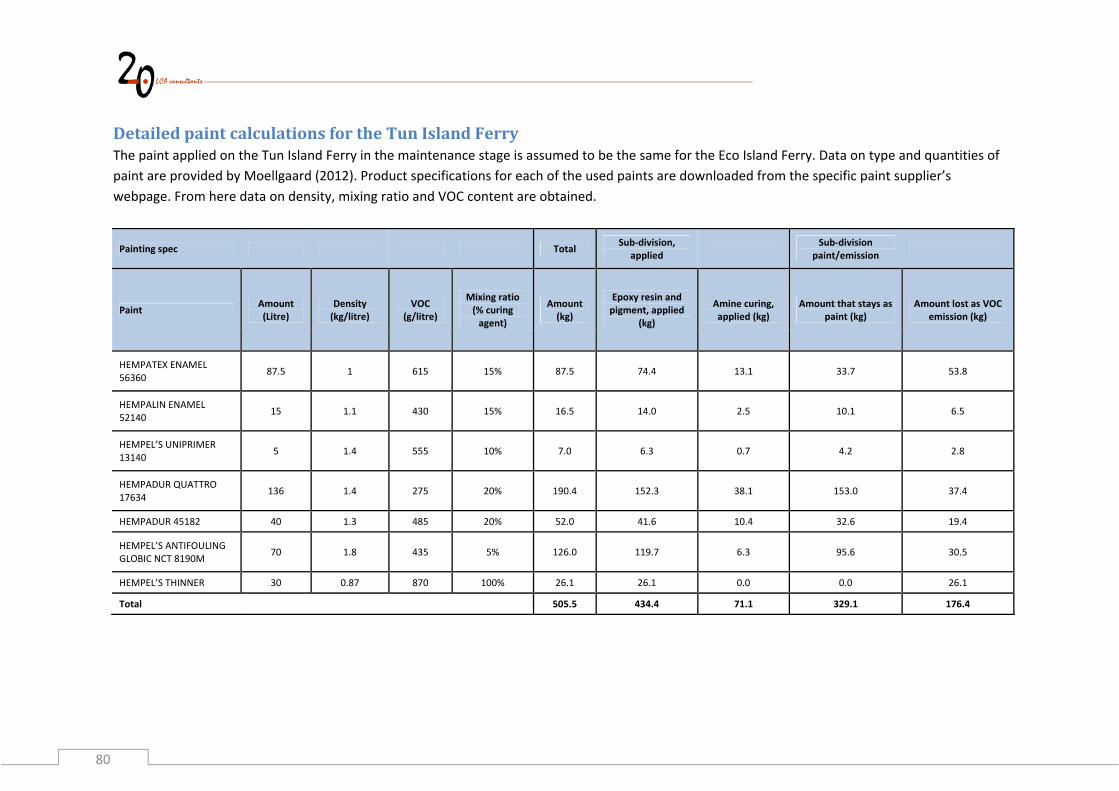
Detailed paint calculations for the Tun Island Ferry 80
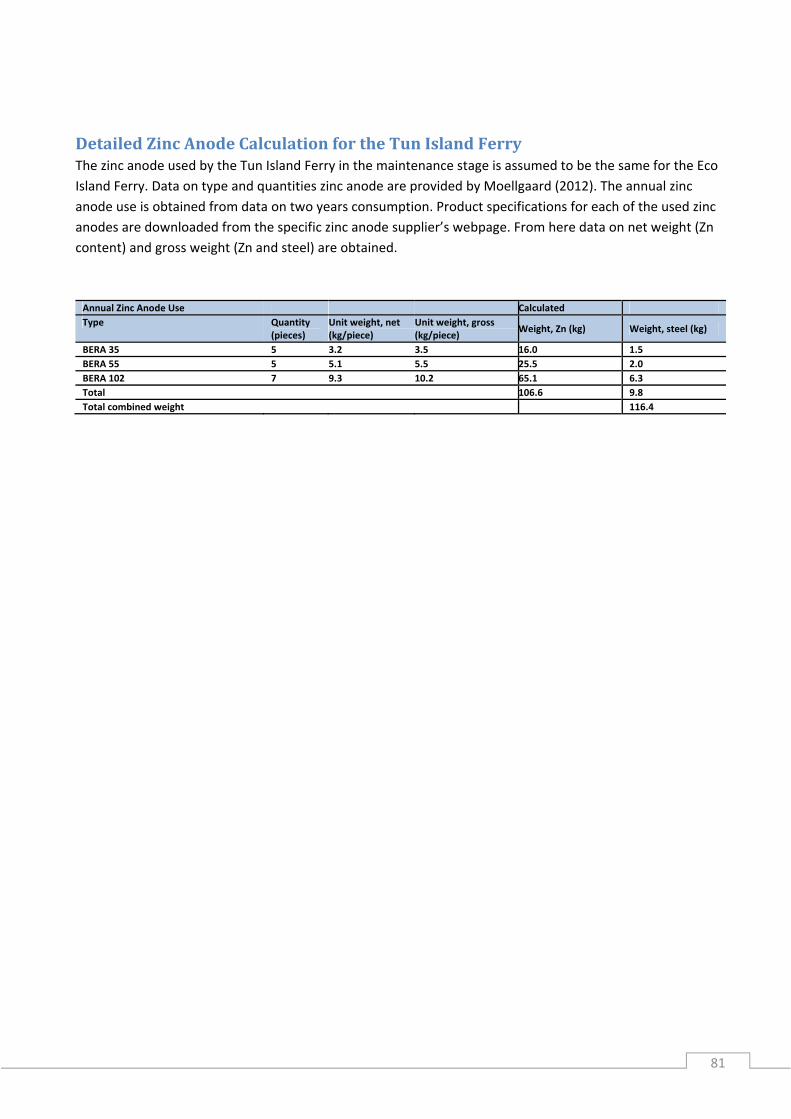
Detailed Zinc Anode Calculation for the Tun Island Ferry 81
Appendix 3: Detailed Insulation Data 82
Appendix 4: Explanation of indicators in the Stepwise LCIA method 85
Appendix 5: Critical review report including author’s response 87
7
1. IntroductionThis report is a comparative life cycle assessment of a conventional steel ferry and a carbon fibre reinforced
polymer (FRP) composite ferry.
Following a kick‐off meeting for the EU project MARKIS in 2010 with the title “Light Weight Marine
structures”, an industrial group in North Jutland, Denmark and SP Technical Research Institute of Sweden
started discussing displacement ferries with a reduced environmental footprint. This led to the creation of a
Swedish‐Danish consortium with the objective of starting construction of this type of ferry in the Swedish
and Danish region. The project was named “Øko‐Ø‐færge” (Eco Island Ferry) and a project group was
formed consisting of naval architects from Sweden and Denmark, university and shipyard representatives
as well as specialists from research institutes. A project plan was prepared, which included a full fire safety
assessment according to SOLAS chapter II‐2 Regulation 17 along with a life cycle costing (LCC) and a life
cycle assessment (LCA) for the new ecological and economical island ferry.
A preliminary study (Amen and Evegren 2012) was carried out by the SP Technical Research Institute of
Sweden that reviewed national, European and international regulations, along with studies of the potential
market and financing for lightweight island ferries in the region.
The project work is meant to illustrate the feasibility of a more ecological and economical alternative for
island ferries. The project sets out to replace the old Tun Island Ferry (Tunøfærgen), which travels between
Hov and the Tunö Island in Denmark. One of the requirements was that the new ship maintains the same
capacity as the Tun Island Ferry, which holds 200 passengers and six cars (or four cars and a truck). By using
carbon fibre reinforced polymer (FRP) composite as an alternative to steel, a weight reduction of up to 71%
can be achieved, which could provide significant improvements to operational costs and environmental
impacts.
As such, the objective of this report is to evaluate the environmental impacts of the current Tun Island
Ferry and the proposed alternative Eco Island Ferry according to ISO 14040 standards for life cycle
assessment. The functional unit is defined as servicing the Tunø ferry route in one year. This includes:
‐ 700 voyages per year
‐ Each journey from Hov to Tunø is approximately 2 times 9.7 nautical miles or 18 km (out and return) =
19.4 nautical miles or 36 km (estimated in Google Earth)
‐ Each journey has a duration of 2 times 1 hour (out and return) = 2 hours (Soerensen 2012)
‐ The load capacity of the ferry is 200 passengers and 6 cars (or 4 cars and 1 truck) (Evegren and Rahm
2012, p 4)
This report studies the environmental performance of the two ferry alternatives, including the emissions
related to the production of construction materials and engine size, energy savings related to change in the
weight of the ferry, and the waste handling at the end‐of‐life of the ferry.
9
2. Goalandscopedefinition
2.1 ISO14040/44onLCAThe LCA is carried out in accordance with the ISO standards on LCA: ISO 14040 (2006) and ISO 14044
(2006). However, at one point the study is not in compliance with ISO 14044, see section 2.2 below.
2.2 CriticalreviewA critical review has been carried out. It should be noticed, that according to ISO 14044 (2006, p 39): “…a
panel of interested parties shall conduct critical reviews on LCA studies where the results are intended to be
used to support a comparative assertion intended to be disclosed to the public.”. Since the current study is
used to support a comparative assertion that is disclosed to the public, and since the review is not carried
out by a panel, the review cannot be characterised as being in accordance with the ISO standards on LCA.
The critical review is carried out by Henrik Wenzel. The review report is available in ‘Appendix 5: Critical
review report including author’s response’. Each of the comments raised in the review report has been
addressed and this is also available in ‘Appendix 5: Critical review report including author’s response’.
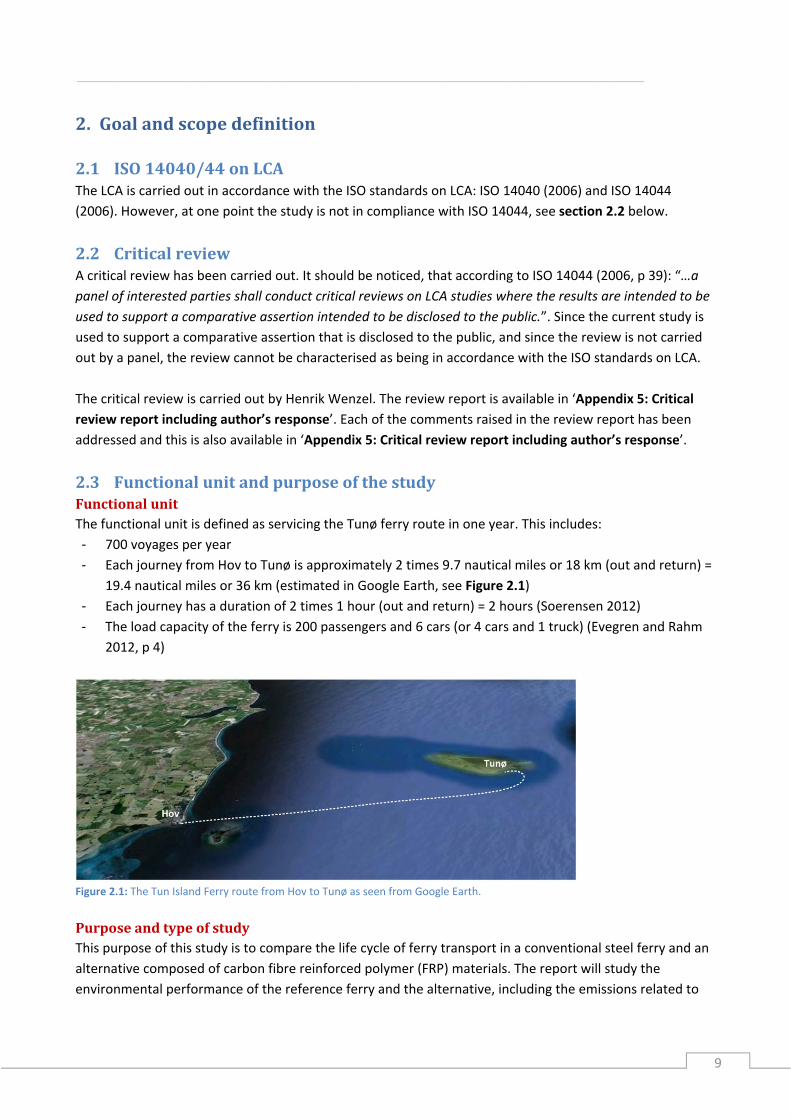
2.3 FunctionalunitandpurposeofthestudyFunctionalunitThe functional unit is defined as servicing the Tunø ferry route in one year. This includes:
‐ 700 voyages per year
‐ Each journey from Hov to Tunø is approximately 2 times 9.7 nautical miles or 18 km (out and return) =
19.4 nautical miles or 36 km (estimated in Google Earth, see Figure 2.1)
‐ Each journey has a duration of 2 times 1 hour (out and return) = 2 hours (Soerensen 2012)
‐ The load capacity of the ferry is 200 passengers and 6 cars (or 4 cars and 1 truck) (Evegren and Rahm
2012, p 4)
Figure 2.1: The Tun Island Ferry route from Hov to Tunø as seen from Google Earth.
PurposeandtypeofstudyThis purpose of this study is to compare the life cycle of ferry transport in a conventional steel ferry and an
alternative composed of carbon fibre reinforced polymer (FRP) materials. The report will study the
environmental performance of the reference ferry and the alternative, including the emissions related to
10
the production of construction materials and engine size, energy savings related to change in the weight of
the ferry, and the waste handling at the end‐of‐life of the ferry.
Another purpose of the study, in keeping with the purpose of the Eco Island Ferry Project, is to change the
perspective among ship owners and authorities with competence building within industry and authorities,
as well as inspiring ship owners and naval architects to consider modern materials for shipbuilding.
(Riisgaard et al. 2011)
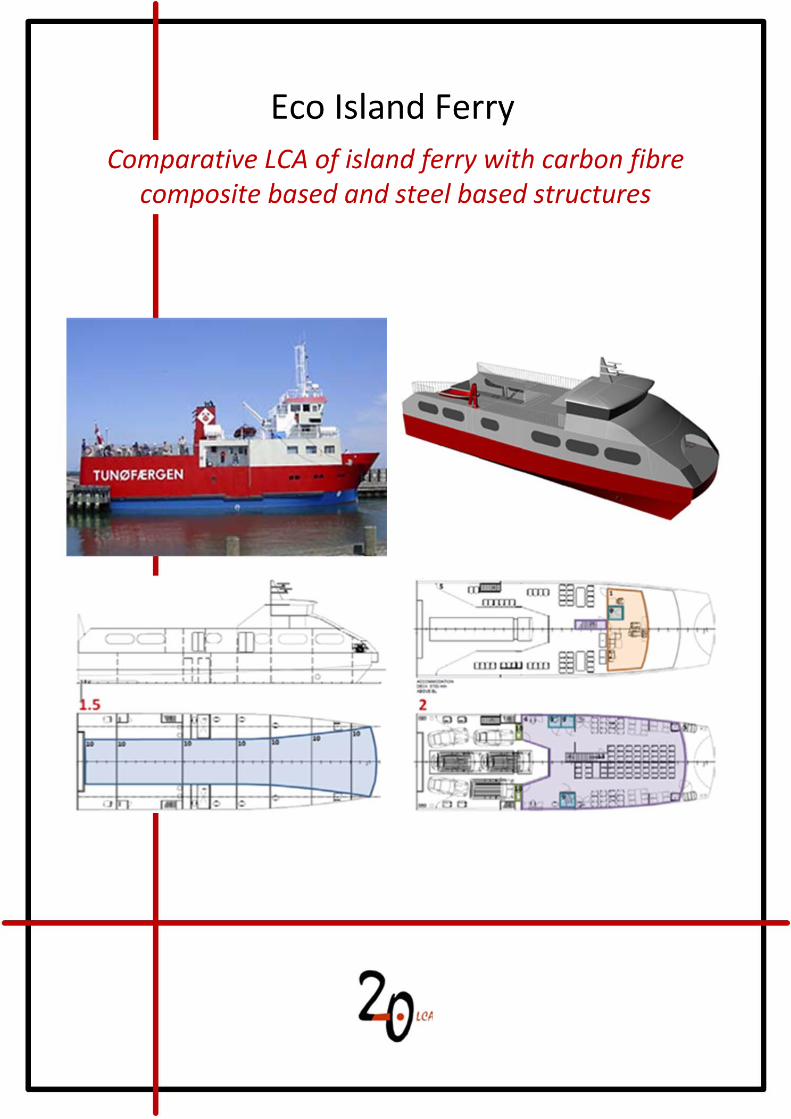
DescriptionoftheferriesandtheircomponentsThe ferries studied in this report are the Tunøfœrgen (or the Tun Island Ferry in English), which is a Ro‐pax
ferry class D from 1993. The Tun Island Ferry has a length of 30.5 meters, a width of 9.0 meters, depth of
3.20 meters and a draft of 2.10 meters. The Eco Island Ferry has roughly the same dimensions, with a
length of 30.7 meters, a width of 10 meters, a depth of 3.2 meters and a draft of 1.40 meters. (Evegren and
Rahm 2012). The payload capacity is equal to 200 passengers plus 3 crew members. An additional 6 cars
can also be carried or 4 cars and 1 truck. The total payload capacity is 45.3 tonnes for the Eco Island Ferry
and 56.1 tonnes for the Tun Island Ferry. This capacity is almost identical for the two ferries and is, together
with the speed, the key design parameter for the Eco Island Ferry (Soerensen 2012). The two ferries are
shown in Figure 2.2 below.
Figure 2.2: The Tun Island Ferry on the left and the Eco Island Ferry on the right. (Evegren and Rahm 2012)
The ferries carry out 700 return voyages per year. Each voyage is 2 x 1 hour at approximately 9.5 knots
(Soerensen 2012). The route of the ship is between Hov and Tunø in Denmark and the approximate number
of passengers using the ship per year is 50,000 (Amen and Evegren 2012). The distance is approximately 2 x
9.7 nautical miles = 19.4 nautical miles (out and return) (estimated in Google Earth). The Tun Island Ferry is
built using steel and the Eco Island Ferry is designed using FRP composite materials. The weight
specifications for the reference ferry and the Eco Island Ferry are shown in Table 2.1 below and include the
weight of crew members, passengers, luggage, cars, cargo etc., whereas Table 2.2 provides the weight and
material composition without these components and broken down by material type.
11
Table 2.1: Payload data for the two the ferry alternatives (Amen and Evegren 2012).
Payload weight
Material Eco Island Ferry (tonne) Tun Island Ferry (tonne)
Fuel 8.0 18.8
Stores 1.0 1.0
Passengers 15.0 15.0
Crew 0.2 0.2
Luggage 2.0 2.0
Cars 16.0 16.0
Deck Cargo 3.1 3.1
Total payload 45.3 56.1
Table 2.2: Lightweight data of the two ferry alternatives. Sources: Tun Island Ferry data (Moellgaard 2012); Eco Island Ferry data (Hjoernet 2012).
Lightweight
Material Eco Island Ferry (tonne) Tun Island Ferry (tonne)
Hull material, fibre reinforced polymer
(FRP)
27.7 ‐
Hull material, aluminum 1.3 ‐
Hull material, steel and other materials ‐ 237
Insulation materials 11.2 7.0
Machinery and equipment 31.8 18.2
Total lightweight* 72.0 262
*The lightweight is a nautical term for the displacement of a ship without cargo, fuel, lubricating oil, ballast water, consumable stores as well as passengers, crew and their effects.
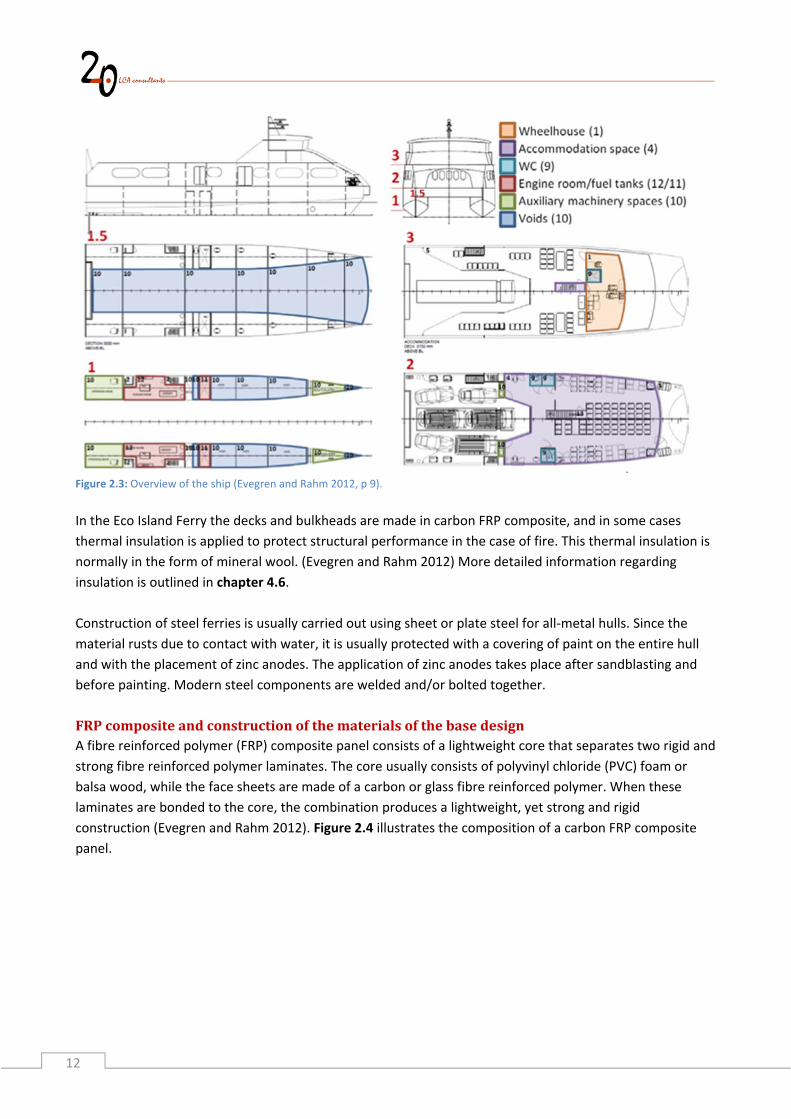
The design of the Eco Island Ferry is the same as the Tun Island Ferry, but all steel structures have been
replaced by carbon FRP composite. It should be noted that the Eco Island Ferry is made up of a main deck
and an upper deck on two pontoons. There is a wet deck between the two pontoons that consists of
shallow void spaces. The levels of the ship are referred to as deck 1, deck 2, and deck 3, starting from the
base of the pontoons. The wet deck is referred to as deck 1.5. (Evegren and Rahm 2012) The design of the
ship is seen below in Figure 2.3.
12
Figure 2.3: Overview of the ship (Evegren and Rahm 2012, p 9).
In the Eco Island Ferry the decks and bulkheads are made in carbon FRP composite, and in some cases
thermal insulation is applied to protect structural performance in the case of fire. This thermal insulation is
normally in the form of mineral wool. (Evegren and Rahm 2012) More detailed information regarding
insulation is outlined in chapter 4.6.
Construction of steel ferries is usually carried out using sheet or plate steel for all‐metal hulls. Since the
material rusts due to contact with water, it is usually protected with a covering of paint on the entire hull
and with the placement of zinc anodes. The application of zinc anodes takes place after sandblasting and
before painting. Modern steel components are welded and/or bolted together.
FRPcompositeandconstructionofthematerialsofthebasedesignA fibre reinforced polymer (FRP) composite panel consists of a lightweight core that separates two rigid and
strong fibre reinforced polymer laminates. The core usually consists of polyvinyl chloride (PVC) foam or
balsa wood, while the face sheets are made of a carbon or glass fibre reinforced polymer. When these
laminates are bonded to the core, the combination produces a lightweight, yet strong and rigid
construction (Evegren and Rahm 2012). Figure 2.4 illustrates the composition of a carbon FRP composite
panel.
13
Figure 2.4: Illustration of a carbon FRP composite panel (top) and a close‐up on the core and the fibre reinforced laminates (bottom). (Evegren and Rahm 2012, p 11)
A typical carbon FRP composite panel consists of a 50 mm PVC foam core (80 kg/m3) sandwiched by two 1.5
mm carbon FRP laminates (approximately 2,100 kg/m3). The total weight of said carbon FRP composite is
~10.5 kg/m2. This composite panel could replace a 7 mm steel plate with a weight of 55 kg/m2 (Evegren and
Rahm 2012).
2.4 LifecycleinventorymodellingapproachConsequentialandattributionalmodellingGenerally there are two different approaches to modelling in life cycle inventory:
‐ consequential modelling
‐ attributional modelling
According to Sonnemann and Vigon (2011, p 132), attributional modelling is defined as: “System modelling
approach in which inputs and outputs are attributed to the functional unit of a product system by linking
and/or partitioning the unit processes of the system according to a normative rule.” In the current study
attributional modelling is carried out by assuming that the products are produced using existing production
capacity (current or historical market average), and multiple‐output activities are dealt with by applying
allocation factors based on economic value.
According to Sonnemann and Vigon (2011, p 133), consequential modelling is defined as a: “System
modelling approach in which activities in a product system are linked so that activities are included in the
product system to the extent that they are expected to change as a consequence of a change in demand for
the functional unit.” Hence, in consequential modelling it is generally a change in demand for the product
under study that is modelled. A cause‐effect relationship between a change in demand and the related
changes in supply is intended to be established. This implies that the product is produced by new capacity
(if the market trend is increasing). In addition, it is taken into account that the affected production capacity
must be the actual affected, i.e. it is not constrained. Multiple‐output activities are dealt with using
substitution. The modelling principles are comprehensively described in Weidema et al. (2009) and
Weidema (2003).
14
AppliedmodellingapproachThe current study will apply the consequential modelling approach because this describes the
consequences of a specific decision instead of following more normative (often mass flow analysis inspired)
modelling rules.
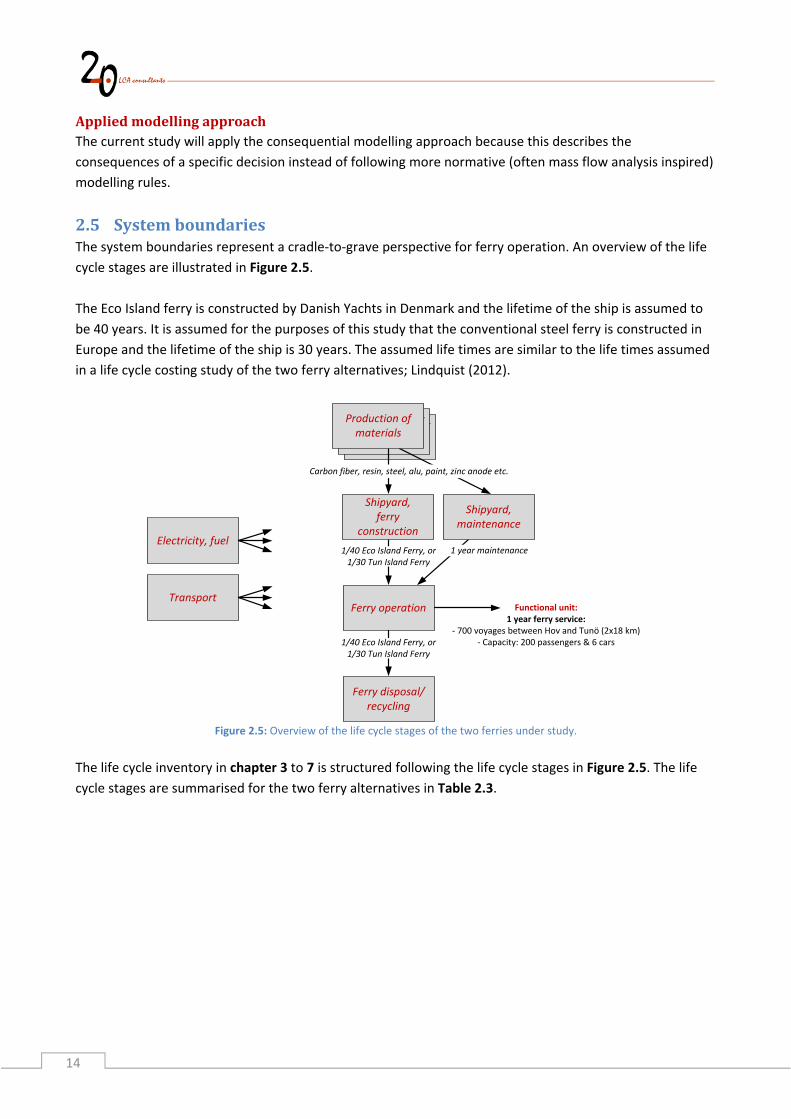
2.5 SystemboundariesThe system boundaries represent a cradle‐to‐grave perspective for ferry operation. An overview of the life
cycle stages are illustrated in Figure 2.5.
The Eco Island ferry is constructed by Danish Yachts in Denmark and the lifetime of the ship is assumed to
be 40 years. It is assumed for the purposes of this study that the conventional steel ferry is constructed in
Europe and the lifetime of the ship is 30 years. The assumed life times are similar to the life times assumed
in a life cycle costing study of the two ferry alternatives; Lindquist (2012).
Figure 2.5: Overview of the life cycle stages of the two ferries under study.
The life cycle inventory in chapter 3 to 7 is structured following the life cycle stages in Figure 2.5. The life
cycle stages are summarised for the two ferry alternatives in Table 2.3.
Production of materials
Production of materials
Shipyard,ferry
construction
1/40 Eco Island Ferry, or1/30 Tun Island Ferry
Ferry operation Functional unit:1 year ferry service:
‐ 700 voyages between Hov and Tunö (2x18 km)‐ Capacity: 200 passengers & 6 cars
Ferry disposal/recycling
Shipyard, maintenance
1 year maintenance
Carbon fiber, resin, steel, alu, paint, zinc anode etc.
Production of materials
Electricity, fuel
Transport
1/40 Eco Island Ferry, or1/30 Tun Island Ferry
15
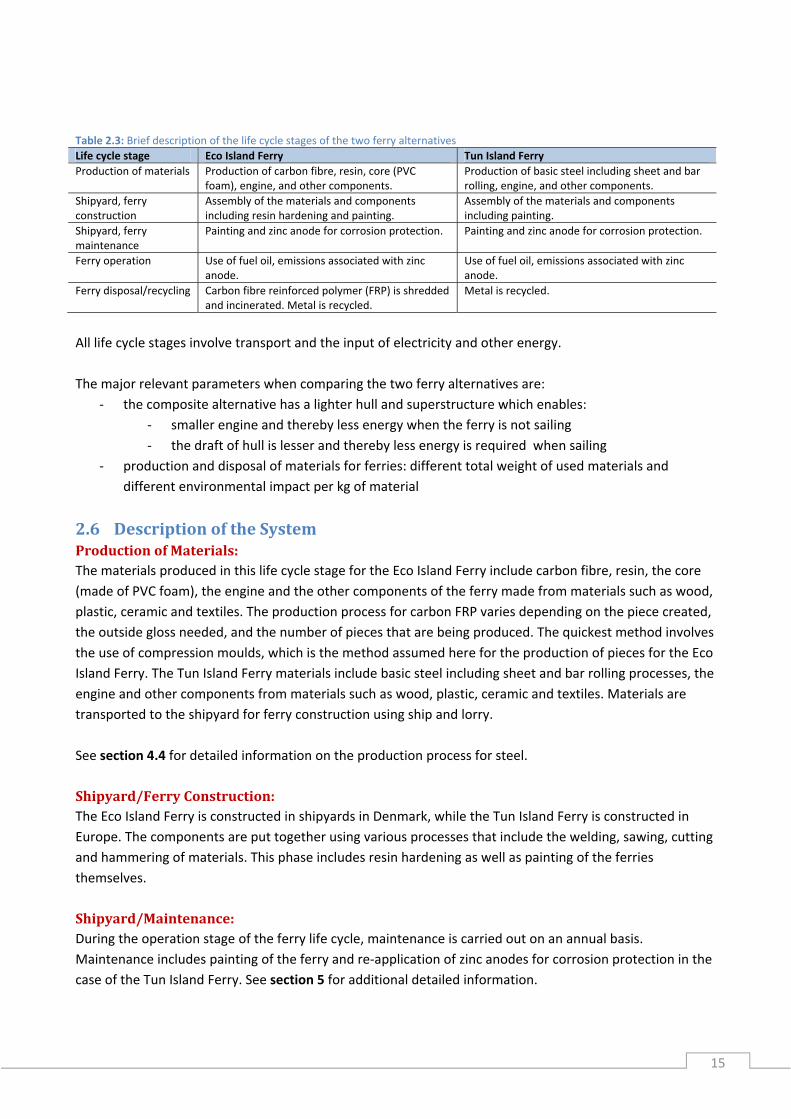
Table 2.3: Brief description of the life cycle stages of the two ferry alternatives
Life cycle stage Eco Island Ferry Tun Island Ferry
Production of materials Production of carbon fibre, resin, core (PVC foam), engine, and other components.
Production of basic steel including sheet and bar rolling, engine, and other components.
Shipyard, ferry construction
Assembly of the materials and components including resin hardening and painting.
Assembly of the materials and components including painting.
Shipyard, ferry maintenance
Painting and zinc anode for corrosion protection. Painting and zinc anode for corrosion protection.
Ferry operation Use of fuel oil, emissions associated with zinc anode.
Use of fuel oil, emissions associated with zinc anode.
Ferry disposal/recycling Carbon fibre reinforced polymer (FRP) is shredded and incinerated. Metal is recycled.
Metal is recycled.
All life cycle stages involve transport and the input of electricity and other energy.
The major relevant parameters when comparing the two ferry alternatives are:
‐ the composite alternative has a lighter hull and superstructure which enables:
‐ smaller engine and thereby less energy when the ferry is not sailing
‐ the draft of hull is lesser and thereby less energy is required when sailing
‐ production and disposal of materials for ferries: different total weight of used materials and
different environmental impact per kg of material
2.6 DescriptionoftheSystemProductionofMaterials:The materials produced in this life cycle stage for the Eco Island Ferry include carbon fibre, resin, the core
(made of PVC foam), the engine and the other components of the ferry made from materials such as wood,
plastic, ceramic and textiles. The production process for carbon FRP varies depending on the piece created,
the outside gloss needed, and the number of pieces that are being produced. The quickest method involves
the use of compression moulds, which is the method assumed here for the production of pieces for the Eco
Island Ferry. The Tun Island Ferry materials include basic steel including sheet and bar rolling processes, the
engine and other components from materials such as wood, plastic, ceramic and textiles. Materials are
transported to the shipyard for ferry construction using ship and lorry.
See section 4.4 for detailed information on the production process for steel.
Shipyard/FerryConstruction:The Eco Island Ferry is constructed in shipyards in Denmark, while the Tun Island Ferry is constructed in
Europe. The components are put together using various processes that include the welding, sawing, cutting
and hammering of materials. This phase includes resin hardening as well as painting of the ferries
themselves.
Shipyard/Maintenance:During the operation stage of the ferry life cycle, maintenance is carried out on an annual basis.
Maintenance includes painting of the ferry and re‐application of zinc anodes for corrosion protection in the
case of the Tun Island Ferry. See section 5 for additional detailed information.
16
FerryoperationAs described in section 2.3, the ferries carry out 700 return voyages per year. Each voyage is 2 x 1 hour at
approximately 9.5 knots (Soerensen 2012). The route of the ship is between Hov and Tunø in Denmark and
the approximate number of passengers using the ship per year is 50,000 (Amen and Evegren 2012). The
distance is approximately 2 x 9.7 nautical miles = 19.4 nautical miles (out and return) (estimated in Google
Earth). This stage in the life cycle of the ferries includes both fuel oil and electricity use, in addition to
emissions associated with zinc anode.
Ferrydisposal/recyclingIn this stage of the ferry life cycle, the carbon fibre material is shredded. All combustible parts are
incinerated and the residual glass fibres are sent to landfill. Metal parts are recycled for both ferries. A
sensitivity analysis will be carried out to apply a recycling scenario.
Cut‐offcriteriaAll processes/activities in the affected product systems will be included. Inputs related to services etc. are
modelled using hybrid input/output models. More information regarding this can be found in section 3.5.
2.7 CategoriesofactivitiesandproductsandlevelofdetailofdataA rough overview of the level of detail in the inventory of different activities is presented in Table 2.4,
where it is indicated whether specific data have been inventoried or if generic data directly obtained from
LCI databases have been used. It should be noticed that hybrid data are applied in the processes
representing the main life cycle stages of the ferries and also one tier upstream in the product system.
Since a tiered approach for hybridisation has been used, it was overly time consuming to go into further
detail.
17
Table 2.4: Overview of the level of detail (specific/detailed versus generic) of the inventory of the transactions of different
categories of products in different categories of activities. activities Products
Shipyard: Eco E Ferry / Steel
Operation: Eco E Ferry / Steel
Maintenance: Eco E Ferry / Steel
Disposal: Eco E Ferry / Steel
Inputs per unit of output
Carbon fiber Specific Specific
Resin & core Specific Specific Specific
Steel Specific Specific Specific
Fuels, electricity, chemicals Specific Specific Specific Generic
Other products incl. services etc. Generic Generic Generic Generic
Emissions per unit of output
Emissions Specific Specific Specific Generic
2.8 DatasourcesforbackgrounddataDatasourcesforferryconstruction,operation,maintenanceanddisposalDetailed data on the material and component composition, performance, construction etc. of the Eco
Island Ferry are provided by:
Hjortberg M (2012), Personal communication with Mats Hjortberg, owner of Coriolis. Gothenberg,
Sweden
Sørensen J O (2012), Personal communication with Mechanical Engineer Jens O Soerensen. Danish
Yachts, Skagen, Denmark
Hjoernet, N K (2012), Personal communication with Naval Architect Niels Kyhn Hjørnet. Yacht
Design, Sæby, Denmark
Data on the material and component composition, performance, construction etc. of the Eco Island Ferry
are provided by:
Moellgaard B (2012), Personal communication with the manager of Hov‐Tunø Ferry, Odder
Municipal, Odder
Further, more general information on the ferry alternatives are obtained from:
Lindquist Å (2012), Life Cycle Cost Analysis ‐ Eco‐Island ferry. SP Technical Research Institute of
Sweden.
Amen M P and Evegren F (2012), Preliminary study of the Øko‐Ø‐færge project, SP Technical
Research Institute of Sweden
Evegren F and Rahm M (2012), Preliminary Analysis report – Eco‐Island‐Ferry (Reference BRd6035).
SP – Technical Research Institute of Sweden
Datasourcesforbackgrounddata:EcoinventandDKandEU27hybridIO‐databaseGenerally, the ecoinvent database v2.2 (ecoinvent 2010) is used for the upstream product system relating
to the production of materials, energy, capital goods as well as treatment/recycling of waste/scrap. The
ecoinvent database is the most comprehensive transparent LCA database on the market. The database is
fully linked (no black box processes) in the LCA software (SimaPro), and the full documentation of all data in
ecoinvent are publically available at http://ecoinvent.org/.
18
The ecoinvent database v2.2 is not linked using consequential modelling (see section 2.4). Therefore, all
significant ecoinvent activities are checked for allocation issues or constrained inputs and adjusted
accordingly.
The ecoinvent database does include inputs of services, such as wholesale, business travelling, accounting,
legal services etc. In order to obtain a cut‐off criterion close to 0%, service inputs are generally based on the
FORWAST hybrid IO‐database (Schmidt 2010c, Schmidt 2010d, and Schmidt et al. 2010). The database is
publically available in the demo version of the LCA software SimaPro:
In the current study, country/region specific inventory data are relevant for the following countries/regions
and are obtained from the following data sources:
‐ Denmark: Merciai et al. (2011a)
‐ Europe: Merciai et al. (2011b)
‐ World: Merciai et al. (2011c)
‐ Sweden: Dalgaard and Schmidt (2012, p 11)
‐ China: Merciai et al. (2011d)
It should be noted that the electricity inventories are linked to the ecoinvent database. This enables for the
identification of capital goods for electricity generation and transmission through the use of the ecoinvent
data for capital goods.
The applied electricity mixes in the three countries/regions are shown in Table 3.1.
20
Table 3.1: GHG‐emissions related to electricity production and distribution (Merciai et al. 2011a,b,c,d; Dalgaard and Schmidt
2012). Energy source Elec DK Elec EU Elec SE Elec CN GLO
Coal ‐ ‐ ‐ 53% 31%
Oil ‐ ‐ ‐ ‐ ‐
Natural gas 20% 13% ‐ 8% 21%
Biomass 40% 12% 27% 1% 4%
Nuclear ‐ ‐ ‐ 13% 13%
Hydro ‐ 7% 12% 15% 15%
Wind 40% 58% 61% 9% 13%
Geothermal ‐ 1% ‐ ‐ 1%
Solar ‐ 9% ‐ ‐ 2%
Total 100% 100% 100% 100% 100%
3.2 DistrictheatingLCA data on district heating in Denmark are based on Schmidt (2012, p 91‐92). The data are shown in Table
3.2.
Table 3.2: LCI‐data for district heating in Denmark. Data are obtained from Schmidt (2012, p 91‐92).
Exchanges Unit District heating, combined heat and
power (CHP)
LCI data
Reference flow
District heating MJ 0.59 Reference flow
Energy inputs
Wood pellets burned in power plant MJ 1 LCI‐Data are fully documented in Schmidt et al. (2011).
Co‐product: Electricity DK MJ ‐0.28 See section 3.1.
Transport
Transport, lorry 16‐32 t tkm 0.0106 Amount calculated based on calorific value of wood pellets at 18.8 MJ/kg and assumed distance at 200 km for all material inputs. LCI data: Transport, lorry 16‐32t, EURO5/RER (ecoinvent 2010).
3.3 TransportInventory data for transport are obtained from ecoinvent (2010). The following transport activities are
included in the inventory. The reference flow is shown, and ecoinvent activities that are used are specified
3.4 Marinedieselincl.combustionEmission data for the major emissions (CO2, SO2, PM2.5, NOx, CO, NMVOC and CH4) from combustion of
marine diesel in Danish national sea for high speed 4 stroke ship engines are obtained from Nielsen et al.
(2012). This reference is the Danish national emission inventory submitted under the Kyoto Protocol in
2012.
21
Emission data for 18 other emissions (e.g. heavy metals and specific NMVOCs) are obtained from ecoinvent
(2010): ‘Operation, barge/RER’. Also the LCI data for upstream production of diesel are obtained from this
data set. The reference flow of the ecoinvent activity is tkm. The activity only includes input of diesel and
the associated combustion emissions. The reference flow is changed to litres based on the input of diesel to
the activity (0.00939 kg/tkm) and the density of diesel, which is 870 kg/m3 (Andersen et al. 1981, p 119,
218).
The major emissions that are obtained from Nielsen et al. (2012), are compared with the figures in the
ecoinvent data set, see Table 3.3. It appears from the comparison, that the differences are relatively small.
Table 3.3: Emission factors for diesel combustion in Denmark; national sea (Nielsen et al. 2012; emission factor for CO2 is obtained from p 840&842 and other emissions are from p 1008‐1013). The applied emissions from Nielsen et al. (2012) are compared with the ecoinvent (2010) data set for diesel combustion emissions.
Emissions
Applied
emission
factors
(g/kg fuel)
For comparison: Emission factors
in ecoinvent (2010) data set:
‘Operation, barge/RER’
(g/kg fuel)
Engine specific emissions
NOx (engine specific emission; high speed 4 stroke engine, year 2000) 55.0 50.0
CO (engine specific emission; high speed 4 stroke engine, year 2000) 8.00 2.7
NMVOC (engine specific emission; high speed 4 stroke engine, year 2000) 2.43 1.0
CH4 (engine specific emission; high speed 4 stroke engine, year 2000) 0.08 0.024
Fuel specific emissions
CO2 (Gas/diesel oil) 3160 3152
SO2 (national sea, year 2009) 2.0 0.60
PM2.5 (national sea, year 2009) 0.9 0.92
3.5 LubricantsThe use of lubricants is modelled as diesel including production and combustion. It has been assumed that
all lubricants are fully combusted.
3.6 ServicesThe use of services is estimated based on generic Danish and European average figures for manufacturing
of ‘other transport equipment’ (NACE industry classification which includes building and repairing of ships
and boats). The data are obtained from a Danish and EU27 input‐output (IO) database (Schmidt 2010a,
Schmidt 2010b, and Schmidt et al. 2010). This database is publically available in SimaPro 7.3 (it can be
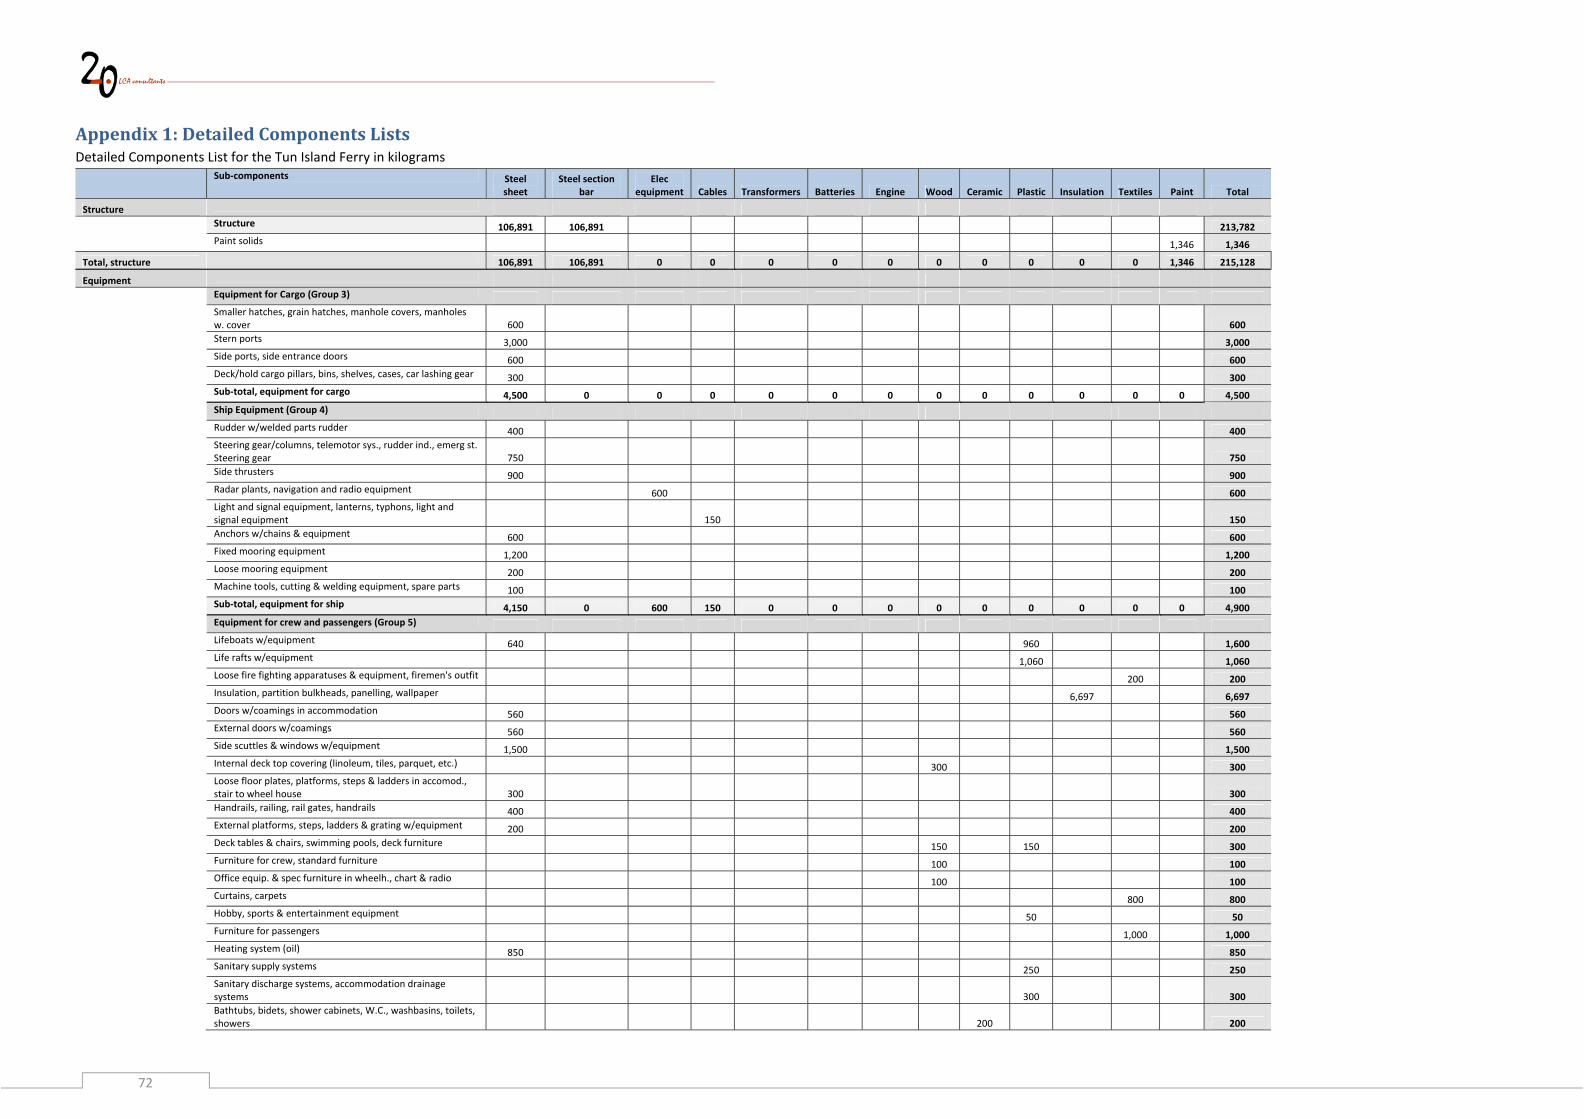
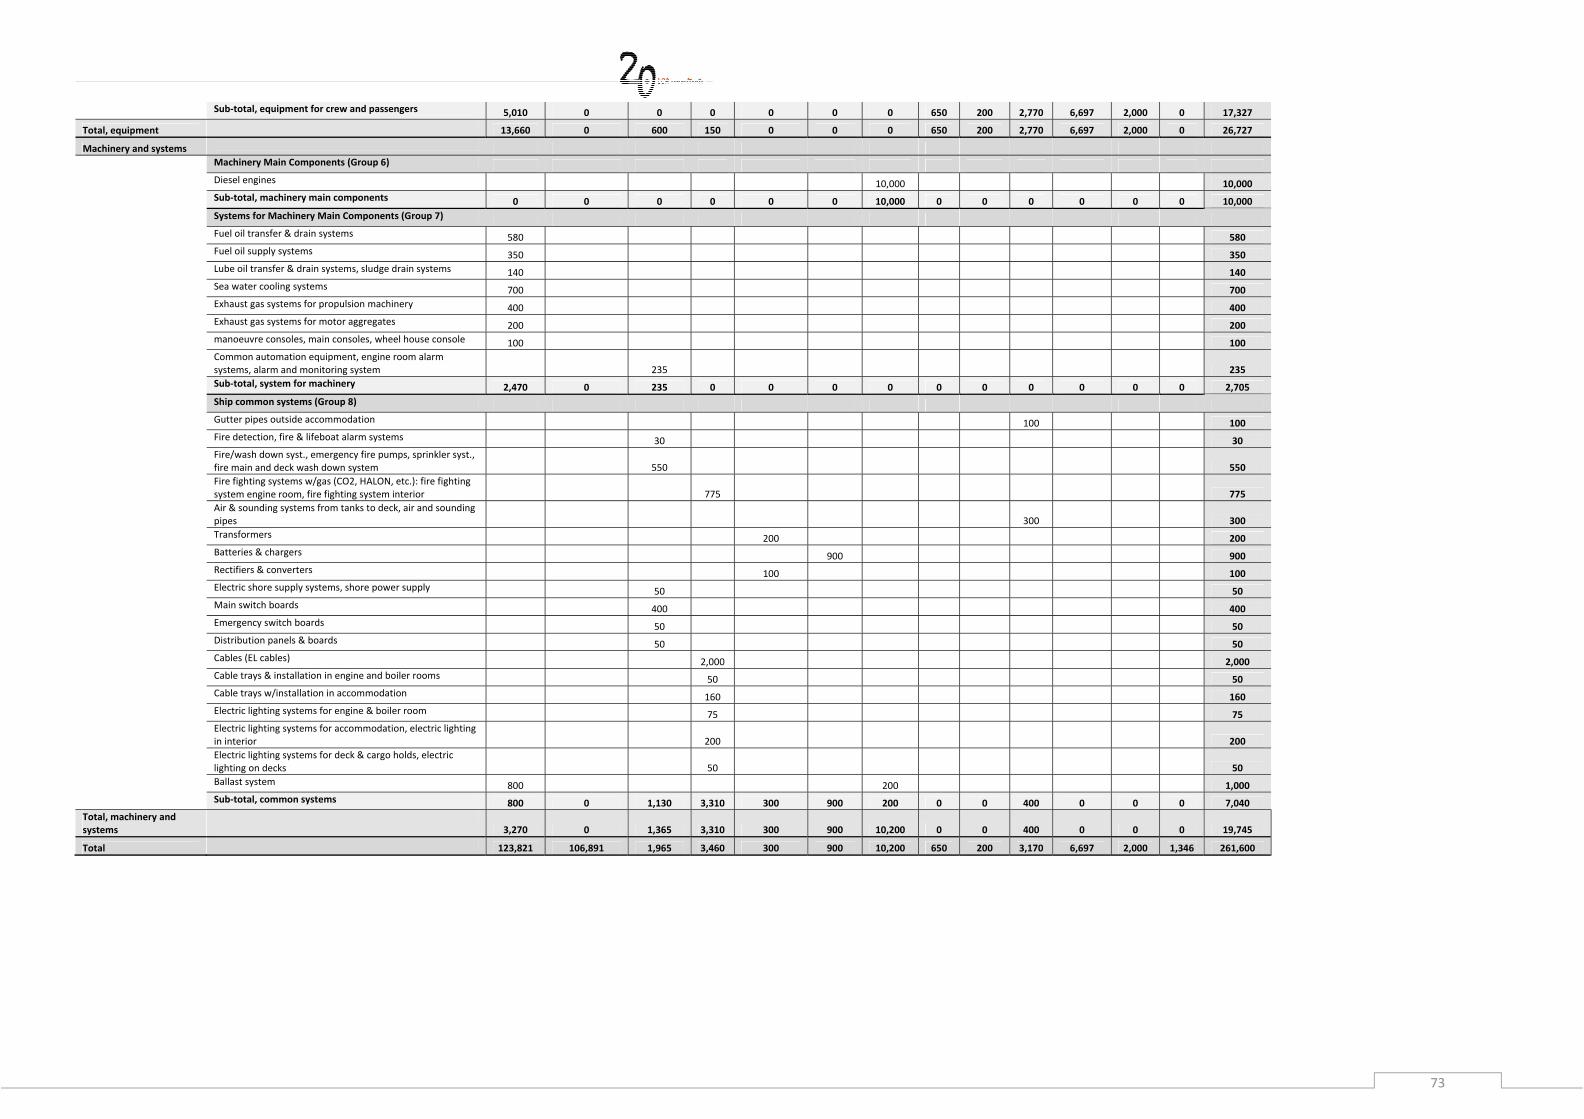
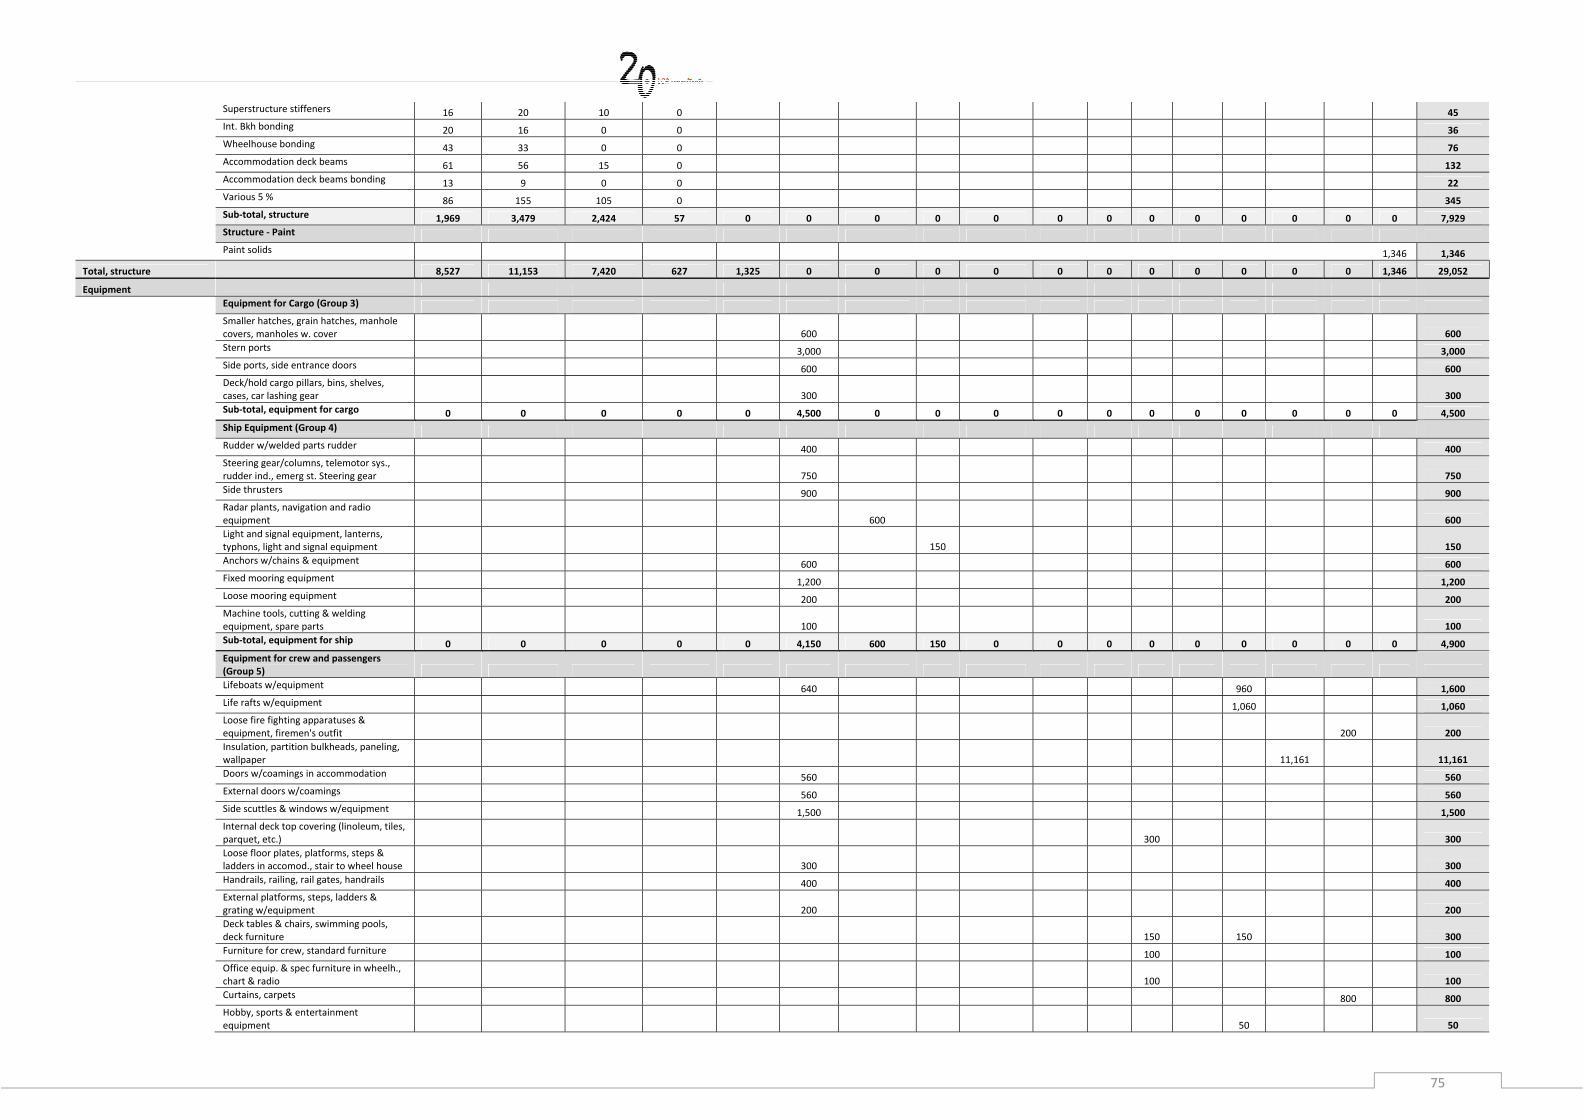
4. Lifecycleinventory:shipyard,ferryconstructionThe material inputs to the construction of the Eco Island Ferry are generally based on a detailed inventory
of the material composition provided by Hjoernet (2012). This is presented in Appendix 1: Detailed
Components Lists. For the use of carbon fibre and resin there is a general material loss at 15% at Danish
Yachts (Soerensen 2012). Carbon fibre is lost because mats are cut to fit the structure, and resin is lost as
excess resin in pipes etc. Electricity in the Eco Island Ferry shipyard is used for heating the hall for post
curing of the paint. Electricity data are provided by Soerensen (2012).
Less detailed data are available for the Tun Island Ferry, where only data on the total lightweight and the
weight of the engine were provided from Moellgaard (2012). The reason for the limited access to data for
the Tun Island Ferry is that this ferry is relatively old and because there is no direct contact with the
providing shipyard. For the Tun Island Ferry, it has been assumed that the use of machinery and equipment
is the same as for the Eco Island Ferry, with the following exceptions:
‐ The weight of the diesel engine for the Tun Island Ferry is 10,000 kg instead of 3,000 kg, which is the
weight for the Eco Island Ferry.
‐ The Tun Island Ferry has a ballast system, which the Eco Island Ferry does not have. The weight of the
ballast system is estimated as 800 kg steel and 200 kg engine (pumps).
‐ The Tun Island Ferry has an oil‐based heating system and not a ventilation/air‐conditioning system as
the Eco Island Ferry. However, the weight and material composition of the two systems is assumed to
be equal.
‐ Whenever, changes are introduced for the Tun Island this is counter balanced in the material input of
steel in order to maintain the total lightweight.
‐ It is assumed that the steel in the structure is distributed as 50% steel sheet and 50% steel section
bars.
‐ Insulation use in the Tun Island Ferry is assumed to be 60% of that used in the Eco Island Ferry. This
assumption is made because the Eco Island Ferry requires more insulation to meet fire safety
regulations. The assumption is made in collaboration with Hjortberg (2012).
The weight and material composition of the two ferry alternatives can be seen in Table 4.1. However, it
should be noted that Table 4.1 also includes material inputs that become waste at the shipyard, e.g. at
Danish Yachts the loss of all ingoing carbon fibre and resin is around 15% (Soerensen 2012). No data on the
material loss at the shipyard that produces the Tun Island Ferry are available. Therefore, it has roughly
been assumed that 5% of the input of steel sheet and section bars are lost and subsequently sent to
recycling.
According to Lindquist (2012, p 9), the production costs of the Eco Island and the Tun Island Ferries are 5.2
and 4.6 million EUR respectively. These prices are used as reference flows for including services and capital
goods at the shipyards.
The details of the life cycle inventory of each material are presented in the subsequent sections. In Table
4.1 reference is made to these descriptions. Notice that specific reference is made to all inputs of process
LCI data, while the inputs of services are not explicitly mentioned in Table 4.1. The services are included by
adding one additional row for each material/energy input and material for treatment in Table 4.1, which
26
accounting for the services related to the manufacturing and disposal of each product input. It is relatively
easy to identify which input‐output data represent each product input because the input‐output used here
follows international industry/product classifications that cover the entire economy, i.e. all
industries/products. Transport of the materials used in the ferry construction stage is included in the
service inputs to the shipyard.
Table 4.1: LCI‐data for the production of the Eco Island Ferry and the Tun Island Ferry. Notice that the inputs of services related to each material, energy and material for treatment are not shown here – this is described in section 3.6
Exchanges Unit Eco Island Ferry
Tun Island Ferry
LCI data
Reference flow
Ferry Pieces 1 1 Reference flow
Material inputs
Carbon fibre tonne 10.031 ‐ See section 4.1. Notice that this includes 15% loss at the shipyard. Hence 8.527 tonne remains in the ship and 1.505 tonne is loss.
Resin (vinylester) tonne 13.121 ‐ Epoxy resin, liquid, at plant/RER (ecoinvent 2010). Notice that this includes 15% loss at the shipyard. Hence 11.153 t remains in the ship and 1.968 is loss.
Core (PVC foam) tonne 7.420 ‐ See section 4.2
E glass (fibreglass) tonne 0.627 ‐ Glass fibre, at plant/RER (ecoinvent 2010)
Aluminium, sheet tonne 1.325 ‐ See section 4.3
Steel, sheet tonne 16.130 129.447 See section 4.4. For the Tun Island Ferry: There is an estimated 5% loss of the use of steel sheets for the structure. Hence 123.821 t remains in the ship and 5.626 t is loss.
Steel, section bar tonne ‐ 112.517 See section 4.4. For the Tun Island Ferry: There is an estimated 5% loss of the use of steel section bars for the structure. Hence 106.891 t remains in the ship and 5.626 t is loss.
Engine tonne 3.000 10.200 Gas motor 206kW/RER (ecoinvent 2010)
Electrical equipment tonne 1.965 same as Eco Electronics for control units/RER (ecoinvent 2010)
Cables tonne 3.460 same as Eco Cable, network cable, category 5, without plugs, at plant/GLO (ecoinvent 2010)
Transformers tonne 0.300 same as Eco Transformer, low voltage use, at plant/GLO (ecoinvent 2010)
Batteries tonne 0.900 same as Eco Battery, LiIo, rechargeable, prismatic, at plant/GLO
Insulation tonne 11.161 6.697 See section 4.6
Textiles tonne 2.000 same as Eco See section 4.7
Wood products tonne 0.650 same as Eco See section 4.8
Plastics products tonne 3.170 same as Eco See section 4.9
Ceramic products tonne 0.200 same as Eco Sanitary ceramics, at regional storage/CH (ecoinvent 2010)
Paint – solids and curing agent tonne 1.346 same as Eco See section 4.10
Service inputs at shipyard EUR 5,200,000 4,600,000 See section 3.6
Shipyard, capital goods EUR 5,200,000 4,600,000 See section 3.7
Energy inputs
Electricity, medium voltage, DK kWh 5,200 ‐ See section 3.1
Transport
Transport, lorry 16‐32 t tkm 0 0 Transport is generally included via the input of services to the shipyard. A large part hereof is related to wholesale, which uses significant amounts of transport services.
Material for treatment
Carbon fibre to incineration tonne 1.505 ‐ See section 7.2
Resin (vinylester) to incineration tonne 1.968 ‐ See section 7.2
Steel recycling tonne ‐ 11.252 See section 7.2
27
4.1 CarbonfibreCarbon fibre is used for the production of the Eco Island ferry. Data for carbon fibre is not available in
ecoinvent. A specific life cycle inventory based on literature data is carried out by Schmidt (2012) and Table
4.2 is also based on Schmidt (2012).
Table 4.2: LCI‐data for the production of carbon fibre. The LCI data (process data) are obtained from Griffing and Overcash (2010).
Inputs and outputs Amount Unit LCI data
Output of products
Carbon fibre 1.00 kg Reference product
Material inputs
Polyacrylonitrile (PAN precursor
fibre)
1.82 kg Polyacrylonitrile fibres (PAN), from acrylonitrile and methacrylate,
prod. mix, PAN w/o additives EU‐27 S; (ELCD 2008). Notice that an
error in this data set has been identified and corrected: In the
original data set the only CO2 emission is ‘Carbon dioxide, land
transformation’. This is corrected to ‘Carbon dioxide’.
Nitrogen 10.0 kg Nitrogen, liquid, at plant/RER (ecoinvent 2010)
Water 2.88 kg Tap water, at user/RER (ecoinvent 2010)
Sizing solids 0.0100 kg Epoxy resin, liquid, at plant/RER (ecoinvent 2010)
Sulphuric acid 0.0200 kg Sulphuric acid, liquid, at plant/RER (ecoinvent 2010)
Energy Use
Electricity, medium voltage, Europe 6.99 MJ See section 3.1
Capital goods 4E‐10 P Flat glass plant/RER/I U (ecoinvent 2010)
Process Emissions
Sulfuric acid 0.0199 kg Emission to water
Ethane 0.0000101 kg Emission to air
Ammonia 0.00116 kg Emission to air
Hydrogen cyanide 0.0157 Kg Emission to air
Carbon monoxide 0.00324 Kg Emission to air
Carbon dioxide 1.013 Kg Emission to air
4.2 Core:PVCfoamCore material/sections for the Eco Island Ferry construction are made of pre‐shaped PVC foam. The core
sections are produced at DIAB International in Sweden. The following LCI data for the production of pre‐
shaped PVC foam sections is based on Sandström and Karlsson (2012).
28
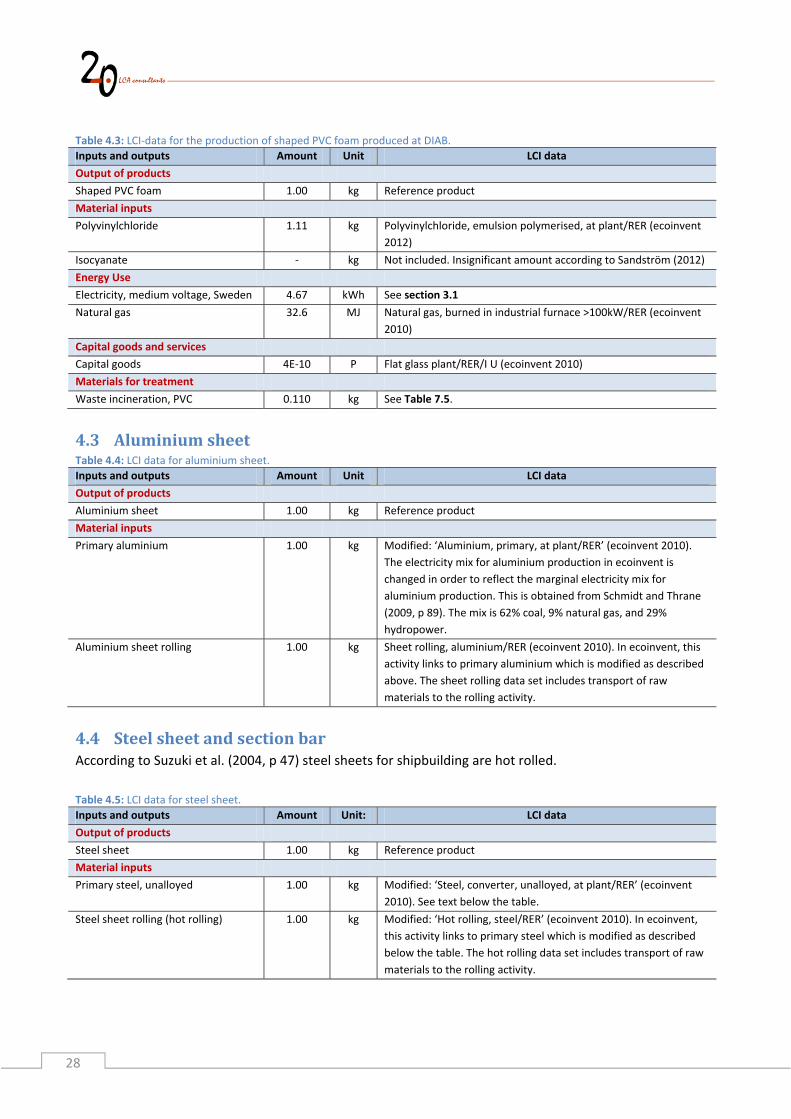
Table 4.3: LCI‐data for the production of shaped PVC foam produced at DIAB.
Inputs and outputs Amount Unit LCI data
Output of products
Shaped PVC foam 1.00 kg Reference product
Material inputs
Polyvinylchloride 1.11 kg Polyvinylchloride, emulsion polymerised, at plant/RER (ecoinvent
2012)
Isocyanate ‐ kg Not included. Insignificant amount according to Sandström (2012)
Energy Use
Electricity, medium voltage, Sweden 4.67 kWh See section 3.1
Natural gas 32.6 MJ Natural gas, burned in industrial furnace >100kW/RER (ecoinvent
2010)
Capital goods and services
Capital goods 4E‐10 P Flat glass plant/RER/I U (ecoinvent 2010)
Materials for treatment
Waste incineration, PVC 0.110 kg See Table 7.5.
4.3 AluminiumsheetTable 4.4: LCI data for aluminium sheet.
Inputs and outputs Amount Unit LCI data
Output of products
Aluminium sheet 1.00 kg Reference product
Material inputs
Primary aluminium 1.00 kg Modified: ‘Aluminium, primary, at plant/RER’ (ecoinvent 2010).
The electricity mix for aluminium production in ecoinvent is
changed in order to reflect the marginal electricity mix for
aluminium production. This is obtained from Schmidt and Thrane
(2009, p 89). The mix is 62% coal, 9% natural gas, and 29%
hydropower.
Aluminium sheet rolling 1.00 kg Sheet rolling, aluminium/RER (ecoinvent 2010). In ecoinvent, this
activity links to primary aluminium which is modified as described
above. The sheet rolling data set includes transport of raw
materials to the rolling activity.
4.4 SteelsheetandsectionbarAccording to Suzuki et al. (2004, p 47) steel sheets for shipbuilding are hot rolled.
Table 4.5: LCI data for steel sheet.
Inputs and outputs Amount Unit: LCI data
Output of products
Steel sheet 1.00 kg Reference product
Material inputs
Primary steel, unalloyed 1.00 kg Modified: ‘Steel, converter, unalloyed, at plant/RER’ (ecoinvent
2010). See text below the table.
Steel sheet rolling (hot rolling) 1.00 kg Modified: ‘Hot rolling, steel/RER’ (ecoinvent 2010). In ecoinvent,
this activity links to primary steel which is modified as described
below the table. The hot rolling data set includes transport of raw
materials to the rolling activity.
29
According to Schmidt (2005) primary steel is produced using the so‐called basic oxygen furnace (BOF)
technology. In this process, there is input of steel scrap, which is added for temperature control as well as
feedstock. Since the activity has inputs of iron ore/pig iron as well as steel scrap, the activity is a mixture of
recycling and primary production. A change in demand for steel will not affect the quantity of steel scrap
collected for recycling. Therefore, the activity is modified to exclude the recycling part. Steel recycling uses
the so‐called electric arc furnace (EAF) technology. The mixed primary / recycling activity ‘Steel, converter,
unalloyed, at plant/RER’ is modified to representing primary production only by reducing the product
output by the same quantity as the steel scrap input and by adding a negative input of the same quantity
steel produced by the EAF technology; ecoinvent activity: Steel, electric, un‐ and low‐alloyed, at plant/RER.
The modification is also described in Schmidt (2012, p 72).
Table 4.6: LCI data for steel section bar.
Inputs and outputs Amount Unit LCI data
Output of products
Steel section bar 1.00 kg Reference product
Material inputs
Primary steel, unalloyed 1.00 kg Modified ‘Steel, converter, unalloyed, at plant/RER’ (ecoinvent
2010). See above below the table.
Steel sheet rolling 1.00 kg Modified: ‘Section bar rolling, steel/RER’ (ecoinvent 2010). In
ecoinvent, this activity links to primary steel which is modified as
described above the table. The section bar rolling data set includes
transport of raw materials to the rolling activity.
30
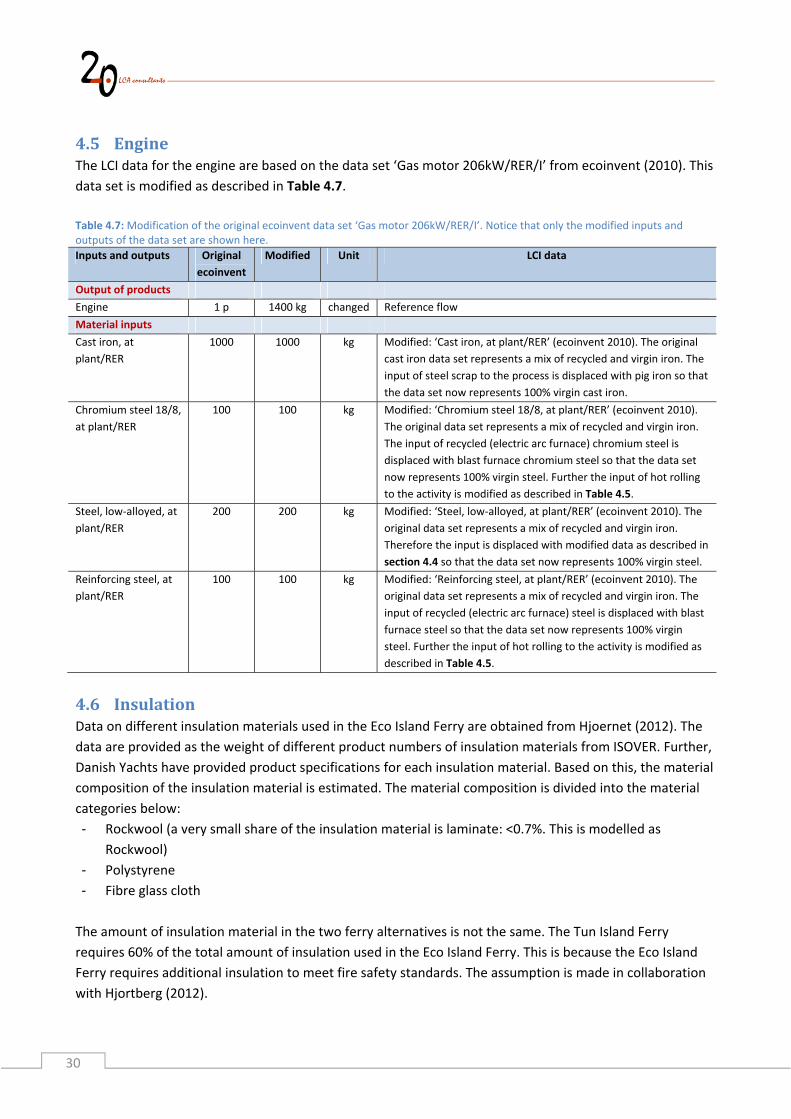
4.5 EngineThe LCI data for the engine are based on the data set ‘Gas motor 206kW/RER/I’ from ecoinvent (2010). This
data set is modified as described in Table 4.7.
Table 4.7: Modification of the original ecoinvent data set ‘Gas motor 206kW/RER/I’. Notice that only the modified inputs and outputs of the data set are shown here.
Inputs and outputs Original
ecoinvent
Modified Unit LCI data
Output of products
Engine 1 p 1400 kg changed Reference flow
Material inputs
Cast iron, at
plant/RER
1000 1000 kg Modified: ‘Cast iron, at plant/RER’ (ecoinvent 2010). The original
cast iron data set represents a mix of recycled and virgin iron. The
input of steel scrap to the process is displaced with pig iron so that
the data set now represents 100% virgin cast iron.
Chromium steel 18/8,
at plant/RER
100 100 kg Modified: ‘Chromium steel 18/8, at plant/RER’ (ecoinvent 2010).
The original data set represents a mix of recycled and virgin iron.
The input of recycled (electric arc furnace) chromium steel is
displaced with blast furnace chromium steel so that the data set
now represents 100% virgin steel. Further the input of hot rolling
to the activity is modified as described in Table 4.5.
Steel, low‐alloyed, at
plant/RER
200 200 kg Modified: ‘Steel, low‐alloyed, at plant/RER’ (ecoinvent 2010). The
original data set represents a mix of recycled and virgin iron.
Therefore the input is displaced with modified data as described in
section 4.4 so that the data set now represents 100% virgin steel.
Reinforcing steel, at
plant/RER
100 100 kg Modified: ‘Reinforcing steel, at plant/RER’ (ecoinvent 2010). The
original data set represents a mix of recycled and virgin iron. The
input of recycled (electric arc furnace) steel is displaced with blast
furnace steel so that the data set now represents 100% virgin
steel. Further the input of hot rolling to the activity is modified as
described in Table 4.5.
4.6 InsulationData on different insulation materials used in the Eco Island Ferry are obtained from Hjoernet (2012). The
data are provided as the weight of different product numbers of insulation materials from ISOVER. Further,
Danish Yachts have provided product specifications for each insulation material. Based on this, the material
composition of the insulation material is estimated. The material composition is divided into the material
categories below:
‐ Rockwool (a very small share of the insulation material is laminate: <0.7%. This is modelled as
Rockwool)
‐ Polystyrene
‐ Fibre glass cloth
The amount of insulation material in the two ferry alternatives is not the same. The Tun Island Ferry
requires 60% of the total amount of insulation used in the Eco Island Ferry. This is because the Eco Island
Ferry requires additional insulation to meet fire safety standards. The assumption is made in collaboration
with Hjortberg (2012).
31
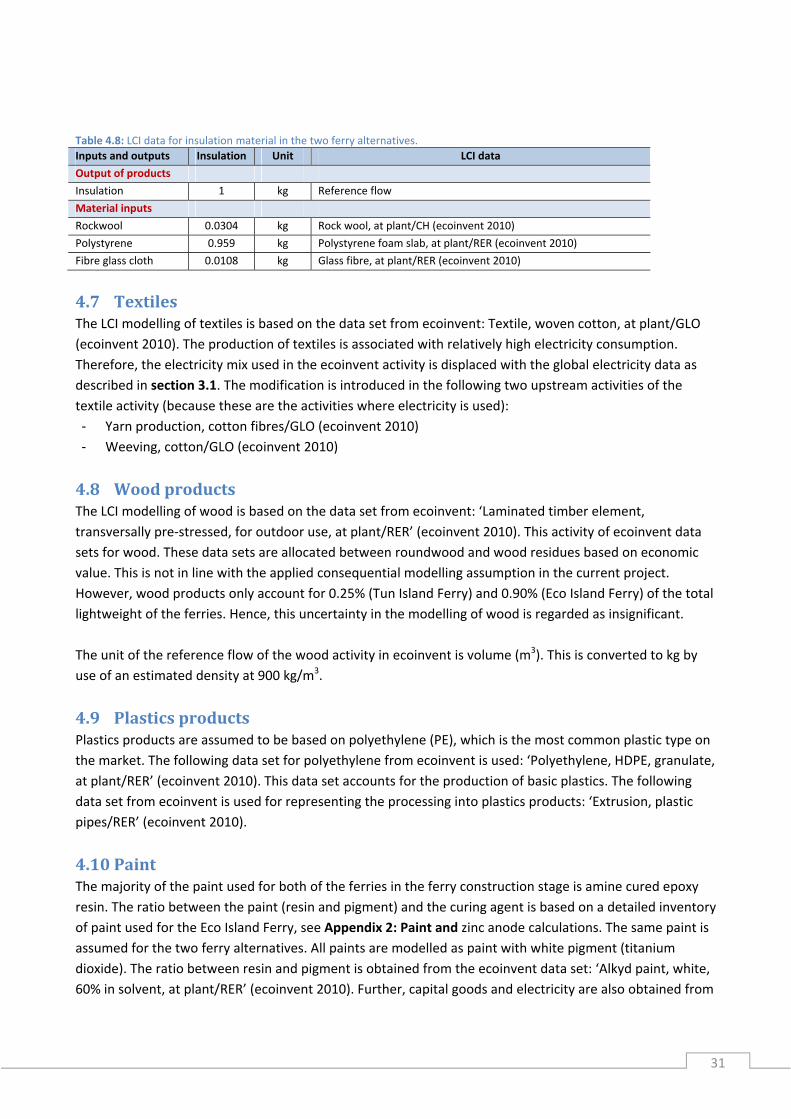
Table 4.8: LCI data for insulation material in the two ferry alternatives.
Inputs and outputs Insulation Unit LCI data
Output of products
Insulation 1 kg Reference flow
Material inputs
Rockwool 0.0304 kg Rock wool, at plant/CH (ecoinvent 2010)
Polystyrene 0.959 kg Polystyrene foam slab, at plant/RER (ecoinvent 2010)
Fibre glass cloth 0.0108 kg Glass fibre, at plant/RER (ecoinvent 2010)
4.7 TextilesThe LCI modelling of textiles is based on the data set from ecoinvent: Textile, woven cotton, at plant/GLO
(ecoinvent 2010). The production of textiles is associated with relatively high electricity consumption.
Therefore, the electricity mix used in the ecoinvent activity is displaced with the global electricity data as
described in section 3.1. The modification is introduced in the following two upstream activities of the
textile activity (because these are the activities where electricity is used):
4.8 WoodproductsThe LCI modelling of wood is based on the data set from ecoinvent: ‘Laminated timber element,
transversally pre‐stressed, for outdoor use, at plant/RER’ (ecoinvent 2010). This activity of ecoinvent data
sets for wood. These data sets are allocated between roundwood and wood residues based on economic
value. This is not in line with the applied consequential modelling assumption in the current project.
However, wood products only account for 0.25% (Tun Island Ferry) and 0.90% (Eco Island Ferry) of the total
lightweight of the ferries. Hence, this uncertainty in the modelling of wood is regarded as insignificant.
The unit of the reference flow of the wood activity in ecoinvent is volume (m3). This is converted to kg by
use of an estimated density at 900 kg/m3.
4.9 PlasticsproductsPlastics products are assumed to be based on polyethylene (PE), which is the most common plastic type on
the market. The following data set for polyethylene from ecoinvent is used: ‘Polyethylene, HDPE, granulate,
at plant/RER’ (ecoinvent 2010). This data set accounts for the production of basic plastics. The following
data set from ecoinvent is used for representing the processing into plastics products: ‘Extrusion, plastic
pipes/RER’ (ecoinvent 2010).
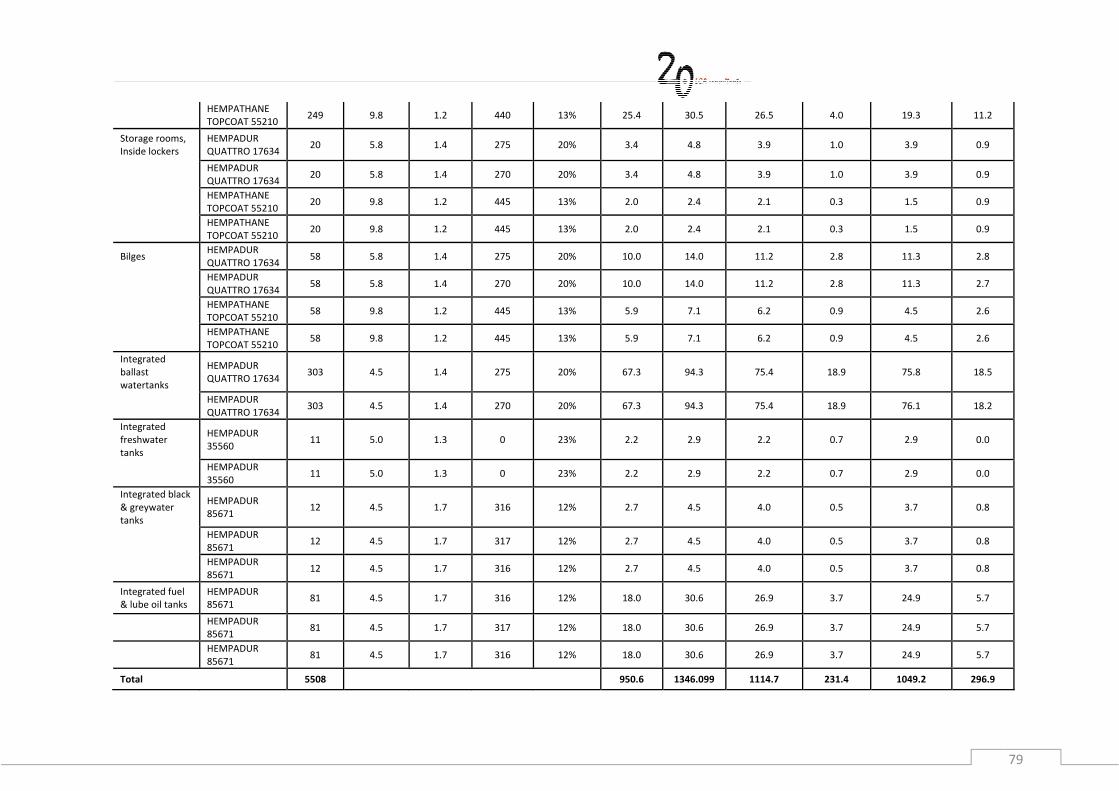
4.10 PaintThe majority of the paint used for both of the ferries in the ferry construction stage is amine cured epoxy
resin. The ratio between the paint (resin and pigment) and the curing agent is based on a detailed inventory
of paint used for the Eco Island Ferry, see Appendix 2: Paint and zinc anode calculations. The same paint is
assumed for the two ferry alternatives. All paints are modelled as paint with white pigment (titanium
dioxide). The ratio between resin and pigment is obtained from the ecoinvent data set: ‘Alkyd paint, white,
60% in solvent, at plant/RER’ (ecoinvent 2010). Further, capital goods and electricity are also obtained from
32
this data set. The NMVOC emissions from paint application are calculated based on the amounts (litre),
densities and VOC‐content of the different paints, see Appendix 2: Paint and zinc anode calculations.
Table 4.9: LCI data for paint, including NMVOC emissions from application.
Inputs and outputs Amount Unit LCI data
Output of products
Paint 1 kg Reference flow
Material inputs
Epoxy resin 0.407 kg Alkyd resin, long oil, 70% in white spirit, at plant/RER (ecoinvent
2010)
Pigment 0.421 kg Titanium dioxide, production mix, at plant/RER (ecoinvent 2010)
Amine curing agent 0.172 kg Trimethylamine, at plant/RER (ecoinvent 2010)
Energy inputs
Electricity, medium voltage,
Europe
0.0428 kWh See section 3.1
Capital goods and services
Capital goods 4.00E‐10 p Chemical plant, organics/RER/I (ecoinvent 2010)
Emissions
NMVOC 0.221 kg Quantity of VOC from paint; see Appendix 2: Paint and zinc anode
calculations
33
5. Lifecycleinventory:shipyard,maintenanceMaintenance of the ferry includes painting for general surface protection and anti‐corrosion, use of zinc
anodes for anti‐corrosion and general maintenance in shipyard. Specific data on the use of paint are
obtained from the Tun Island Ferry (Moellgaard 2012) and a similar use has been assumed for the Eco
Island Ferry. This is an overestimation of the paint use for the Eco Island Ferry because there is almost no
need for anti‐corrosion applications.
Specific data on the annual use of zinc anodes are obtained from the Eco Island Ferry (Hjortberg 2012) and
the Tun Island Ferry (Moellgaard 2012). In collaboration with Hjoernet (2012), it has been assumed that
50% of the initial weight of the zinc in the zinc anodes is emitted to seawater during operation. This
emission is included in the operation stage in chapter 1. The remaining weight of the zinc after use is
assumed to be recycled. The total weight of the steel in the zinc anode is assumed to be recycled after use.
According to Lindquist (2012, p 11), the maintenance costs of the Eco Island and the Tun Island Ferries are
35,000 and 71,000 EUR respectively. These prices are used as reference flows for including services and
capital goods at the shipyards.
In Table 5.1, notice that specific reference is made to all inputs of process LCI data, while the inputs of
services are not explicitly mentioned. The services are included by adding one additional row for each
material input and material for treatment in the table accounting for the services related to the
manufacturing and disposal of each product input. It is relatively easy to identify which input‐output data
that represent each product input because the used input‐output follows international industry/product
classifications that cover the entire economy, i.e. all industries/products. Transport of the materials used in
the maintenance stage is included in the service inputs to the shipyard.
34
Table 5.1: LCI‐data for the maintenance of the Eco Island Ferry and the Tun Island Ferry. Notice that the inputs of services related to each material, energy and material for treatment are not shown here – this is described in section 3.5.
Exchanges Unit Eco Island Ferry
Tun Island Ferry
LCI data
Reference flow
Ferry maintenance year 1 1 Reference flow
Material inputs
Zinc anode – zinc kg 18.3 107 Modified: Zinc, primary, at regional storage/RER (ecoinvent 2010). The electricity mix for zinc production in ecoinvent is changed in order to reflect the marginal global electricity mix (see section 3.1)
Zinc anode ‐ steel kg 1.69 9.80 See Table 4.5
Paint kg 505 505 See Table 5.2
Service inputs at shipyard
EUR 35,000 71,000 See section 3.5
Shipyard, capital goods EUR 35,000 71,000 See section 3.7
Transport
Transport, lorry 16‐32 t tkm 0 0 Transport is generally included via the input of services to the shipyard. A large part hereof is related to wholesale, which uses significant amounts of transport services.
Materials for treatment
Recycling of zinc in spent zinc anode
kg 9.16 53.3 See section 7.1
Recycling of steel in spent zinc anode
kg 1.69 9.80 See section 7.1
The majority of the paint used for both of the ferries in the ferry maintenance stage is amine cured epoxy
resin. The ratio between the paint (resin and pigment) and the curing agent is based on a detailed inventory
of paint used for the Tun Island Ferry, see Appendix 2: Paint and zinc anode calculations. The same paint is
assumed for the two ferry alternatives. All paints are modelled as paint with white pigment (titanium
dioxide). The ratio between resin and pigment is obtained from the ecoinvent data set: ‘Alkyd paint, white,
60% in solvent, at plant/RER’ (ecoinvent 2010). Further, capital goods and electricity are also obtained from
this data set. The NMVOC emissions from paint application are calculated based on the amounts (litre),
densities and VOC‐content of the different paints, see Appendix 2: Paint and zinc anode calculations.
35
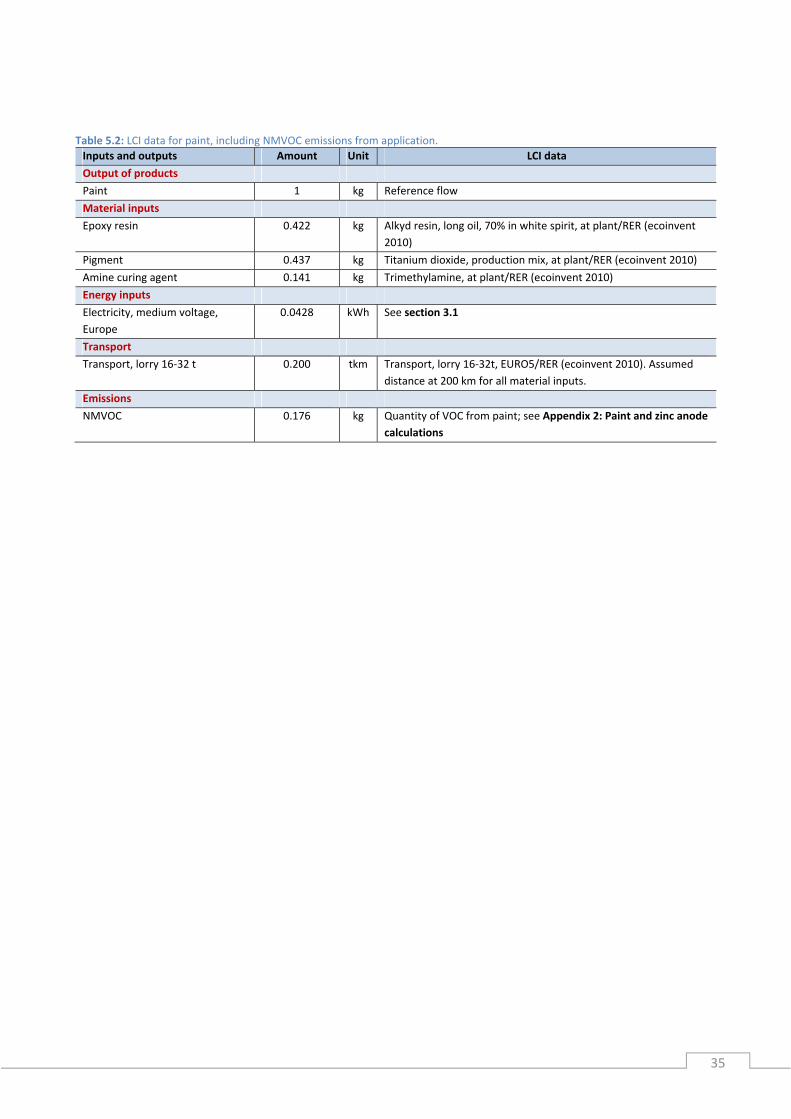
Table 5.2: LCI data for paint, including NMVOC emissions from application.
Inputs and outputs Amount Unit LCI data
Output of products
Paint 1 kg Reference flow
Material inputs
Epoxy resin 0.422 kg Alkyd resin, long oil, 70% in white spirit, at plant/RER (ecoinvent
2010)
Pigment 0.437 kg Titanium dioxide, production mix, at plant/RER (ecoinvent 2010)
Amine curing agent 0.141 kg Trimethylamine, at plant/RER (ecoinvent 2010)
NMVOC 0.176 kg Quantity of VOC from paint; see Appendix 2: Paint and zinc anode
calculations
37
6. Lifecycleinventory:FerryoperationThe ferry operation stage includes the use and combustion of diesel and lubricants, electricity and
emissions of zinc from the zinc anode. Services related to tickets sale, marketing, webpage etc. are not
included for this stage. Data on the annual use of diesel are provided by Sørensen (2012), see Table 6.2.
According to Hjortberg (2012), the use of lubricants can be estimated as 1.6 kg per tonne diesel for new
engines and 3.2 kg per tonne diesel for older engines. The average at 2.4 kg per tonne diesel is applied.
The total use of zinc anodes is described in section 5. It has been assumed that 50% of the weight of the
original zinc in the zinc anode is emitted to sea water.
A potential significant emission from the operation stage of ships is the emission of anti‐fouling agents to
sea water, e.g. tributyl tin oxide or copper (Thrane 2004). The Eco and Tun Island Ferries use
nanotechnology anti‐fouling coatings. According to Szewczyk (2010), there are generally no hazardous
emissions associated with nanotechnology anti‐fouling agents. Therefore, no of such emissions are included
in the study.
Table 6.1: LCI‐data for the maintenance of the Eco Island Ferry and the Tun Island Ferry. Notice that the inputs of services related to the production of lubricants, diesel and electricity are not shown here – this is described in section 3.5.
Exchanges Unit Eco Island Ferry
Tun Island Ferry
LCI data
Reference flow
Ferry operation year 1 1 Reference flow
Material inputs
Lubricants litre 178 357 See section 3.5
Energy inputs
Diesel incl. combustion litre 74,340 148,792 See section 3.4
Electricity, medium voltage, DK kWh 73,600 65,472 See section 3.1
Transport
Transport, lorry 16‐32 t tkm 12,966 25,952 Transport, lorry 16‐32t, EURO5/RER U. Assumed distance at 200 km for all material inputs. The mass of diesel is calculated using the density at 0.87 kg/litre (Andersen et al. 1981).
Emissions to water
Zinc kg 9.16 53.3 emission to water
Diesel and fuel oil consumption data is provided by Soerensen (2012) and is presented below in Table 6.2.
Table 6.2: Diesel/fuel oil consumption per year for the two ferry alternatives (Soerensen 2012).
Diesel/fuel oil consumption Eco Island Ferry Tun Island ferry
Main engines at 9.5 knots 41.4 litre/hour 90 litre/hour
Generator per hour (air condition etc.) 11.7 litre/hour 10 litre/hour
Total per voyage (2 hours per out and return trip) 106.2 litre 200 litre
Total per year (700 voyages/year) 74,340 litre 140,000 litre
Consumption in harbor per year (air condition etc.) 0 litre 8,792 litre
Total consumption per year 74,340 litre 148,792 litre
39
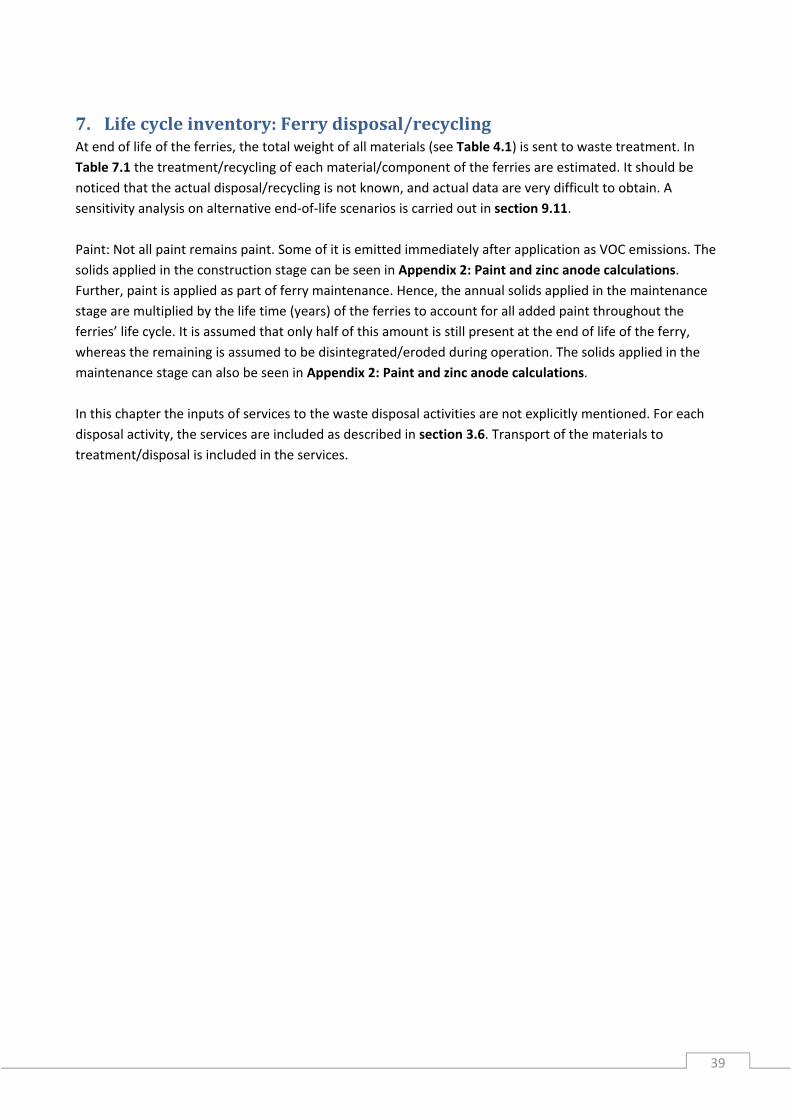
7. Lifecycleinventory:Ferrydisposal/recyclingAt end of life of the ferries, the total weight of all materials (see Table 4.1) is sent to waste treatment. In
Table 7.1 the treatment/recycling of each material/component of the ferries are estimated. It should be
noticed that the actual disposal/recycling is not known, and actual data are very difficult to obtain. A
sensitivity analysis on alternative end‐of‐life scenarios is carried out in section 9.11.
Paint: Not all paint remains paint. Some of it is emitted immediately after application as VOC emissions. The
solids applied in the construction stage can be seen in Appendix 2: Paint and zinc anode calculations.
Further, paint is applied as part of ferry maintenance. Hence, the annual solids applied in the maintenance
stage are multiplied by the life time (years) of the ferries to account for all added paint throughout the
ferries’ life cycle. It is assumed that only half of this amount is still present at the end of life of the ferry,
whereas the remaining is assumed to be disintegrated/eroded during operation. The solids applied in the
maintenance stage can also be seen in Appendix 2: Paint and zinc anode calculations.
In this chapter the inputs of services to the waste disposal activities are not explicitly mentioned. For each
disposal activity, the services are included as described in section 3.6. Transport of the materials to
treatment/disposal is included in the services.
40
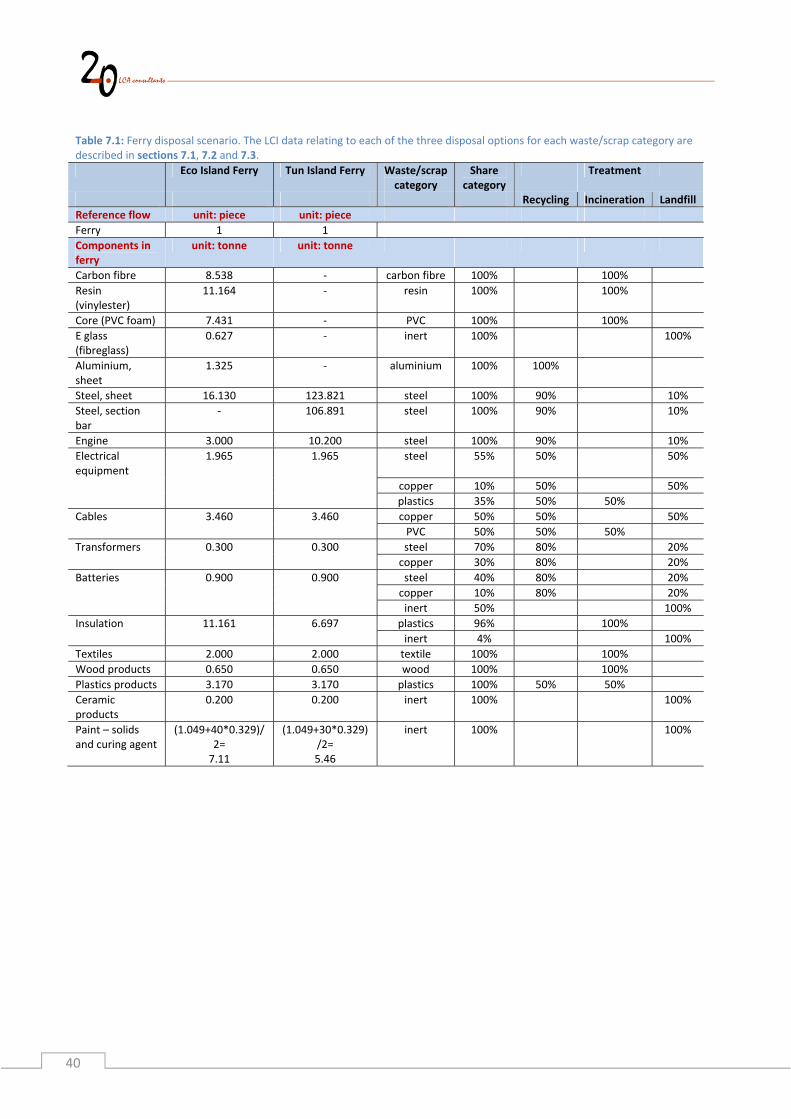
Table 7.1: Ferry disposal scenario. The LCI data relating to each of the three disposal options for each waste/scrap category are described in sections 7.1, 7.2 and 7.3.
Eco Island Ferry Tun Island Ferry Waste/scrap category
7.1 RecyclingIn this section the LCI data for recycling of different relevant scrap/waste materials are described.
Generally, recycling if the different materials are assumed to take place in Europe. When services are
included (see section 3.6), this is done for European industries.
Table 7.2: LCI data for recycling of different waste fractions. The data are further described below the table. In addition to the data in the table, lorry transport of the scrap/waste to the recycling plant at estimated 200 km is included: Transport, lorry 16‐32t, EURO5/RER (ecoinvent 2010).
Waste/scrap fraction to
recycling
Material
recovery
rate
Data source for recycling activity Data source for the displaced virgin
material
Plastics, polyethylene (PE) to
recycling
88% Schmidt (2005, p 105), see detailed
description in Table 7.3.
See Table 7.3
Iron and steel scrap to
recycling
90% Steel, electric, un‐ and low‐alloyed, at
plant/RER. Original ecoinvent activity
modified, see text below table.
Primary steel (not rolled) as
described in section 4.4
Aluminium scrap to recycling 97% Aluminium, secondary, from old scrap, at
plant/RER. Original ecoinvent activity
modified, see text below table.
Primary aluminium (not rolled) as
described in section 4.3
Copper scrap to recycling 76% Copper, secondary, at refinery/RER.
Original ecoinvent activity modified, see
text below table.
Copper, primary, at refinery/GLO
(ecoinvent 2010)
Zinc scrap to recycling 76% Copper, secondary, at refinery/RER.
Original ecoinvent activity modified, see
text below table.
Modified: Zinc, primary, at regional
storage/RER (ecoinvent 2010). The
electricity mix for zinc production in
ecoinvent is changed in order to
reflect the marginal global electricity
mix (see section 3.1)
Inert waste to recycling (used
as filler material)
100% Based on parts of ecoinvent activity:
Gravel, crushed, at mine/CH. Only the
parts of the activity that relates to the
crushing is included.
Sand, at mine/CH (ecoinvent 2010)
Material recovery efficiency for plastic scrap is obtained from Schmidt (2012). A material recovery
efficiency of 88% means that 1 kg plastics waste/scrap which is sent to recycling is reprocessed into 0.88 kg
new plastics and 0.12 kg processing waste. The efficiencies of metals are given below;
‐ recovery of iron/steel scrap: efficiency is 90% (based on Classen et al. 2009)
‐ recovery efficiency of aluminium scrap is 97% (based on Classen et al. 2009)
‐ recovery efficiency of copper is 76% (based on Classen et al. 2009)
‐ recovery efficiency of zinc is assumed the same as for copper
‐ when inert material is used as filler material no loss is considered, i.e. the efficiency is 100% (based on
Schmidt 2012)
The inventory data used for the modelling of recycling of plastics scrap in Table 7.2 are described in detail
in Table 7.3 below. Schmidt (2012) assumes that 50% of all plastic waste that is collected for recycling, is
recycled in Denmark and that the remaining is recycled in China. It is assumed that process waste in
Denmark is incinerated, while it is assumed that in China it is sent to landfill.
42
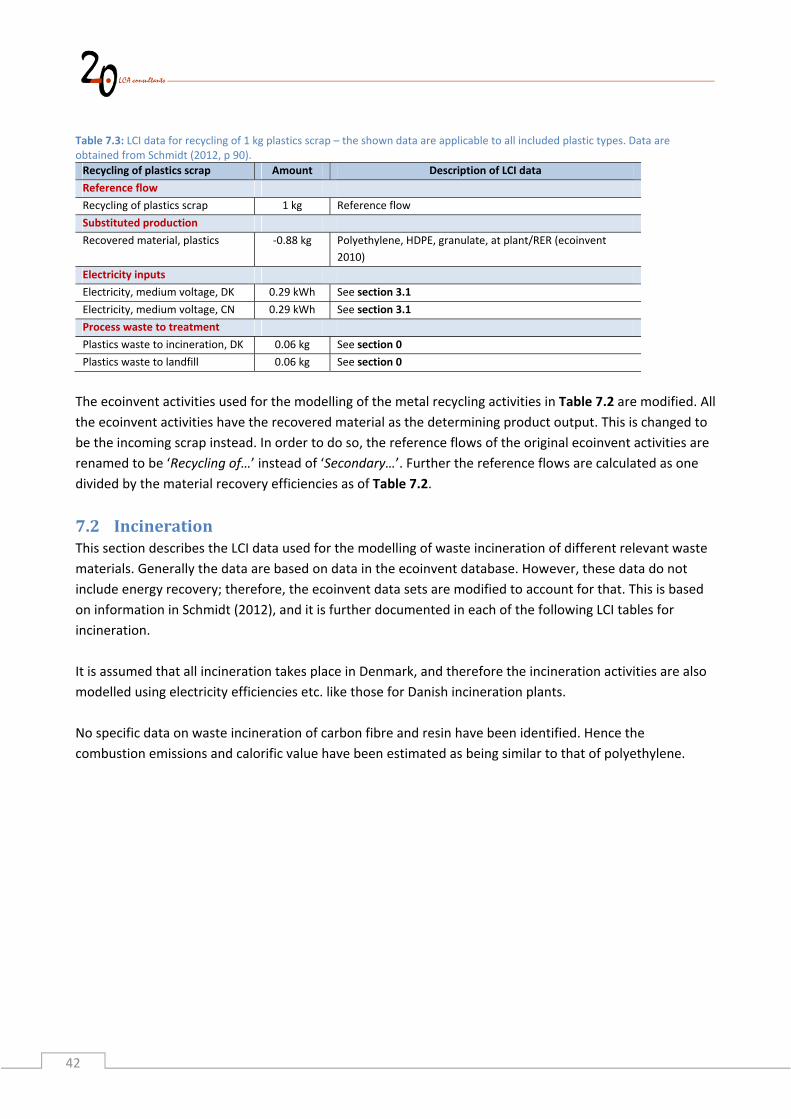
Table 7.3: LCI data for recycling of 1 kg plastics scrap – the shown data are applicable to all included plastic types. Data are obtained from Schmidt (2012, p 90).
Recycling of plastics scrap Amount Description of LCI data
Reference flow
Recycling of plastics scrap 1 kg Reference flow
Substituted production
Recovered material, plastics ‐0.88 kg Polyethylene, HDPE, granulate, at plant/RER (ecoinvent
2010)
Electricity inputs
Electricity, medium voltage, DK 0.29 kWh See section 3.1
Electricity, medium voltage, CN 0.29 kWh See section 3.1
Process waste to treatment
Plastics waste to incineration, DK 0.06 kg See section 0
Plastics waste to landfill 0.06 kg See section 0
The ecoinvent activities used for the modelling of the metal recycling activities in Table 7.2 are modified. All
the ecoinvent activities have the recovered material as the determining product output. This is changed to
be the incoming scrap instead. In order to do so, the reference flows of the original ecoinvent activities are
renamed to be ‘Recycling of…’ instead of ‘Secondary…’. Further the reference flows are calculated as one
divided by the material recovery efficiencies as of Table 7.2.
7.2 IncinerationThis section describes the LCI data used for the modelling of waste incineration of different relevant waste
materials. Generally the data are based on data in the ecoinvent database. However, these data do not
include energy recovery; therefore, the ecoinvent data sets are modified to account for that. This is based
on information in Schmidt (2012), and it is further documented in each of the following LCI tables for
incineration.
It is assumed that all incineration takes place in Denmark, and therefore the incineration activities are also
modelled using electricity efficiencies etc. like those for Danish incineration plants.
No specific data on waste incineration of carbon fibre and resin have been identified. Hence the
combustion emissions and calorific value have been estimated as being similar to that of polyethylene.
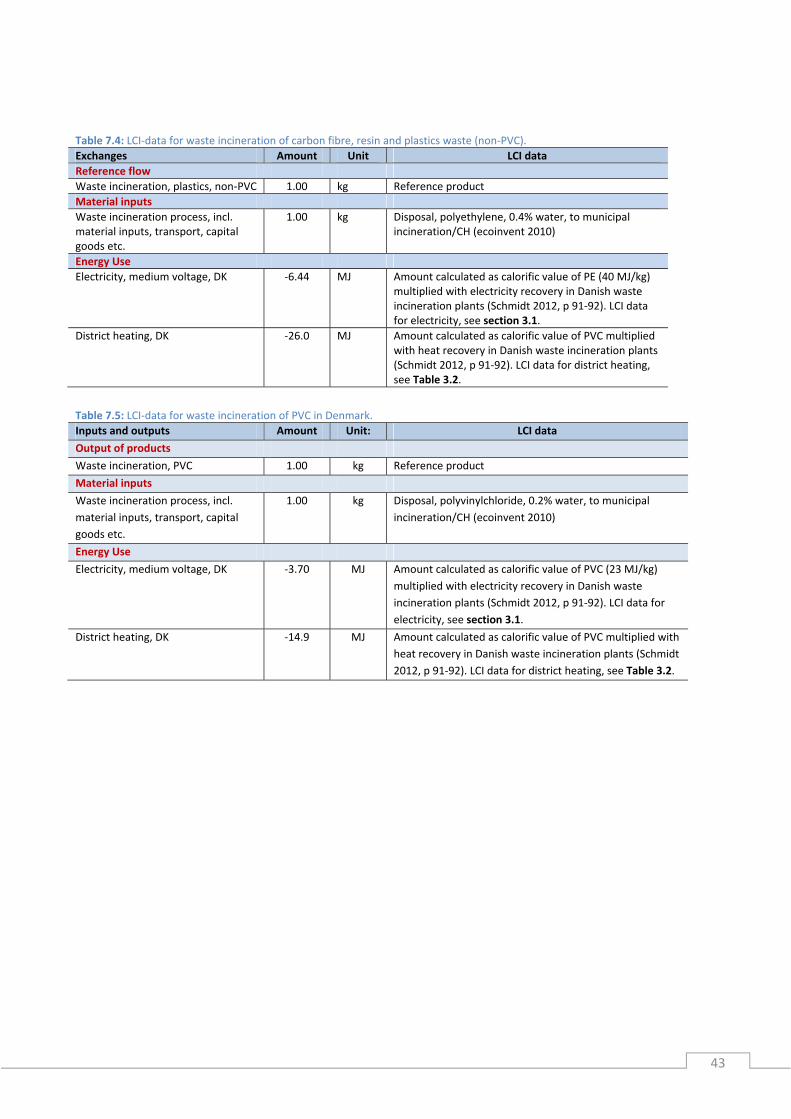
43
Table 7.4: LCI‐data for waste incineration of carbon fibre, resin and plastics waste (non‐PVC).
Exchanges Amount Unit LCI data
Reference flow
Waste incineration, plastics, non‐PVC 1.00 kg Reference product
Material inputs
Waste incineration process, incl. material inputs, transport, capital goods etc.
1.00 kg Disposal, polyethylene, 0.4% water, to municipal incineration/CH (ecoinvent 2010)
Energy Use
Electricity, medium voltage, DK ‐6.44 MJ Amount calculated as calorific value of PE (40 MJ/kg) multiplied with electricity recovery in Danish waste incineration plants (Schmidt 2012, p 91‐92). LCI data for electricity, see section 3.1.
District heating, DK ‐26.0 MJ Amount calculated as calorific value of PVC multiplied with heat recovery in Danish waste incineration plants (Schmidt 2012, p 91‐92). LCI data for district heating, see Table 3.2.
Table 7.5: LCI‐data for waste incineration of PVC in Denmark.
Inputs and outputs Amount Unit: LCI data
Output of products
Waste incineration, PVC 1.00 kg Reference product
Material inputs
Waste incineration process, incl.
material inputs, transport, capital
goods etc.
1.00 kg Disposal, polyvinylchloride, 0.2% water, to municipal
incineration/CH (ecoinvent 2010)
Energy Use
Electricity, medium voltage, DK ‐3.70 MJ Amount calculated as calorific value of PVC (23 MJ/kg)
multiplied with electricity recovery in Danish waste
incineration plants (Schmidt 2012, p 91‐92). LCI data for
electricity, see section 3.1.
District heating, DK ‐14.9 MJ Amount calculated as calorific value of PVC multiplied with
heat recovery in Danish waste incineration plants (Schmidt
2012, p 91‐92). LCI data for district heating, see Table 3.2.
44
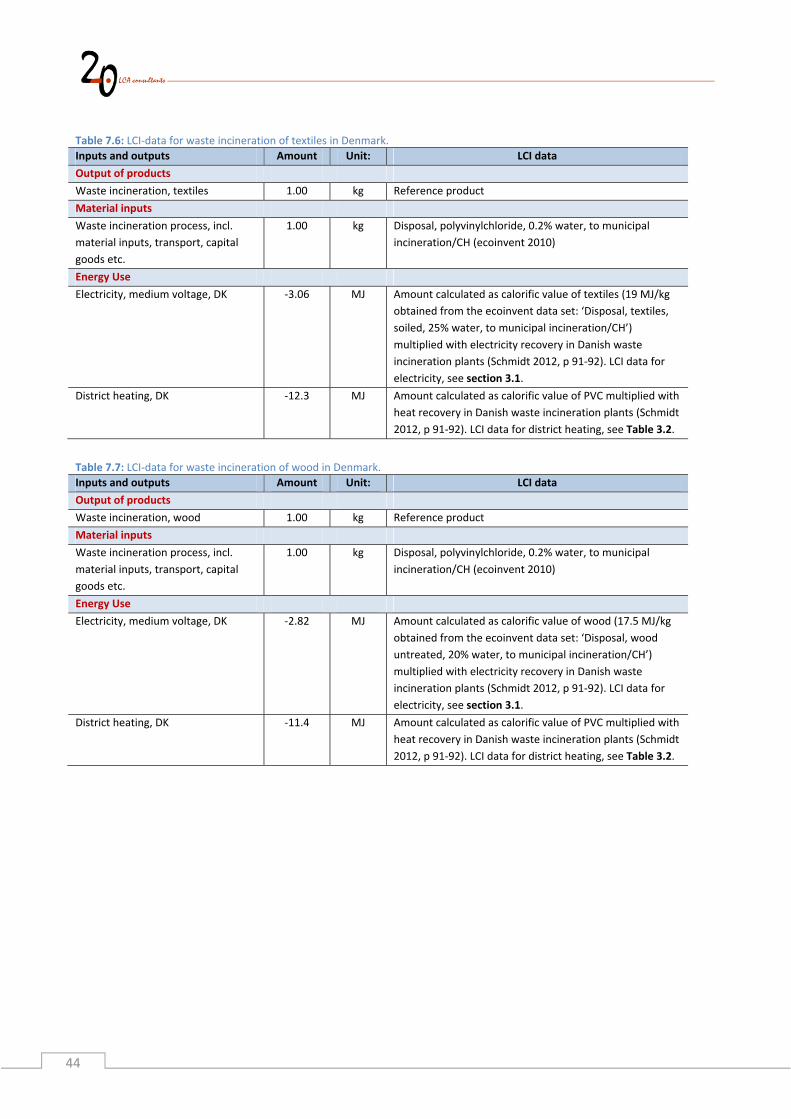
Table 7.6: LCI‐data for waste incineration of textiles in Denmark.
Inputs and outputs Amount Unit: LCI data
Output of products
Waste incineration, textiles 1.00 kg Reference product
Material inputs
Waste incineration process, incl.
material inputs, transport, capital
goods etc.
1.00 kg Disposal, polyvinylchloride, 0.2% water, to municipal
incineration/CH (ecoinvent 2010)
Energy Use
Electricity, medium voltage, DK ‐3.06 MJ Amount calculated as calorific value of textiles (19 MJ/kg
obtained from the ecoinvent data set: ‘Disposal, textiles,
soiled, 25% water, to municipal incineration/CH’)
multiplied with electricity recovery in Danish waste
incineration plants (Schmidt 2012, p 91‐92). LCI data for
electricity, see section 3.1.
District heating, DK ‐12.3 MJ Amount calculated as calorific value of PVC multiplied with
heat recovery in Danish waste incineration plants (Schmidt
2012, p 91‐92). LCI data for district heating, see Table 3.2.
Table 7.7: LCI‐data for waste incineration of wood in Denmark.
Inputs and outputs Amount Unit: LCI data
Output of products
Waste incineration, wood 1.00 kg Reference product
Material inputs
Waste incineration process, incl.
material inputs, transport, capital
goods etc.
1.00 kg Disposal, polyvinylchloride, 0.2% water, to municipal
incineration/CH (ecoinvent 2010)
Energy Use
Electricity, medium voltage, DK ‐2.82 MJ Amount calculated as calorific value of wood (17.5 MJ/kg
obtained from the ecoinvent data set: ‘Disposal, wood
untreated, 20% water, to municipal incineration/CH’)
multiplied with electricity recovery in Danish waste
incineration plants (Schmidt 2012, p 91‐92). LCI data for
electricity, see section 3.1.
District heating, DK ‐11.4 MJ Amount calculated as calorific value of PVC multiplied with
heat recovery in Danish waste incineration plants (Schmidt
2012, p 91‐92). LCI data for district heating, see Table 3.2.
45
7.3 LandfillLandfill for the relevant waste materials is modelled using the LCI data specified below. Generally,
landfilling of the different materials is assumed to take place in Europe. This is because it is typically a
fraction of the components/materials that is sent to recycling, i.e. impurities, poor quality scrap etc., that
ends up being landfilled – and recycling is generally assumed to take place in Europe. When services are
included (see section 3.6), this is done for European industries.
Table 7.8: LCI‐data for landfill for different waste materials.
8. Results:LifeCycleImpactAssessmentIn this section the results of the LCA are presented.
8.1 OverallcharacterisedandweightedresultsofthetwoferryalternativesThe characterised results for the two ferry alternatives are shown in Table 8.1 below.
Table 8.1: Characterised results for the two ferry alternatives. The results represent the functional unit: servicing the Tunø ferry route in one year.
Impact category Unit Eco Island Ferry Tun Island Ferry
Global warming kg CO2‐eq 295,154 546,305
Human toxicity, carcinogens kg C2H3Cl‐eq 1,036 3,421
Human toxicity, non‐carc. kg C2H3Cl‐eq 3,243 10,499
Respiratory inorganics kg PM2.5‐eq 613 1,193
Ionizing radiation Bq C‐14‐eq 865,267 1,493,367
Ozone layer depletion kg CFC‐11‐eq 0.034 0.064
Ecotoxicity, aquatic kg TEG‐eq w 17,909,827 83,764,965
Ecotoxicity, terrestrial kg TEG‐eq s 729,854 1,460,375
Non‐renewable energy MJ primary 4,331,095 7,953,873
Mineral extraction MJ extra 555 1,367
The comparison of the two ferry alternatives in Table 8.1 is presented in a chart below (Figure 8.1) showing
the relative difference.
Figure 8.1: Comparison of the two ferry alternatives showing the relative difference.
0%
20%
40%
60%
80%
100%
Global warming
Human
toxicity, carcinogens
Human
toxicity, non‐carc.
Respiratory inorganics
Ionizing radiation
Ozone layer depletion
Ecotoxicity, aquatic
Ecotoxicity, terrestrial
Nature occupation
Acidification
Eutrophication, aquatic
Eutrophication, terrestrial
Respiratory organics
Photochem
ical ozone, vegetat.
Non‐renewable energy
Mineral extraction
Eco Island Ferry
Tun Island Ferry
48
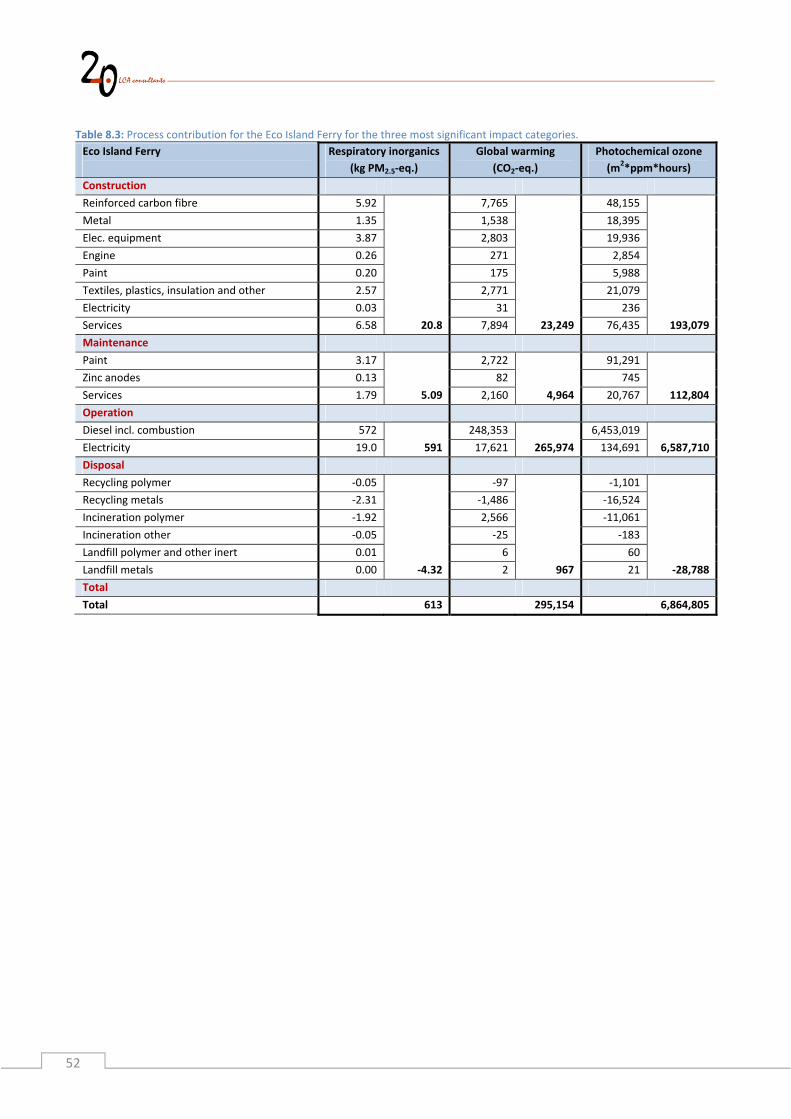
It appears from the comparison of the overall characterised results that the Eco Island Ferry performs
better than the Tun Island Ferry for all impact categories. Generally, the impacts related to the life cycle of
the Eco Island Ferry are around the half of the impacts of the Tun Island Ferry. The explanation of the
difference is related to the reduced fuel consumption in the Eco Island Ferry.
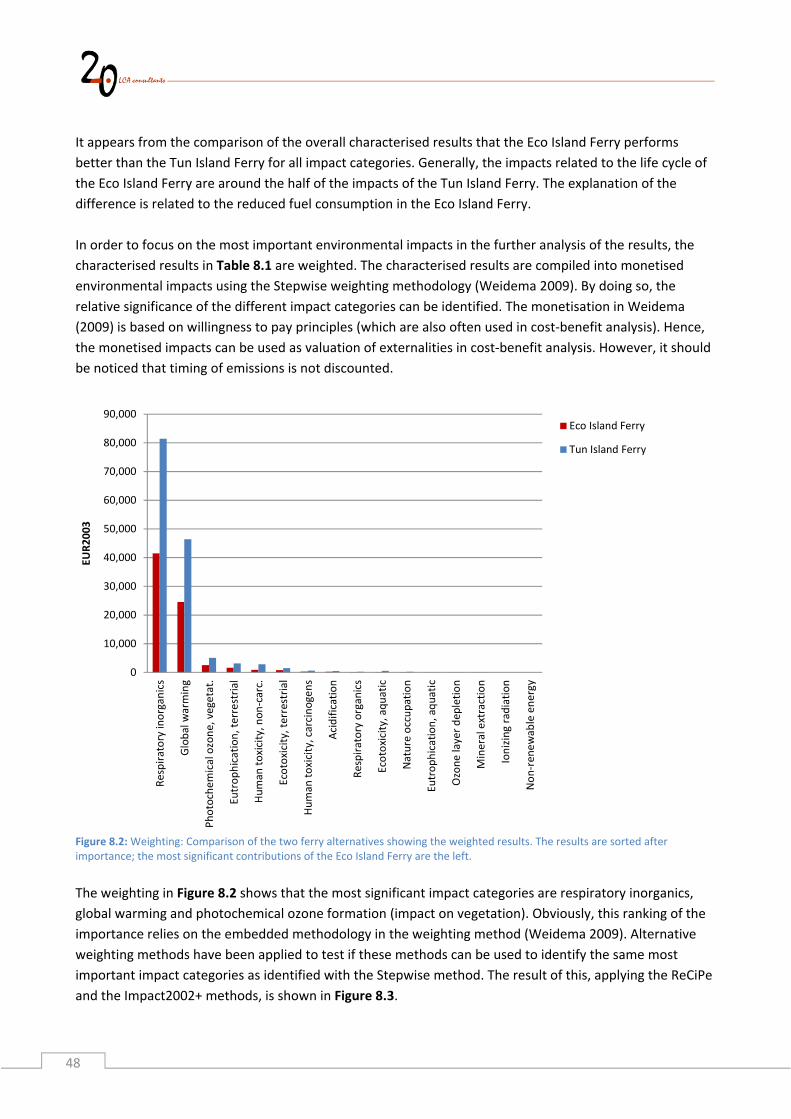
In order to focus on the most important environmental impacts in the further analysis of the results, the
characterised results in Table 8.1 are weighted. The characterised results are compiled into monetised
environmental impacts using the Stepwise weighting methodology (Weidema 2009). By doing so, the
relative significance of the different impact categories can be identified. The monetisation in Weidema
(2009) is based on willingness to pay principles (which are also often used in cost‐benefit analysis). Hence,
the monetised impacts can be used as valuation of externalities in cost‐benefit analysis. However, it should
be noticed that timing of emissions is not discounted.
Figure 8.2: Weighting: Comparison of the two ferry alternatives showing the weighted results. The results are sorted after importance; the most significant contributions of the Eco Island Ferry are the left.
The weighting in Figure 8.2 shows that the most significant impact categories are respiratory inorganics,
global warming and photochemical ozone formation (impact on vegetation). Obviously, this ranking of the
importance relies on the embedded methodology in the weighting method (Weidema 2009). Alternative
weighting methods have been applied to test if these methods can be used to identify the same most
important impact categories as identified with the Stepwise method. The result of this, applying the ReCiPe
and the Impact2002+ methods, is shown in Figure 8.3.
0
10,000
20,000
30,000
40,000
50,000
60,000
70,000
80,000
90,000
Respiratory inorgan
ics
Global warming
Photochem
ical ozone, vegetat.
Eutrophication, terrestrial
Human
toxicity, non‐carc.
Ecotoxicity, terrestrial
Human
toxicity, carcinogens
Acidification
Respiratory organics
Ecotoxicity, aquatic
Nature occupation
Eutrophication, aquatic
Ozone layer dep
letion
Mineral extraction
Ionizing radiation
Non‐ren
ewab
le energy
EUR2003
Eco Island Ferry
Tun Island Ferry
49
Figure 8.3: Identification of most significant impact categories by using alternative weighting methods: Impact 2002+ (Jolliet et al. 2003) and ReCiPe Endpoint v1.07 / Europe H/H (Goedkoop et al. 2009).
The Impact2002+ and the ReCiPe methods both agree with the Stepwise method that global warming
(=climate change) and respiratory inorganics (=particulate matter formation) are among the three most
import impact categories. However, the third significant impact category identified with Stepwise;
photochemical ozone formation is not identified as significant with the other two LCIA methods. Instead,
the Impact2002+ and the ReCiPe methods identify non‐renewable energy and natural land transformation
respectively as among the three most significant impacts. Therefore, the identification of respiratory
0
2,000
4,000
6,000
8,000
10,000
12,000
Clim
ate change Human
Health
Clim
ate change Ecosystem
s
Particulate m
atter form
ation
Natural lan
d transform
ation
Fossil depletion
Human
toxicity
Metal dep
letion
Terrestrial ecotoxicity
Agricultural lan
d occupation
Terrestrial acidification
Urban
land occupation
Photochem
ical oxidant form
ation
Ionising radiation
Freshwater eu
trophication
Ozone dep
letion
Freshwater ecotoxicity
Marine ecotoxicity
Pt
Eco Island Ferry
Tun Island Ferry
0
20
40
60
80
100
120
140Respiratory inorganics
Global warming
Non‐renewable energy
Terrestrial ecotoxicity
Terrestrial acid/nutri
Non‐carcinogens
Carcinogens
Aquatic ecotoxicity
Land occupation
Respiratory organics
Ionizing radiation
Ozone layer depletion
Mineral extraction
Aquatic acidification
Aquatic eutrophication
Pt
Eco Island Ferry
Tun Island Ferry
Impact 2002+
Hotspots identified with Stepwise
ReCiPe (endpoint H/H)
50
inorganics and global warming as the most significant impact categories is regarded as relatively robust. It
should be noticed, that this identification does not affect the results/conclusions of the LCA since the Eco
Island Ferry performs better than the Tun Island Ferry for all impact categories – and the relative difference
between the two ferry alternatives is more or less the same for all impact categories. Further, it should be
noticed that weighting often to some degree is related to subjective choices. Therefore, other weighting
methods are likely to point out other impact categories as the most significant ones.
8.2 ProcesscontributionIn the following the overall results from the previous section are broken down. This helps understanding
the environmental relevance of the difference life cycle stages of the ferries and which emissions are
contributing to each impact category. The process contribution analysis is only presented for the three
most significant impact categories; respiratory inorganics, global warming and photochemical smog. Figure
8.4 and Table 8.2 below present an overview of the contribution to the three impact categories from each
of the life cycle stages. Notice that in Figure 8.4, the results are normalised by the total impact of the Tun
Island Ferry. Then the importance of the same life cycle stage for the two ferry alternatives can also be
compared.
Figure 8.4: Identification of most significant impact categories by using alternative weighting methods: Impact 2002+ (Jolliet et al. 2003) and ReCiPe v1.06 (Goedkoop et al. 2009).
0%
20%
40%
60%
80%
100%
Eco Island Ferry
Tun Island Ferry
Eco Island Ferry
Tun Island Ferry
Eco Island Ferry
Tun Island Ferry
Disposal
Operation
Maintenance
Construction
Respiratory inorganics
Global warming
Photochemical smog
51
Table 8.2: Process contribution for the Eco Island Ferry for the three most significant impact categories.
9. SensitivityanalysisanduncertaintiesThroughout the goal and scope definition as well as the life cycle inventory a number of assumptions have
been taken, uncertainties in data have been identified and methodological choices have been made. In
order to be able to evaluate the sensitivity of the results in the next chapter, a number of sensitivity
analyses are carried out in the current chapter. A screening for significant assumptions and uncertainties
has been carried out, and the outcome is summarised in section 9.12.
9.1 FerrylifetimesLife times at 40 and 30 years have been assumed for the Eco and Tun Island Ferry respectively (section 2.5).
In this sensitivity analysis, the same life time of the two ferry alternatives at 30 years has been assumed.
Since most impact categories are proportional to GHG‐emissions, only the results for this impact category
have been shown here.
Figure 9.1: Eco Island Ferry with life times at 40 (default scenario) and 30 years (sensitivity analysis) compared with the Tun Island Ferry with life time at 30 years (default scenario). The results represent the functional unit: servicing the Tunø ferry route in one year.
It appears from Figure 9.1 that the life time of the Eco Island Ferry only influences the results
insignificantly.
9.2 ModellingofelectricityElectricity is modelled using a future consequential scenario (section 3.1). The results for the Eco Island and
the Tun Island Ferries are shown using different electricity models; in addition to the applied consequential
future electricity mix, the results have been calculated by using an average mix in year 2008 and 100% coal.
The electricity models are implemented throughout the database (ecoinvent) which is used for the
modelling of all direct inputs and upstream inputs of electricity in the life cycle inventory.
56
Figure 9.2: GHG‐emissions for Eco Island and Tun Island Ferries calculated with different electricity models The results represent the functional unit: servicing the Tunø ferry route in one year.
It appears from Figure 9.2 that the differences in results by the two ferry alternatives are not affected by
the electricity model.
9.3 QuantityofinsulationinTunIslandFerryInsulation in the Tun Island Ferry is assumed to be 60% of the insulation in the Eco Island Ferry (chapter 4).
Insulation materials account for <0.5% of the life cycle GHG‐emissions for both of the ferries. Hence any
uncertainties related to this assumption will affect the results insignificantly.
9.4 SameamountofmachineryandequipmentintwoferriesFor most of the machinery and equipment, the same amount has been assumed for the two ferries
(chapter 4). Machinery and equipment materials (excl. engine) account for <2% of the life cycle GHG‐
emissions for both of the ferries. Hence uncertainties related to this assumption will affect the results
insignificantly.
9.5 InconsistentmodellingofwoodWood from forest is not modelled consistent with other materials (allocation) (section 4.8). Wood based
products account for <0.002% of the life cycle GHG‐emissions for both of the ferries. Hence any
uncertainties related to inconsistent modelling of wood will have no significant effects on the results.
9.6 SameamountofpaintformaintenanceintwoferriesSame quantity of paint for maintenance is assumed for the Eco Island Ferry as for the Tun Island Ferry
(chapter 5). Generally the Eco Island Ferry requires less anti corrosive protection. Thus, the assumption of
same quantity paint overestimates the amount for the Eco Island Ferry. Paint in the maintenance stage
accounts for <0.5% of the life cycle emissions of the Eco Island Ferry. Therefore this assumption will not
affect the results.
9.7 ZincanodeemissionsIt is assumed that 50% of the initial weight of the zinc in the zinc anodes is emitted to seawater during
operation (chapter 5 and chapter 6). Zinc emissions are relevant for aquatic ecotoxicity. For the Tun Island
57
Ferry, which uses much more zinc anode than the Eco Island Ferry, the zinc emissions account for 89% of
the total contribution to aquatic ecotoxicity. According to the weighted results, aquatic toxicity is of minor
importance. But this relies on the applied weighting principles. Hence, the assumptions on zinc emissions
may influence the results for each ferry. However, it does not affect the ranking of the Eco Island Ferry over
the Tun Island Ferry.
9.8 Anti‐foulingagentemissionsAccording to chapter 6 all anti‐fouling agents for both ferries are assumed to be based on nano technology.
However, in some currently used paints, toxic anti‐fouling agents are added, such as tributyl tin oxide or
copper (Thrane 2004). If such paints were used instead of a more non‐toxic nano‐based anti‐fouling agent
as assumed, this could potentially affect the relative difference in the contribution to toxicity for the two
ferry alternatives. However, since the Eco Island Ferry is significant lighter than the Tun Island Ferry (see
Table 2.2), the area of painted surface under water, i.e. hull surface where anti‐fouling is needed, is smaller
for the Eco Island Ferry. Therefore, the use of toxic paints for anti‐fouling will not change the
environmental ranking of the two ferry alternatives.
9.9 DieselconsumptionDiesel consumption in operation stage of Eco Island Ferry is based on theoretical calculations whereas the
Tun Island Ferry figures represent actual data (chapter 6). The use of diesel is the single most influencing
factor on the results since it accounts for 90% and 83% of the total GHG‐emissions for the Eco and Tun
Island Ferry respectively. Hence, uncertainties in diesel consumption lead to approximately same
uncertainties in results. Therefore, despite the uncertainties of diesel use are unknown, they are regarded
as significant. However, it does not affect the ranking of the Eco Island Ferry over the Tun Island Ferry.
If diesel consumption in the Eco Island Ferry is underestimated with 10%, then the overall results of the Eco
Island Ferry are also underestimated with approximately 10%.
9.10 MarginalsourceoffuelforoperationstageIt has been assumed that the ferries uses mineral diesel throughout the life time, i.e. 30‐40 years in the
future. Given the current political targets on minimising or even phasing out fossil fuels over the next 40
years, another fuel than fossil diesel might be the marginal one in part of the life time of the ferries. If the
future fuel is associated with significant lesser emissions, this could change the results. Especially, the
differences in the impact related to the operation stage could be smaller. However, since the sum of the
other life cycle stages (construction, maintenance and disposal) are also favourable to the Eco Island Ferry,
it is not likely that a very environmentally friendly fuel, would change the ranking of the two ferry
alternatives.
9.11 End‐of‐lifescenariosThe applied end‐of‐life scenario in chapter 7 represents estimated current waste disposal/recycling of a
ferry. Two scenarios have been carried out; one where recycling of polymers is maximised and one where
polymers are sent to landfill. Disposal of other materials (mainly steel) have not been changed, since the
current practise of steel recycling is well established. The only new technology/material being introduced is
58
the polymers (the composite material). It should be noticed that it is assumed that the carbon fibre cannot
be recycled.
The results of the sensitivity analysis are presented in Figure 9.3.
Table 9.1: Polymer recycling scenario: Eco Island Ferry. All changes compared to the baseline disposal scenario are marked with red and arrows that show change. The LCI data relating to each of the three disposal options for each waste/scrap category are described in sections 7.1, 7.2 and 7.3.
Polymer recycling scenario Eco Island Ferry Waste/scrap category
Share category
Treatment
Recycling Incineration Landfill
Reference flow unit: piece
Ferry 1
Components in ferry unit: tonne
Carbon fibre 8.538 carbon fibre 100% 100%
Resin (vinylester) 11.164 resin 100% 100%
Core (PVC foam) 7.431 PVC 100% 100%
E glass (fibreglass) 0.627 inert 100% 100%
Aluminium, sheet 1.325 aluminium 100% 100%
Steel, sheet 16.130 steel 100% 90% 10%
Steel, section bar ‐ steel 100% 90% 10%
Engine 3.000 steel 100% 90% 10%
Electrical equipment 1.965 steel 55% 50% 50%
copper 10% 50% 50%
plastics 35% 100%
Cables 3.460 copper 50% 50% 50%
PVC 50% 100%
Transformers 0.300 steel 70% 80% 20%
copper 30% 80% 20%
Batteries 0.900 steel 40% 80% 20%
copper 10% 80% 20%
inert 50% 100%
Insulation 11.161 plastics 96% 100%
inert 4% 100%
Textiles 2.000 textile 100% 100%
Wood products 0.650 wood 100% 100%
Plastics products 3.170 plastics 100% 50% 50%
Ceramic products 0.200 inert 100% 100%
Paint – solids and curing agent 7.11 inert 100% 100%
59
Table 9.2: Polymer landfill scenarios: Eco Island Ferry. All changes compared to the baseline disposal scenario are marked with red and arrows that show change. The LCI data relating to each of the three disposal options for each waste/scrap category are described in sections 7.1, 7.2 and 7.3.
Polymer landfill scenario Eco Island Ferry Waste/scrap category
Share category
Treatment
Recycling Incineration Landfill
Reference flow unit: piece
Ferry 1
Components in ferry unit: tonne
Carbon fibre 8.538 carbon fibre 100% 100%
Resin (vinylester) 11.164 resin 100% 100%
Core (PVC foam) 7.431 PVC 100% 100%
E glass (fibreglass) 0.627 inert 100% 100%
Aluminium, sheet 1.325 aluminium 100% 100%
Steel, sheet 16.130 steel 100% 90% 10%
Steel, section bar ‐ steel 100% 90% 10%
Engine 3.000 steel 100% 90% 10%
Electrical equipment 1.965 steel 55% 50% 50%
copper 10% 50% 50%
plastics 35% 100%
Cables 3.460 copper 50% 50% 50%
PVC 50% 100%
Transformers 0.300 steel 70% 80% 20%
copper 30% 80% 20%
Batteries 0.900 steel 40% 80% 20%
copper 10% 80% 20%
inert 50% 100%
Insulation 11.161 plastics 96% 100%
inert 4% 100%
Textiles 2.000 textile 100% 100%
Wood products 0.650 wood 100% 100%
Plastics products 3.170 plastics 100% 100%
Ceramic products 0.200 inert 100% 100%
Paint – solids and curing agent 7.11 inert 100% 100%
60
Figure 9.3: End‐of‐life scenarios for the Eco Island Ferry.
It appears from the end‐of‐life sensitivity analysis that the life cycle impacts of the Eco Island Ferry can only
be insignificantly affected by different disposal/recycling systems for the polymers in the ferry.
9.12 ConcludingremarkonthesensitivityanalysisIt appears from the sensitivity analyses that the result that the Eco Island Ferry is performing significantly
better than the Tun Island Ferry is not sensitive to assumptions and uncertainties. Most assumptions and
uncertainties can only affect the results insignificantly. Two issues were identified as being significant:
‐ The assumption that 50% of zinc in zinc anodes is emitted to sea water during operation significantly
affects the result on aquatic ecotoxicity (this impact category is given a low significance in all weighted
results)
‐ Uncertainties in diesel consumption lead to approximately the same uncertainties in results
61
63
10. Evaluationofsensitivity,completenessandconsistencyAccording to ISO 14044 (2006) an evaluation in the interpretation phase including sensitivity, completeness
and consistency check must be carried out in order to establish confidence in the results of the LCA.
10.1 SensitivitycheckThe objective of the sensitivity check is to assess the reliability of the results and how they are affected by
system boundaries, uncertainties in data, assumptions and LCIA‐methods (ISO 14044 2006). Given that the
results show that 80‐90% of most impacts are related to one activity, diesel combustion, the results are not
sensitive to changes in system boundaries, uncertainties in data, assumptions or the LCIA methods applied
here.
The sensitivity analysis in chapter 9 also shows that the result that the Eco Island Ferry is performing
significantly better than the Tun Island Ferry is not sensitive to assumptions and uncertainties. Most
assumptions and uncertainties can only affect the results insignificantly. Two issues were identified as being
significant:
‐ The assumption that 50% of zinc in zinc anodes is emitted to sea water during operation significantly
affects the result on aquatic ecotoxicity (this impact category is given a low significance in all weighted
results)
‐ Uncertainties in diesel consumption lead to approximately the same uncertainties in results
10.2 CompletenesscheckThe objective of a completeness check is to ensure that the information provided in the difference phases
of the LCA is sufficient for the interpretation of the results (ISO 14044 2006). This LCA is considered to be
very complete given that almost data or processes were excluded from the study. The life cycle inventory
consistently operates with a cut‐off criterion of close to 0%. Only services in the operation stage have not
been included. Further, uncertainties in the hybridization of process data and input‐output data may have
caused that some minor transactions have not been accounted for.
10.3 ConsistencycheckThe objective of the consistency check is to verify that the assumptions, methods and data are consistent
with the goal and scope. Especially the consistency regarding data quality along the product chain,
regional/temporal differences, allocation rules/system boundaries and LCIA are important (ISO 14044).
In general the model is based on a very consistent and well‐defined methodological framework as
presented in chapter 2.4.
In this study, consequential modelling was applied throughout and, in general, is regarded as having a very
high degree of consistency.
65
11. ConclusionsThe comparative LCA of the Eco Island Ferry with a carbon FRP structure and the Tun Island Ferry with a
steel structure is prepared to evaluate the environmental impacts of the reference ferry and its alternative,
and to aid decision‐makers when considering the inclusion of FRP materials as an option for passenger
ferries.
The results indicate that the Eco Ferry outperforms the Tun Island Ferry by a factor of 2 for almost all
impact categories. The explanation of the difference is related to the reduced fuel consumption in the Eco
Island Ferry. The lighter materials used for the structure, carbon fibre composite, allows for a reduction of
the ferry’s light weight from 262 tonne to 72 tonne, i.e. a factor of around 3.5. This means that the depth of
hull of the Eco Island Ferry is lesser and thereby less energy is required for propulsion. This also allows for a
smaller engine and thereby less energy when the ferry is not sailing. Given that the Eco Island Ferry
requires less fuel for operation, it surpasses the Tun Island Ferry in all impact categories.
Generally, the results are regarded as robust and not sensitive to assumptions and uncertainty in data. The
major issues regarding sensitivity are:
‐ The assumption that 50% of zinc in zinc anodes is emitted to sea water during operation significantly
affects the result on aquatic ecotoxicity (this impact category is given a low significance in all weighted
results)
‐ Uncertainties in diesel consumption lead to approximately the same uncertainties in results
Sensitivity analysis investigating different end‐of‐life scenarios were carried out. The baseline scenario
assumed that most of the composite materials are incinerated. A recycling scenario, where the polymers
were assumed to be 100% recycled and a landfill scenario, where the polymers were assumed to be 100%
landfilled was defined. The results of the end‐of‐life scenario showed that the life cycle results were only
insignificantly affected by alternative end‐of‐life strategies. The explanation hereof is that the materials of
which the Eco Island Ferry is made originates from oil and gas. The diesel combusted in the operation stage
amounts roughly 80 times the amount of oil and gas used for the composite materials.
67
12. ReferencesAmen M P and Evegren F (2012), Preliminary study of the Øko‐Ø‐færge project, SP Technical Research
Institute of Sweden, SP Report 2012:03, Sweden
Andersen E S, P Jespersgaard and O G Østergaard (1981), Databog, fysik, kemi (English: Data book, physics,
chemistry). F&K forlaget, Copenhagen
Classen M, Althaus H J, Blaser S, Tuchschmid M, Jungbluth N, Doka G, Faist Emmnegger M, and
Scharnhorst W (2009), Life cycle inventories of metals. Final report ecoinvent data v2.1, No 10. EMPA
Dübendorf, Swiss Centre for Life Cycle Inventories, Dübendorf
Dairy UK, DairyCO and Carbon Trust (2010), Guidelines for the Carbon Footprinting of Dairy Products in the
UK. Dairy UK, DairyCO and Carbon Trust
Dalgaard R (2007), The environmental impact of pork production from a life cycle perspective. PhD Thesis.
Available at www.lcafood.dk
Dalgaard R, Schmidt J H, Halberg N, Christensen P, Thrane M and Pengue W A (2008), LCA of soybean
meal. International Journal of Life Cycle Assessment, 13 LCA (3) 240‐254
Dalgaard R and Schmidt J H (2010), Input‐output modelling of the Danish Agricultural Sector ‐ Update of
the FORWAST Danish Input‐Output Database. Appendix to the report documenting the project 'Pilotprojekt
‐ effektvurdering af forskningsmæssig indsats' (English: Pilot project ‐ assessment of the effect of research)
funded by the Danish Ministry of Food, Agriculture and Fishery. The report is currently under publication.
Dalgaard R and Schmidt J H (2012), National and farm level carbon footprint of milk ‐ Life cycle inventory
for Danish and Swedish milk 2005 at farm gate. Arla Foods, Aarhus, Denmark
Ecoinvent (2010), Ecoinvent data v2.2. Final reports Ecoinvent v2.2 No. 1‐25. Swiss Centre for Life Cycle
Inventories, Dübendorf. The inventory data and reports are available in the LCA pc‐software SimaPro 7.3.
Evegren F and Rahm M (2012), Preliminary Analysis report – Eco‐Island‐Ferry (Reference BRd6035). SP –
Technical Research Institute of Sweden, Göteburg, Sweden.
Goedkoop M, Heijungs R, Huijbregts M, Schryver A D, Struijs J, van Zelm R (2009), ReCiPe 2008 ‐ A life
cycle impact assessment method which comprises harmonised category indicators at the midpoint and the
endpoint level. First edition. Report I: Characterisation. Ministry of Housing, Spatial Planning and
Environment (VROM), the Netherlands
Hauschild M and Potting J (2005), Spatial differentiation in Life Cycle impact assessment ‐ The EDIP2003
DetailedPaintCalculationsforEcoIslandFerryThe paint applied on the Eco Island Ferry in the construction stage is assumed to be the same for the Tun Island Ferry. Data on type and quantities of
paint are provided by Hjoernet (2012). Product specifications for each of the used paints are downloaded from the specific paint supplier’s webpage.
From here data on dosage, density, mixing ratio and VOC content are obtained.
Total 5508 950.6 1346.099 1114.7 231.4 1049.2 296.9
80
DetailedpaintcalculationsfortheTunIslandFerryThe paint applied on the Tun Island Ferry in the maintenance stage is assumed to be the same for the Eco Island Ferry. Data on type and quantities of
paint are provided by Moellgaard (2012). Product specifications for each of the used paints are downloaded from the specific paint supplier’s
webpage. From here data on density, mixing ratio and VOC content are obtained.
DetailedZincAnodeCalculationfortheTunIslandFerryThe zinc anode used by the Tun Island Ferry in the maintenance stage is assumed to be the same for the Eco
Island Ferry. Data on type and quantities zinc anode are provided by Moellgaard (2012). The annual zinc
anode use is obtained from data on two years consumption. Product specifications for each of the used zinc
anodes are downloaded from the specific zinc anode supplier’s webpage. From here data on net weight (Zn
content) and gross weight (Zn and steel) are obtained.
Annual Zinc Anode Use Calculated
Type Quantity (pieces)
Unit weight, net (kg/piece)
Unit weight, gross (kg/piece)
Weight, Zn (kg) Weight, steel (kg)
BERA 35 5 3.2 3.5 16.0 1.5
BERA 55 5 5.1 5.5 25.5 2.0
BERA 102 7 9.3 10.2 65.1 6.3
Total 106.6 9.8
Total combined weight 116.4
82
Appendix3:DetailedInsulationData
Detailed insulation data as provided by Hjoernet (2012)
Total FRD60 FRM1 FRM2 FRM3 FRM4 Glass cloth Sole 1 Ceiling Sole 2
Appendix4:ExplanationofindicatorsintheStepwiseLCIAmethodThis appendix briefly explains the impact categories included in the applied LCIA method: Stepwise 2006 (version
1.3) (Weidema et al. 2007). If no literature reference is given in the table, this means that the information is
obtained from Weidema et al. (2007).
Impact
category
Unit Original source Explanation
EDIP
2003
Impact
2002+
Global
warming
kg CO2‐eq x The unit is GWP100 (kg CO2 equivalents) based on the IPCC status reports.
Nature
occupation
m2 agr.land x The unit ‘m
2‐equivalents arable land’, represents the impact from the occupation of one m
2
of arable land during one year. Impact 2002+ (Jolliet et al. 2003) has obtained the method
for LCIA from EcoIndicator (Goedkoop and Spriensma 2001) where the impact is assessed on
the basis of the duration of area occupied (m2*years) multiplied with a severity score,
representing the potentially disappeared fraction (PDF) of species on that area during the
specified time. In order to include the impacts from transformation, the Stepwise method
introduces an additional severity of 0.88 to represent the secondary impacts from this
transformation (deforestation), calculated as the nature occupation during the later
relaxation from deforestation.
Acidification m2 UES x The unit expresses the area ofecosystem within the full deposition area (in Europe) which
isbrought to exceed thecritical load of acidification as a consequence of the emission (area
ofunprotected ecosystem = m2 UES). The impact indicator is based on modelling of
deposition in Europe. (Hauchild and Potting 2005, p47)
Eutrophication,
aquatic
kg NO3‐eq x The aquatic eutrophication potentials of a nutrient emissionexpress the maximum exposure
of aquatic systems that it can cause. The aquatic eutrophication potentials are expressed as
N‐ or P‐equivalents. (Hauchild and Potting 2005, p 73‐74)
Eutrophication,
terrestrial
m2 UES x Same as for acidification.
Photochemical
ozone, vegetat.
m2*ppm*h x The impact is expressed as the accumulated exposure(duration times exceedance of
threshold) above the threshold of 40 ppb times the area that is exposed as a consequence
of the emission.The threshold of 40 ppb is chosen as an exposure level below which no or
only small effects occur. The unit for vegetation exposure is m2*ppm*hours. (Hauchild and
Potting 2005, p 93)
Respiratory
inorganics
kg PM2.5‐eq x The impact on human health related to respiratory inorganics is expressed as equivalents of
particles (PM2.5).
Respiratory
organics
pers*ppm*h x The category covers the impact on human health from photochemical ozone formation. The
impact is expressed as the accumulated exposureabove the threshold of 60 ppb times the
number of persons which areexposed as a consequence of the emission. No threshold for
chronicexposure of humans to ozone has been established. Instead,the threshold of 60 ppb
is chosen as the long‐term environmental objectivefor the EU ozone strategy proposed by
the World Health Organisation,WHO. The unit for human exposure is pers*ppm*hours.
(Hauchild and Potting 2005, p 93)
Human toxicity,
carcinogens
kg C2H3Cl‐eq x The impact on human health related to carcinogens is expressed as equivalents of
chloroethylene (C2H3Cl). The Impact2002+ method determines the damage on human
heatth in terms of DALY (disability adjusted life years). Since there is no real mid‐point for
human toxicity, the Impact2002+ method has chosen C2H3Cl‐eq. as a reference substance.
(Jolliet et al. 2003)
Human toxicity,
non‐carc.
kg C2H3Cl‐eq x Same as for human toxicity, carcinogens
Ecotoxicity,
aquatic
kg TEG‐eq w x The impact on ecosystems related to ecotoxicity is expressed as equivalents of
chloroethylenetriethylene glycol (TEG) into water. The Impact2002+ method determines the
damage on ecosystems in terms of PAF (potentially affected fraction). Since there is no real
86
mid‐point for ecotoxicity, the Impact2002+ method has chosen TEG‐eq. into water as a
reference. (Jolliet et al. 2003)
Ecotoxicity,
terrestrial
kg TEG‐eq s x Same as for ecotoxicity, aquatic
Ozone layer
depletion
kg CFC11‐eq x The unit is equivalents of CFC11 which is an important contributyor to ozone layer
depletion.
Non‐renewable
energy
MJ primary x Total use of primary non‐renewable energy resources measured in MJ.
Mineral
extraction
MJ extra x This is the expected increase in extraction energy per kg extracted material. The reasoning is
based on the fact that extraction of minerals expoits the ores with the highest concentrates
(most accessible) resources first. (Goedkoop and Spriensma 2001, p 14)
87
Appendix5:Criticalreviewreportincludingauthor’sresponseIn the following, the critical review report from Henrik Wenzel is shown. In the report, each of the issues raised
are commented by the author of the current LCA report. The author’s responses are marked with grey.
Brandholt 2013‐03‐10
Critical review of LCA study: ”Eco Island Ferry – comparative LCA of island ferry with carbon fibre
composite based and steel based structures”
This is a critical review review of the LCA study: ”Eco Island Ferry – comparative LCA of island ferry with carbon fibre composite based and steel based structures. My review comments will take outset in the conclusions. The authors of the study conclude (LCA report page 63): “The results indicate that the Eco Ferry outperforms the Tun Island Ferry by a factor of 2 for almost all impact categories. The explanation of the difference is related to the reduced fuel consumption in the Eco Island Ferry. The lighter materials used for the structure, carbon fibre composite, allows for a reduction of the ferry’s light weight from 262 tons to 72 tons, i.e. a factor of around 3.5. This means that the depth of hull of the Eco Island Ferry is lesser and thereby less energy is required for propulsion. This also allows for a smaller engine and thereby less energy when the ferry is not sailing. Given that the Eco Island Ferry requires less fuel for operation, it surpasses the Tun Island Ferry in all impact categories”. Further, it is found (LCA report page 56) that the fuel consumption during sailing is the dominating source of environmental impact: “The use of diesel is the single most influencing factor on the results since it accounts for 90% and 83% of the total GHG‐emissions for the Eco and Tun Island Ferry respectively”. This latter statement was checked and found to be true. This overarching influence of fuel consumption during sailing was also expected as experience from many other LCA studies point in the same direction. Given the dominating influence of fuel consumption for sailing compared to all other life stages of the ferries and given their large difference in fuel consumption during sailing, the overall results and conclusions of the study stand out as both evident and robust. The only change in assumptions that can really influence the robustness of the results and conclusions is if very environmentally friendly fuels of some kind are assumed during sailing. Assuming a diesel like bio‐fuel of some kind could, thus, potentially change the results significantly. Not so much in case of a conventional bio‐diesel, because the environmental impacts from the use of land for growing the energy crops behind the fuel in this case would imply the same large environmental advantage of the fuel saving alternative. But in an ultimate case of e.g. diesel or di‐methyl‐ether (DME) produced through a wind power‐to‐liquid‐fuel type of scenario, the environmental comparison between the two ferries would be confined to comparing all other life phases than the sailing itself. In such a case, fuels would be much more expensive, and the fuel saving ferry would be even more economically attractive, of course. With the present very ambitious common energy agreement in Parliament, and the even more ambitious long term energy strategy of our Government to be completely free of fossil fuels in 2050, it is not completely unrealistic to assume that such fuels could be foreseen for at least the latest part of the life time of the ferries. It seems, however, that even in such a scenario, the much lighter weight of the Eco Ferry will imply smaller environmental impact potentials from this compared to the heavier alternative. This review comment is not a very significant one, because a fossil based diesel fuel is expected to be the most realistic alternative many years ahead. But as it is the only aspect that has any potential of changing the outcome of the study significantly, it could beneficially be addressed in the study and LCA report.
[Author’s comment #1]: A qualitative sensitivity consideration has been included in section 9.10. The scope of the study is in general both comprehensive and exhaustive, including even aspects of secondary activities related to the life of the ferries (the so‐called ‘services’ in the study). A consequential LCA approach is followed, which is believed to be best practice. Sensitivity analyses are believed to cover the most essential assumptions and uncertainties, besides the aspect of environmentally friendly fuels mentioned here already. All in all, therefore, the LCA is found to be well performed and results and conclusions robust to foreseeable changes in assumptions. Brandholt March 10th, 2013 Henrik Wenzel