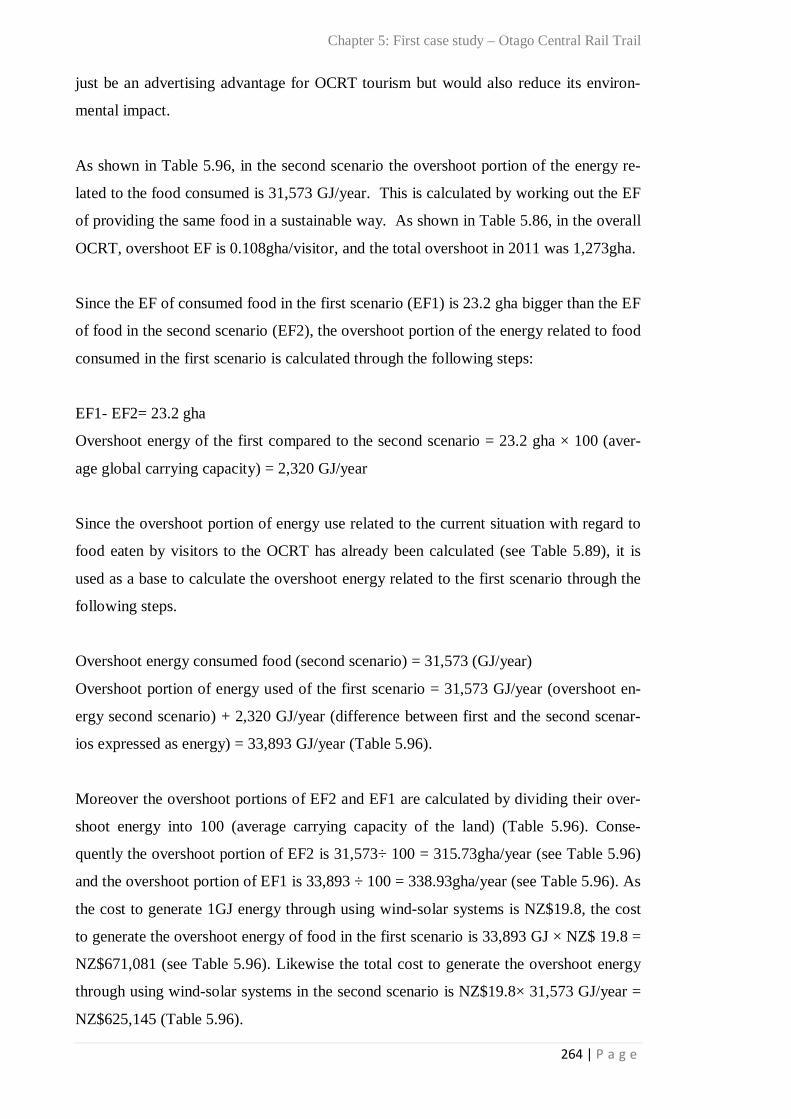
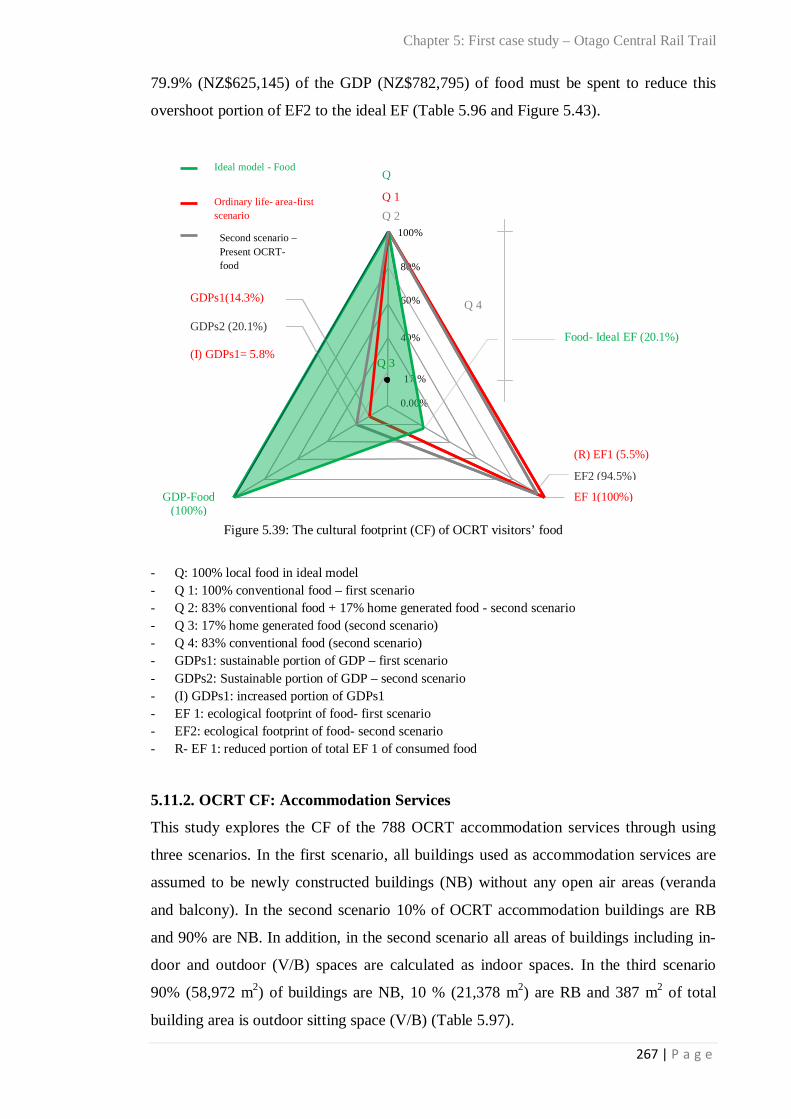
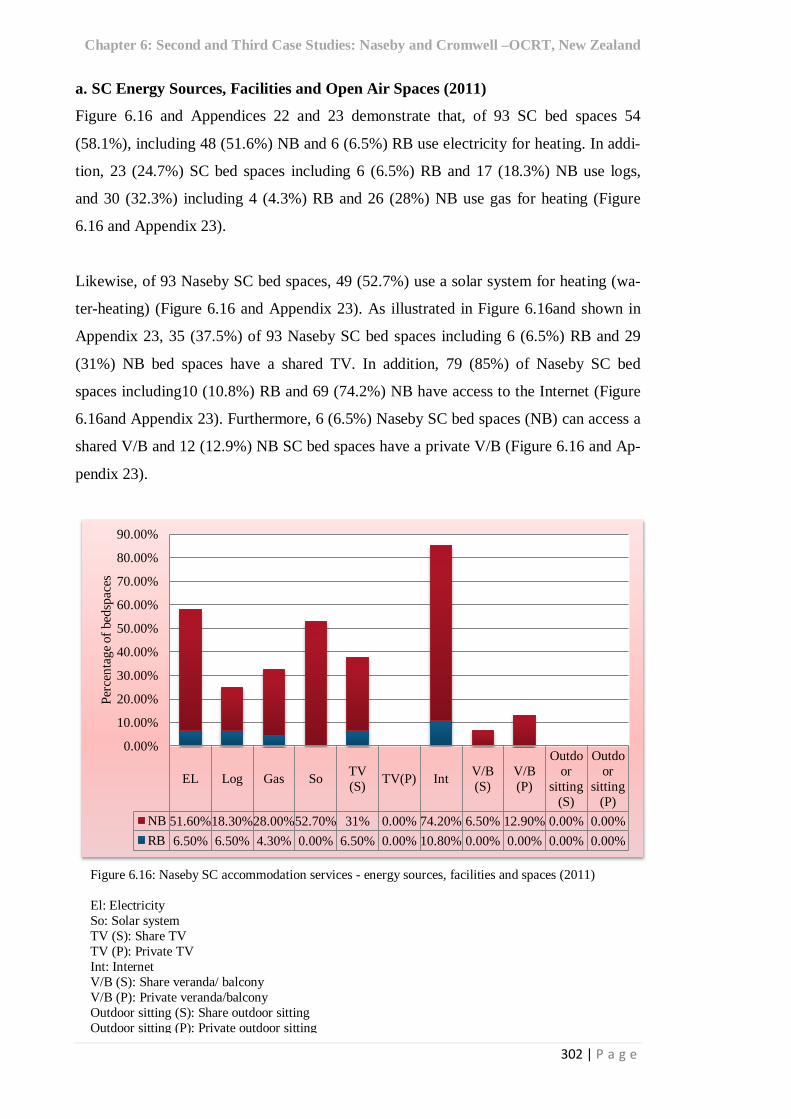
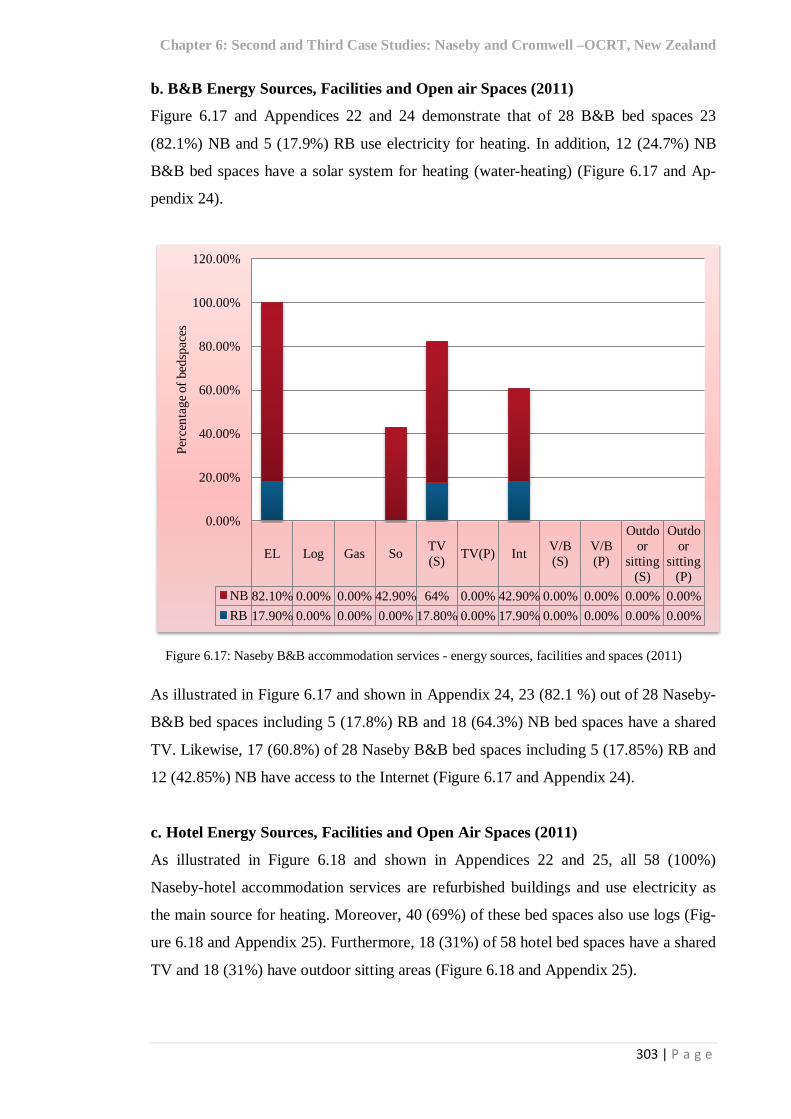
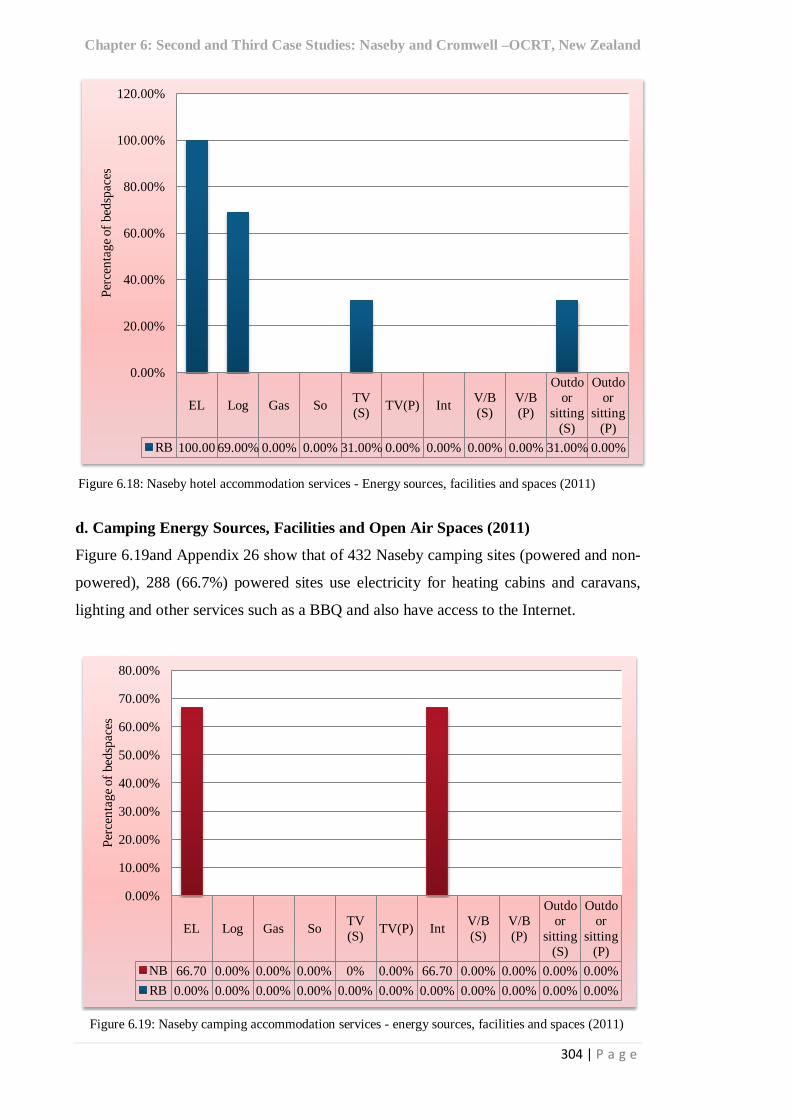
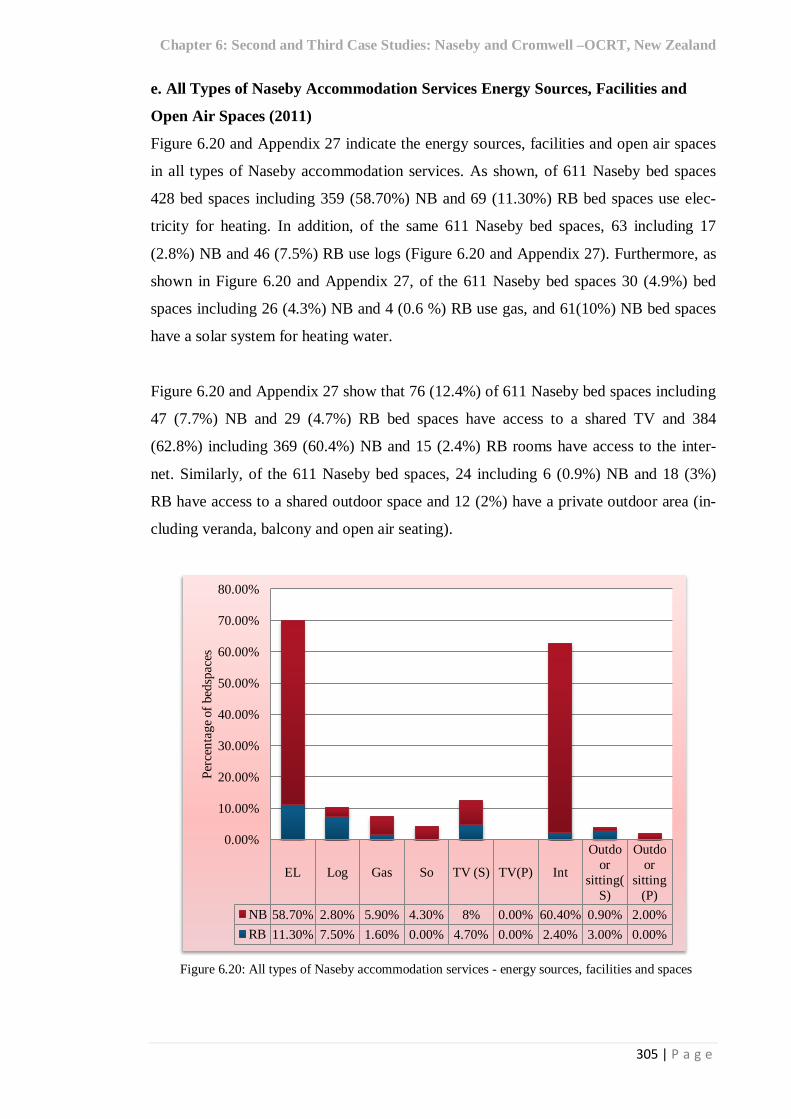
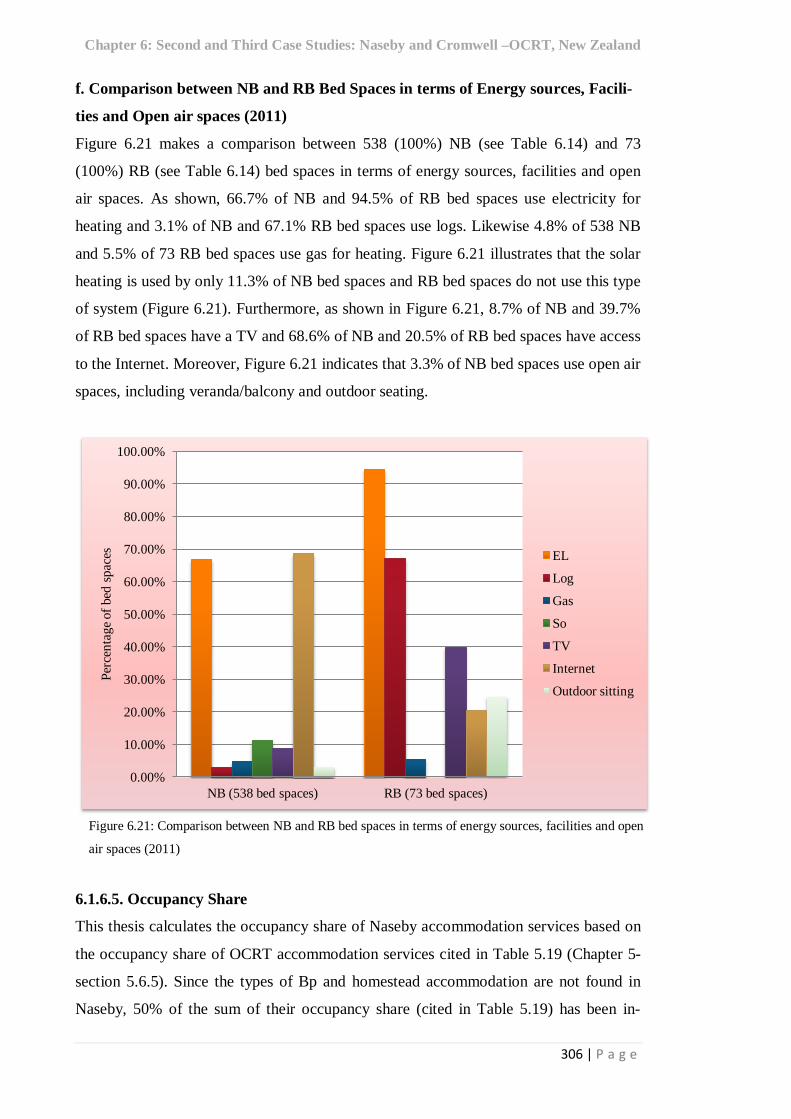
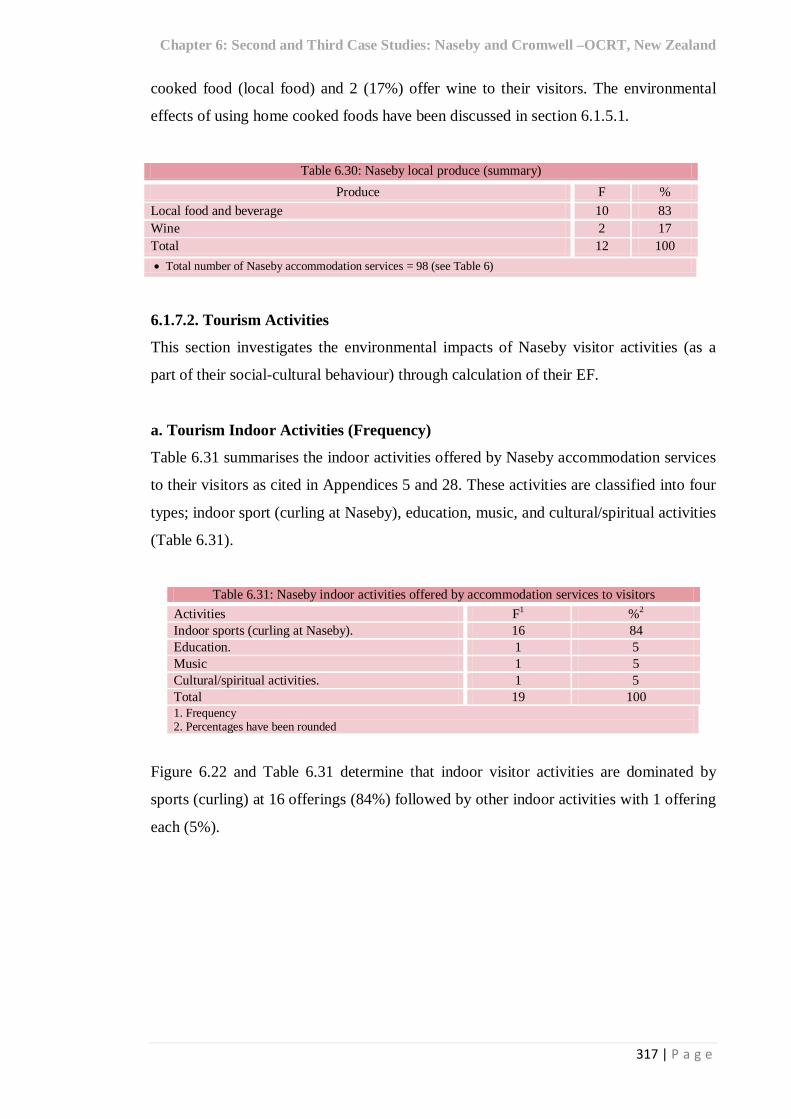
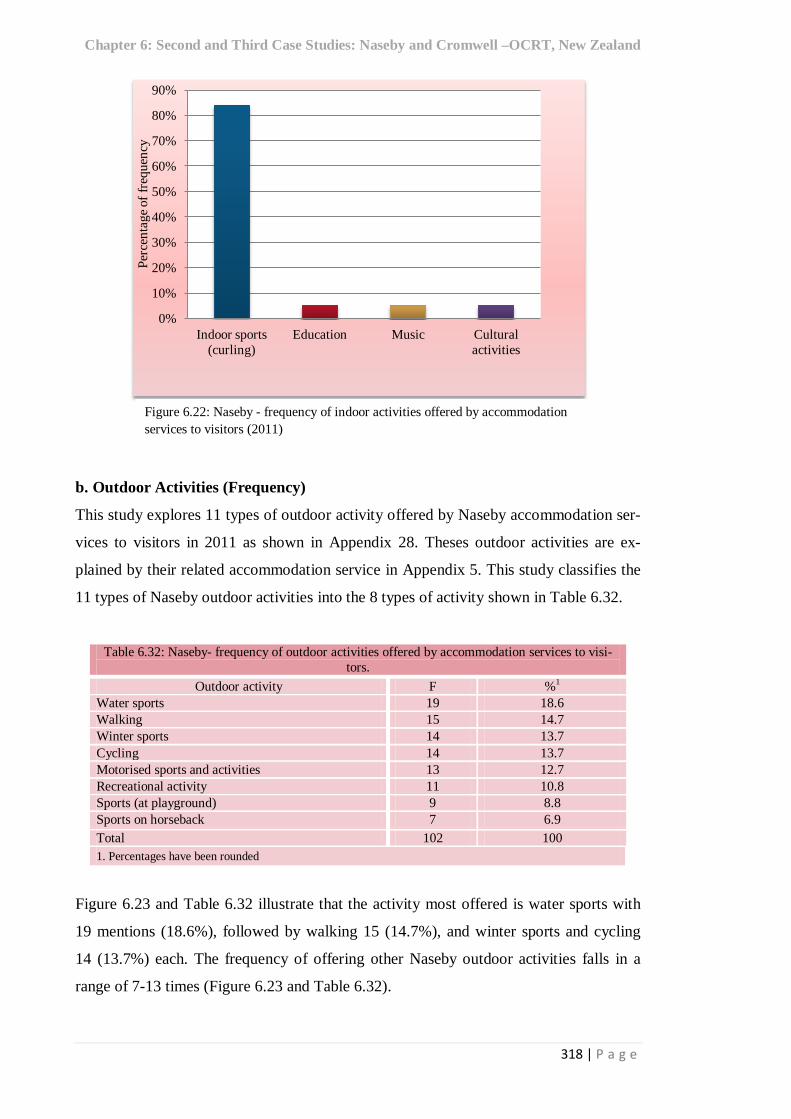
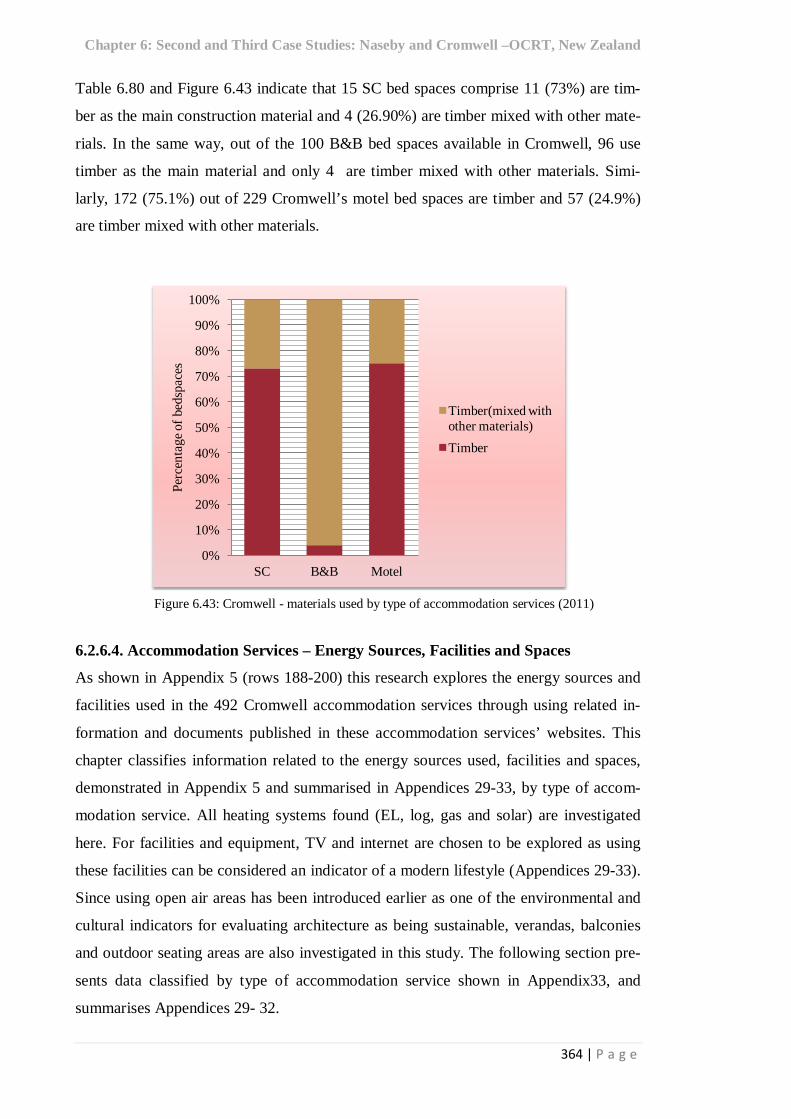
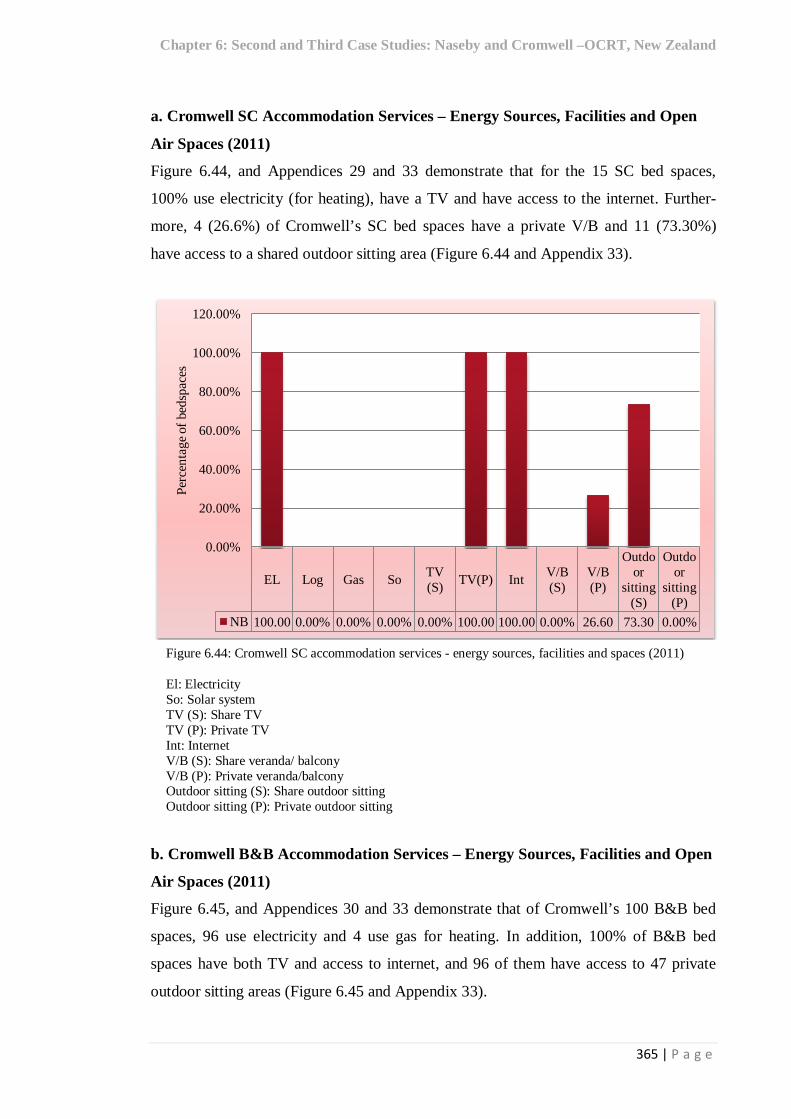
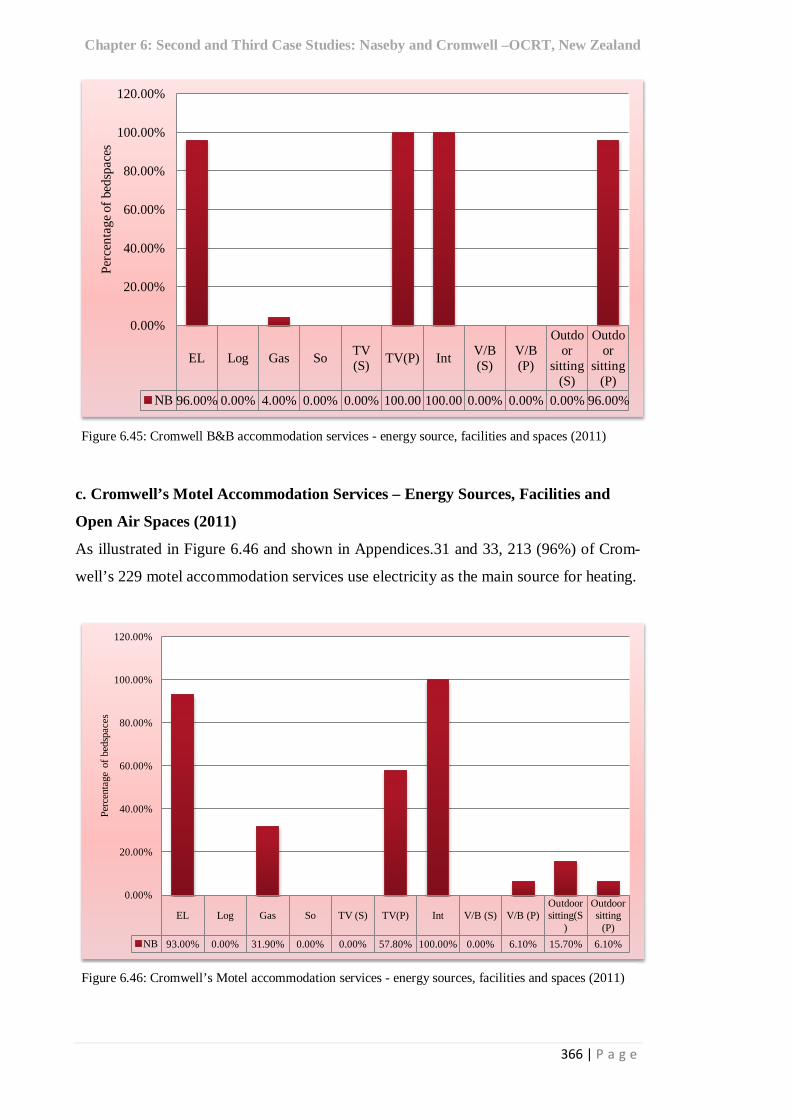
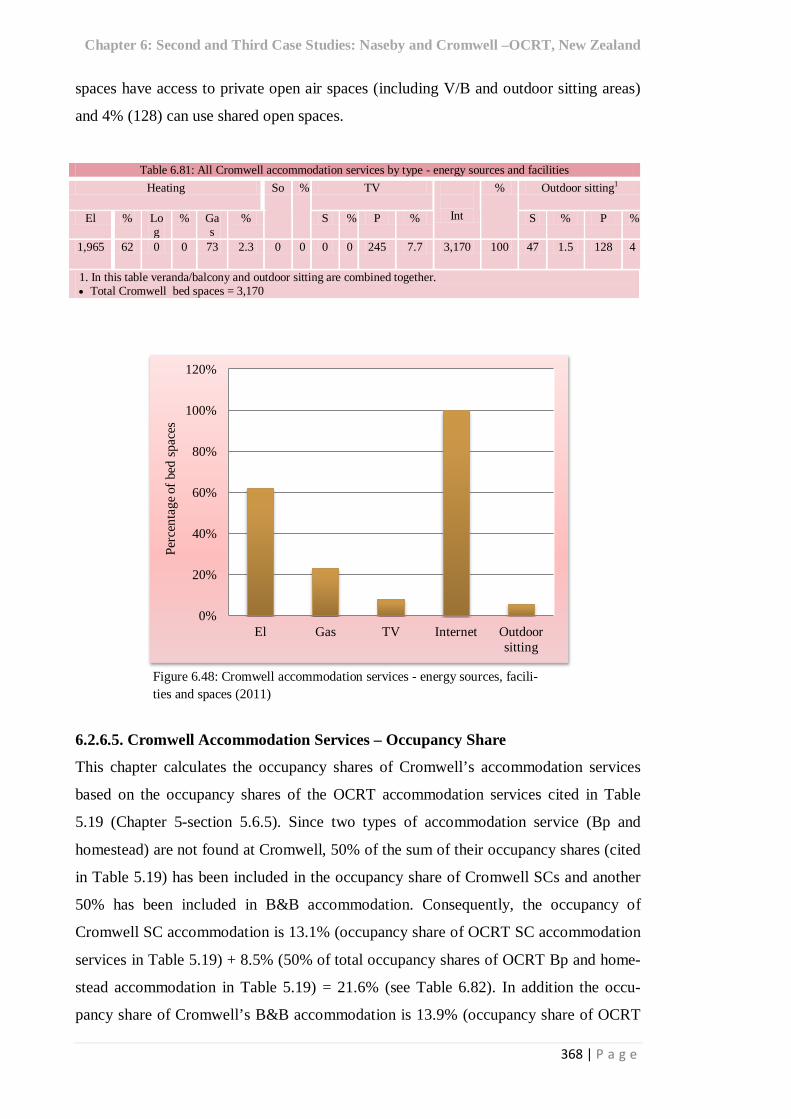
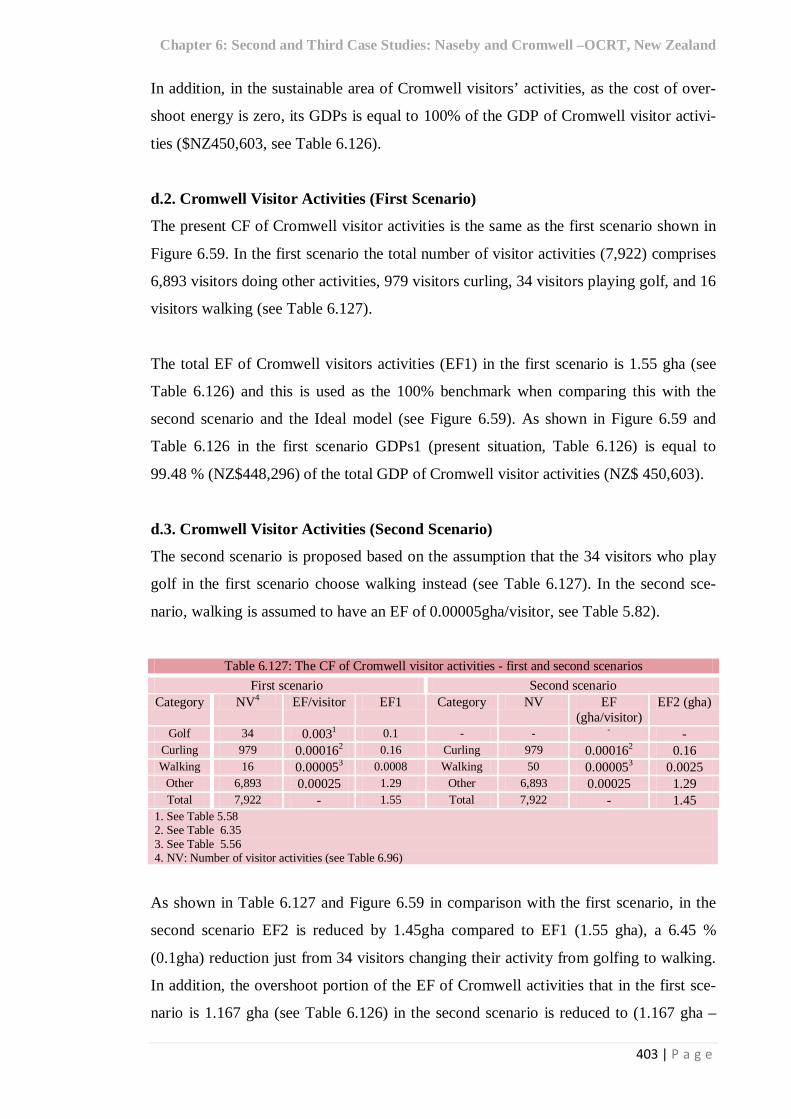
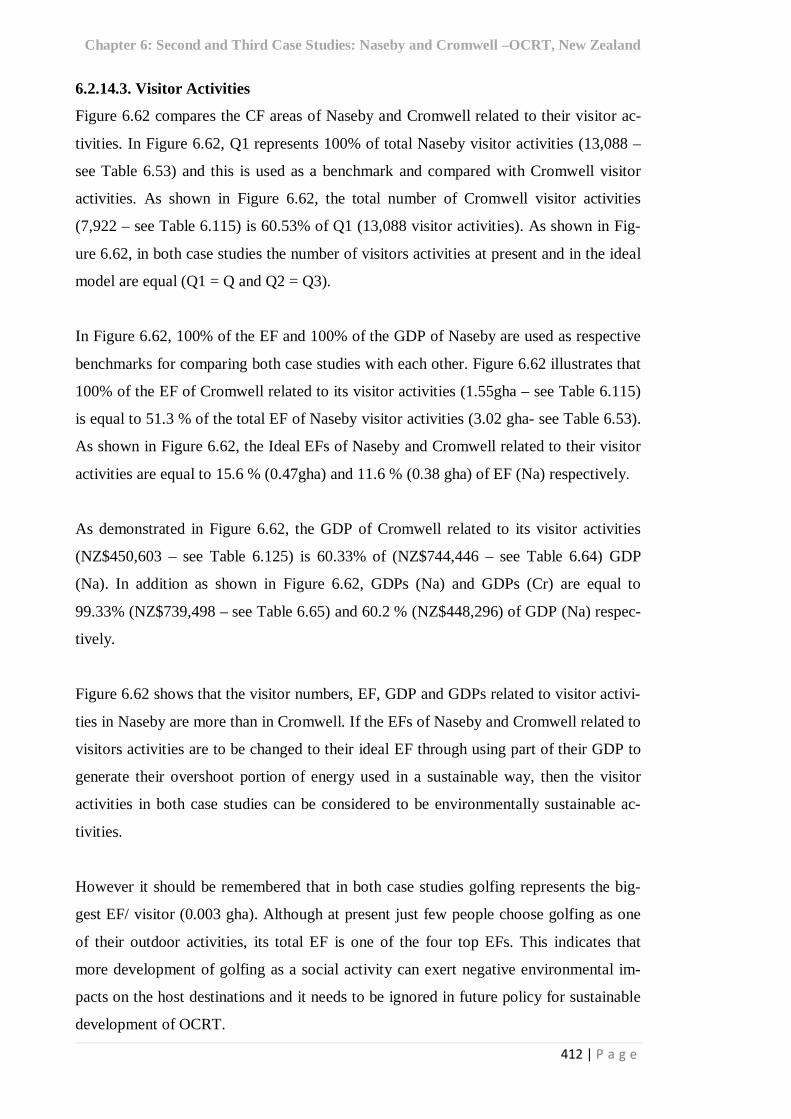
Eco-Tourism and its Architecture: A Methodological Framework for Assessing Progress towards Sustainable Development Abbas Mahravan A thesis submitted to the Victoria University of Wellington in fulfil- ment of the requirements for the degree of Doctor of Philosophy in Architecture Victoria University of Wellington 2012
Transcript
Eco-Tourism and its Architecture: A Methodological Framework for Assessing
Progress towards Sustainable Development
Abbas Mahravan
A thesis submitted to the Victoria University of Wellington in fulfil-ment of the requirements for the degree of Doctor of Philosophy in
Architecture
Victoria University of Wellington
2012
ii | P a g e
Acknowledgements
First and foremost I offer my most sincere gratitude to my supervisors, Professor Brenda Vale and Professor Robert Vale, who have supported me throughout my thesis with their patience and knowledge, whilst allowing me the room to work in my own way. I attribute my PhD degree to their encouragement and effort and without them this thesis would not have been completed. I simply could not have wished for better or more friendly supervisors.
I would like to acknowledge the financial, academic and technical support of the Victo-ria University of Wellington, and the School of Architecture and Design, and its staff, particularly in the award of a Postgraduate Research Studentship.
I would like to thank my wife, Niloofar Maleki and my daughter Hasti Mahravan who were always there cheering me up and stood by me through good times and bad.
Finally I would like to thank all my friends who were always supporting me, and were most encouraging with their best wishes.
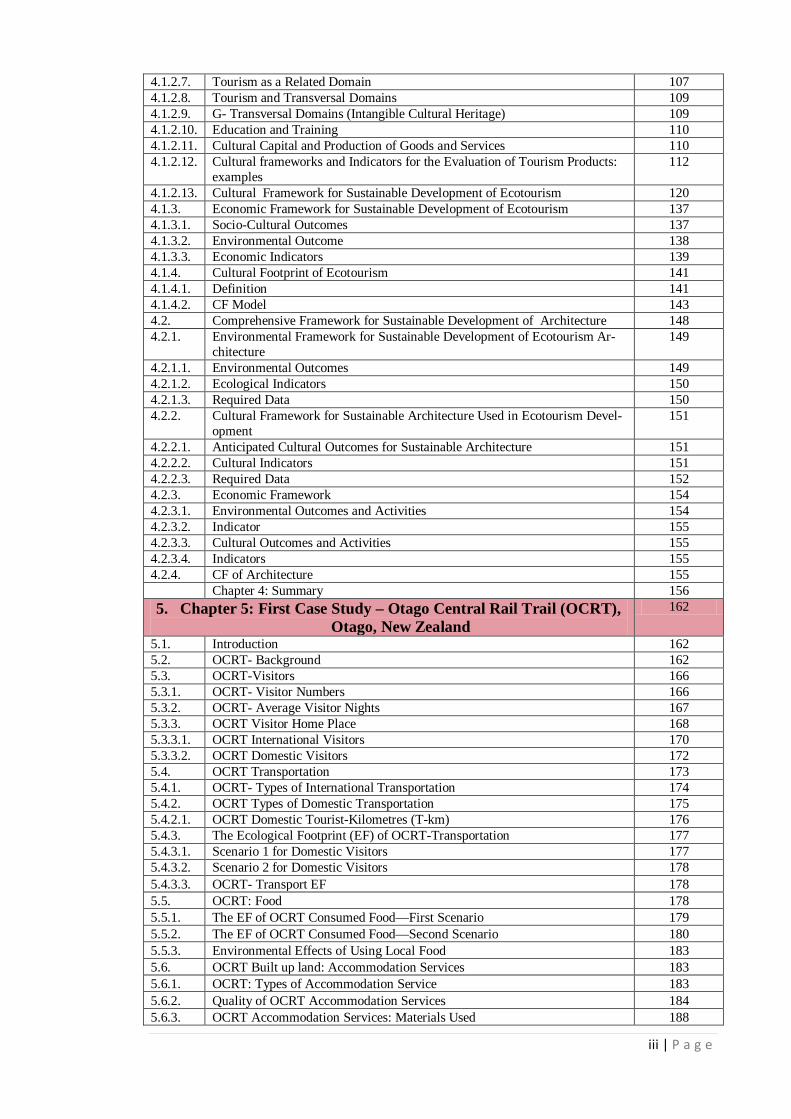
2. Chapter 2 9 2.1. Sustainability 9 2.1.1. Definition of Sustainability 9 2.1.2. The Necessity for Sustainability 10 2.1.3. Models of Sustainability 11 2.1.4. Fundamental Characteristics of Sustainability 13 2.1.5. Sustainable Development- Goals 14 2.1.6. Sustainability- Principles 14 2.1.7. Sustainability Frameworks and Indicators 15 2.1.7.1. Ecological Footprint 15 2.1.7.2. GDP and its Possible Adjustments 18 2.1.7.3. Sustainability Assessment 19 2.1.7.4. Genuine Saving (Sg) 21 2.2. Ecotourism 22 2.2.1. Definition of Ecotourism 22 2.2.1.1. General Views of a Definition of Ecotourism 23 2.2.1.2. Location and Definition of Ecotourism 23 2.2.1.3. Sustainability and Definition of Ecotourism 24 2.2.1.4. Definition of Ecotourism as a Segment of Alternative Tourism 25 2.2.2. Ecotourism and Environmental Heritage 26 2.2.2.1. Case Study of Costa Rica 28 2.2.3. Ecotourism and Local Economic Growth 30 2.2.3.1. A Case Study of Thailand 30 2.2.3.2. The Potential of Ecotourism 33 2.2.3.3. Definition of Ecotourism in this Thesis 34 2.2.4. Strategy for Sustainable Development of Tourism 34 2.2.4.1. New Zealand’s Tourism Strategy 2015 (2007) 35 2.2.4.2. Discussion 40 2.3. Sustainable Architecture 40 2.3.1. Historic Perspective on Sustainable Architecture 40 2.3.2. Learning from Vernacular Architecture 42 2.3.2.1. The Clustered Villages of Nuristan- Afghanistan 43 2.3.3. Sustainable or Green Architecture 44 2.3.4. Sustainable Architecture and Environment 46 2.3.5. Sustainable Architecture and Culture 46 2.3.6. The Historical City of Kerman 47 2.3.6.1. General View of Kerman City 47 2.3.6.2. Kerman City - Structure and Elements 49 2.3.6.3. Economy 59 2.3.6.4. The Main Characteristics of Kerman’s Architecture 60 2.4. Ecotourism and Its Architecture through Sustainable Development 61 2.5. Knowledge Gap and Research Justification 61 2.5.1. Shortage of Integrated Strategies 62
ii | P a g e
2.5.1.1. Linkage between Anticipated Outcomes 62 2.5.1.2. Linkage between Forecasted Priorities 62 2.5.1.3. Linkage between the Indicators 63 2.5.1.4. Deficit of an Integrated Method to view Ecotourism and Architecture 63 2.6. Research Question 64 2.6.1. Sub Research Questions 65 2.6.2. Key Research Question 65 Chapter 2: Summary 65
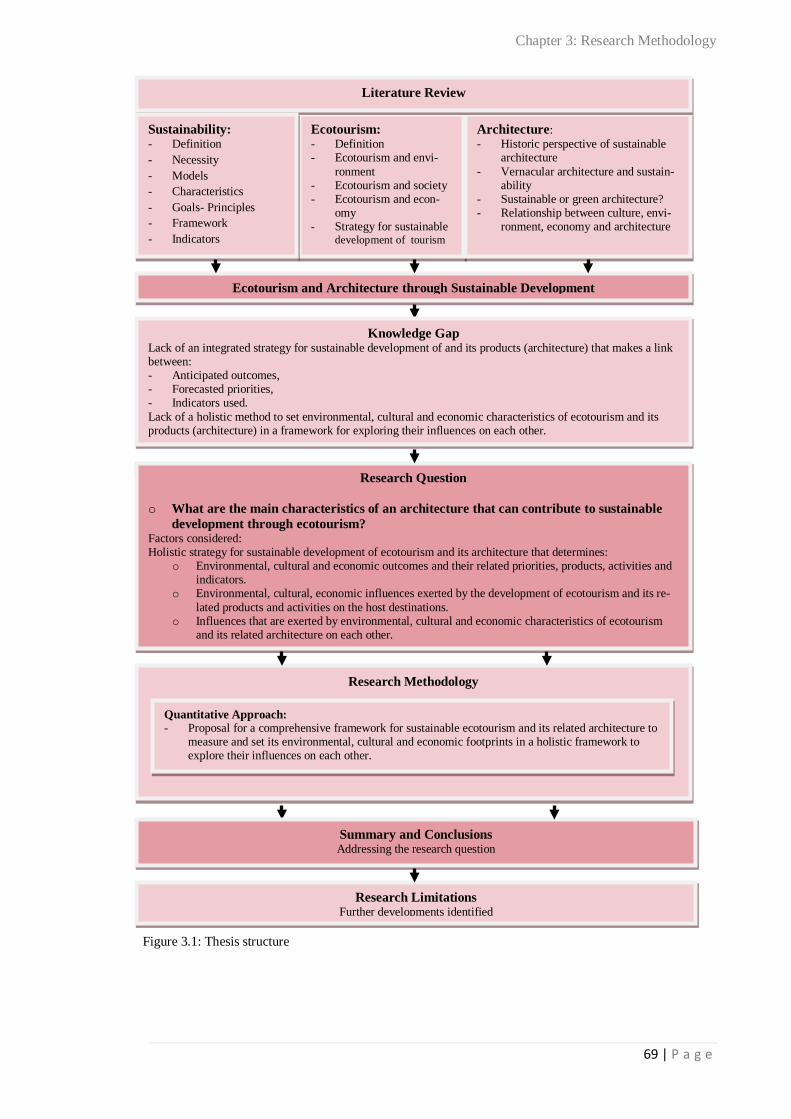
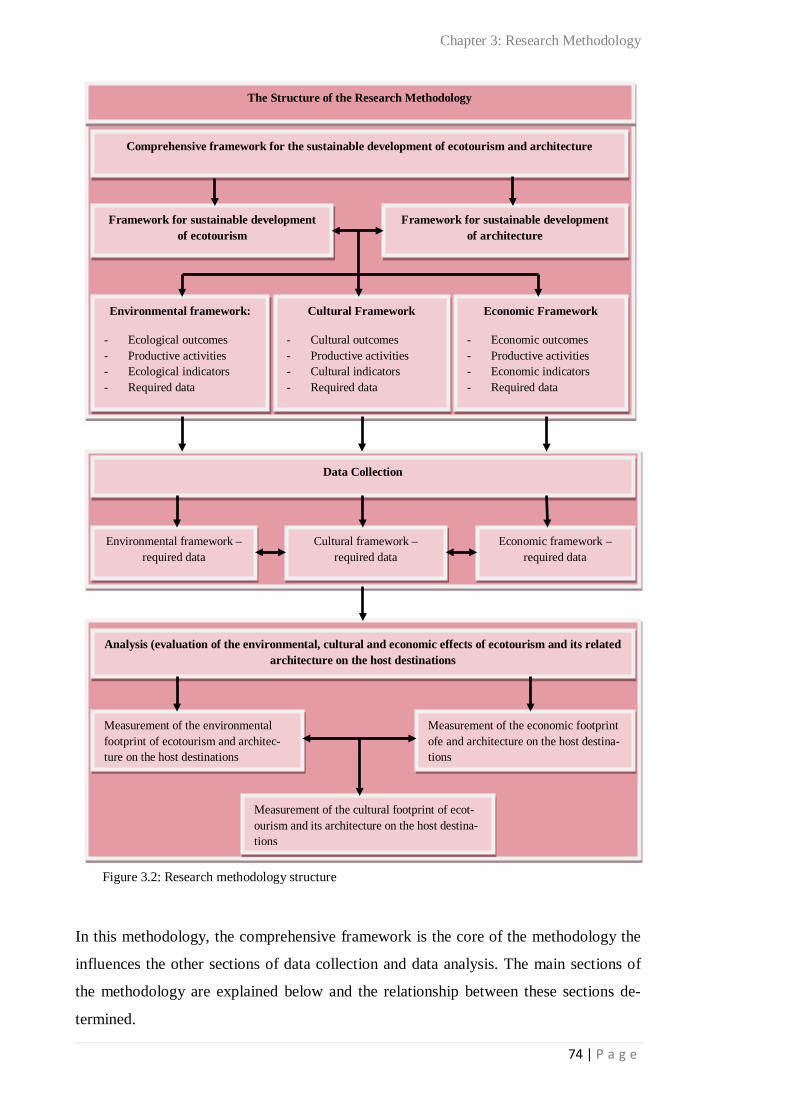
3. Chapter 3: Methodology 68 3.1. Introduction 68 3.2. Research Structure 68 3.3. Justification of the Research Methodology 70 3.3.1. Methodological Problems 71 3.3.2. Research Case Studies 71 3.3.2.1. OCRT 71 3.3.2.2. Second Case Study: Naseby 72 3.3.2.3. Third Case Study: Cromwell 73 3.4. The Structure of Methodology 73 3.4.1. A Comprehensive Framework for Sustainable Development of Ecotourism
and its Architecture 75
3.4.1.1. Framework for Sustainable Development of Ecotourism 75 3.4.1.2. Framework for the Sustainable Development of Architecture 76 3.4.2. Data Collection 77 3.4.2.1. Visitor Data 78 3.4.2.2. Data Related to Facilities, Services and Products 78 3.4.2.3. Tourism Activities Data 78 3.4.3. Data Analysis 78 3.4.3.1. Analysis at the Regional Scale 78 3.4.3.2. Analysis at the Site/Individual Building Scale 84 3.5. Importance and Limitations 85 3.5.1. Importance of the Methodology 85 3.5.1.1. Comprehensive Approach 85 3.5.1.2. The Integration of Environmental, Social and Economic Indicators 85 3.5.1.3. Compatibility with Quantitative Methodologies 85 3.5.1.4. Using Existing Information Systems and Available Technologies 85 3.5.1.5. Indicating Required Data through Related Indicators 85 3.5.1.6. Integrated Analysis 86 3.5.2. Limitations. 86 3.5.2.1. Shortcoming of Available Information Systems 86 3.5.2.2. Accuracy 86 Chapter 3: Summary 86 4. Chapter 4: Comprehensive Framework for the Sustainable Devel-
opment of Ecotourism and Its Related Architecture 89
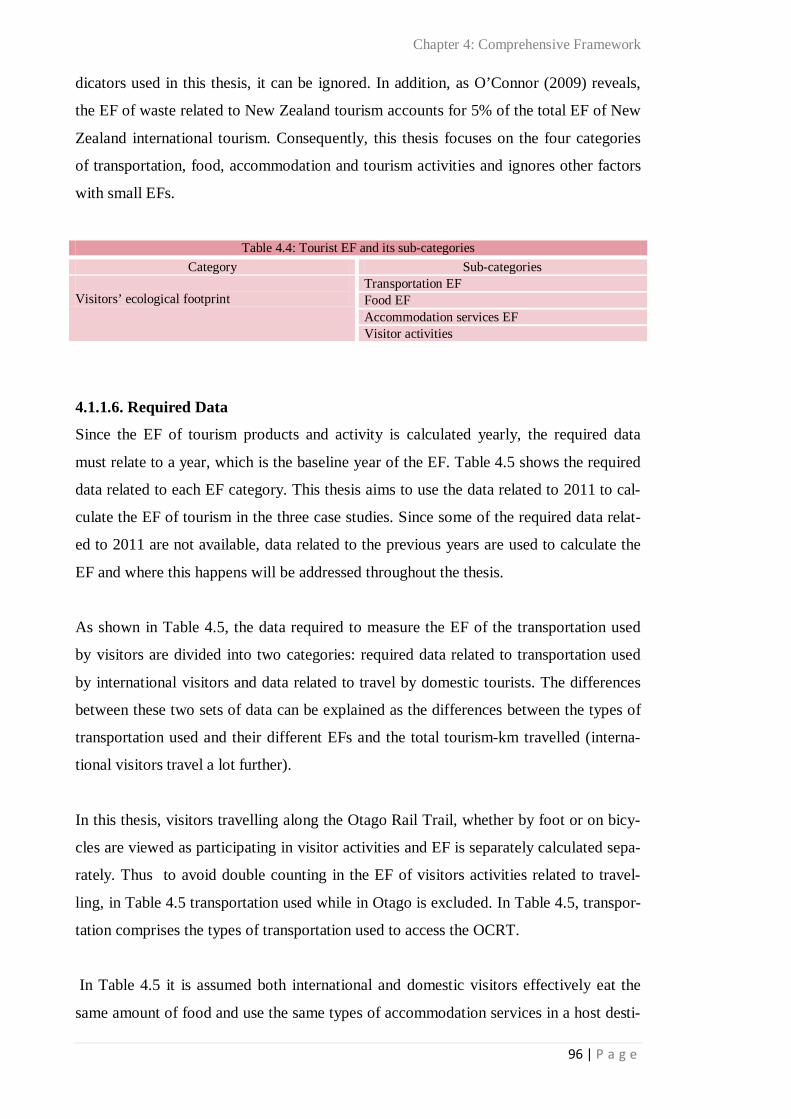
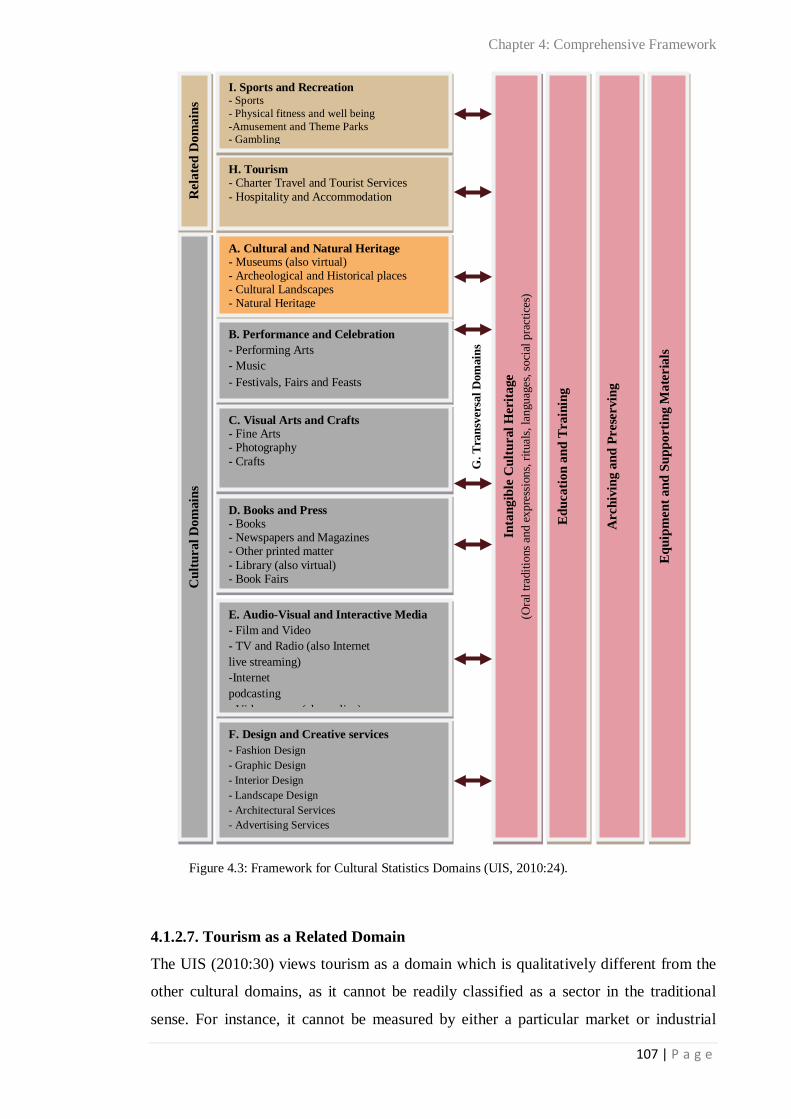
4.1. A Framework for Assessing the Sustainable Development of Ecotourism 89 4.1.1. Ecological Framework for the Sustainable Development of Ecotourism 89 4.1.1.1. Environment and Framework for Development of Ecotourism 90 4.1.1.2. Ecological Framework and Environmental Awareness 91 4.1.1.3. Social- Ecological Goals for Ecotourism Development 92 4.1.1.4. Definition of an Indicator 93 4.1.1.5. EF by Types of Ecotourism Products and Activities 95 4.1.1.6. Required data 96 4.1.1.7. Discussion 97 4.1.2. Cultural Framework for Sustainable Development of Ecotourism 98 4.1.2.1. Culture 99 4.1.2.2. Culture and Environment 101 4.1.2.3. Culture and Development 102 4.1.2.4. FCS- a Framework for Cultural Statistics 103 4.1.2.5. Culture Cycle 104 4.1.2.6. Cultural and Related Domains 105
iii | P a g e
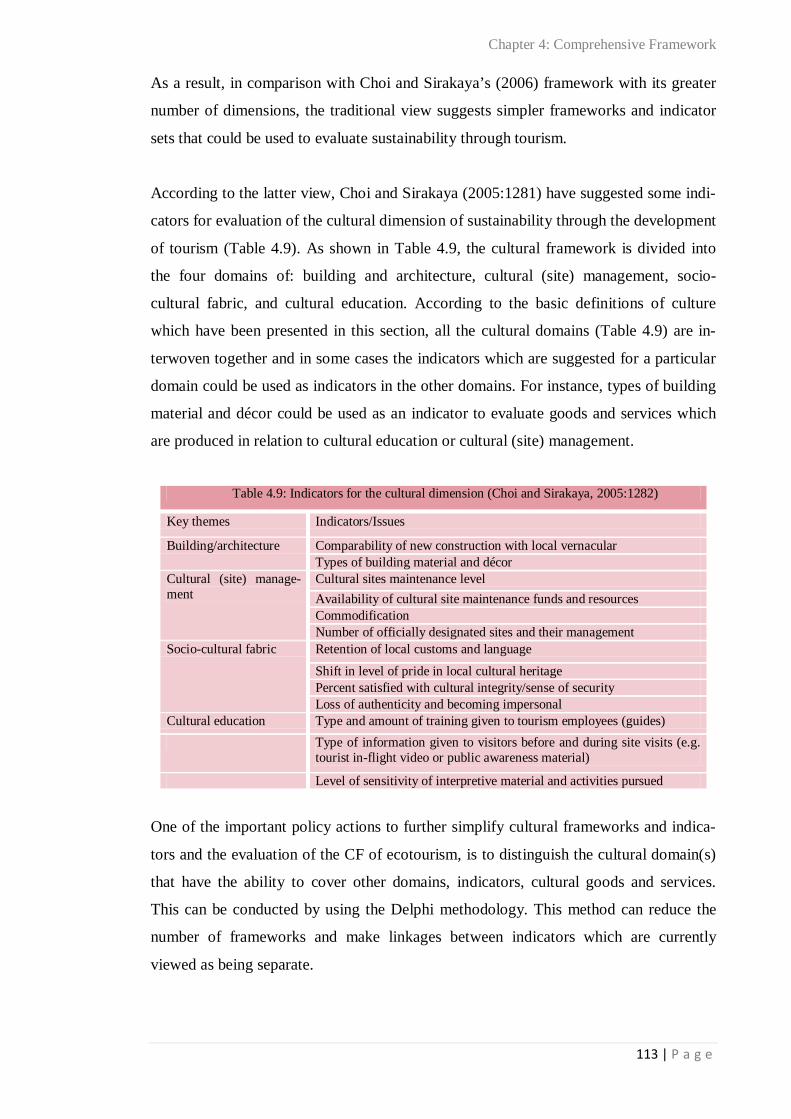
4.1.2.7. Tourism as a Related Domain 107 4.1.2.8. Tourism and Transversal Domains 109 4.1.2.9. G- Transversal Domains (Intangible Cultural Heritage) 109 4.1.2.10. Education and Training 110 4.1.2.11. Cultural Capital and Production of Goods and Services 110 4.1.2.12. Cultural frameworks and Indicators for the Evaluation of Tourism Products:
examples 112
4.1.2.13. Cultural Framework for Sustainable Development of Ecotourism 120 4.1.3. Economic Framework for Sustainable Development of Ecotourism 137 4.1.3.1. Socio-Cultural Outcomes 137 4.1.3.2. Environmental Outcome 138 4.1.3.3. Economic Indicators 139 4.1.4. Cultural Footprint of Ecotourism 141 4.1.4.1. Definition 141 4.1.4.2. CF Model 143 4.2. Comprehensive Framework for Sustainable Development of Architecture 148 4.2.1. Environmental Framework for Sustainable Development of Ecotourism Ar-
chitecture 149
4.2.1.1. Environmental Outcomes 149 4.2.1.2. Ecological Indicators 150 4.2.1.3. Required Data 150 4.2.2. Cultural Framework for Sustainable Architecture Used in Ecotourism Devel-
opment 151
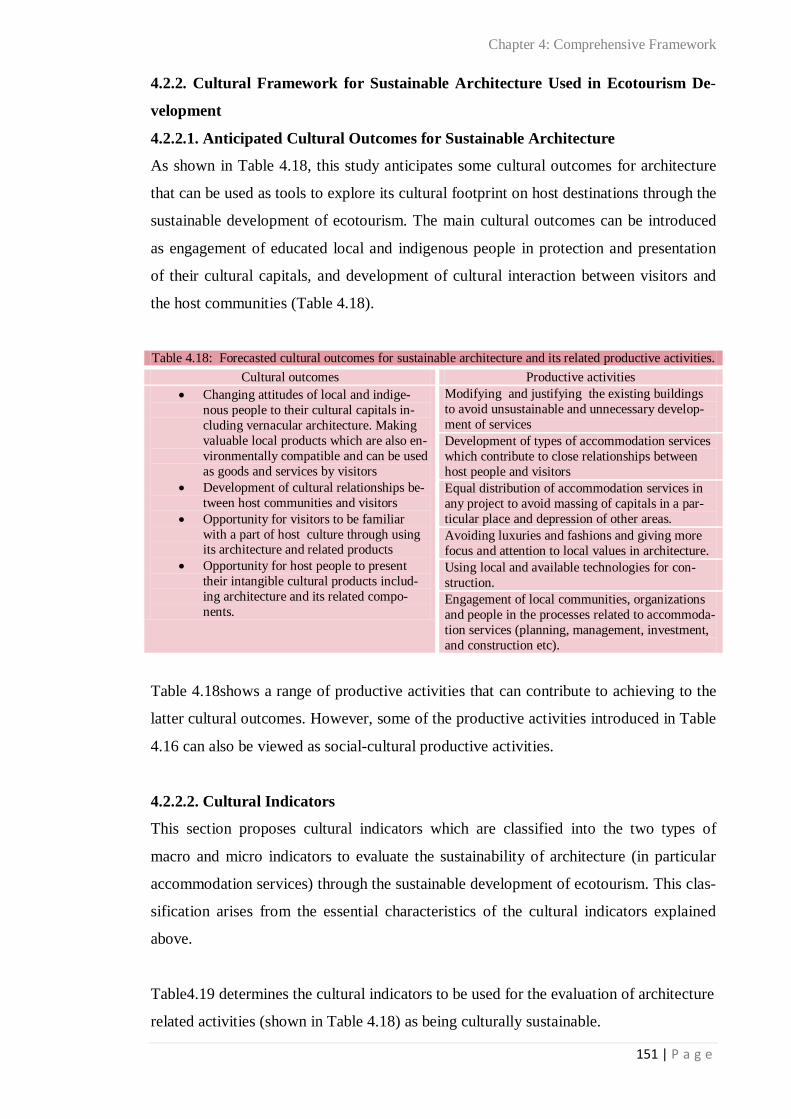
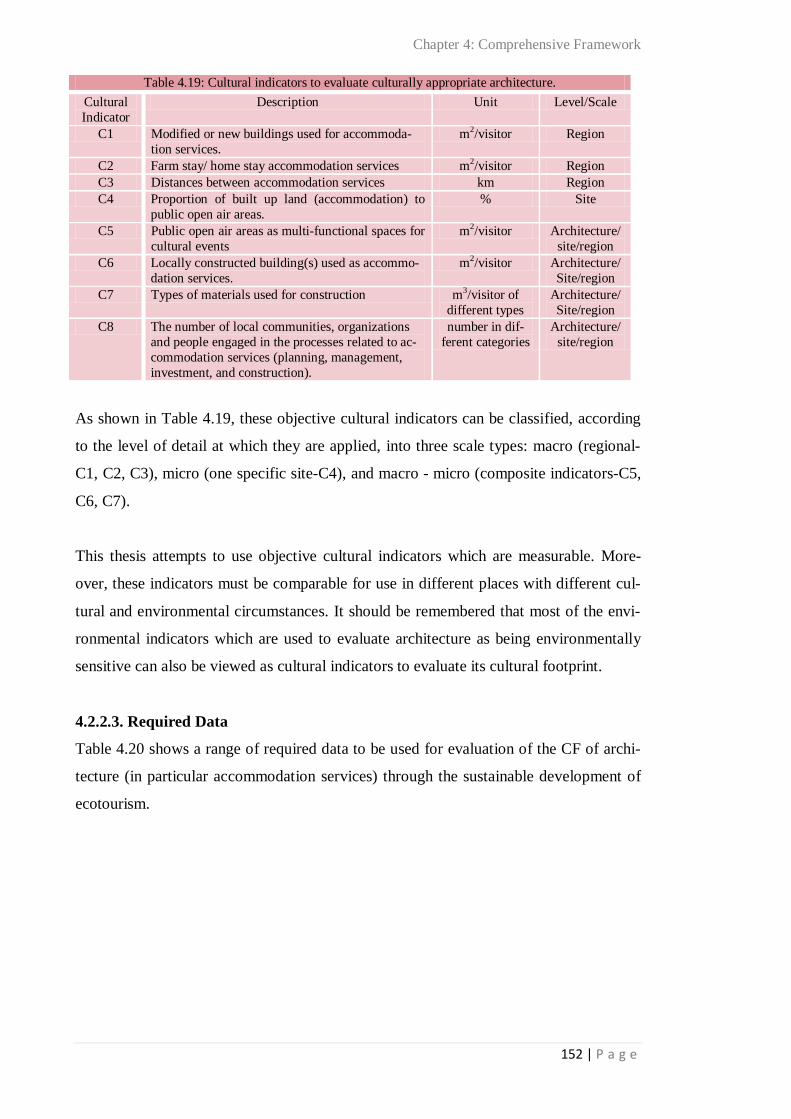
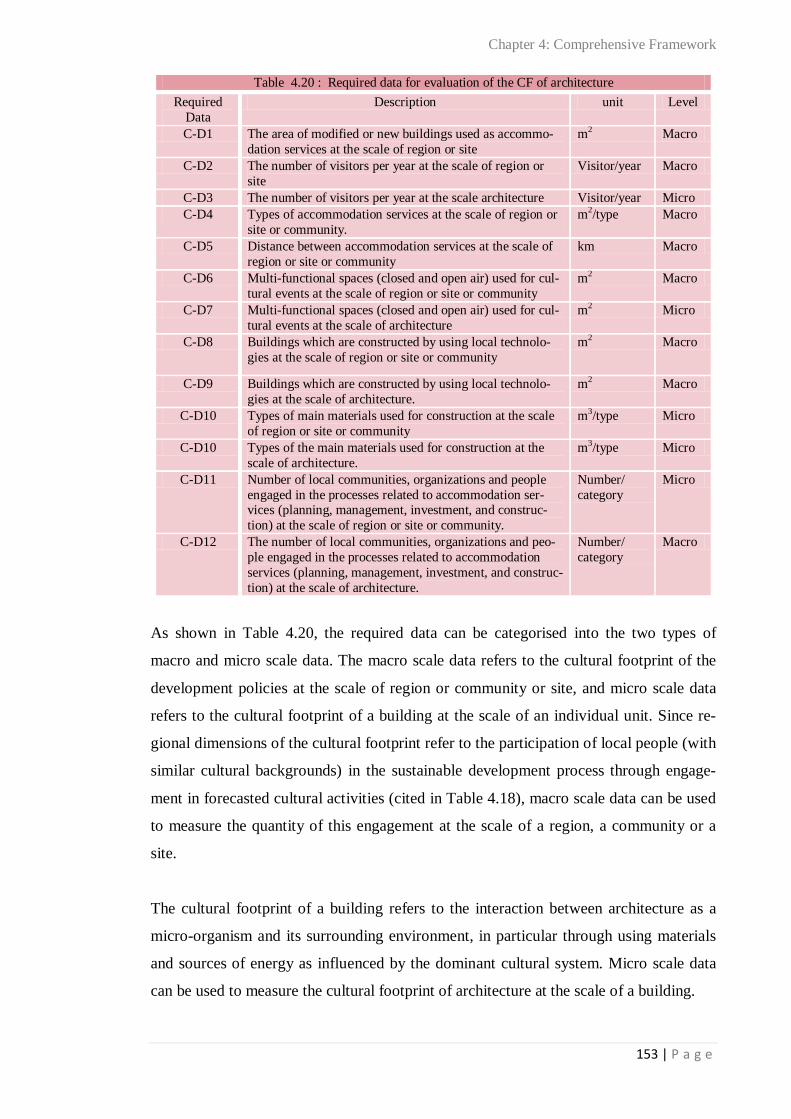
4.2.2.1. Anticipated Cultural Outcomes for Sustainable Architecture 151 4.2.2.2. Cultural Indicators 151 4.2.2.3. Required Data 152 4.2.3. Economic Framework 154 4.2.3.1. Environmental Outcomes and Activities 154 4.2.3.2. Indicator 155 4.2.3.3. Cultural Outcomes and Activities 155 4.2.3.4. Indicators 155 4.2.4. CF of Architecture 155 Chapter 4: Summary 156 5. Chapter 5: First Case Study – Otago Central Rail Trail (OCRT),
Otago, New Zealand 162
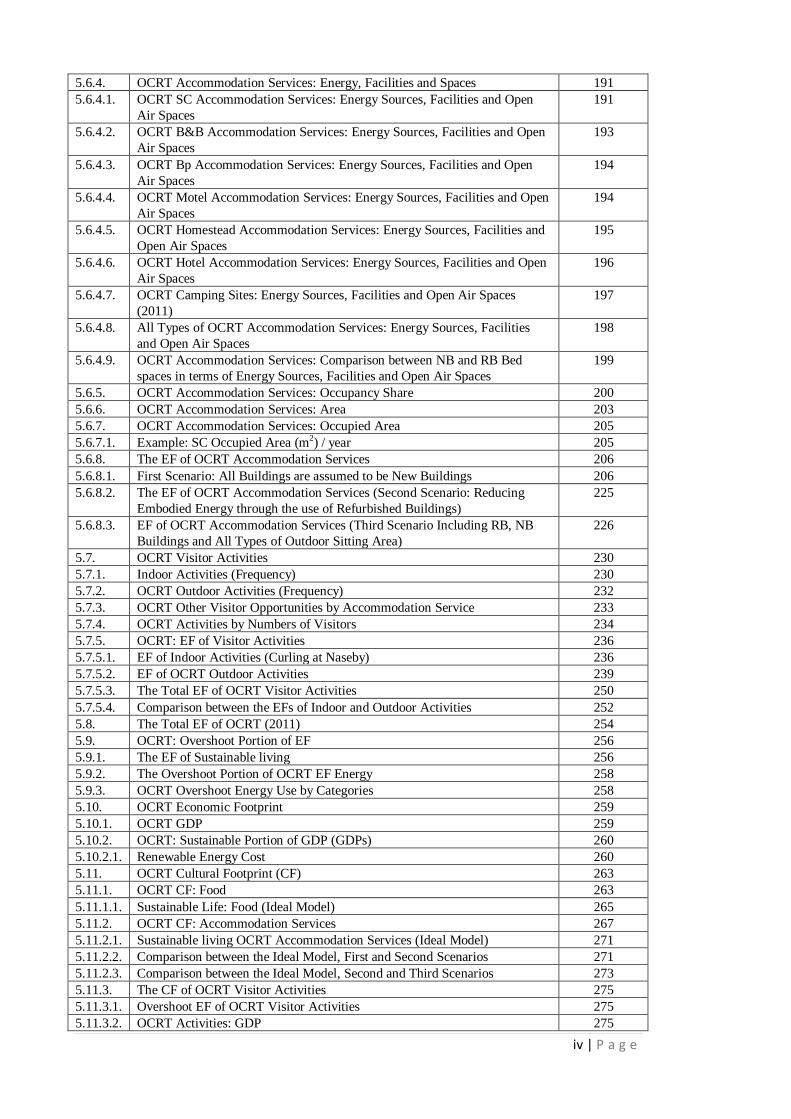
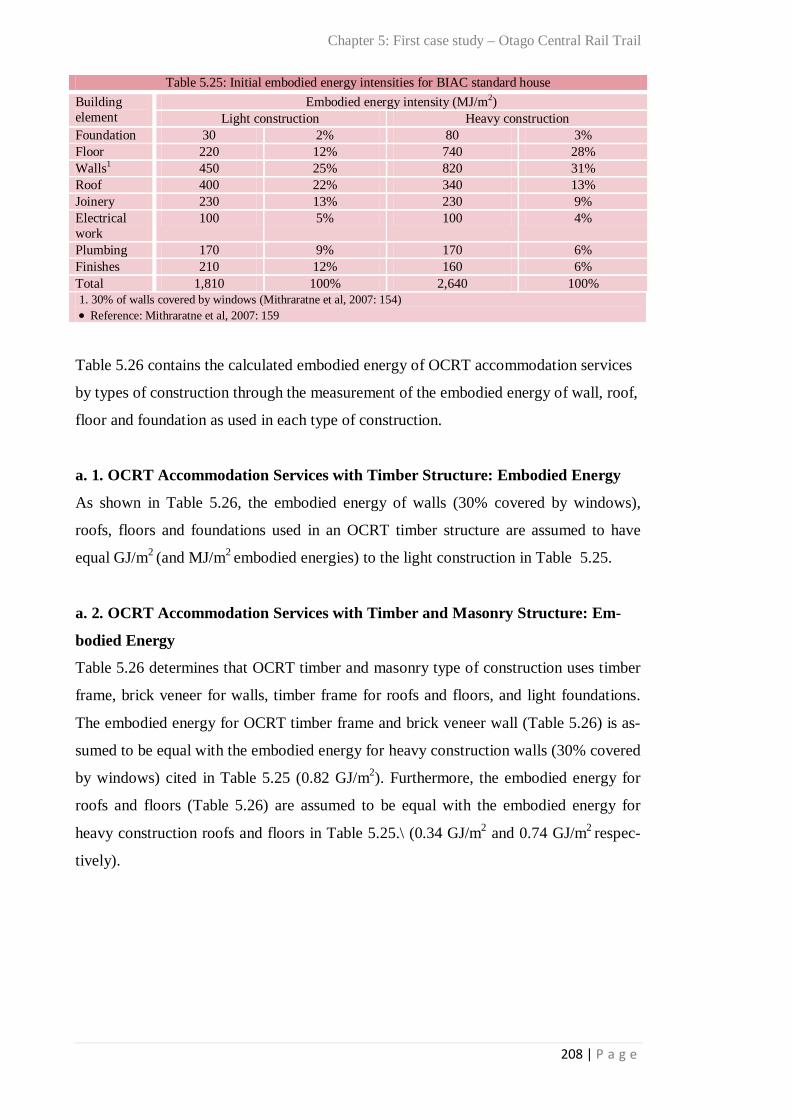
5.1. Introduction 162 5.2. OCRT- Background 162 5.3. OCRT-Visitors 166 5.3.1. OCRT- Visitor Numbers 166 5.3.2. OCRT- Average Visitor Nights 167 5.3.3. OCRT Visitor Home Place 168 5.3.3.1. OCRT International Visitors 170 5.3.3.2. OCRT Domestic Visitors 172 5.4. OCRT Transportation 173 5.4.1. OCRT- Types of International Transportation 174 5.4.2. OCRT Types of Domestic Transportation 175 5.4.2.1. OCRT Domestic Tourist-Kilometres (T-km) 176 5.4.3. The Ecological Footprint (EF) of OCRT-Transportation 177 5.4.3.1. Scenario 1 for Domestic Visitors 177 5.4.3.2. Scenario 2 for Domestic Visitors 178 5.4.3.3. OCRT- Transport EF 178 5.5. OCRT: Food 178 5.5.1. The EF of OCRT Consumed Food—First Scenario 179 5.5.2. The EF of OCRT Consumed Food—Second Scenario 180 5.5.3. Environmental Effects of Using Local Food 183 5.6. OCRT Built up land: Accommodation Services 183 5.6.1. OCRT: Types of Accommodation Service 183 5.6.2. Quality of OCRT Accommodation Services 184 5.6.3. OCRT Accommodation Services: Materials Used 188
iv | P a g e
5.6.4. OCRT Accommodation Services: Energy, Facilities and Spaces 191 5.6.4.1. OCRT SC Accommodation Services: Energy Sources, Facilities and Open
Air Spaces 191
5.6.4.2. OCRT B&B Accommodation Services: Energy Sources, Facilities and Open Air Spaces
193
5.6.4.3. OCRT Bp Accommodation Services: Energy Sources, Facilities and Open Air Spaces
194
5.6.4.4. OCRT Motel Accommodation Services: Energy Sources, Facilities and Open Air Spaces
194
5.6.4.5. OCRT Homestead Accommodation Services: Energy Sources, Facilities and Open Air Spaces
195
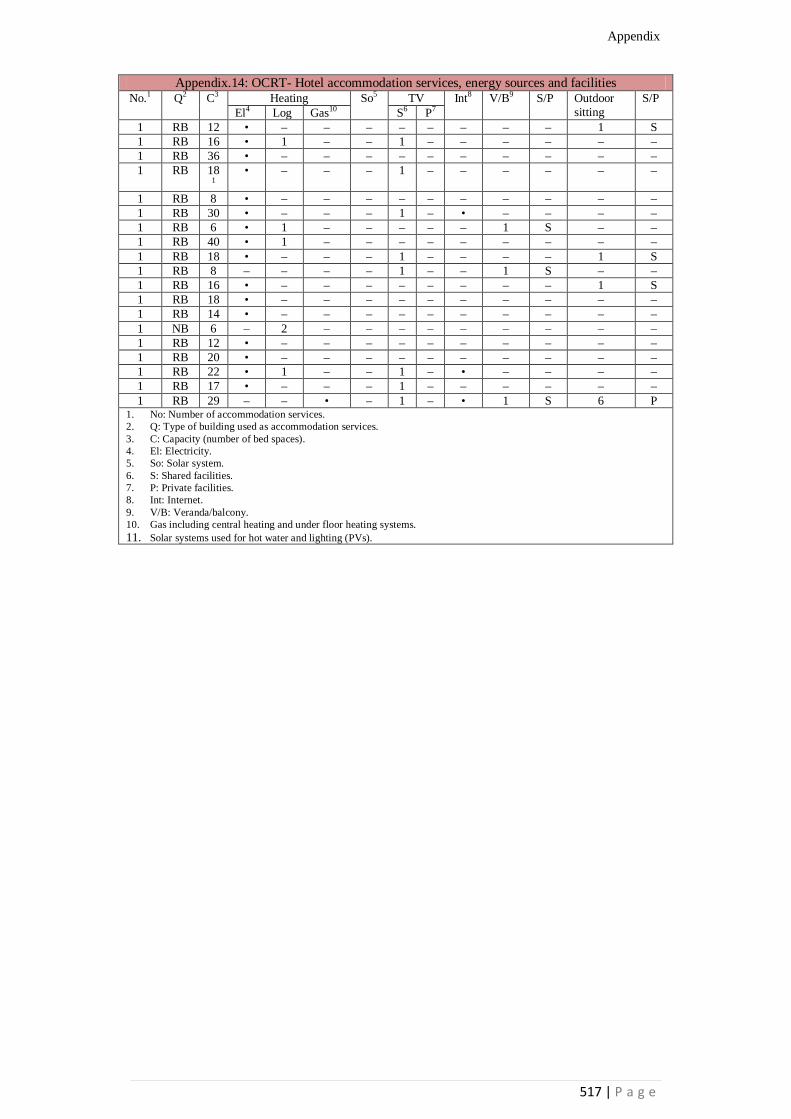
5.6.4.6. OCRT Hotel Accommodation Services: Energy Sources, Facilities and Open Air Spaces
196
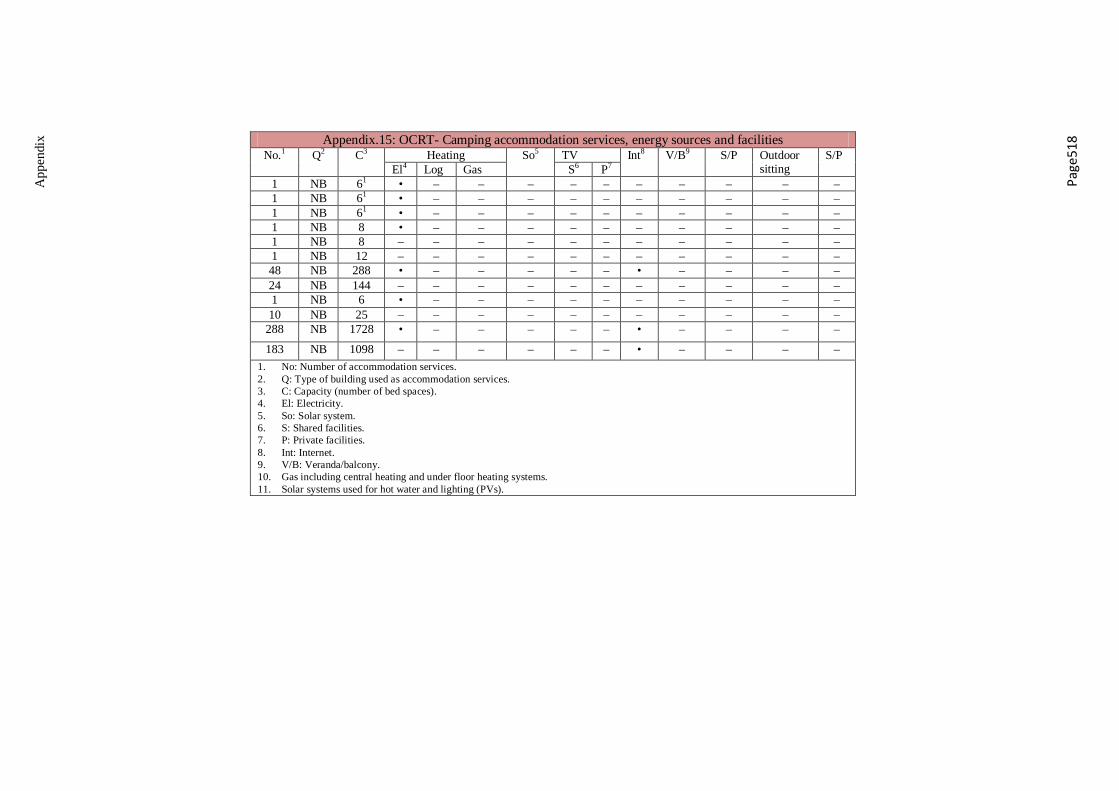
5.6.4.7. OCRT Camping Sites: Energy Sources, Facilities and Open Air Spaces (2011)
197
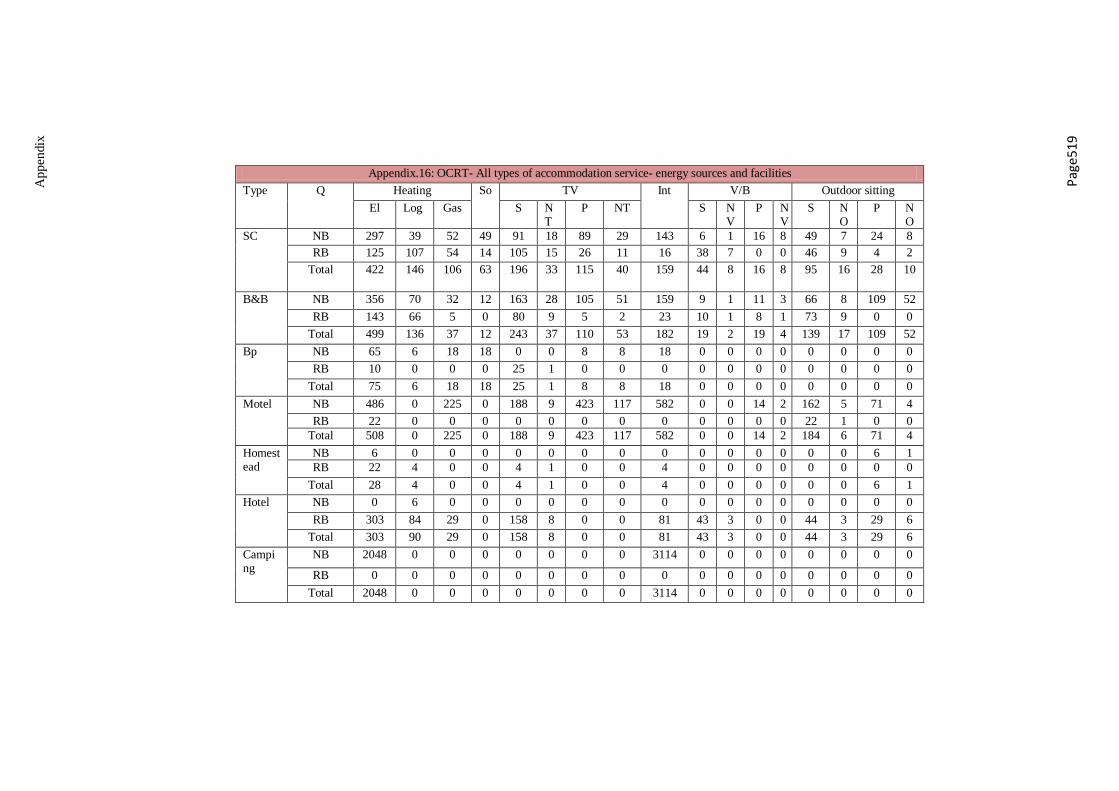
5.6.4.8. All Types of OCRT Accommodation Services: Energy Sources, Facilities and Open Air Spaces
198
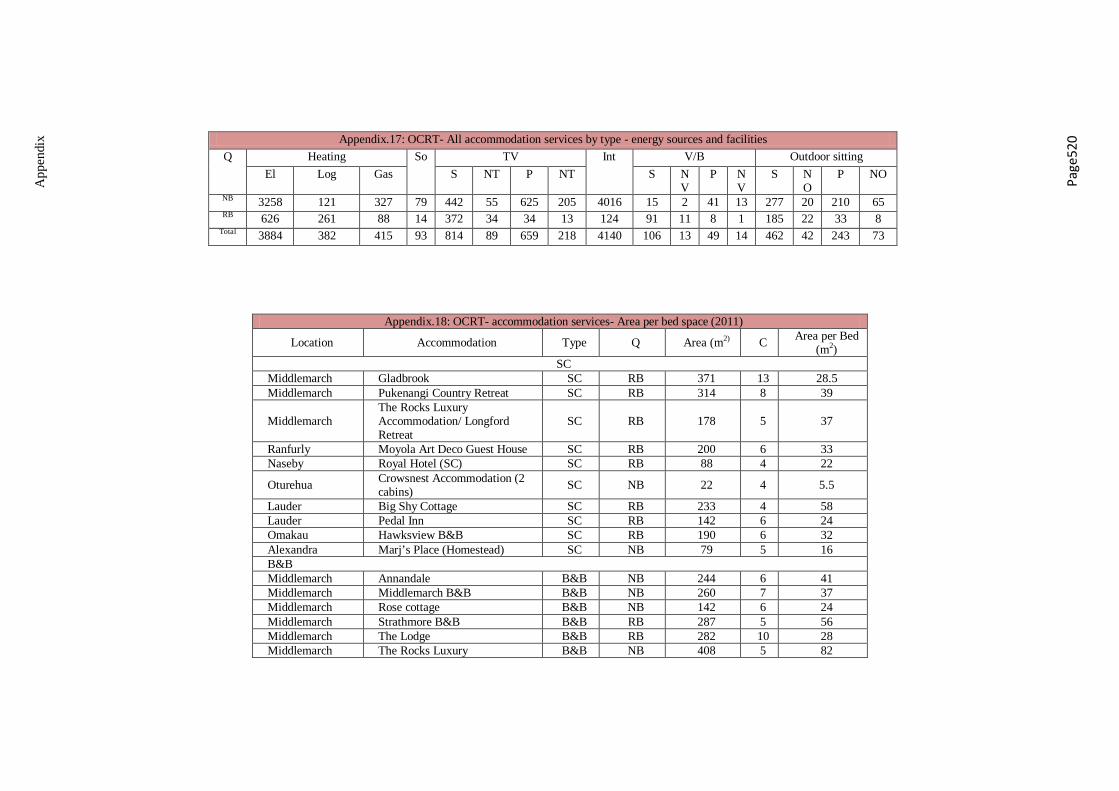
5.6.4.9. OCRT Accommodation Services: Comparison between NB and RB Bed spaces in terms of Energy Sources, Facilities and Open Air Spaces
199
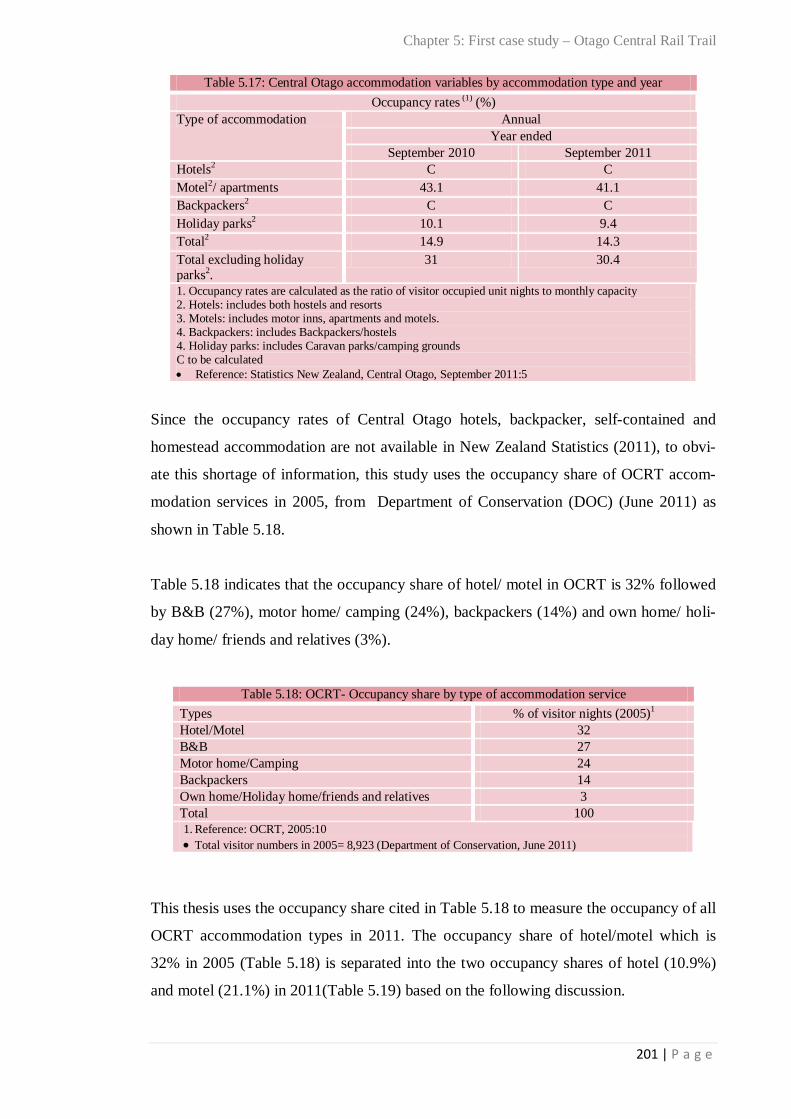
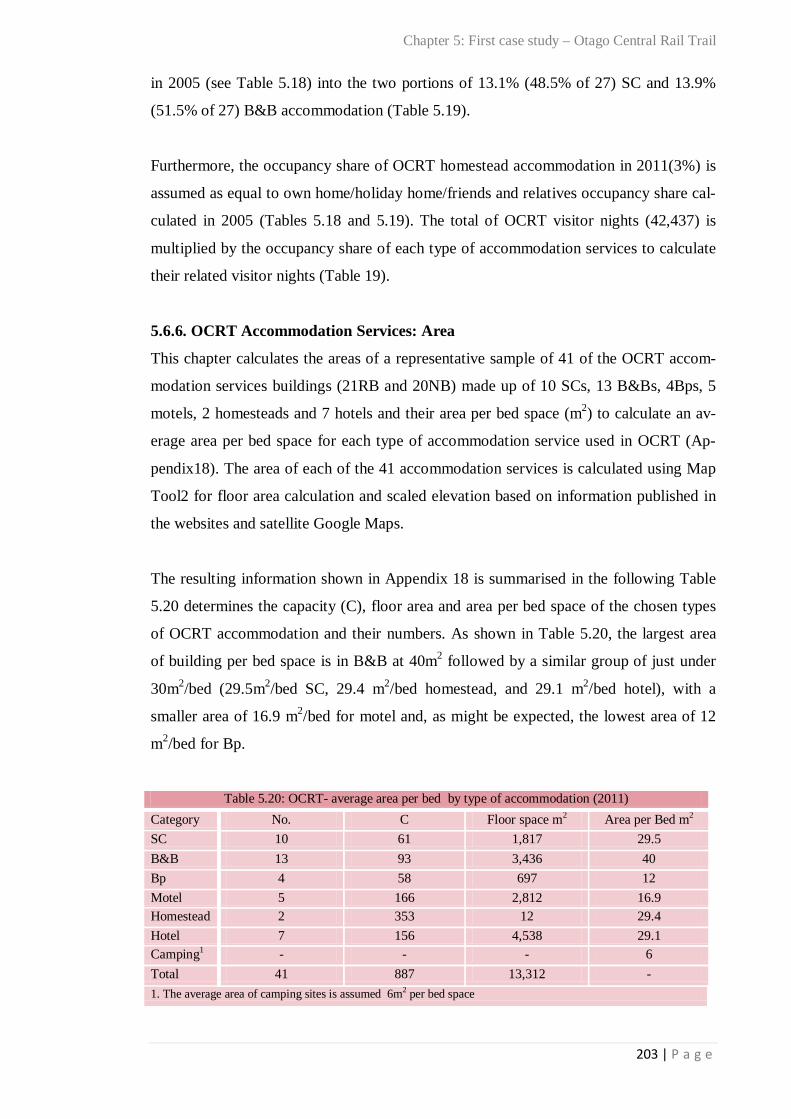
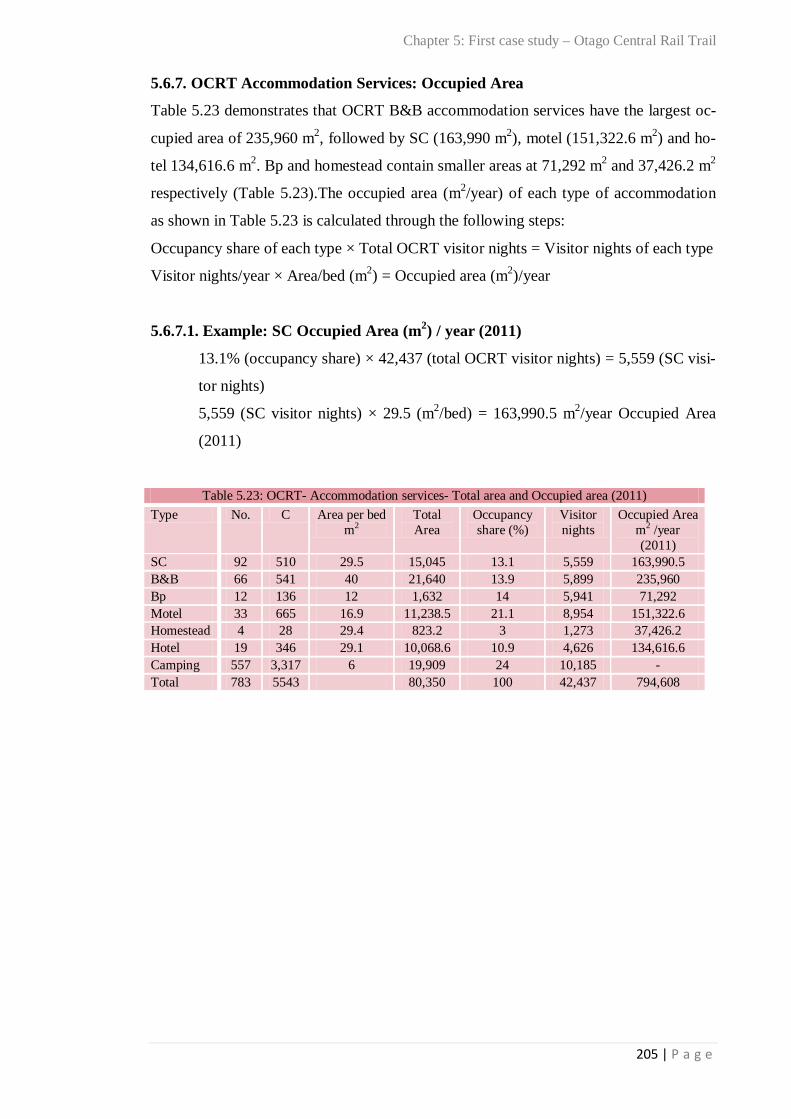
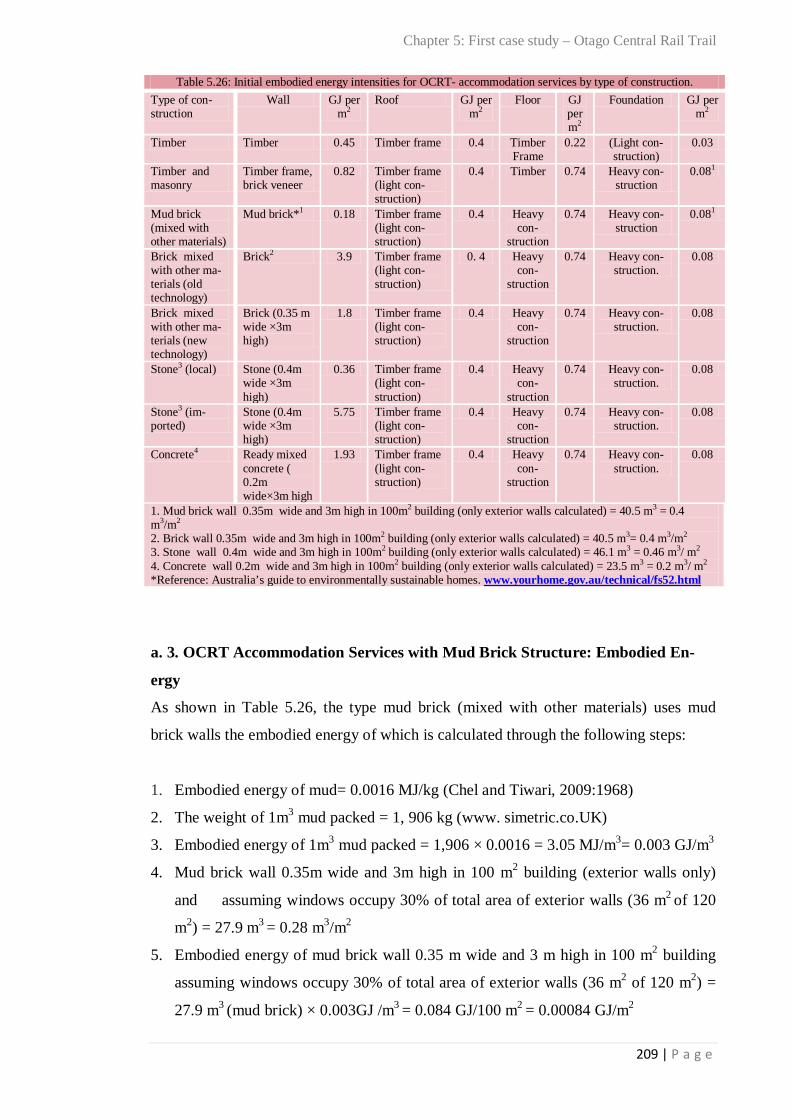
5.6.5. OCRT Accommodation Services: Occupancy Share 200 5.6.6. OCRT Accommodation Services: Area 203 5.6.7. OCRT Accommodation Services: Occupied Area 205 5.6.7.1. Example: SC Occupied Area (m2) / year 205 5.6.8. The EF of OCRT Accommodation Services 206 5.6.8.1. First Scenario: All Buildings are assumed to be New Buildings 206 5.6.8.2. The EF of OCRT Accommodation Services (Second Scenario: Reducing
Embodied Energy through the use of Refurbished Buildings) 225
5.6.8.3. EF of OCRT Accommodation Services (Third Scenario Including RB, NB Buildings and All Types of Outdoor Sitting Area)
226
5.7. OCRT Visitor Activities 230 5.7.1. Indoor Activities (Frequency) 230 5.7.2. OCRT Outdoor Activities (Frequency) 232 5.7.3. OCRT Other Visitor Opportunities by Accommodation Service 233 5.7.4. OCRT Activities by Numbers of Visitors 234 5.7.5. OCRT: EF of Visitor Activities 236 5.7.5.1. EF of Indoor Activities (Curling at Naseby) 236 5.7.5.2. EF of OCRT Outdoor Activities 239 5.7.5.3. The Total EF of OCRT Visitor Activities 250 5.7.5.4. Comparison between the EFs of Indoor and Outdoor Activities 252 5.8. The Total EF of OCRT (2011) 254 5.9. OCRT: Overshoot Portion of EF 256 5.9.1. The EF of Sustainable living 256 5.9.2. The Overshoot Portion of OCRT EF Energy 258 5.9.3. OCRT Overshoot Energy Use by Categories 258 5.10. OCRT Economic Footprint 259 5.10.1. OCRT GDP 259 5.10.2. OCRT: Sustainable Portion of GDP (GDPs) 260 5.10.2.1. Renewable Energy Cost 260 5.11. OCRT Cultural Footprint (CF) 263 5.11.1. OCRT CF: Food 263 5.11.1.1. Sustainable Life: Food (Ideal Model) 265 5.11.2. OCRT CF: Accommodation Services 267 5.11.2.1. Sustainable living OCRT Accommodation Services (Ideal Model) 271 5.11.2.2. Comparison between the Ideal Model, First and Second Scenarios 271 5.11.2.3. Comparison between the Ideal Model, Second and Third Scenarios 273 5.11.3. The CF of OCRT Visitor Activities 275 5.11.3.1. Overshoot EF of OCRT Visitor Activities 275 5.11.3.2. OCRT Activities: GDP 275
v | P a g e
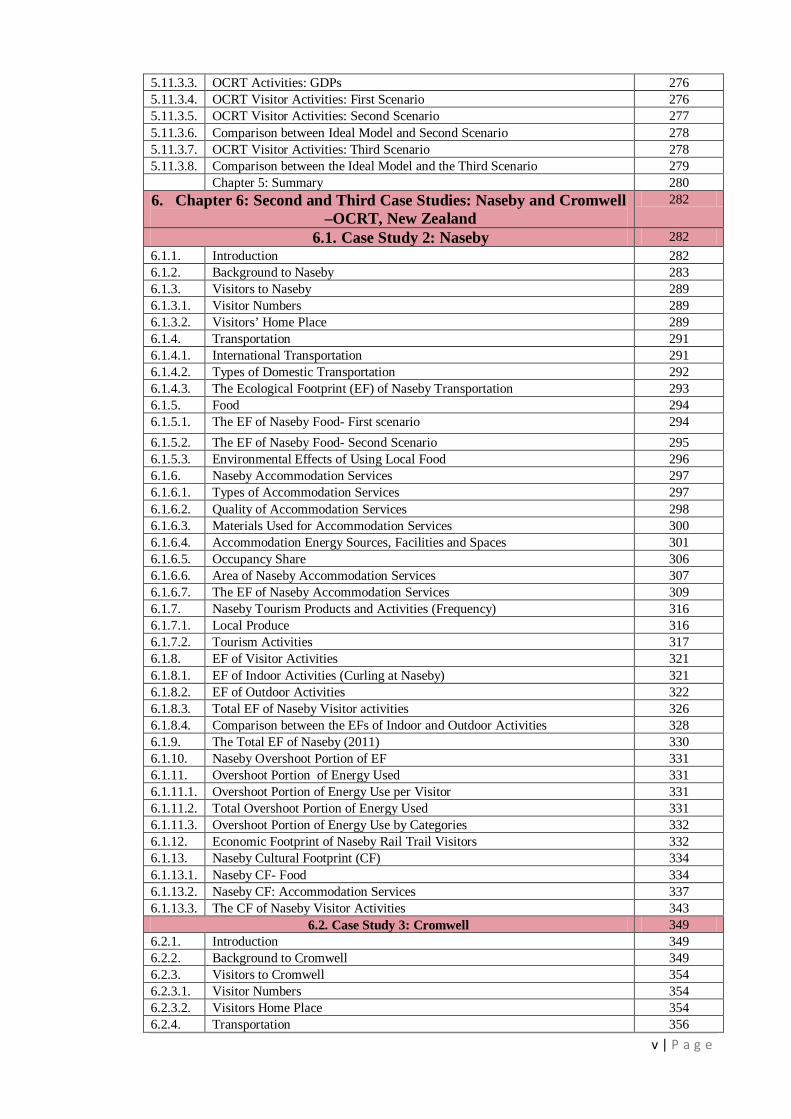
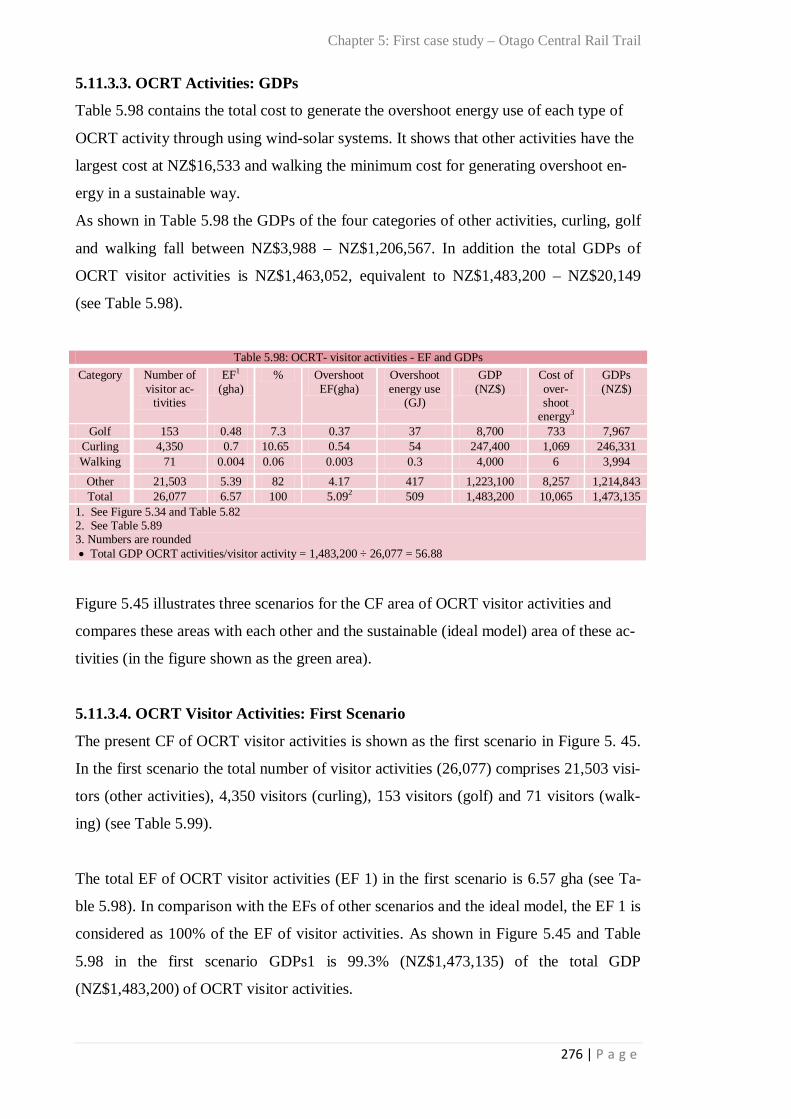
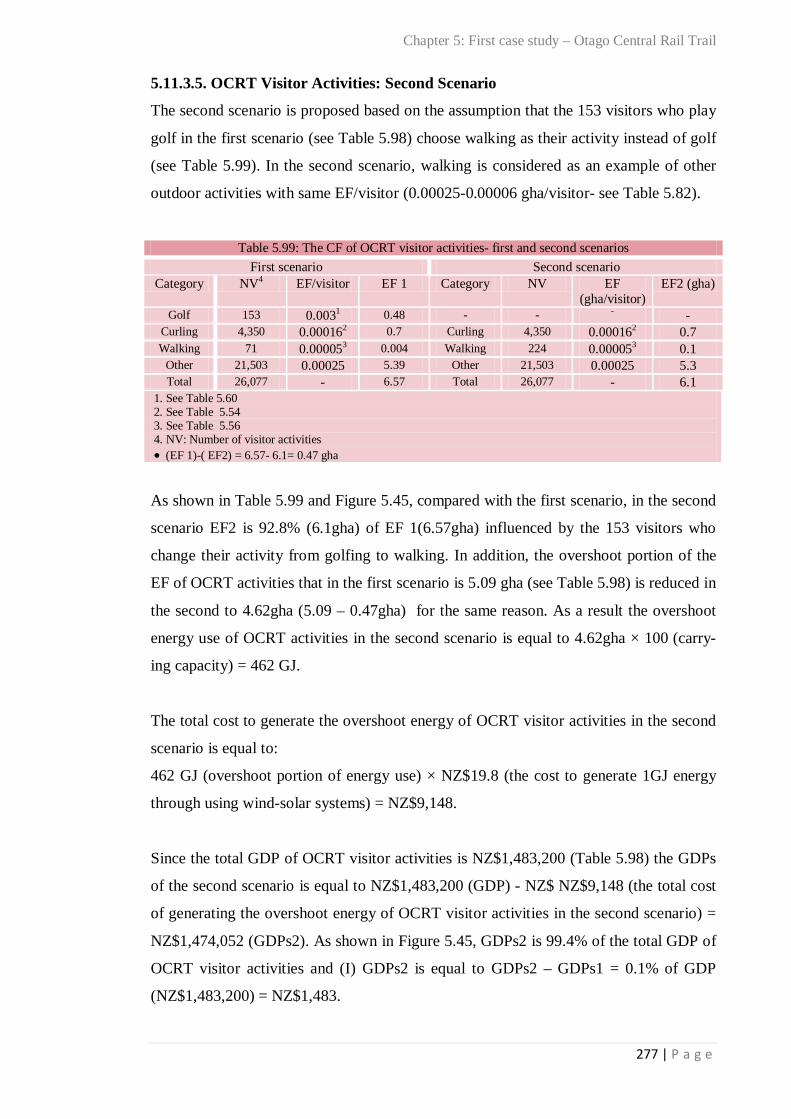
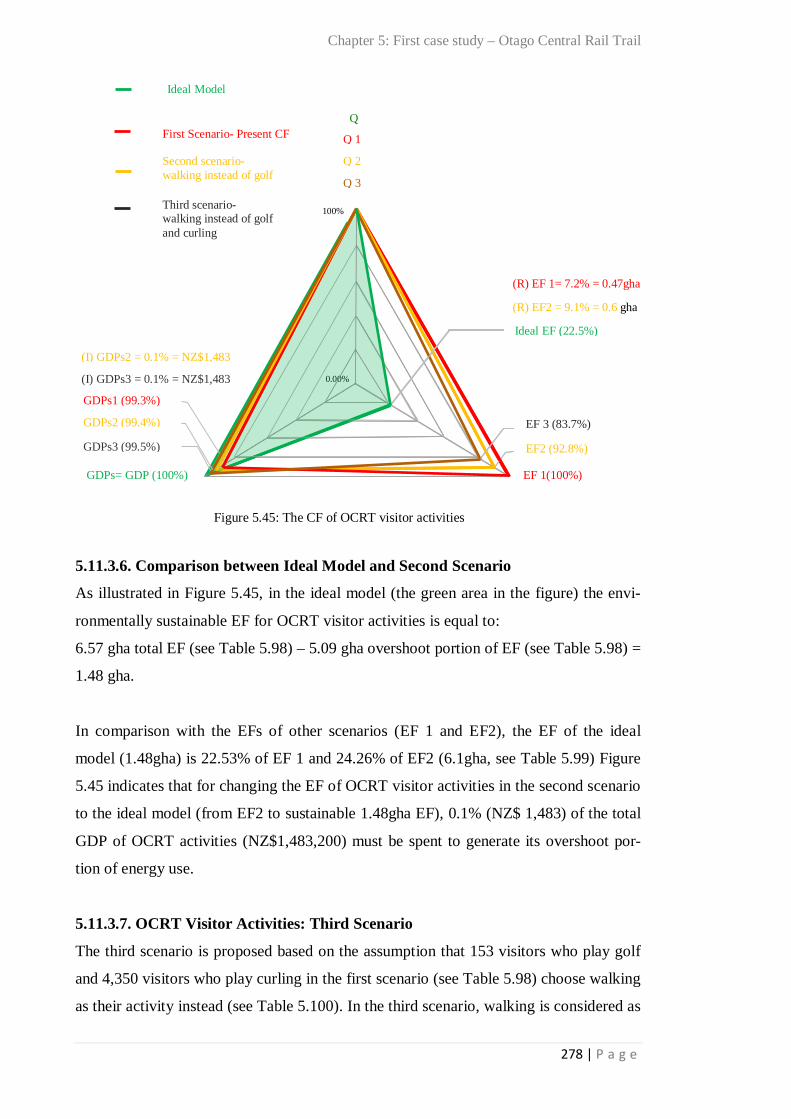
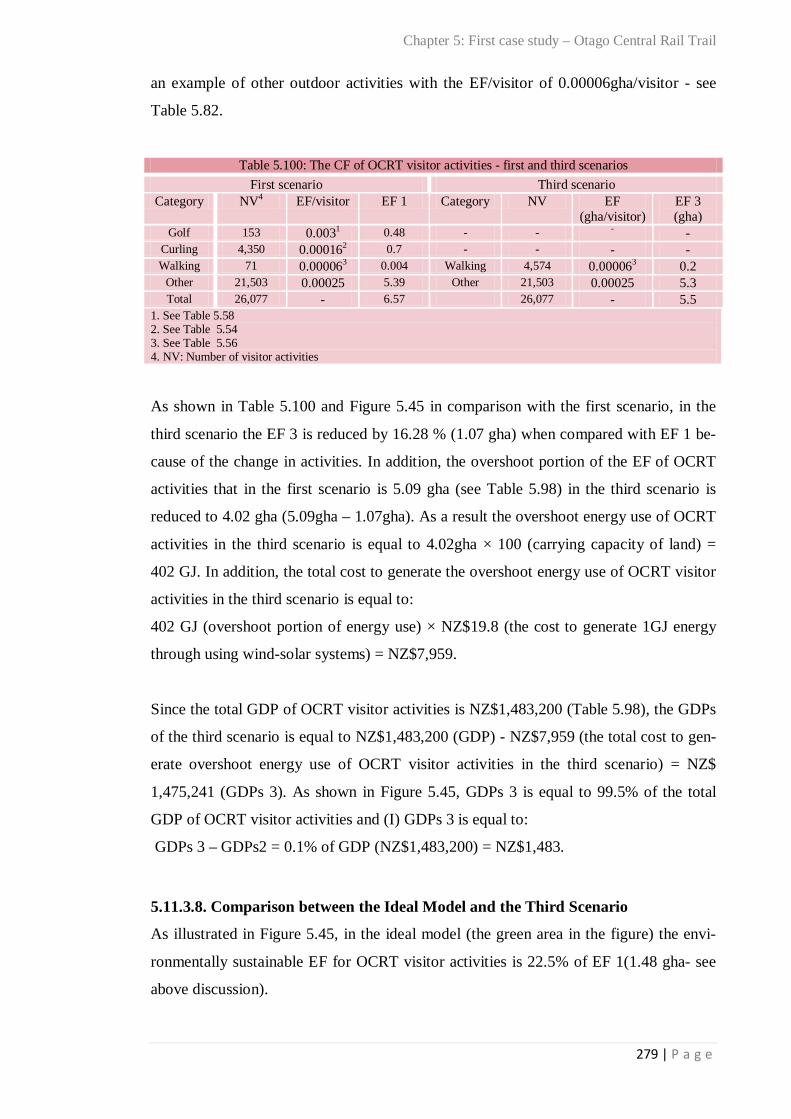
5.11.3.3. OCRT Activities: GDPs 276 5.11.3.4. OCRT Visitor Activities: First Scenario 276 5.11.3.5. OCRT Visitor Activities: Second Scenario 277 5.11.3.6. Comparison between Ideal Model and Second Scenario 278 5.11.3.7. OCRT Visitor Activities: Third Scenario 278 5.11.3.8. Comparison between the Ideal Model and the Third Scenario 279 Chapter 5: Summary 280 6. Chapter 6: Second and Third Case Studies: Naseby and Cromwell
–OCRT, New Zealand 282
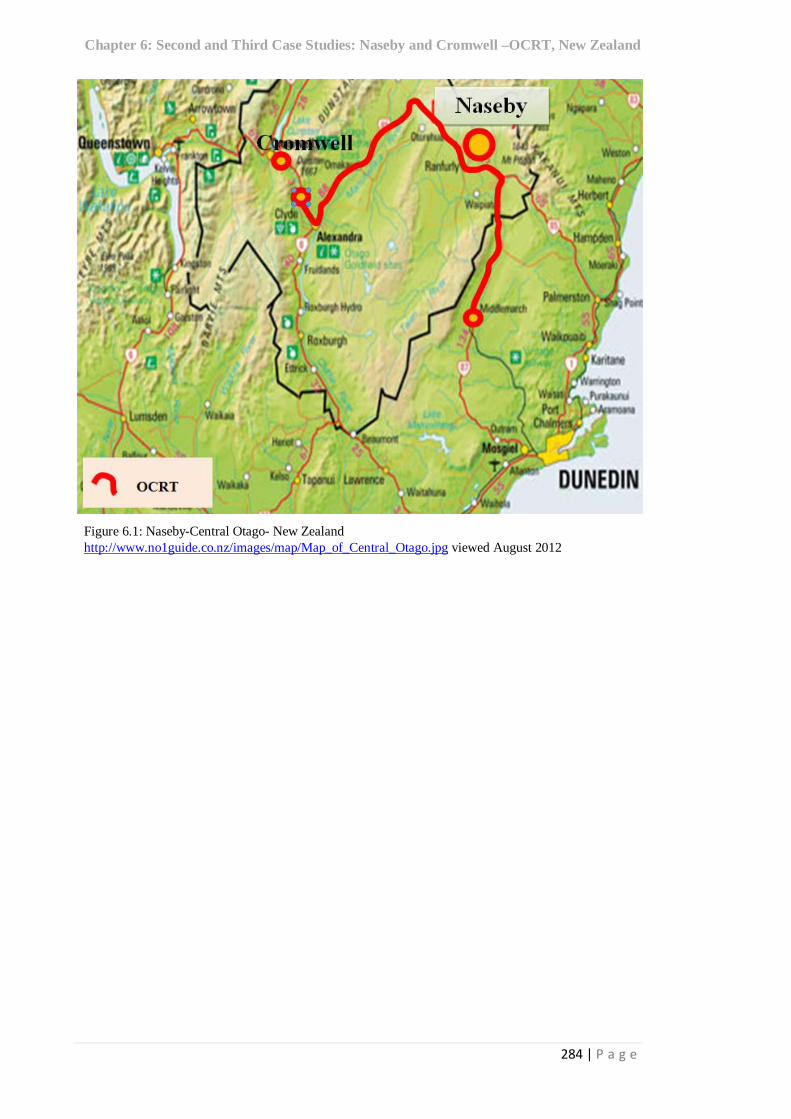
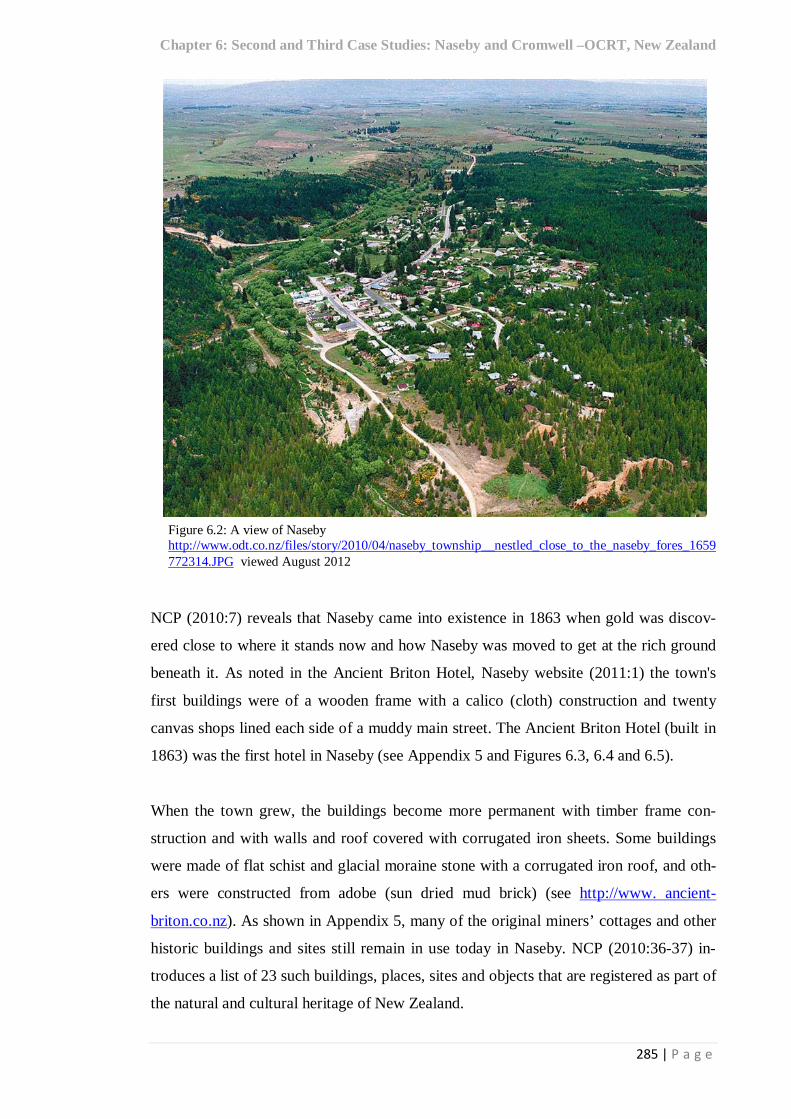
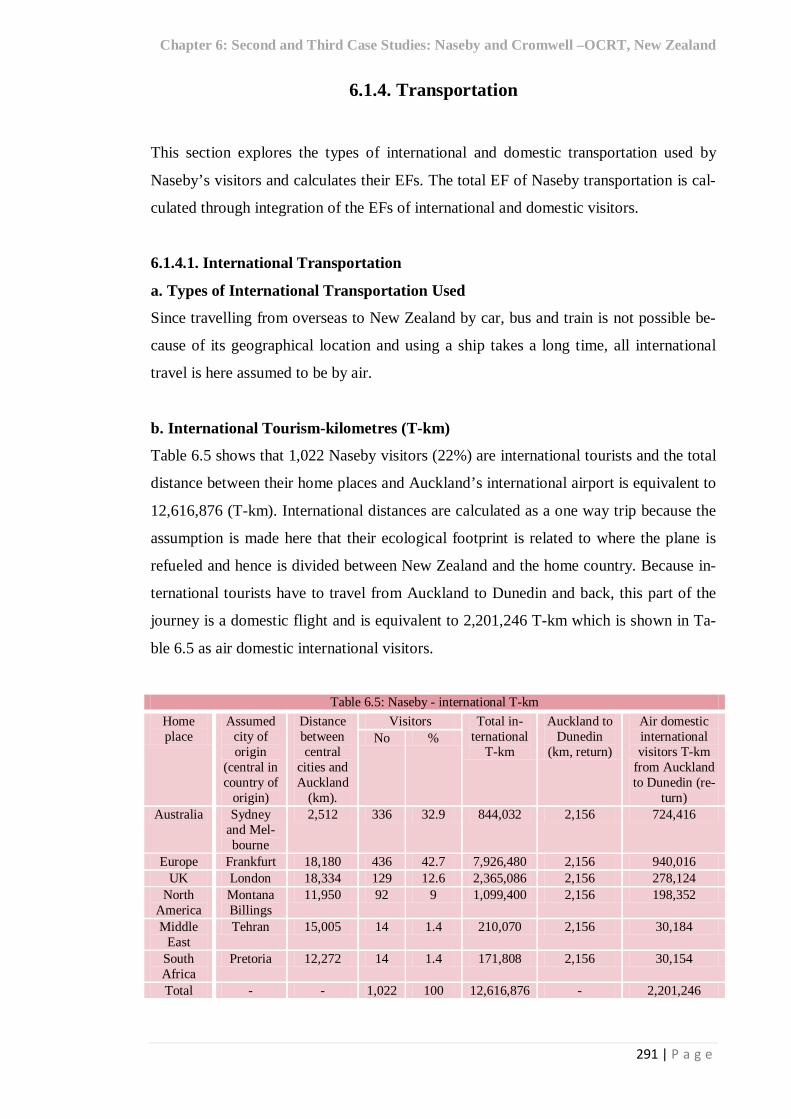
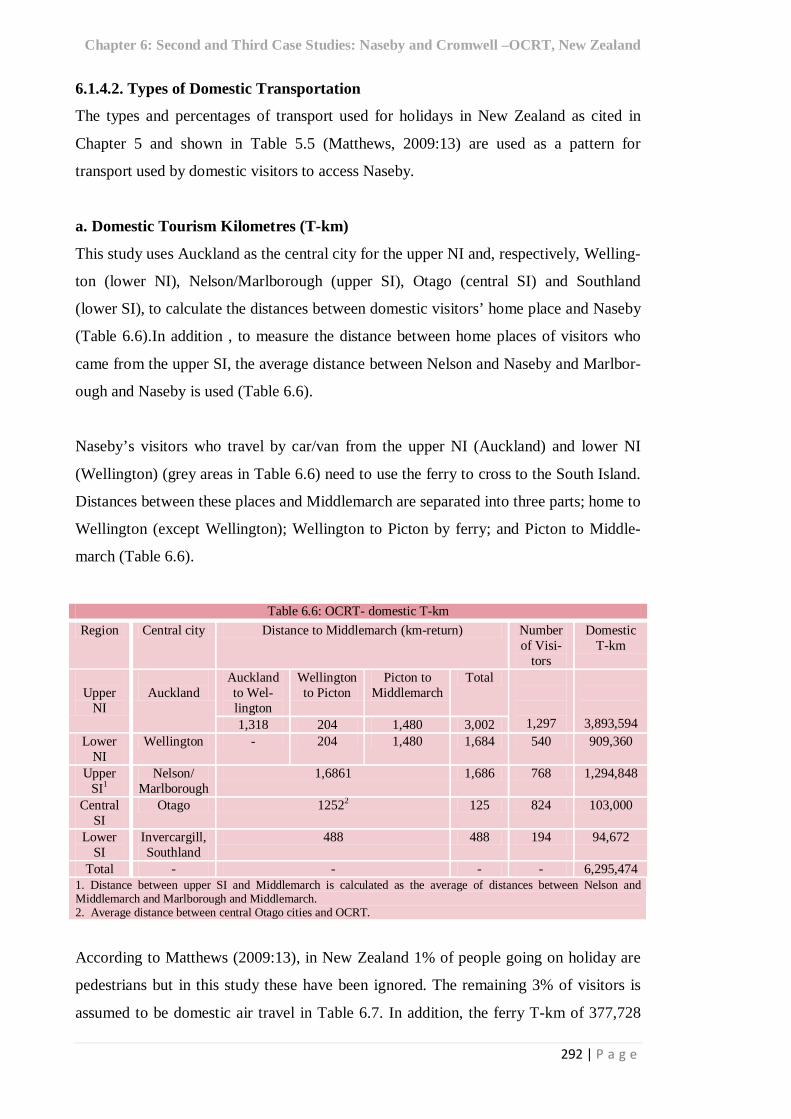
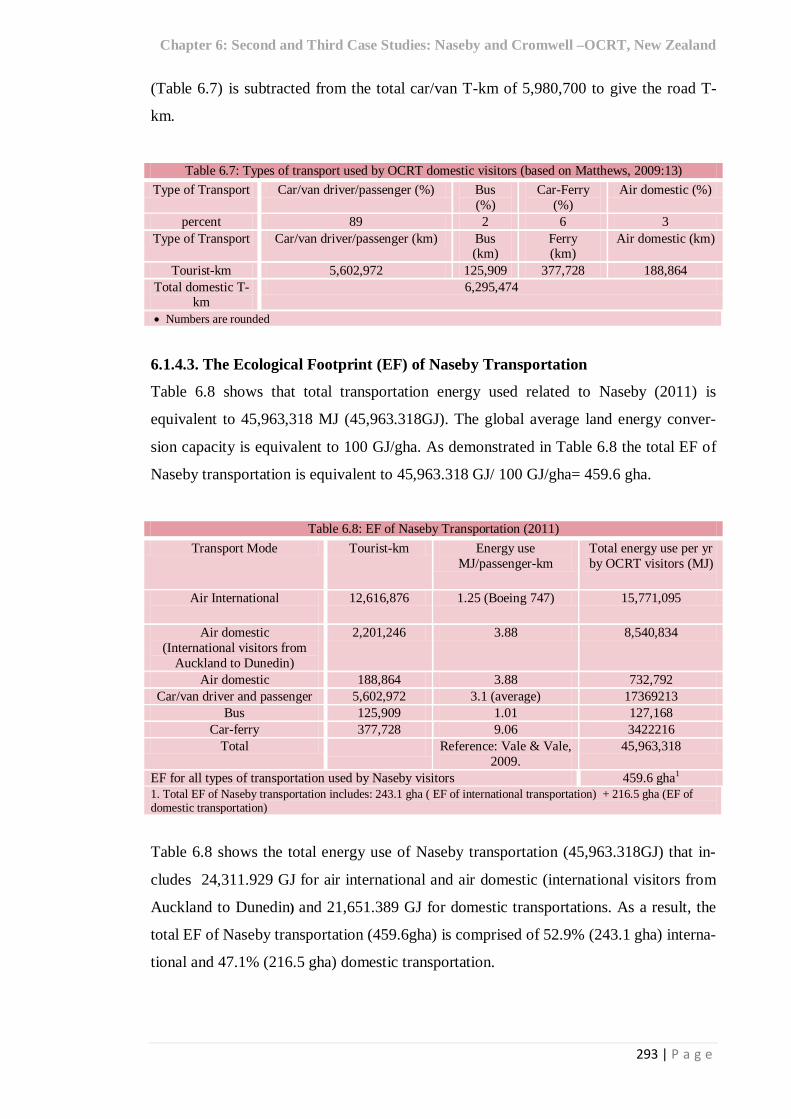
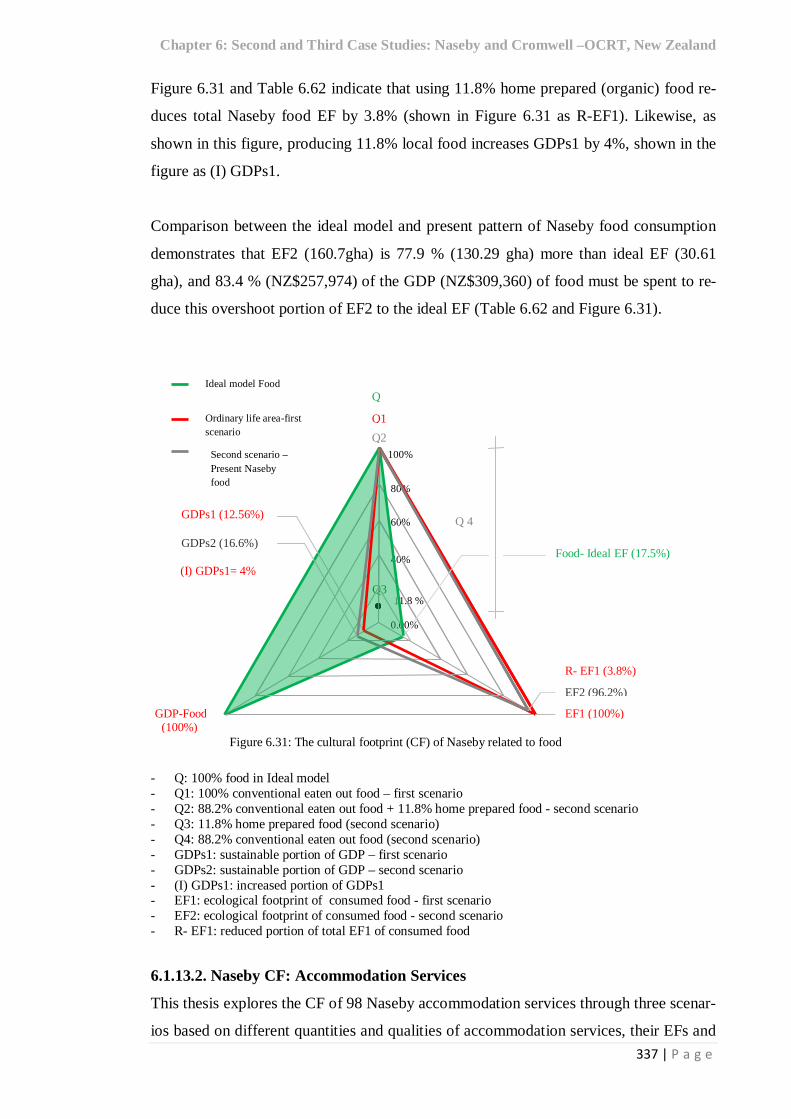
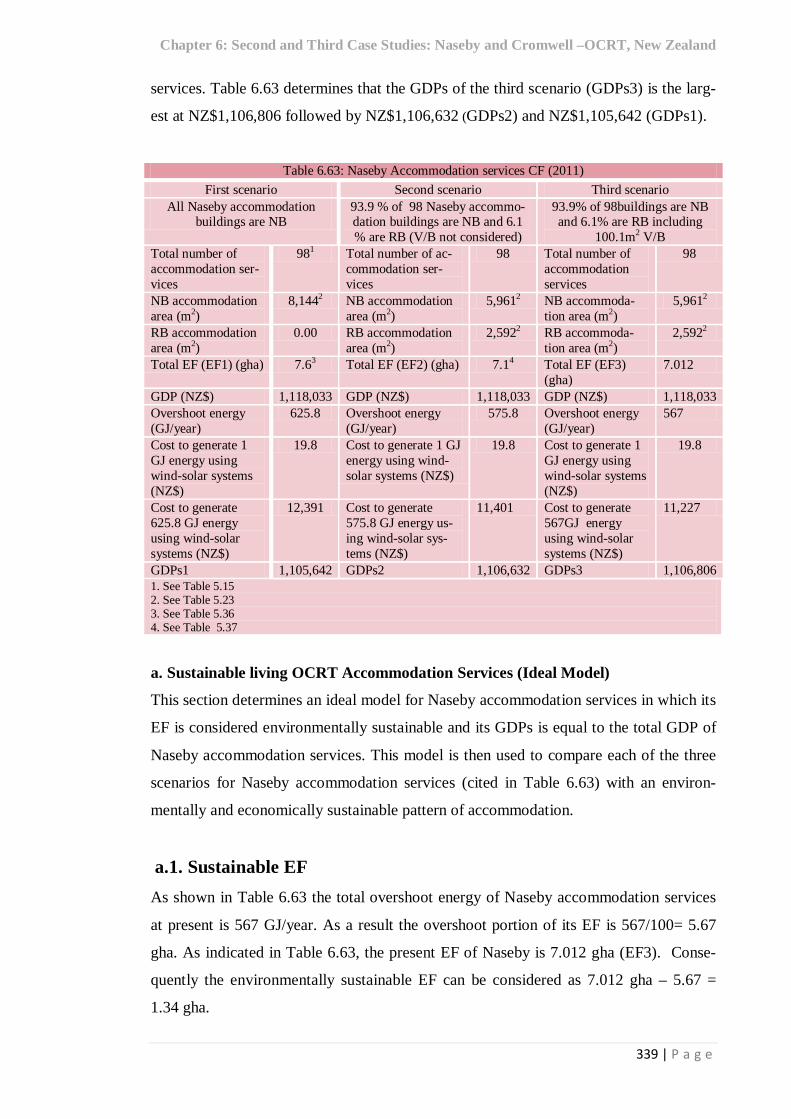
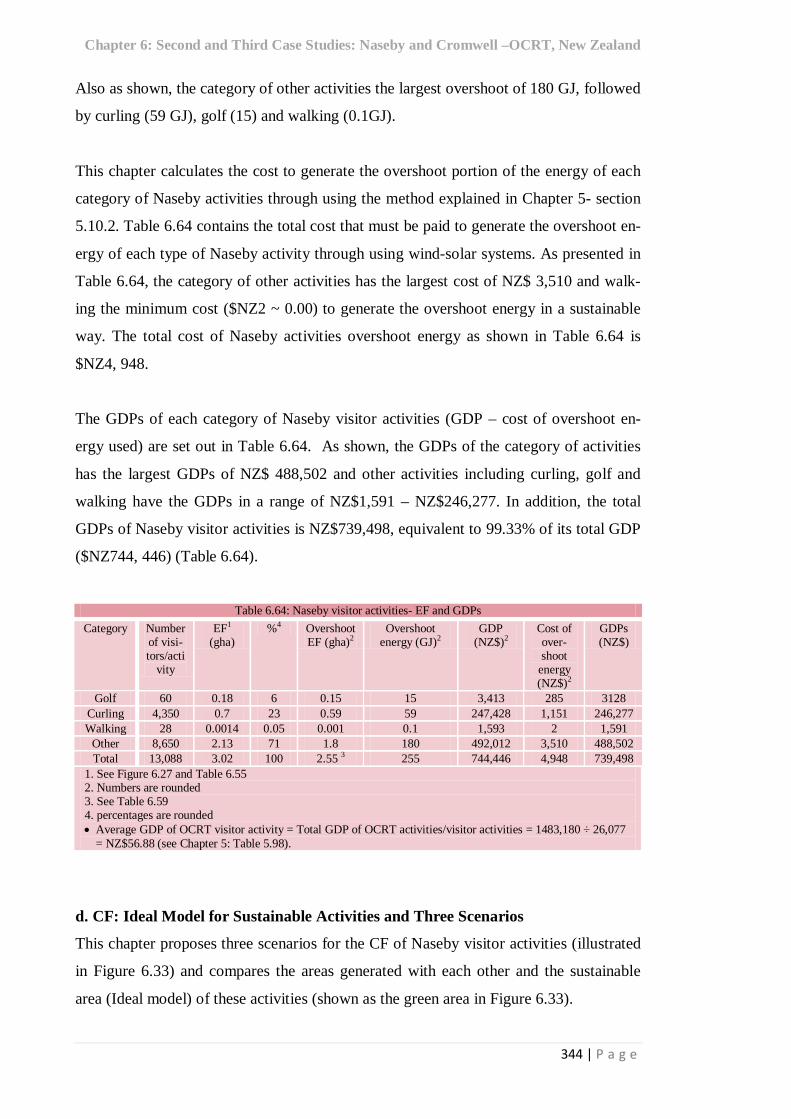
6.1. Case Study 2: Naseby 282 6.1.1. Introduction 282 6.1.2. Background to Naseby 283 6.1.3. Visitors to Naseby 289 6.1.3.1. Visitor Numbers 289 6.1.3.2. Visitors’ Home Place 289 6.1.4. Transportation 291 6.1.4.1. International Transportation 291 6.1.4.2. Types of Domestic Transportation 292 6.1.4.3. The Ecological Footprint (EF) of Naseby Transportation 293 6.1.5. Food 294 6.1.5.1. The EF of Naseby Food- First scenario 294 6.1.5.2. The EF of Naseby Food- Second Scenario 295 6.1.5.3. Environmental Effects of Using Local Food 296 6.1.6. Naseby Accommodation Services 297 6.1.6.1. Types of Accommodation Services 297 6.1.6.2. Quality of Accommodation Services 298 6.1.6.3. Materials Used for Accommodation Services 300 6.1.6.4. Accommodation Energy Sources, Facilities and Spaces 301 6.1.6.5. Occupancy Share 306 6.1.6.6. Area of Naseby Accommodation Services 307 6.1.6.7. The EF of Naseby Accommodation Services 309 6.1.7. Naseby Tourism Products and Activities (Frequency) 316 6.1.7.1. Local Produce 316 6.1.7.2. Tourism Activities 317 6.1.8. EF of Visitor Activities 321 6.1.8.1. EF of Indoor Activities (Curling at Naseby) 321 6.1.8.2. EF of Outdoor Activities 322 6.1.8.3. Total EF of Naseby Visitor activities 326 6.1.8.4. Comparison between the EFs of Indoor and Outdoor Activities 328 6.1.9. The Total EF of Naseby (2011) 330 6.1.10. Naseby Overshoot Portion of EF 331 6.1.11. Overshoot Portion of Energy Used 331 6.1.11.1. Overshoot Portion of Energy Use per Visitor 331 6.1.11.2. Total Overshoot Portion of Energy Used 331 6.1.11.3. Overshoot Portion of Energy Use by Categories 332 6.1.12. Economic Footprint of Naseby Rail Trail Visitors 332 6.1.13. Naseby Cultural Footprint (CF) 334 6.1.13.1. Naseby CF- Food 334 6.1.13.2. Naseby CF: Accommodation Services 337 6.1.13.3. The CF of Naseby Visitor Activities 343
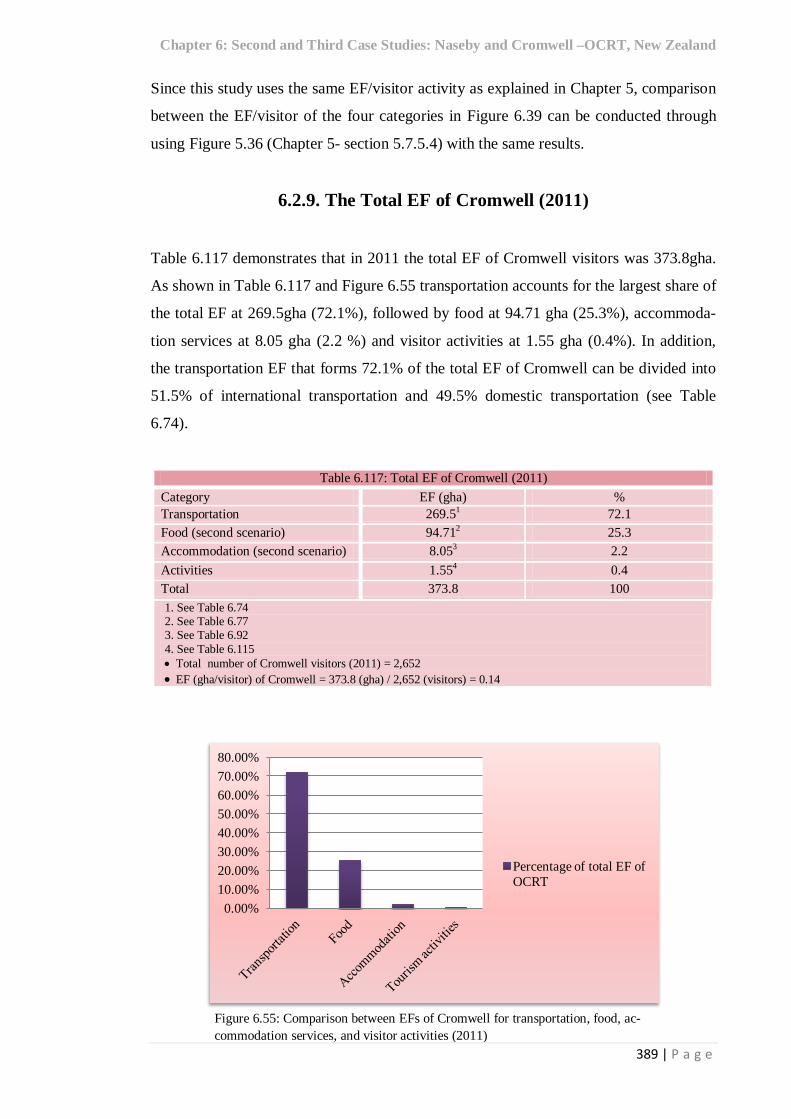
6.2. Case Study 3: Cromwell 349 6.2.1. Introduction 349 6.2.2. Background to Cromwell 349 6.2.3. Visitors to Cromwell 354 6.2.3.1. Visitor Numbers 354 6.2.3.2. Visitors Home Place 354 6.2.4. Transportation 356
vi | P a g e
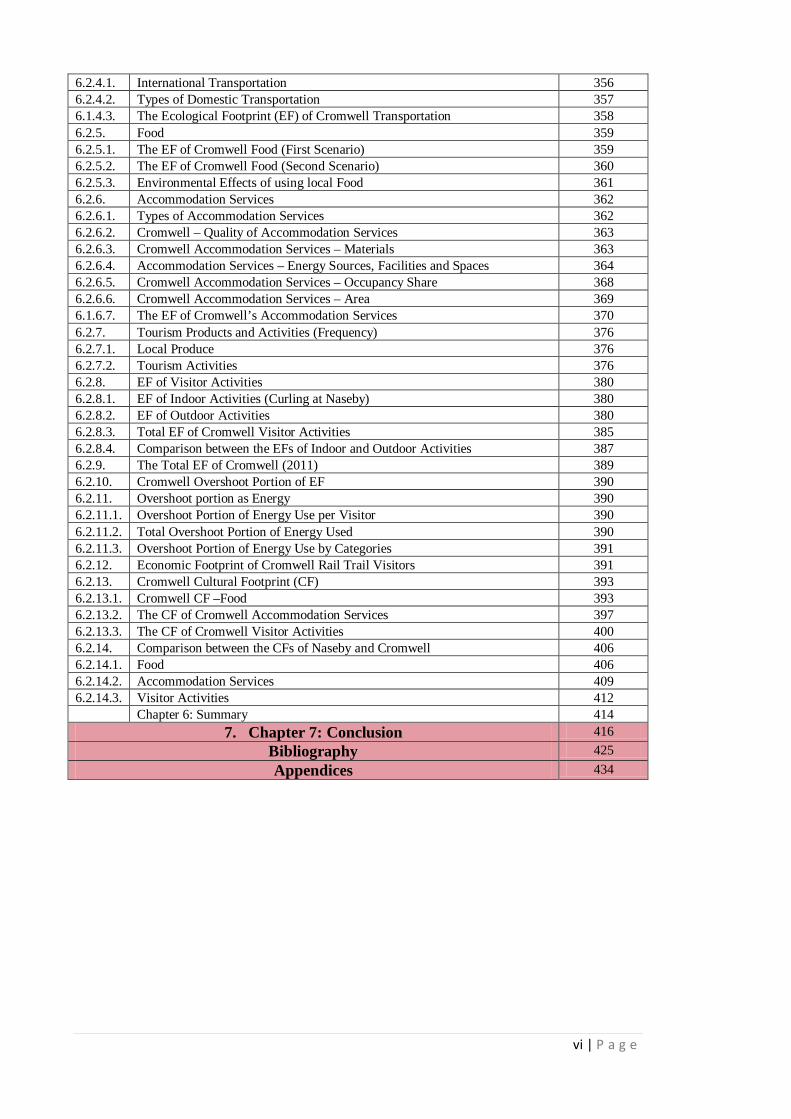
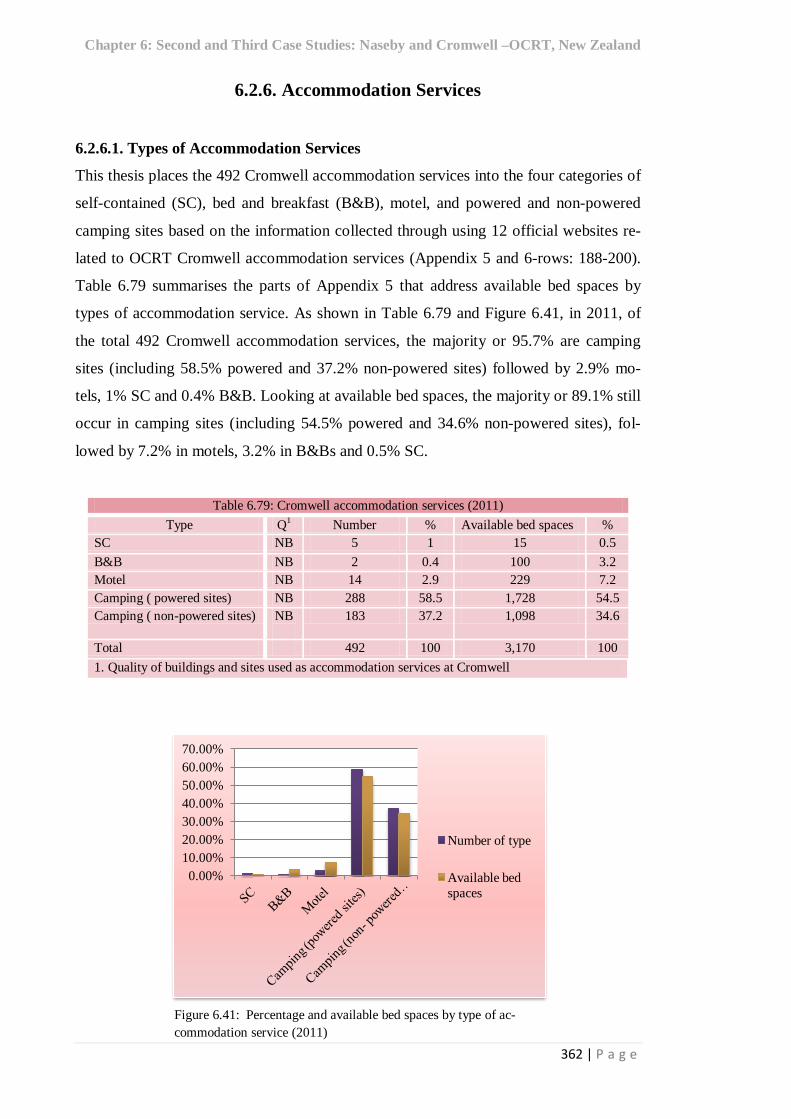
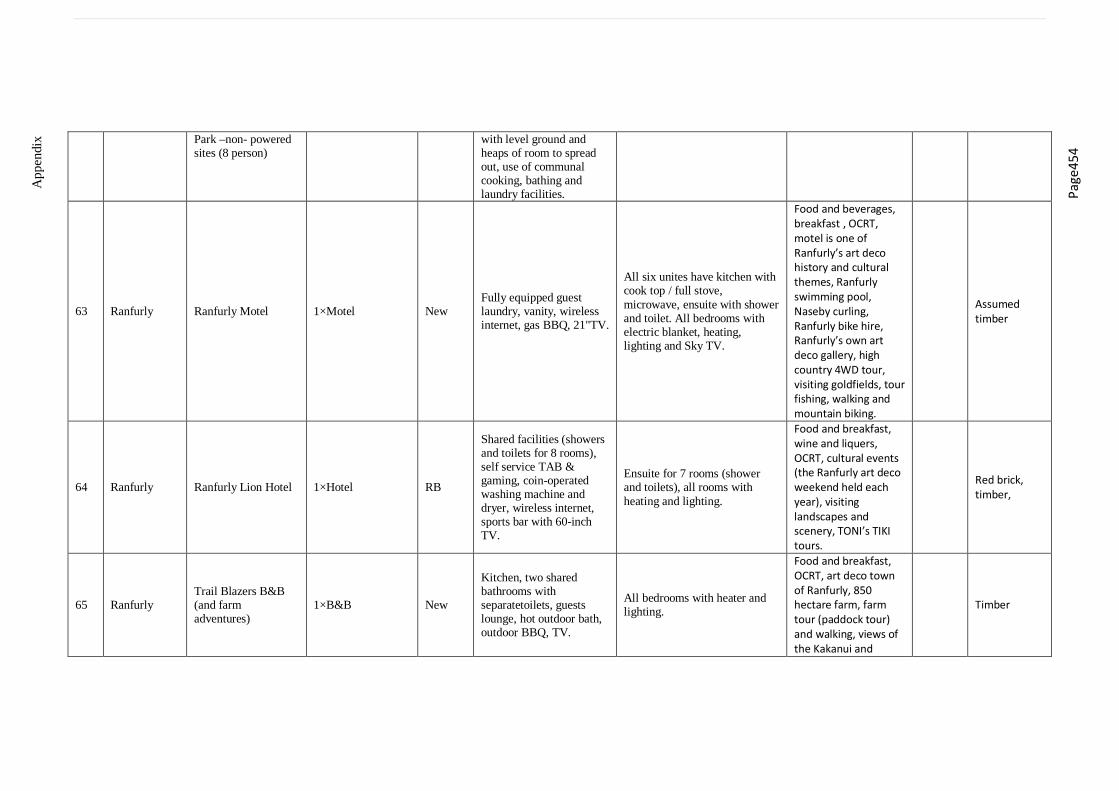
6.2.4.1. International Transportation 356 6.2.4.2. Types of Domestic Transportation 357 6.1.4.3. The Ecological Footprint (EF) of Cromwell Transportation 358 6.2.5. Food 359 6.2.5.1. The EF of Cromwell Food (First Scenario) 359 6.2.5.2. The EF of Cromwell Food (Second Scenario) 360 6.2.5.3. Environmental Effects of using local Food 361 6.2.6. Accommodation Services 362 6.2.6.1. Types of Accommodation Services 362 6.2.6.2. Cromwell – Quality of Accommodation Services 363 6.2.6.3. Cromwell Accommodation Services – Materials 363 6.2.6.4. Accommodation Services – Energy Sources, Facilities and Spaces 364 6.2.6.5. Cromwell Accommodation Services – Occupancy Share 368 6.2.6.6. Cromwell Accommodation Services – Area 369 6.1.6.7. The EF of Cromwell’s Accommodation Services 370 6.2.7. Tourism Products and Activities (Frequency) 376 6.2.7.1. Local Produce 376 6.2.7.2. Tourism Activities 376 6.2.8. EF of Visitor Activities 380 6.2.8.1. EF of Indoor Activities (Curling at Naseby) 380 6.2.8.2. EF of Outdoor Activities 380 6.2.8.3. Total EF of Cromwell Visitor Activities 385 6.2.8.4. Comparison between the EFs of Indoor and Outdoor Activities 387 6.2.9. The Total EF of Cromwell (2011) 389 6.2.10. Cromwell Overshoot Portion of EF 390 6.2.11. Overshoot portion as Energy 390 6.2.11.1. Overshoot Portion of Energy Use per Visitor 390 6.2.11.2. Total Overshoot Portion of Energy Used 390 6.2.11.3. Overshoot Portion of Energy Use by Categories 391 6.2.12. Economic Footprint of Cromwell Rail Trail Visitors 391 6.2.13. Cromwell Cultural Footprint (CF) 393 6.2.13.1. Cromwell CF –Food 393 6.2.13.2. The CF of Cromwell Accommodation Services 397 6.2.13.3. The CF of Cromwell Visitor Activities 400 6.2.14. Comparison between the CFs of Naseby and Cromwell 406 6.2.14.1. Food 406 6.2.14.2. Accommodation Services 409 6.2.14.3. Visitor Activities 412 Chapter 6: Summary 414
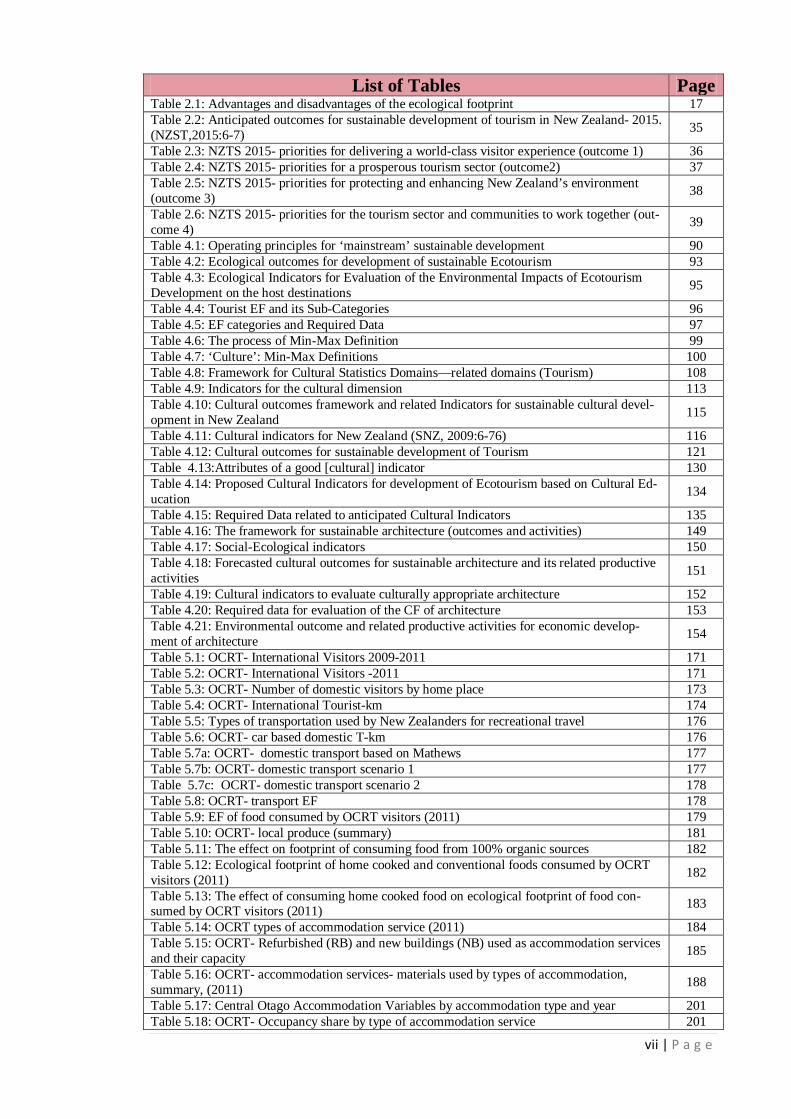
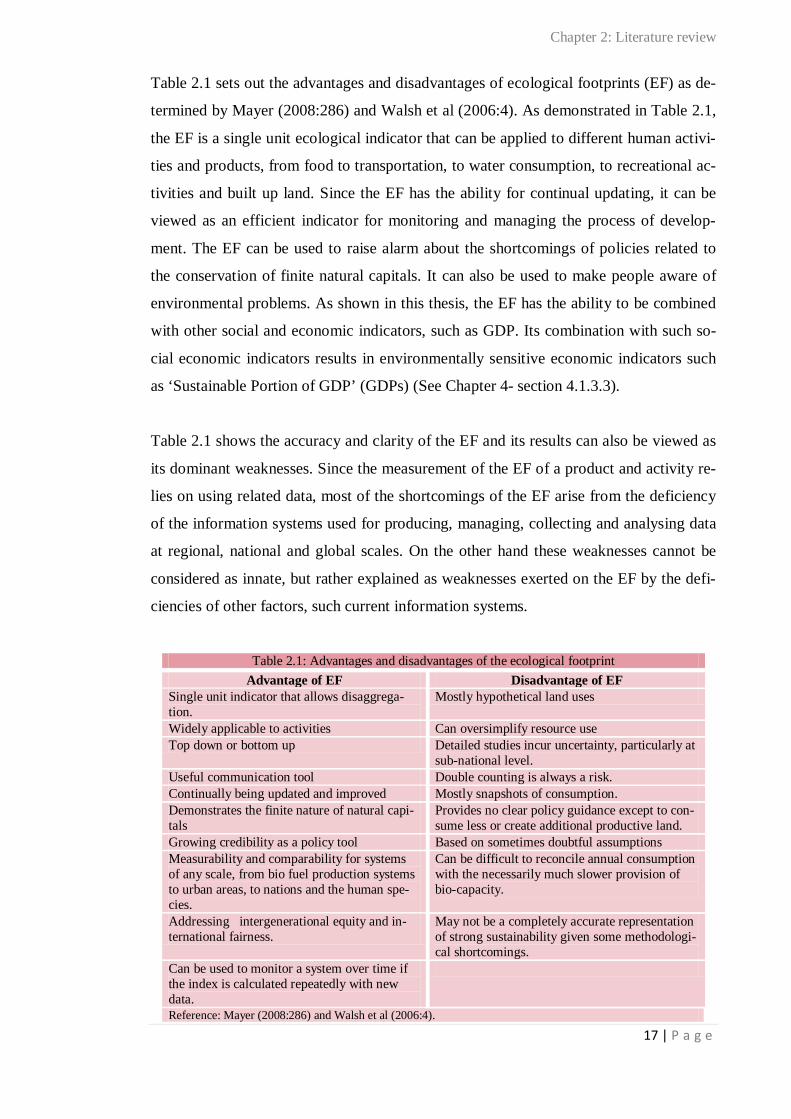
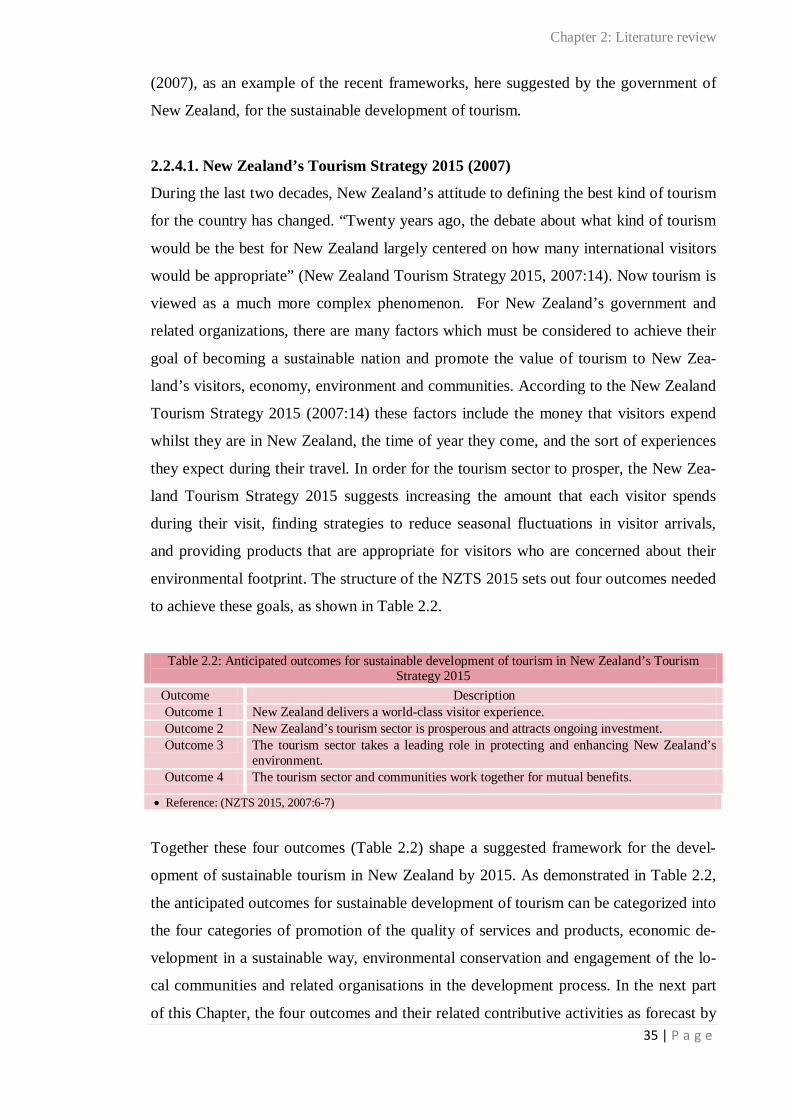
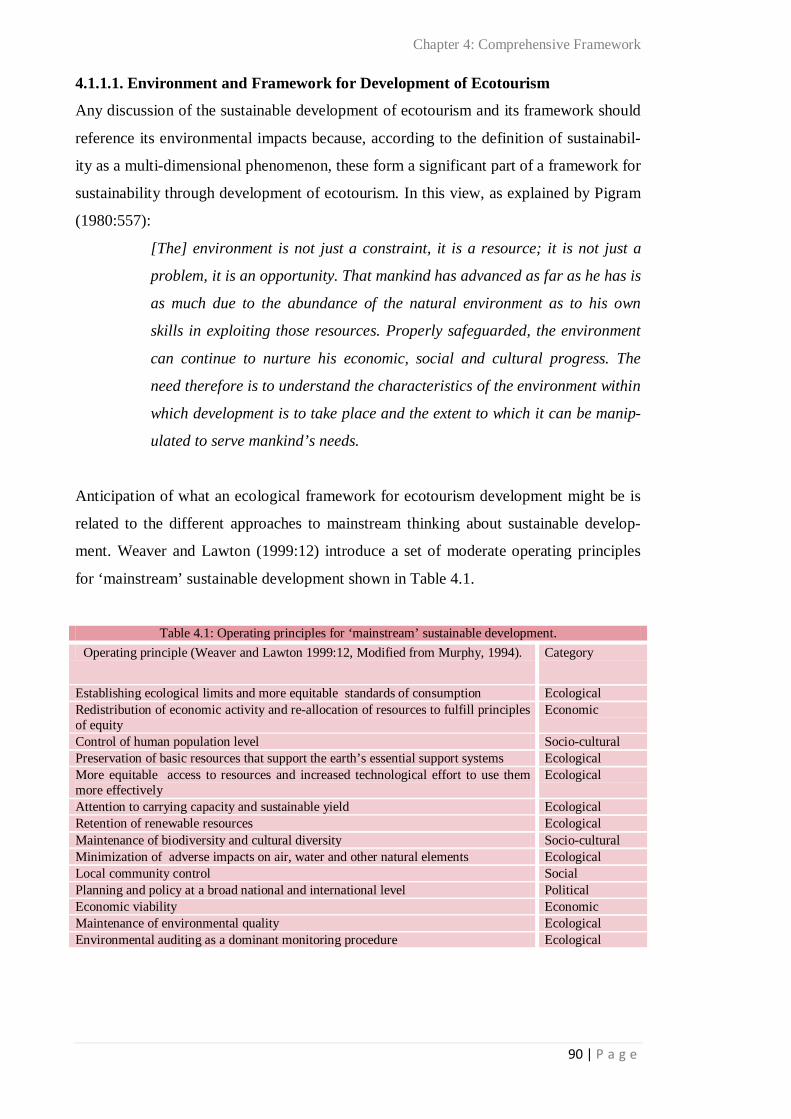
List of Tables Page Table 2.1: Advantages and disadvantages of the ecological footprint 17 Table 2.2: Anticipated outcomes for sustainable development of tourism in New Zealand- 2015. (NZST,2015:6-7) 35
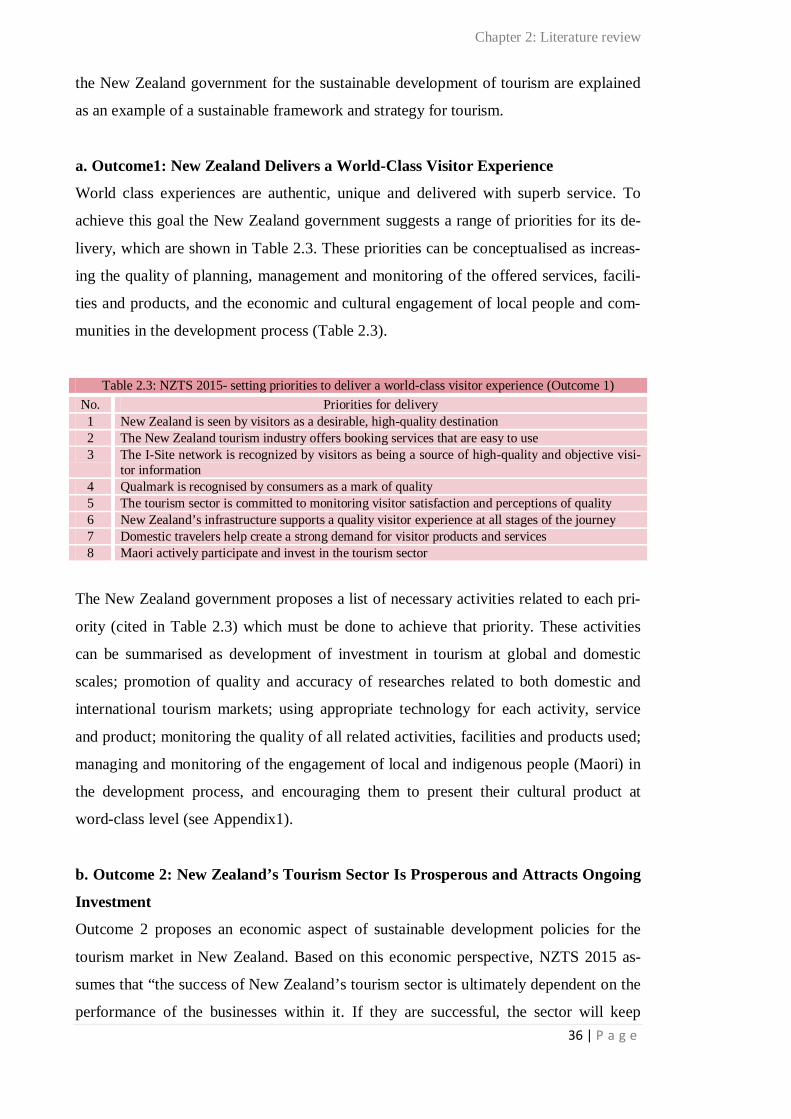
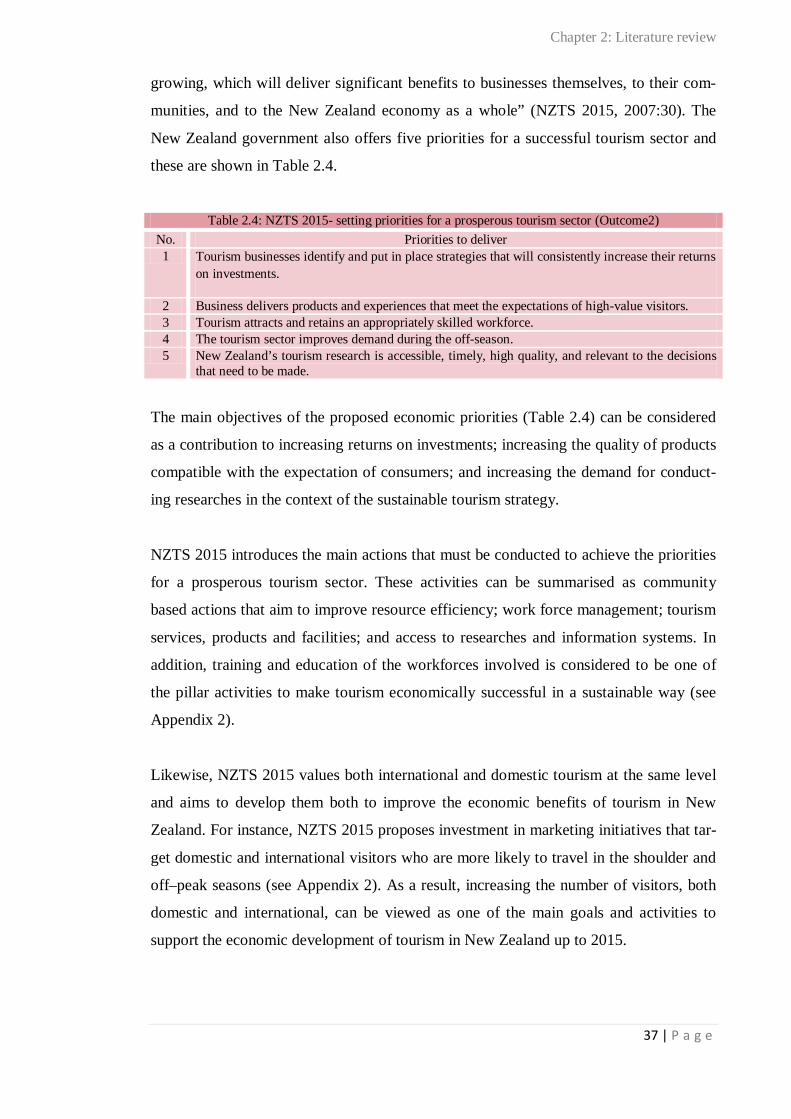
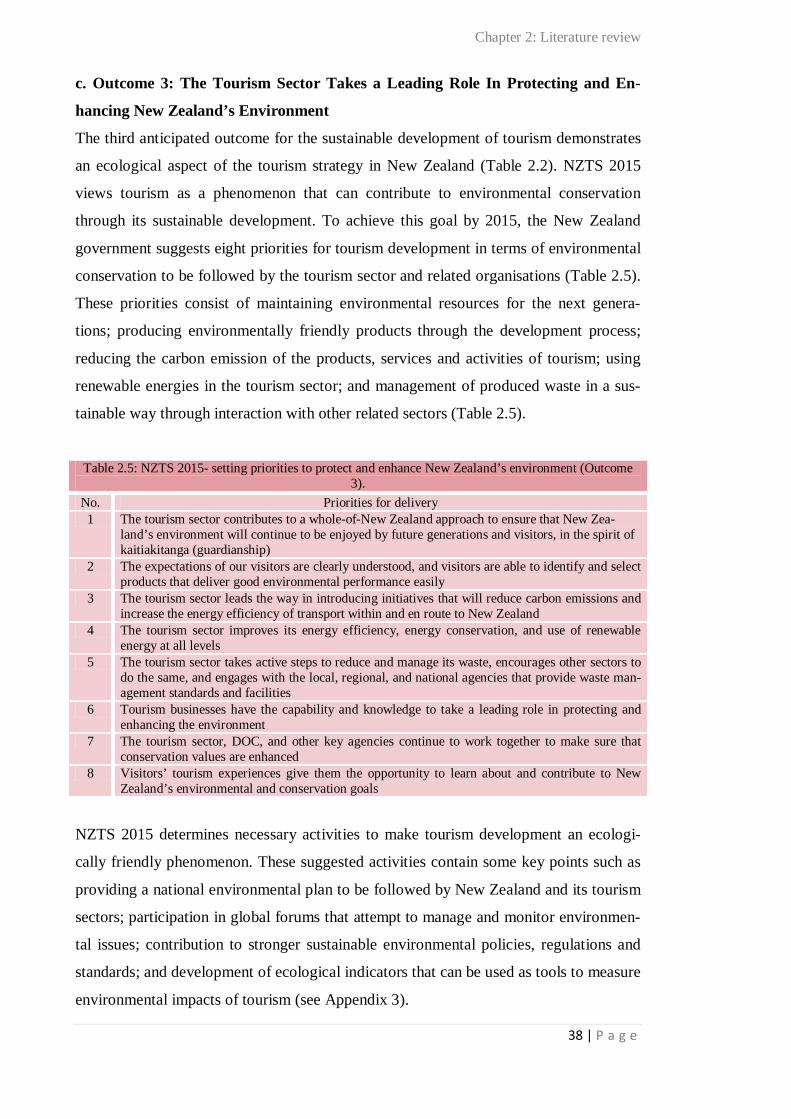
Table 2.3: NZTS 2015- priorities for delivering a world-class visitor experience (outcome 1) 36 Table 2.4: NZTS 2015- priorities for a prosperous tourism sector (outcome2) 37 Table 2.5: NZTS 2015- priorities for protecting and enhancing New Zealand’s environment (outcome 3) 38
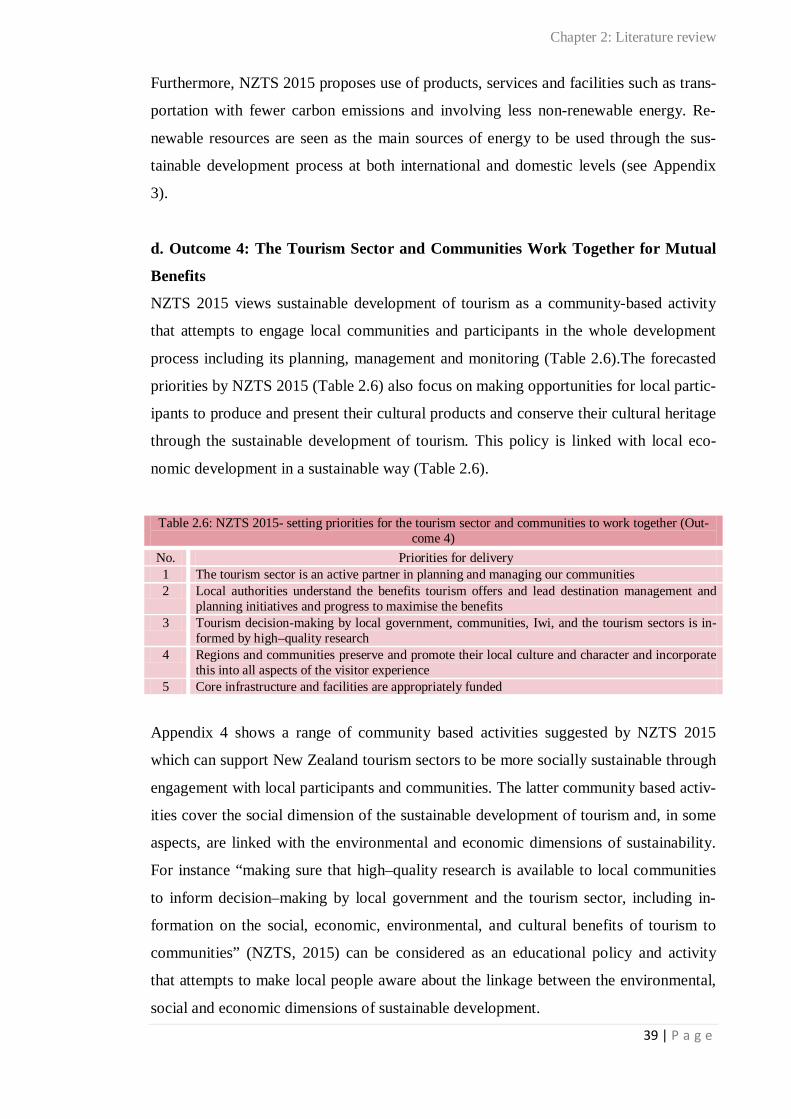
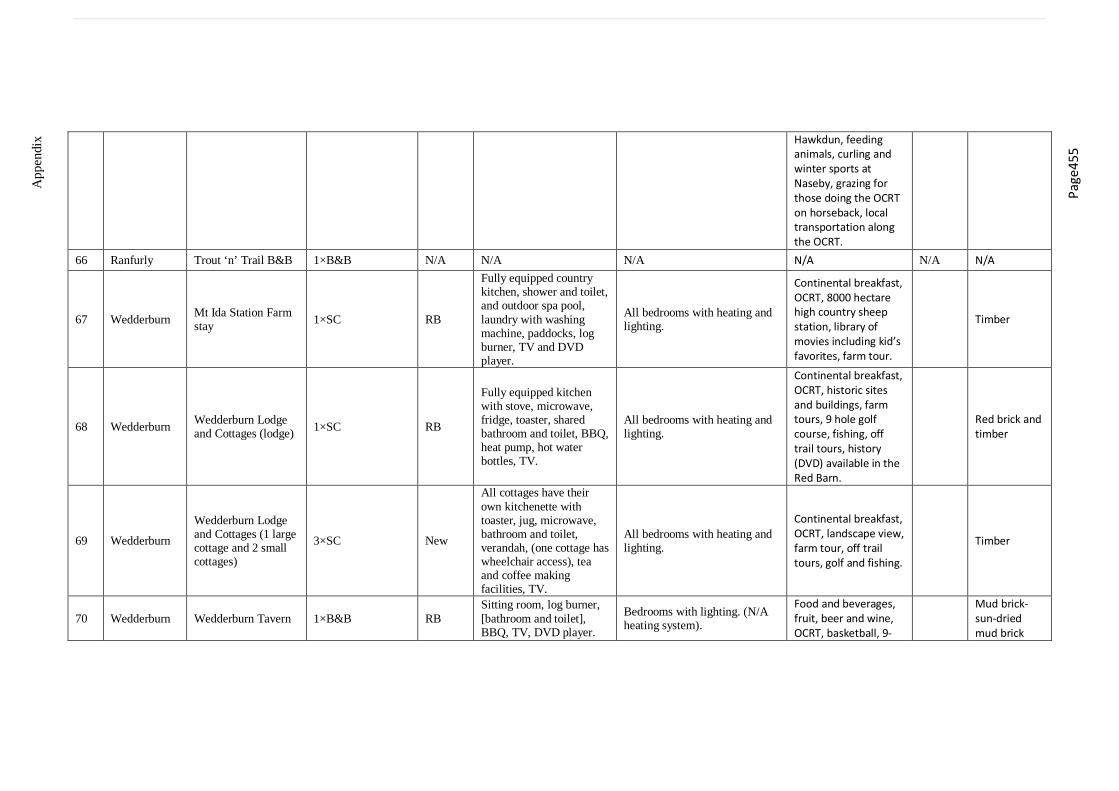
Table 2.6: NZTS 2015- priorities for the tourism sector and communities to work together (out-come 4) 39
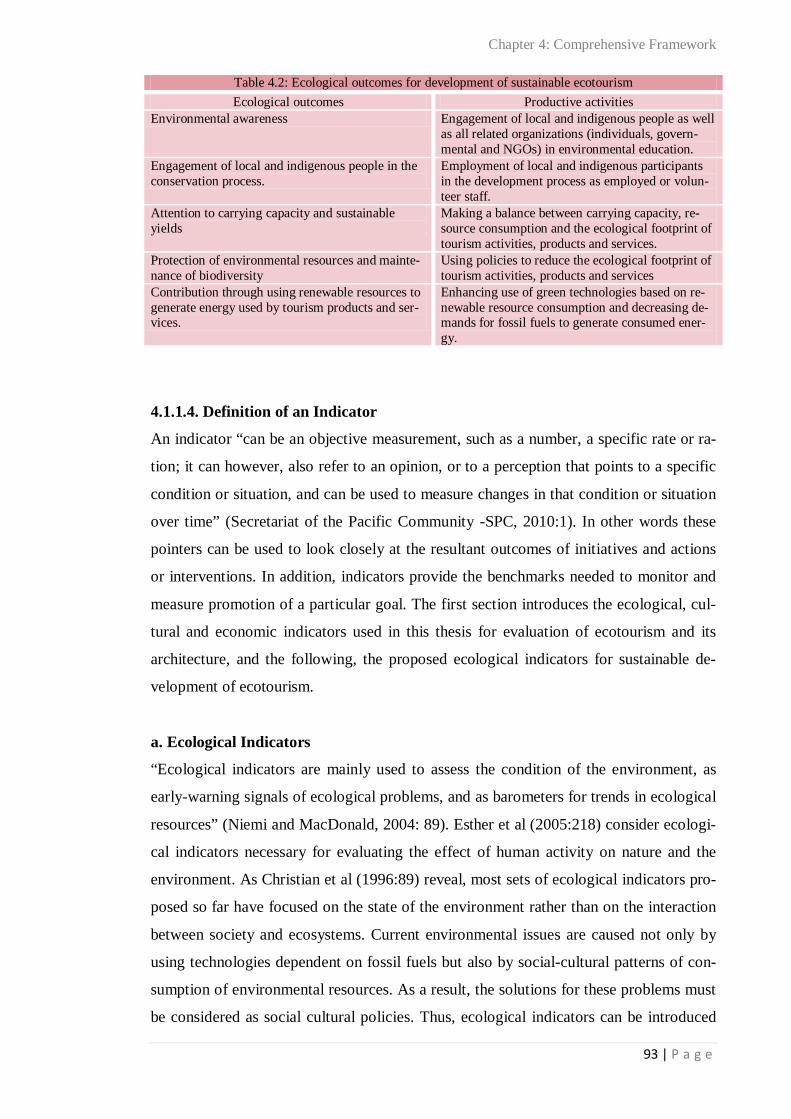
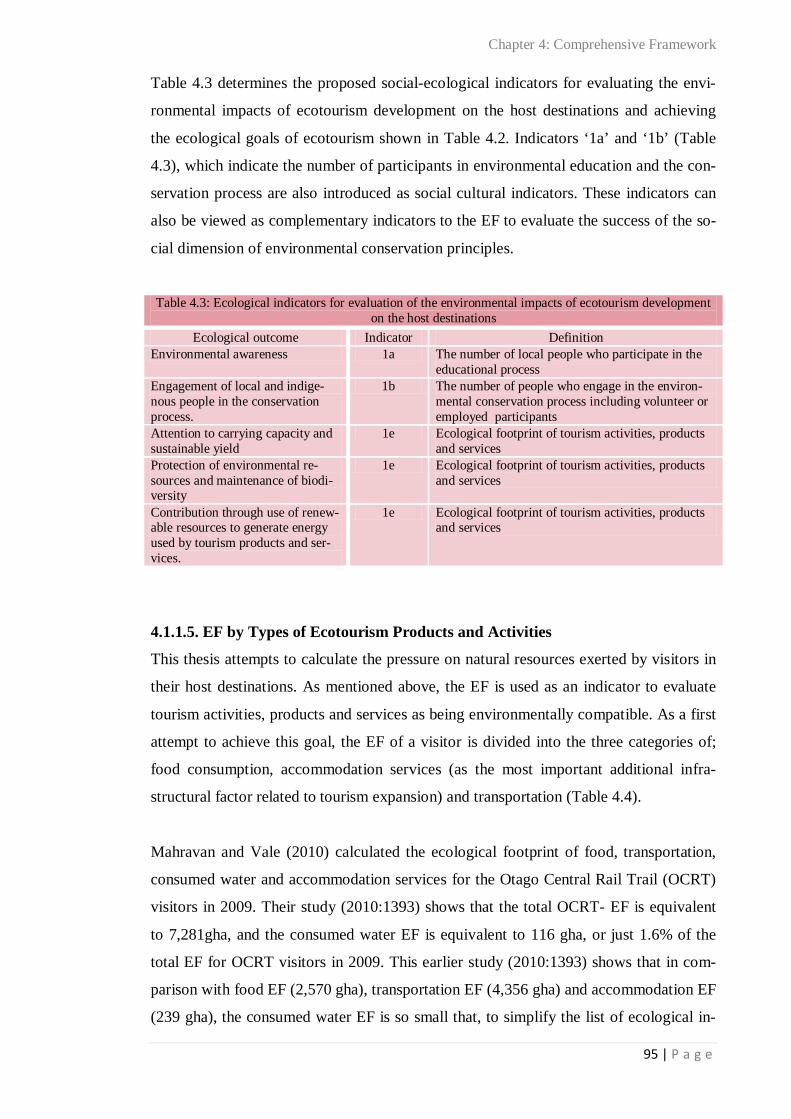
Table 4.1: Operating principles for ‘mainstream’ sustainable development 90 Table 4.2: Ecological outcomes for development of sustainable Ecotourism 93 Table 4.3: Ecological Indicators for Evaluation of the Environmental Impacts of Ecotourism Development on the host destinations 95
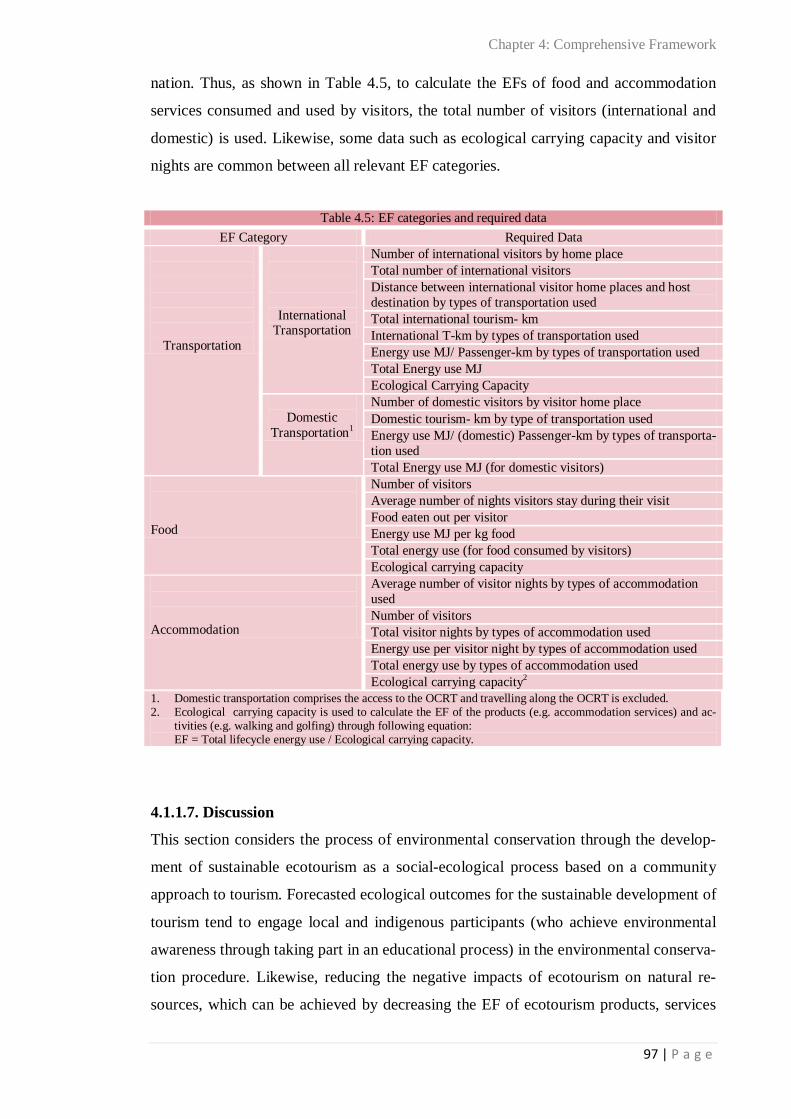
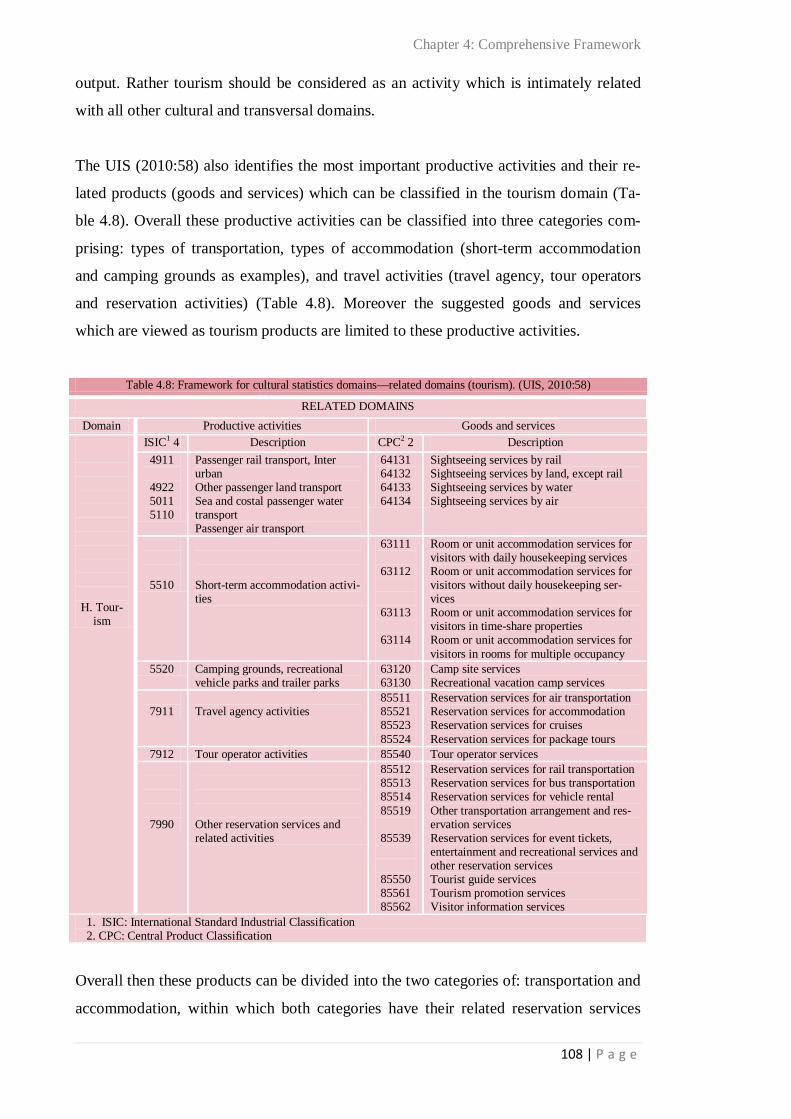
Table 4.4: Tourist EF and its Sub-Categories 96 Table 4.5: EF categories and Required Data 97 Table 4.6: The process of Min-Max Definition 99 Table 4.7: ‘Culture’: Min-Max Definitions 100 Table 4.8: Framework for Cultural Statistics Domains—related domains (Tourism) 108 Table 4.9: Indicators for the cultural dimension 113 Table 4.10: Cultural outcomes framework and related Indicators for sustainable cultural devel-opment in New Zealand 115
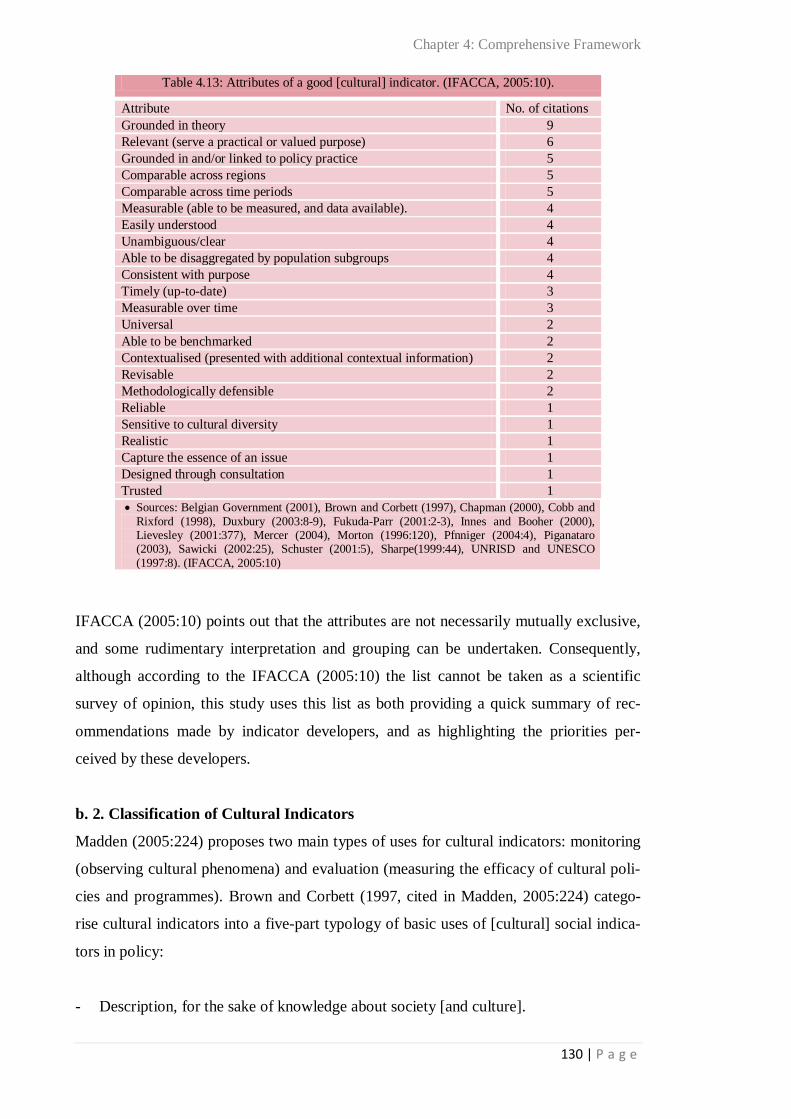
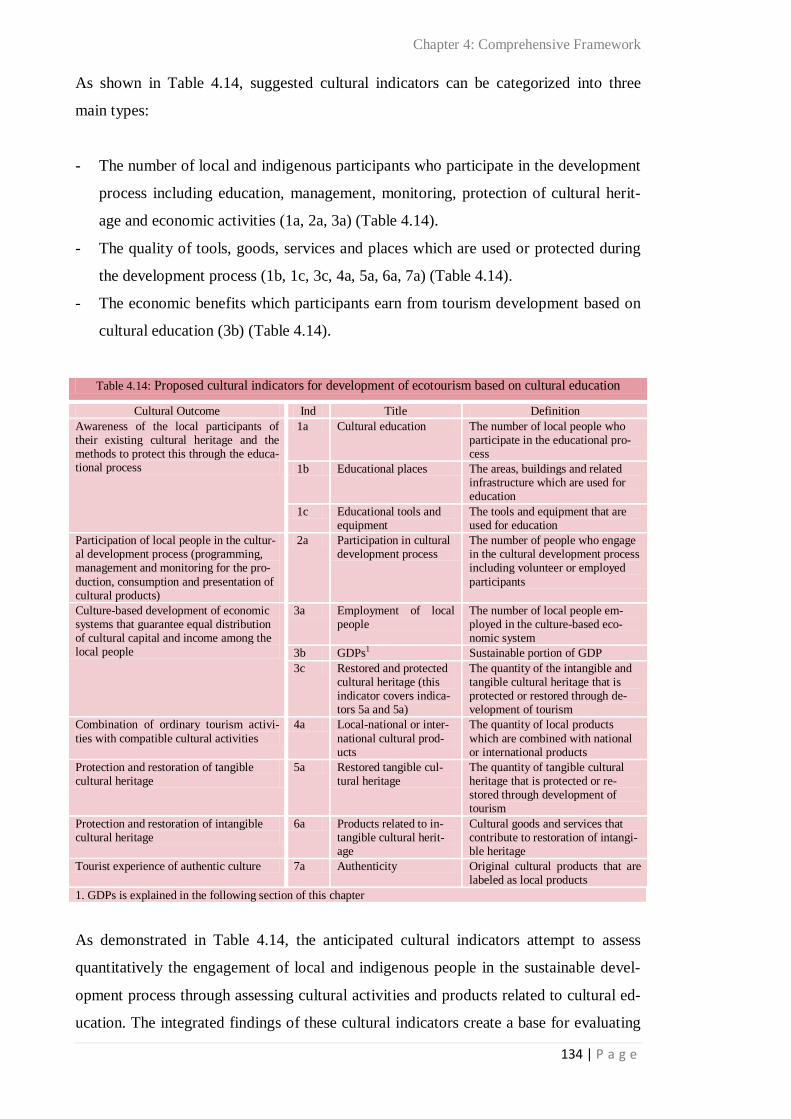
Table 4.11: Cultural indicators for New Zealand (SNZ, 2009:6-76) 116 Table 4.12: Cultural outcomes for sustainable development of Tourism 121 Table 4.13:Attributes of a good [cultural] indicator 130 Table 4.14: Proposed Cultural Indicators for development of Ecotourism based on Cultural Ed-ucation 134
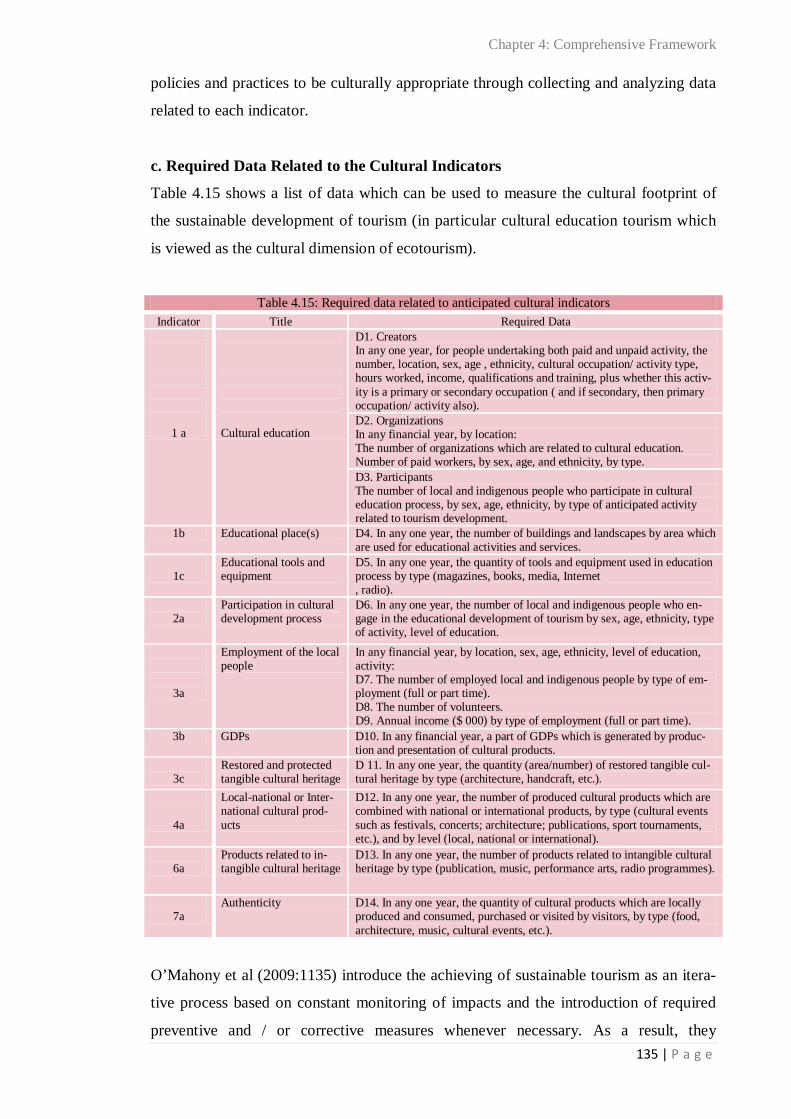
Table 4.15: Required Data related to anticipated Cultural Indicators 135 Table 4.16: The framework for sustainable architecture (outcomes and activities) 149 Table 4.17: Social-Ecological indicators 150 Table 4.18: Forecasted cultural outcomes for sustainable architecture and its related productive activities 151
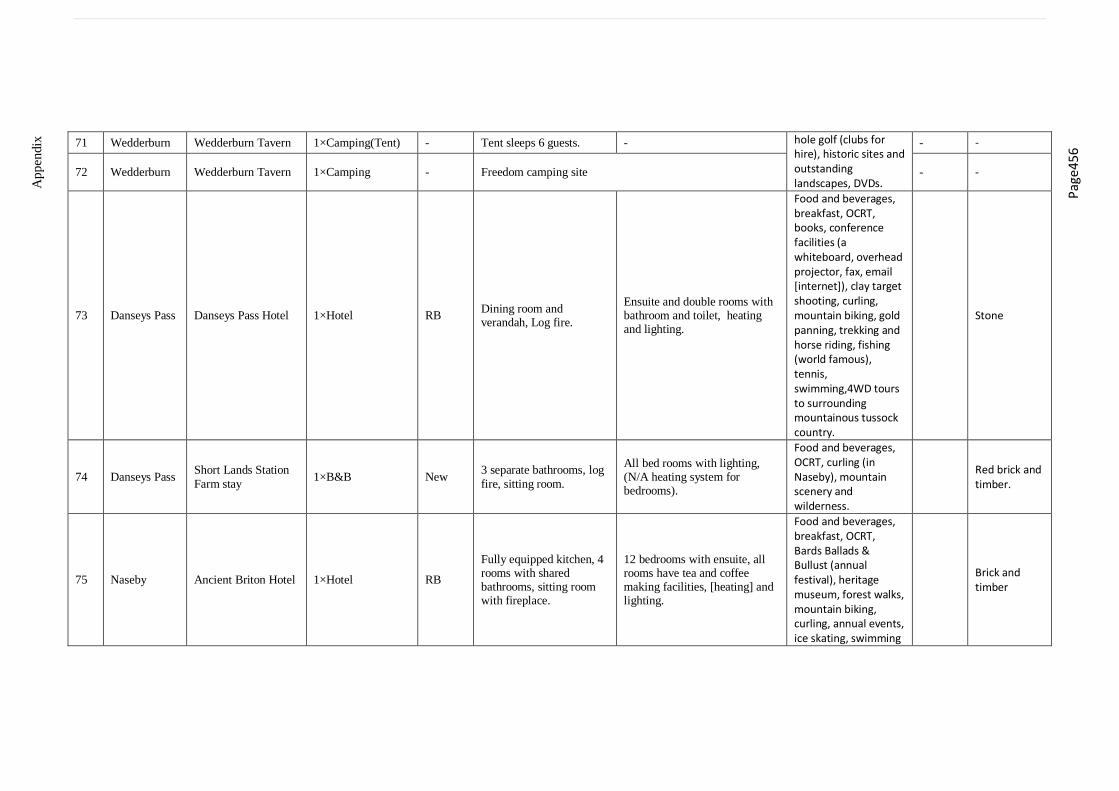
Table 4.19: Cultural indicators to evaluate culturally appropriate architecture 152 Table 4.20: Required data for evaluation of the CF of architecture 153 Table 4.21: Environmental outcome and related productive activities for economic develop-ment of architecture 154
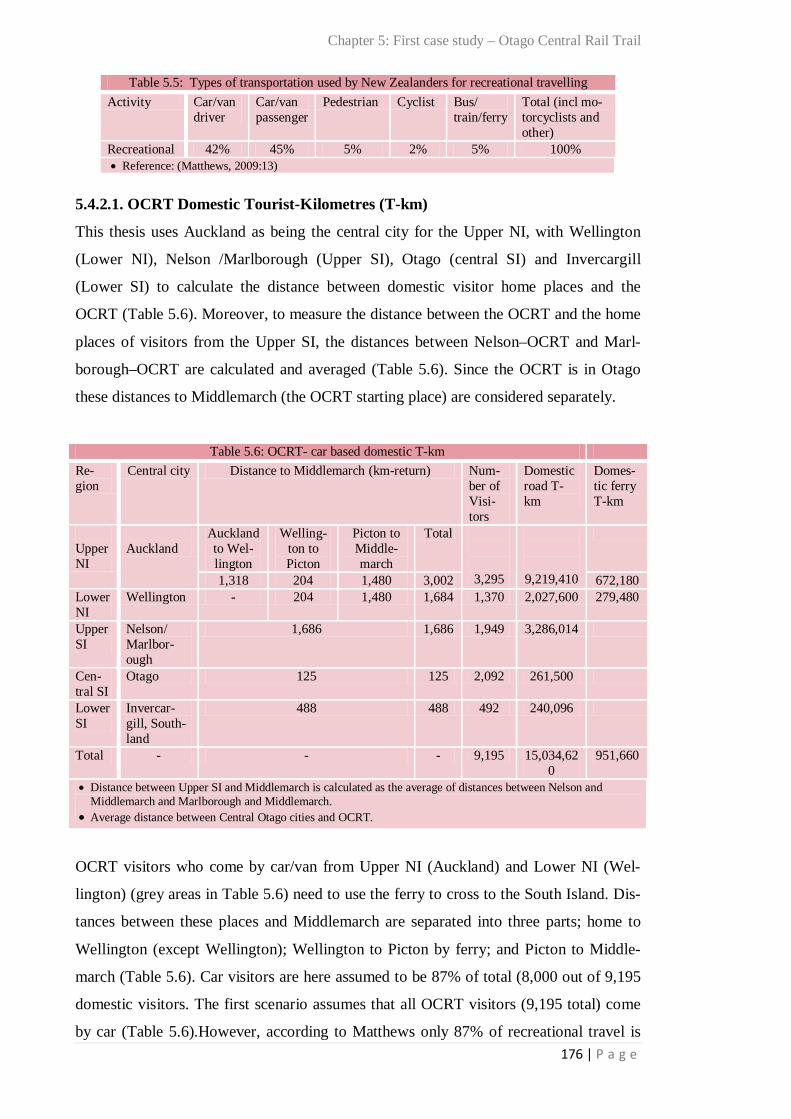
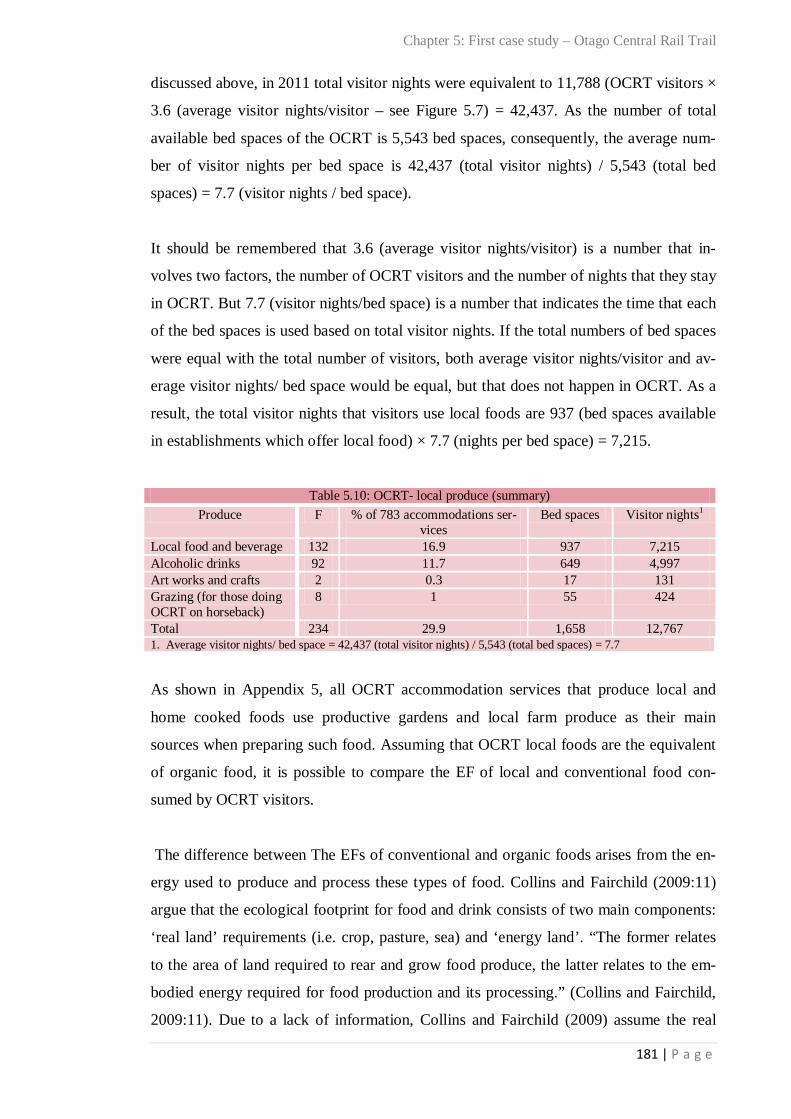
Table 5.1: OCRT- International Visitors 2009-2011 171 Table 5.2: OCRT- International Visitors -2011 171 Table 5.3: OCRT- Number of domestic visitors by home place 173 Table 5.4: OCRT- International Tourist-km 174 Table 5.5: Types of transportation used by New Zealanders for recreational travel 176 Table 5.6: OCRT- car based domestic T-km 176 Table 5.7a: OCRT- domestic transport based on Mathews 177 Table 5.7b: OCRT- domestic transport scenario 1 177 Table 5.7c: OCRT- domestic transport scenario 2 178 Table 5.8: OCRT- transport EF 178 Table 5.9: EF of food consumed by OCRT visitors (2011) 179 Table 5.10: OCRT- local produce (summary) 181 Table 5.11: The effect on footprint of consuming food from 100% organic sources 182 Table 5.12: Ecological footprint of home cooked and conventional foods consumed by OCRT visitors (2011) 182
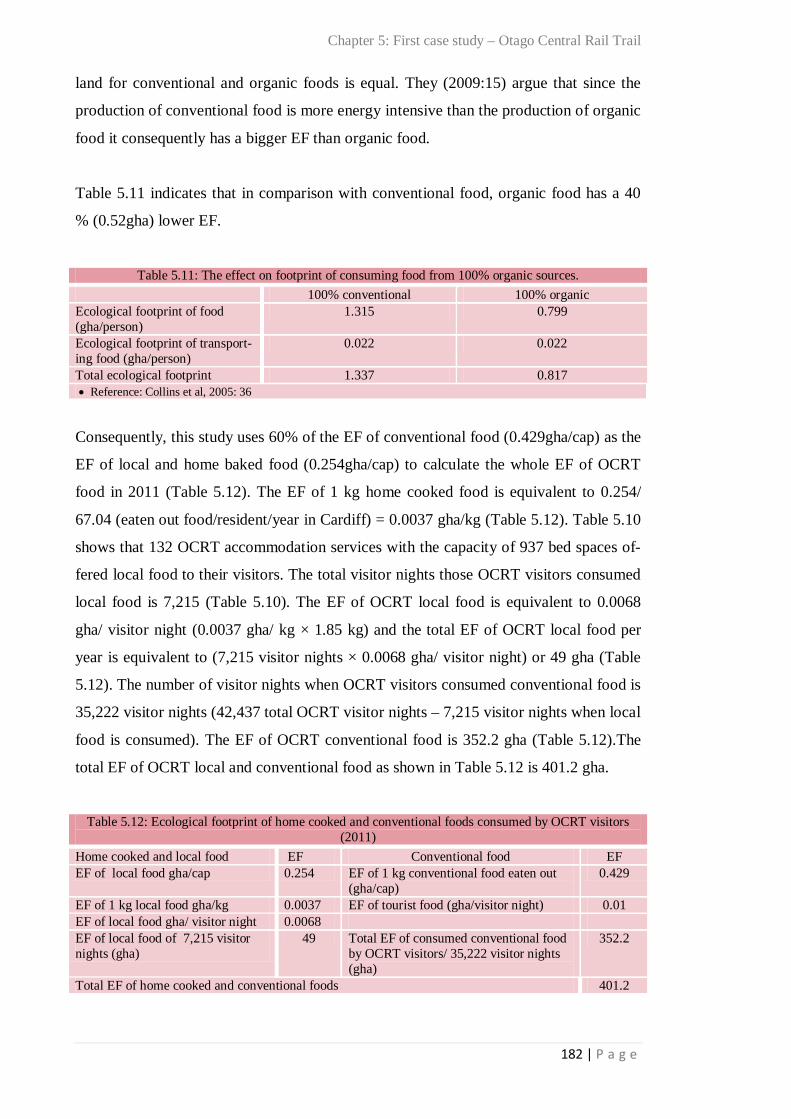
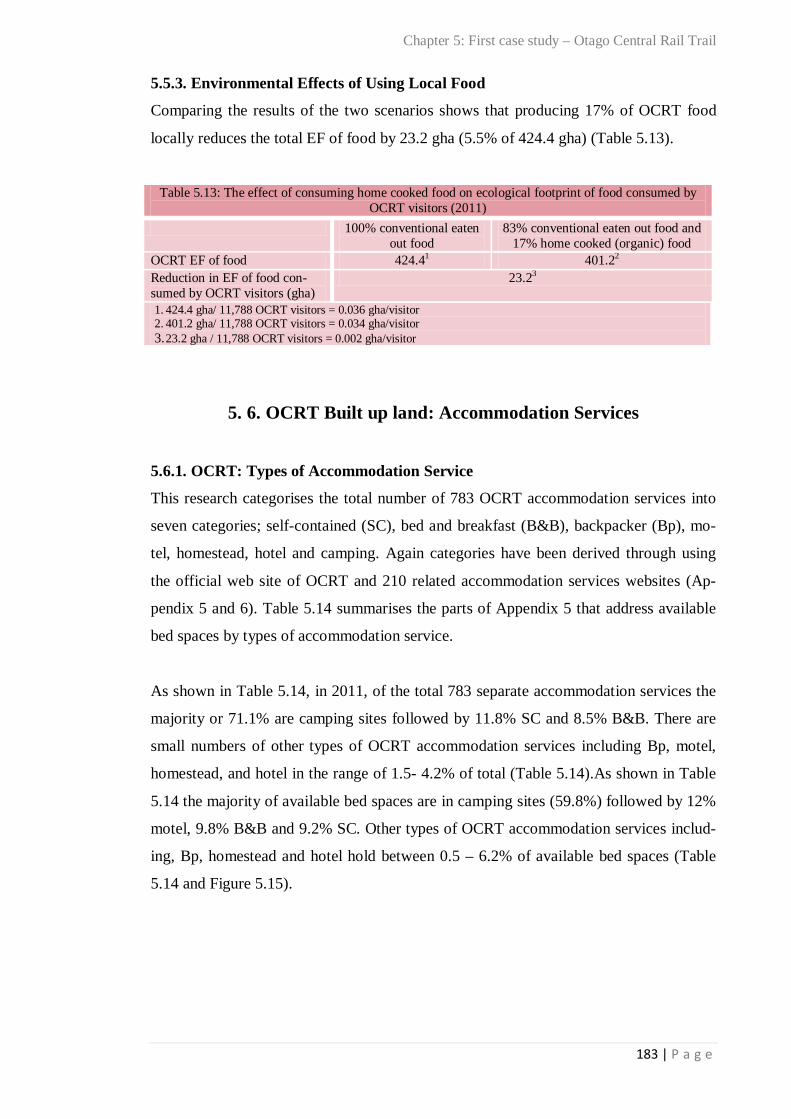
Table 5.13: The effect of consuming home cooked food on ecological footprint of food con-sumed by OCRT visitors (2011) 183
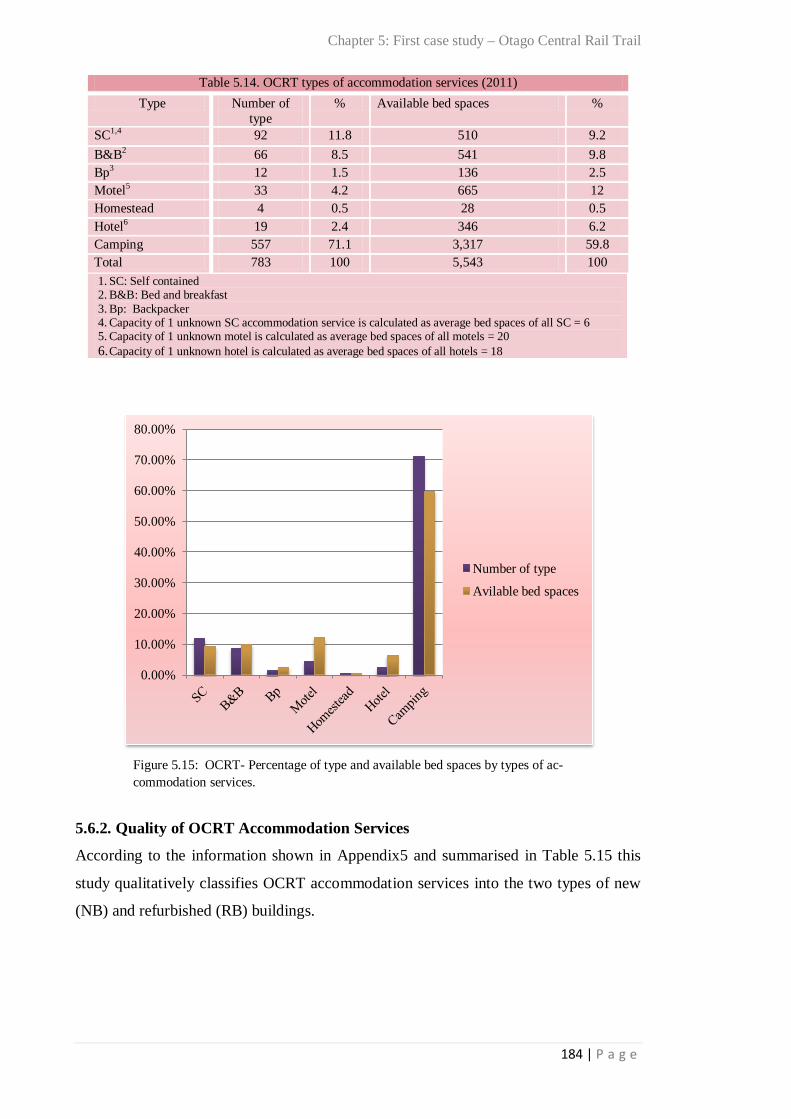
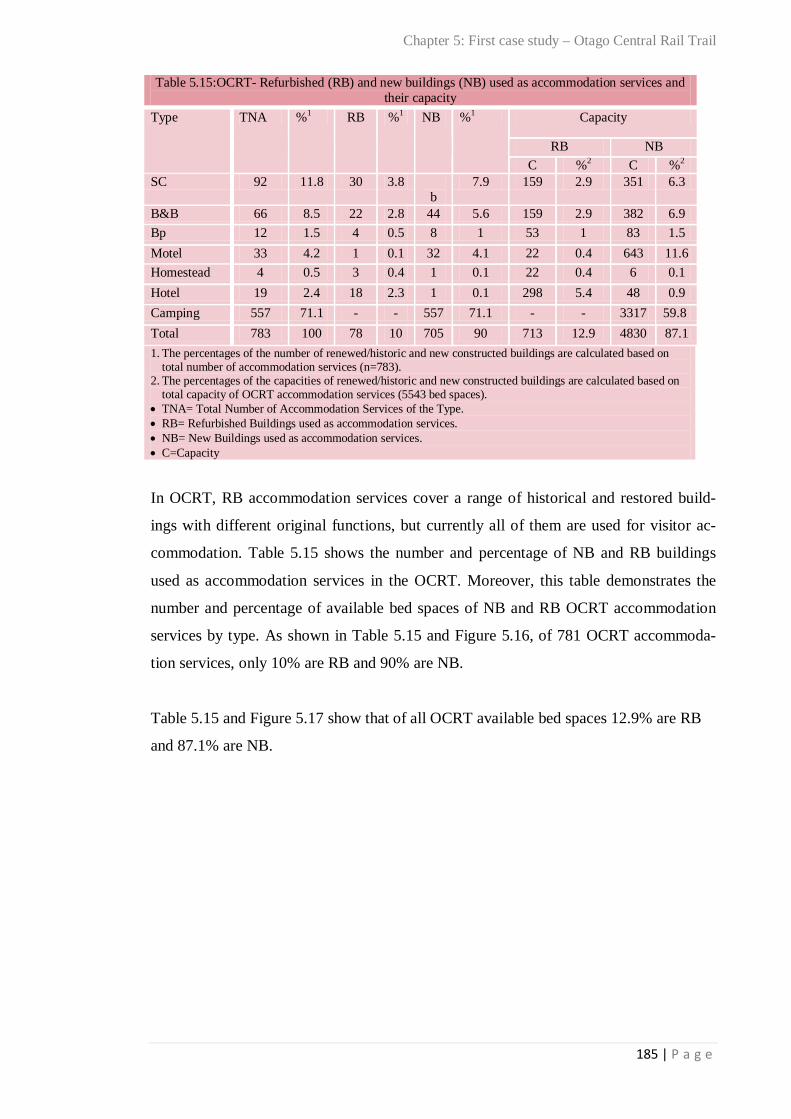
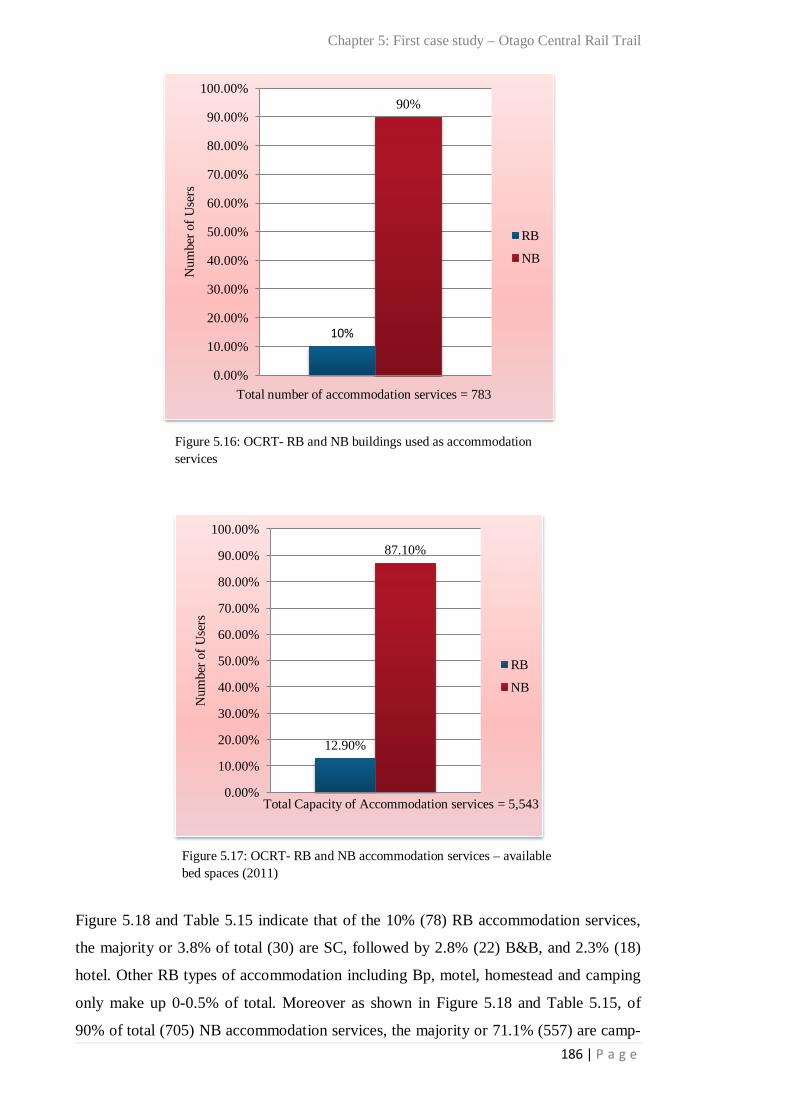
Table 5.14: OCRT types of accommodation service (2011) 184 Table 5.15: OCRT- Refurbished (RB) and new buildings (NB) used as accommodation services and their capacity 185
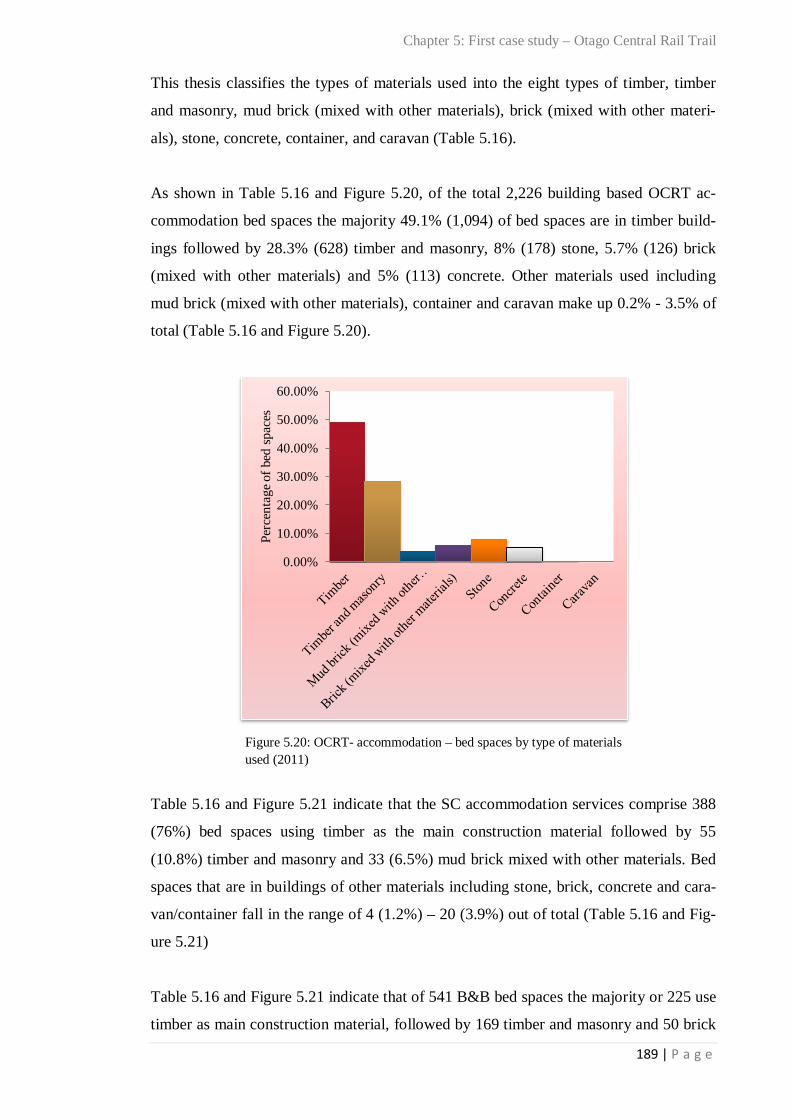
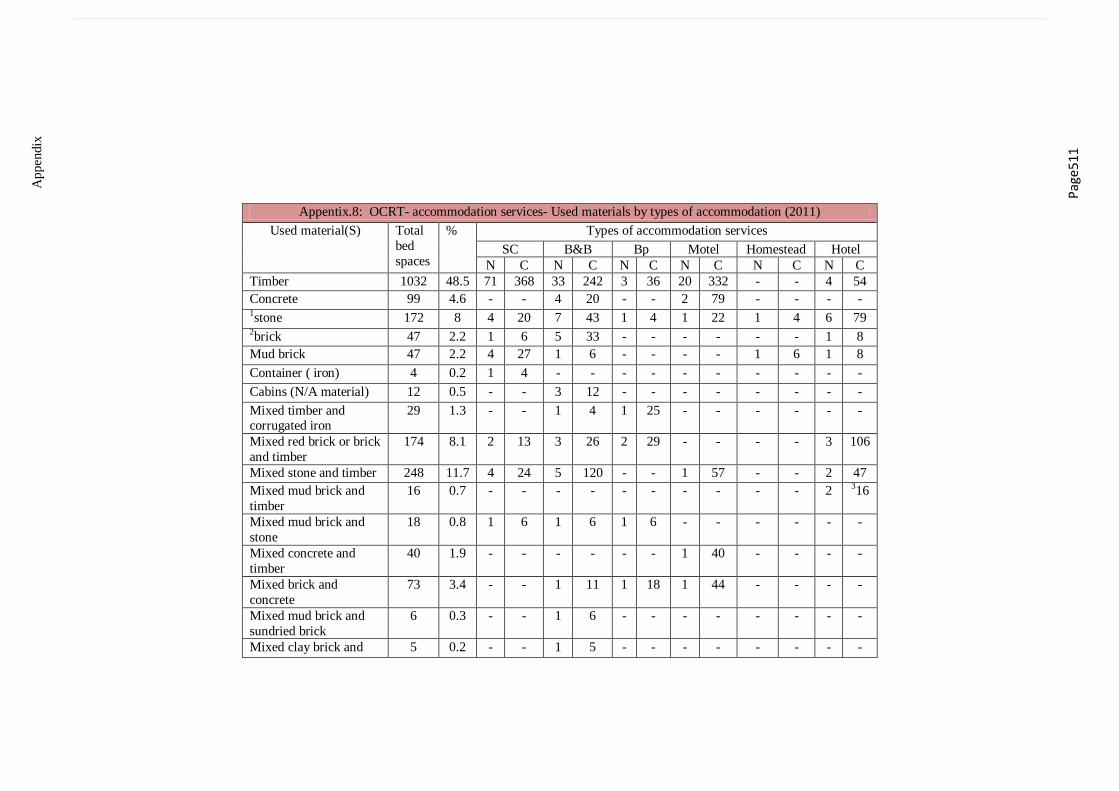
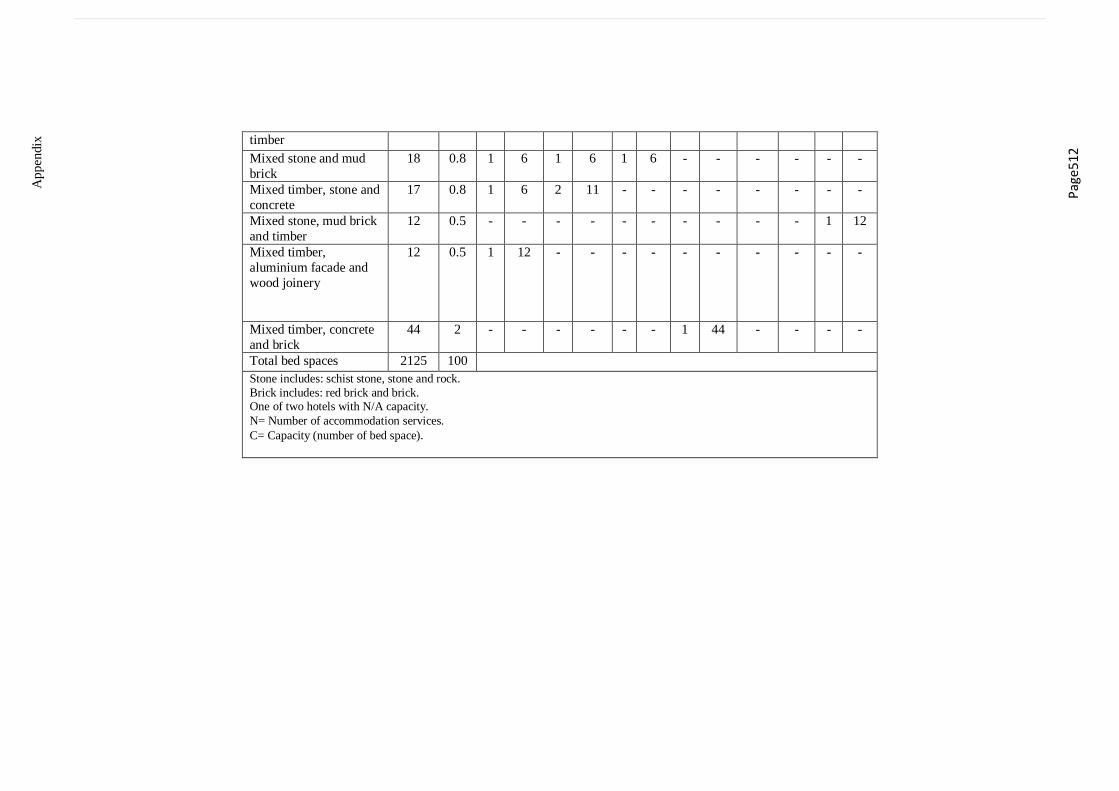
Table 5.16: OCRT- accommodation services- materials used by types of accommodation, summary, (2011) 188
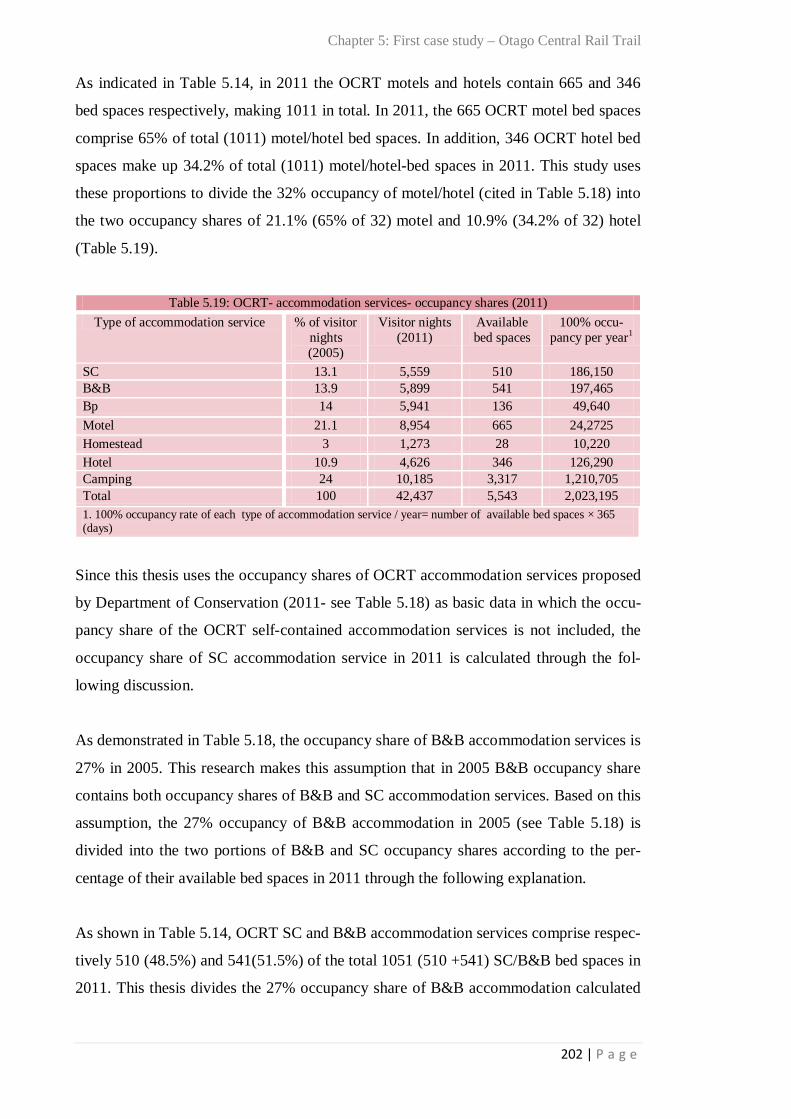
Table 5.17: Central Otago Accommodation Variables by accommodation type and year 201 Table 5.18: OCRT- Occupancy share by type of accommodation service 201
viii | P a g e
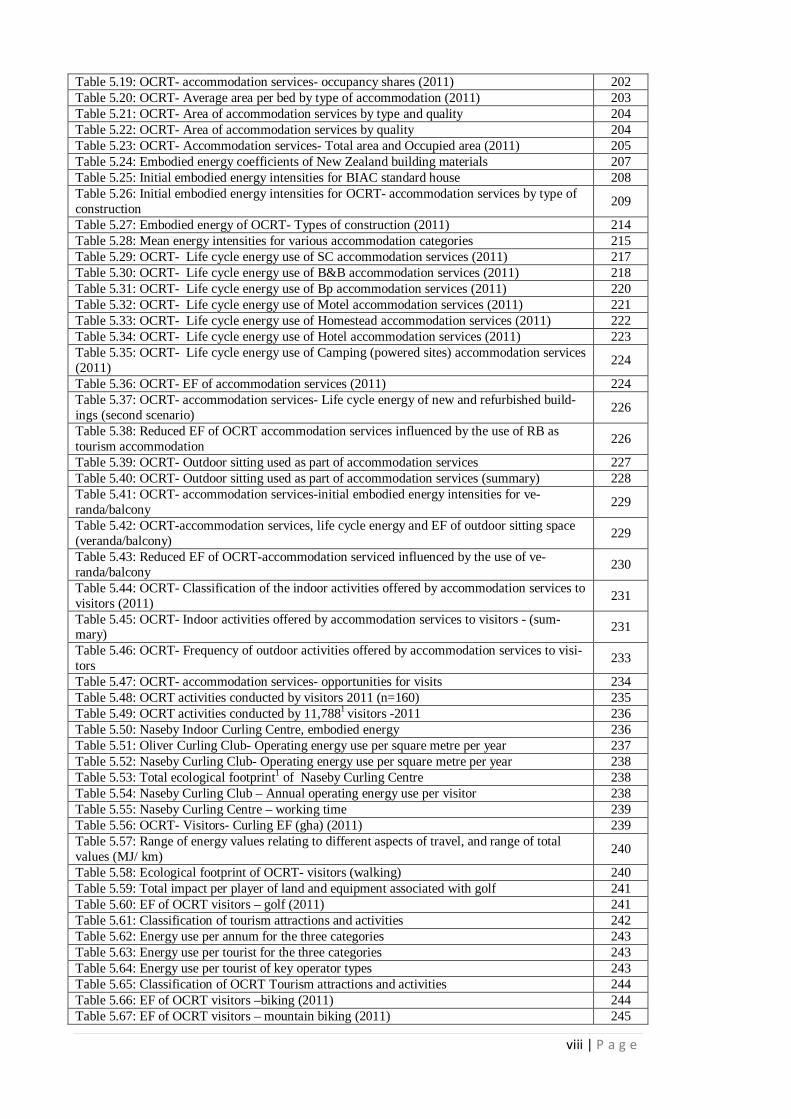
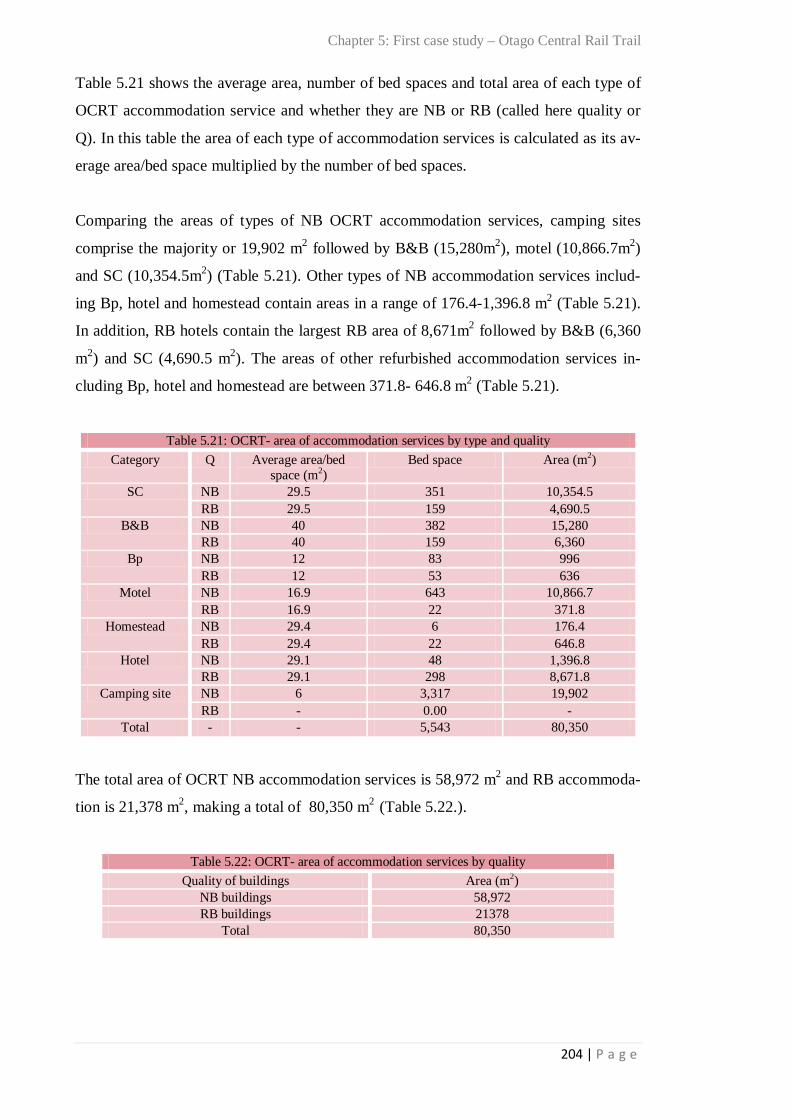
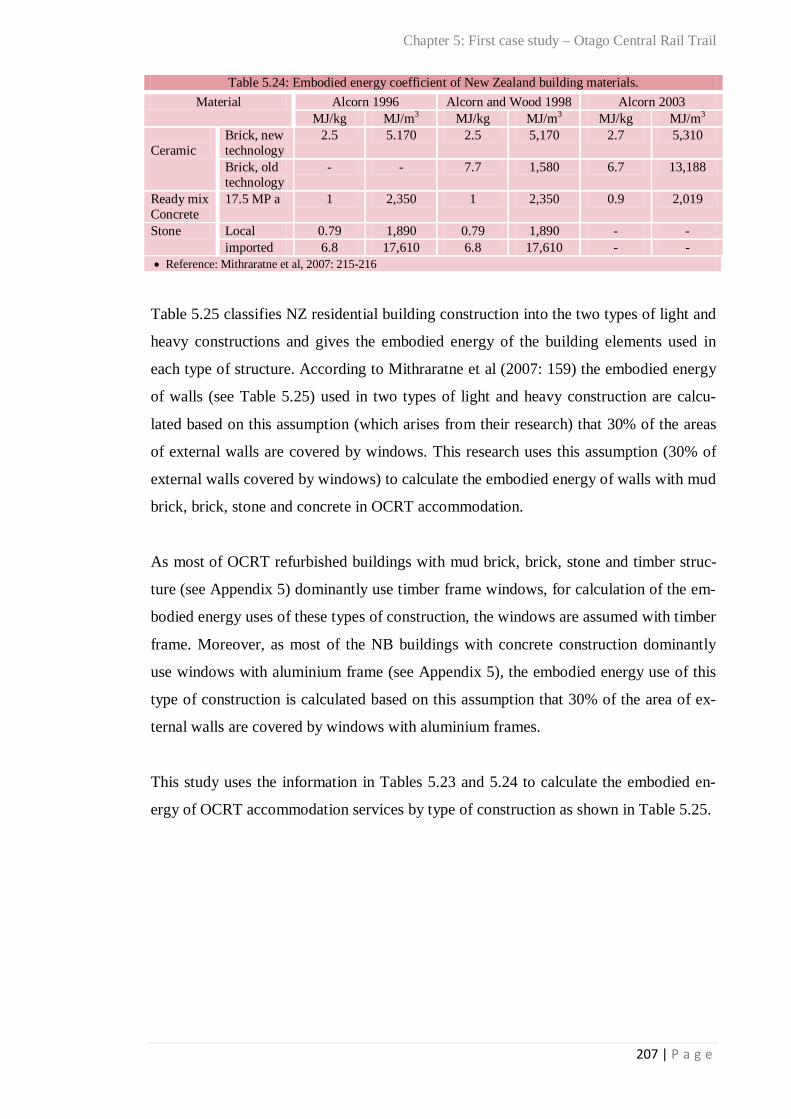
Table 5.19: OCRT- accommodation services- occupancy shares (2011) 202 Table 5.20: OCRT- Average area per bed by type of accommodation (2011) 203 Table 5.21: OCRT- Area of accommodation services by type and quality 204 Table 5.22: OCRT- Area of accommodation services by quality 204 Table 5.23: OCRT- Accommodation services- Total area and Occupied area (2011) 205 Table 5.24: Embodied energy coefficients of New Zealand building materials 207 Table 5.25: Initial embodied energy intensities for BIAC standard house 208 Table 5.26: Initial embodied energy intensities for OCRT- accommodation services by type of construction 209
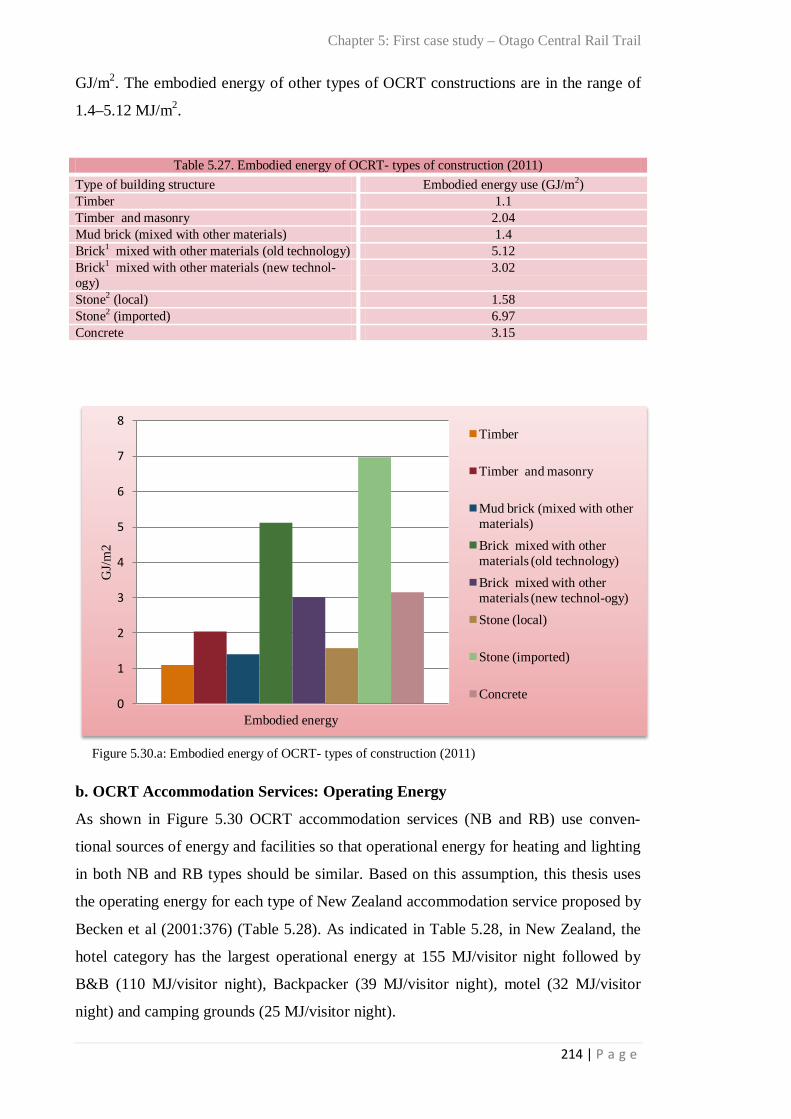
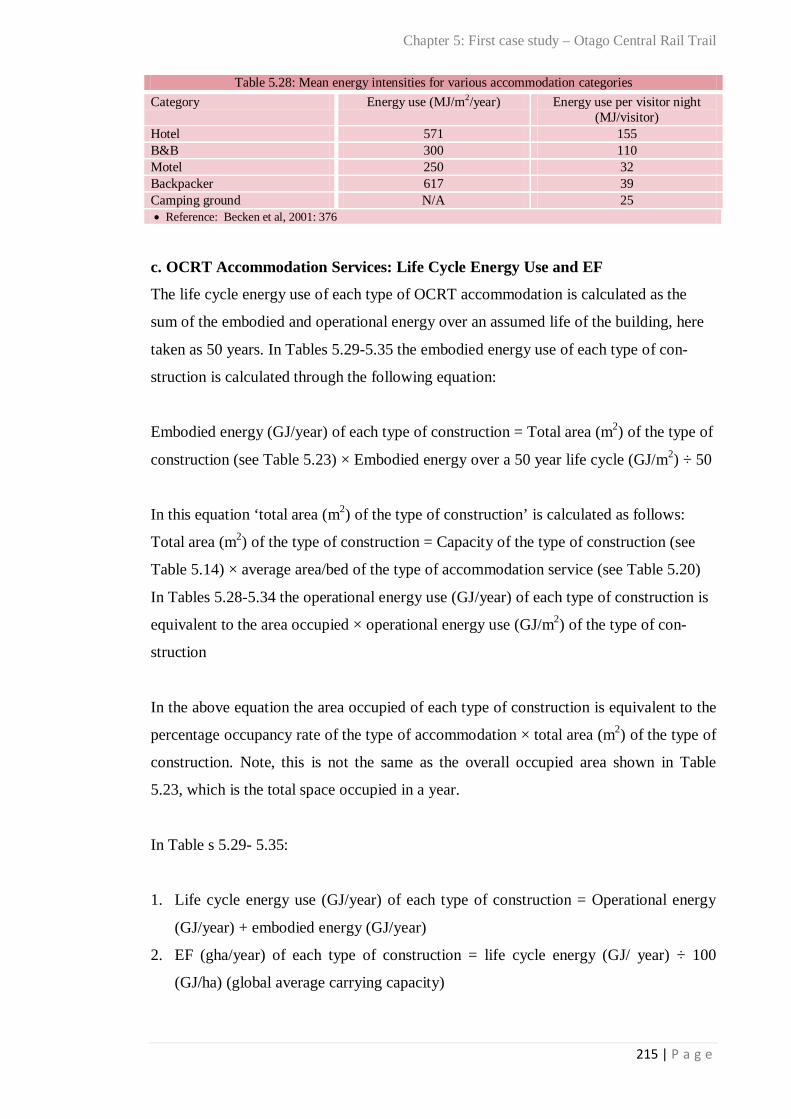
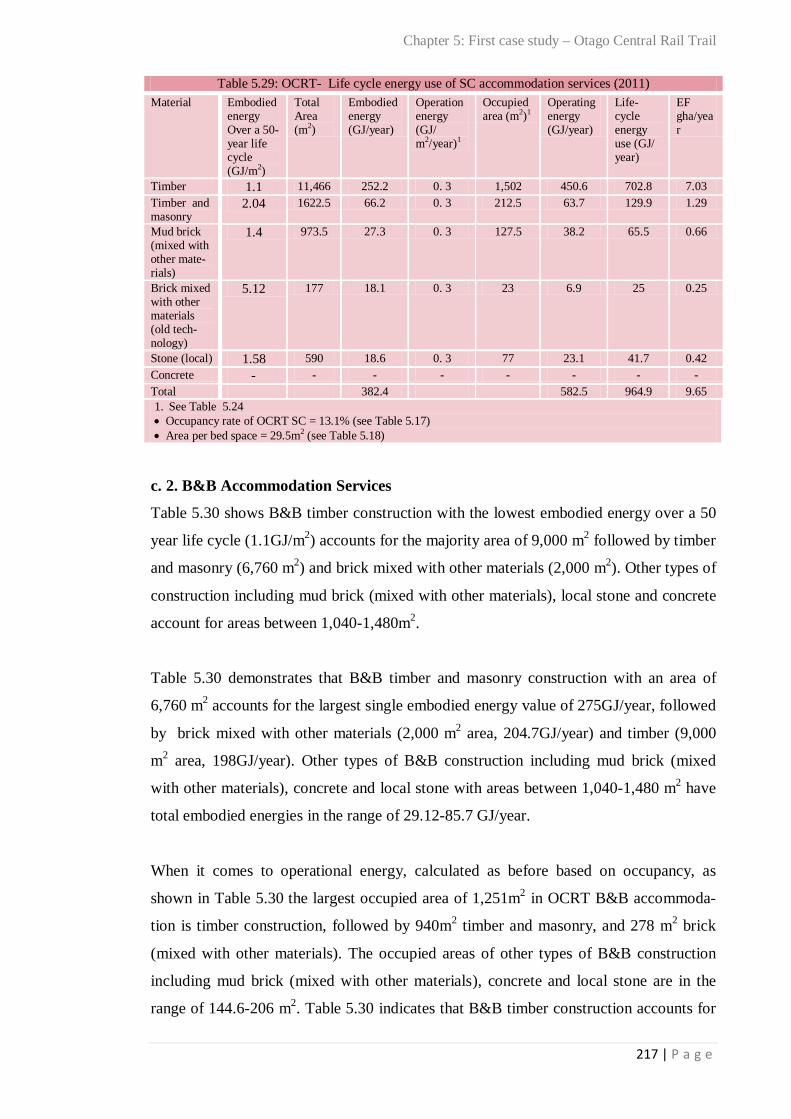
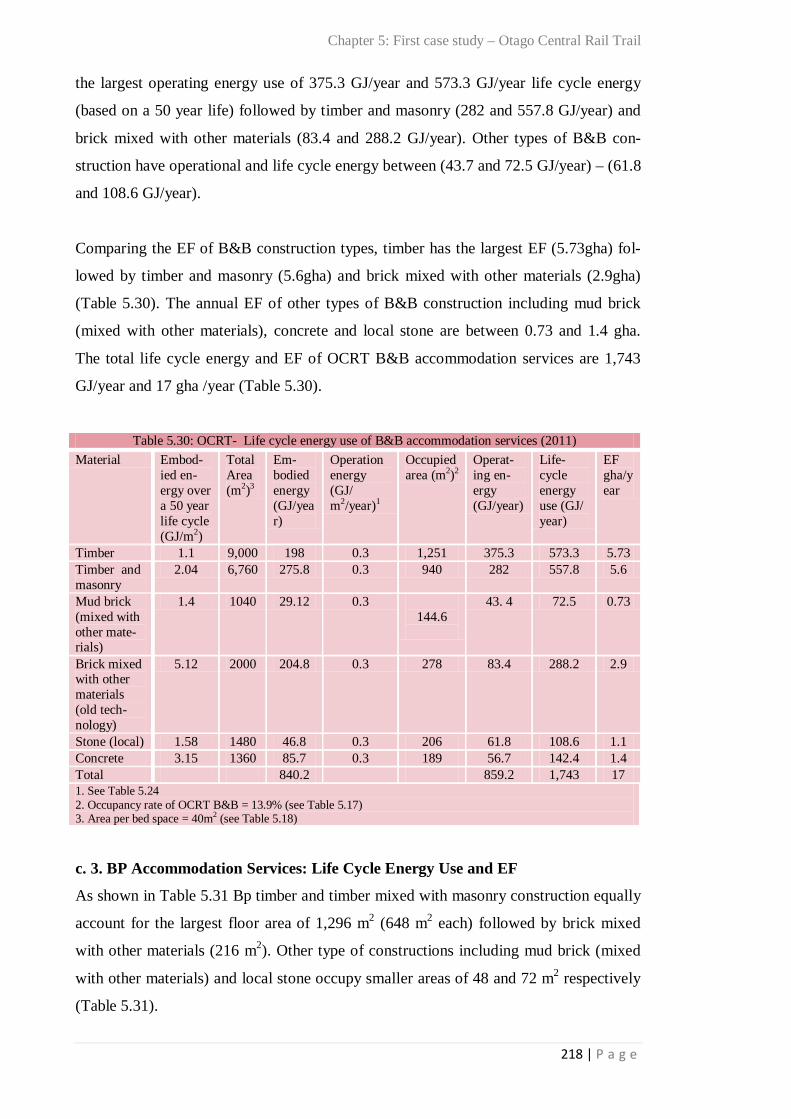
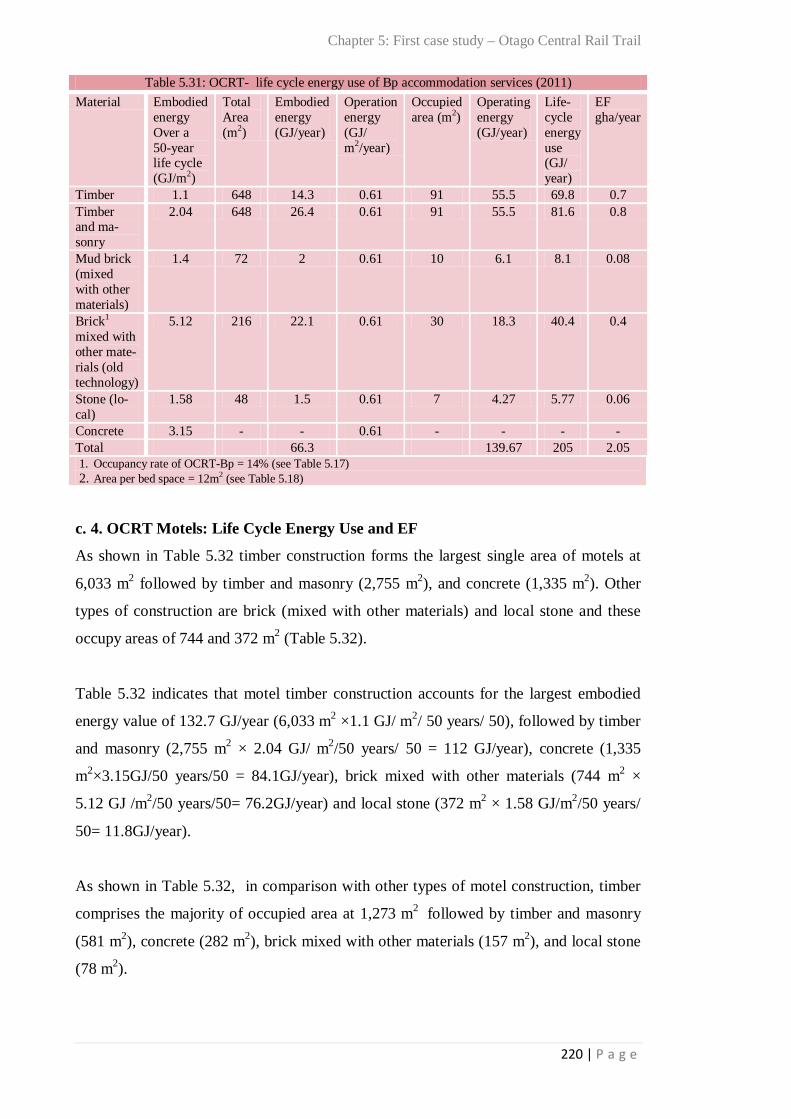
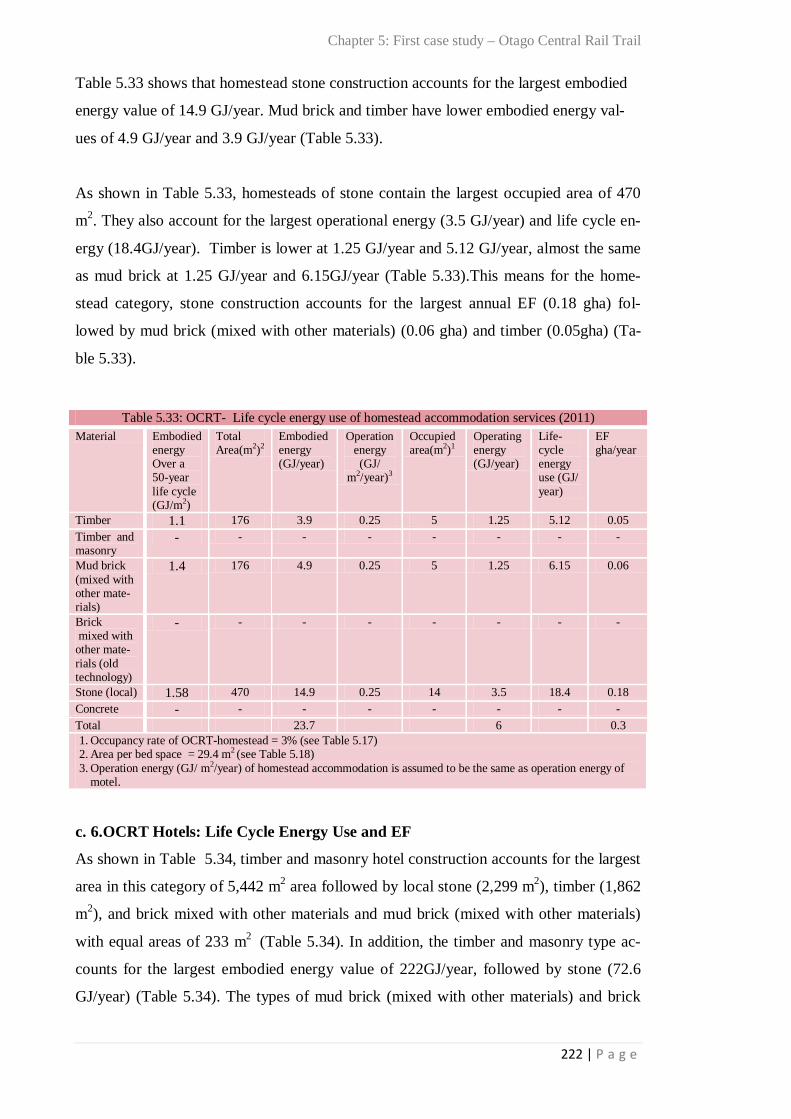
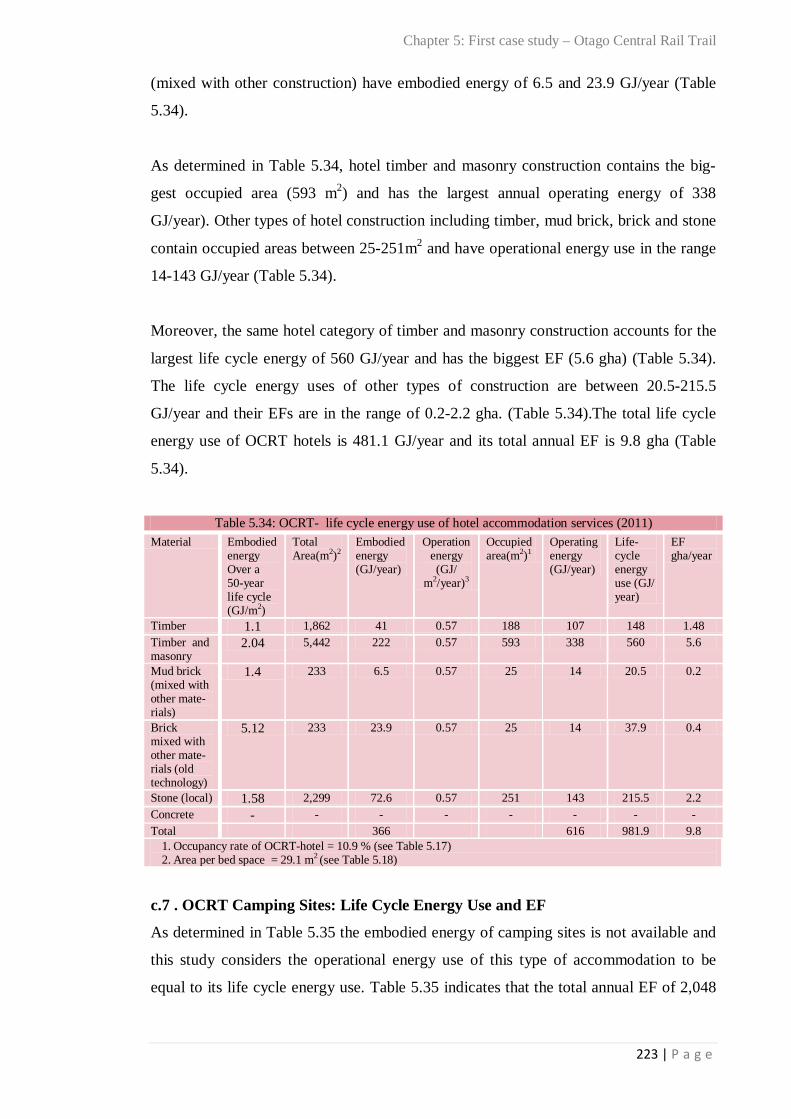
Table 5.27: Embodied energy of OCRT- Types of construction (2011) 214 Table 5.28: Mean energy intensities for various accommodation categories 215 Table 5.29: OCRT- Life cycle energy use of SC accommodation services (2011) 217 Table 5.30: OCRT- Life cycle energy use of B&B accommodation services (2011) 218 Table 5.31: OCRT- Life cycle energy use of Bp accommodation services (2011) 220 Table 5.32: OCRT- Life cycle energy use of Motel accommodation services (2011) 221 Table 5.33: OCRT- Life cycle energy use of Homestead accommodation services (2011) 222 Table 5.34: OCRT- Life cycle energy use of Hotel accommodation services (2011) 223 Table 5.35: OCRT- Life cycle energy use of Camping (powered sites) accommodation services (2011) 224
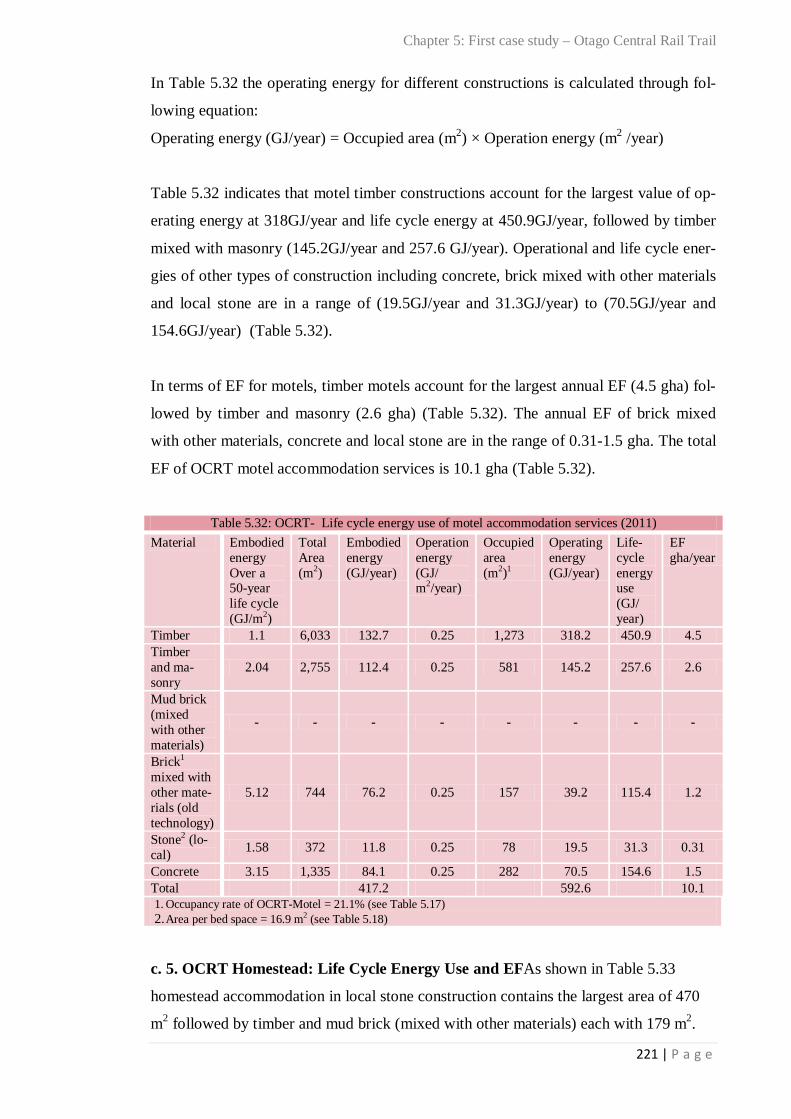
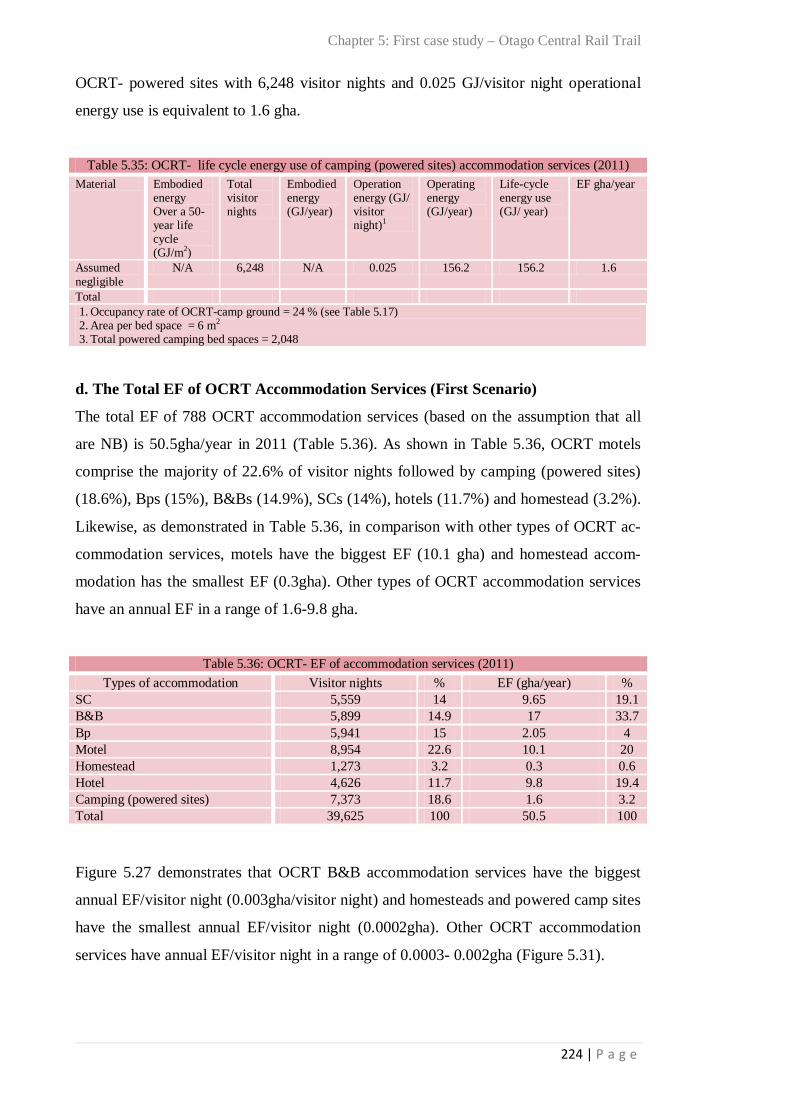
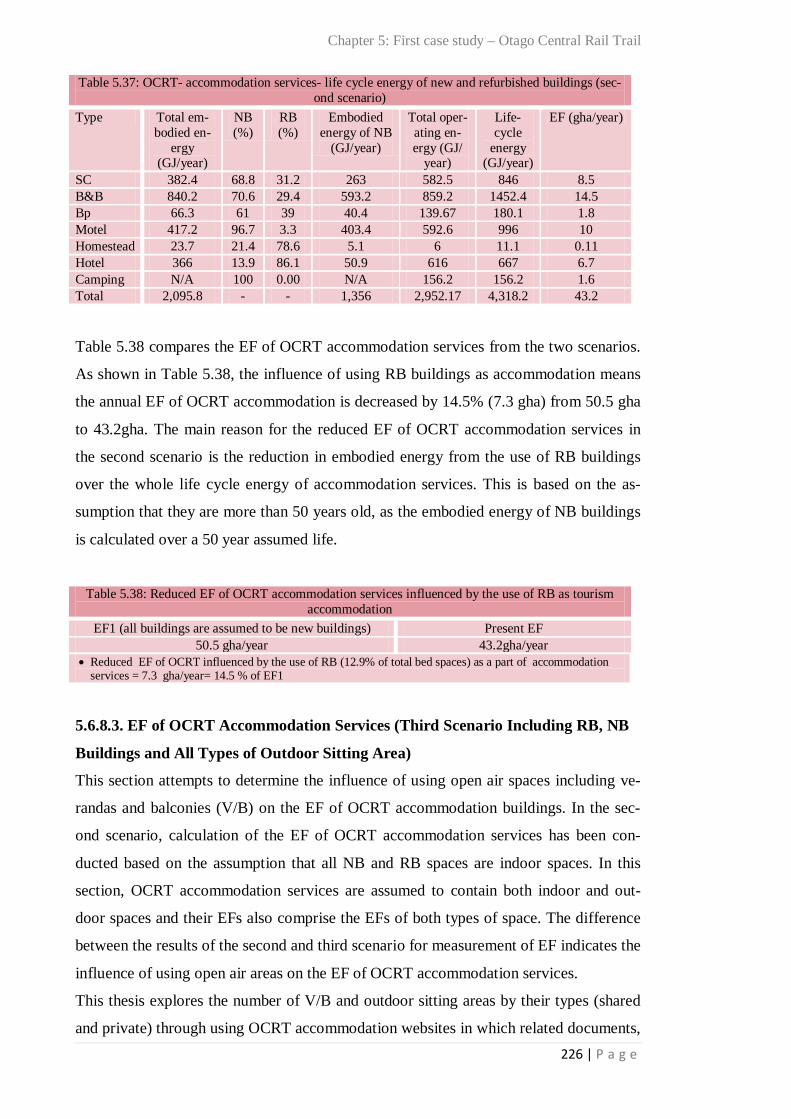
Table 5.36: OCRT- EF of accommodation services (2011) 224 Table 5.37: OCRT- accommodation services- Life cycle energy of new and refurbished build-ings (second scenario) 226
Table 5.38: Reduced EF of OCRT accommodation services influenced by the use of RB as tourism accommodation 226
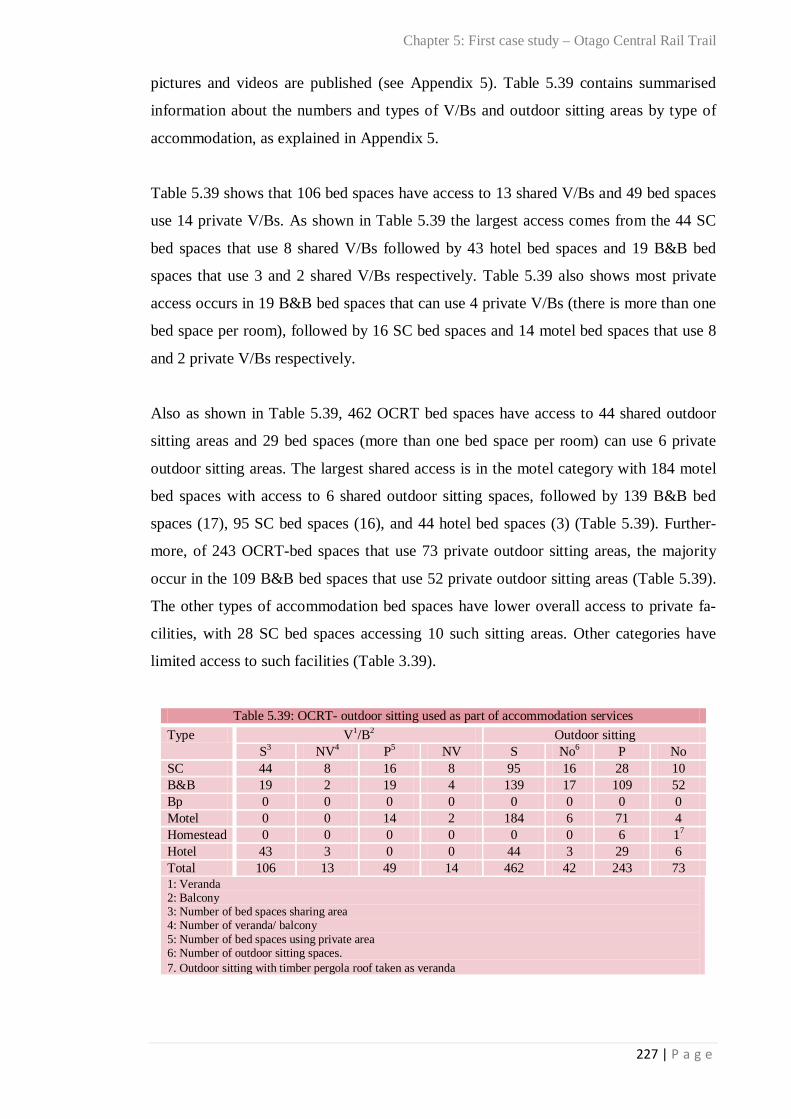
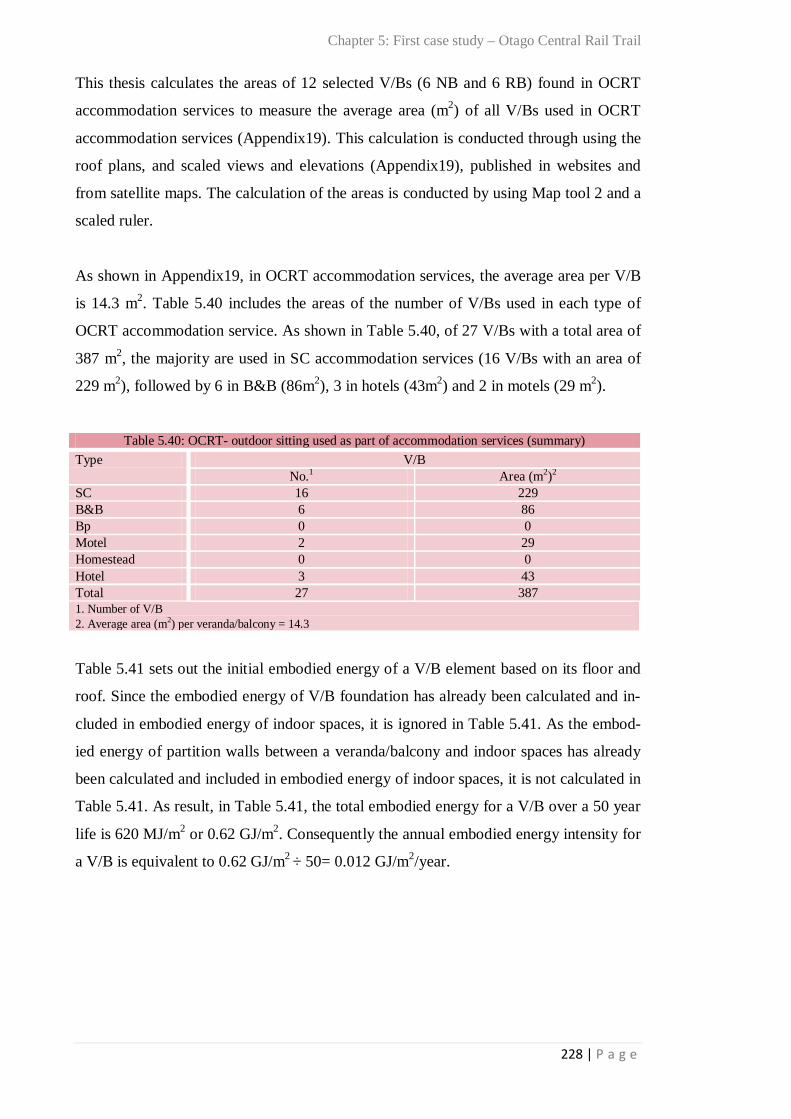
Table 5.39: OCRT- Outdoor sitting used as part of accommodation services 227 Table 5.40: OCRT- Outdoor sitting used as part of accommodation services (summary) 228 Table 5.41: OCRT- accommodation services-initial embodied energy intensities for ve-randa/balcony 229
Table 5.42: OCRT-accommodation services, life cycle energy and EF of outdoor sitting space (veranda/balcony) 229
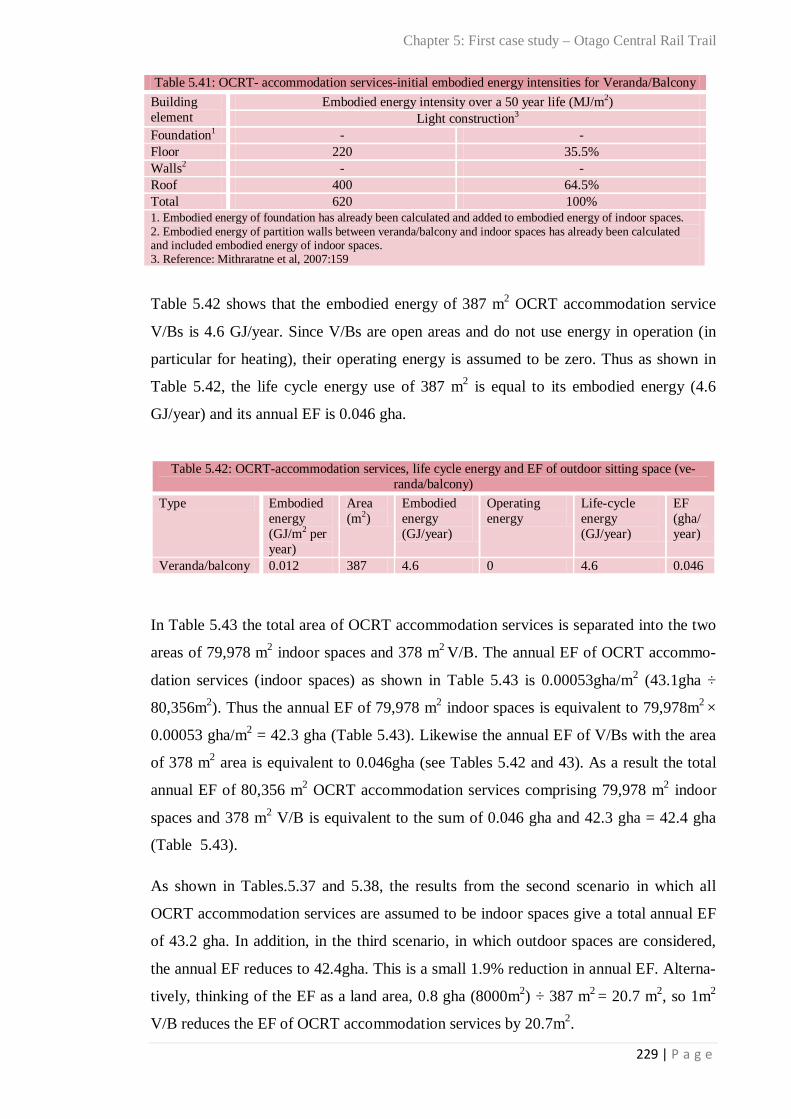
Table 5.43: Reduced EF of OCRT-accommodation serviced influenced by the use of ve-randa/balcony 230
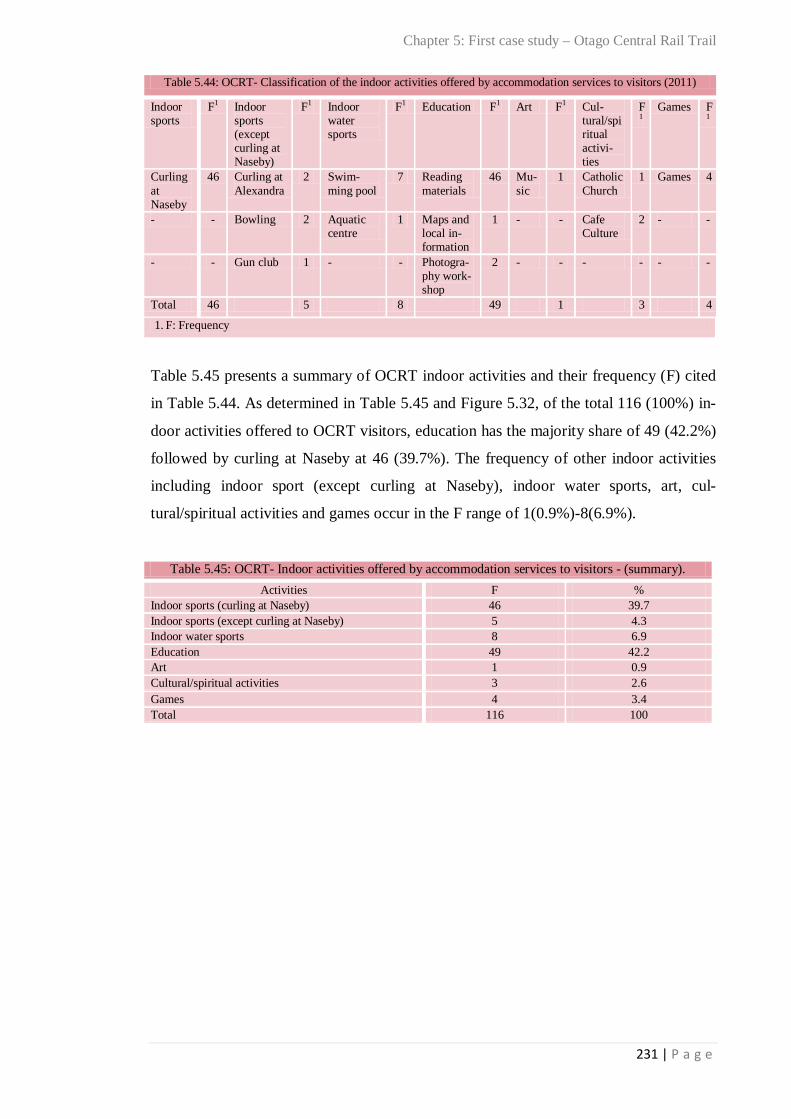
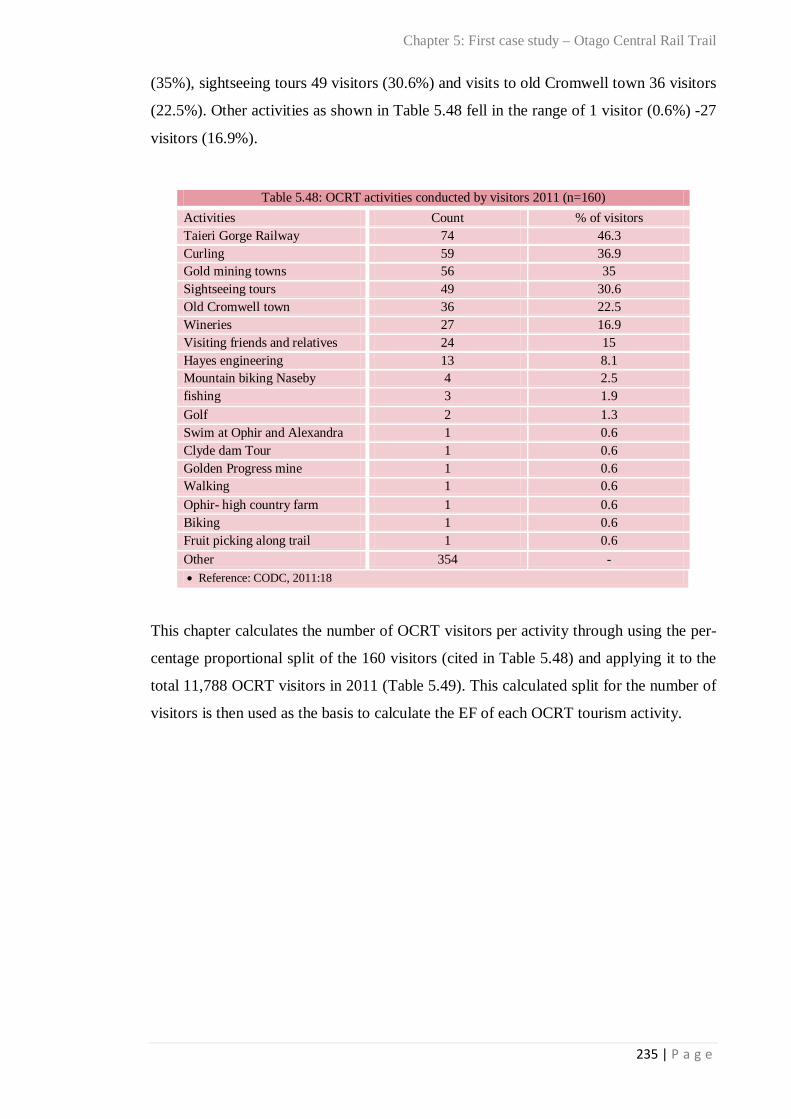
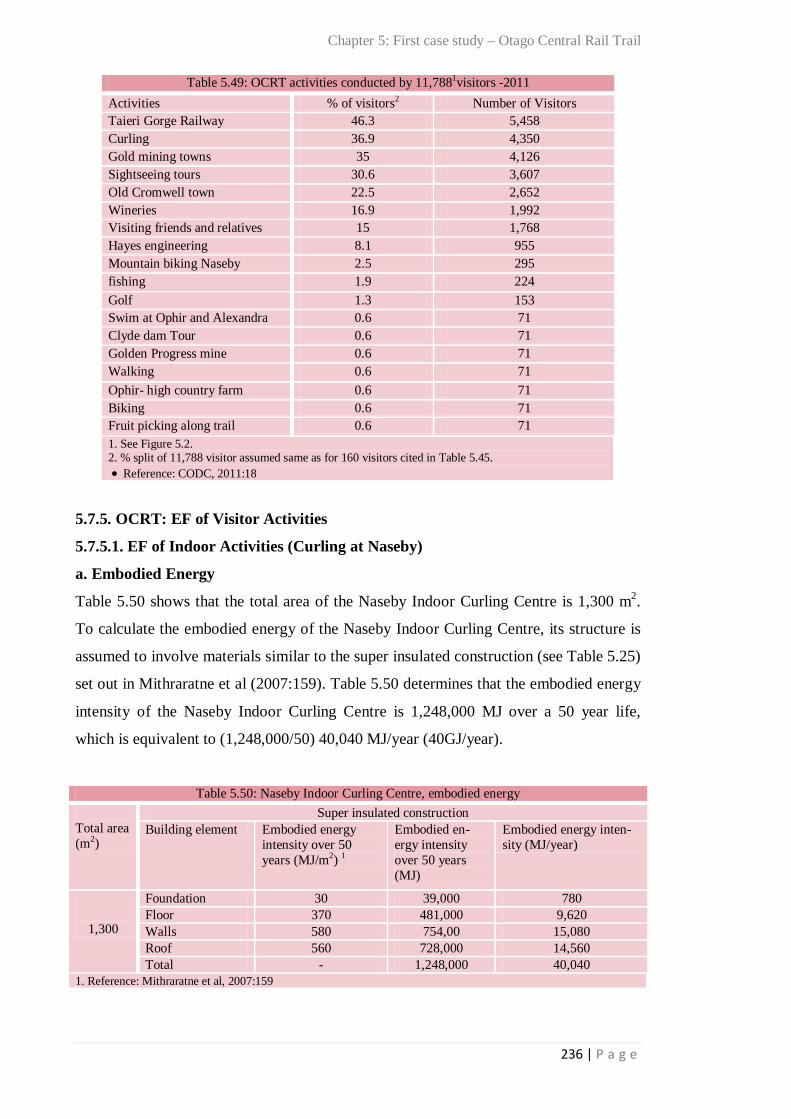
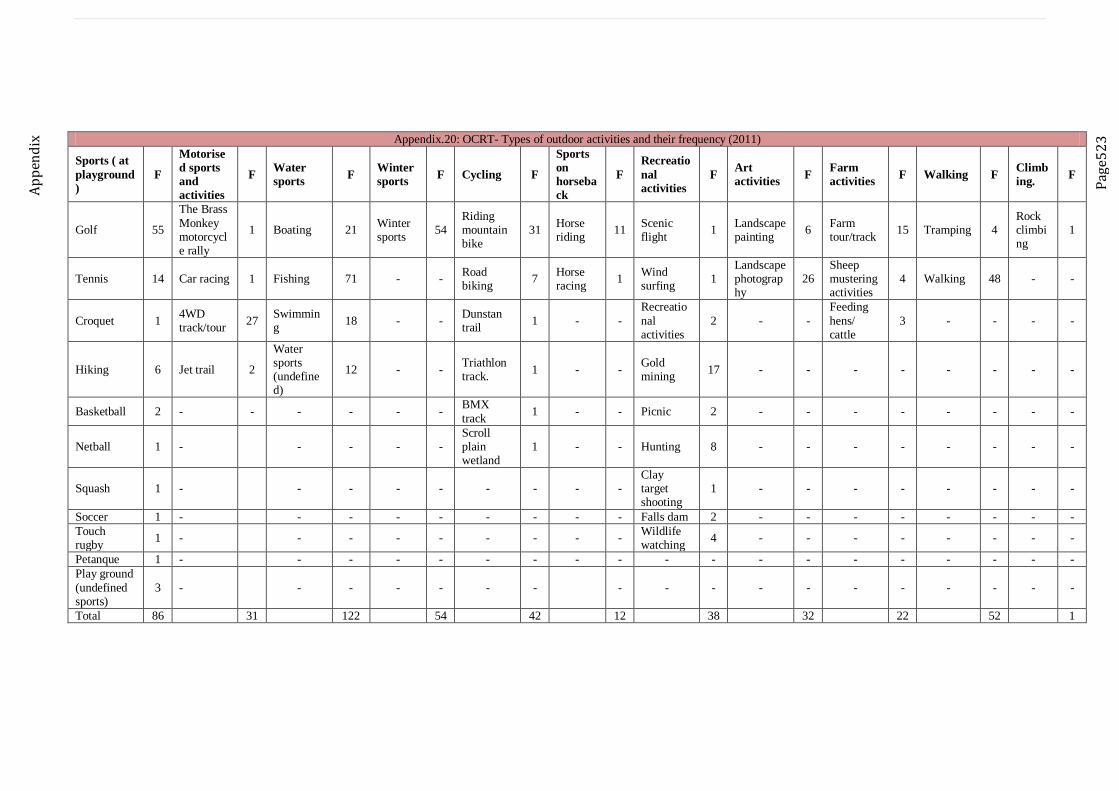
Table 5.44: OCRT- Classification of the indoor activities offered by accommodation services to visitors (2011) 231
Table 5.45: OCRT- Indoor activities offered by accommodation services to visitors - (sum-mary) 231
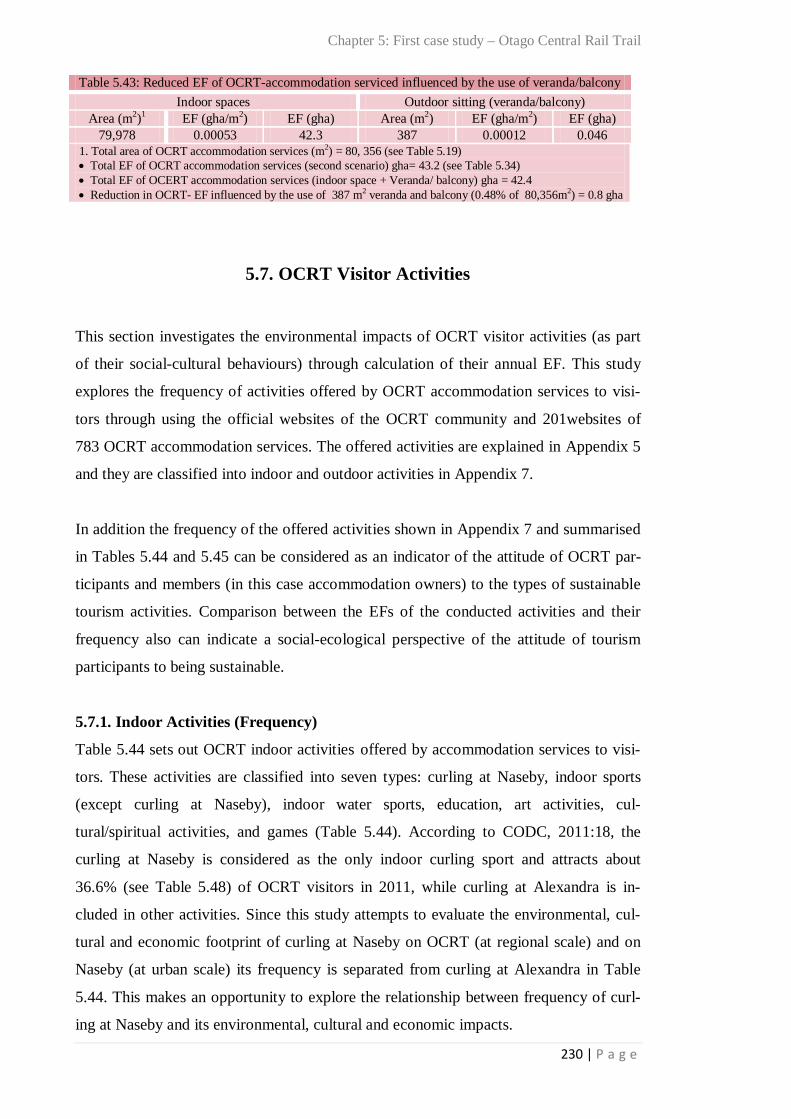
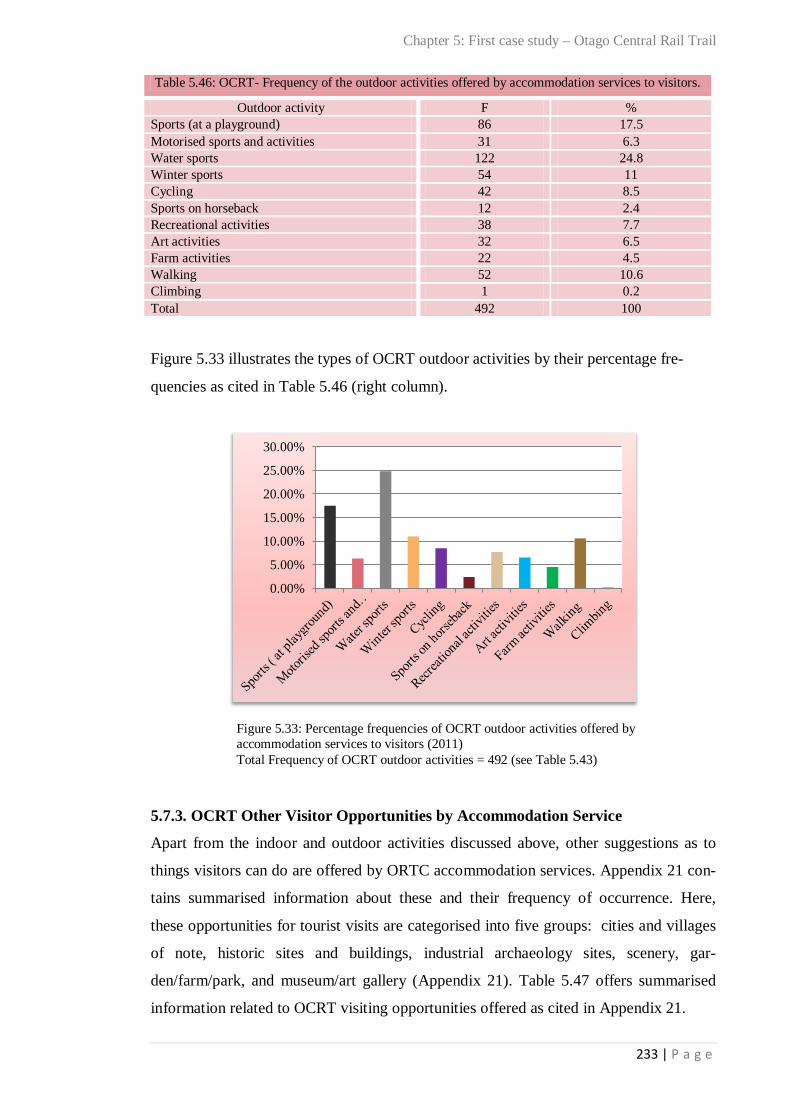
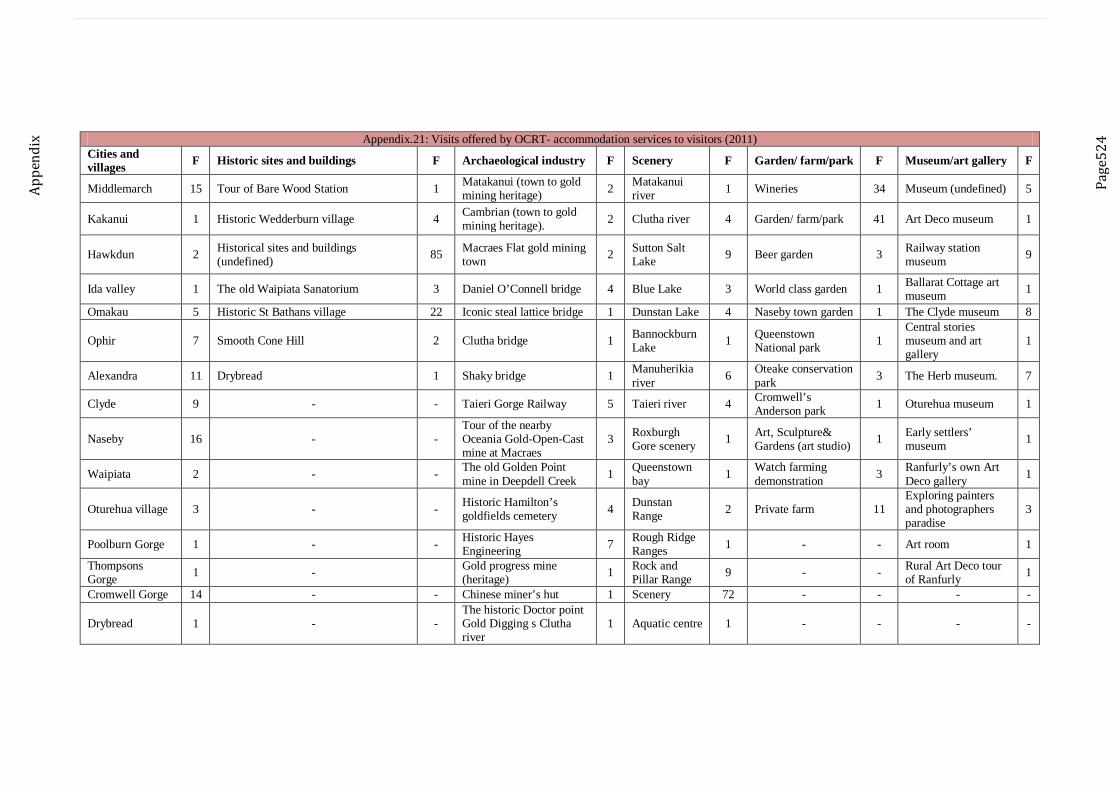
Table 5.46: OCRT- Frequency of outdoor activities offered by accommodation services to visi-tors 233
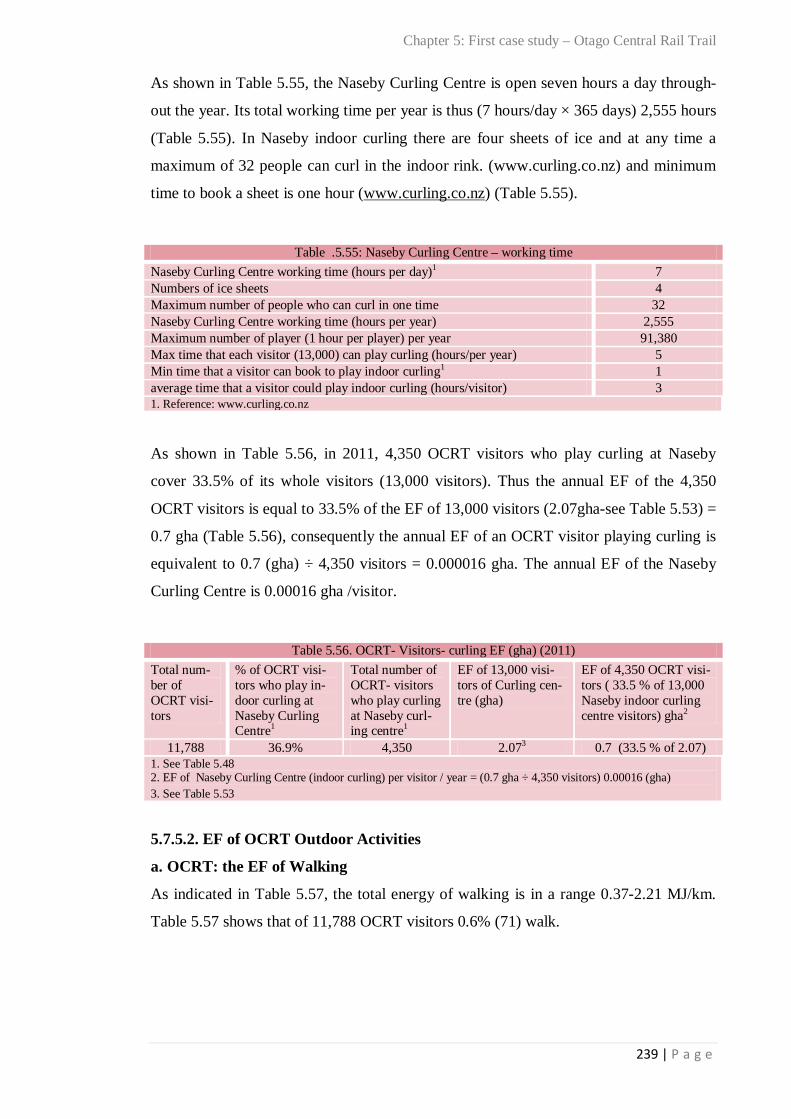
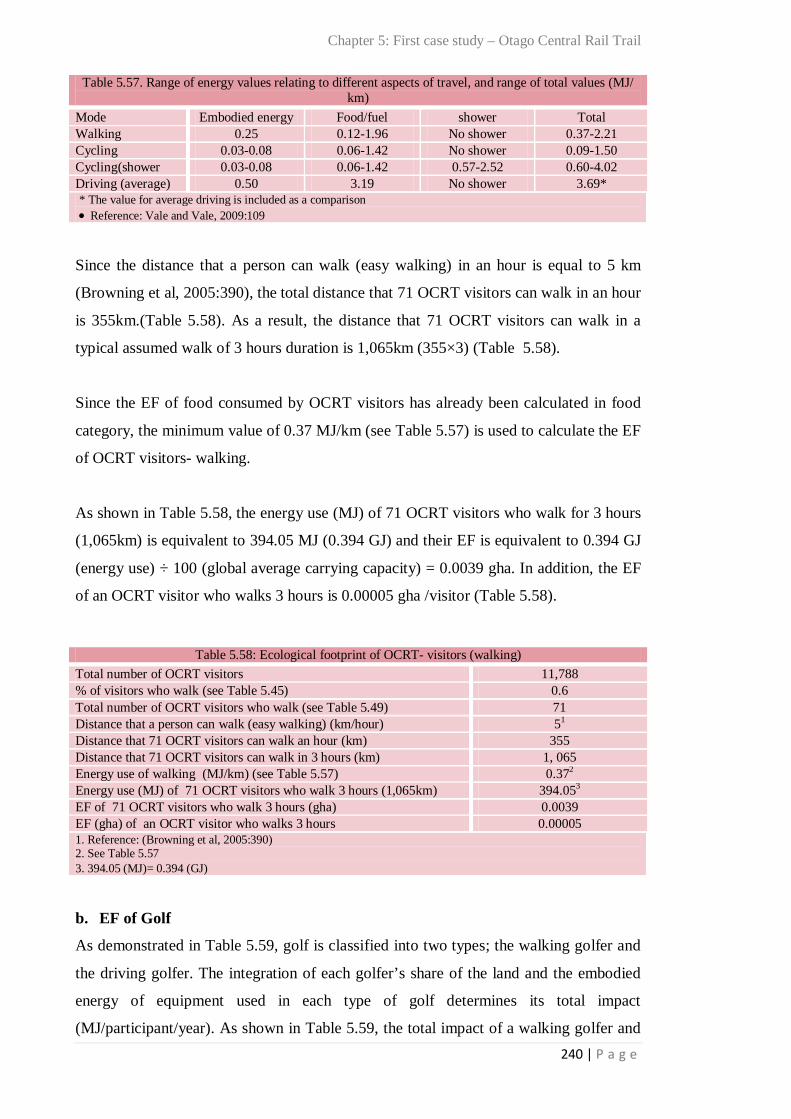
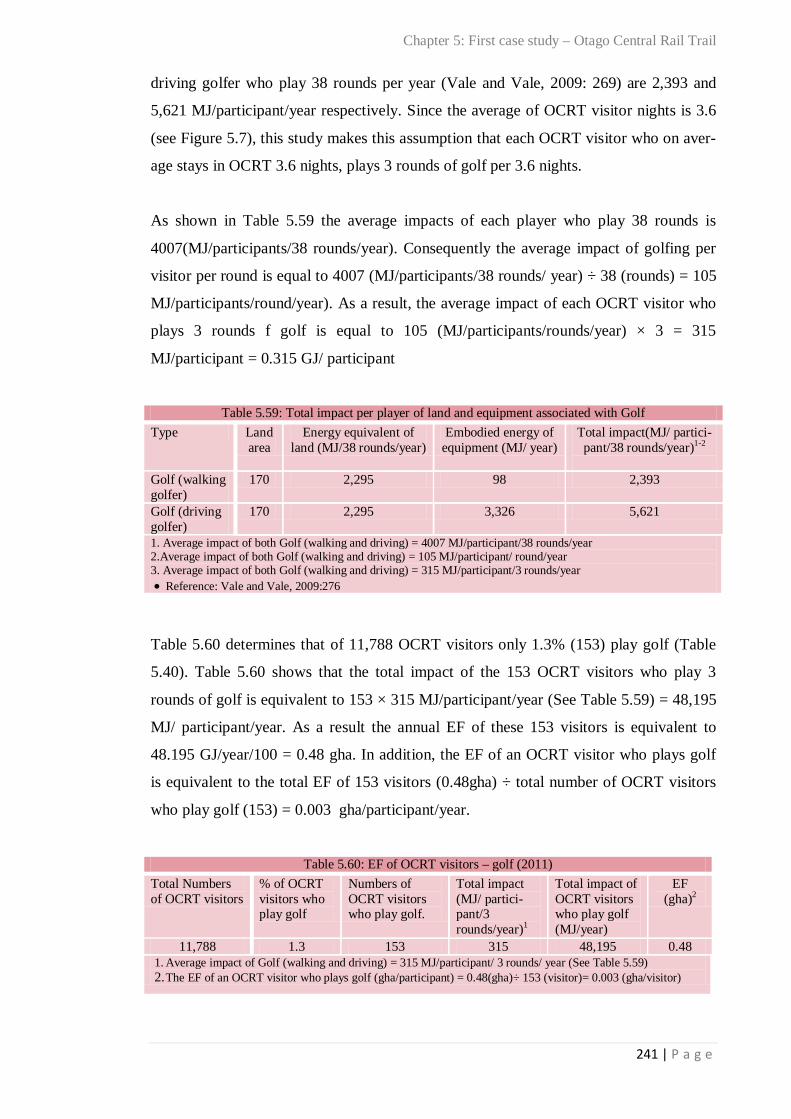
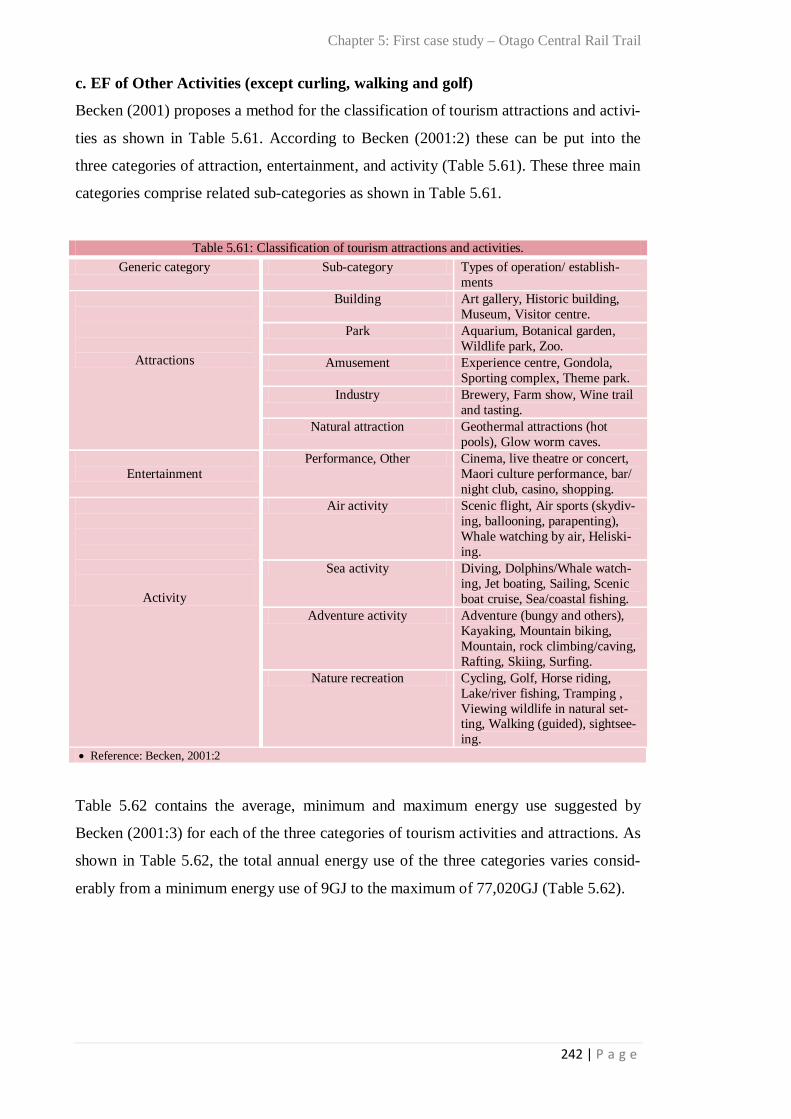
Table 5.47: OCRT- accommodation services- opportunities for visits 234 Table 5.48: OCRT activities conducted by visitors 2011 (n=160) 235 Table 5.49: OCRT activities conducted by 11,7881 visitors -2011 236 Table 5.50: Naseby Indoor Curling Centre, embodied energy 236 Table 5.51: Oliver Curling Club- Operating energy use per square metre per year 237 Table 5.52: Naseby Curling Club- Operating energy use per square metre per year 238 Table 5.53: Total ecological footprint1 of Naseby Curling Centre 238 Table 5.54: Naseby Curling Club – Annual operating energy use per visitor 238 Table 5.55: Naseby Curling Centre – working time 239 Table 5.56: OCRT- Visitors- Curling EF (gha) (2011) 239 Table 5.57: Range of energy values relating to different aspects of travel, and range of total values (MJ/ km) 240
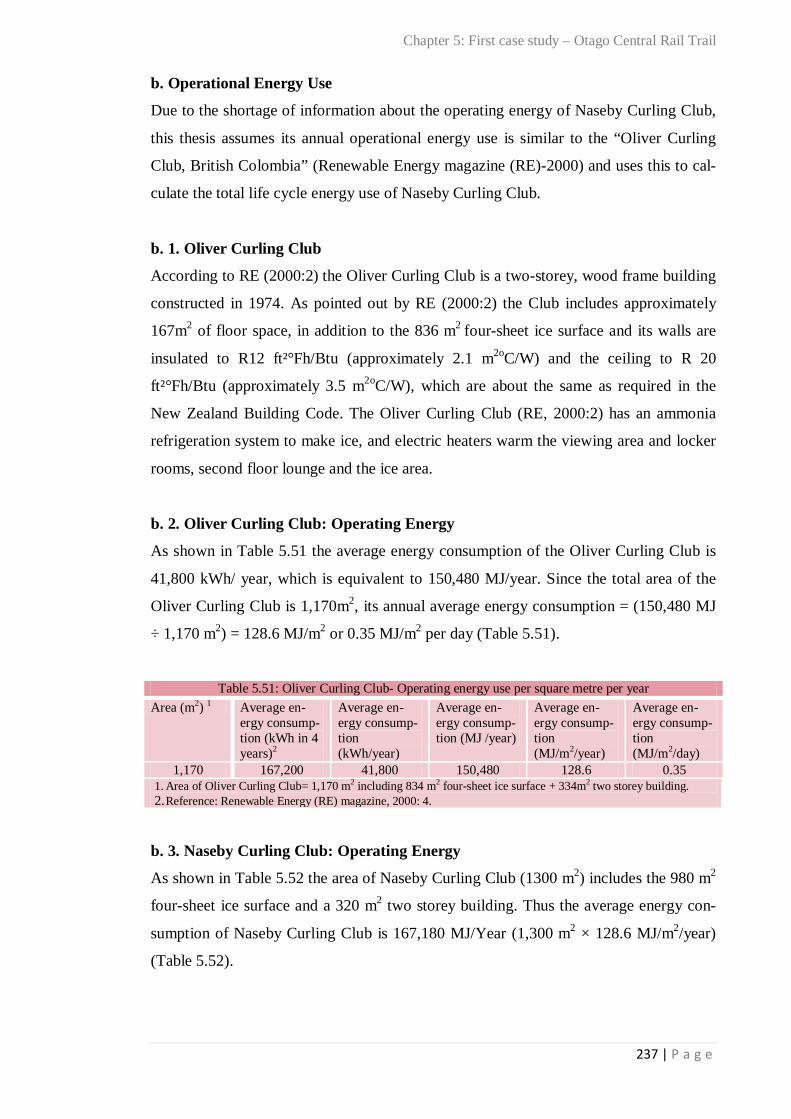
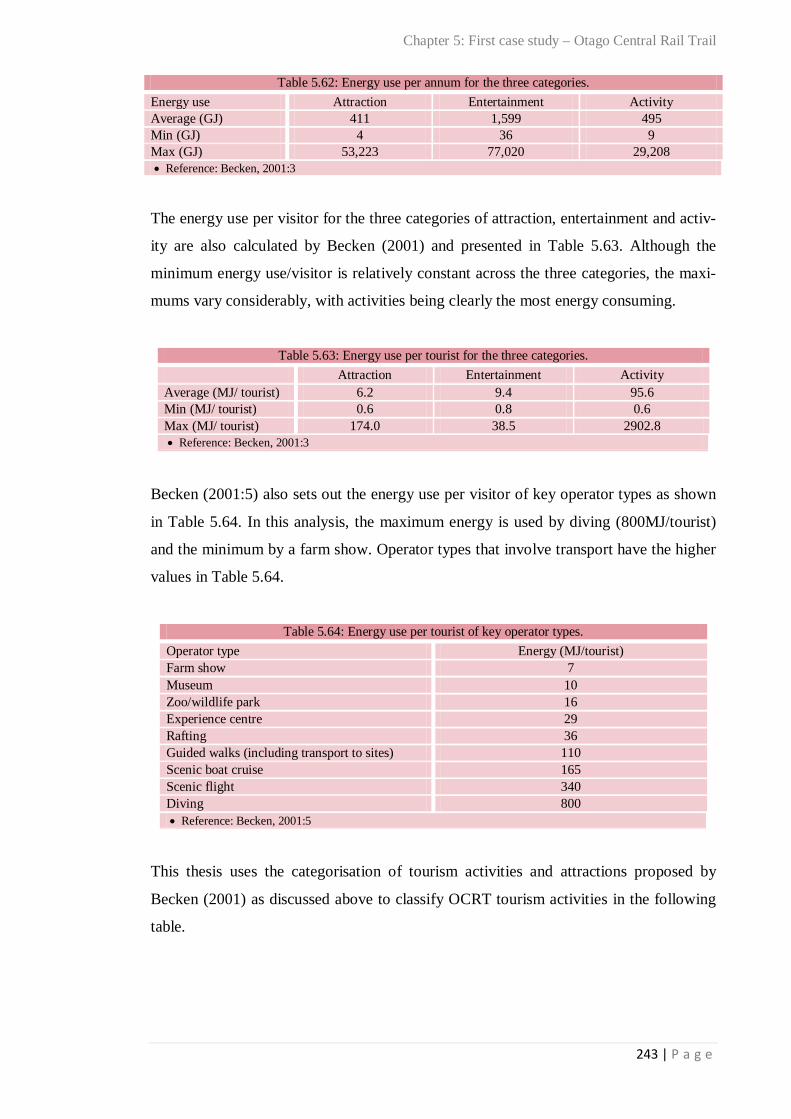
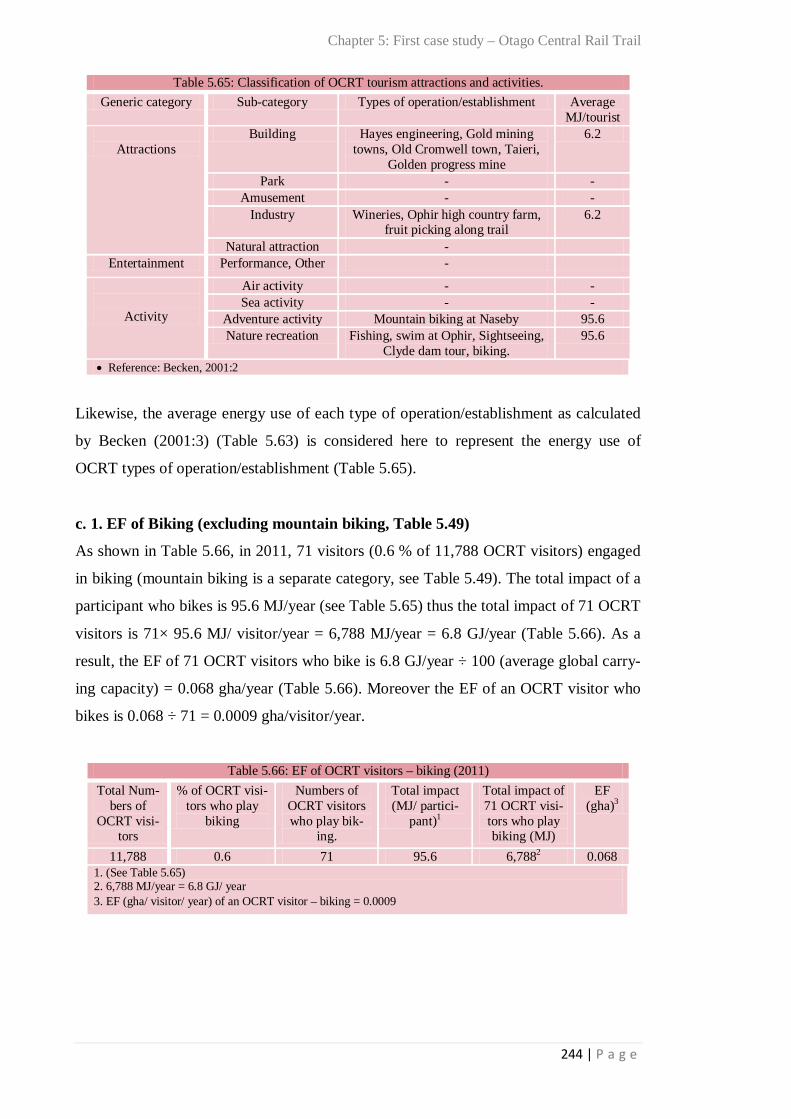
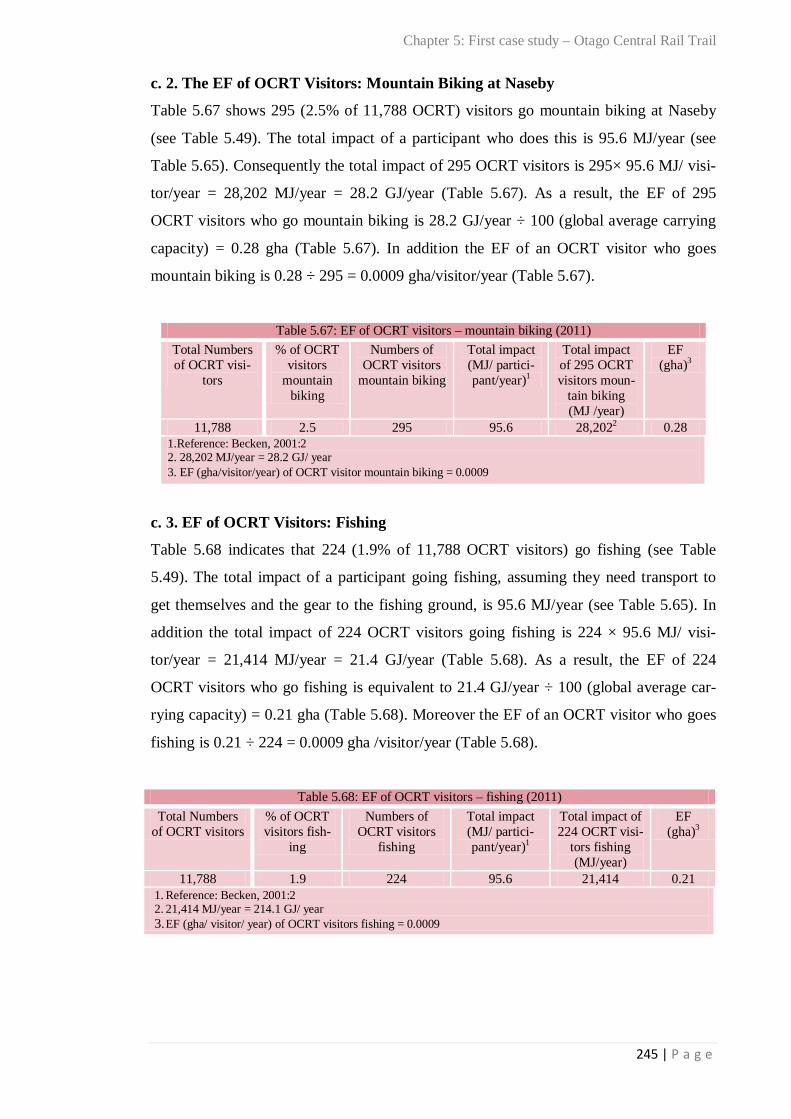
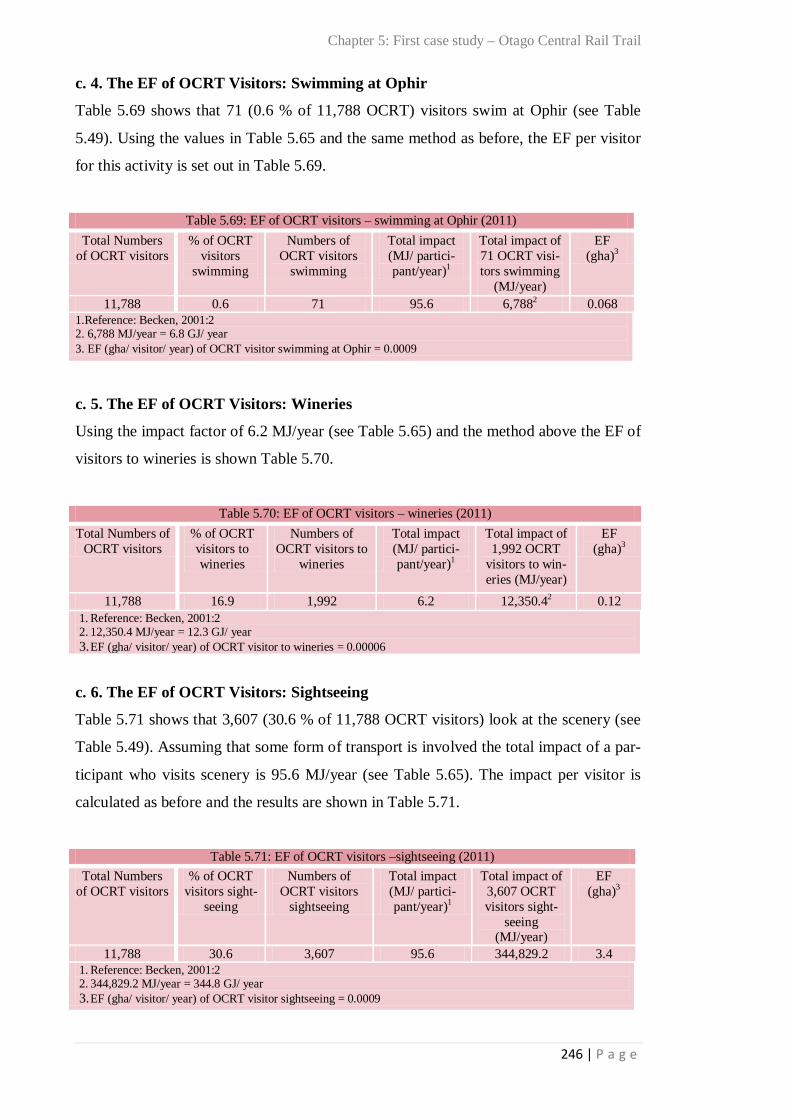
Table 5.58: Ecological footprint of OCRT- visitors (walking) 240 Table 5.59: Total impact per player of land and equipment associated with golf 241 Table 5.60: EF of OCRT visitors – golf (2011) 241 Table 5.61: Classification of tourism attractions and activities 242 Table 5.62: Energy use per annum for the three categories 243 Table 5.63: Energy use per tourist for the three categories 243 Table 5.64: Energy use per tourist of key operator types 243 Table 5.65: Classification of OCRT Tourism attractions and activities 244 Table 5.66: EF of OCRT visitors –biking (2011) 244 Table 5.67: EF of OCRT visitors – mountain biking (2011) 245
ix | P a g e
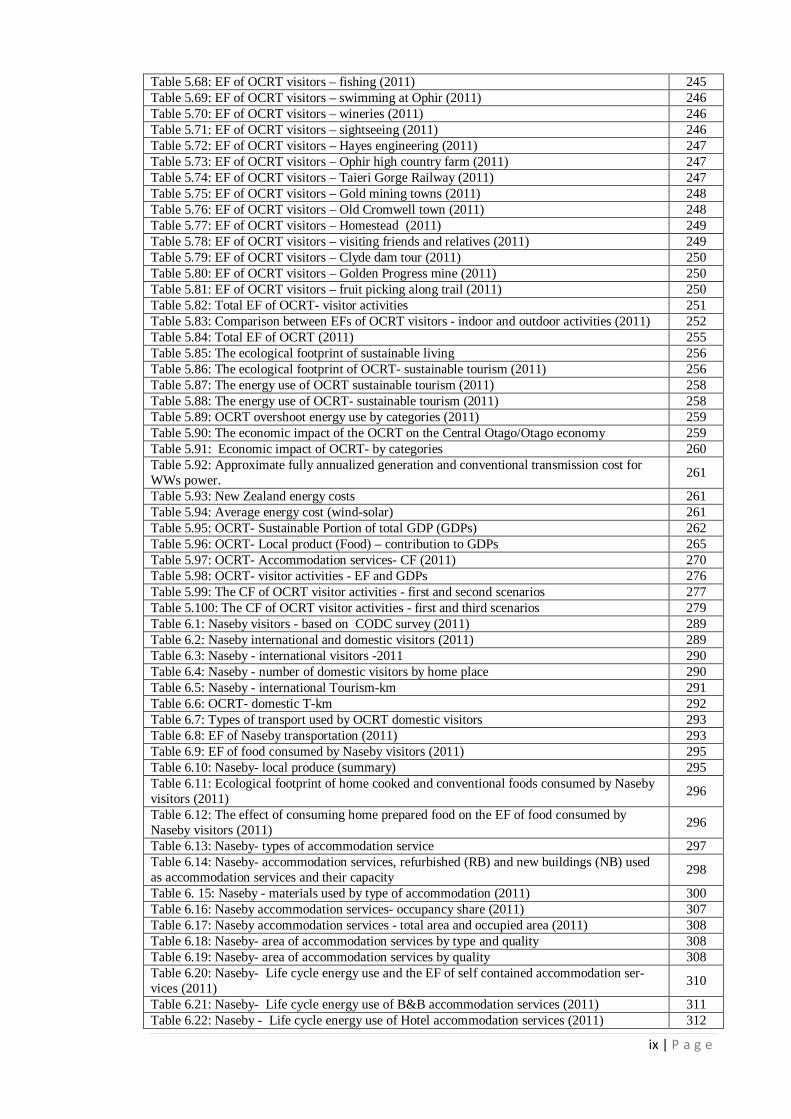
Table 5.68: EF of OCRT visitors – fishing (2011) 245 Table 5.69: EF of OCRT visitors – swimming at Ophir (2011) 246 Table 5.70: EF of OCRT visitors – wineries (2011) 246 Table 5.71: EF of OCRT visitors – sightseeing (2011) 246 Table 5.72: EF of OCRT visitors – Hayes engineering (2011) 247 Table 5.73: EF of OCRT visitors – Ophir high country farm (2011) 247 Table 5.74: EF of OCRT visitors – Taieri Gorge Railway (2011) 247 Table 5.75: EF of OCRT visitors – Gold mining towns (2011) 248 Table 5.76: EF of OCRT visitors – Old Cromwell town (2011) 248 Table 5.77: EF of OCRT visitors – Homestead (2011) 249 Table 5.78: EF of OCRT visitors – visiting friends and relatives (2011) 249 Table 5.79: EF of OCRT visitors – Clyde dam tour (2011) 250 Table 5.80: EF of OCRT visitors – Golden Progress mine (2011) 250 Table 5.81: EF of OCRT visitors – fruit picking along trail (2011) 250 Table 5.82: Total EF of OCRT- visitor activities 251 Table 5.83: Comparison between EFs of OCRT visitors - indoor and outdoor activities (2011) 252 Table 5.84: Total EF of OCRT (2011) 255 Table 5.85: The ecological footprint of sustainable living 256 Table 5.86: The ecological footprint of OCRT- sustainable tourism (2011) 256 Table 5.87: The energy use of OCRT sustainable tourism (2011) 258 Table 5.88: The energy use of OCRT- sustainable tourism (2011) 258 Table 5.89: OCRT overshoot energy use by categories (2011) 259 Table 5.90: The economic impact of the OCRT on the Central Otago/Otago economy 259 Table 5.91: Economic impact of OCRT- by categories 260 Table 5.92: Approximate fully annualized generation and conventional transmission cost for WWs power. 261
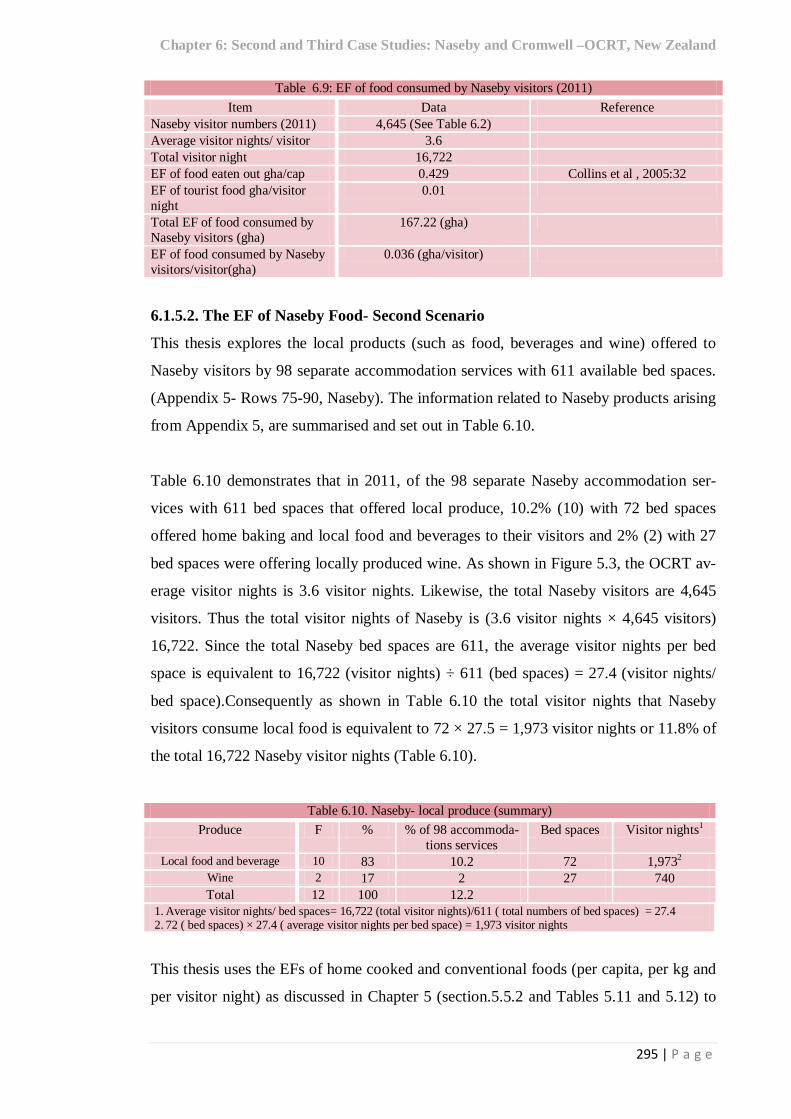
Table 5.93: New Zealand energy costs 261 Table 5.94: Average energy cost (wind-solar) 261 Table 5.95: OCRT- Sustainable Portion of total GDP (GDPs) 262 Table 5.96: OCRT- Local product (Food) – contribution to GDPs 265 Table 5.97: OCRT- Accommodation services- CF (2011) 270 Table 5.98: OCRT- visitor activities - EF and GDPs 276 Table 5.99: The CF of OCRT visitor activities - first and second scenarios 277 Table 5.100: The CF of OCRT visitor activities - first and third scenarios 279 Table 6.1: Naseby visitors - based on CODC survey (2011) 289 Table 6.2: Naseby international and domestic visitors (2011) 289 Table 6.3: Naseby - international visitors -2011 290 Table 6.4: Naseby - number of domestic visitors by home place 290 Table 6.5: Naseby - international Tourism-km 291 Table 6.6: OCRT- domestic T-km 292 Table 6.7: Types of transport used by OCRT domestic visitors 293 Table 6.8: EF of Naseby transportation (2011) 293 Table 6.9: EF of food consumed by Naseby visitors (2011) 295 Table 6.10: Naseby- local produce (summary) 295 Table 6.11: Ecological footprint of home cooked and conventional foods consumed by Naseby visitors (2011) 296
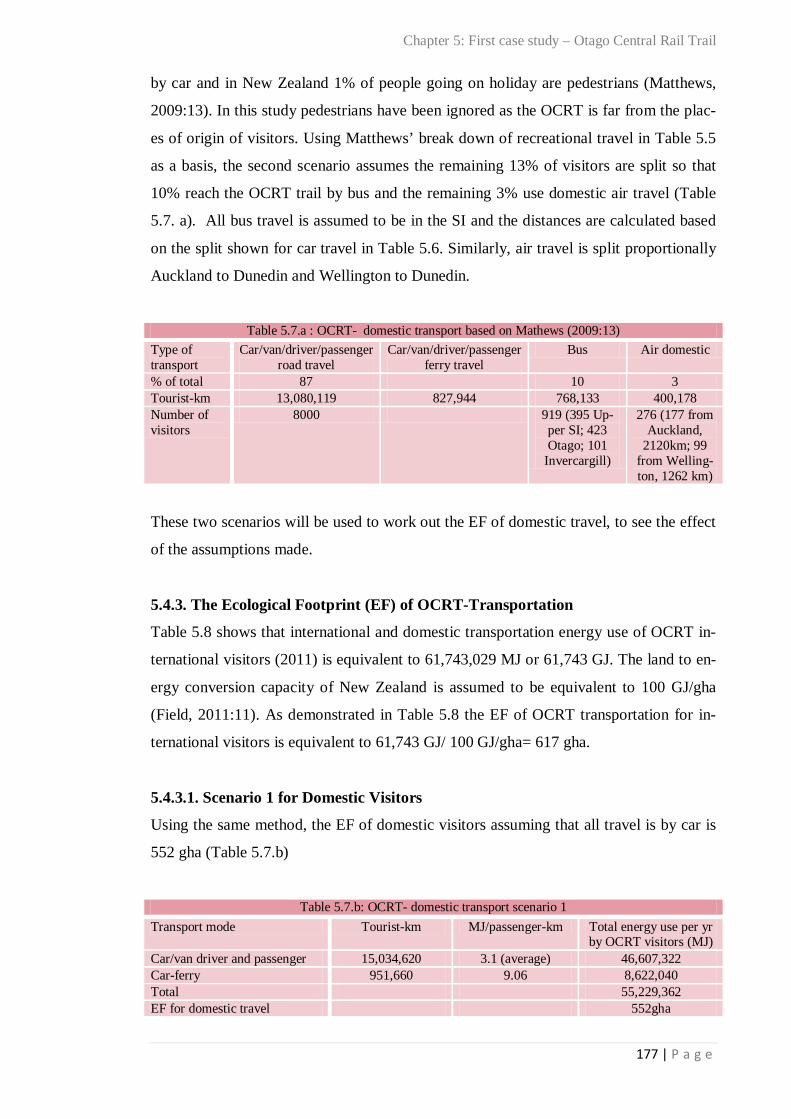
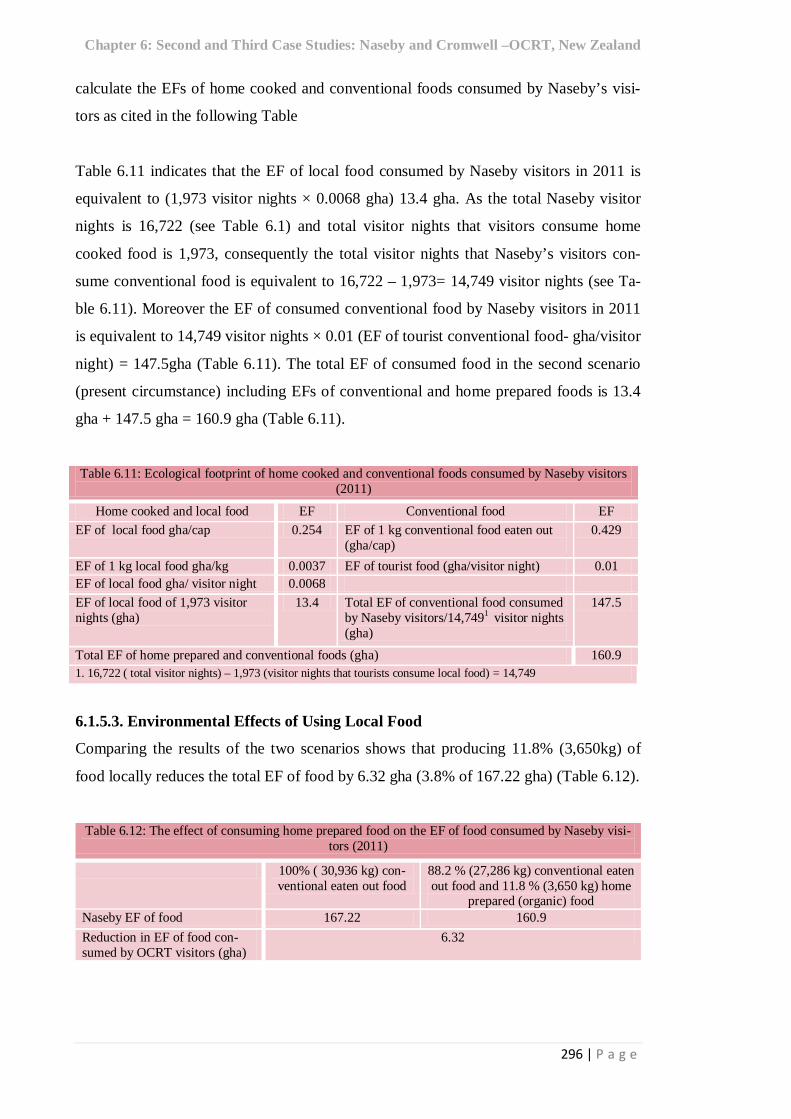
Table 6.12: The effect of consuming home prepared food on the EF of food consumed by Naseby visitors (2011) 296
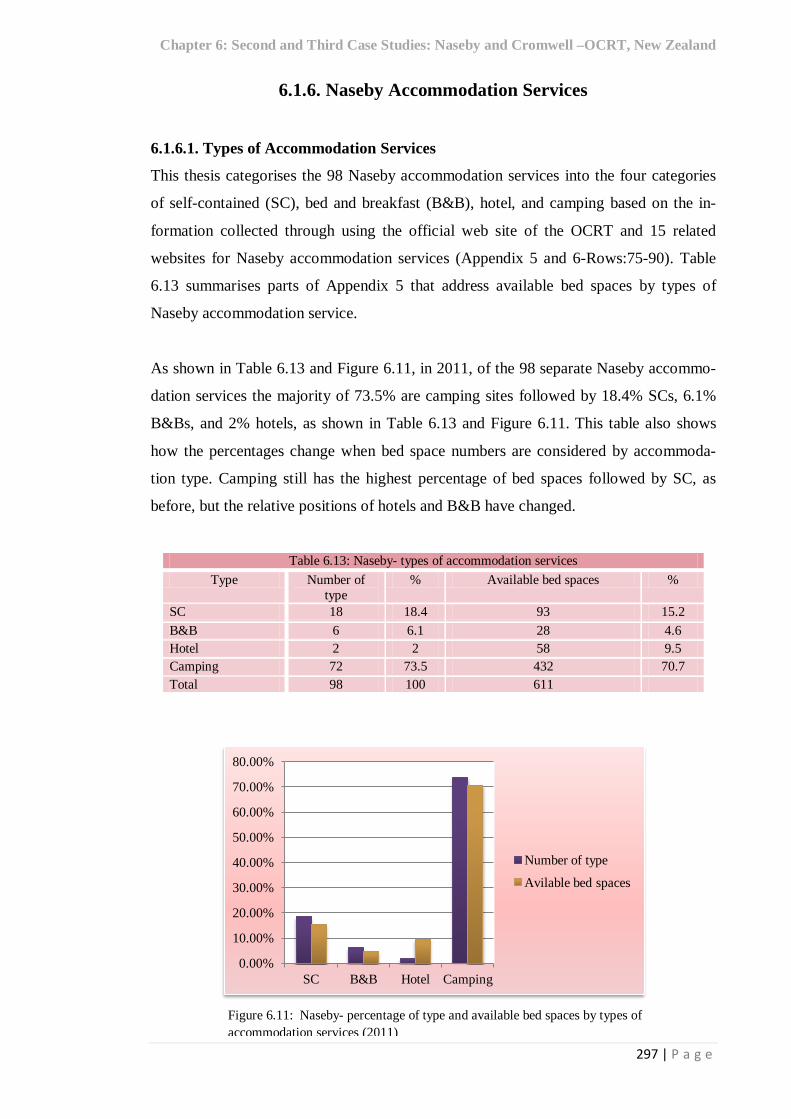
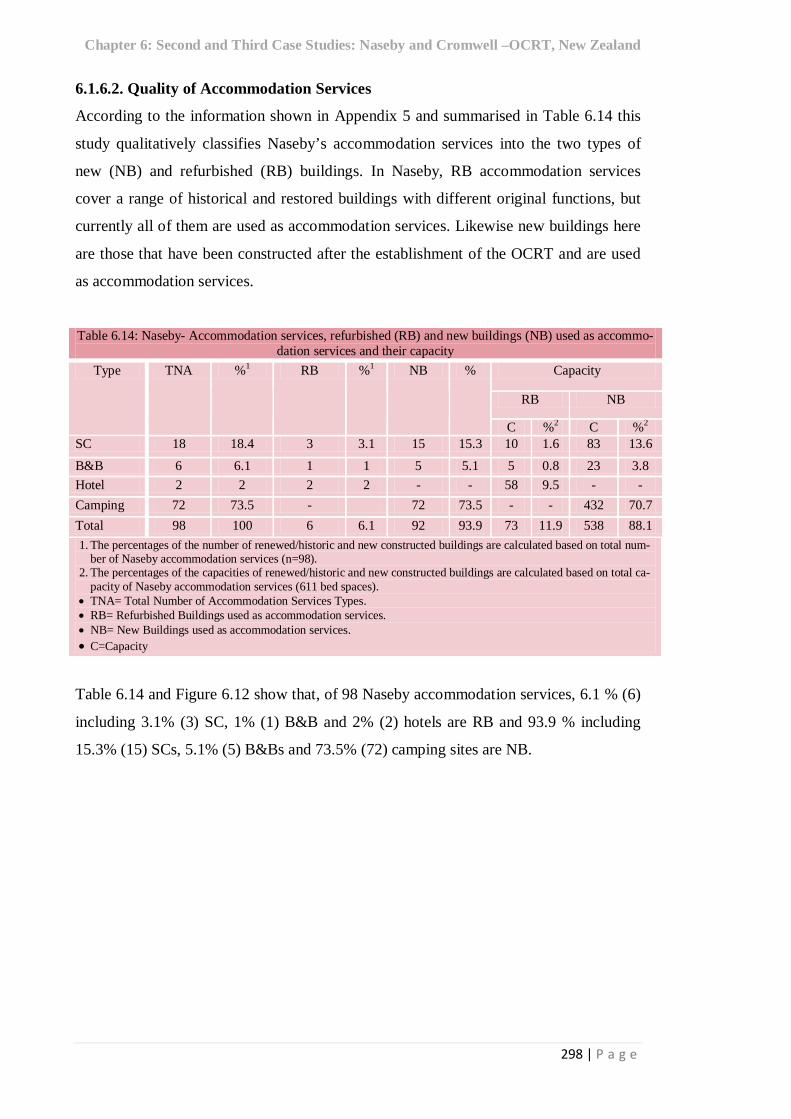
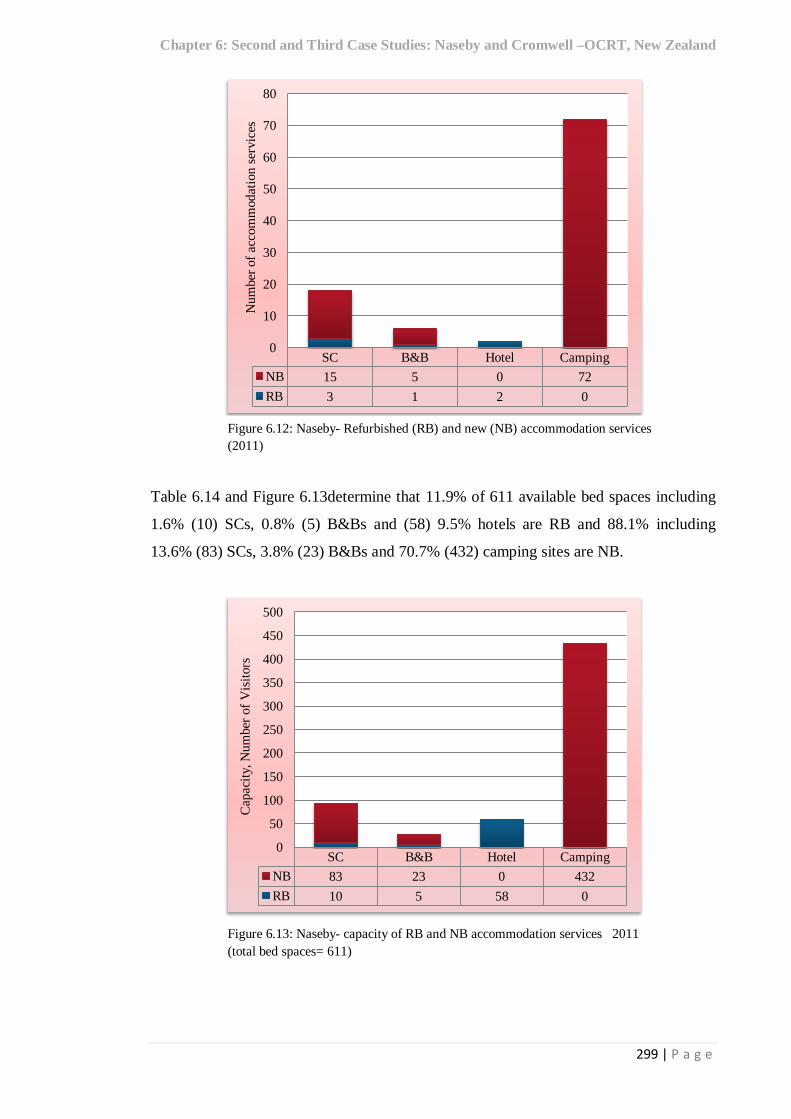
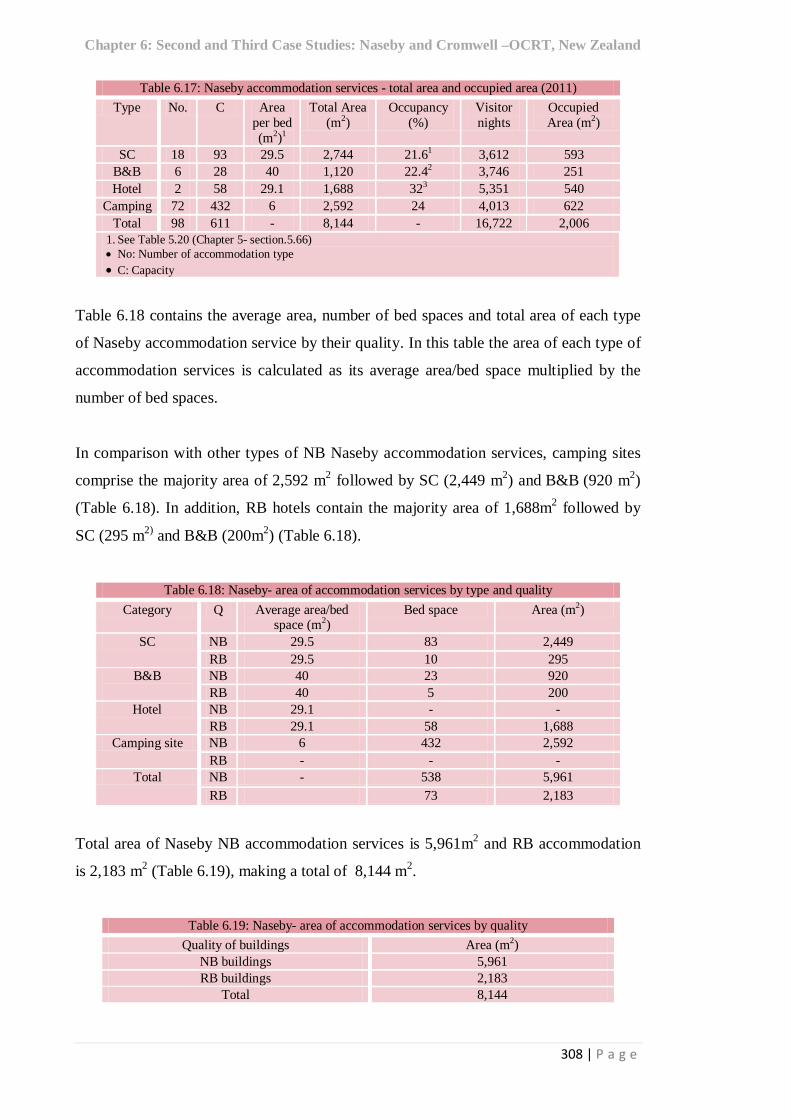
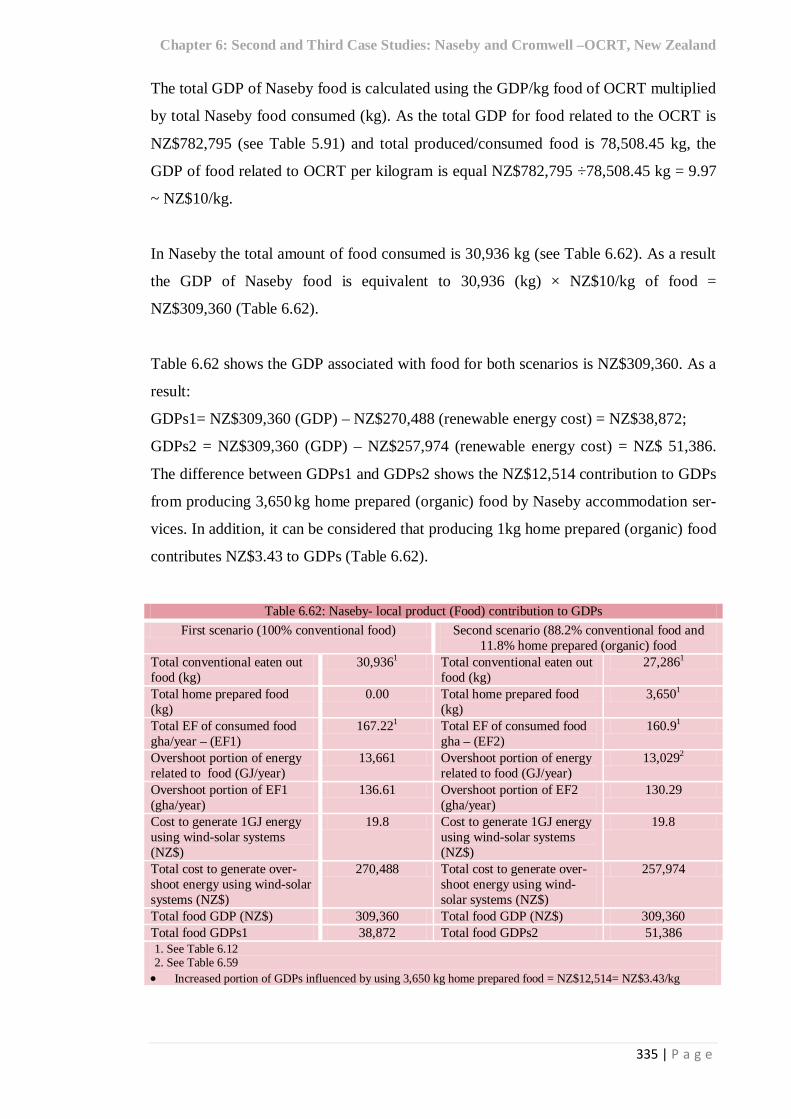
Table 6.13: Naseby- types of accommodation service 297 Table 6.14: Naseby- accommodation services, refurbished (RB) and new buildings (NB) used as accommodation services and their capacity 298
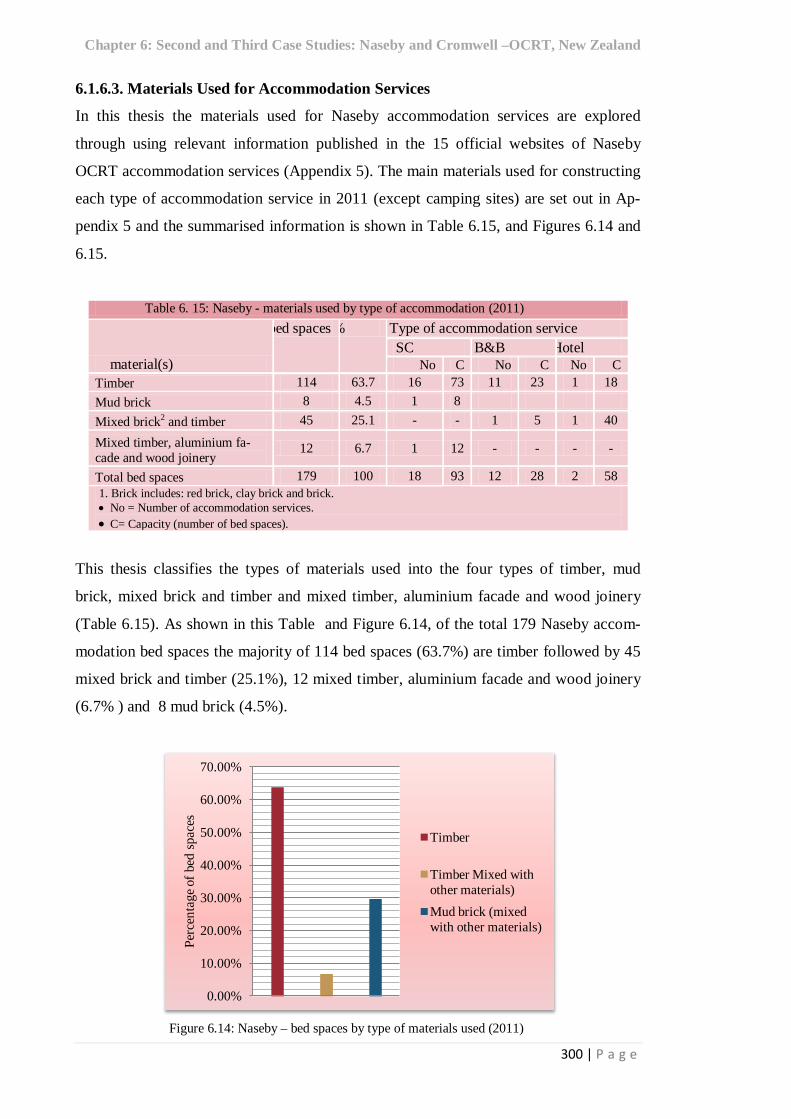
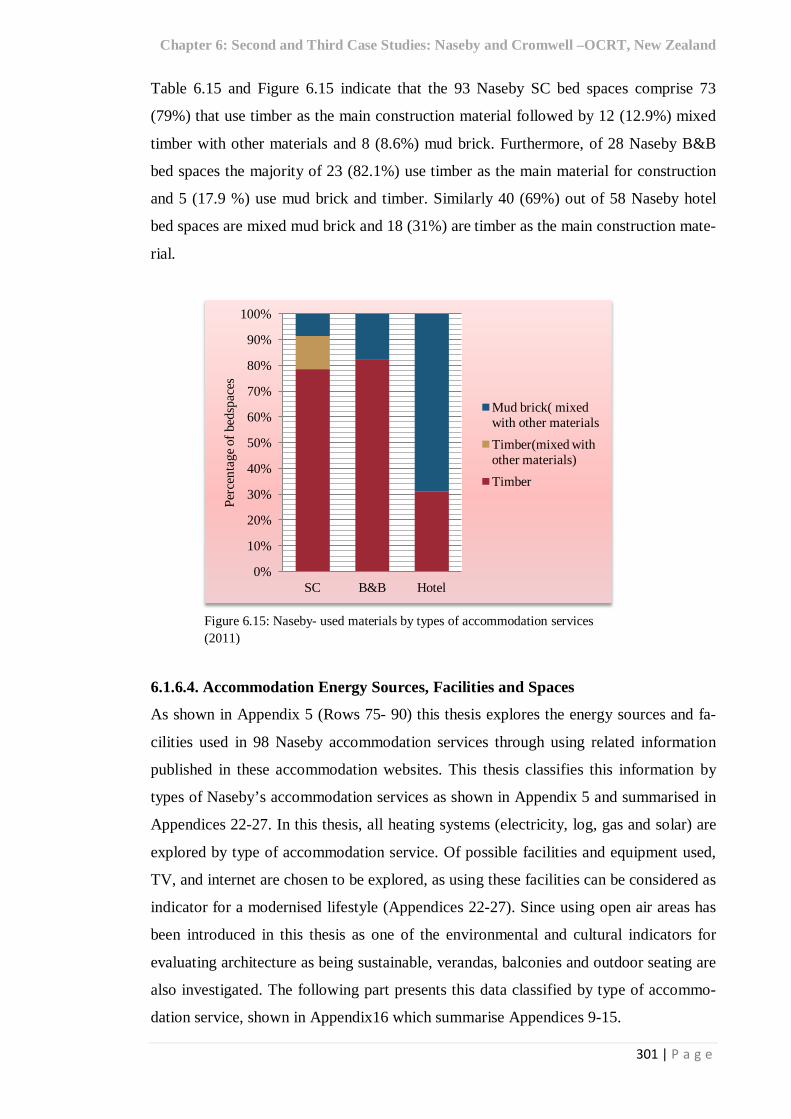
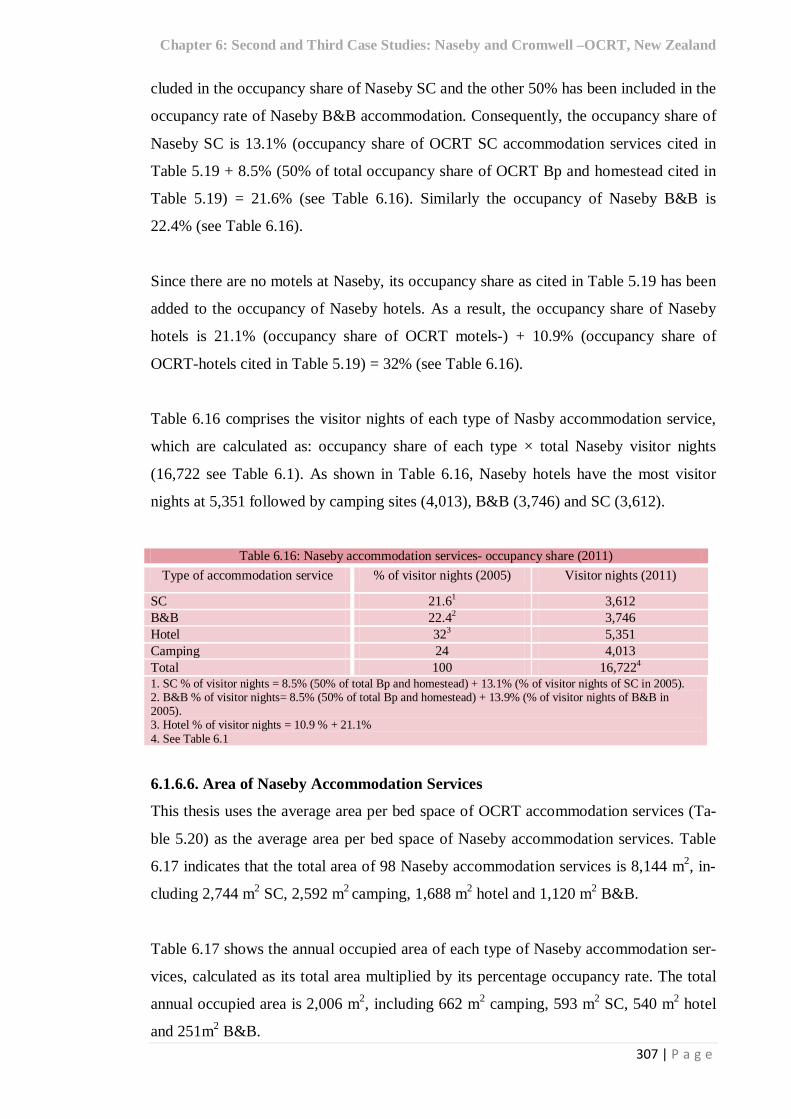
Table 6. 15: Naseby - materials used by type of accommodation (2011) 300 Table 6.16: Naseby accommodation services- occupancy share (2011) 307 Table 6.17: Naseby accommodation services - total area and occupied area (2011) 308 Table 6.18: Naseby- area of accommodation services by type and quality 308 Table 6.19: Naseby- area of accommodation services by quality 308 Table 6.20: Naseby- Life cycle energy use and the EF of self contained accommodation ser-vices (2011) 310
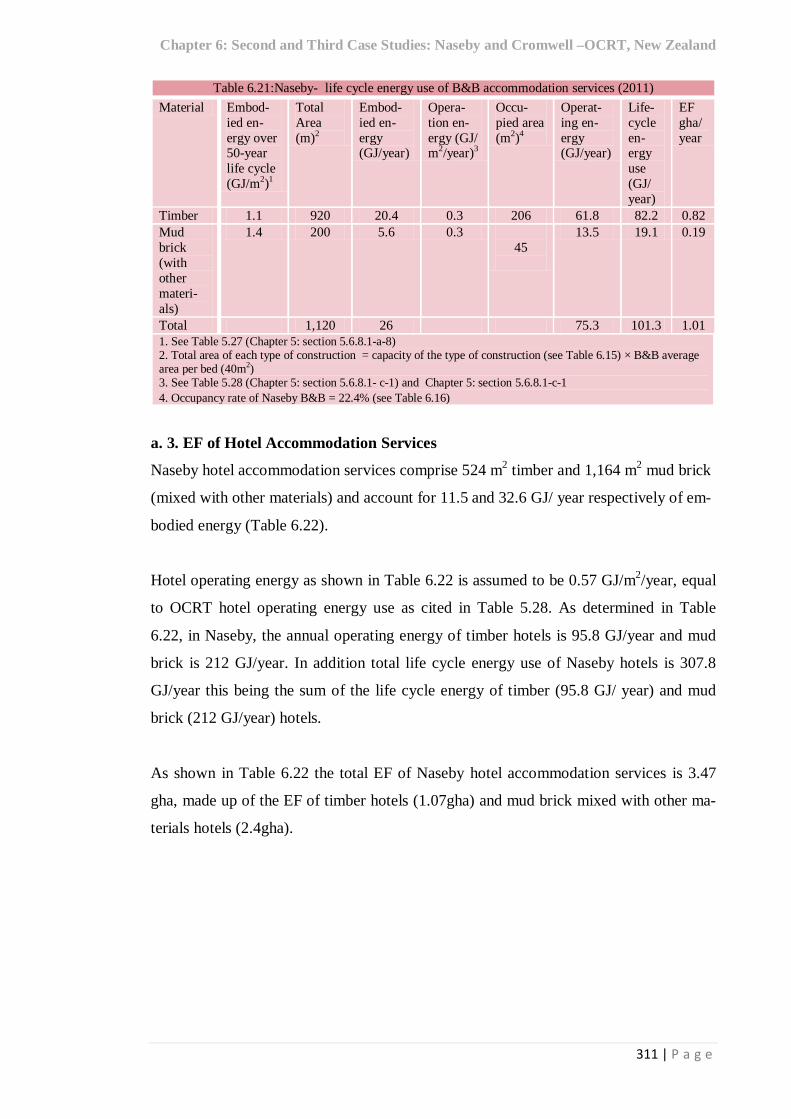
Table 6.21: Naseby- Life cycle energy use of B&B accommodation services (2011) 311 Table 6.22: Naseby - Life cycle energy use of Hotel accommodation services (2011) 312
x | P a g e
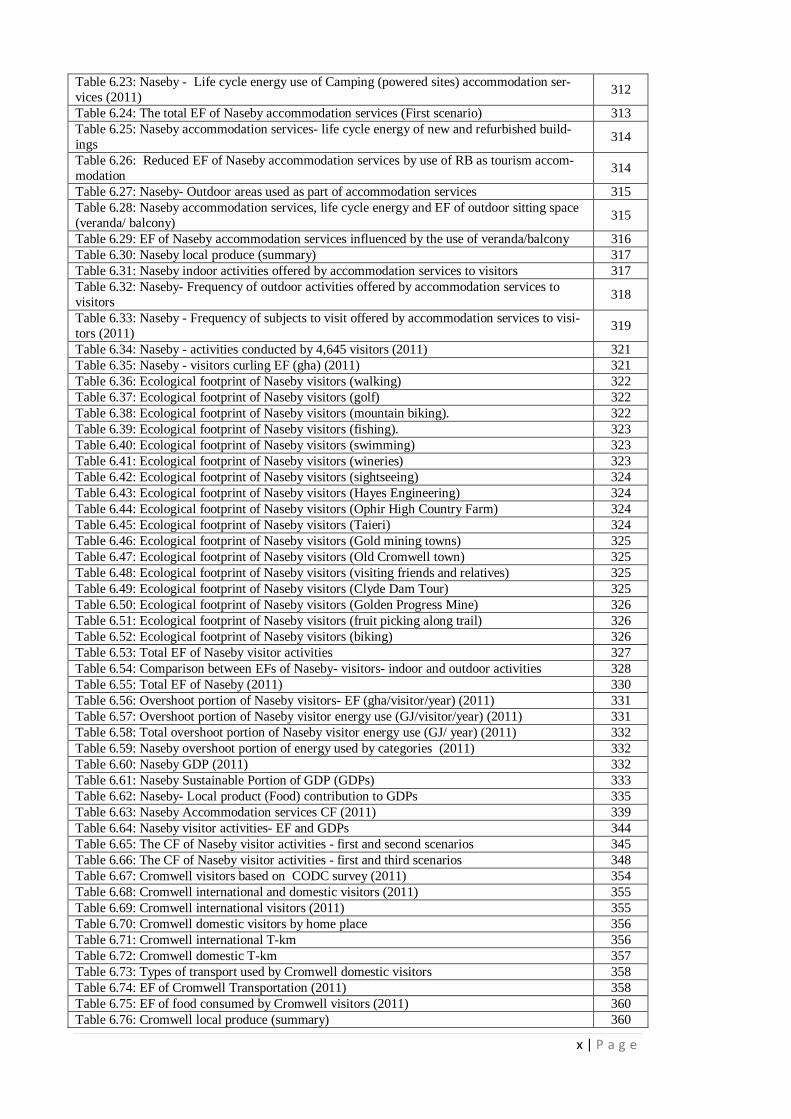
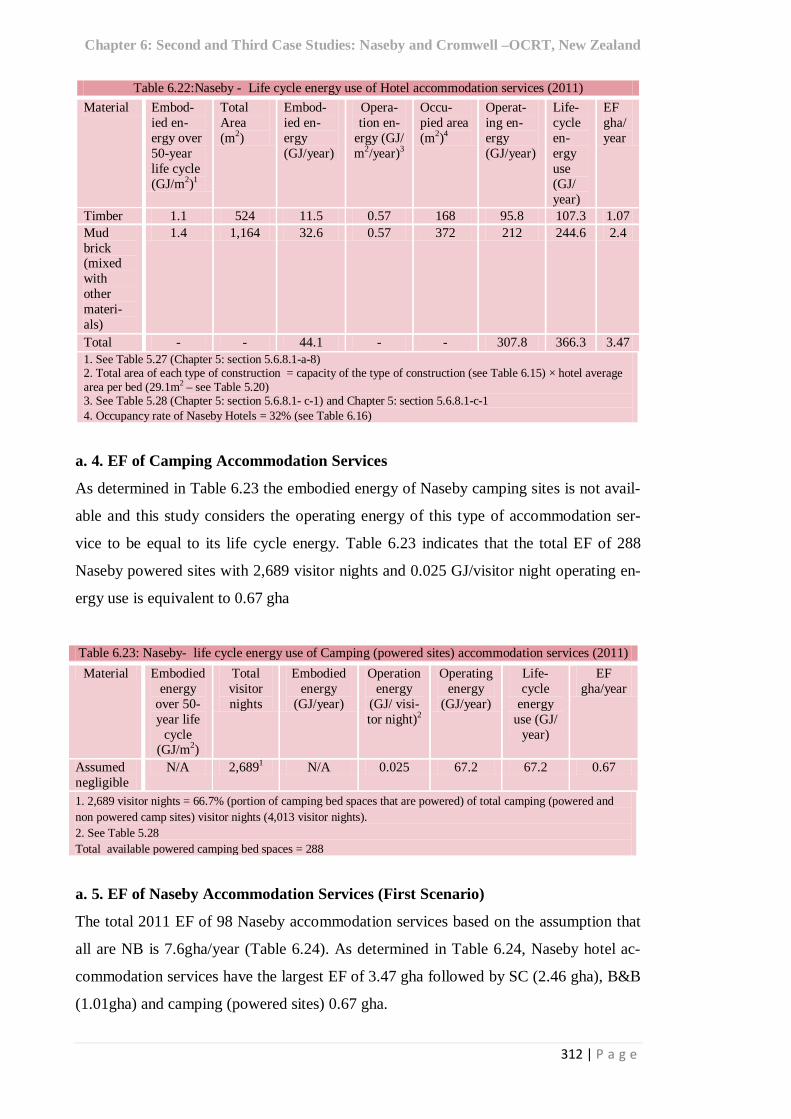
Table 6.23: Naseby - Life cycle energy use of Camping (powered sites) accommodation ser-vices (2011) 312
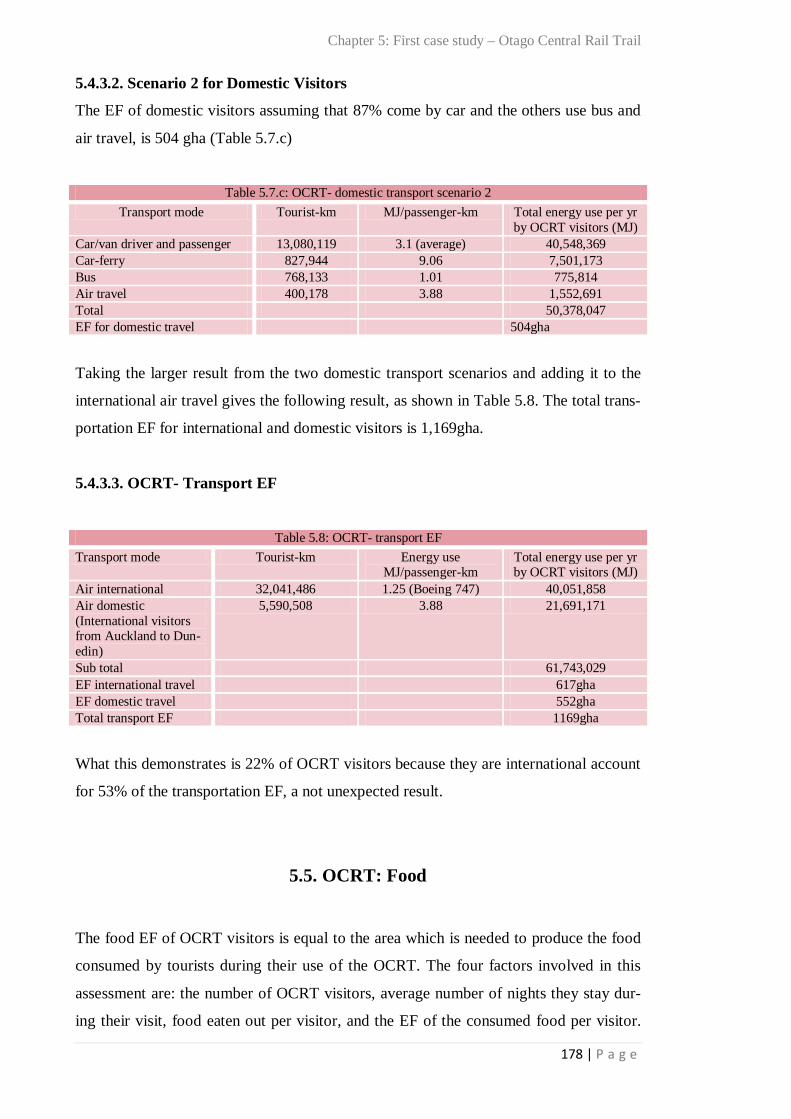
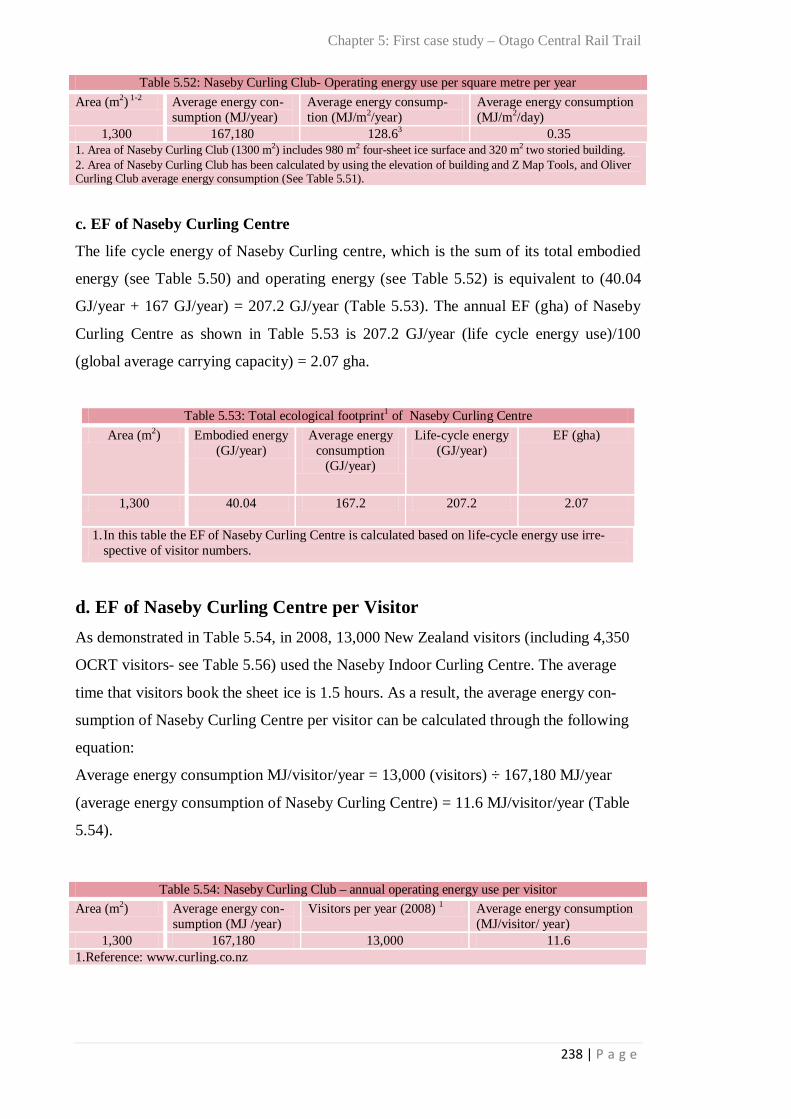
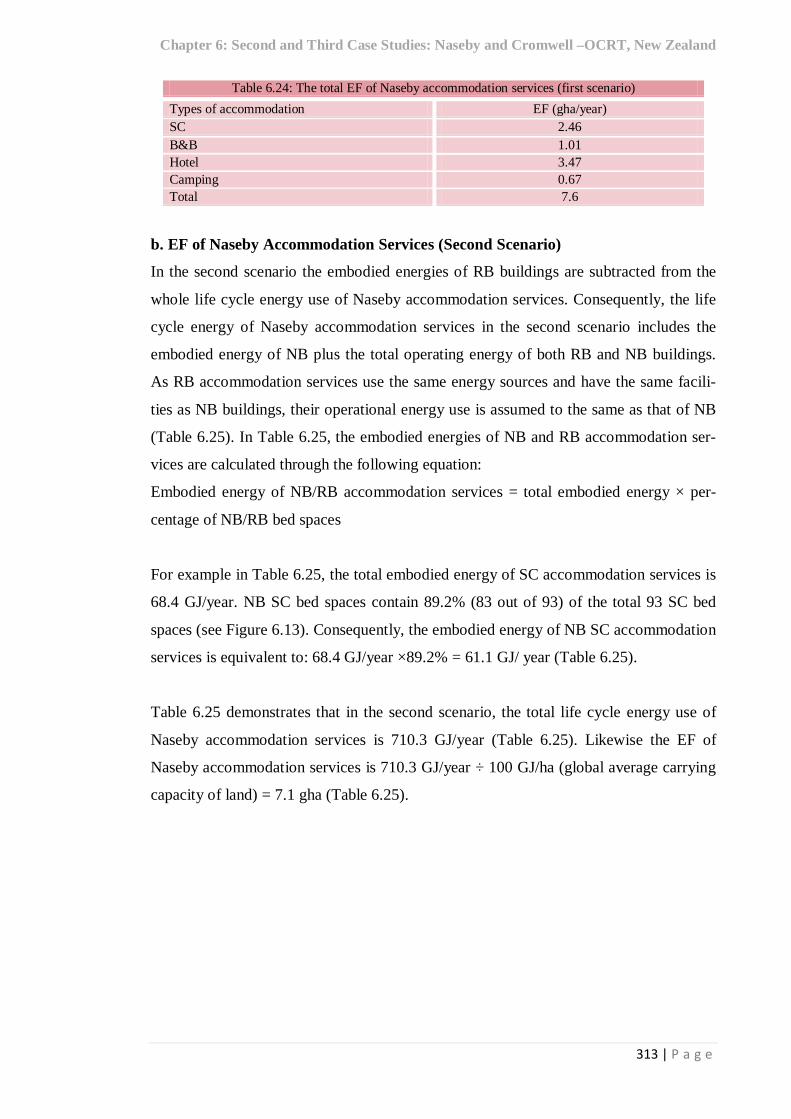
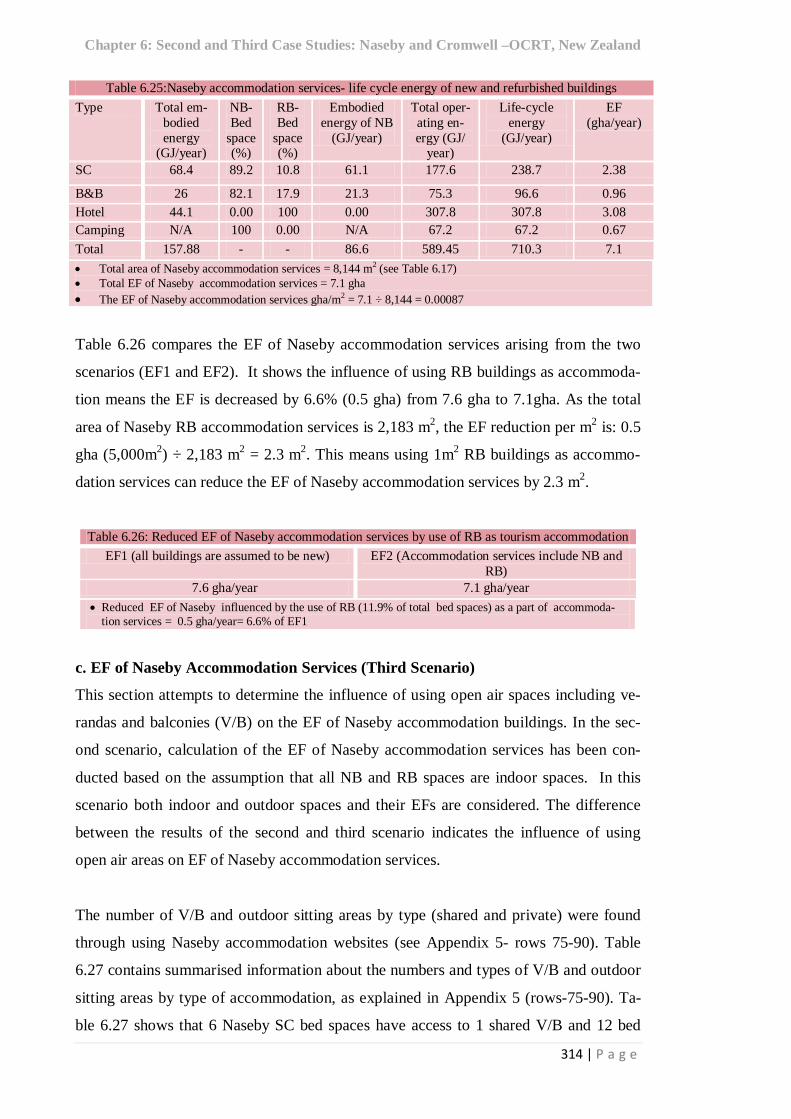
Table 6.24: The total EF of Naseby accommodation services (First scenario) 313 Table 6.25: Naseby accommodation services- life cycle energy of new and refurbished build-ings 314
Table 6.26: Reduced EF of Naseby accommodation services by use of RB as tourism accom-modation 314
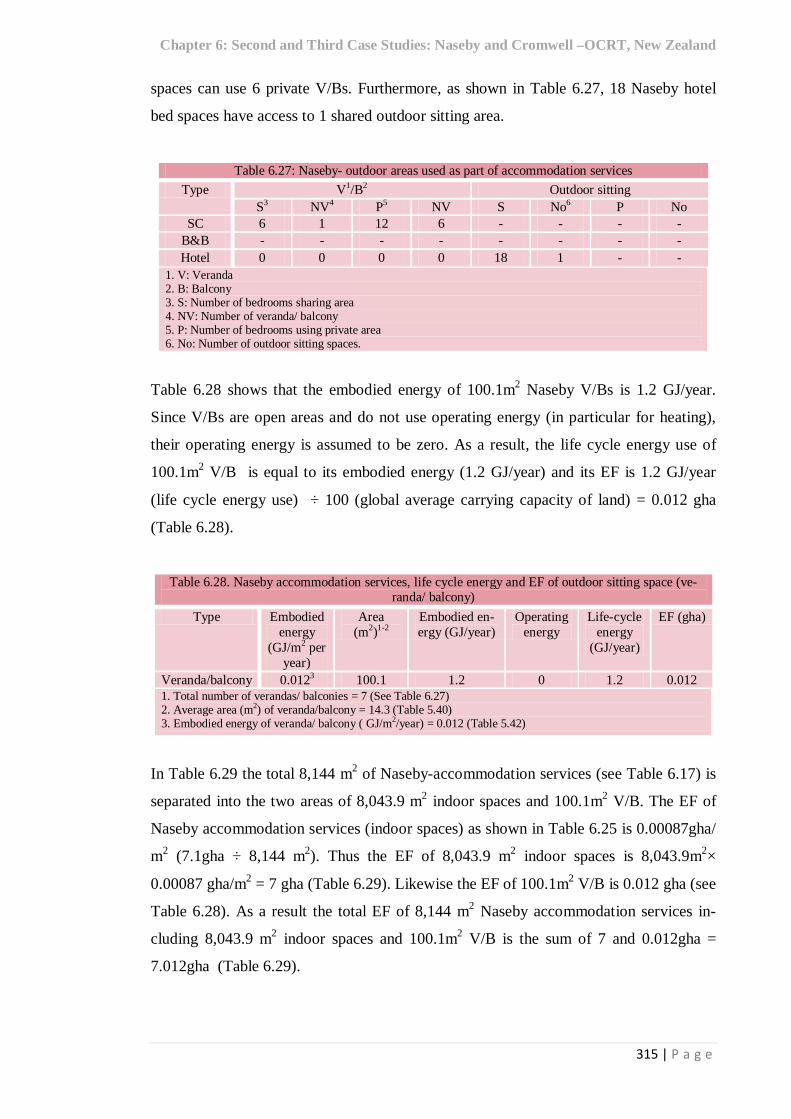
Table 6.27: Naseby- Outdoor areas used as part of accommodation services 315 Table 6.28: Naseby accommodation services, life cycle energy and EF of outdoor sitting space (veranda/ balcony) 315
Table 6.29: EF of Naseby accommodation services influenced by the use of veranda/balcony 316 Table 6.30: Naseby local produce (summary) 317 Table 6.31: Naseby indoor activities offered by accommodation services to visitors 317 Table 6.32: Naseby- Frequency of outdoor activities offered by accommodation services to visitors 318
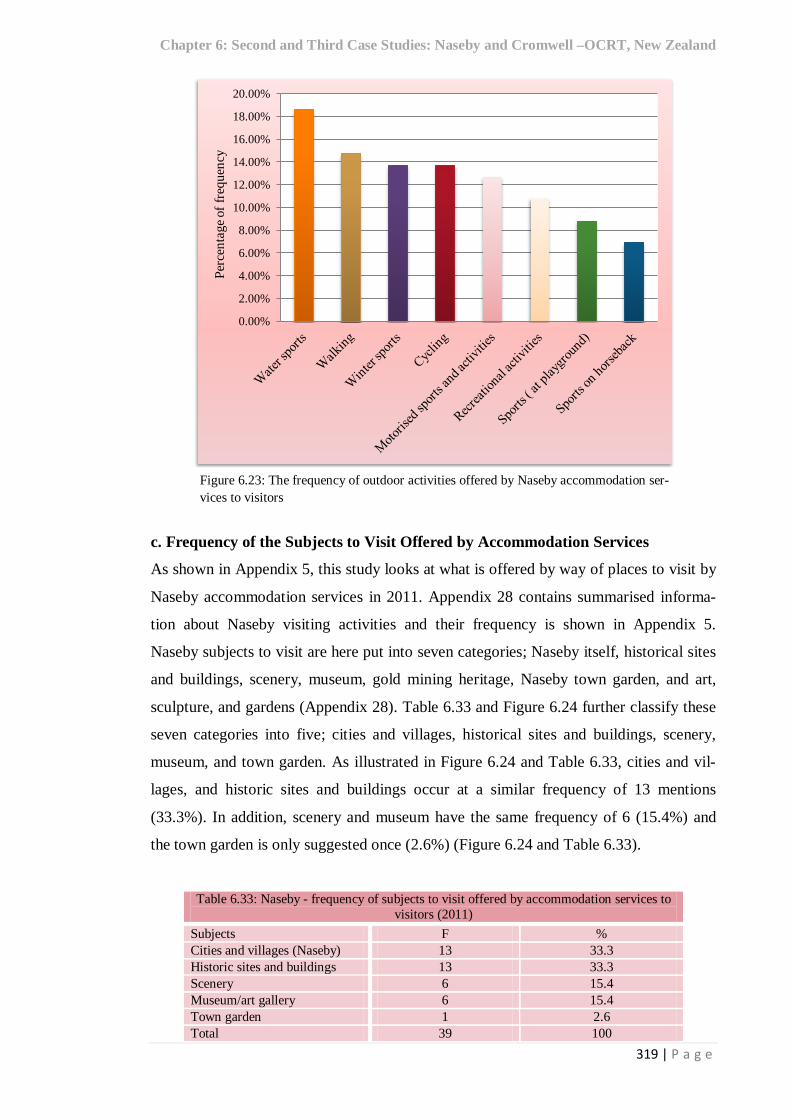
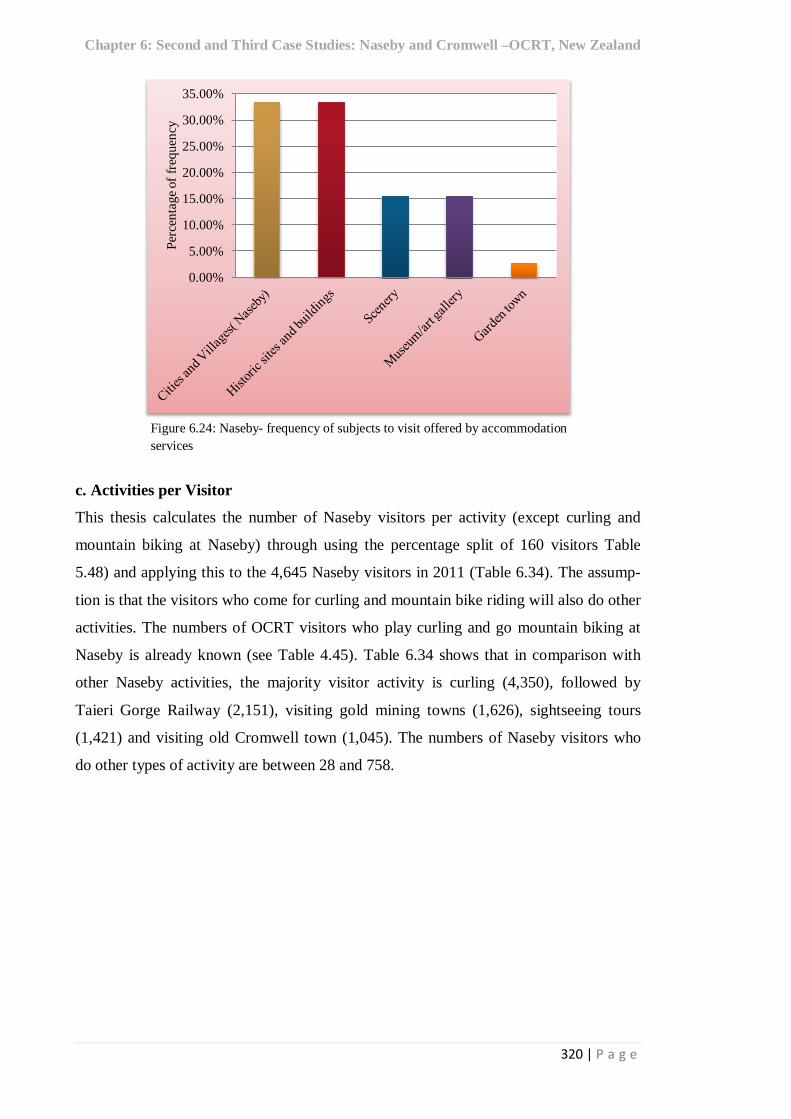
Table 6.33: Naseby - Frequency of subjects to visit offered by accommodation services to visi-tors (2011) 319
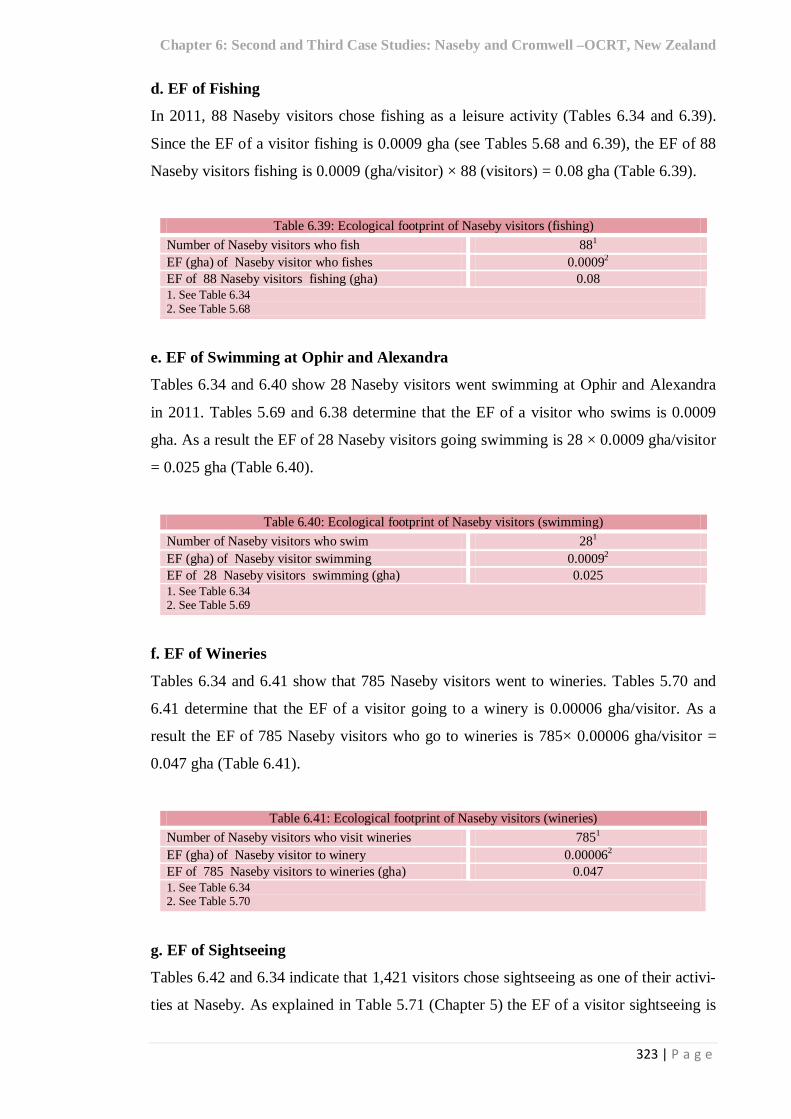
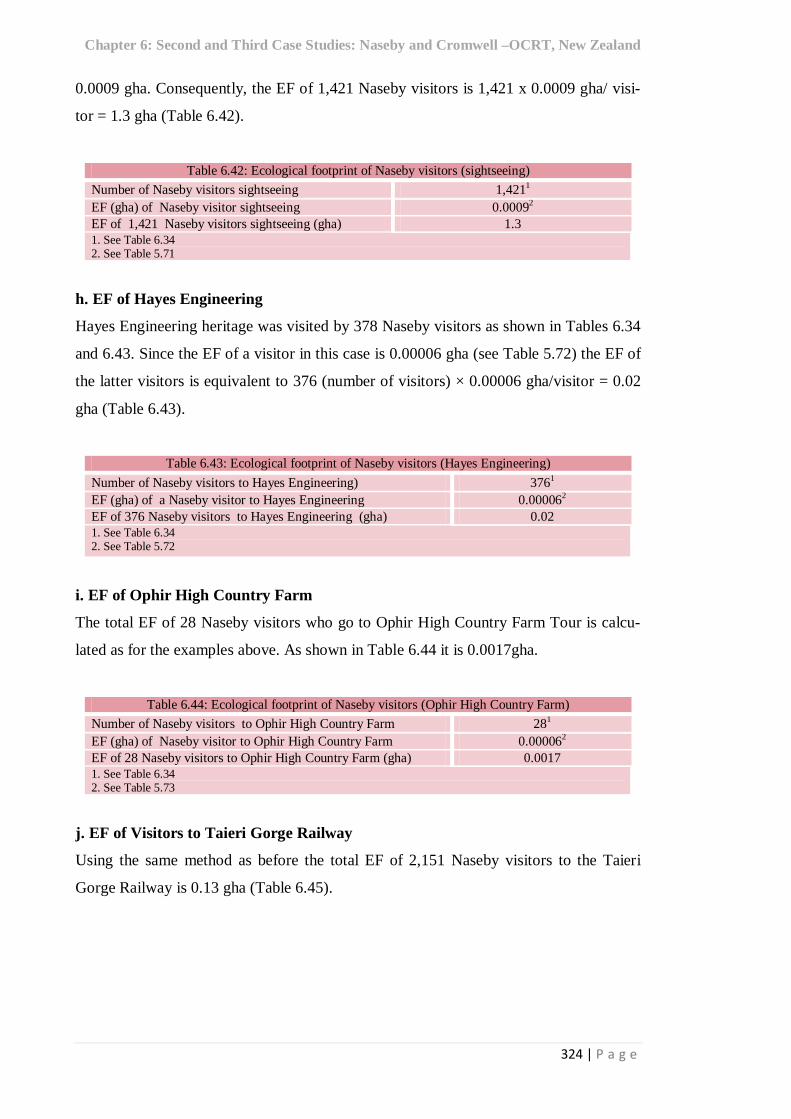
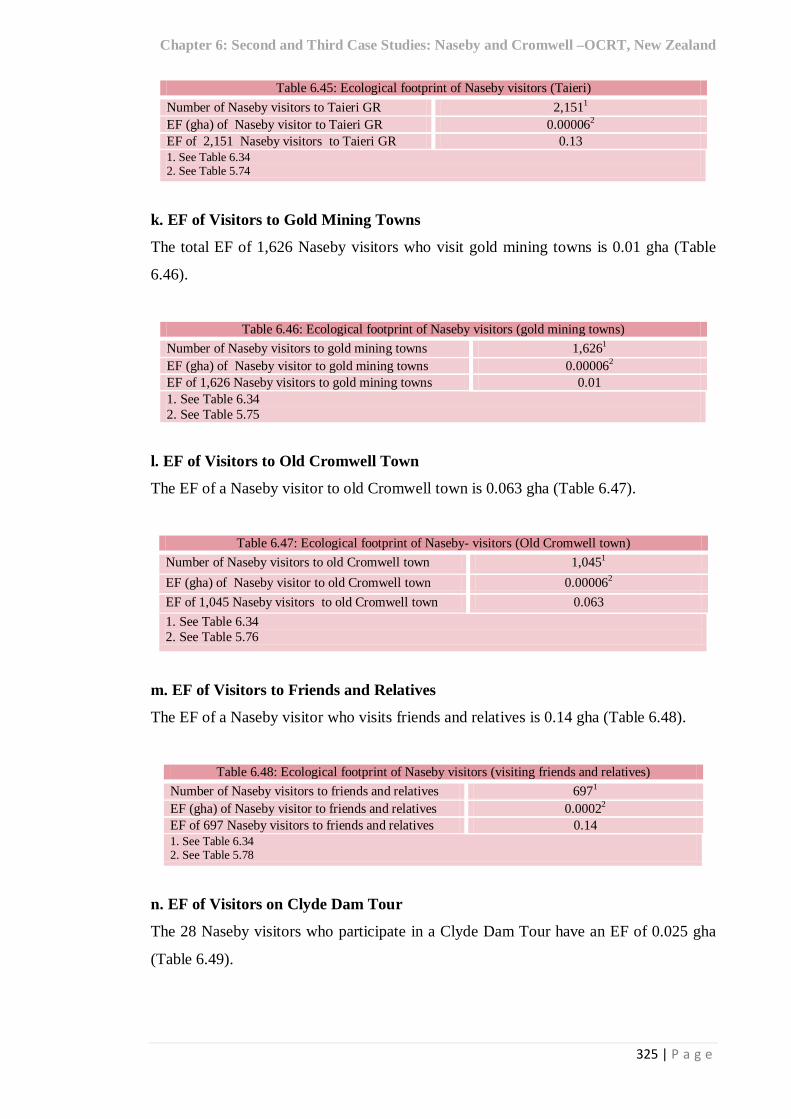
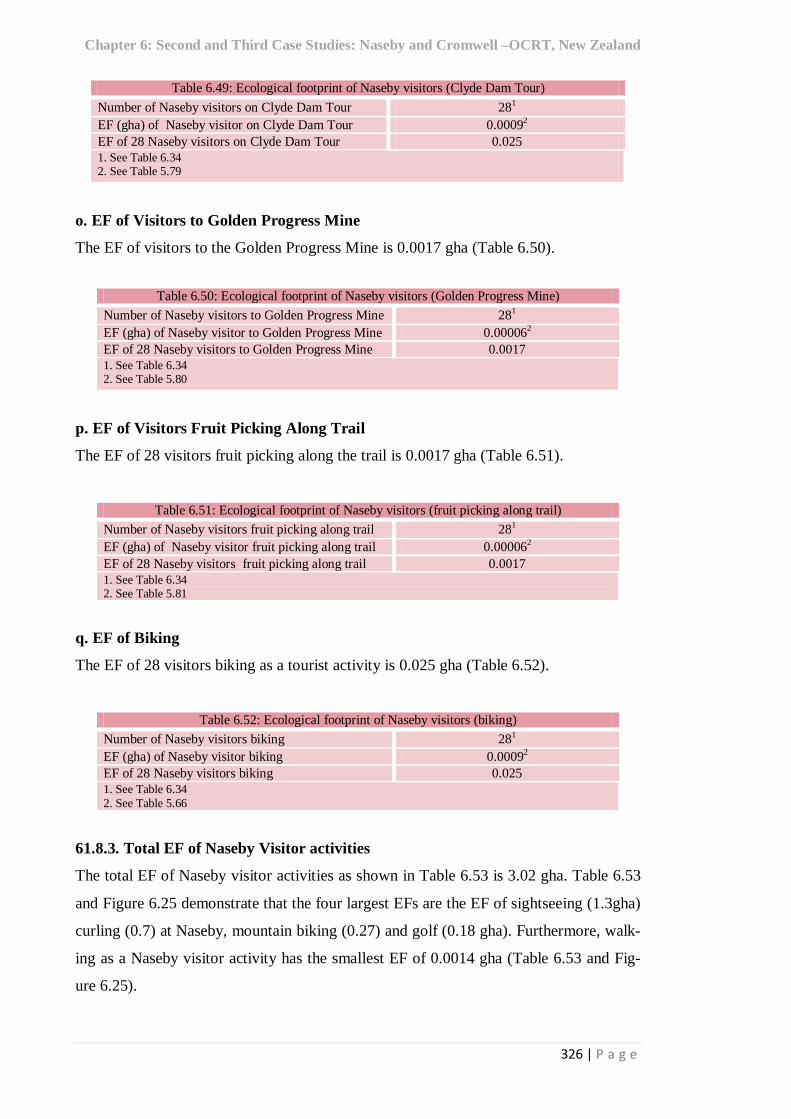
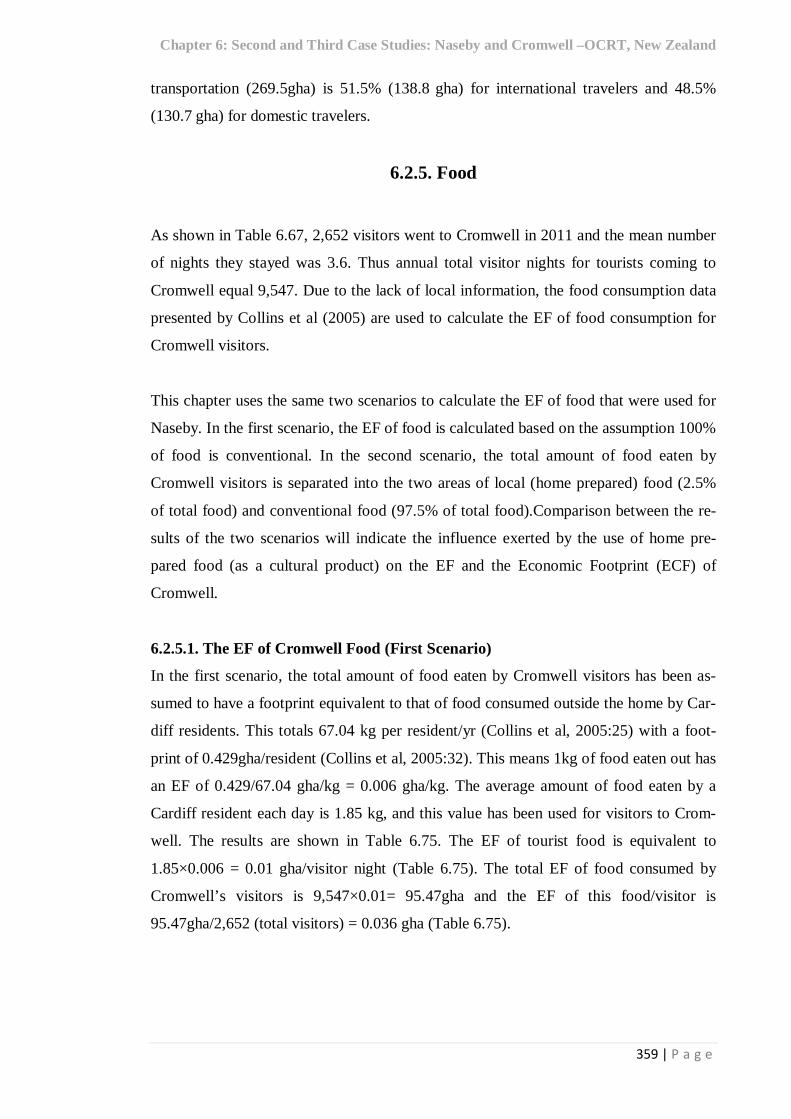
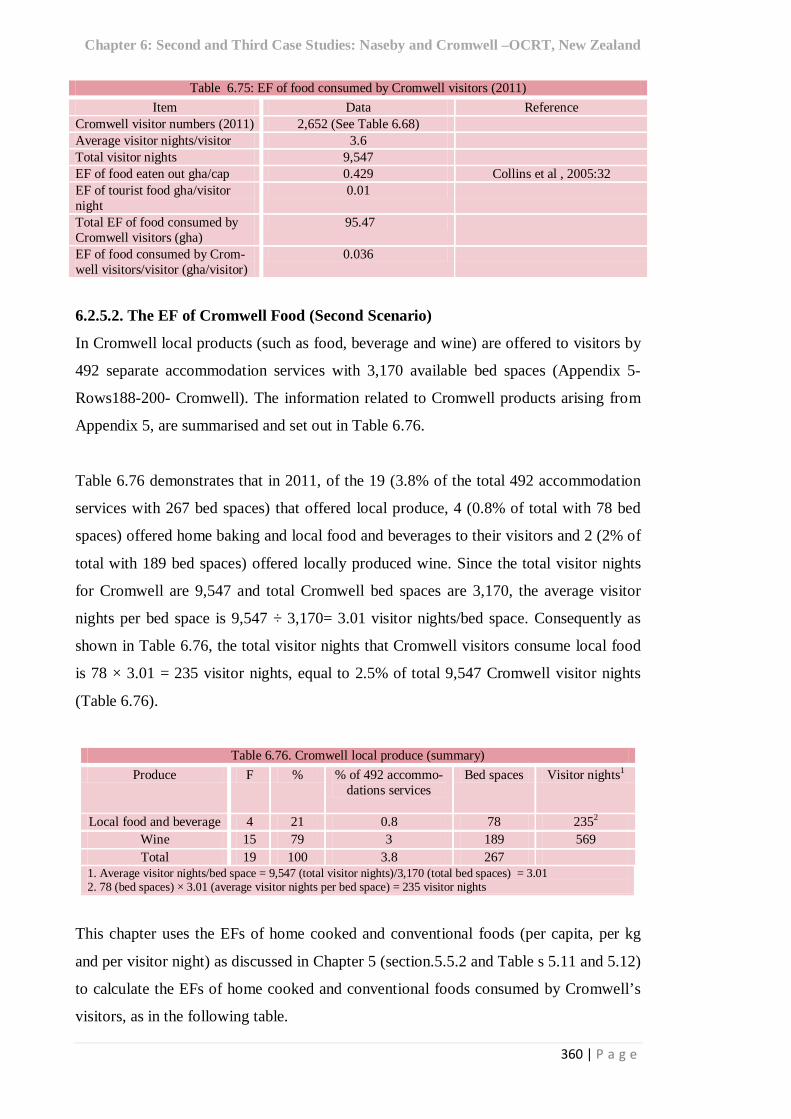
Table 6.34: Naseby - activities conducted by 4,645 visitors (2011) 321 Table 6.35: Naseby - visitors curling EF (gha) (2011) 321 Table 6.36: Ecological footprint of Naseby visitors (walking) 322 Table 6.37: Ecological footprint of Naseby visitors (golf) 322 Table 6.38: Ecological footprint of Naseby visitors (mountain biking). 322 Table 6.39: Ecological footprint of Naseby visitors (fishing). 323 Table 6.40: Ecological footprint of Naseby visitors (swimming) 323 Table 6.41: Ecological footprint of Naseby visitors (wineries) 323 Table 6.42: Ecological footprint of Naseby visitors (sightseeing) 324 Table 6.43: Ecological footprint of Naseby visitors (Hayes Engineering) 324 Table 6.44: Ecological footprint of Naseby visitors (Ophir High Country Farm) 324 Table 6.45: Ecological footprint of Naseby visitors (Taieri) 324 Table 6.46: Ecological footprint of Naseby visitors (Gold mining towns) 325 Table 6.47: Ecological footprint of Naseby visitors (Old Cromwell town) 325 Table 6.48: Ecological footprint of Naseby visitors (visiting friends and relatives) 325 Table 6.49: Ecological footprint of Naseby visitors (Clyde Dam Tour) 325 Table 6.50: Ecological footprint of Naseby visitors (Golden Progress Mine) 326 Table 6.51: Ecological footprint of Naseby visitors (fruit picking along trail) 326 Table 6.52: Ecological footprint of Naseby visitors (biking) 326 Table 6.53: Total EF of Naseby visitor activities 327 Table 6.54: Comparison between EFs of Naseby- visitors- indoor and outdoor activities 328 Table 6.55: Total EF of Naseby (2011) 330 Table 6.56: Overshoot portion of Naseby visitors- EF (gha/visitor/year) (2011) 331 Table 6.57: Overshoot portion of Naseby visitor energy use (GJ/visitor/year) (2011) 331 Table 6.58: Total overshoot portion of Naseby visitor energy use (GJ/ year) (2011) 332 Table 6.59: Naseby overshoot portion of energy used by categories (2011) 332 Table 6.60: Naseby GDP (2011) 332 Table 6.61: Naseby Sustainable Portion of GDP (GDPs) 333 Table 6.62: Naseby- Local product (Food) contribution to GDPs 335 Table 6.63: Naseby Accommodation services CF (2011) 339 Table 6.64: Naseby visitor activities- EF and GDPs 344 Table 6.65: The CF of Naseby visitor activities - first and second scenarios 345 Table 6.66: The CF of Naseby visitor activities - first and third scenarios 348 Table 6.67: Cromwell visitors based on CODC survey (2011) 354 Table 6.68: Cromwell international and domestic visitors (2011) 355 Table 6.69: Cromwell international visitors (2011) 355 Table 6.70: Cromwell domestic visitors by home place 356 Table 6.71: Cromwell international T-km 356 Table 6.72: Cromwell domestic T-km 357 Table 6.73: Types of transport used by Cromwell domestic visitors 358 Table 6.74: EF of Cromwell Transportation (2011) 358 Table 6.75: EF of food consumed by Cromwell visitors (2011) 360 Table 6.76: Cromwell local produce (summary) 360
xi | P a g e
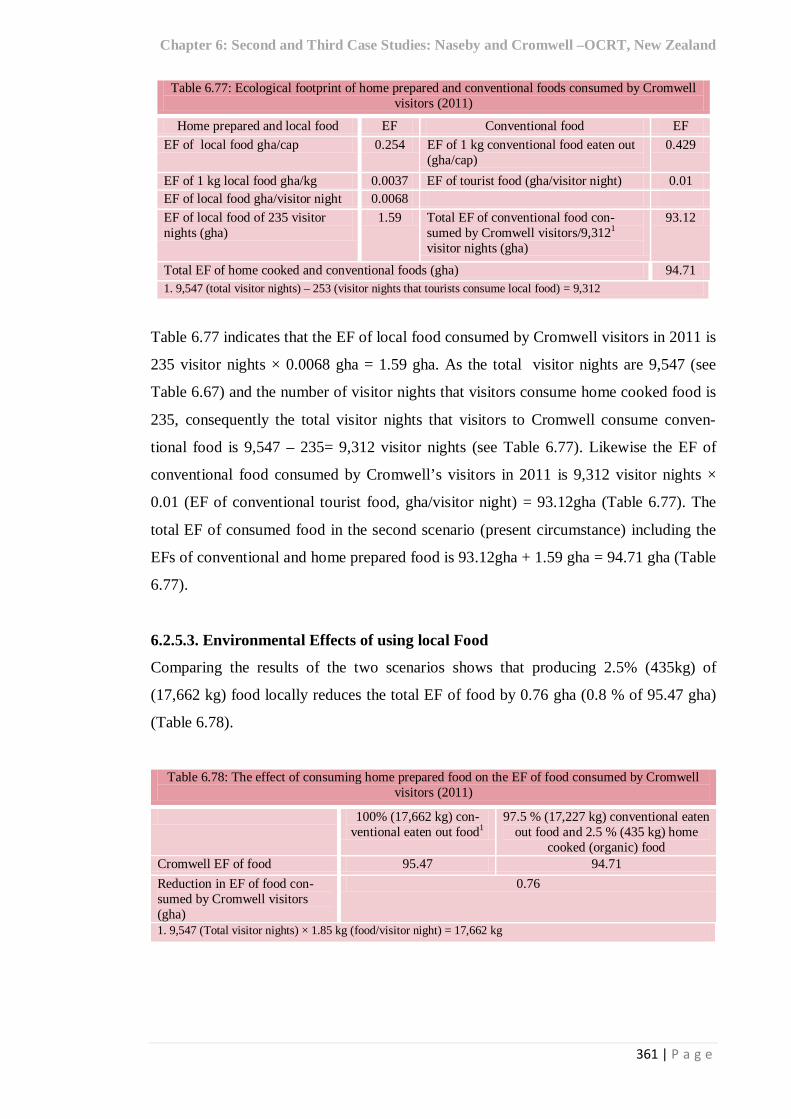
Table 6.77: Ecological footprint of home prepared and conventional foods consumed by Cromwell visitors (2011) 361
Table 6.78: The effect of consuming home prepared food on the EF of food consumed by Cromwell visitors (2011) 361
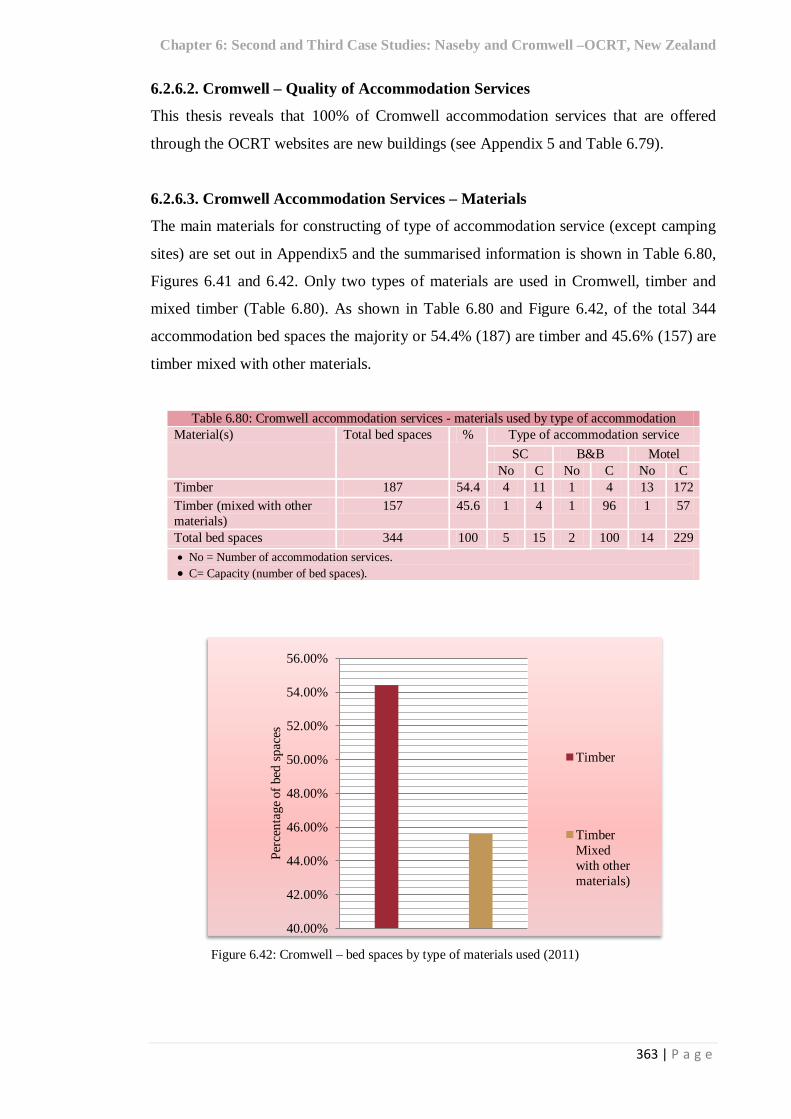
Table 6.79: Cromwell accommodation services (2011) 362 Table 6.80: Cromwell accommodation services - materials used by type of accommodation 363 Table 6.81: All Cromwell accommodation services by type - energy sources and facilities 368 Table 6.82: Cromwell accommodation services - occupancy shares (2011) 369 Table 6.83: Cromwell Accommodation services - Total area and Occupied area (2011) 370 Table 6.84: Cromwell - Life cycle energy of SC accommodation services (2011) 371 Table 6.85:Cromwell - Life cycle energy of B&B accommodation services (2011) 372 Table 6.86: Cromwell - Life cycle energy use of Motel accommodation services (2011) 373 Table 6.87: Cromwell camping sites – available bed spaces and visitor nights 373 Table 6.88: Cromwell - Life cycle energy use of camping (powered sites) accommodation ser-vices (2011) 373
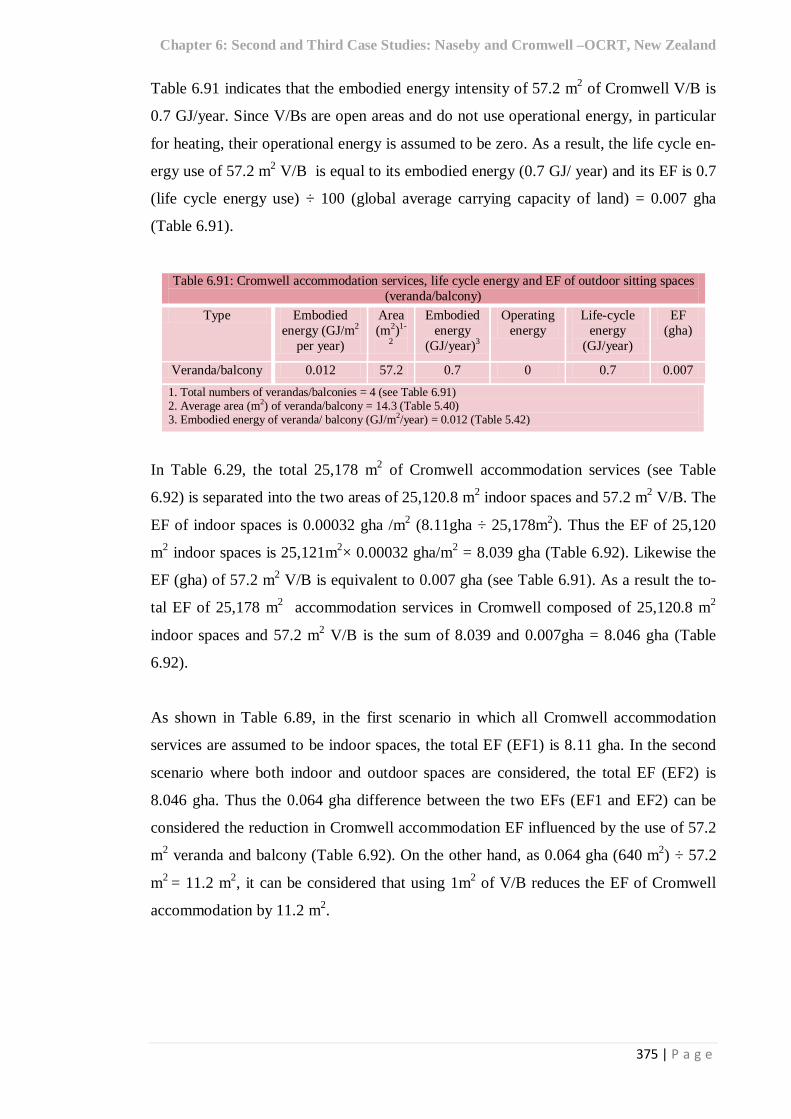
Table 6.89: Cromwell - EF of accommodation services (2011) 374 Table 6.90: Cromwell - Outdoor sitting space used as part of accommodation services 374 Table 6.91: Cromwell accommodation services, life cycle energy and EF of outdoor sitting spaces (veranda/balcony) 375
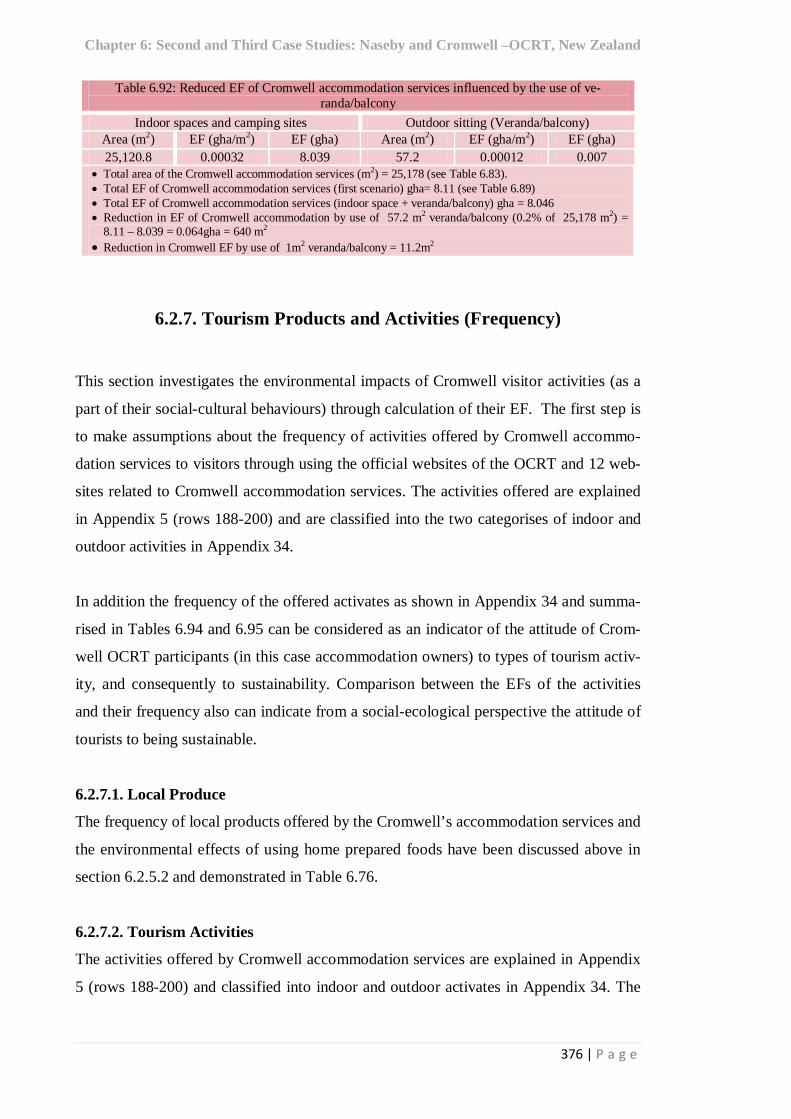
Table 6.92: Reduced EF of Cromwell accommodation services influenced by the use of ve-randa/balcony 376
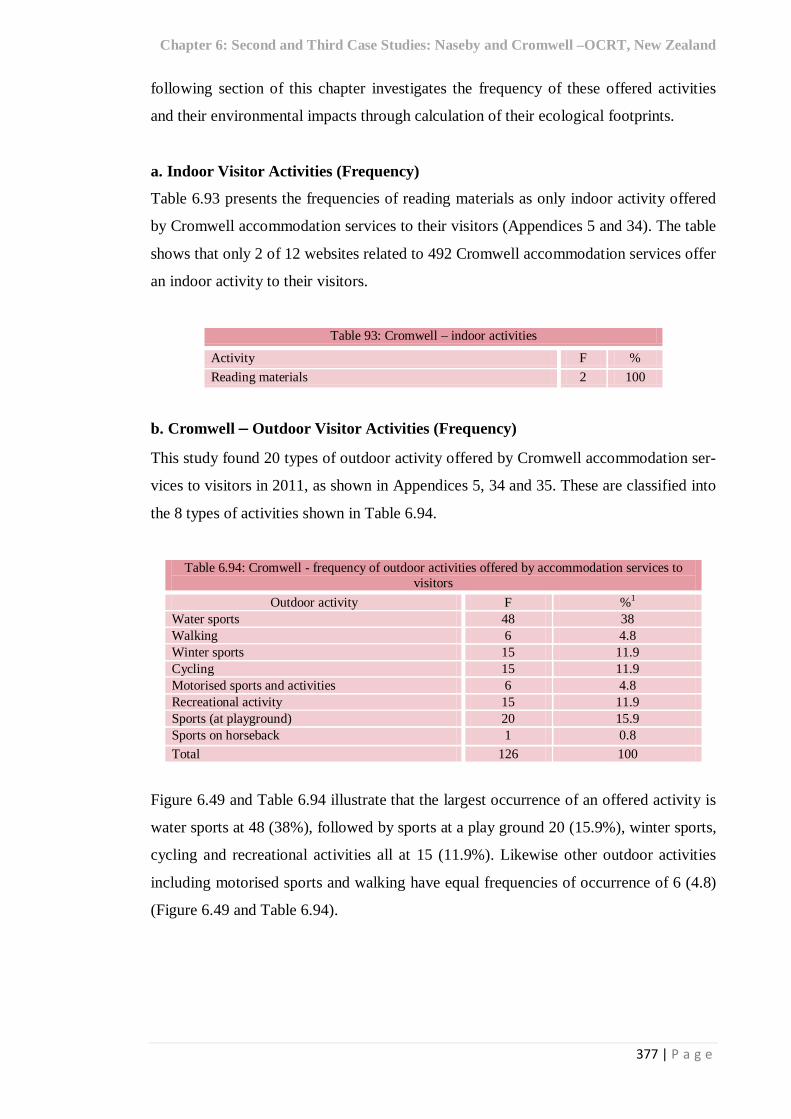
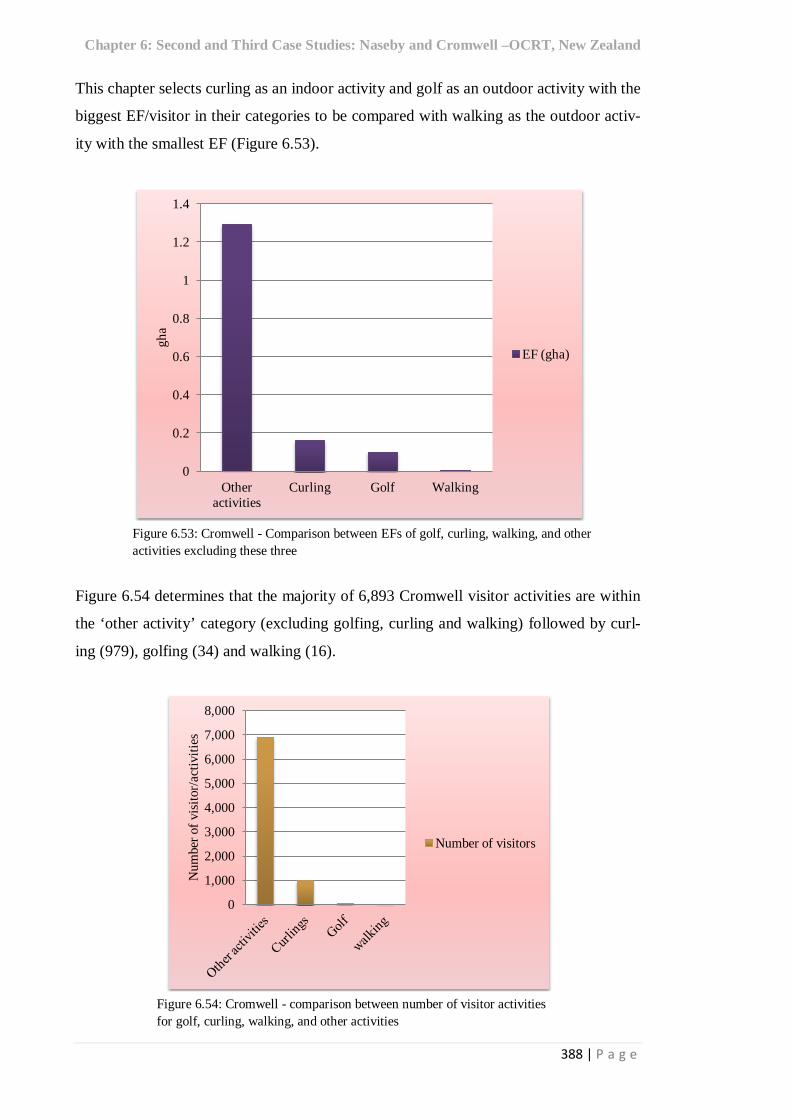
Table 6.93: Cromwell – Indoor activities 377 Table 6.94: Cromwell - Frequency of outdoor activities offered by accommodation services to visitors 377
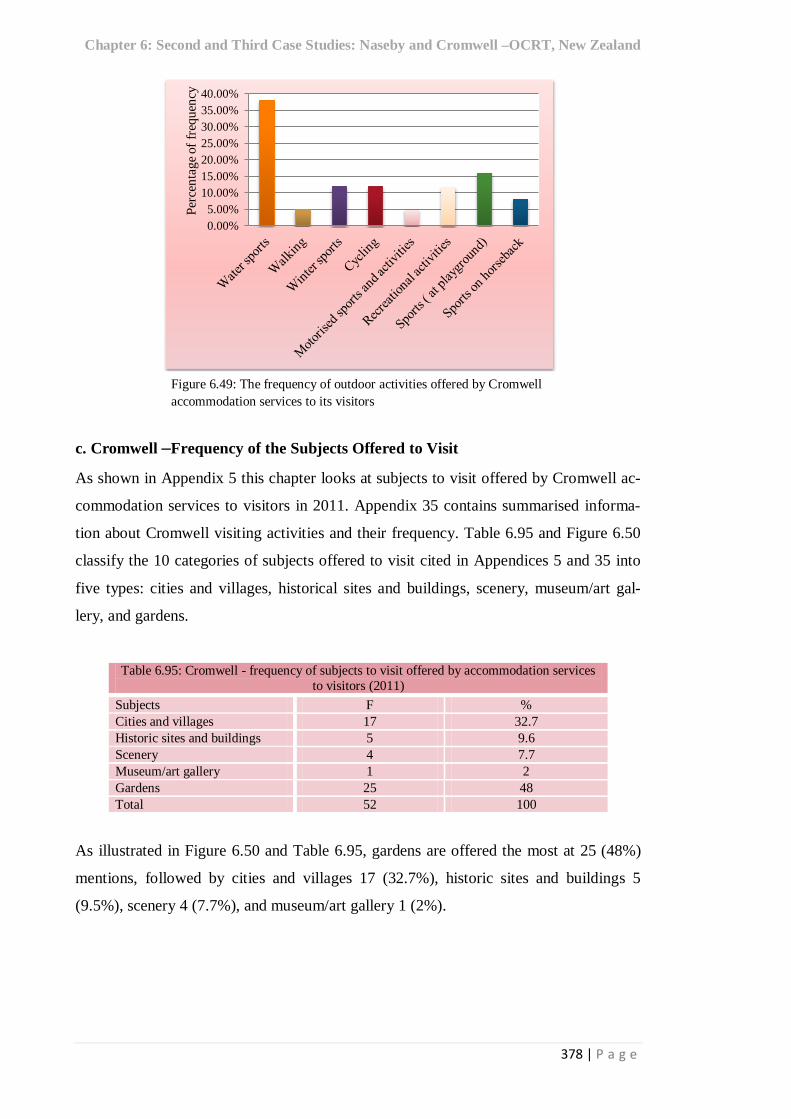
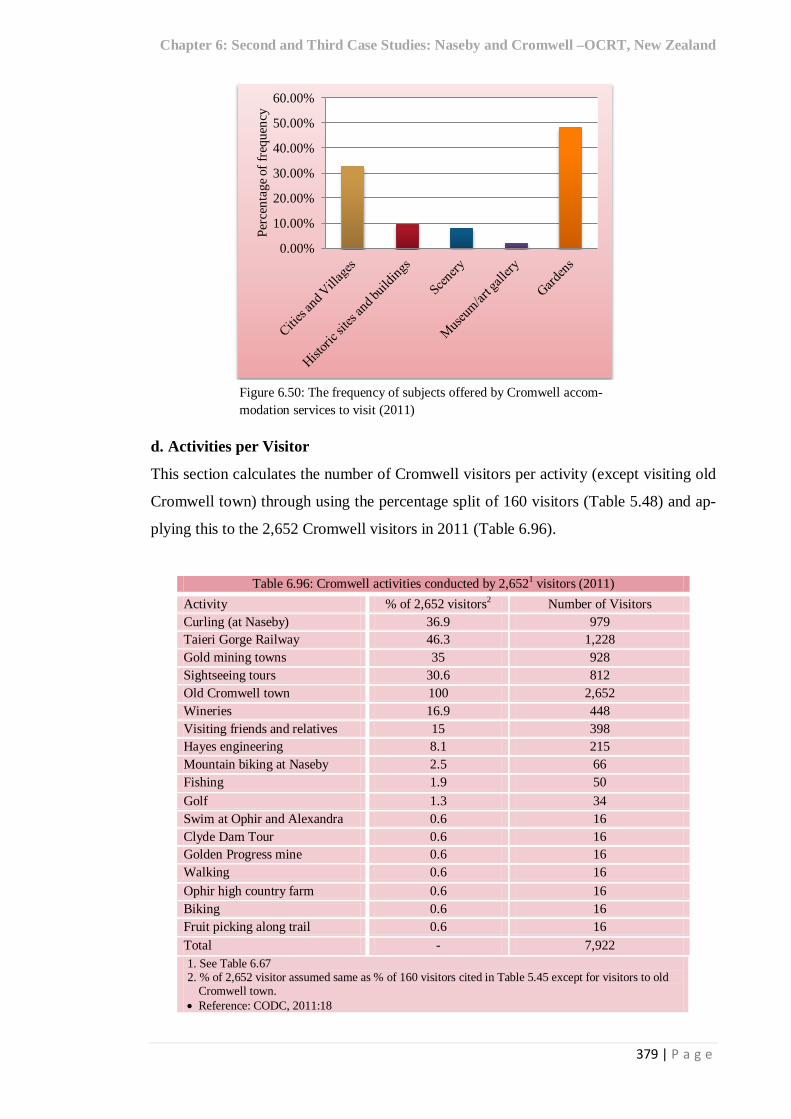
Table 6.95: Cromwell - frequency of subjects to visit offered by accommodation services to visitors (2011) 378
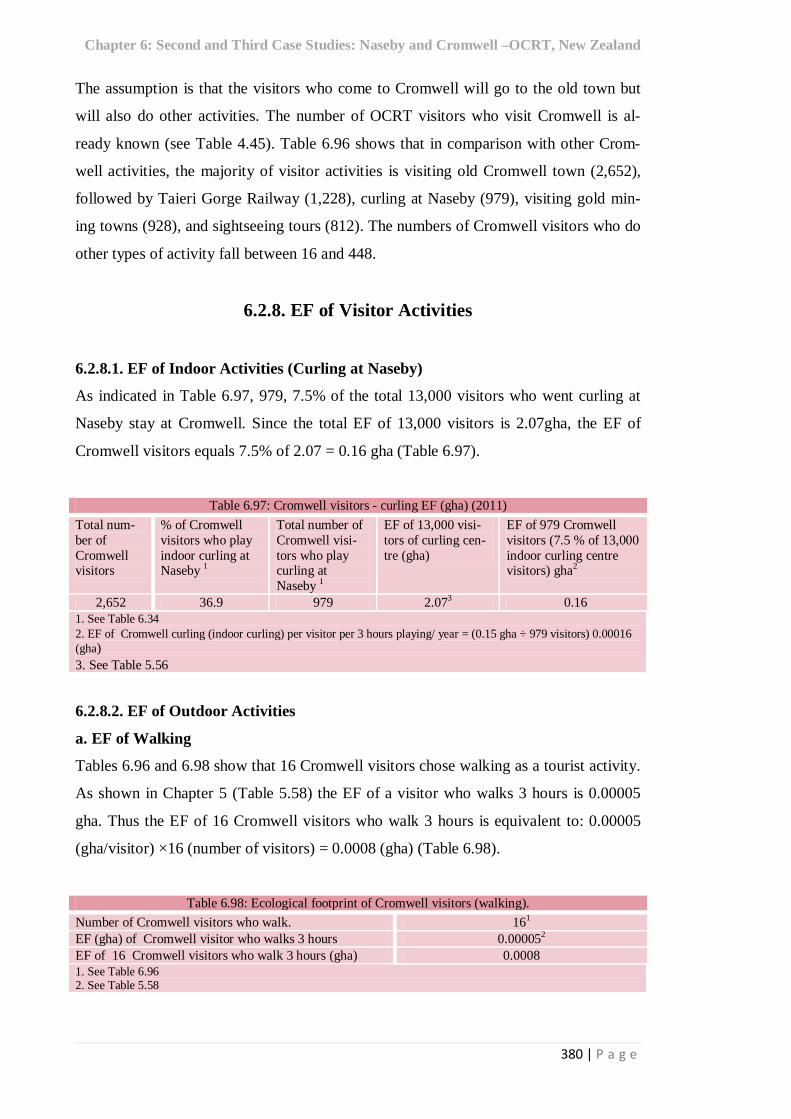
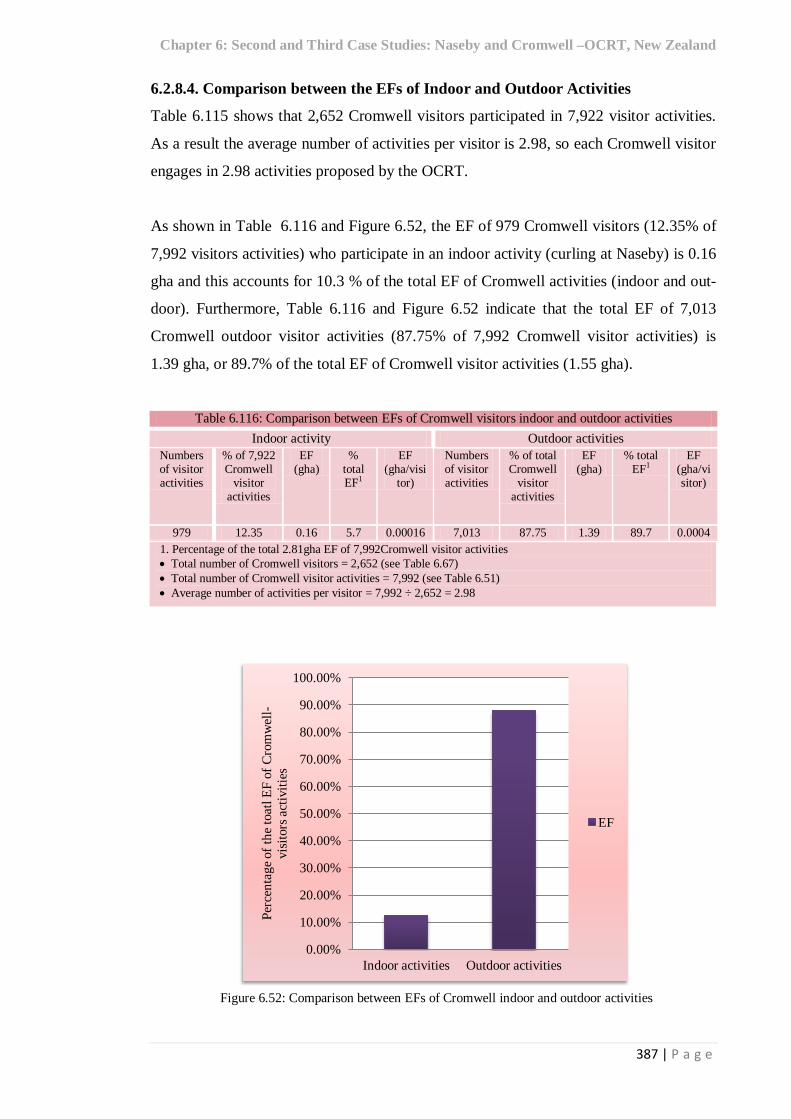
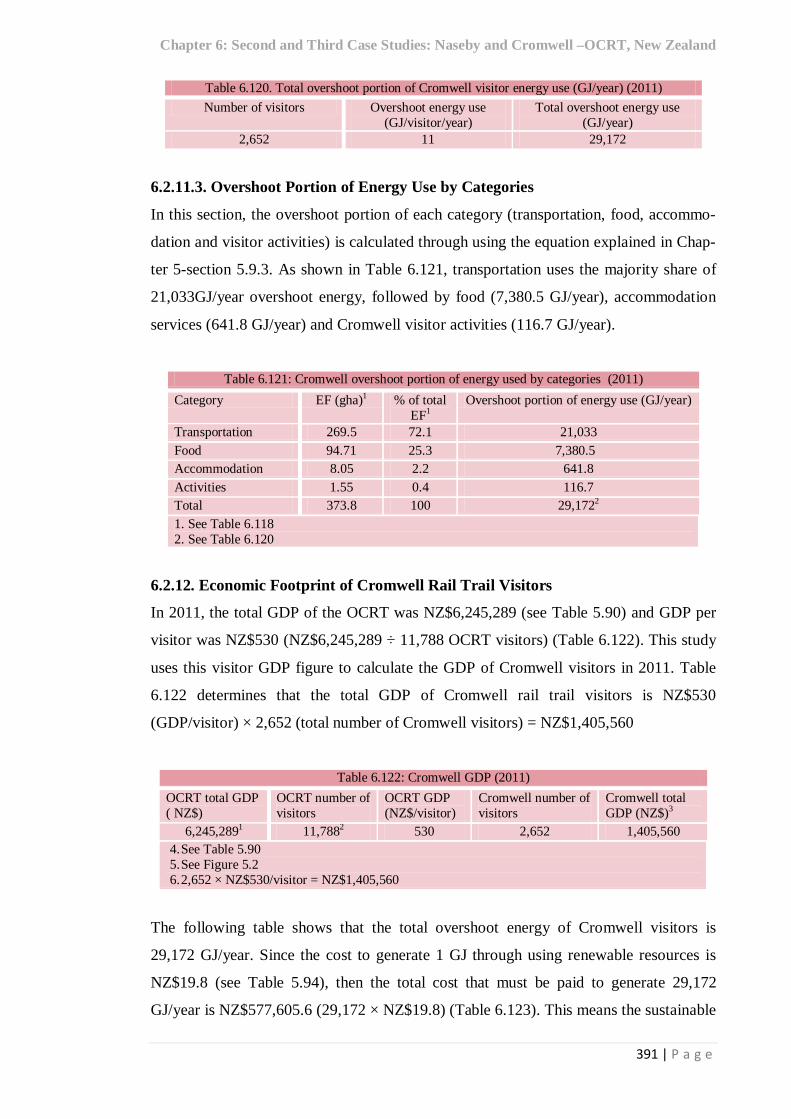
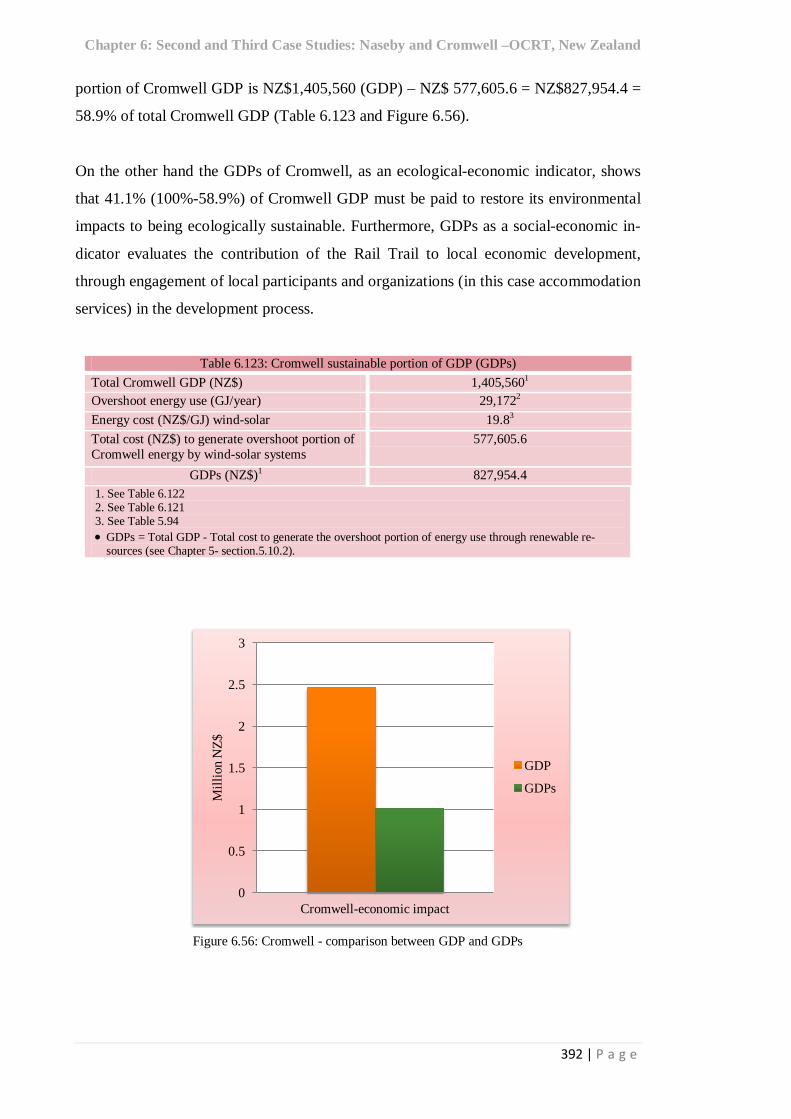
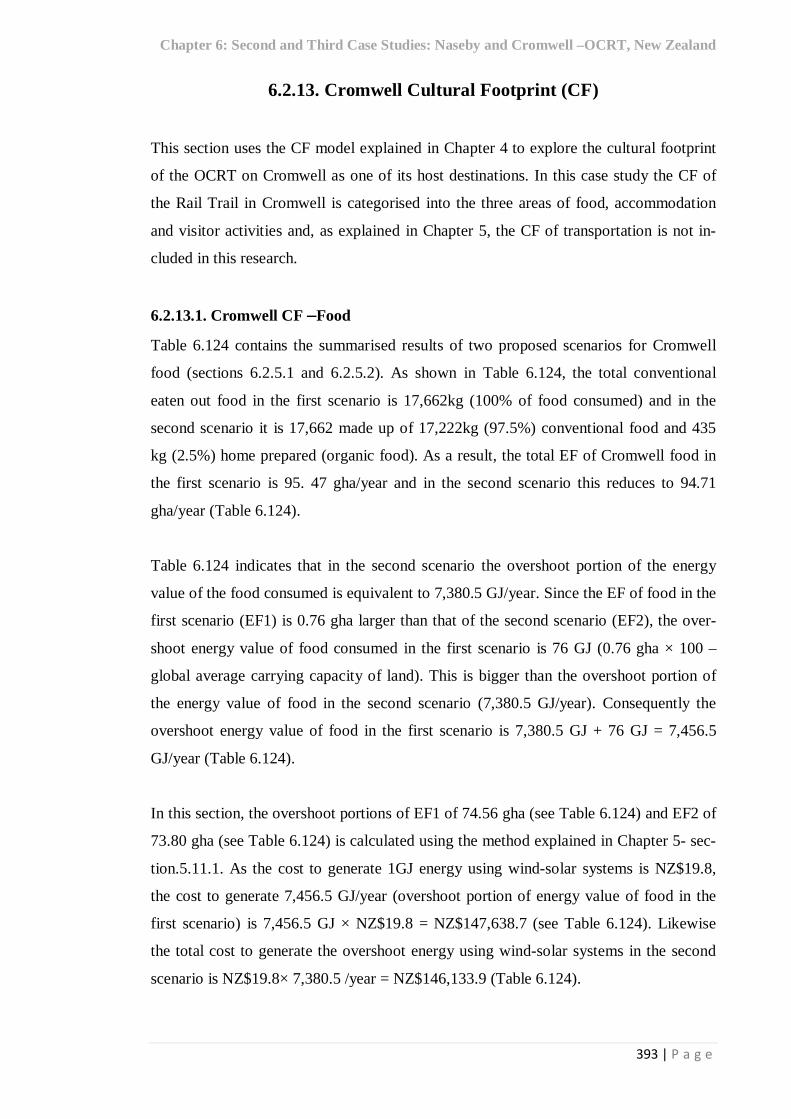
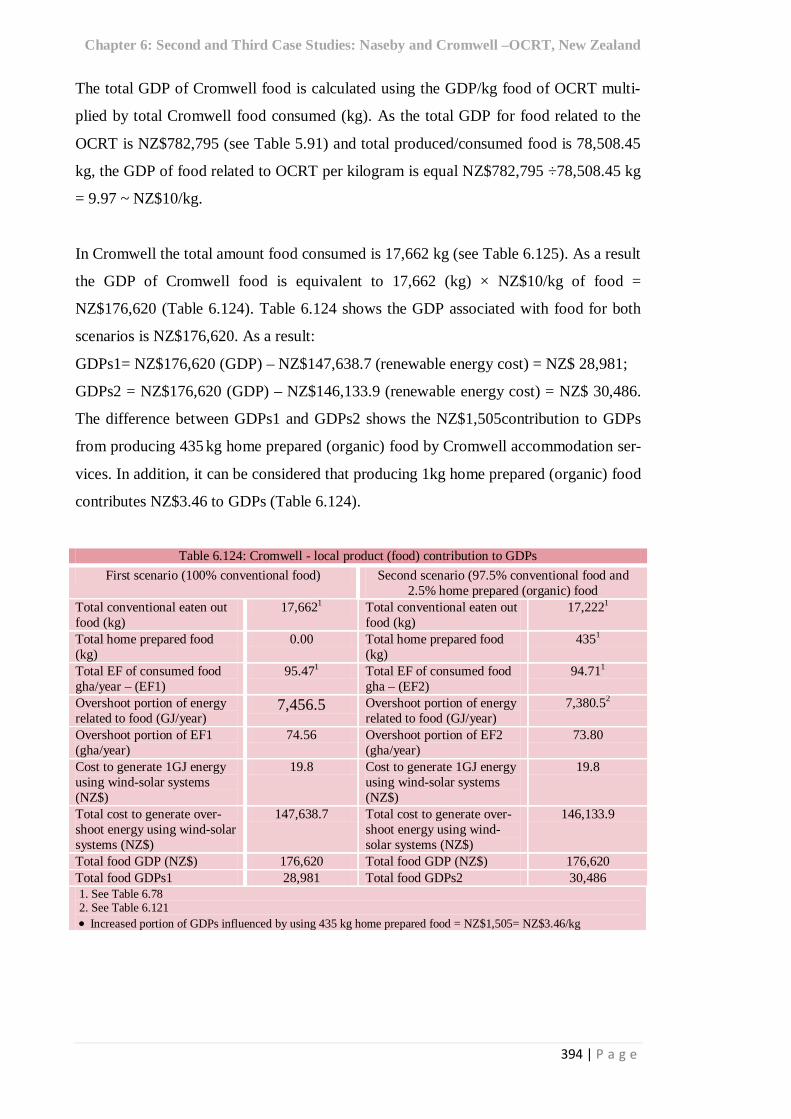
Table 6.96: Cromwell activities conducted by 2,6521 visitors (2011) 379 Table 6.97: Cromwell visitors - Curling EF (gha) (2011) 380 Table 6.98: Ecological footprint of Cromwell visitors (walking). 380 Table 6.99: Ecological footprint of Cromwell visitors (golf) 381 Table 6.100: Ecological footprint of Cromwell visitors (mountain biking) 381 Table 6.101: Ecological footprint of Cromwell visitors (fishing) 381 Table 6.102: Ecological footprint of Cromwell visitors (swimming) 382 Table 6.103: Ecological footprint of Cromwell visitors (wineries) 382 Table 6.104: Ecological footprint of Cromwell visitors (sightseeing) 382 Table 6.105: Ecological footprint of Cromwell visitors (Hayes Engineering) 383 Table 6.106: Ecological footprint of Cromwell visitors (Ophir High Country Farm) 383 Table 6.107: Ecological footprint of Cromwell visitors (Taieri) 383 Table 6.108: Ecological footprint of Cromwell visitors (Gold mining towns) 383 Table 6.109: Ecological footprint of Cromwell visitors (Old Cromwell town) 384 Table 6.110: Ecological footprint of Cromwell visitors (visiting friends and relatives) 384 Table 6.111: Ecological footprint of Cromwell visitors (Clyde Dam Tour) 384 Table 6.112: Ecological footprint of Cromwell visitors (Golden Progress Mine) 384 Table 6.113: Ecological footprint of Cromwell visitors (fruit picking along trail) 385 Table 6.114: Ecological footprint of Cromwell visitors (biking) 385 Table 6.115: Total EF of Cromwell visitor activities 386 Table 6.115: Total EF of Cromwell visitor activities 387 Table 6.116: Comparison between EFs of Cromwell visitors indoor and outdoor activities 389 Table 6.117: Total EF of Cromwell (2011) 390 Table 6.118: Overshoot portion of Cromwell visitors EF (gha/visitor/year) (2011) 390 Table 6.119: Overshoot portion of Cromwell visitor energy use (GJ/visitor/year) (2011) 391 Table 6.121: Cromwell overshoot portion of energy used by categories (2011) 391 Table 6.122: Cromwell GDP (2011) 391 Table 6.123: Cromwell Sustainable Portion of GDP (GDPs) 392 Table 6.124: Cromwell - Local product (Food) contribution to GDPs 394 Table 6.125: Cromwell Accommodation services - CF (2011) 398 Table 6.126: Cromwell visitor activities - EF and GDPs 402 Table 6.127: The CF of Cromwell visitor activities - first and second scenarios 403 Table 6.128: The CF of Cromwell visitor activities - first and third scenarios 405
xii | P a g e
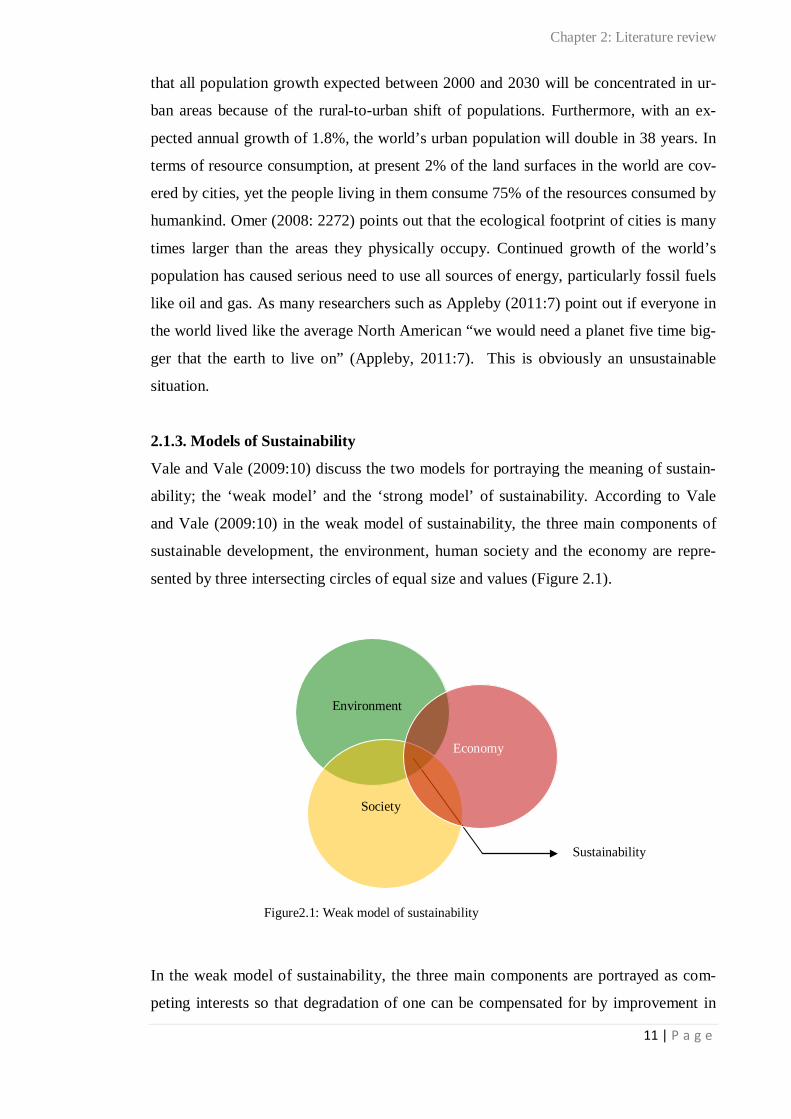
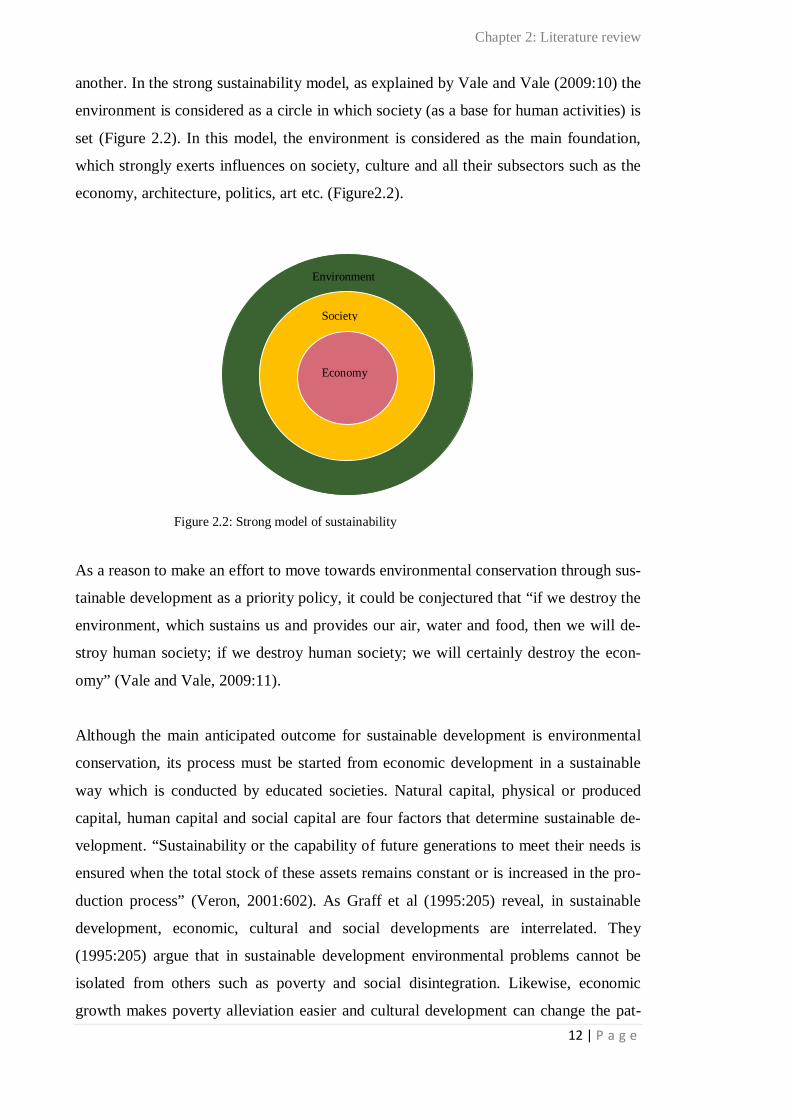
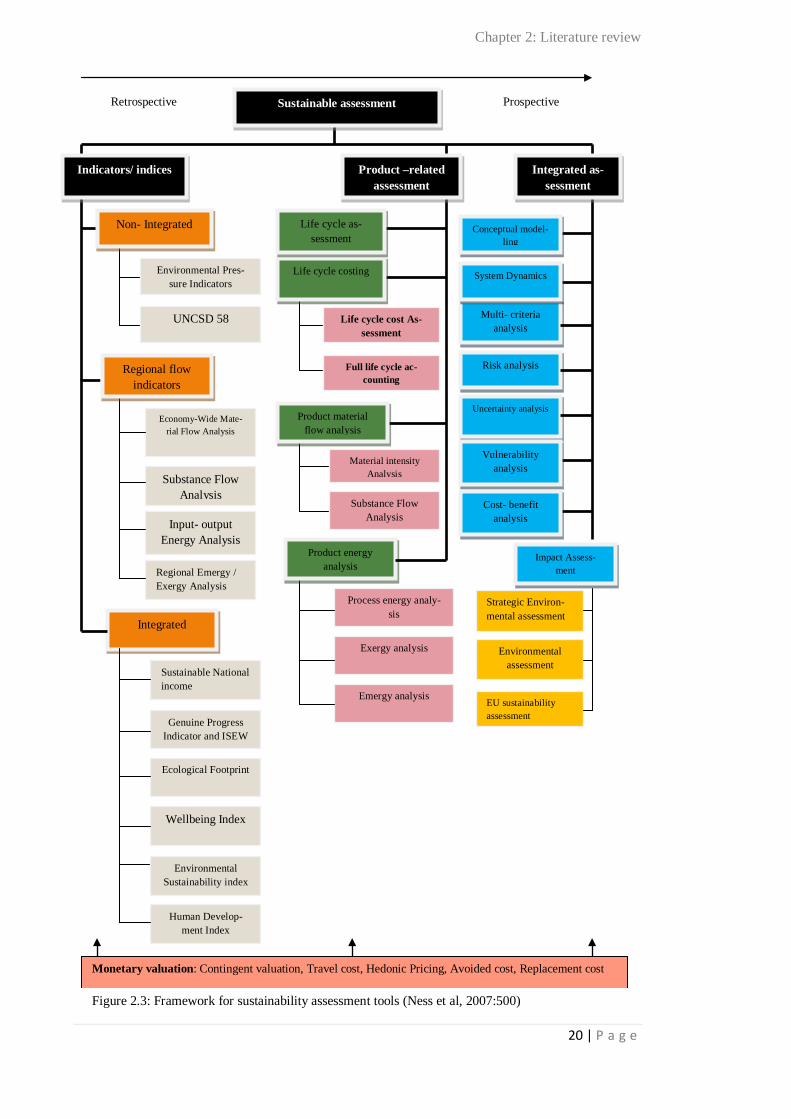
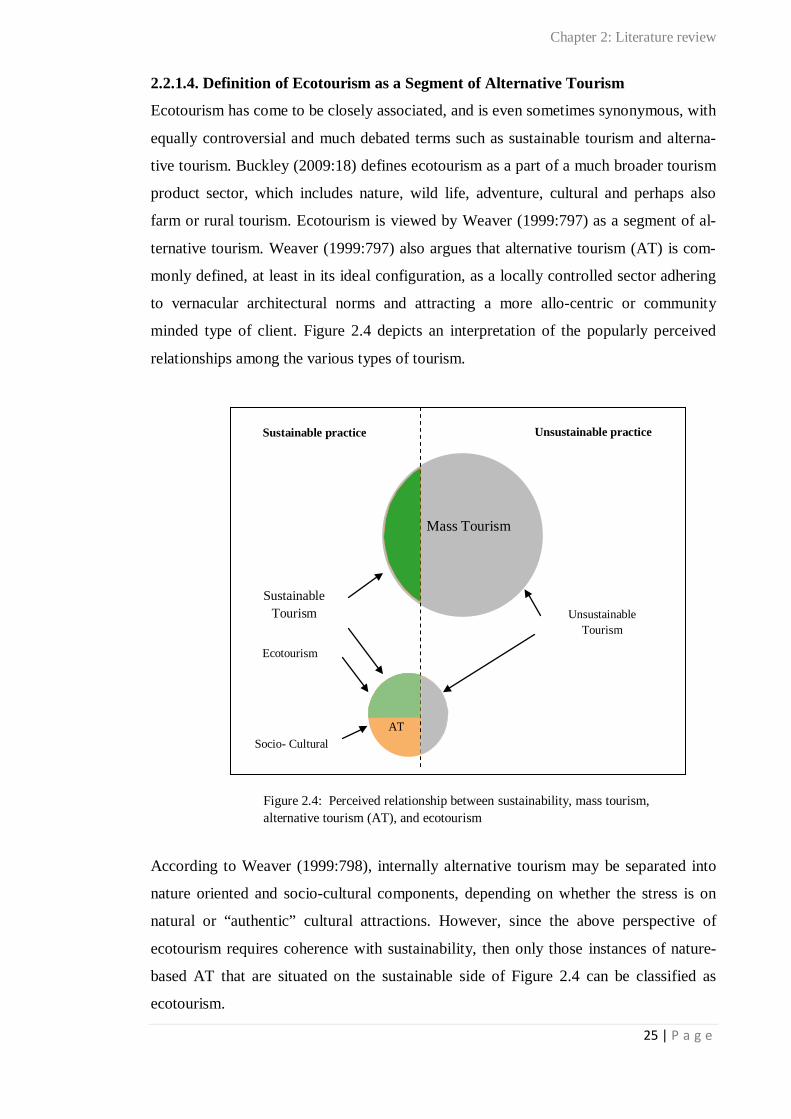
List of Figures Page Figure 2.1: Weak model of sustainability 11 Figure 2.2: Strong model of sustainability 12 Figure 2.3: Framework for sustainability assessment tools 20 Figure 2.4: Perceived relationship between sustainability, mass tourism, alternative tourism (AT), and ecotourism
25
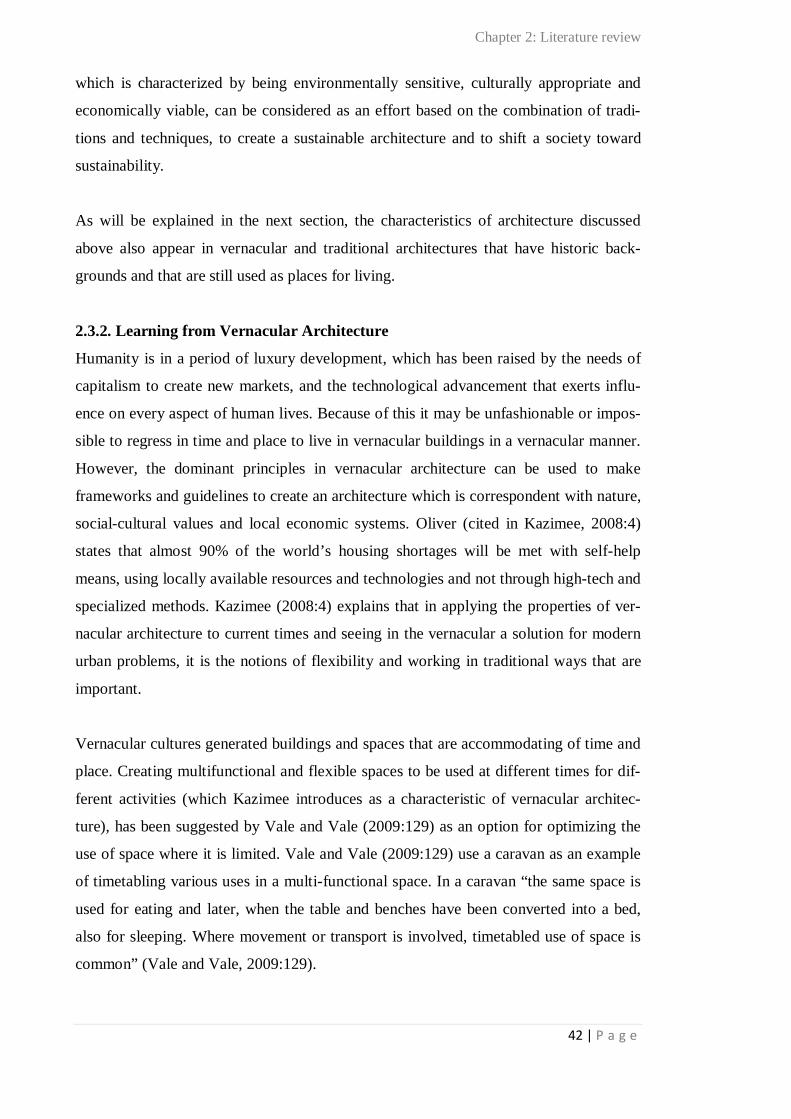
Figure 2.5: Nuristan village, Afghanistan http://viaterra.net/photos/pakistan/pakistan_nuristani2.jpg viewed December 2010
43
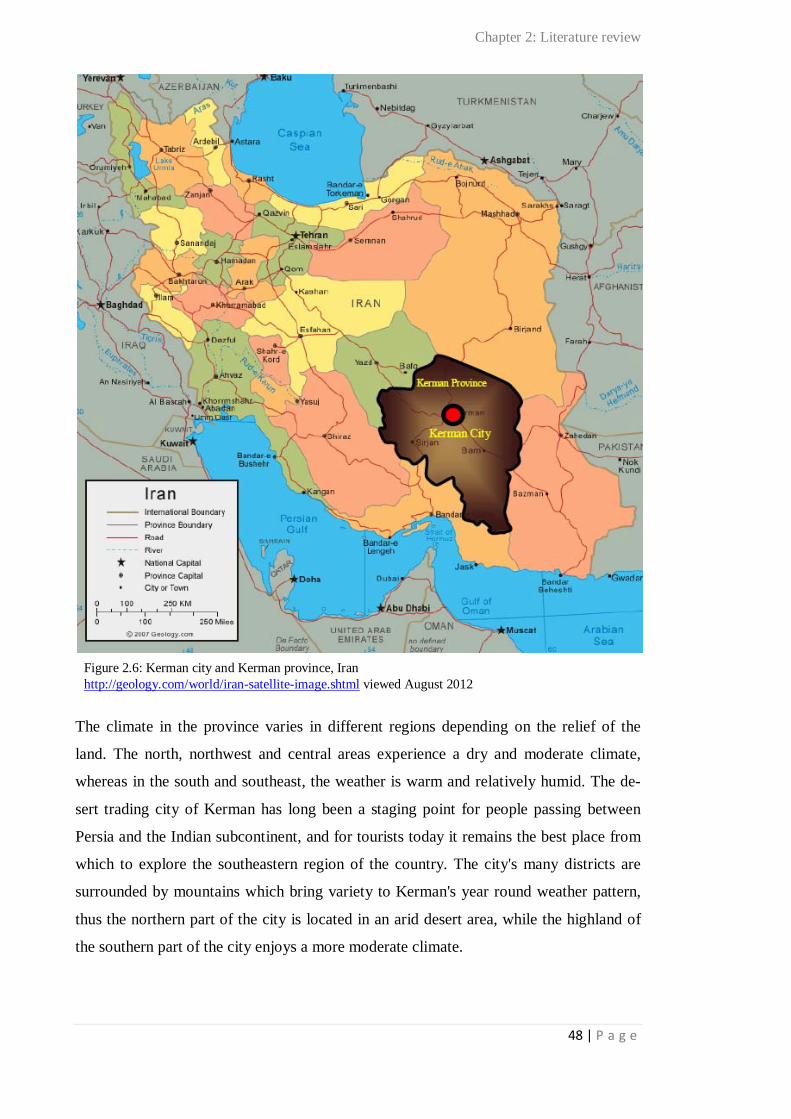
Figure 2.6: Kerman city and Kerman province, Iran http://geology.com/world/iran-satellite-image.shtml viewed August 2012
48
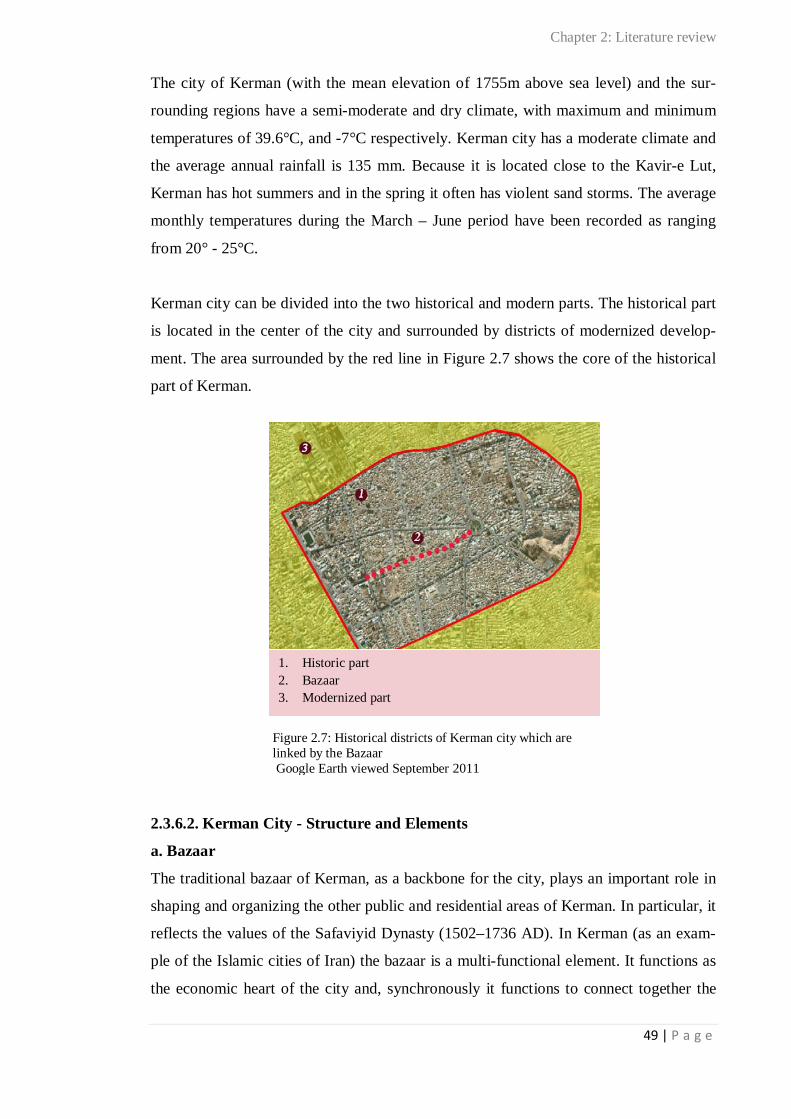
Figure 2.7: Historical districts of Kerman city which are linked by the Bazaar Google Earth viewed September 2011
49
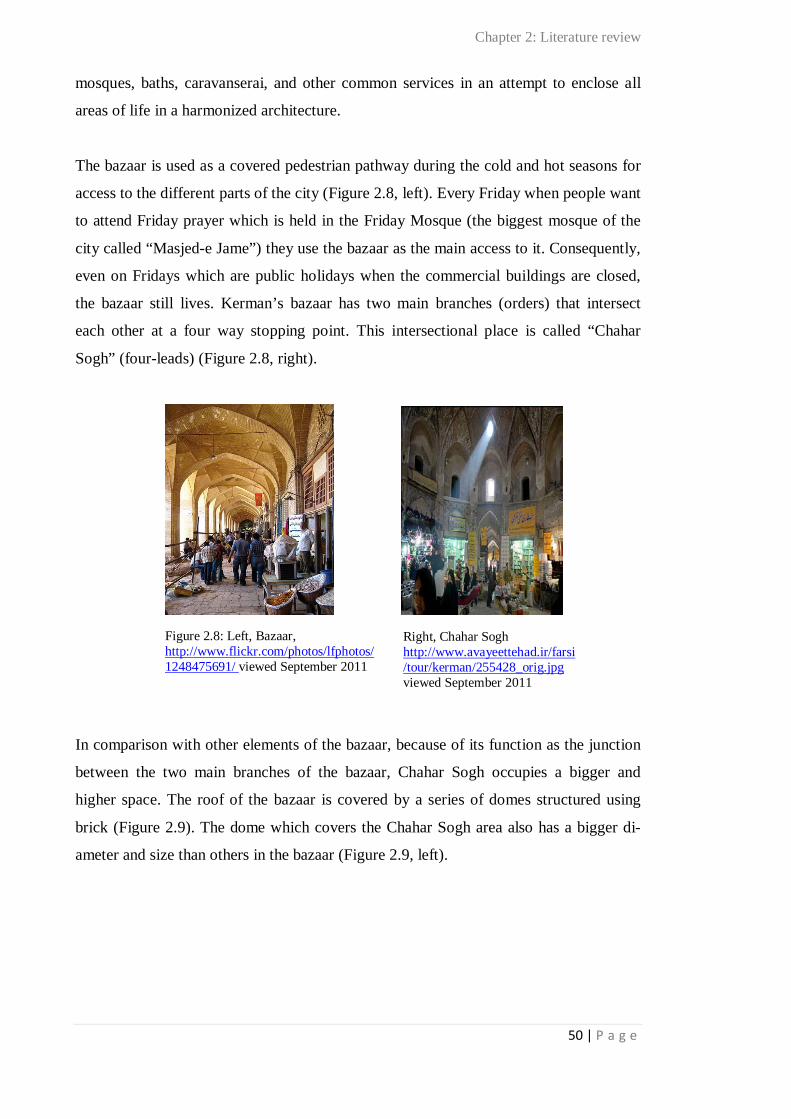
Figure 2.8: Bazaar1 and Chahar Sogh2
1. http://www.flickr.com/photos/lfphotos/1248475691/ viewed September 2011 2. http://www.avayeettehad.ir/farsi/tour/kerman/255428_orig.jpg viewed September 2011
50
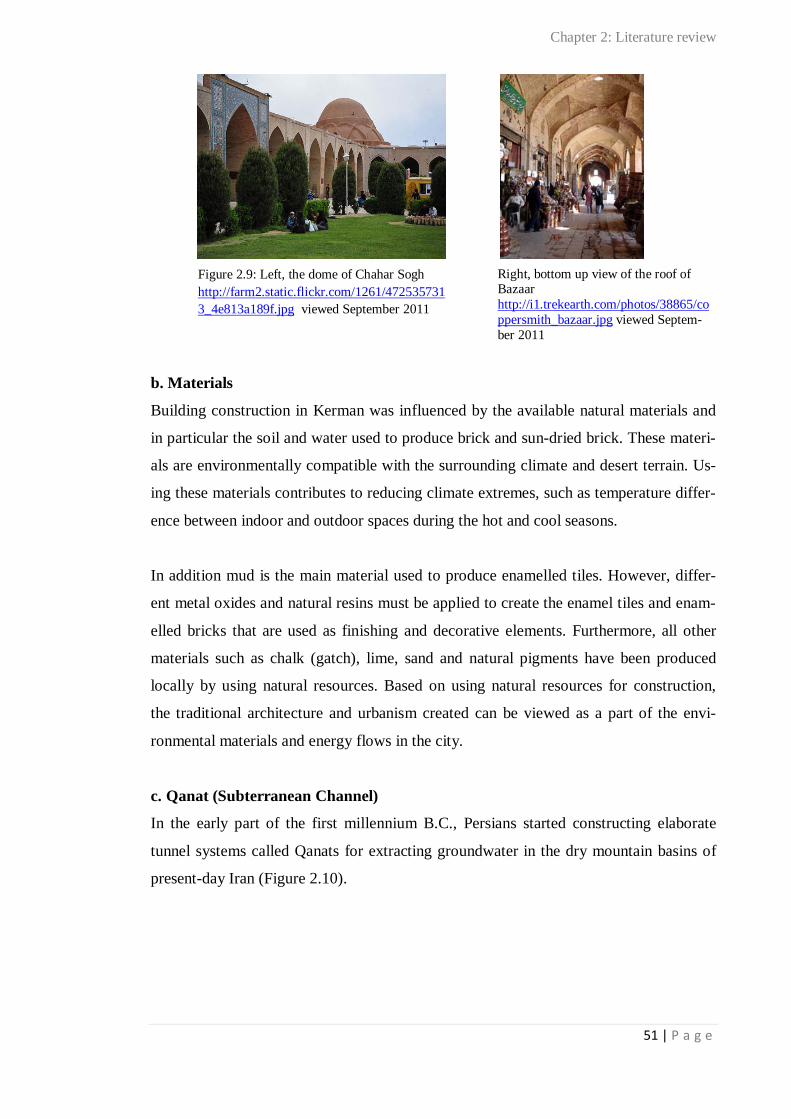
Figure 2.9: The dome of Chahar Sogh1 and the roof of the Bazaar2
1. http://farm2.static.flickr.com/1261/4725357313_4e813a189f.jpg viewed September 2011 2. http://i1.trekearth.com/photos/38865/coppersmith_bazaar.jpg viewed September 2011
51
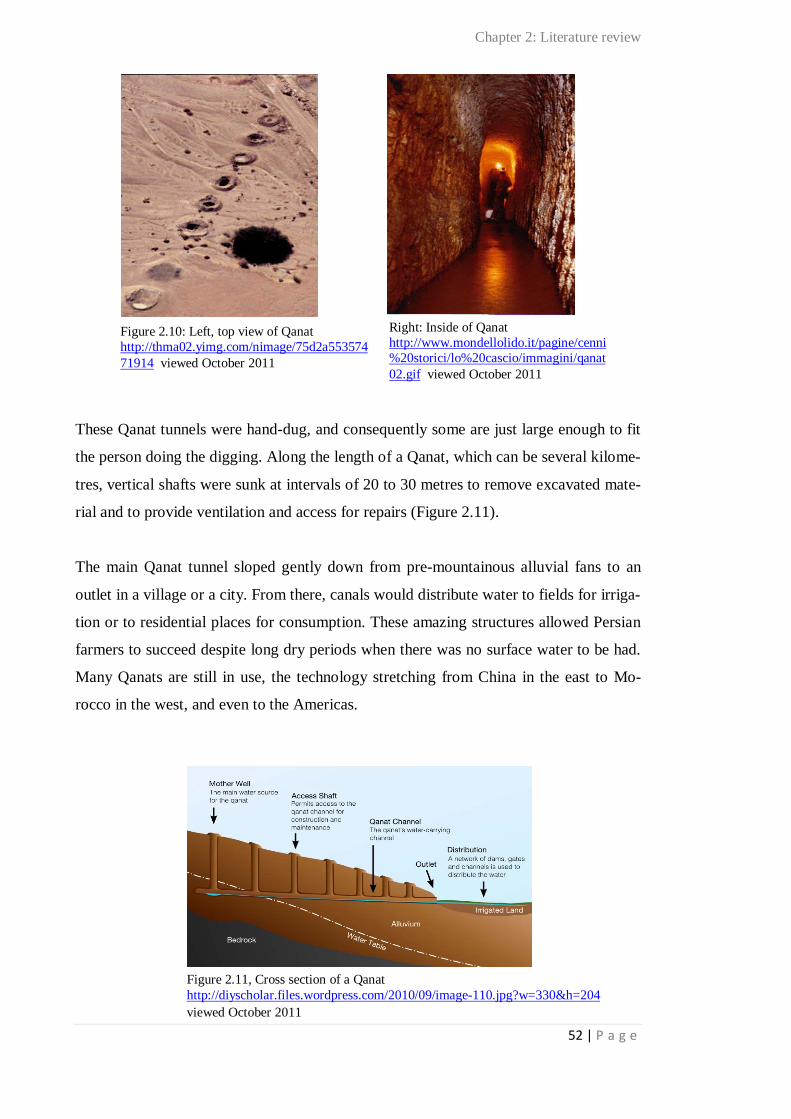
Figure 2.10: Top view1 and inside2 of Qanat 1. http://thma02.yimg.com/nimage/75d2a55357471914 viewed October 2011 2. http://www.mondellolido.it/pagine/cenni%20storici/lo%20cascio/immagini/qanat02.gif viewed October 2011
52
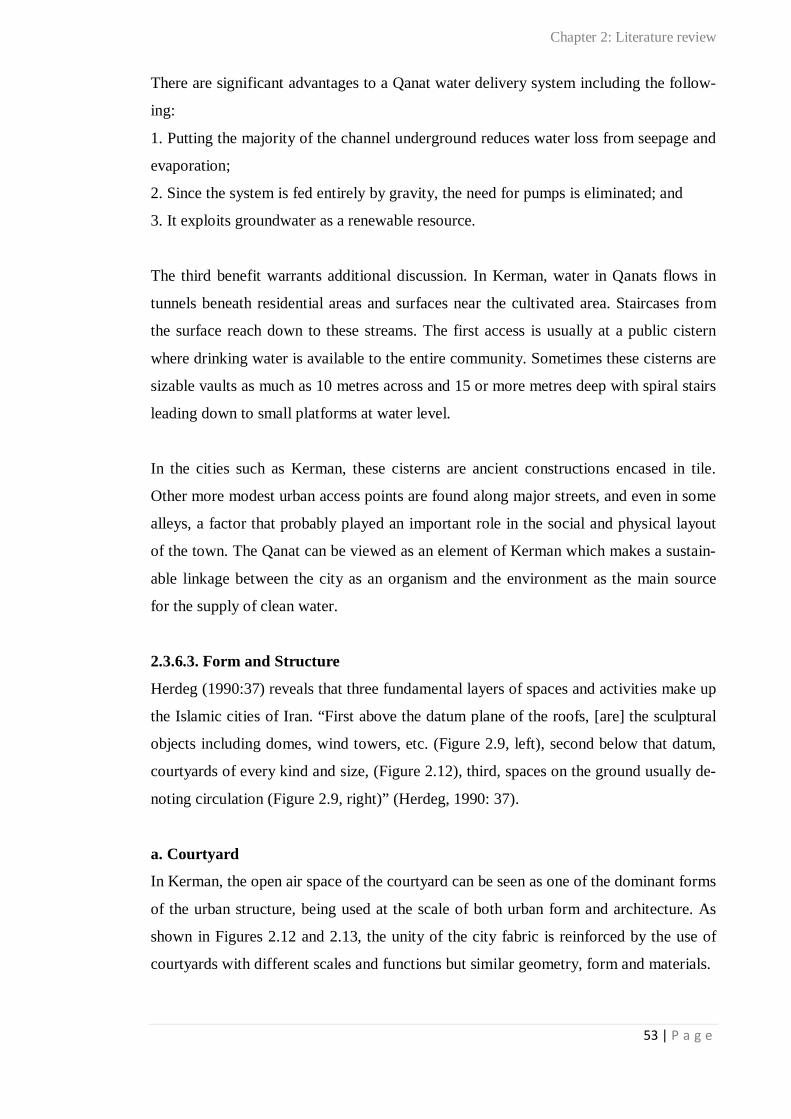
Figure 2.11: Cross section of a Qanat http://diyscholar.files.wordpress.com/2010/09/image-110.jpg?w=330&h=204 viewed October 2011
52
Figure 2.12: Courtyards with different functions in the historical part of Kerman Google Earth viewed October 2011
54
Figure 2.13: Arg Square1 and Gang Ali Khan Square2, Kerman 1. http://innocent.persiangig.com/image/Kerman%20Ghadim/Saeed017.jpg viewed December 2011 2. http://farm2.staticflickr.com/1383/4725402177_c052e0c31b_z.jpg viewed December 2011
54
Figure 2.14: The open space (white areas) and built areas in the historical part of Kerman The open space (white areas) and built areas in the historical part of Kerman (Herdeg, 1990:37)
55
Figure 2.15: Courtyard http://nazaronline.ir/files/fa/news/1389/7/3/1309_325.jpg viewed October 2011 http://images.travelpod.com/tw_slides/ta00/9d9/eca/kashan-traditional-house-kashan.jpg viewed October 2011
56
Figure 2.16: Dome http://lajourd.com/HTMLs/dome.htm viewed October 2011
57
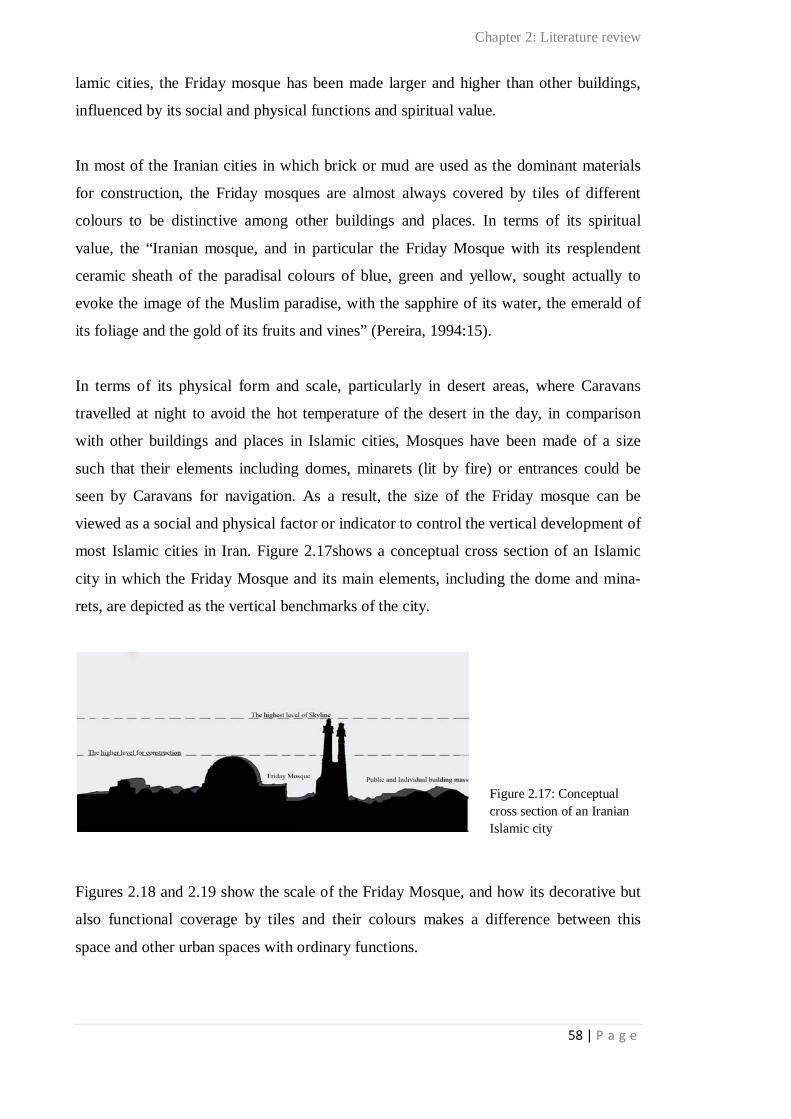
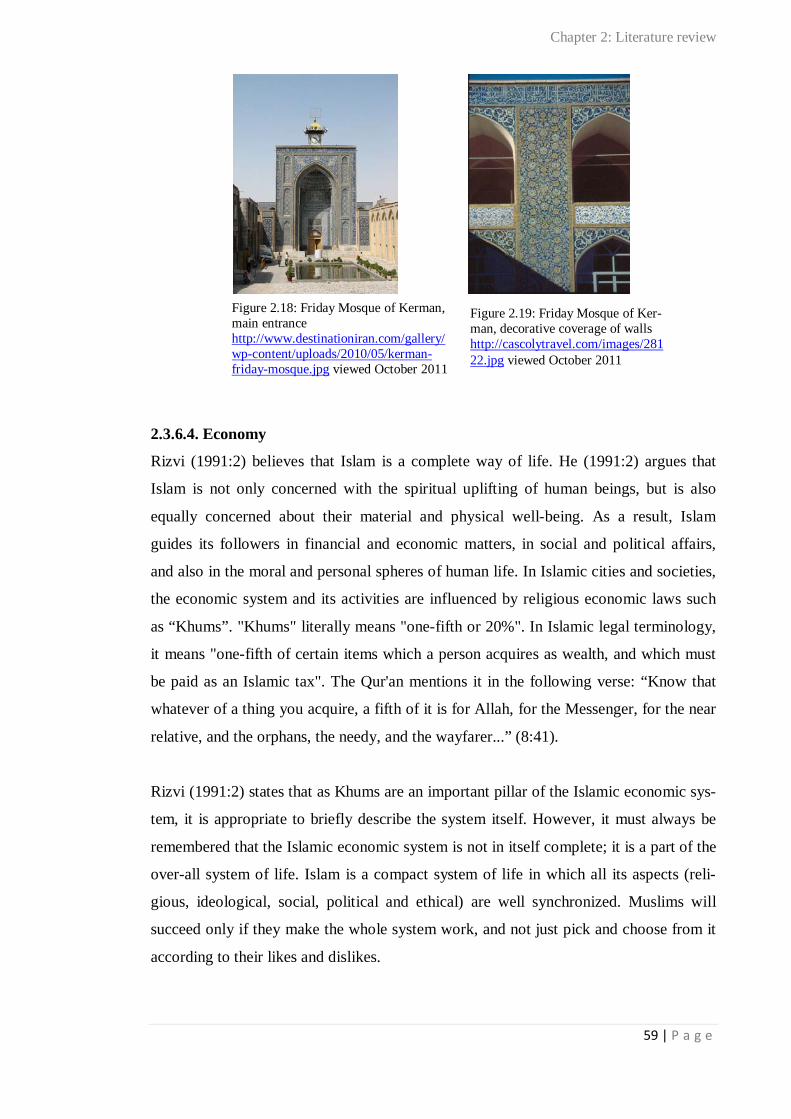
Figure 2.17: Conceptual cross section of an Iranian Islamic city 58 Figure 2.18: Friday Mosque of Kerman, main entrance http://www.destinationiran.com/gallery/wp-content/uploads/2010/05/kerman-friday-mosque.jpg viewed October 2011
59
Figure 2.19: Friday Mosque of Kerman, decorative coverage of walls http://cascolytravel.com/images/28122.jpg viewed October 2011
59
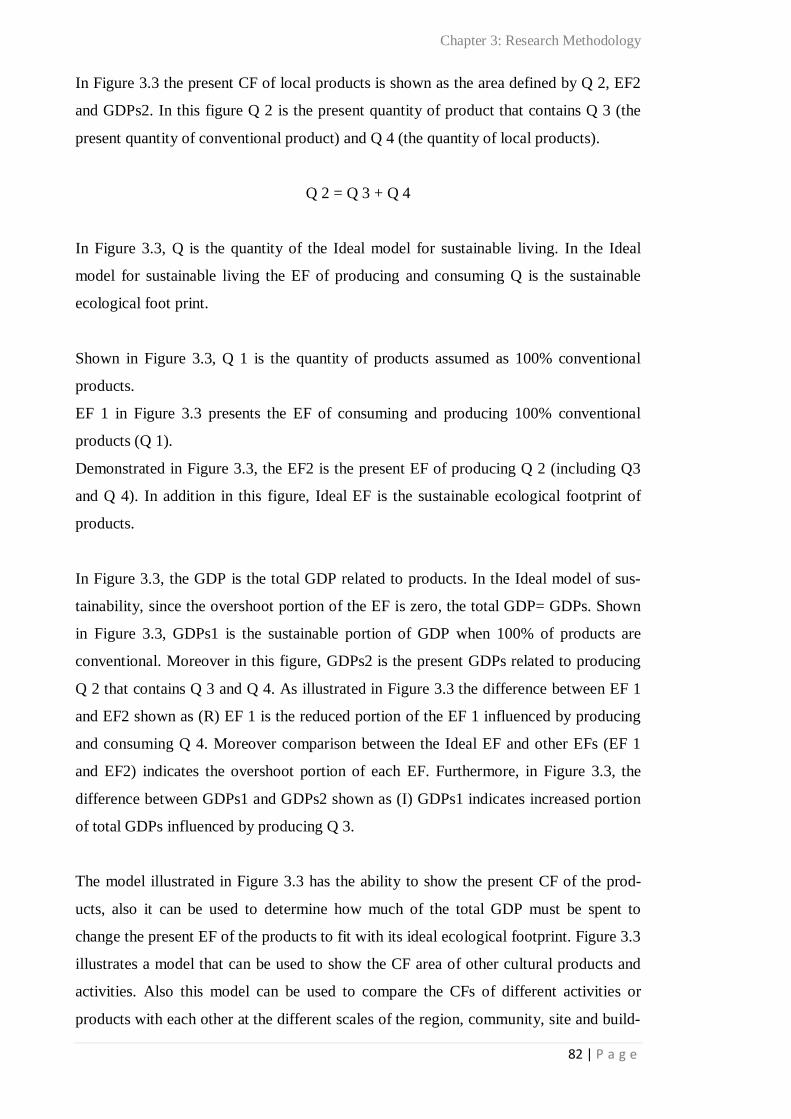
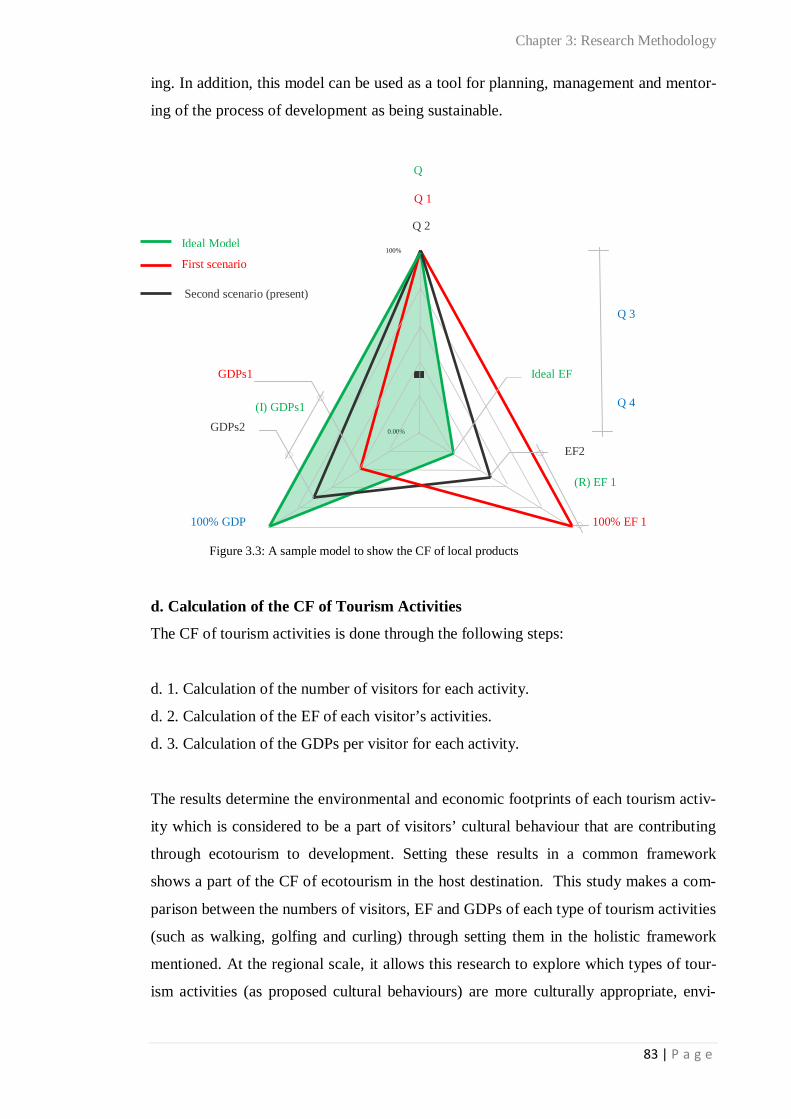
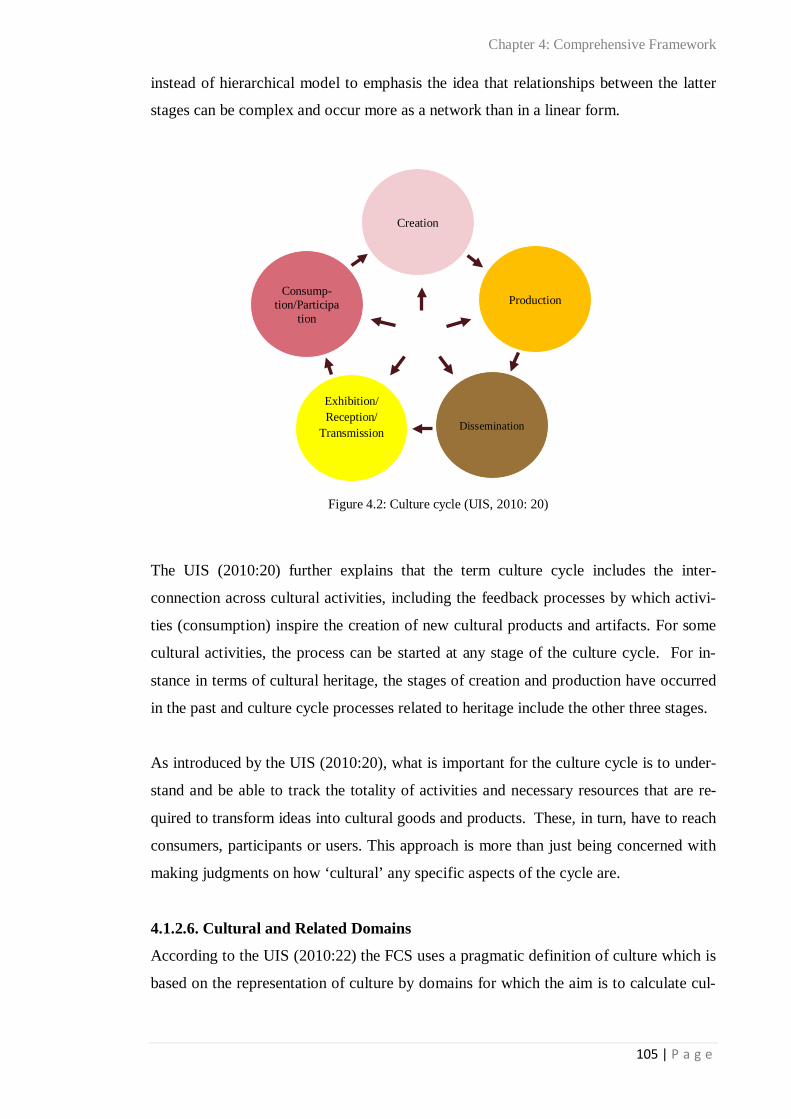
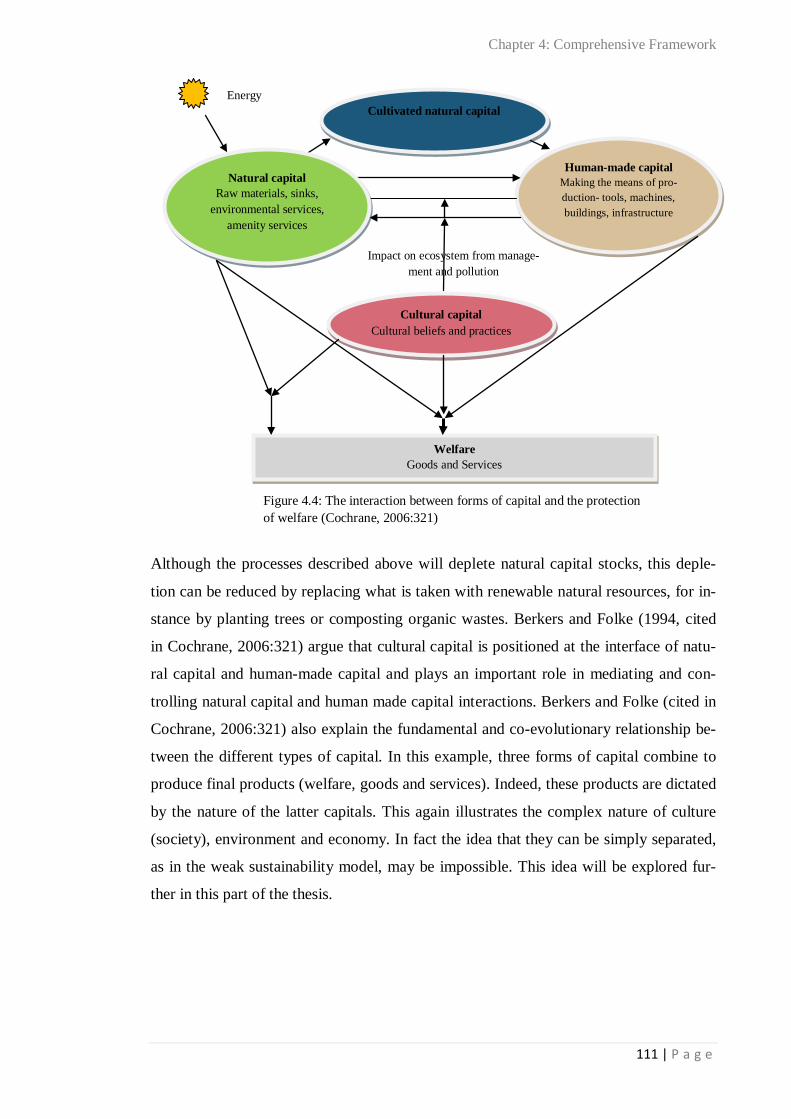
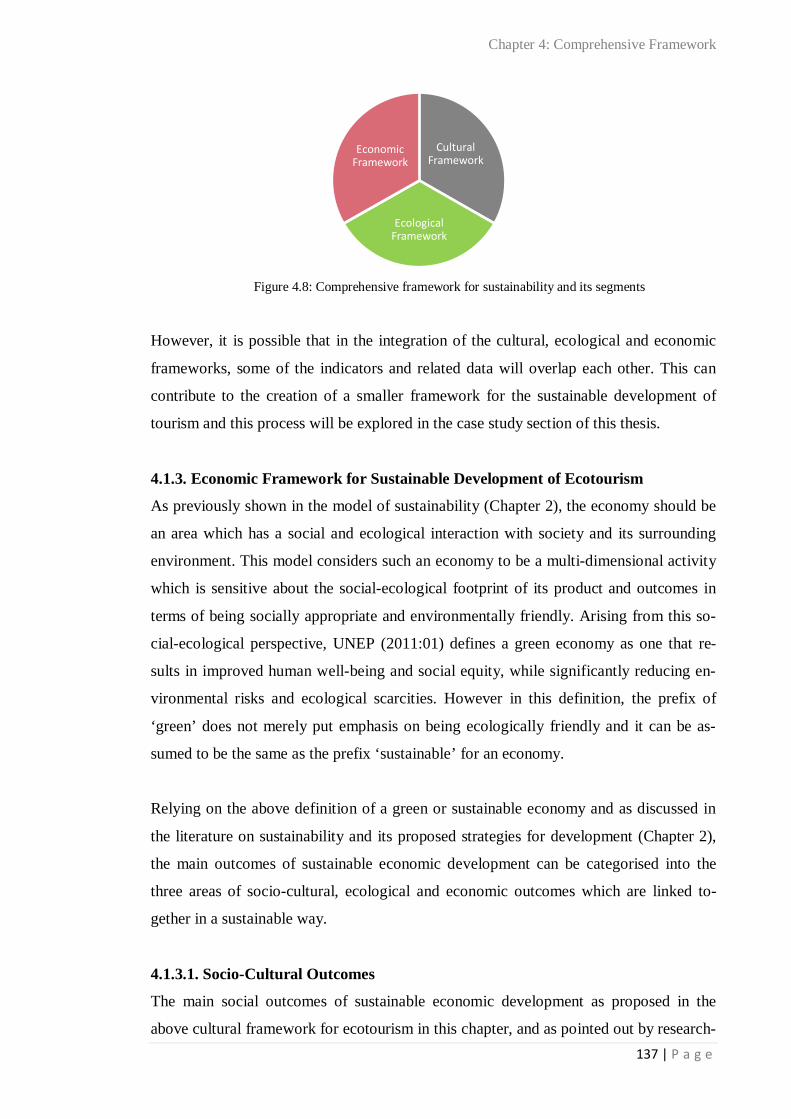
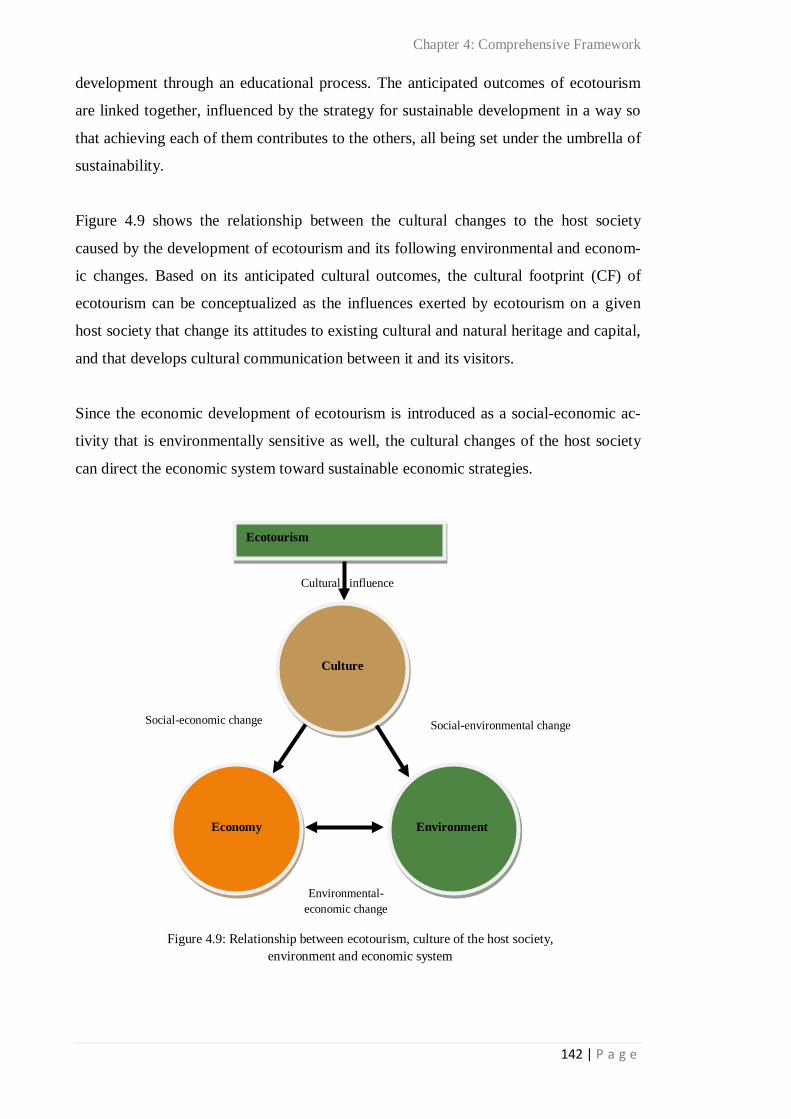
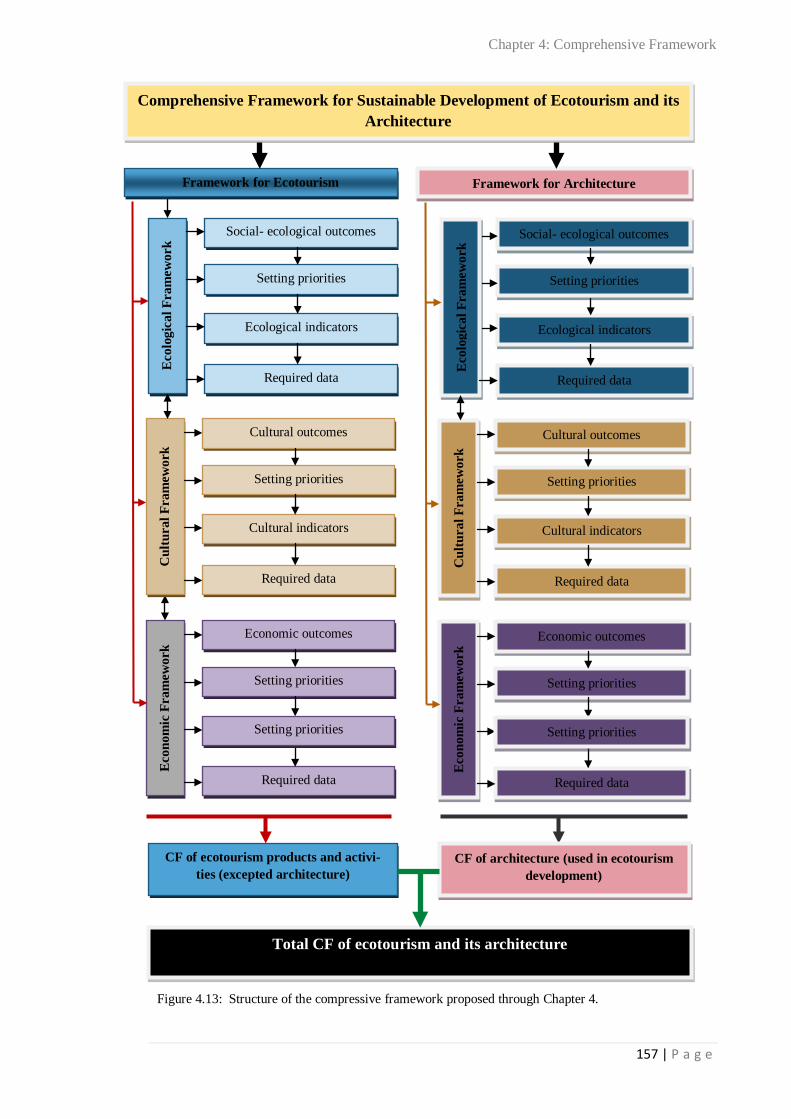
Figure 3.1: Thesis structure 69 Figure 3.2: Research methodology structure 74 Figure 3.3: A sample model to show the CF of local products 83 Figure 4.1: Flows of energies and materials in an organism 101 Figure 4.2: Culture cycle (UIS, 2010:20) 105 Figure 4.3: Framework for Cultural Statistics Domains 107 Figure 4.4: The interaction between forms of capital and the protection of welfare 111 Figure 4.5: Integration of FCS cultural domains and indicators 118 Figure 4.6: Tourism, FCS cultural frameworks, and SNZ themes and indicators 119 Figure 4.7: Community tourism planning model (Reid et al, 2004:625) 121 Figure 4.8: Comprehensive framework for sustainability and its segments 136 Figure 4.9: Relationship between ecotourism, culture of the host society, environment and eco-nomic system
142
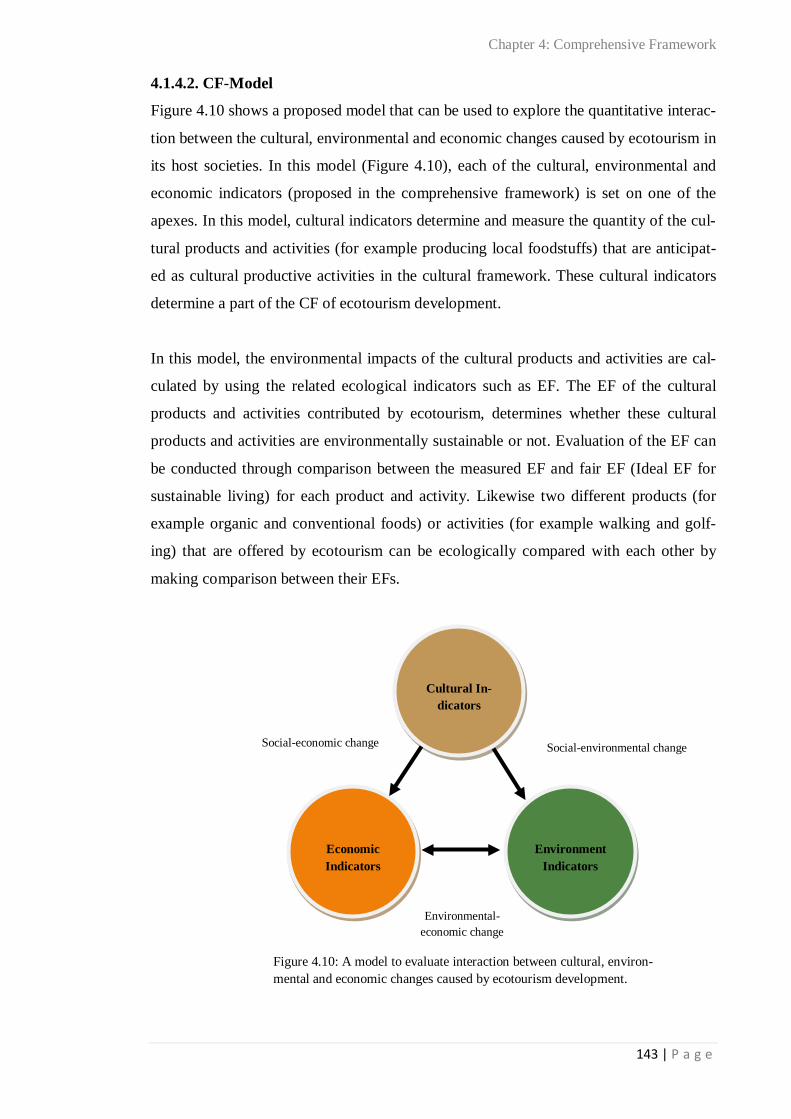
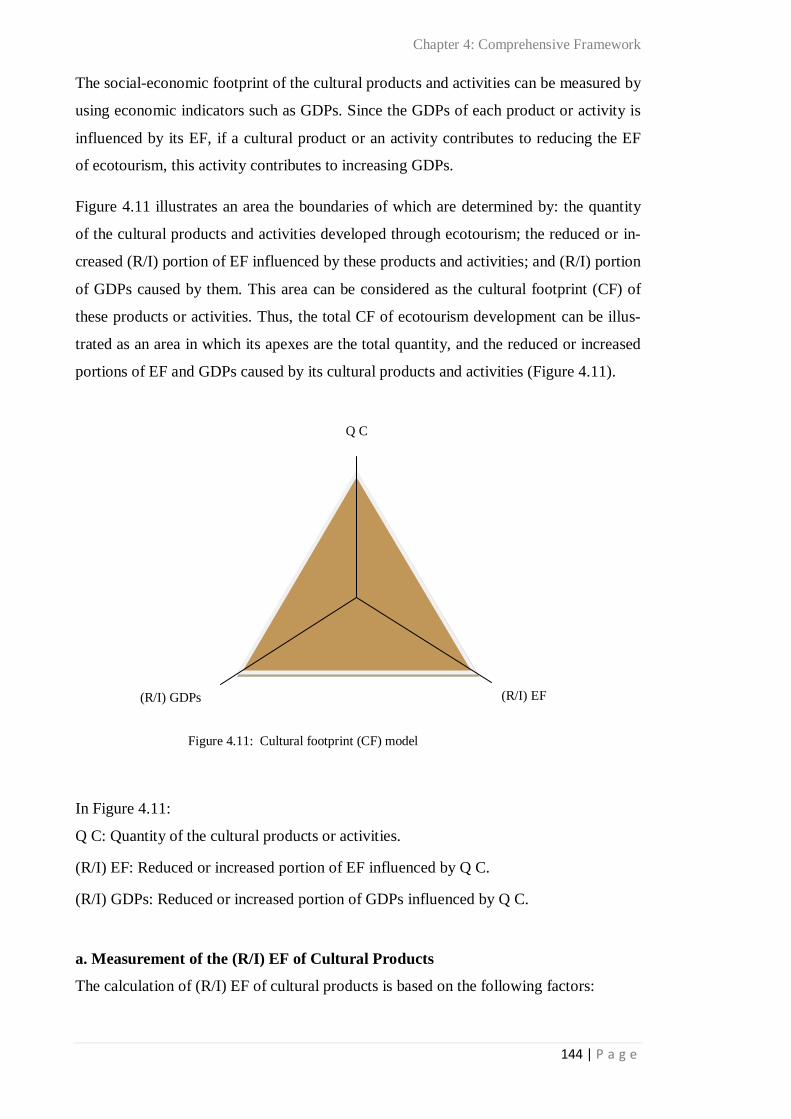
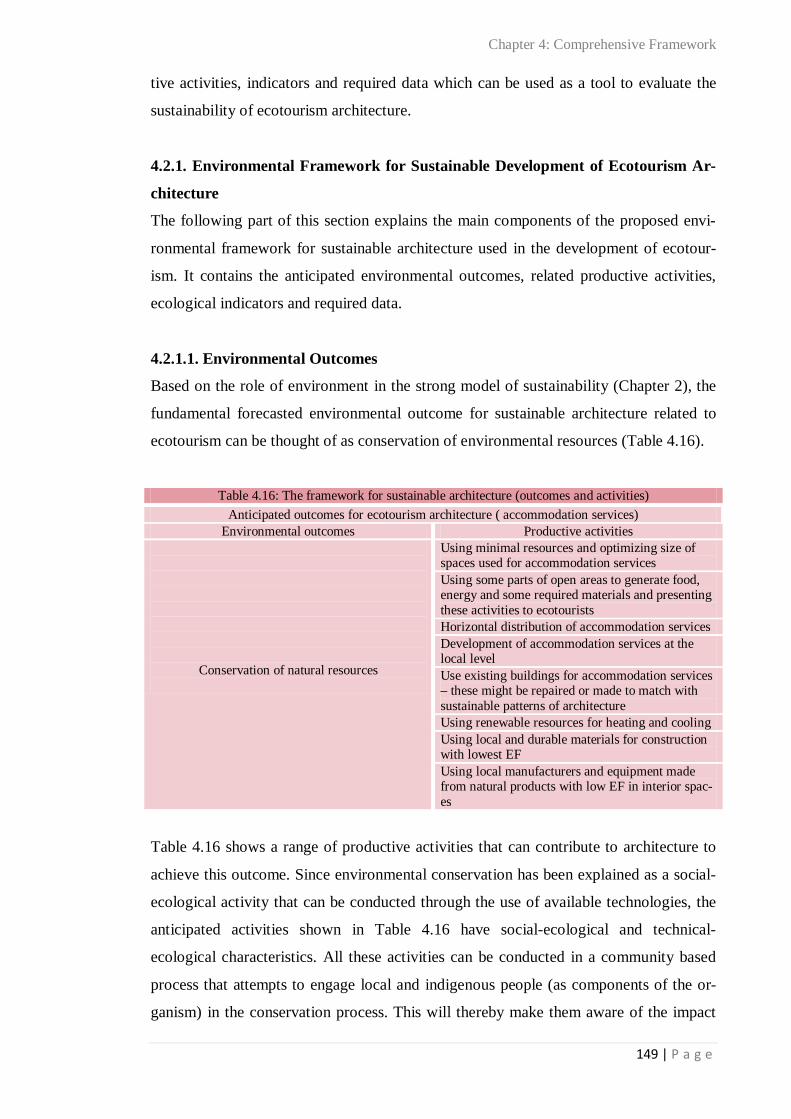
Figure 4.10: A model to evaluate interaction between cultural, environmental and economic changes caused by ecotourism development
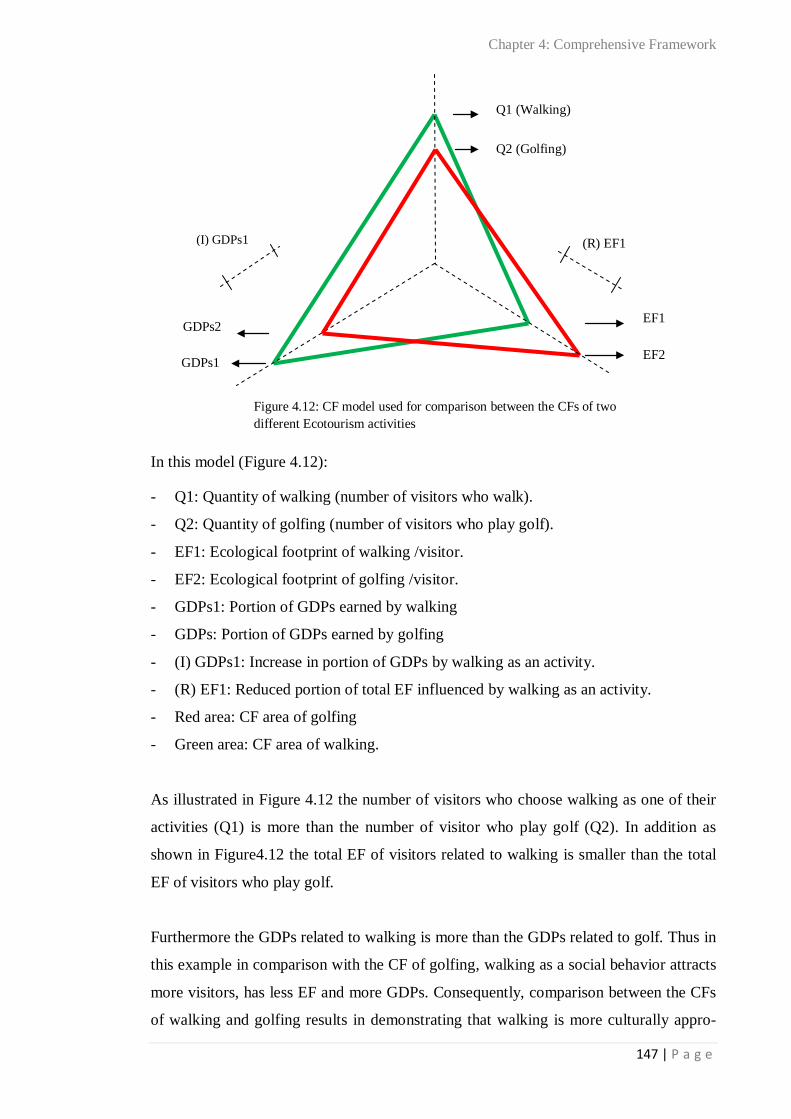
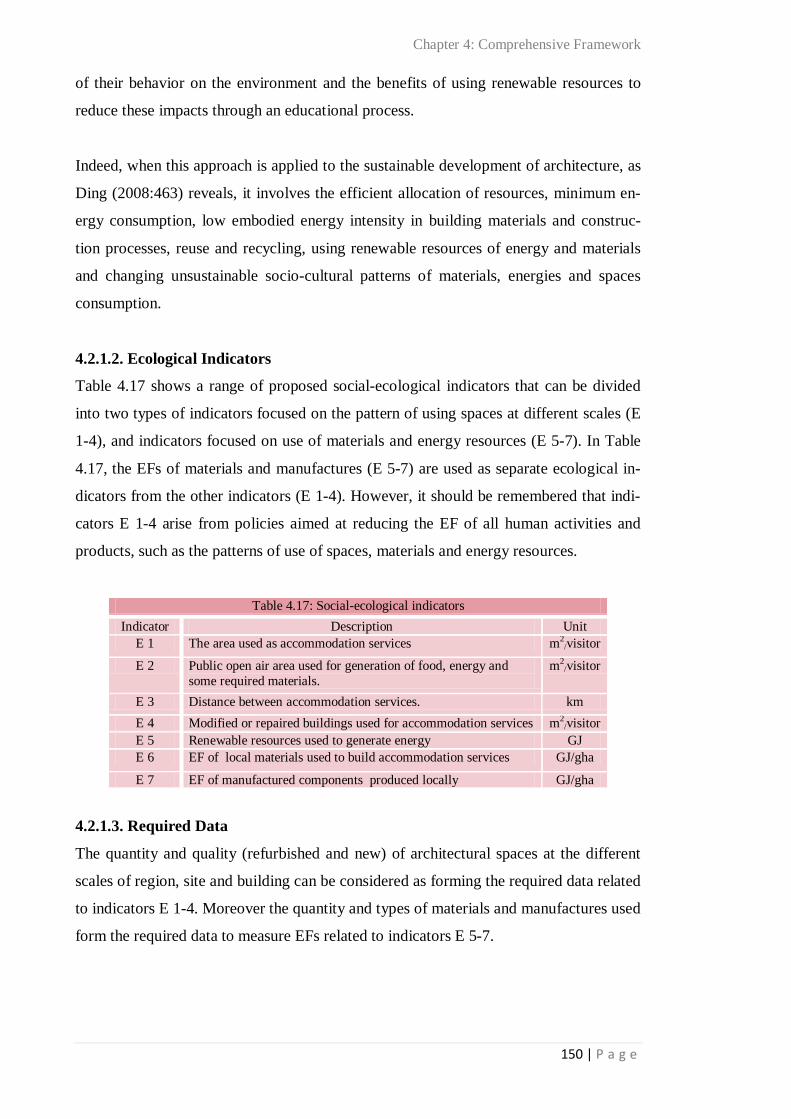
Figure 4.11: Cultural footprint (CF) model 144 Figure 4.12: CF model used for comparison between the CFs of two different Ecotourism ac-tivities
147
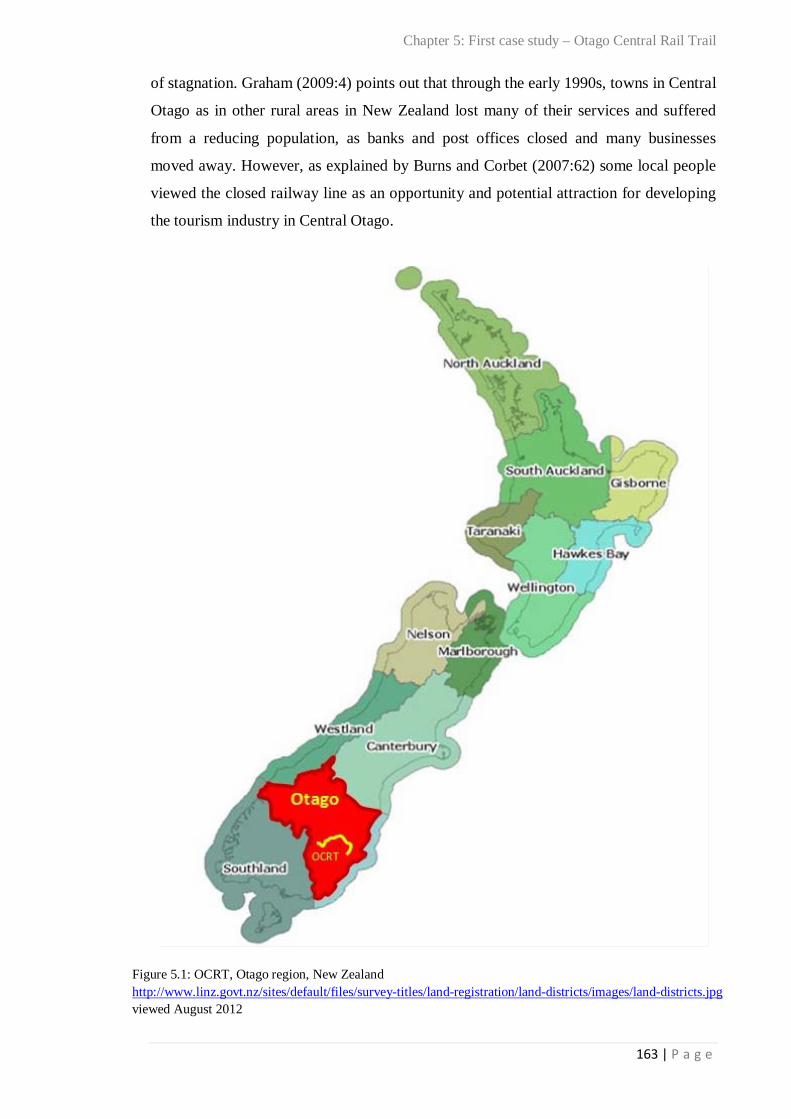
Figure 4.13: Structure of the comprehensive framework proposed in Chapter 4 157 Figure 5.1: OCRT, Otago region, New Zealand http://www.linz.govt.nz/sites/default/files/survey-titles/land-registration/land-districts/images/land-districts.jpg viewed August 2012
163
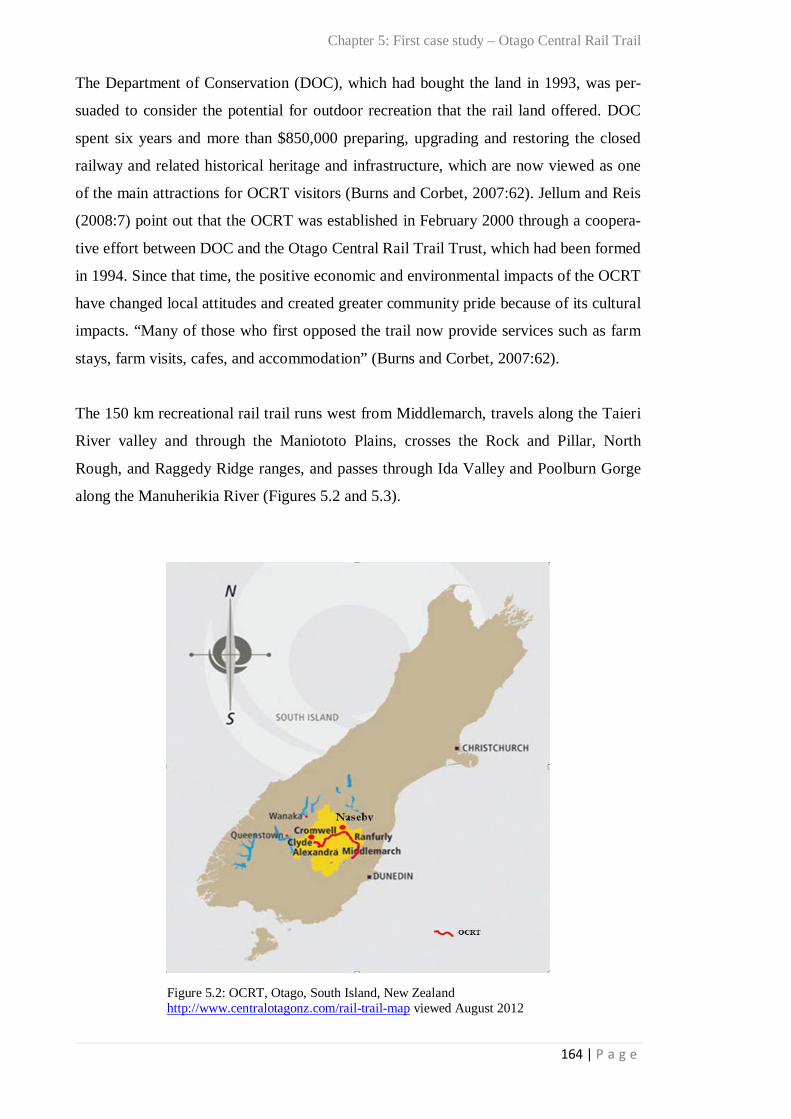
Figure 5.2: OCRT, Otago, South Island, New Zealand http://www.centralotagonz.com/rail-trail-map viewed August 2012
164
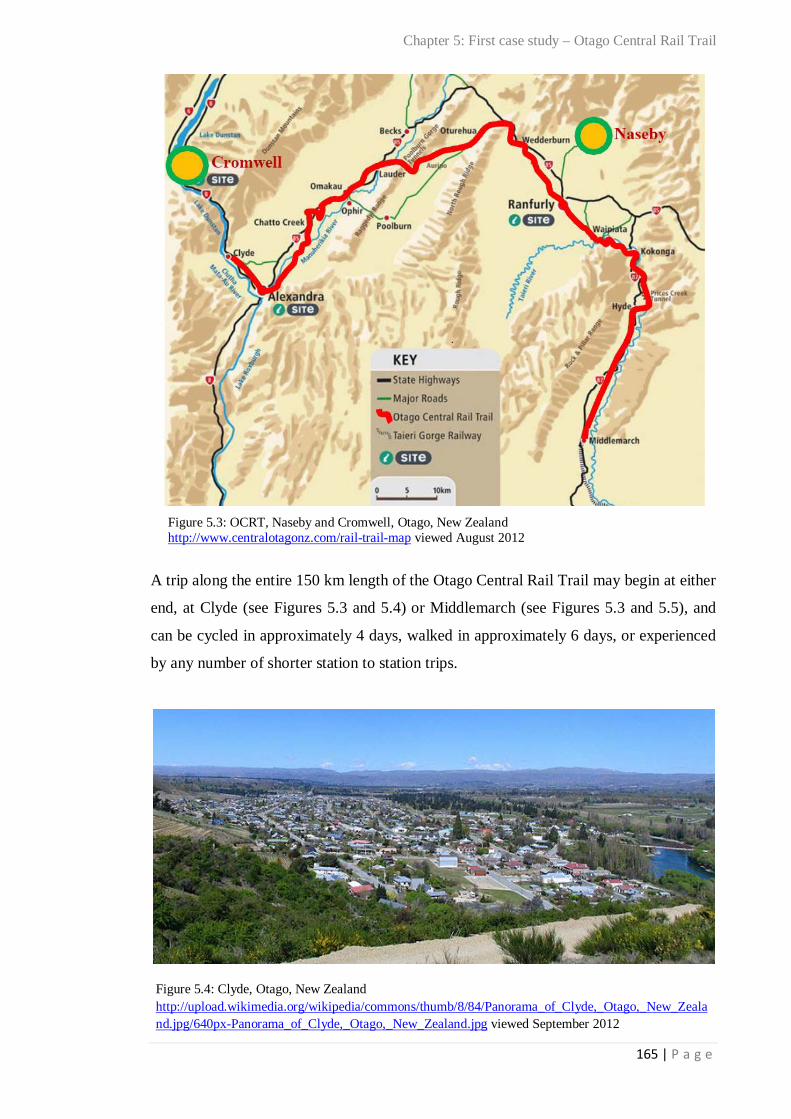
Figure 5.3: OCRT, Naseby and Cromwell, Otago, New Zealand http://www.centralotagonz.com/rail-trail-map viewed August 2012
165
Figure 5.4: Clyde, Otago, New Zealand http://upload.wikimedia.org/wikipedia/commons/thumb/8/84/Panorama_of_Clyde,_Otago,_NewZealand.jpg/640px-Panorama_of_Clyde,_Otago,_New_Zealand.jpg viewed September 2012
165
Figure 5.5: Middlemarch, Otago, New Zealand http://www.otagorailtrail.co.nz/index.php?option=com_content&task=view&id=26&Itemid=57#photos1 viewed August 2012
166
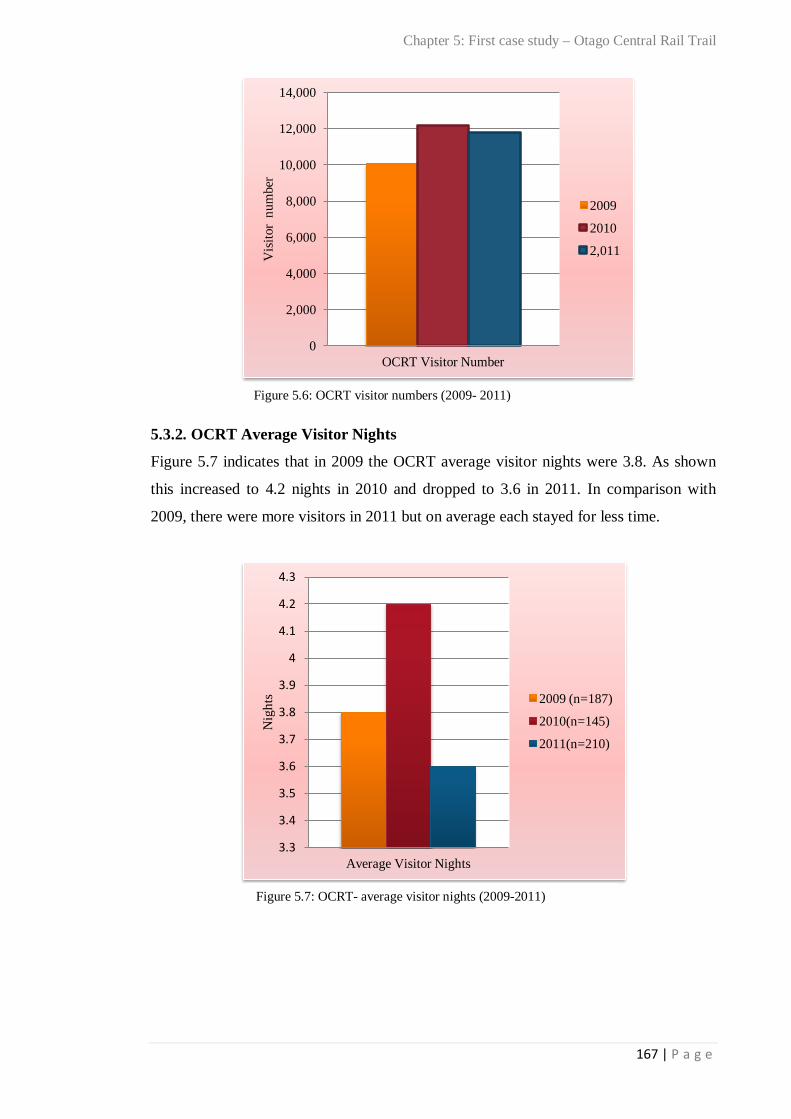
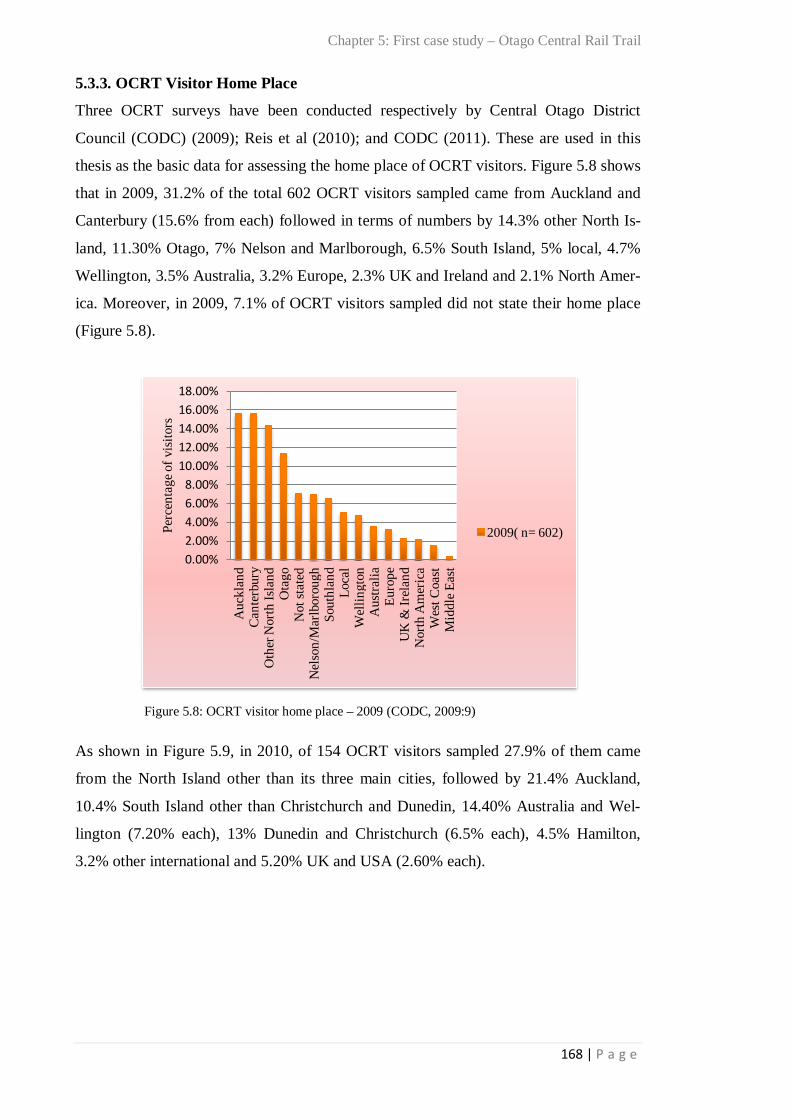
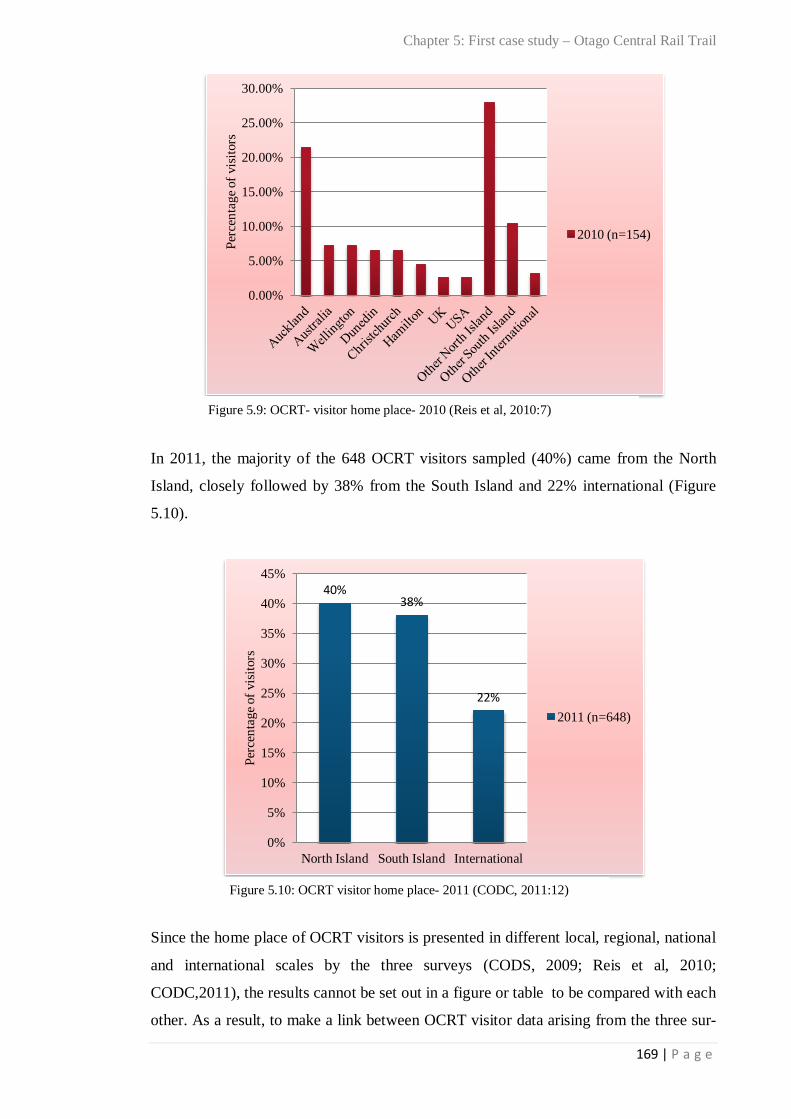
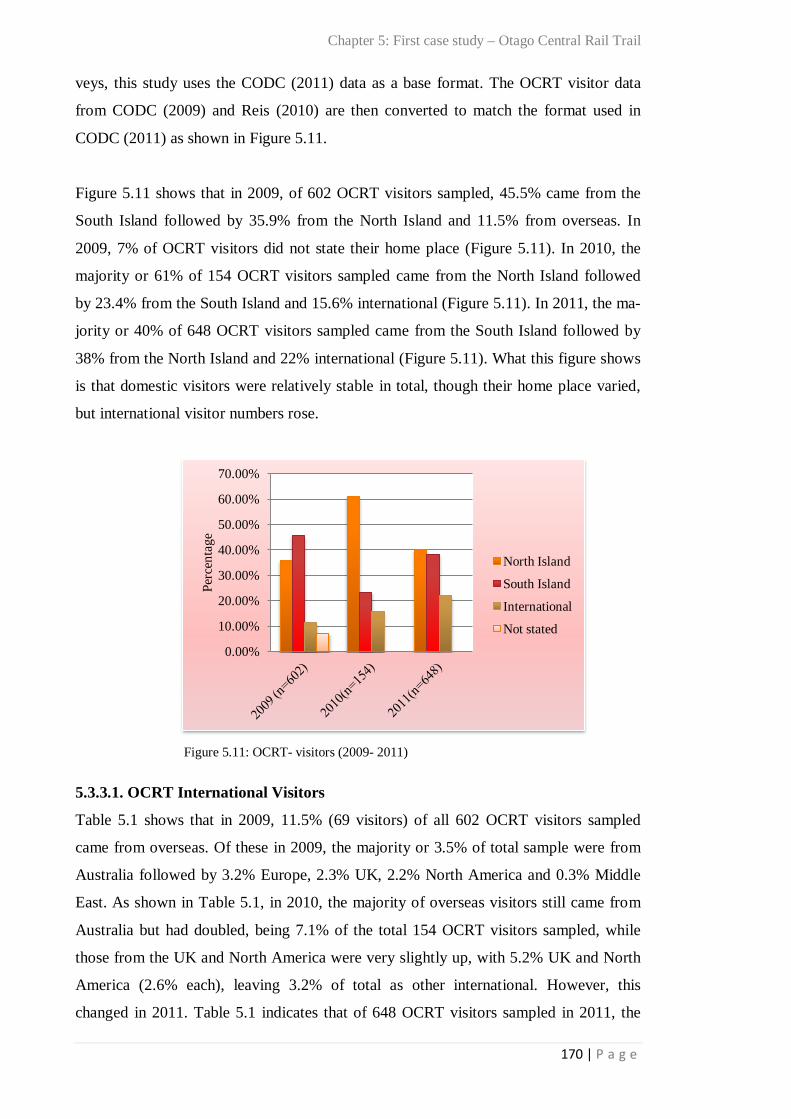
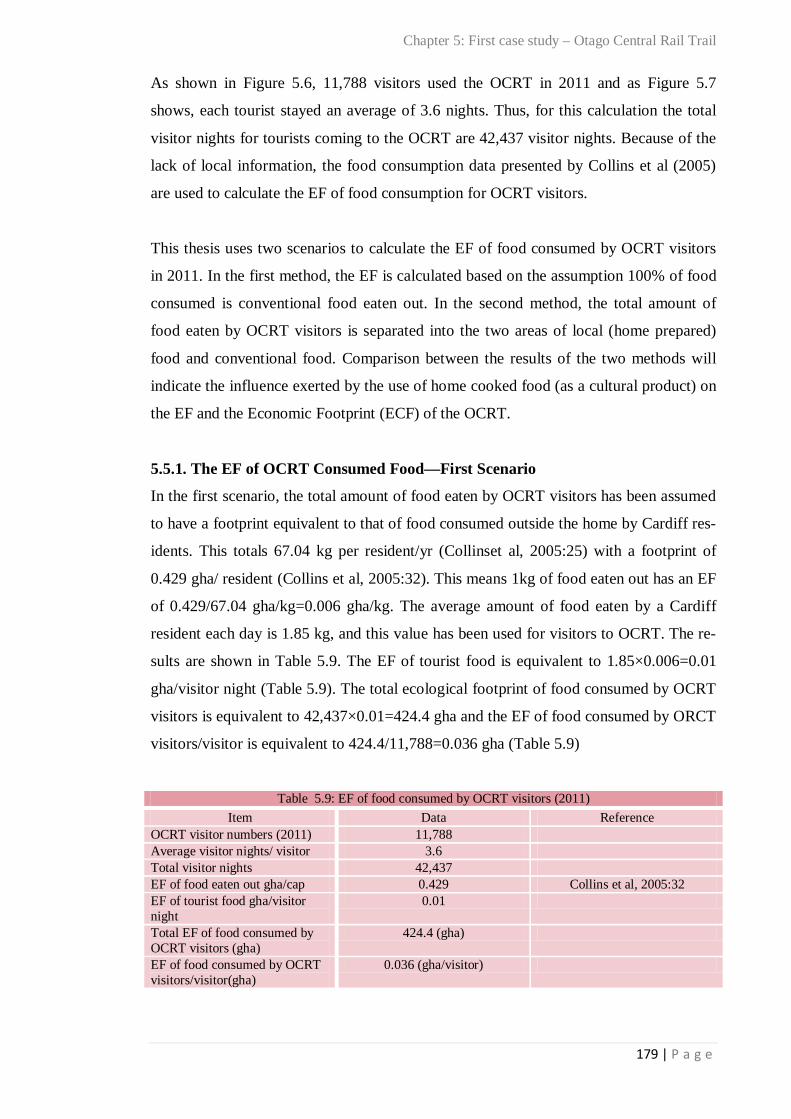
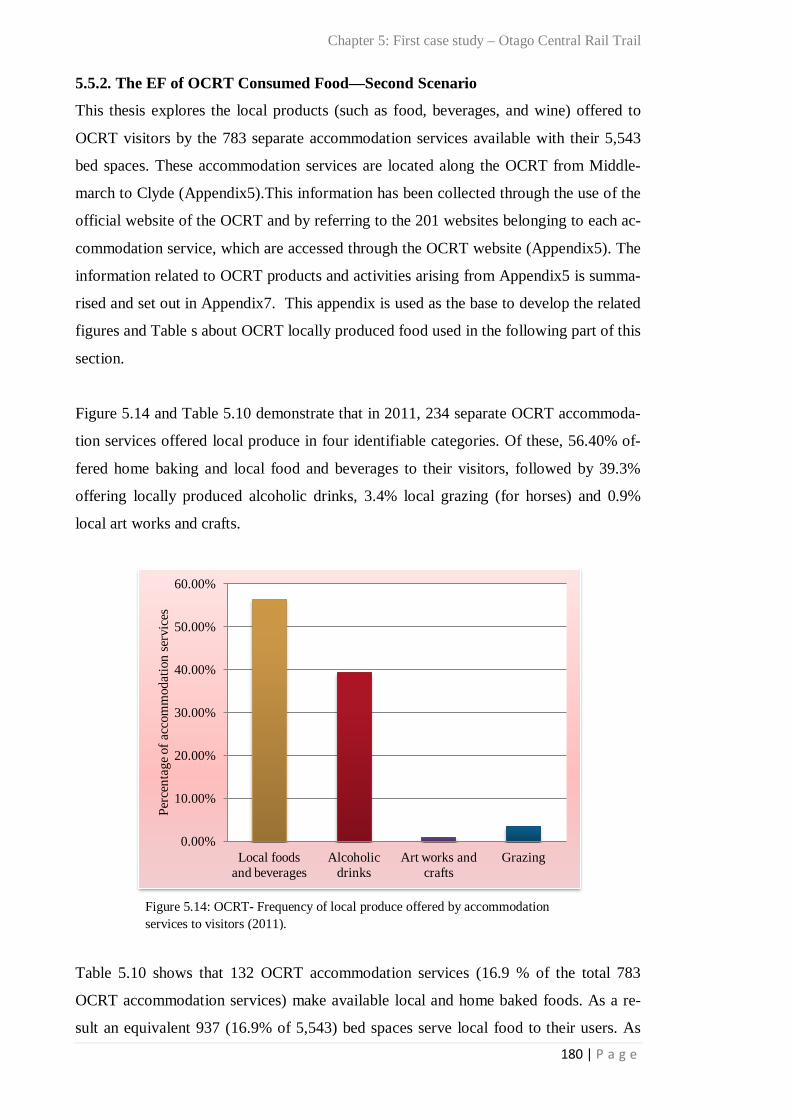
Figure 5.6: OCRT visitor numbers (2009-2011) 167 Figure 5.7: OCRT- average visitor nights (2009-2011) 167 Figure 5.8: OCRT visitor home place – 2009 168 Figure 5.9: OCRT- visitor home place- 2010 169 Figure 5.10: OCRT visitor home place- 2011 169 Figure 5.11: OCRT- visitors (2009-2011) 170 Figure 5.12: OCRT- domestic visitors (2009-2011) 172 Figure 5.13: OCRT- domestic and international visitors (2011) 173 Figure 5.14: OCRT- Frequency of local produce offered by accommodation services to visitors (2011)
180
Figure 5.15: OCRT- Percentage of type and available bed spaces by type of accommodation service
184
Figure 5.16: OCRT- RB and NB buildings used as accommodation services 186 Figure 5.17: OCRT- RB and NB accommodation services – available bed spaces (2011) 186 Figure 5 18: OCRT- number of RB and NB accommodation services 187 Figure 5.19: OCRT- capacity of RB and NB accommodation services – total capacity =5,543bed spaces (2011)
187
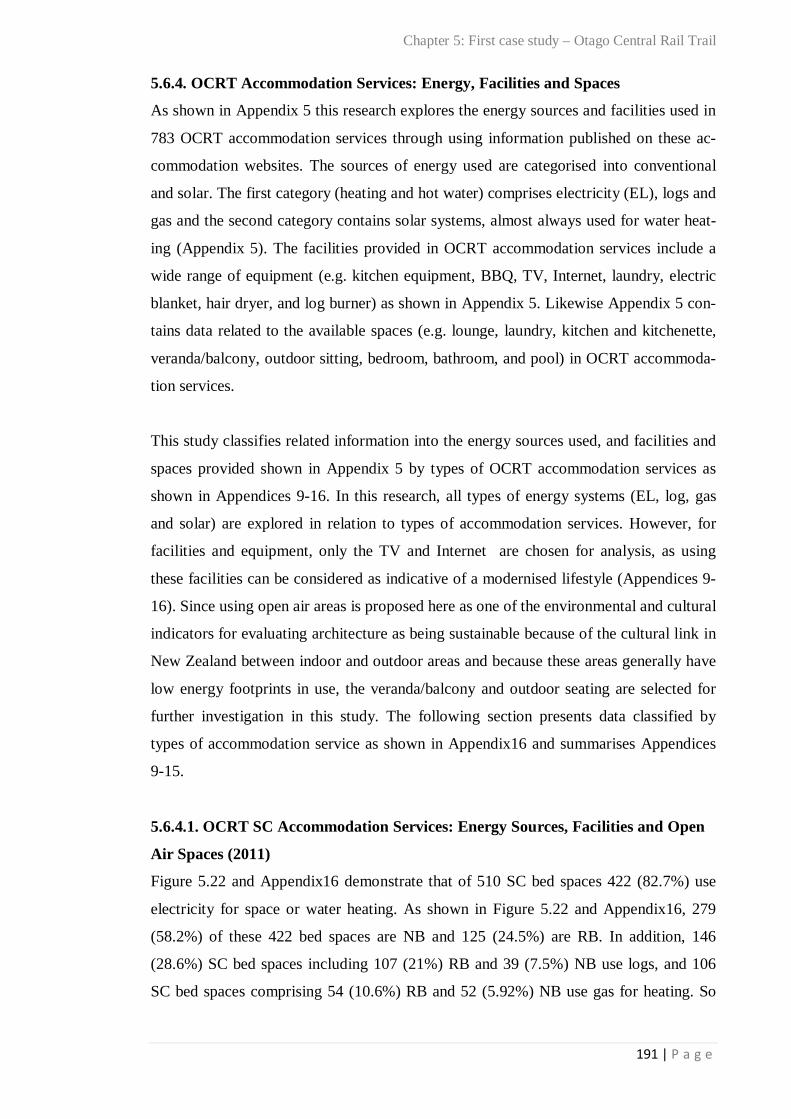
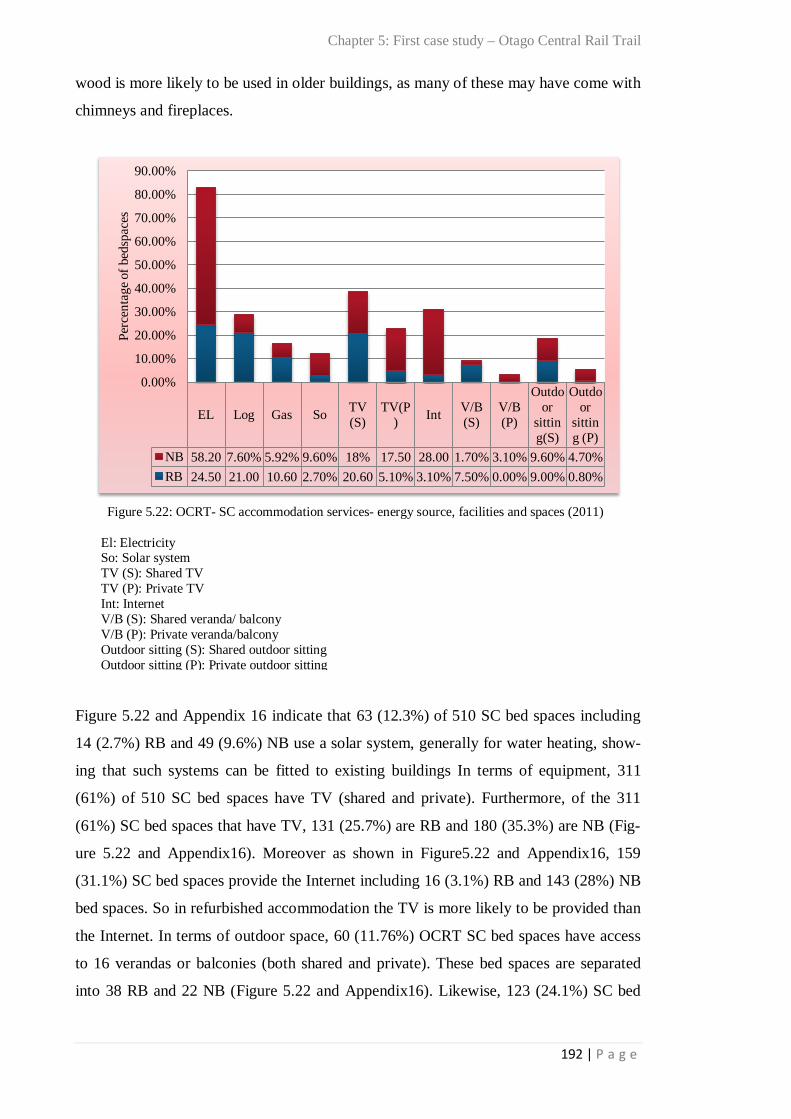
Figure 5.20: OCRT- accommodation – bed spaces by type of materials used 189 Figure 5.21: OCRT- accommodation services- materials used by type of accommodation (2011) 190 Figure 5.22: OCRT- SC accommodation services- energy source, facilities and spaces (2011) 192 Figure 5.23: OCRT- B&B accommodation services- energy sources, facilities and spaces (2011)
193
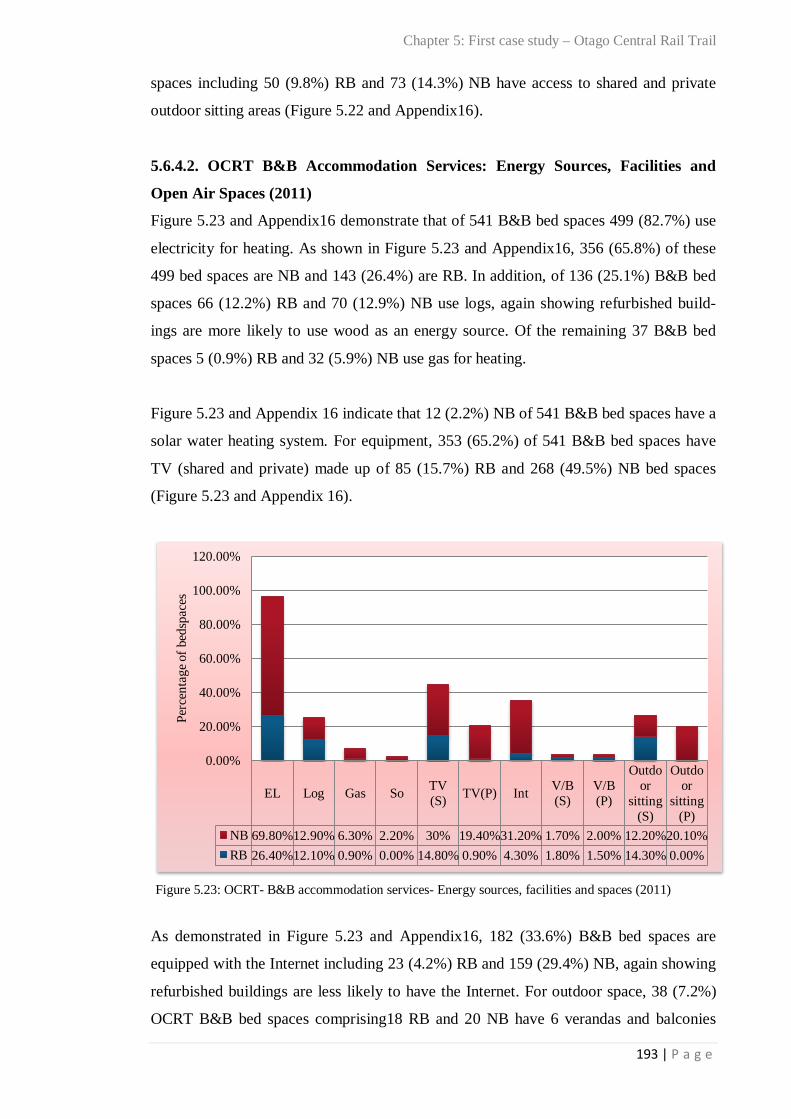
Figure 5.24: OCRT- Bp accommodation services- energy sources and facilities (2011) 194 Figure 5.25: OCRT- Motel accommodation services- energy sources and facilities (2011) 195 Figure 5.26: OCRT- Homestead accommodation services- energy sources and facilities (2011) 196 Figure 5.27: OCRT- Hotel accommodation services- energy sources and facilities (2011) 197 Figure 5.28: OCRT- Camping site accommodation services- energy sources and facilities (2011)
198
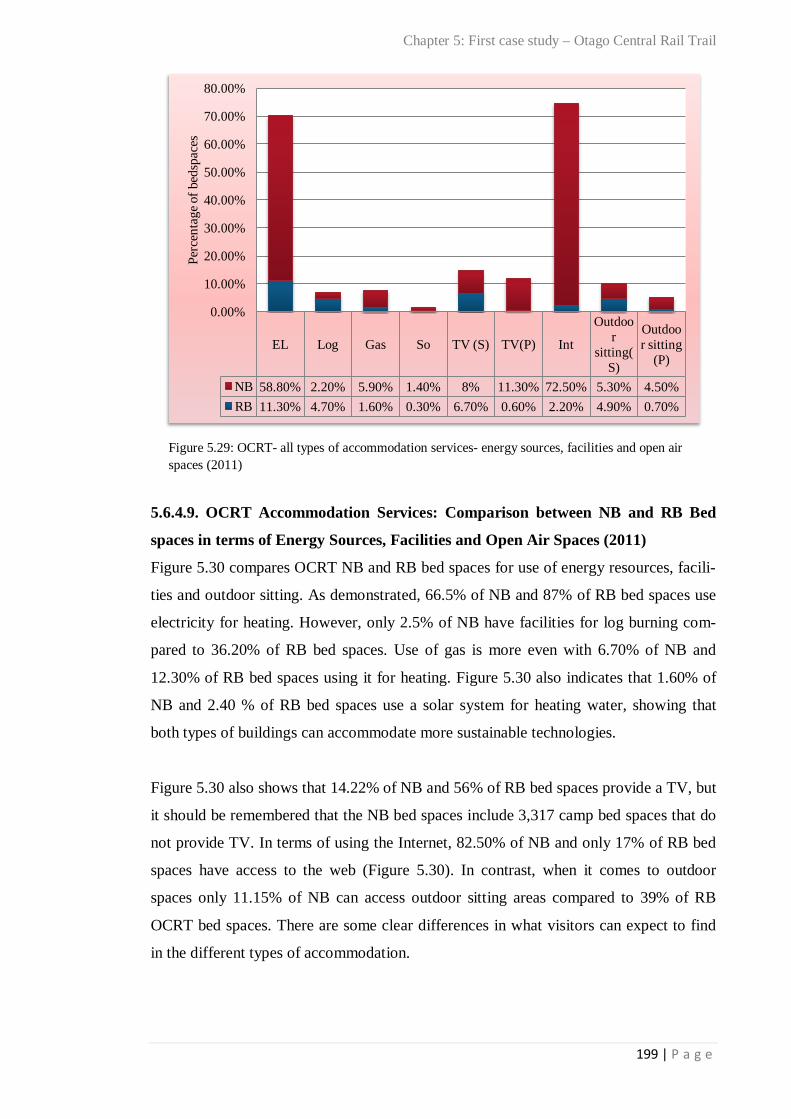
Figure 5.29: OCRT- All types of accommodation services- energy sources, facilities and open air spaces (2011)
199
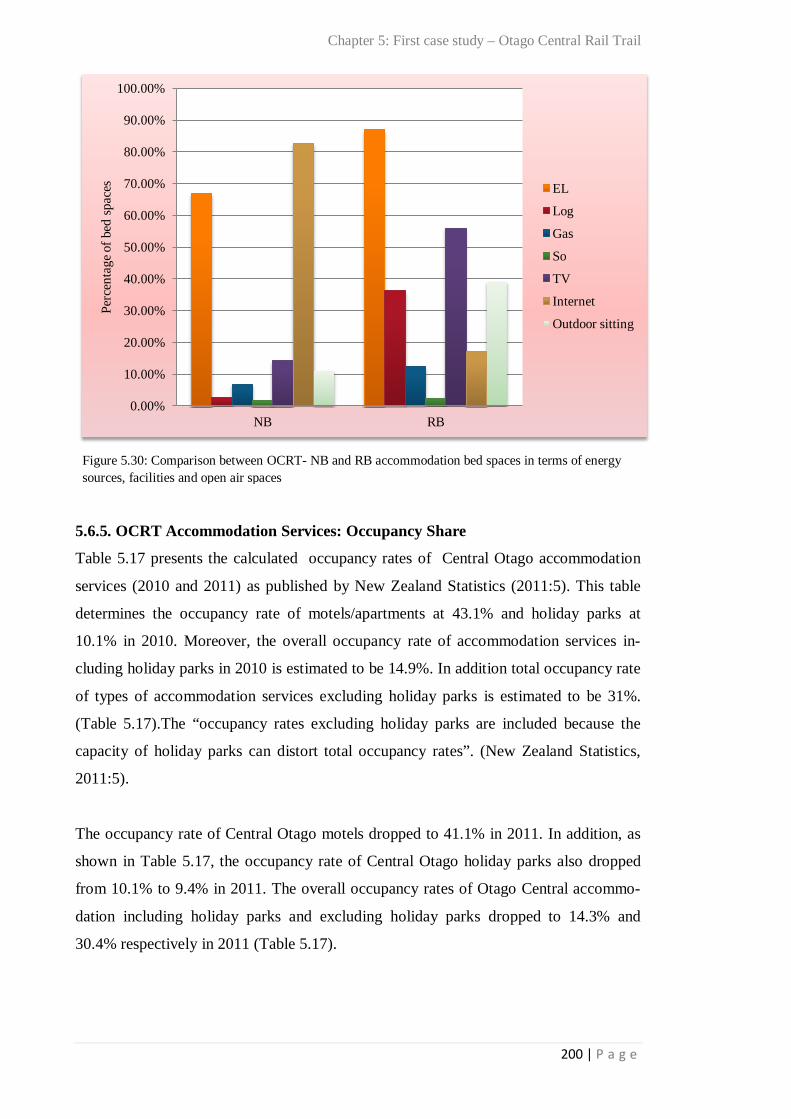
Figure 5.30: Comparison between OCRT- NB and RB accommodation bed spaces in terms of energy sources, facilities and open air spaces
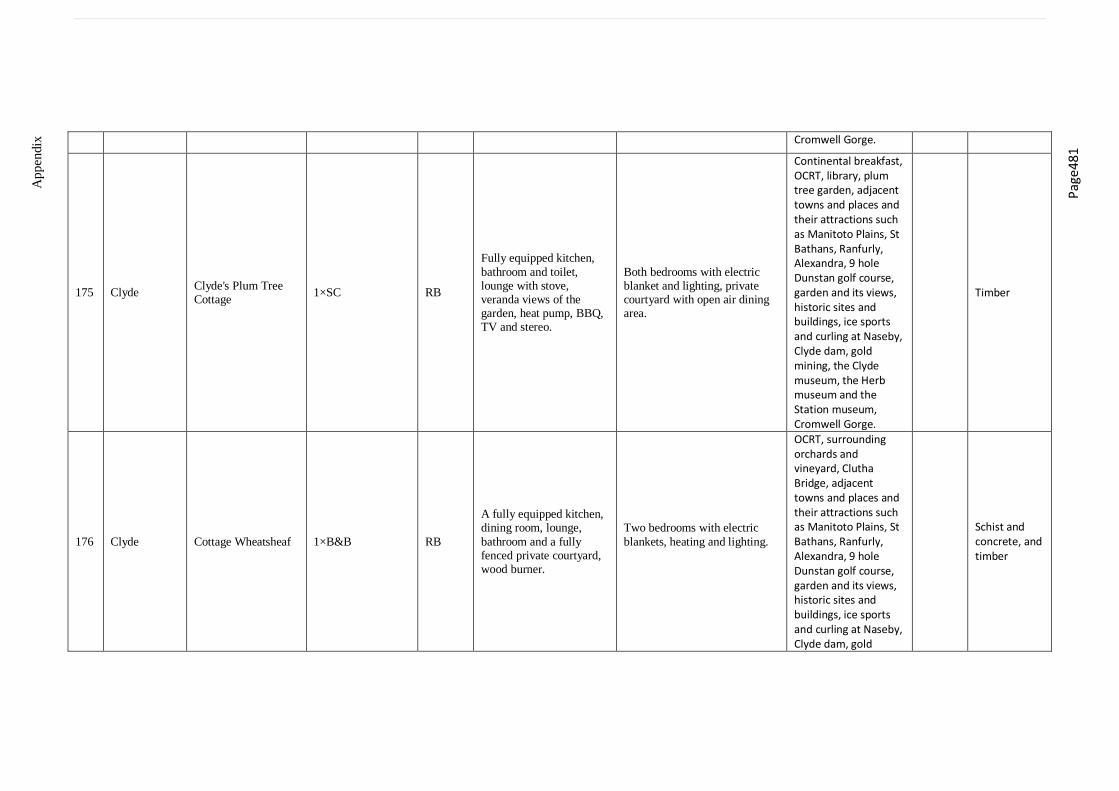
200
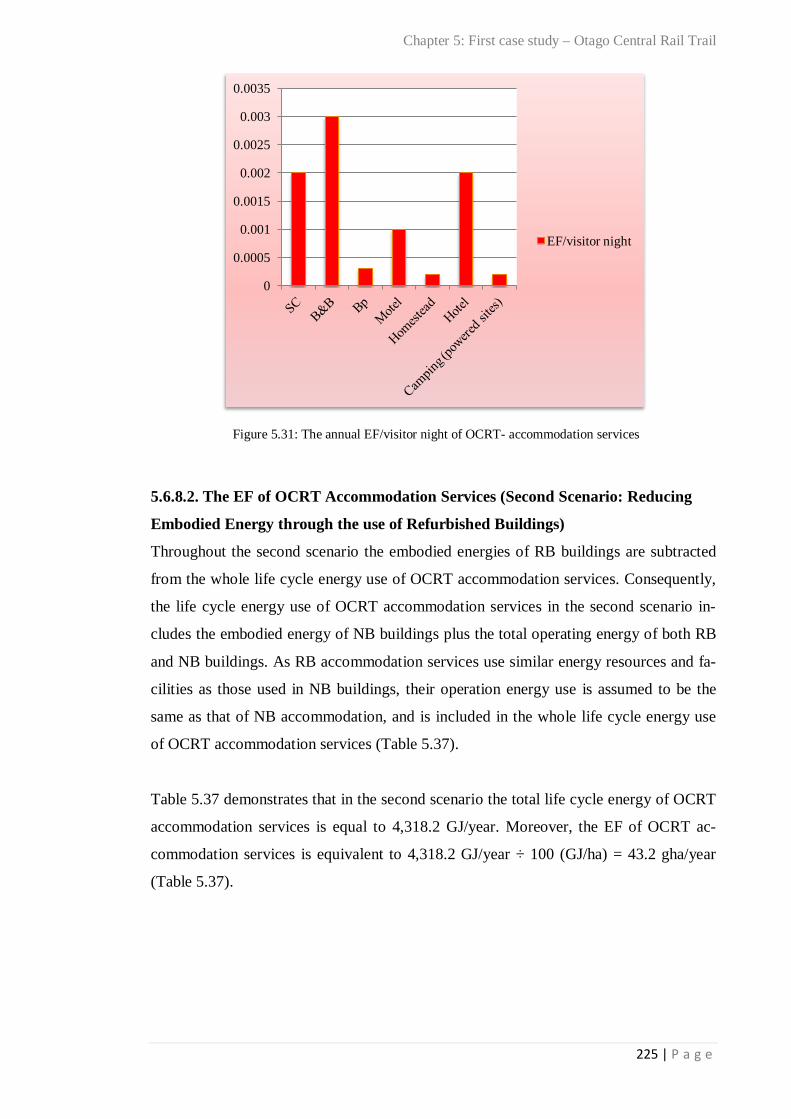
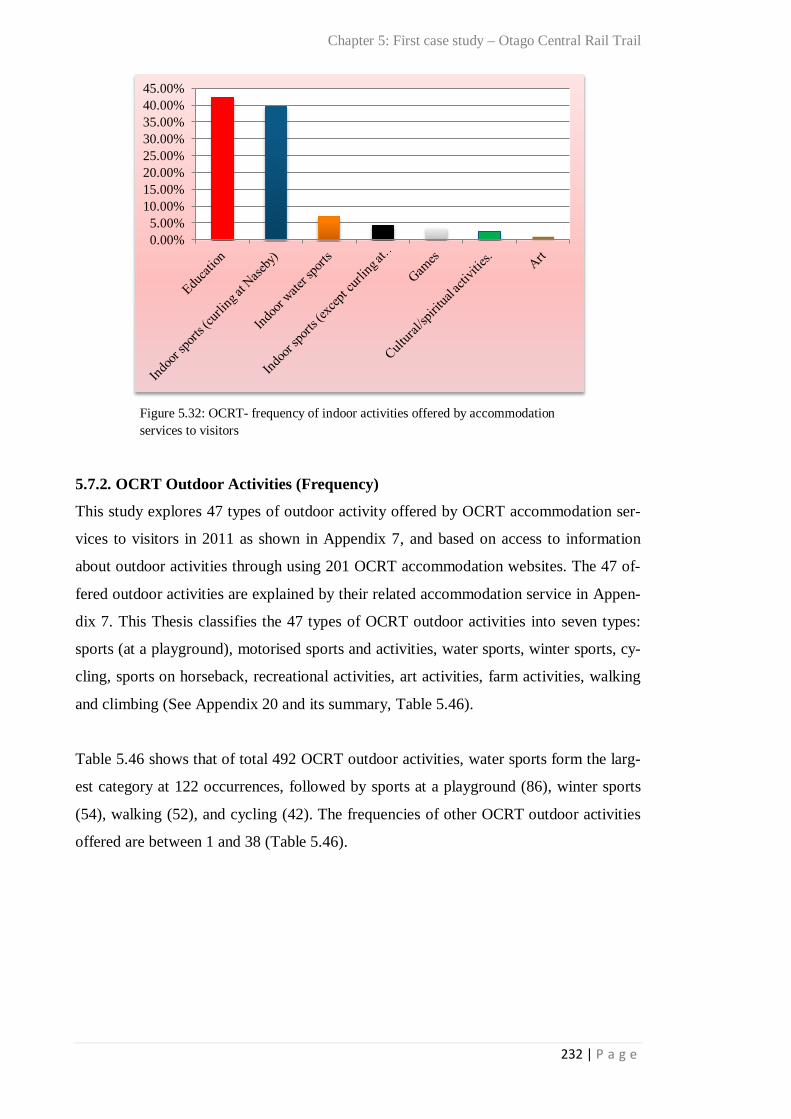
Figure 5.30.a: Embodied energy of OCRT- types of construction (2011) 214 Figure 5.31: The annual EF/visitor night of OCRT- accommodation services 225 Figure 5.32: OCRT- frequency of indoor activities offered by accommodation services to visi-tors
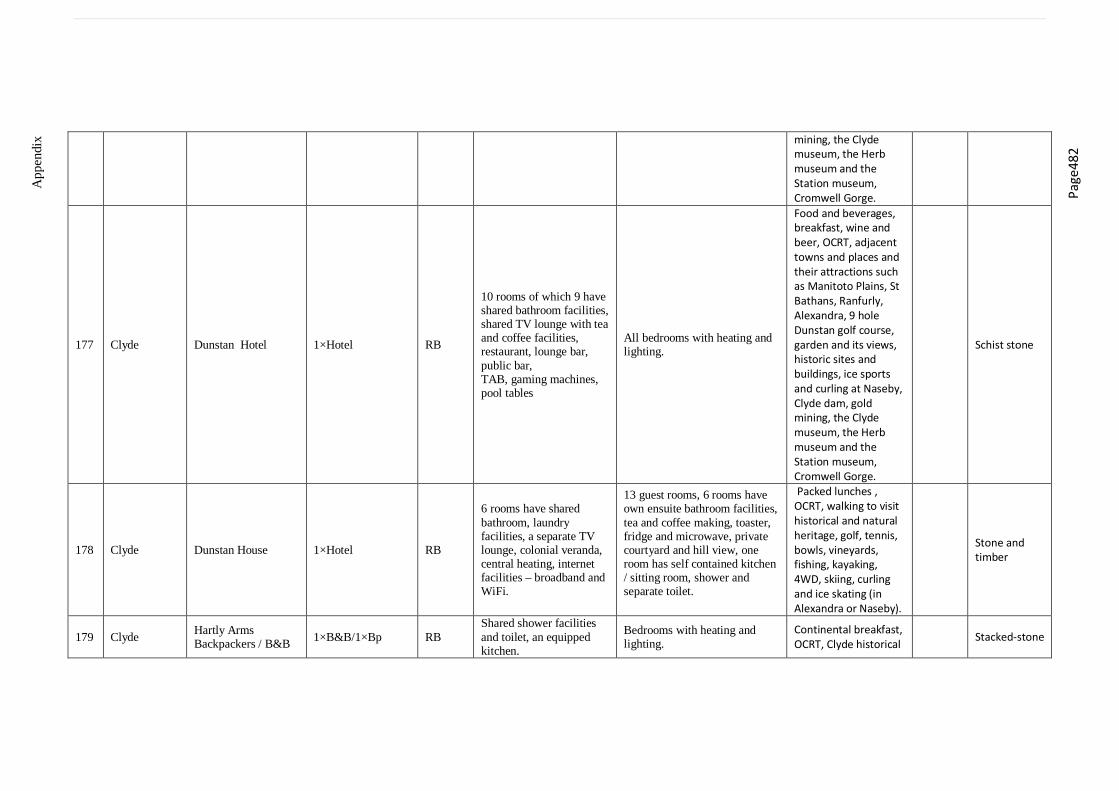
232
Figure 5.33: Percentage frequencies of OCRT outdoor activities offered by accommodation services to visitors (2011)
233
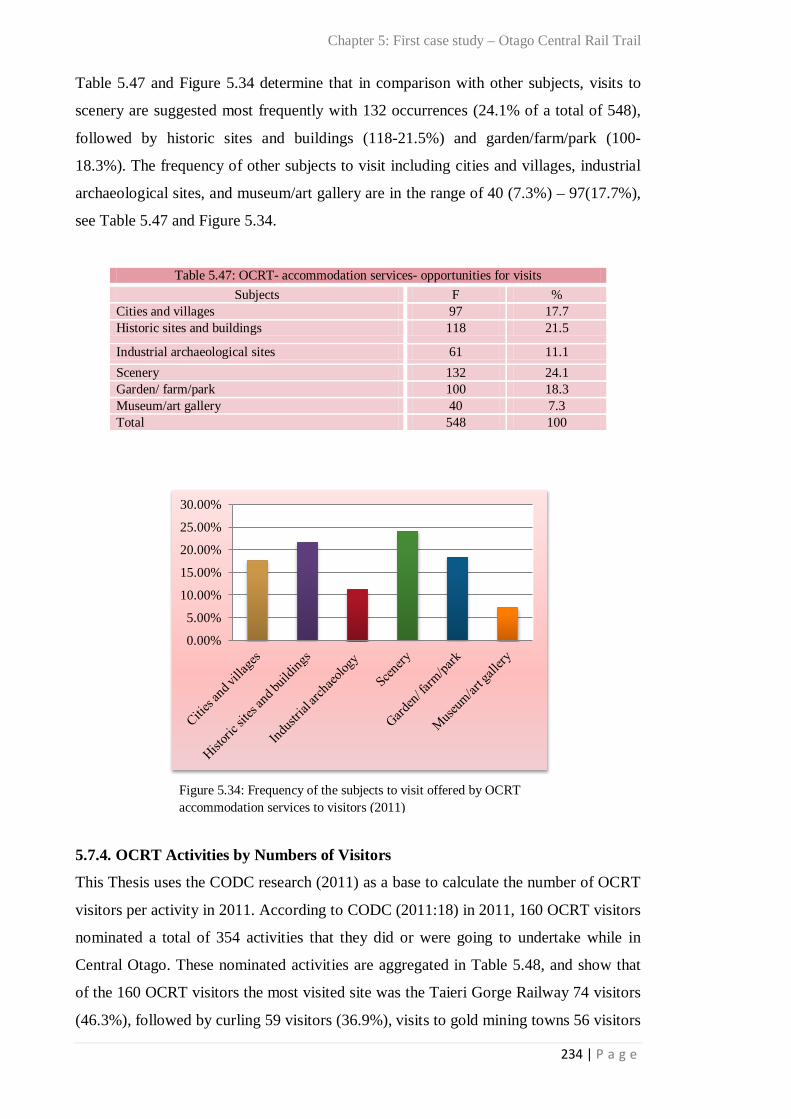
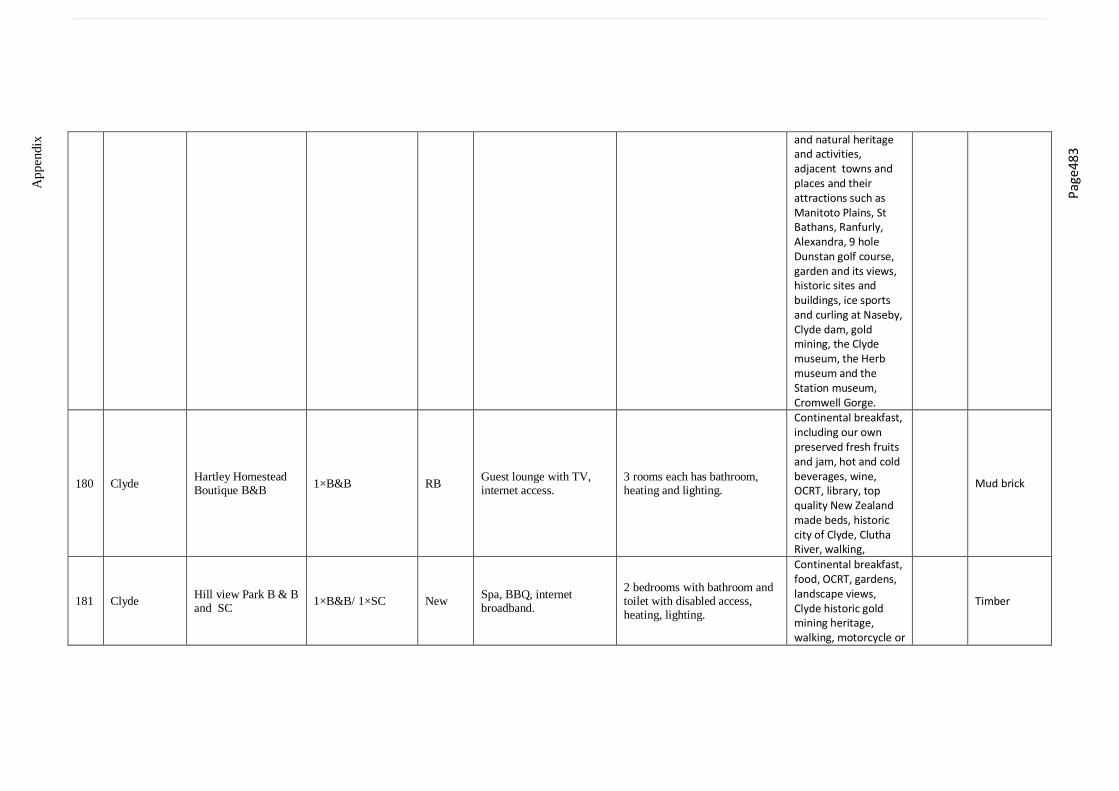
Figure 5.34: Frequency of the subjects to visit offered by OCRT accommodation services to visitors (2011)
234
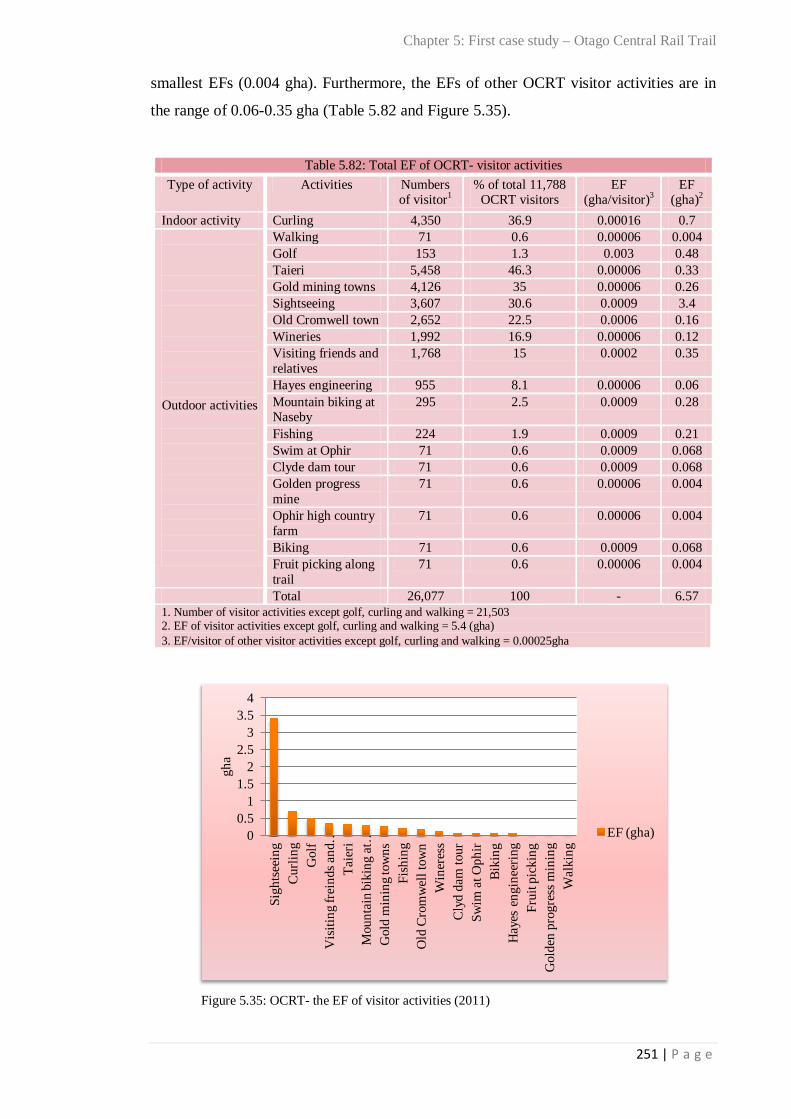
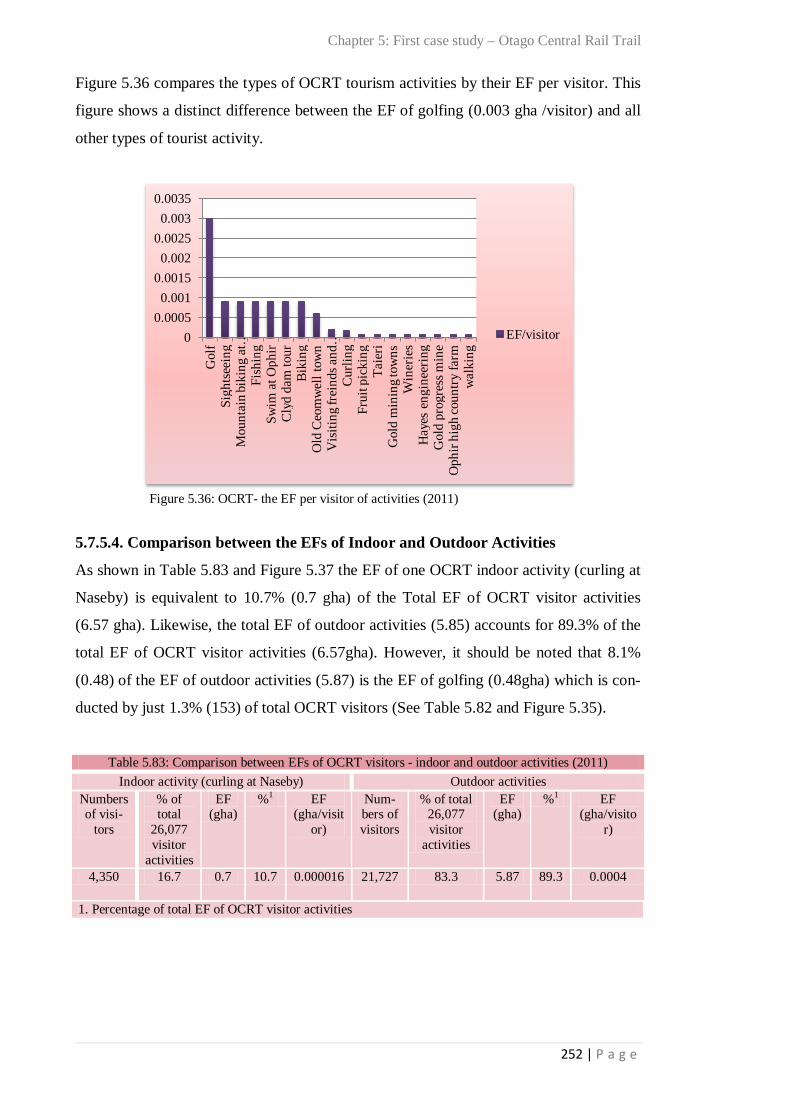
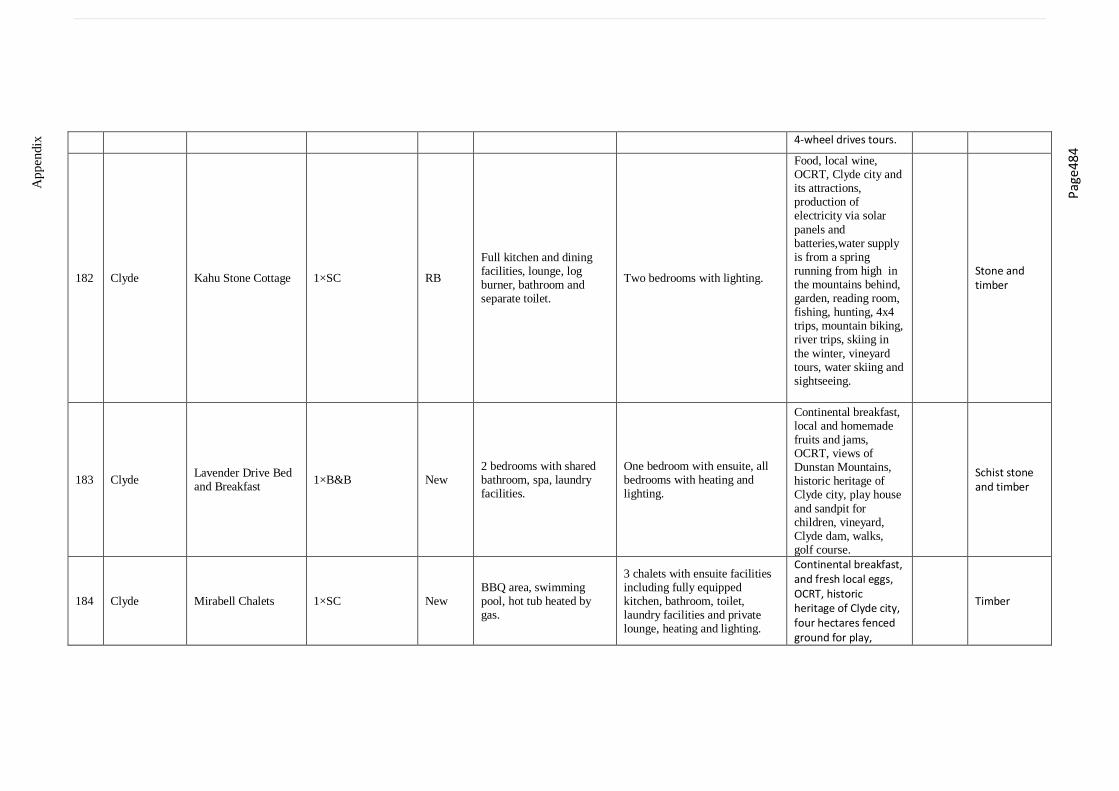
Figure 5.35: OCRT- the EF of visitor activities (2011) 251 Figure 5.36: OCRT- the EF per visitor of activities (2011) 252 Figure 5.37: comparison between the EF of OCRT visitor indoor and outdoor activities. 253
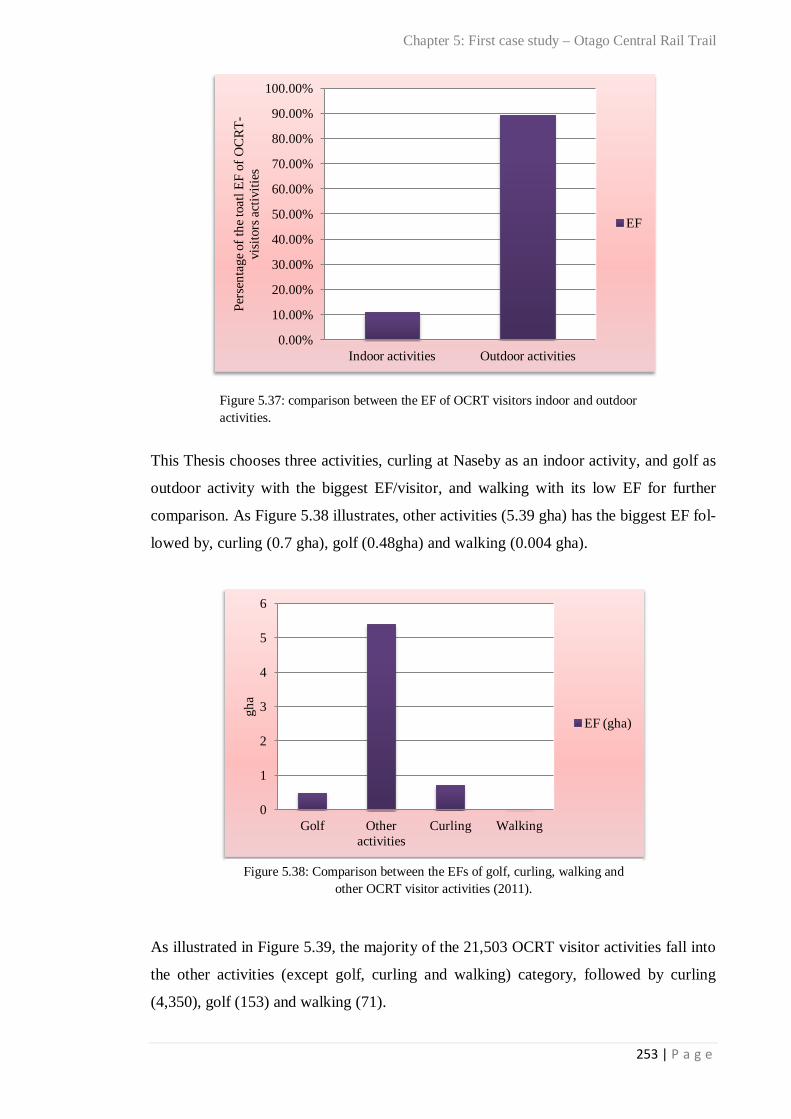
Figure 5.38: Comparison between the EFs of golf, curling, walking and other OCRT visitor activities (2011)
253
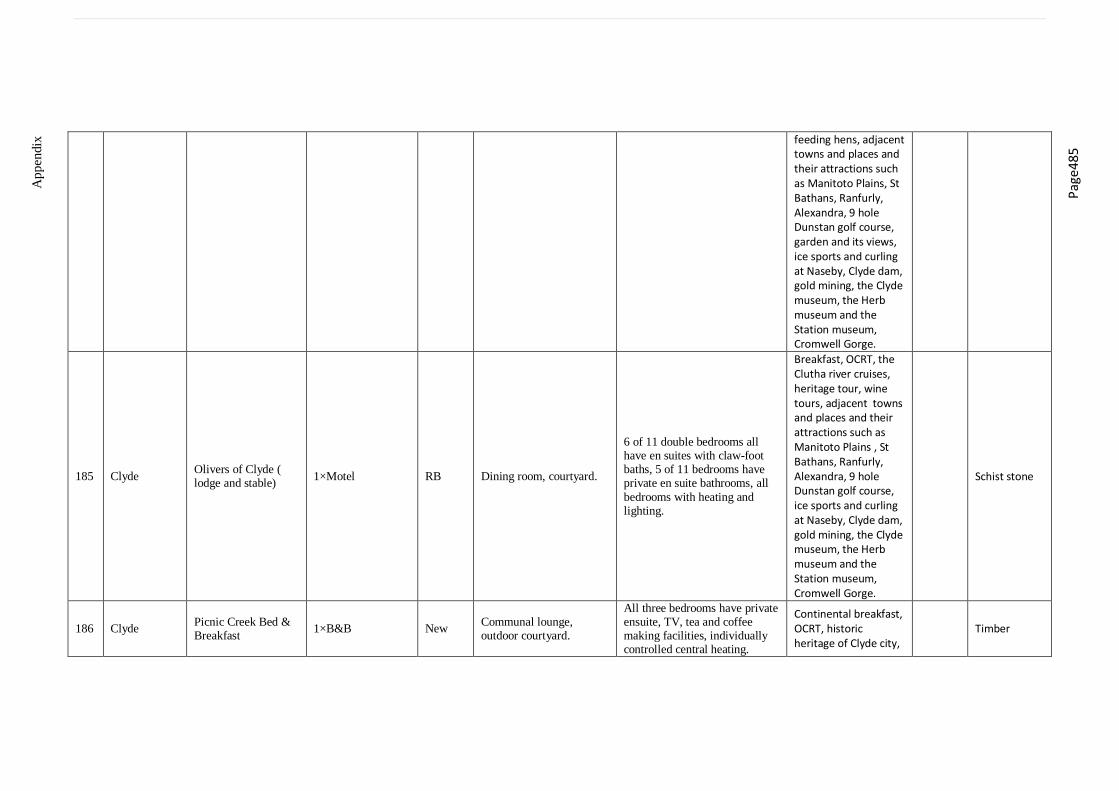
Figure 5.39: Comparison between the numbers of OCRT visitors who engage in golf, curling, walking and other activities (2011)
254
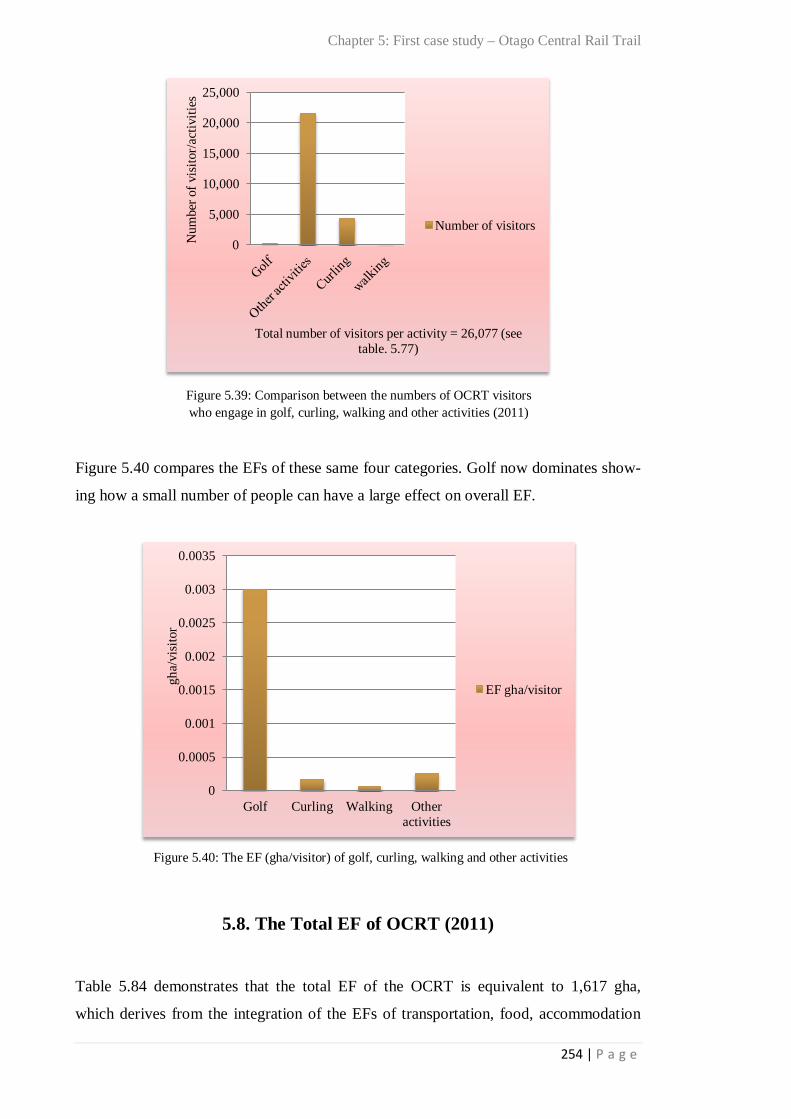
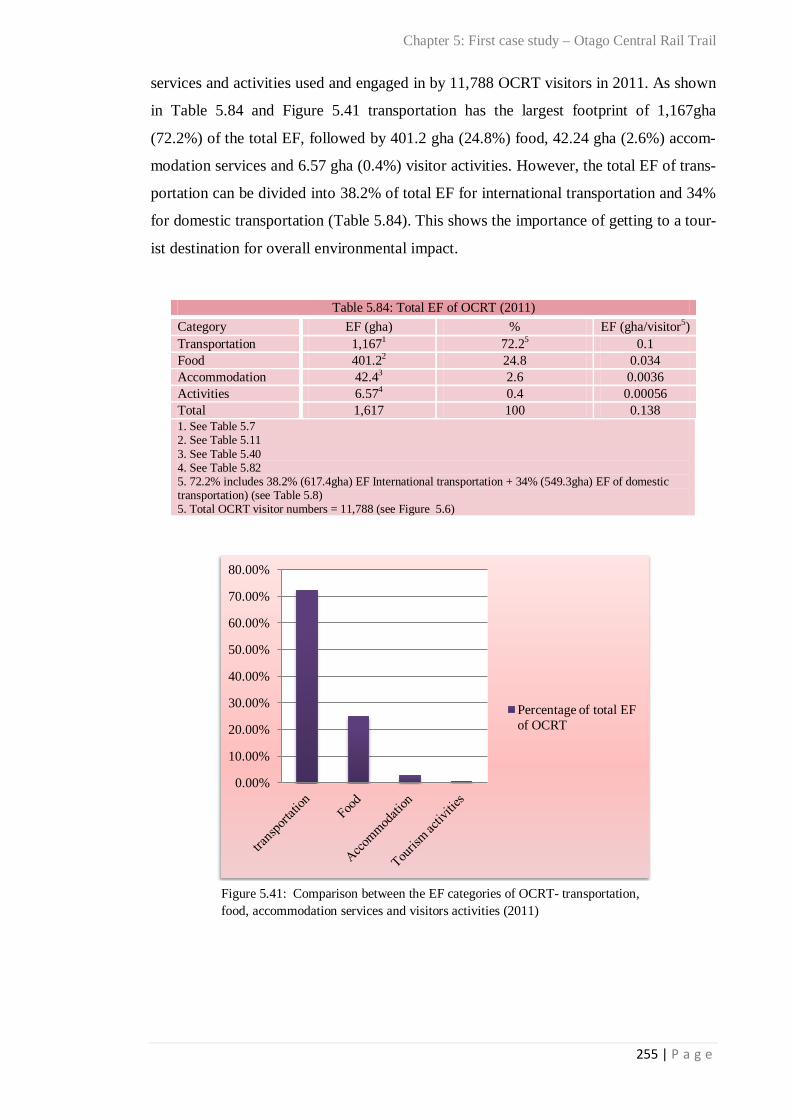
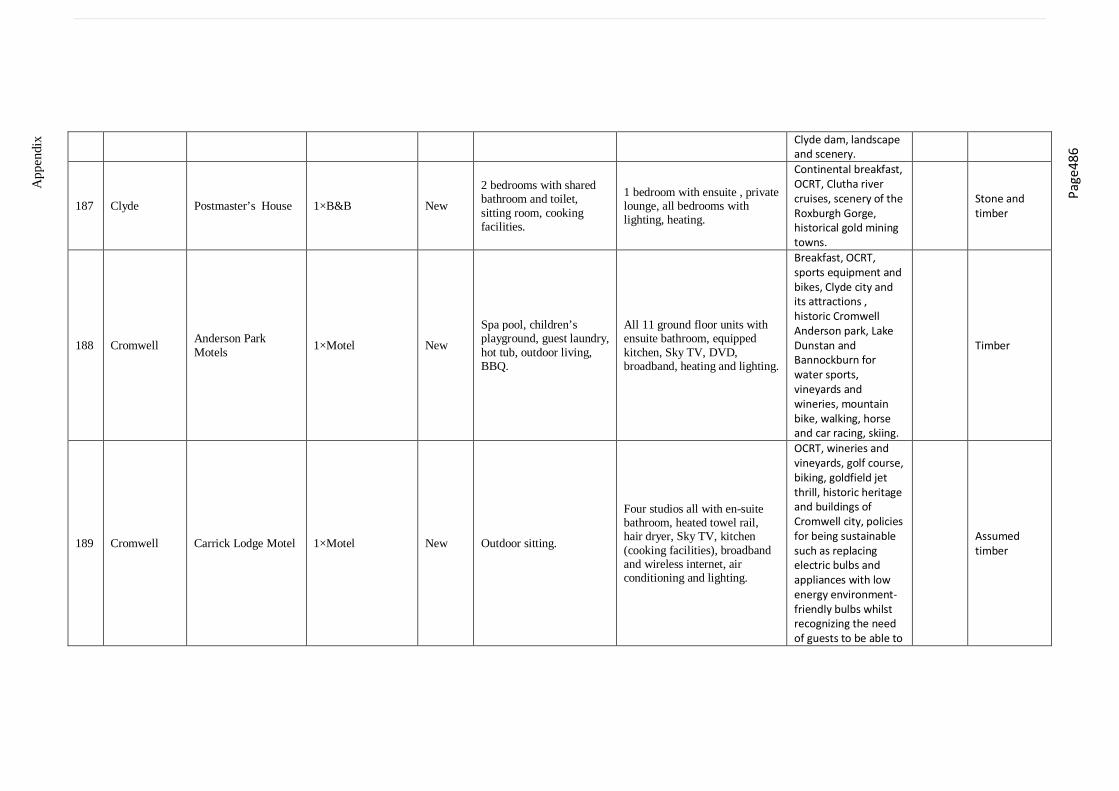
Figure 5.40: The EF (gha/visitor) of golf, curling, walking and other activities 254 Figure 5.41: Comparison between the EF categories of OCRT- transportation, food, accommo-dation services and visitors activities (2011)
255
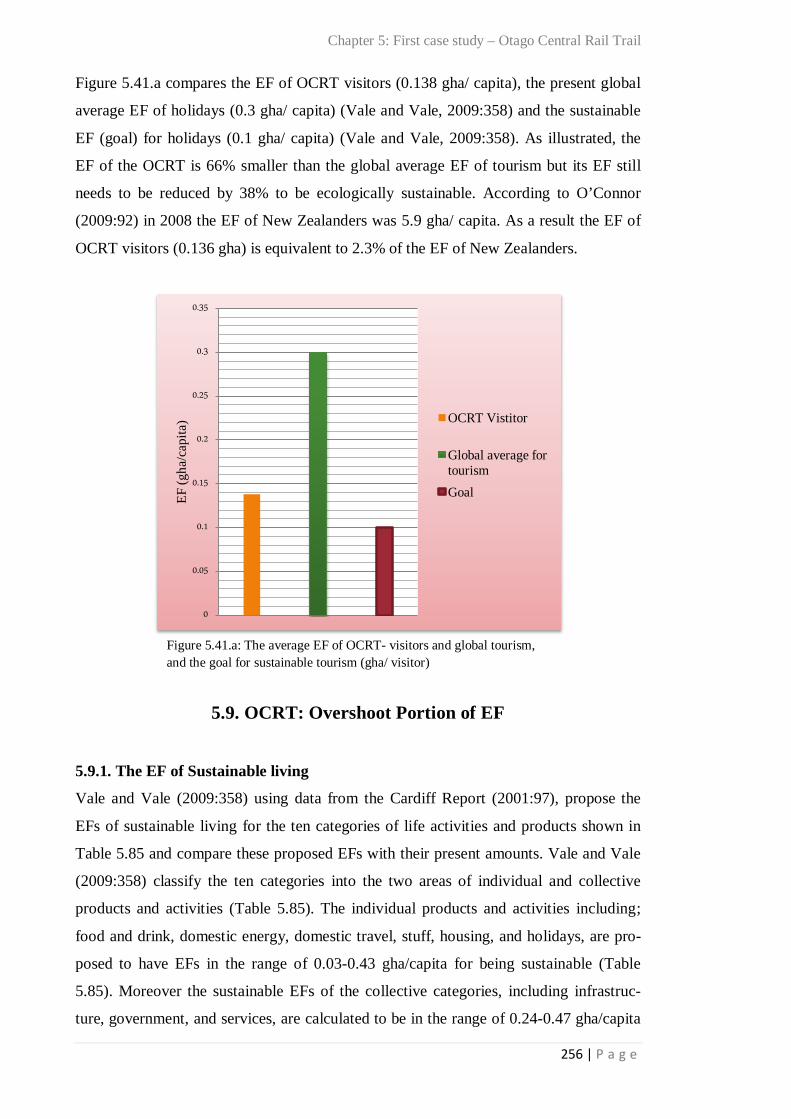
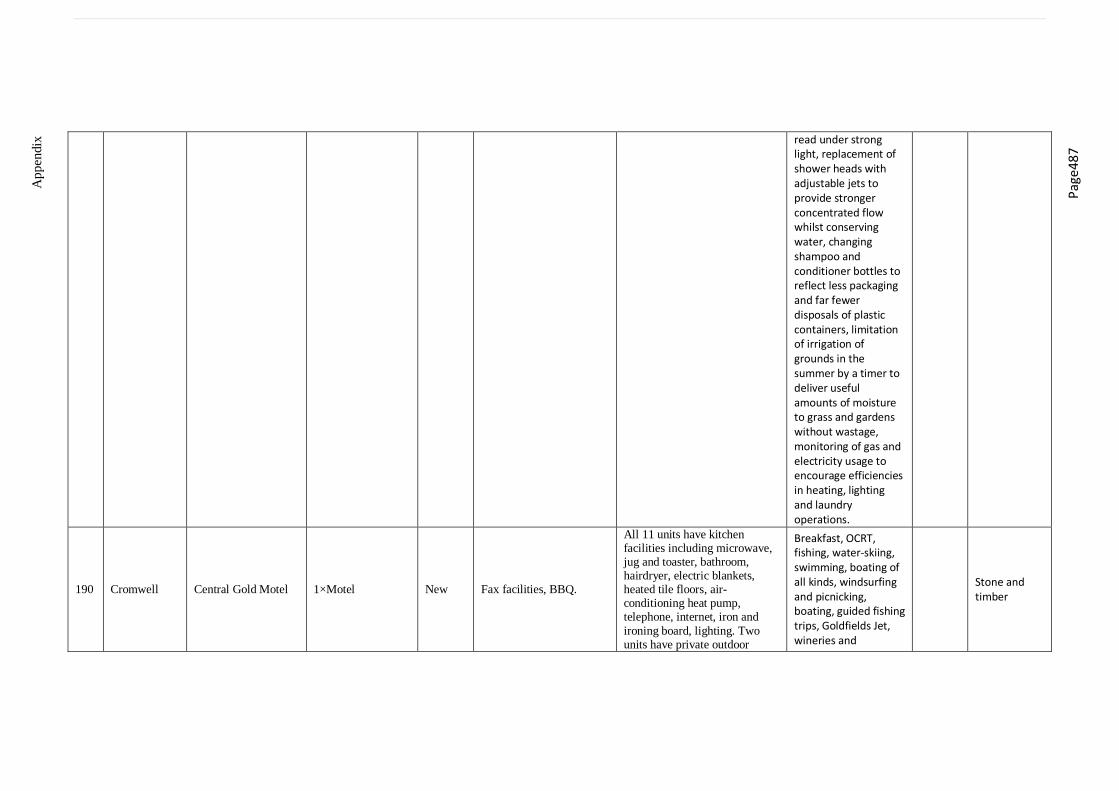
Figure 5.41.a: The average EF of OCRT- visitors and global tourism, and the goal for sustain-able tourism
256
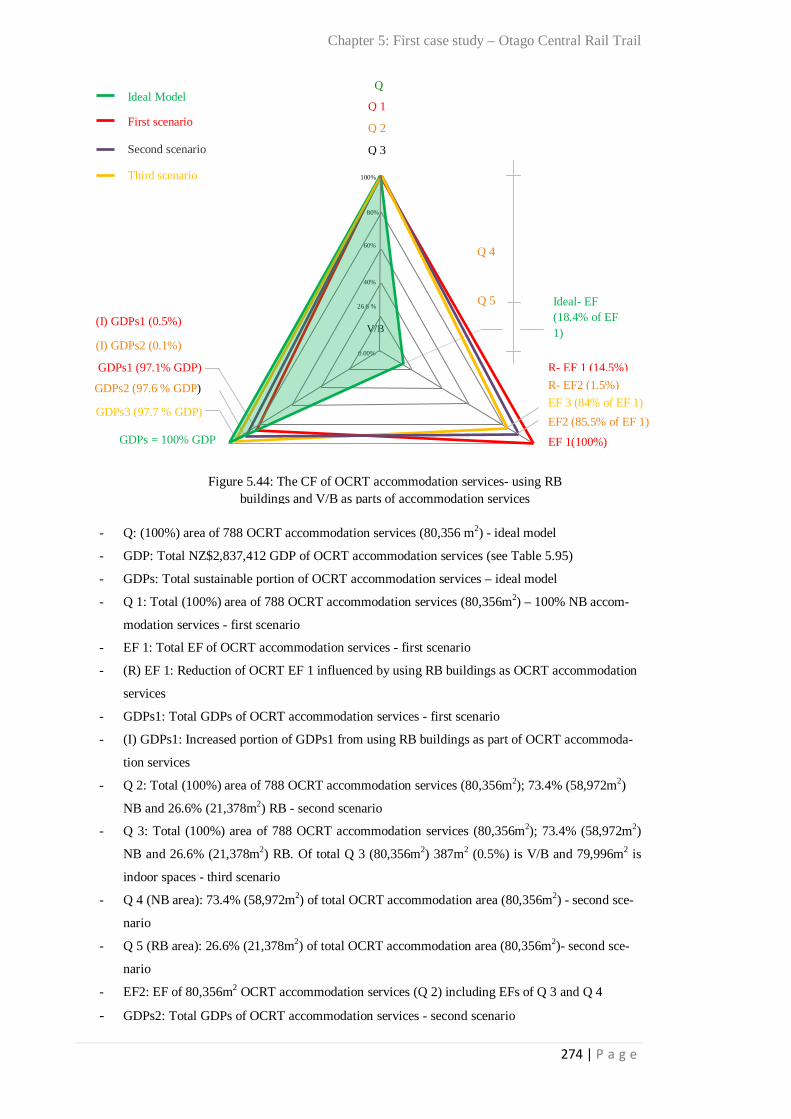
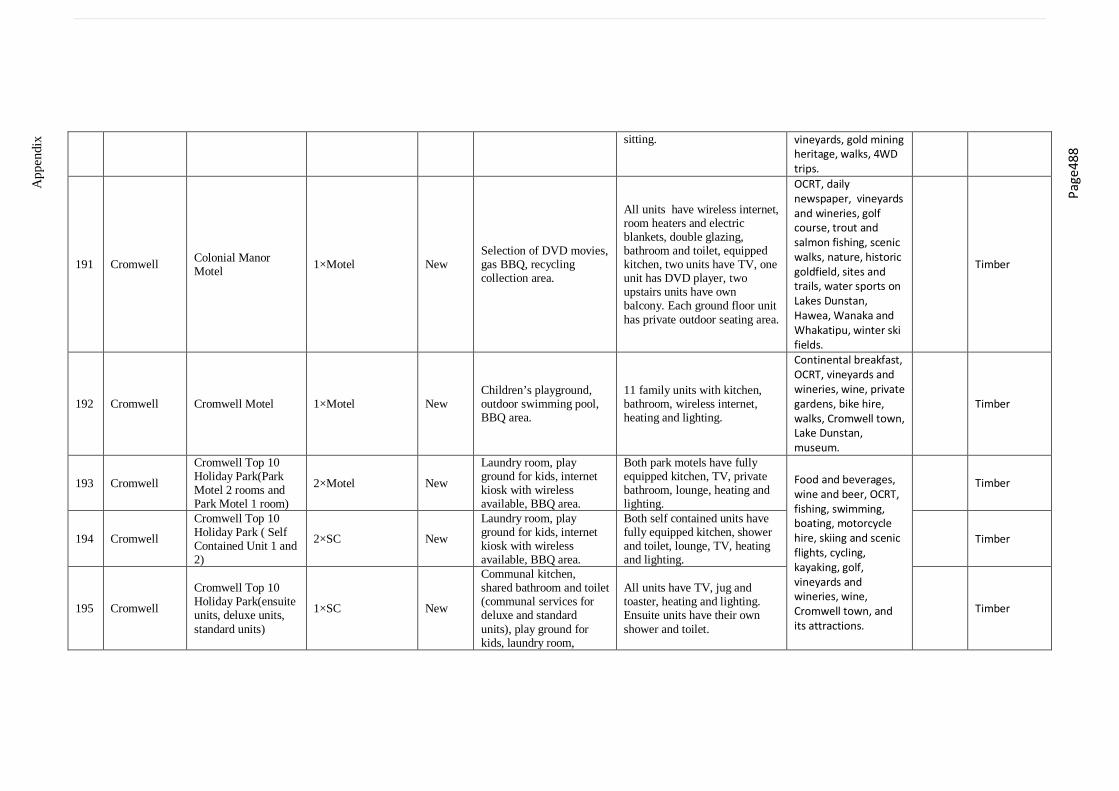
Figure 5.42: OCRT- GDP and GDPs 263 Figure 5.43: The cultural footprint (CF) of OCRT visitors’ food 267 Figure 5.44: The CF of OCRT accommodation services- using RB buildings and V/B as parts of accommodation services
274
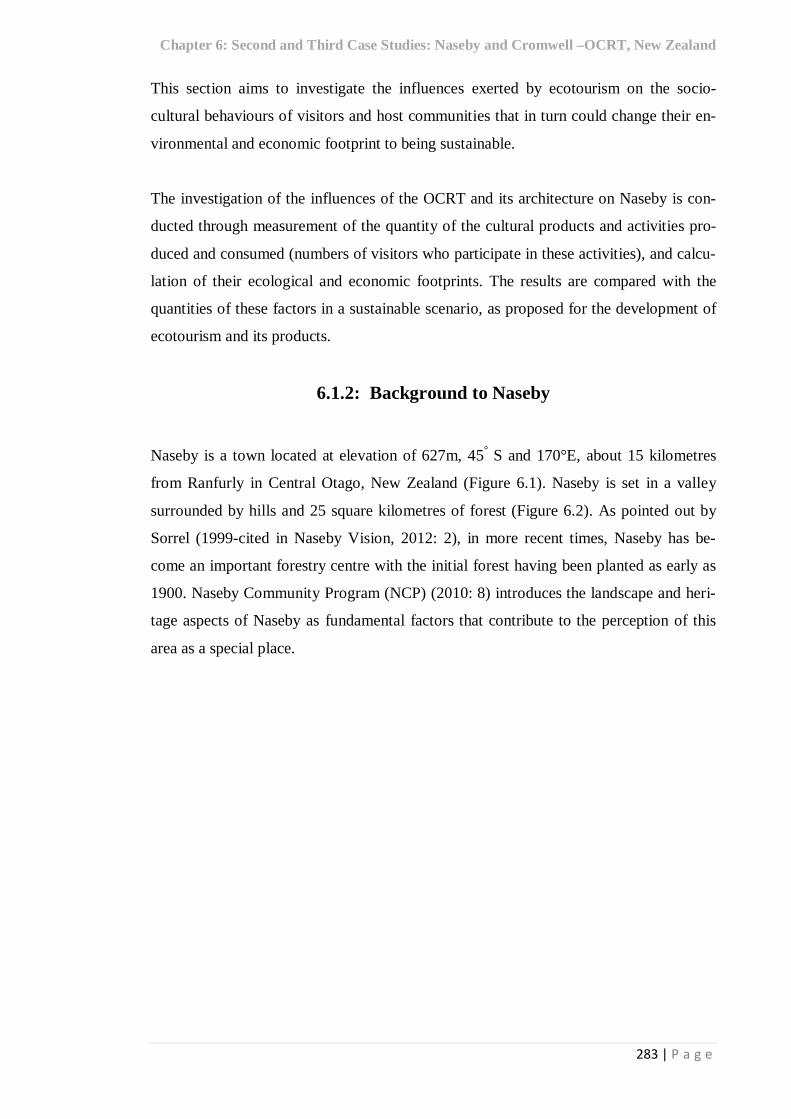
Figure 5.45: The CF of OCRT visitor activities 278 Figure 6.1: Naseby-Central Otago- New Zealand http://www.no1guide.co.nz/images/map/Map_of_Central_Otago.jpg viewed August 2012
284
Figure 6.2: A view of Naseby http://www.odt.co.nz/files/story/2010/04/naseby_township__nestled_close_to_the_naseby_fores1659 772314.JPG viewed August 2012
285
Figure 6.3: Ancient Briton Hotel, Naseby http://www.otagorailtrail.co.nz/images/stories/ancientbritonold.jpg viewed August 2012
286
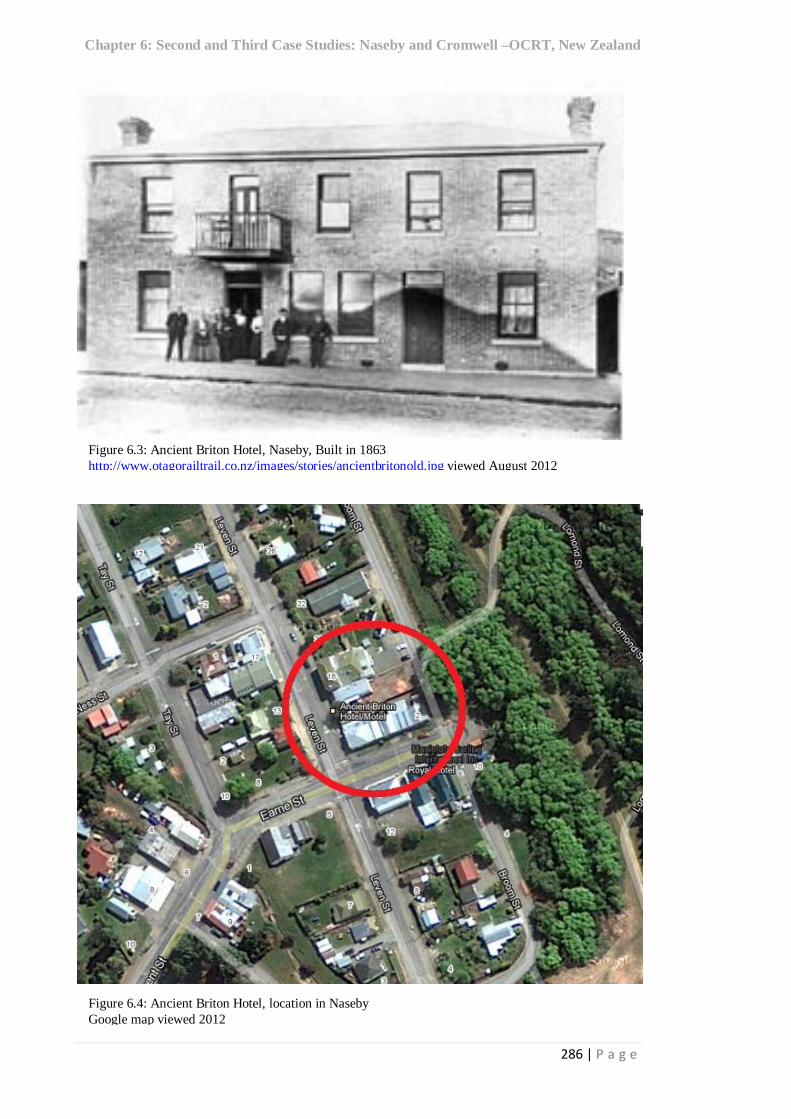
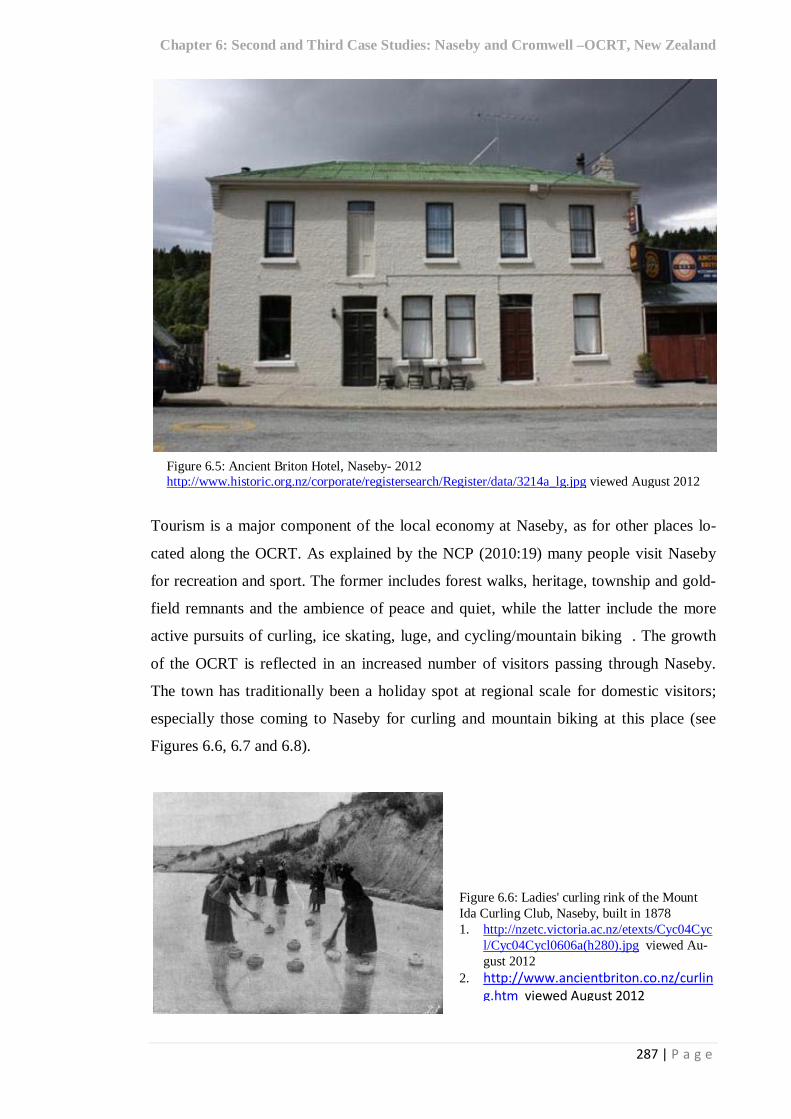
Figure 6.4: Ancient Briton Hotel, location in Naseby 286 Figure 6.5: Ancient Briton Hotel, Naseby- 2012 http://www.historic.org.nz/corporate/registersearch/Register/data/3214a_lg.jpg viewed August 2012
287
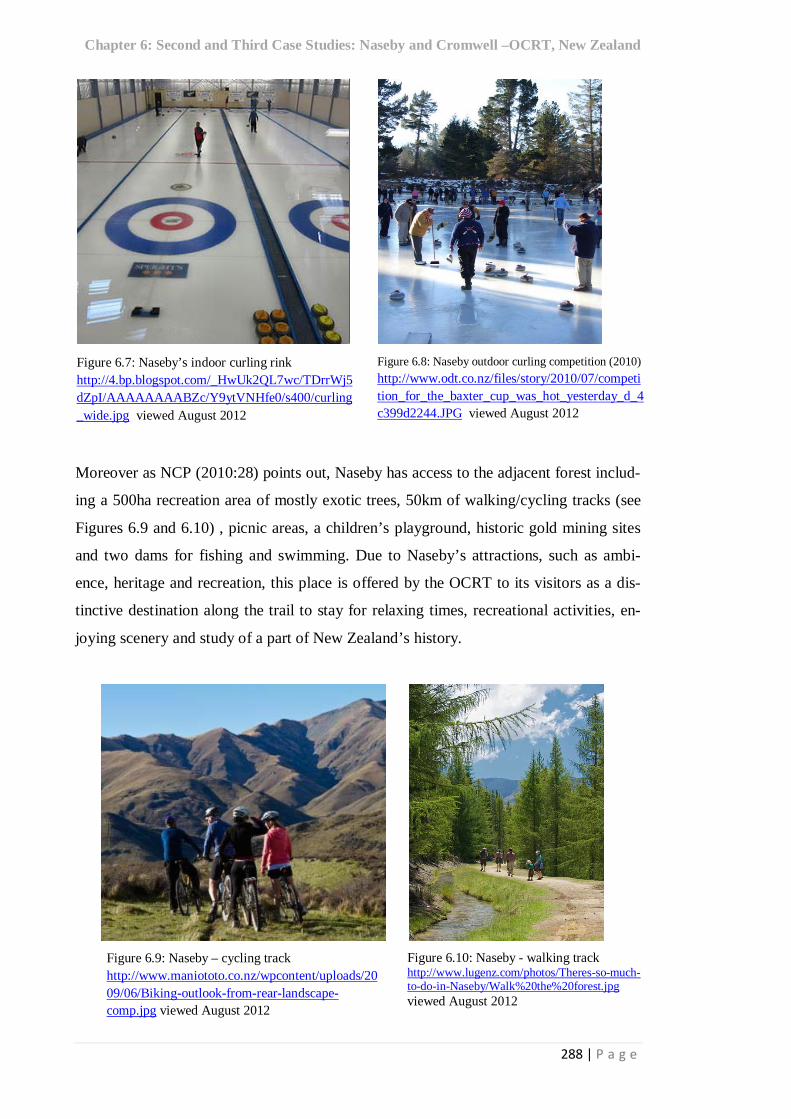
Figure 6.6: Ladies' curling rink of the Mount Ida Curling Club1, Naseby, built in 18782
1. http://nzetc.victoria.ac.nz/etexts/Cyc04Cycl/Cyc04Cycl0606a(h280).jpg viewed August 2012
2. http://www.ancientbriton.co.nz/curling.htm viewed August 2012
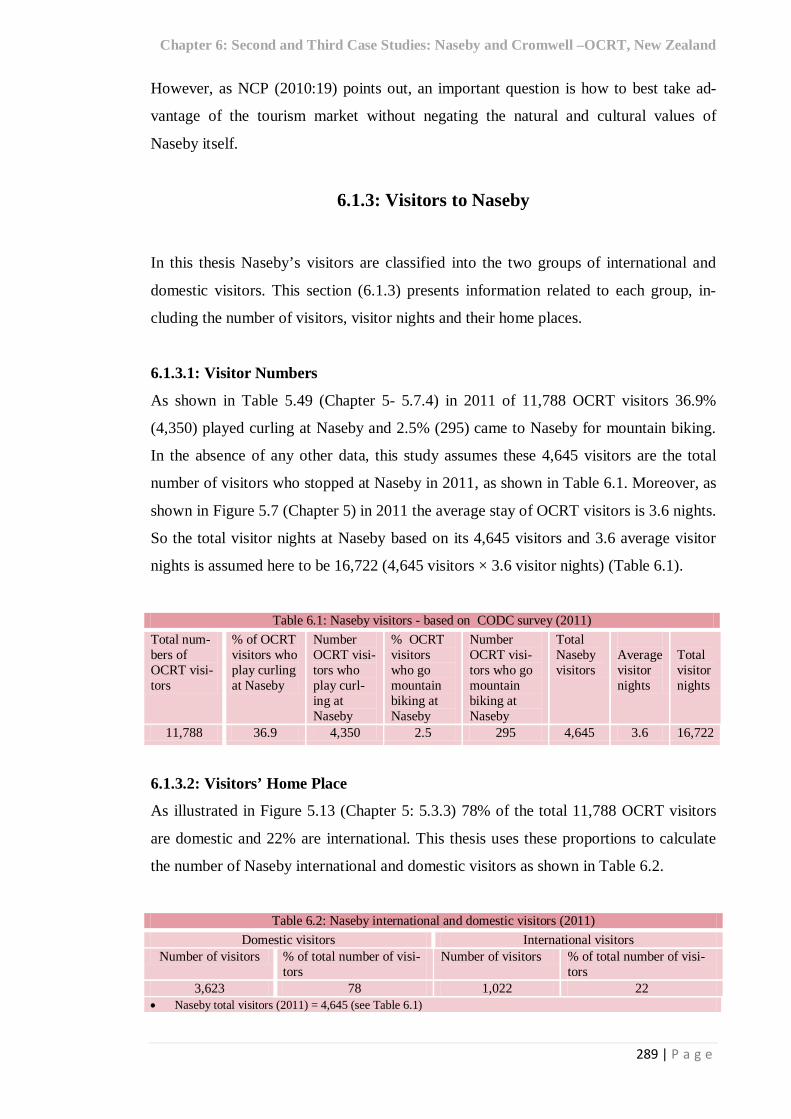
Figure 6.8: Naseby outdoor curling http://www.odt.co.nz/files/story/2010/07/competition_for_the_baxter_cup_was_hot_yesterday_d4c399d2244.JPG viewed August 2012
288
Figure 6.9: Naseby – cycling track http://www.maniototo.co.nz/wpcontent/uploads/2009/06/Biking-outlook-from-rear-landscape-comp.jpg viewed August 2012
288
Figure 6.10: Naseby - walking track http://www.lugenz.com/photos/Theres-so-much-to-do-in-Naseby/Walk%20the%20forest.jpg viewed August 2012
288
Figure 6.11: Naseby- percentage of type and available bed spaces by type of accommodation service
297
Figure 6.12: Naseby- Refurbished (RB) and new (NB) accommodation services (2011) 299 Figure 6.13: Naseby- capacity of RB and NB accommodation services (2011) 299 Figure 6.14: Naseby – bed spaces by type of materials used (2011) 300 Figure 6.15: Naseby- used materials by types of accommodation services (2011) 301 Figure 6.16: Naseby SC accommodation services - energy sources, facilities and spaces (2011) 302 Figure 6.17: Naseby B&B accommodation services - energy sources, facilities and spaces (2011)
303
Figure 6.18: Naseby hotel accommodation services - energy sources, facilities and spaces (2011)
304
Figure 6.20: All types of Naseby accommodation services - energy sources, facilities and spaces
305
Figure 6.21: Comparison between NB and RB bed spaces in terms of energy sources, facilities and open air spaces (2011)
306
Figure 6.22: Naseby - frequency of indoor activities offered by accommodation services to visi-tors (2011)
318
Figure 6.23: The frequency of outdoor activities offered by Naseby accommodation services to visitors
319
Figure 6.24: Naseby- frequency of subjects to visit offered by accommodation services 320
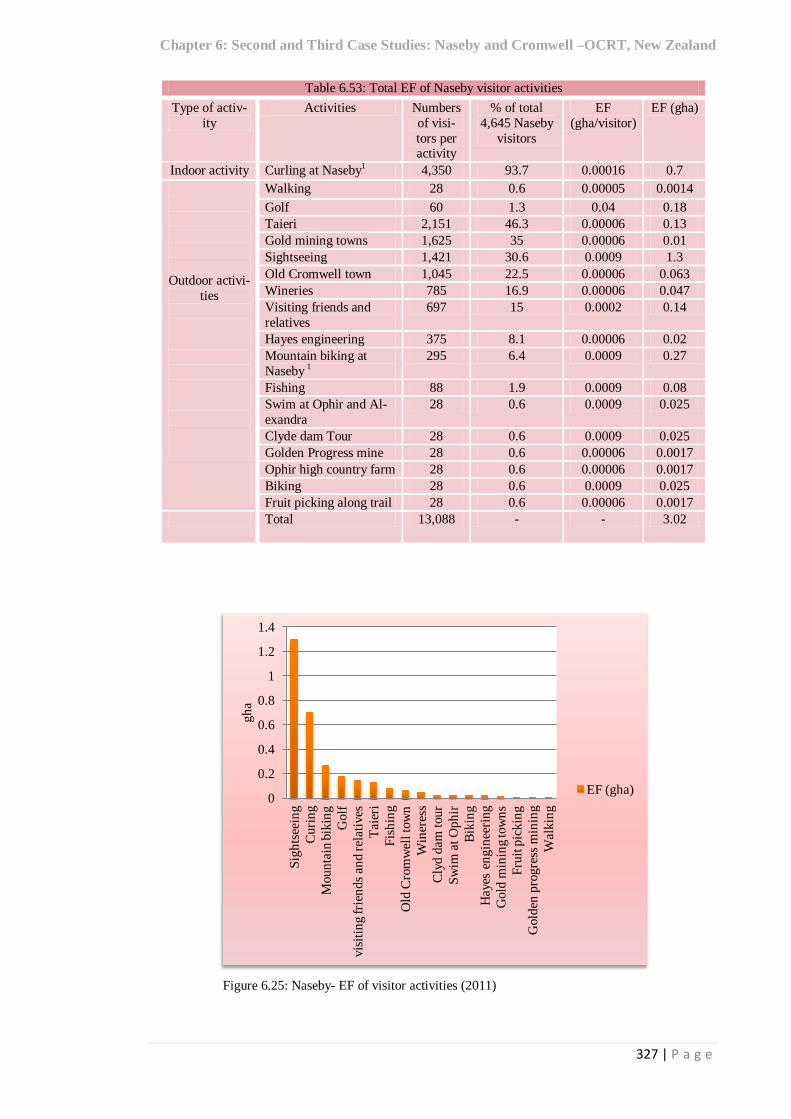
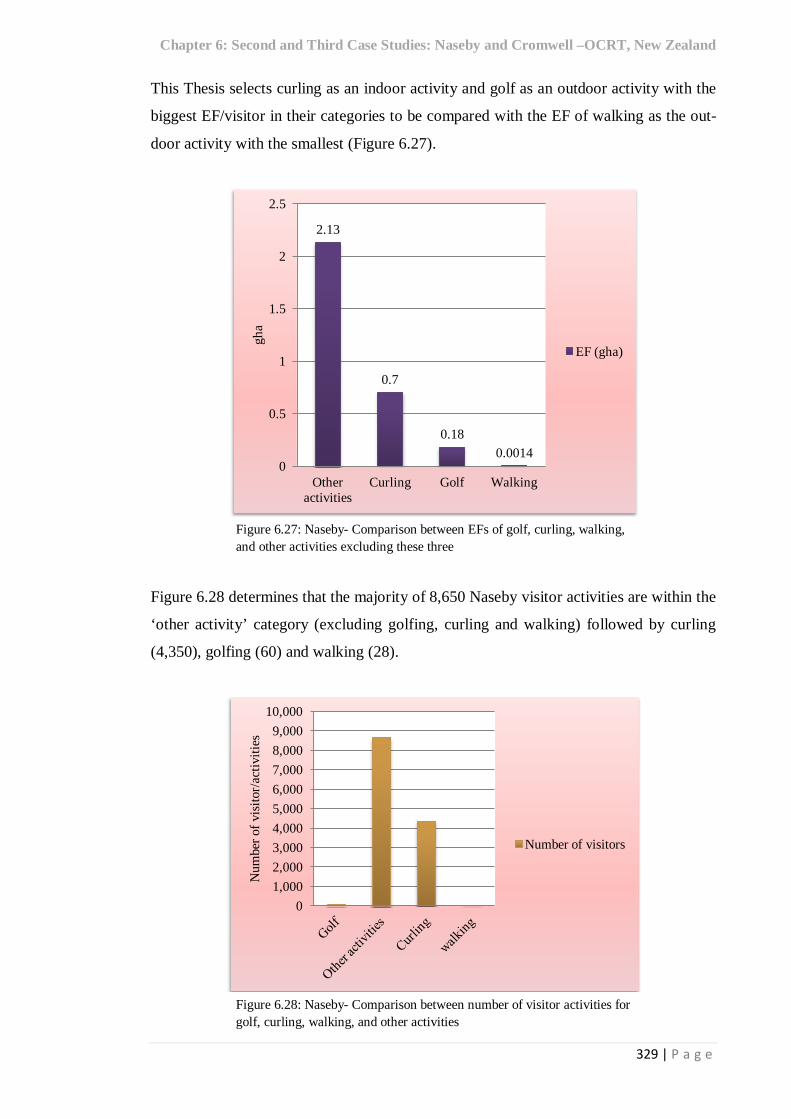
Figure 6.25: Naseby- EF of visitor activities (2011) 327 Figure 6.26: Comparison between EFs of Naseby indoor and outdoor activities 328 Figure 6.27: Naseby- Comparison between EFs of golf, curling, walking, and other activities excluding these three
329
Figure 6.28: Naseby- Comparison between number of visitor activities for golf, curling, walk-ing, and other activities
329
Figure 6.29: Comparison between EFs of Naseby for transportation, food, accommodation ser-vices, and visitor activities (2011)
330
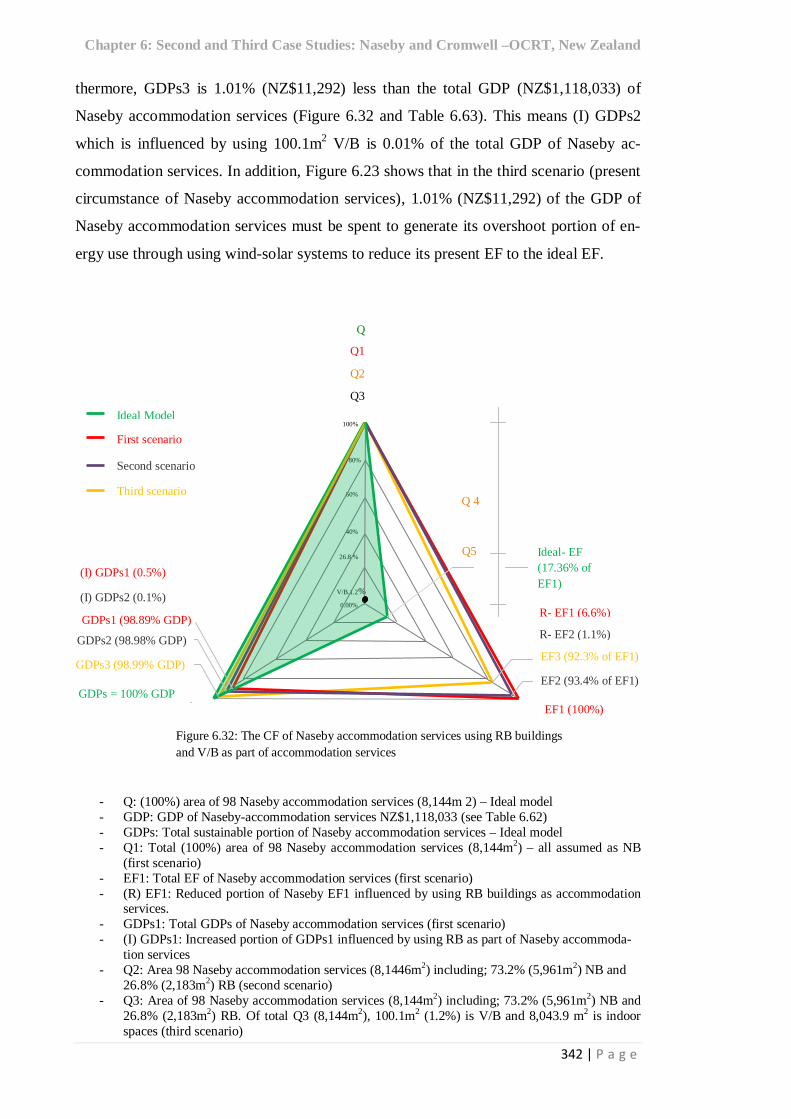
Figure 6.30: Naseby- comparison between GDP and GDPs 333 Figure 6.31: The cultural footprint (CF) of Naseby related to food 337 Figure 6.32: The CF of Naseby accommodation services using RB buildings and V/B as part of accommodation services
342
Figure 6.33: The CF of Naseby visitor activities 348 Figure 6.34: Cromwell, Central Otago, New Zealand http://www.centralotagonz.com/PicsHotel/CentralOtagoRTO/Images/Discovery/RailTrail/HotspotMap.jpg viewed August 2012
350
Figure 6.35: A view of Cromwell http://cromwellsports.files.wordpress.com/2010/05/cromwell.jpg viewed August 2012
350
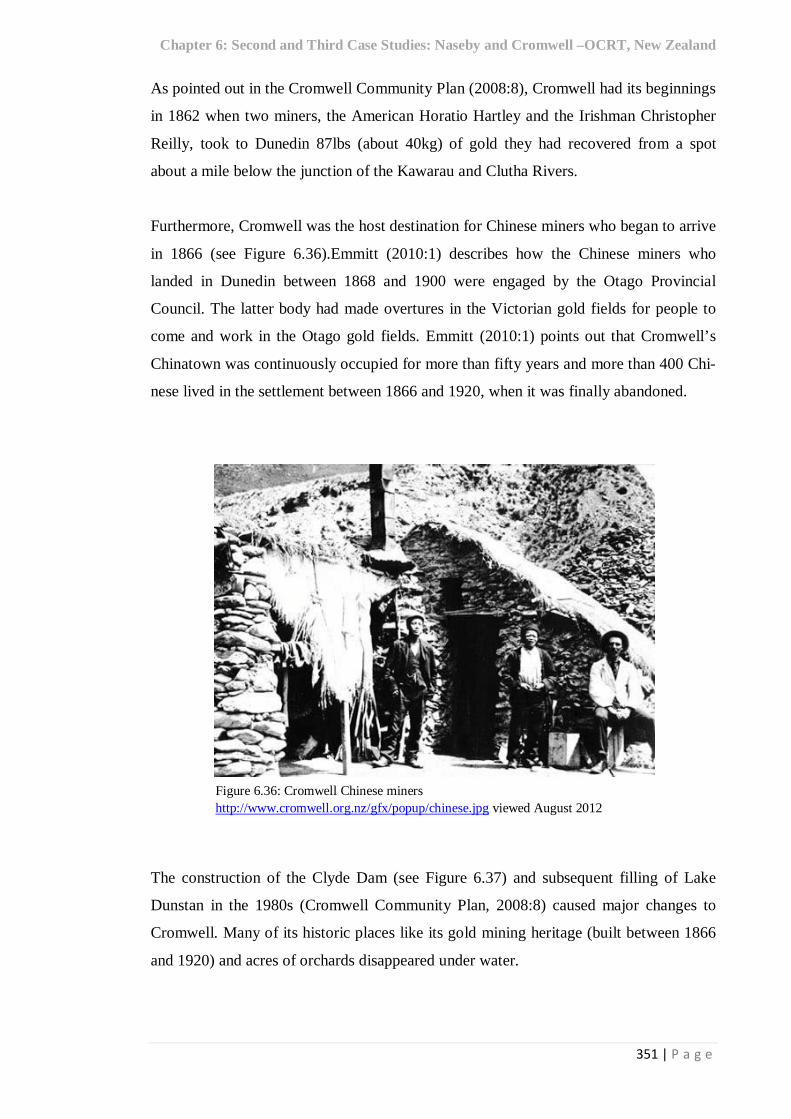
Figure 6.36: Cromwell Chinese miners http://www.cromwell.org.nz/gfx/popup/chinese.jpg viewed August 2012
351
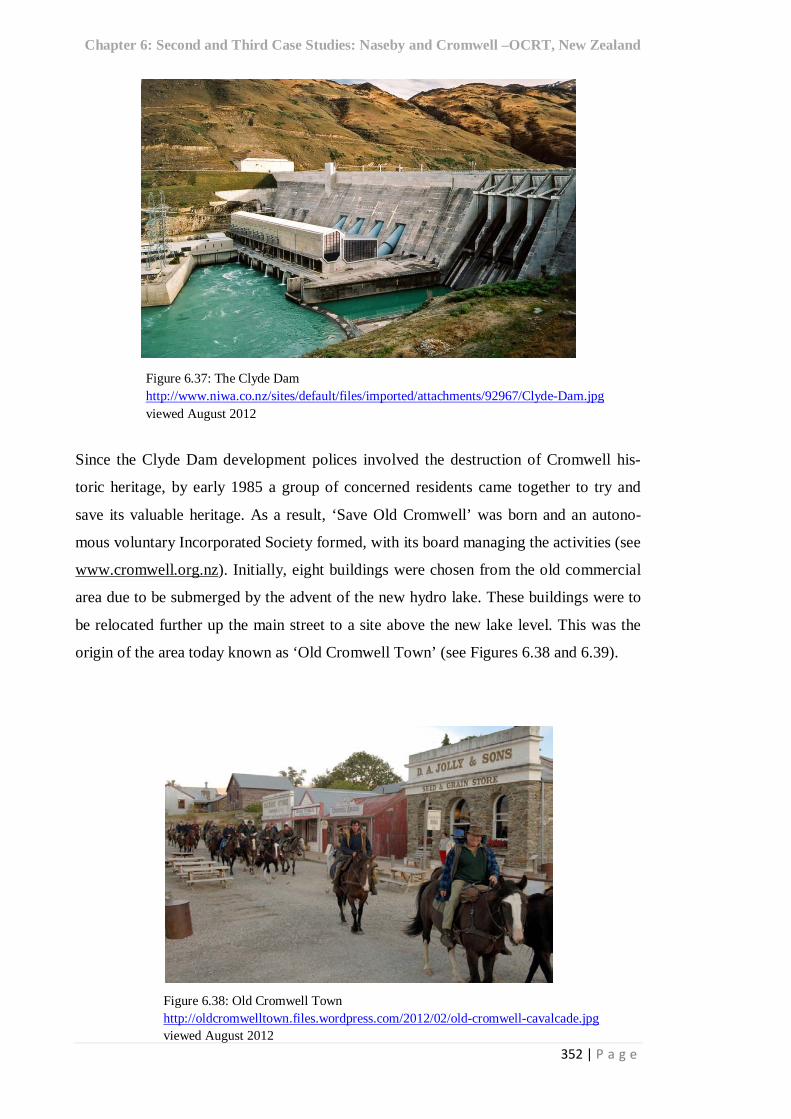
Figure 6.37: The Clyde Dam http://www.niwa.co.nz/sites/default/files/imported/attachments/92967/Clyde-Dam.jpg viewed August 2012
352
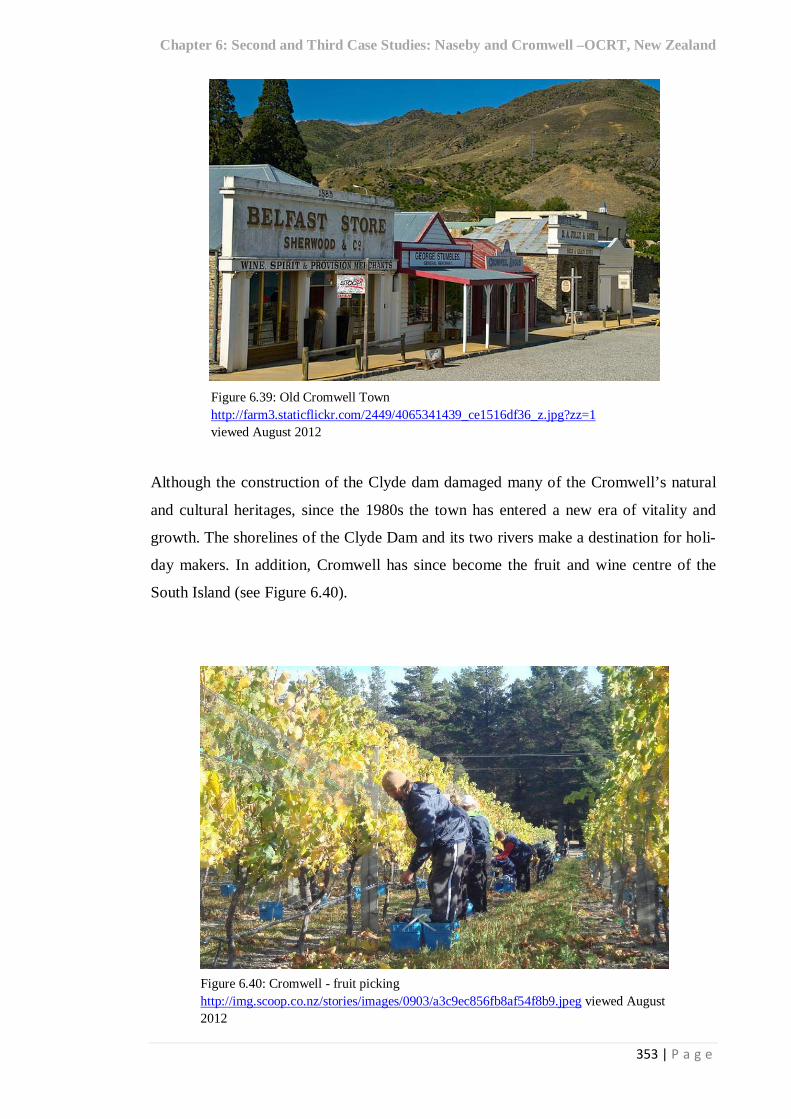
Figure 6.38: Old Cromwell Town http://oldcromwelltown.files.wordpress.com/2012/02/old-cromwell-cavalcade.jpg viewed Au-gust 2012
352
Figure 6.39: Old Cromwell Town http://farm3.staticflickr.com/2449/4065341439_ce1516df36_z.jpg?zz=1 viewed August 2012
353
Figure 6.40: Cromwell- fruit picking http://img.scoop.co.nz/stories/images/0903/a3c9ec856fb8af54f8b9.jpeg viewed August 2012
353
Figure 6.41: Percentage and available bed spaces by type of accommodation service (2011) 362 Figure 6.42: Cromwell – bed spaces by type of materials used (2011) 363 Figure 6.43: Cromwell - materials used by type of accommodation service (2011) 364 Figure 6.44: Cromwell SC accommodation services - energy sources, facilities and spaces (2011)
365
Figure 6.45: Cromwell B&B accommodation services - energy source, facilities and spaces (2011)
366
Figure 6.46: Cromwell Motel accommodation services - energy sources, facilities and spaces (2011)
366
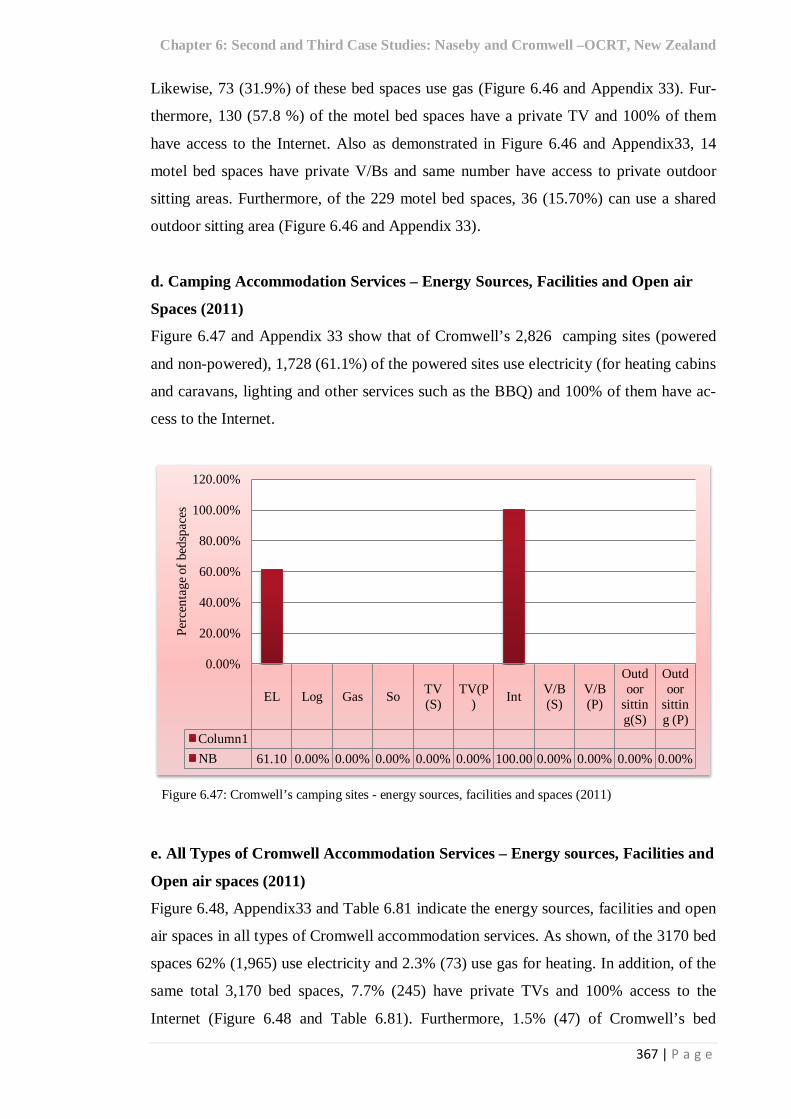
Figure 6.47: Cromwell camping sites - energy sources, facilities and spaces (2011) 367 Figure 6.48: Cromwell accommodation services - energy sources, facilities and spaces (2011) 368 Figure 6.49: The frequency of outdoor activities offered by Cromwell accommodation services to its visitors
378
Figure 6.50: The frequency of subjects offered by Cromwell accommodation services to visit (2011)
379
Figure 6.51: Cromwell - EF of visitor activities (2011) 386 Figure 6.52: Comparison between EFs of Cromwell indoor and outdoor activities 387 Figure 6.53: Cromwell - Comparison between EFs of golf, curling, walking, and other activities excluding these three
388
Figure 6.54: Cromwell - comparison between number of visitor activities for golf, curling, walking, and other activities
388
Figure 6.55: Comparison between EFs of Cromwell for transportation, food, accommodation services, and visitor activities (2011)
389
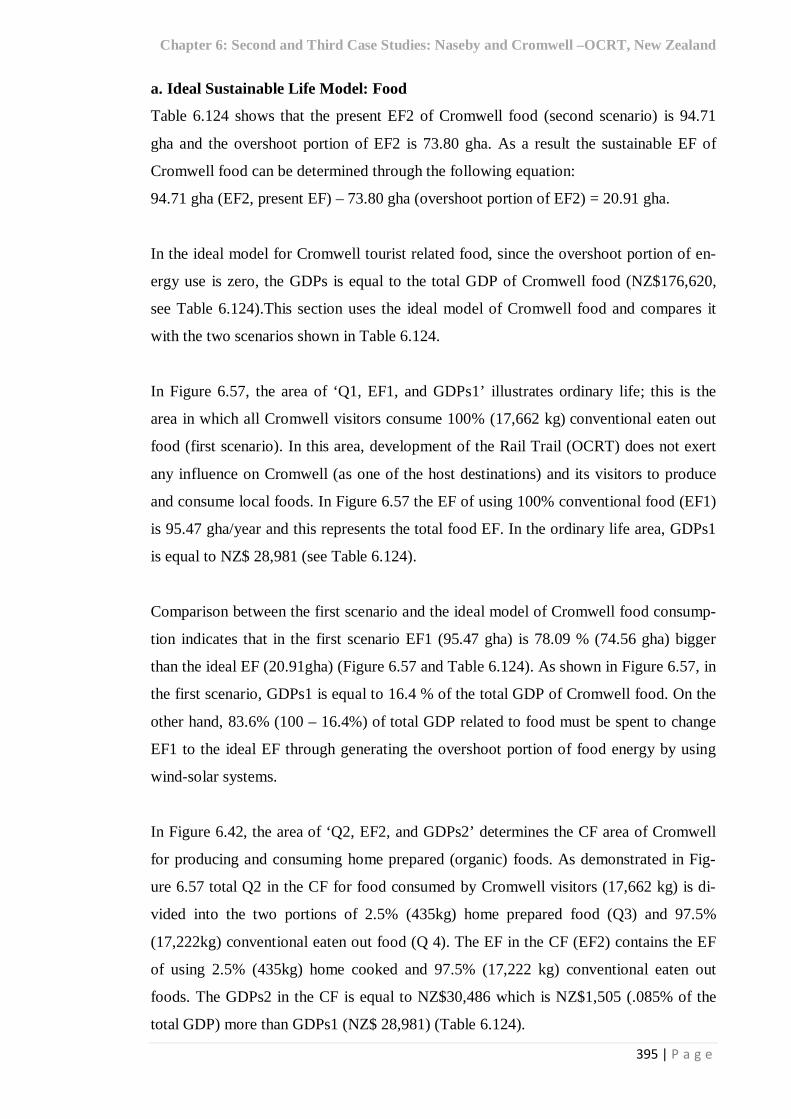
Figure 6.56: Cromwell - comparison between GDP and GDPs 392 Figure 6.57: The cultural footprint (CF) of Cromwell visitor food 396 Figure 6.58: The CF of Cromwell accommodation services with V/B as part of the used spaces 400 Figure 6.59: The CF of Cromwell visitor activities 406 Figure 6.60: The CF of Naseby and Cromwell related to Food 408 Figure 6.61: The CFs of Naseby and Cromwell related to accommodation services 411 Figure 6.47: The CFs of Naseby and Cromwell related to visitor activities 413
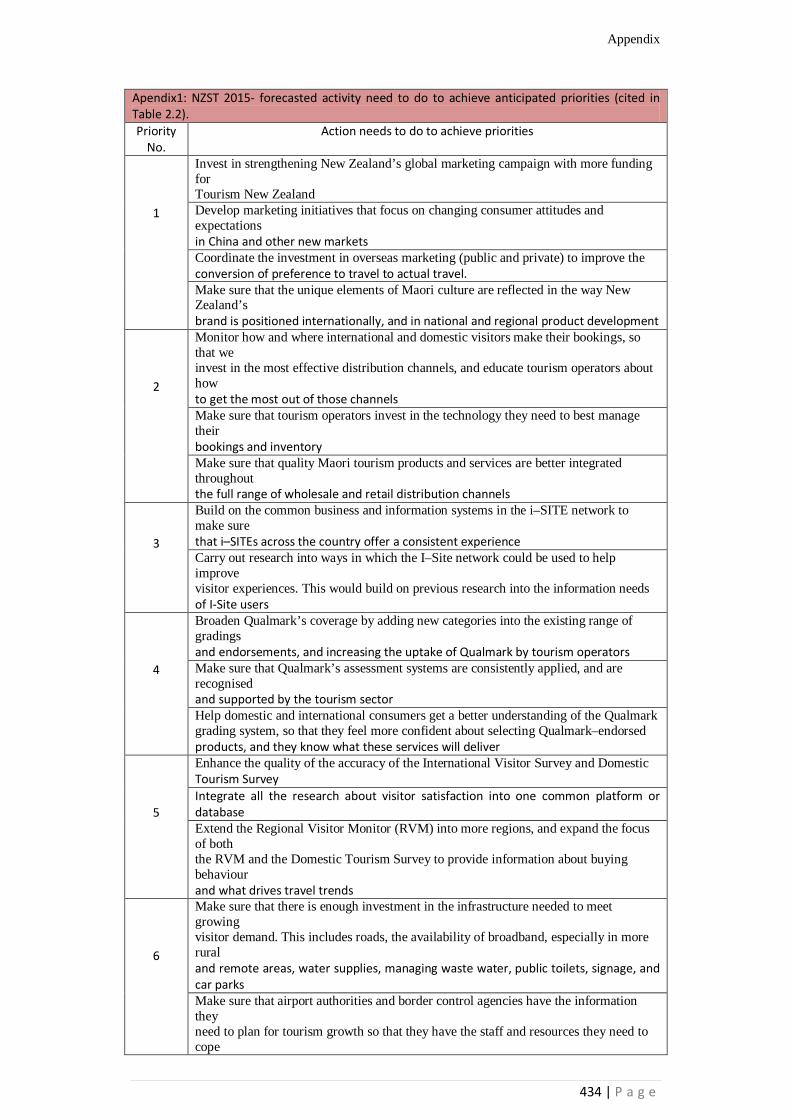
List of Appendices Page Appendix 1: NZTS 2015: forecasted activity necessary to achieve anticipated priorities (cited in Table 2.2)
434
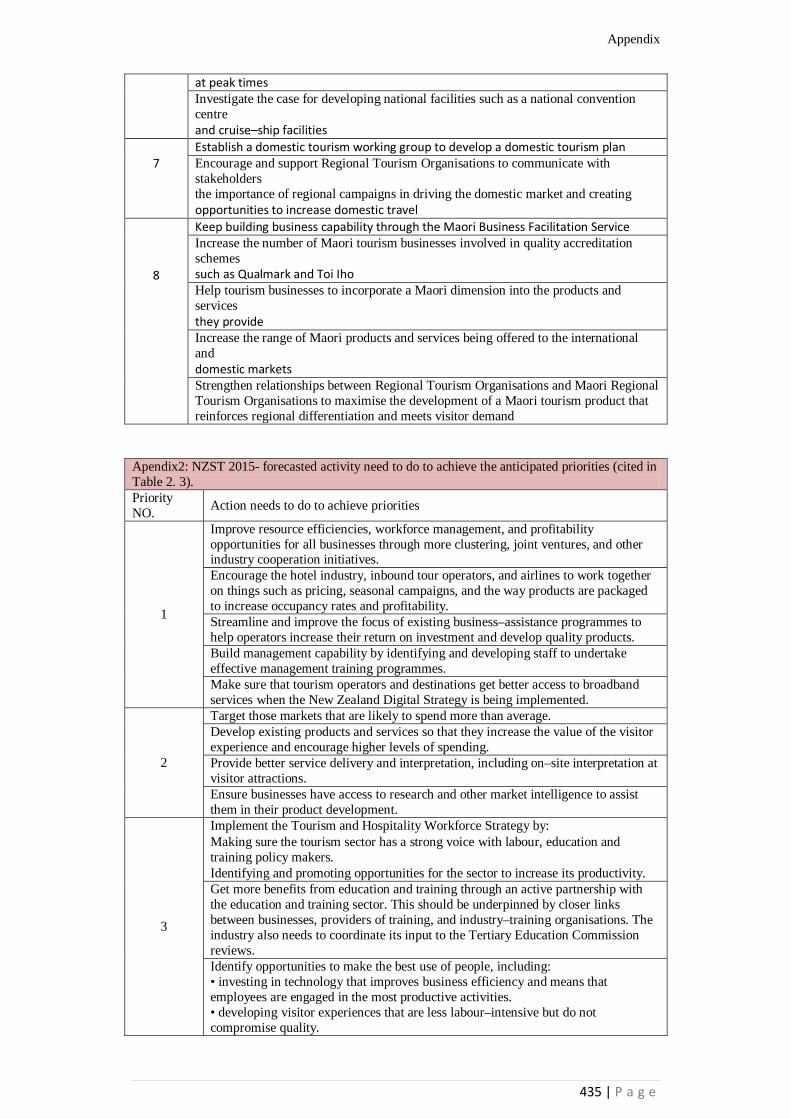
Appendix 2: NZTS 2015: forecasted activity necessary to achieve anticipated priorities (cited in Table 2.3)
435
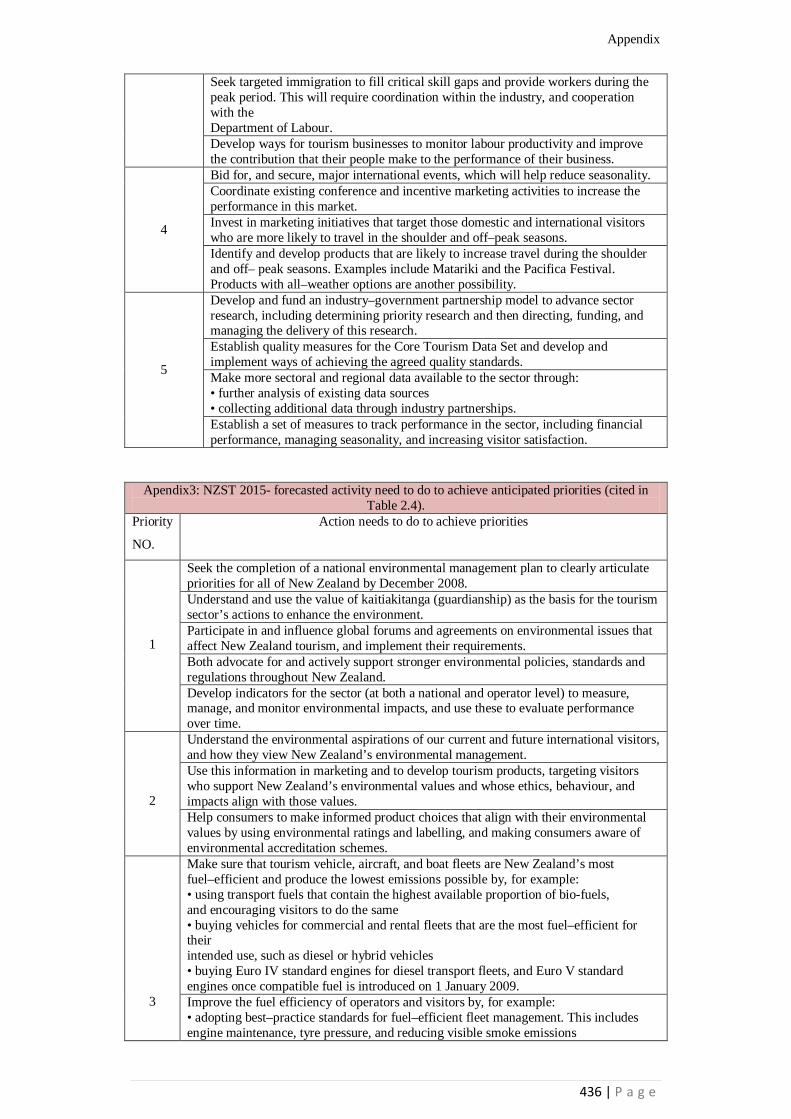
Appendix 3: NZTS 2015: forecasted activity necessary to achieve anticipated priorities (cited in Table 2.4)
436
Appendix 4: NZTS 2015: forecasted activity necessary to achieve anticipated priorities (cited in Table 2.5)
438
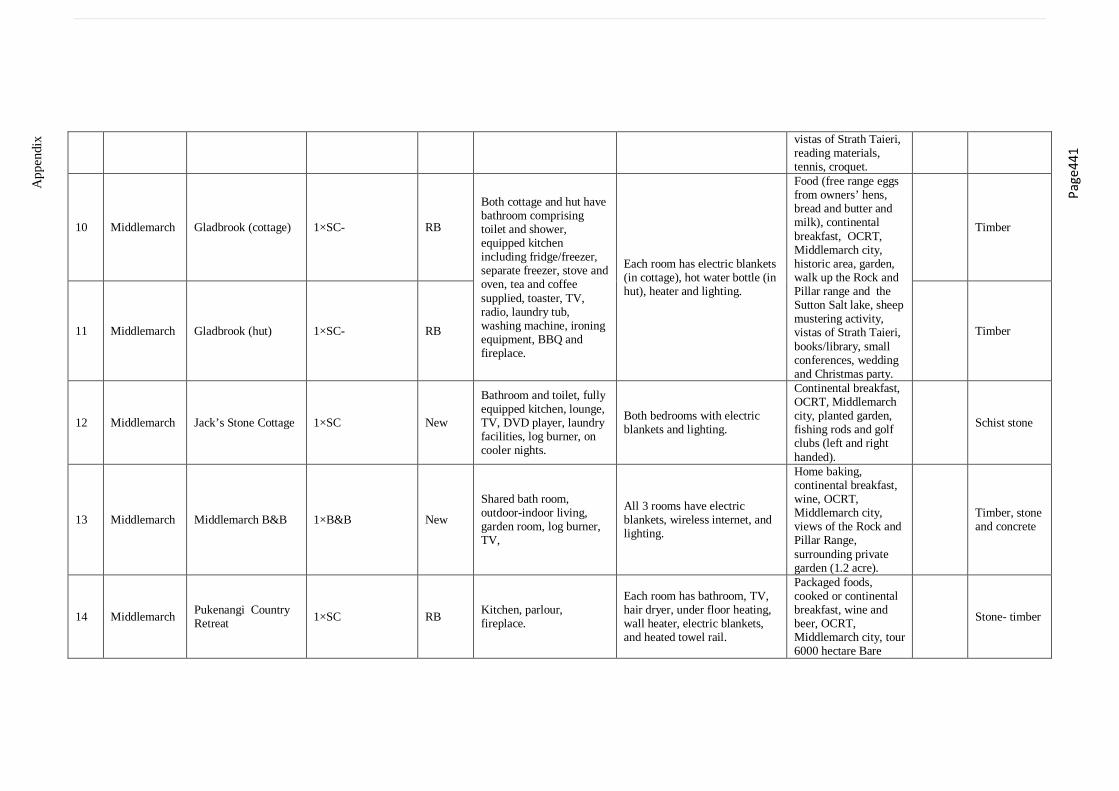
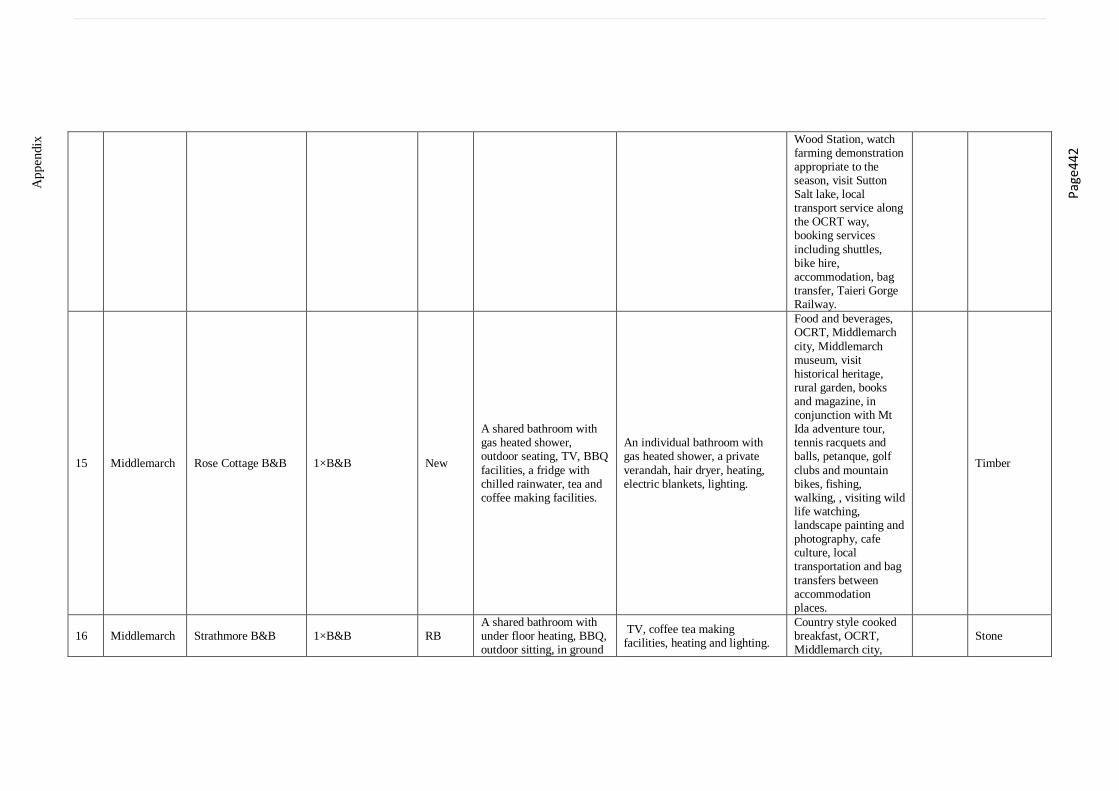
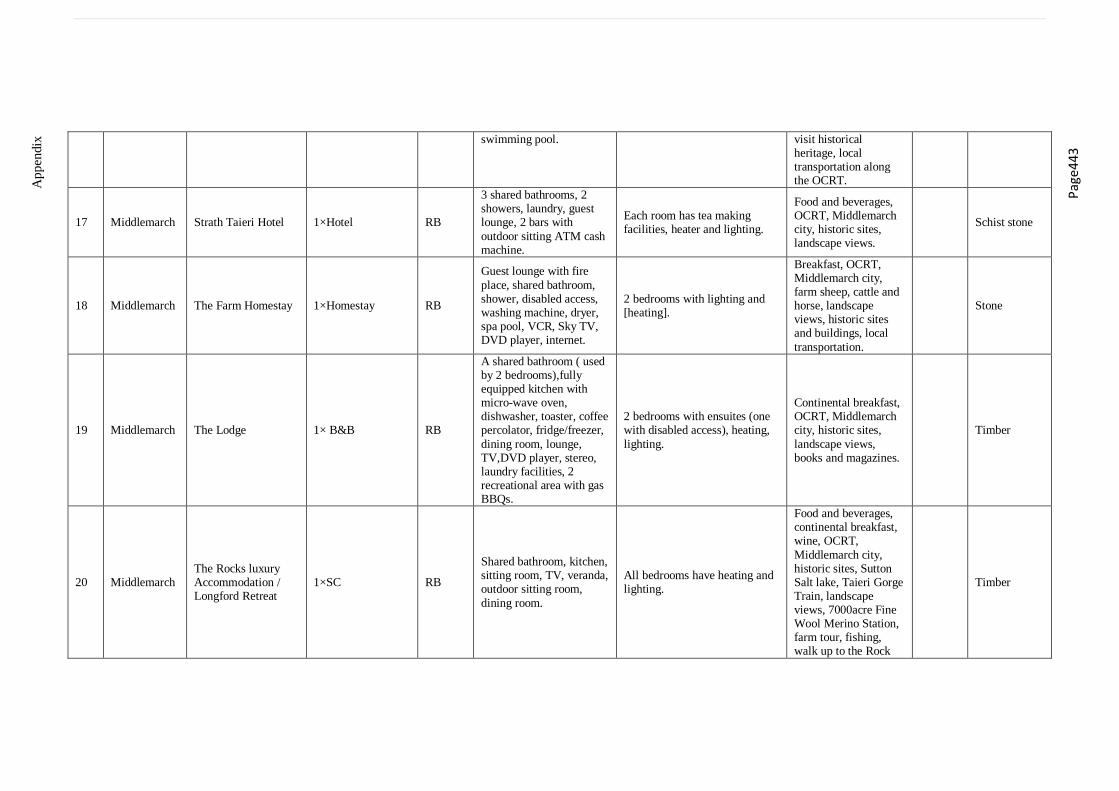
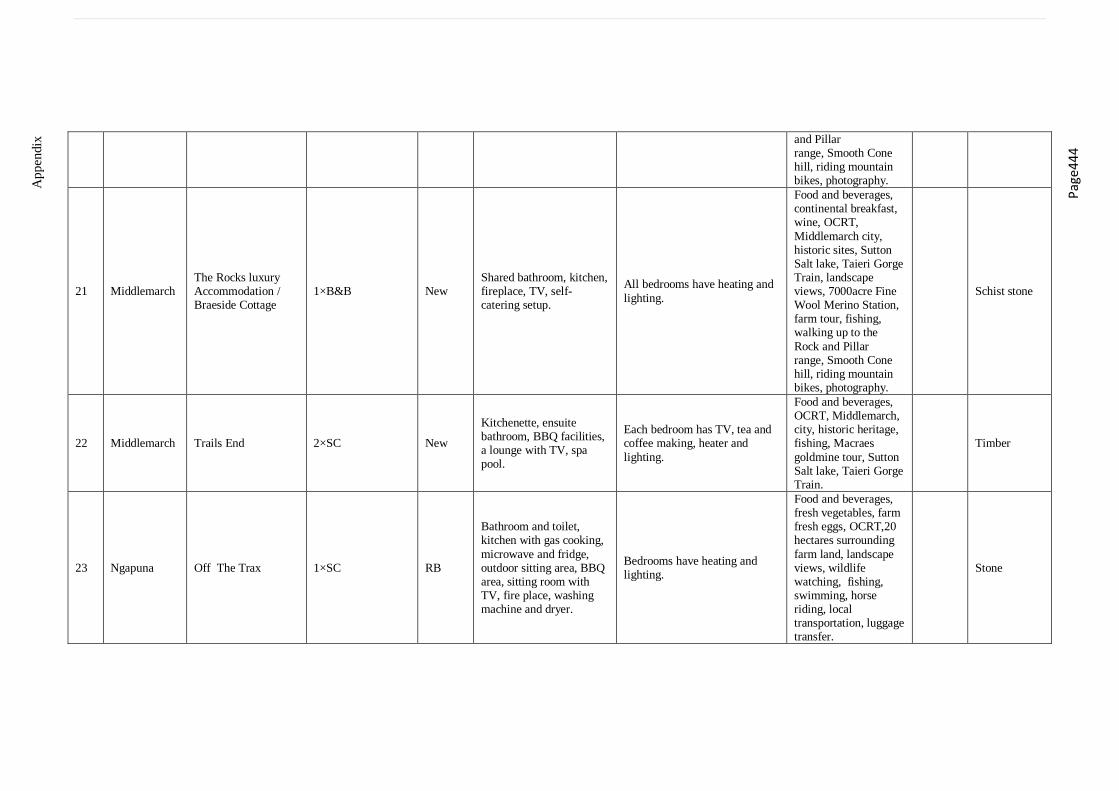
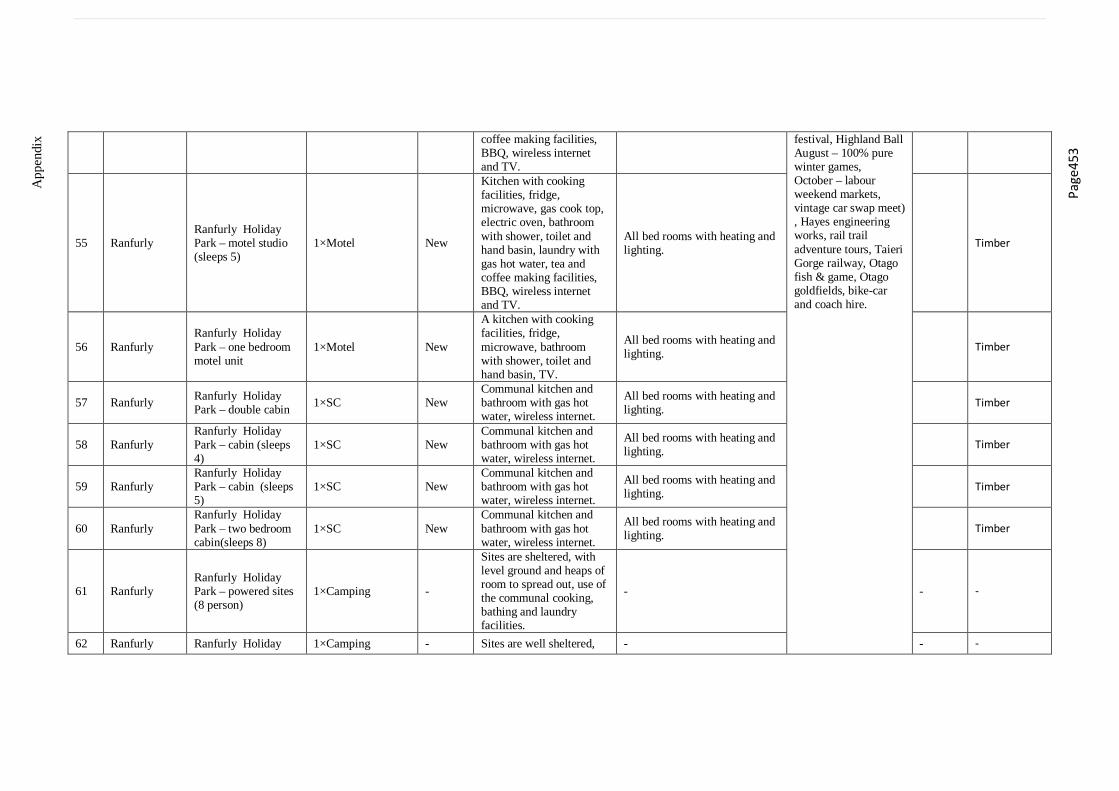
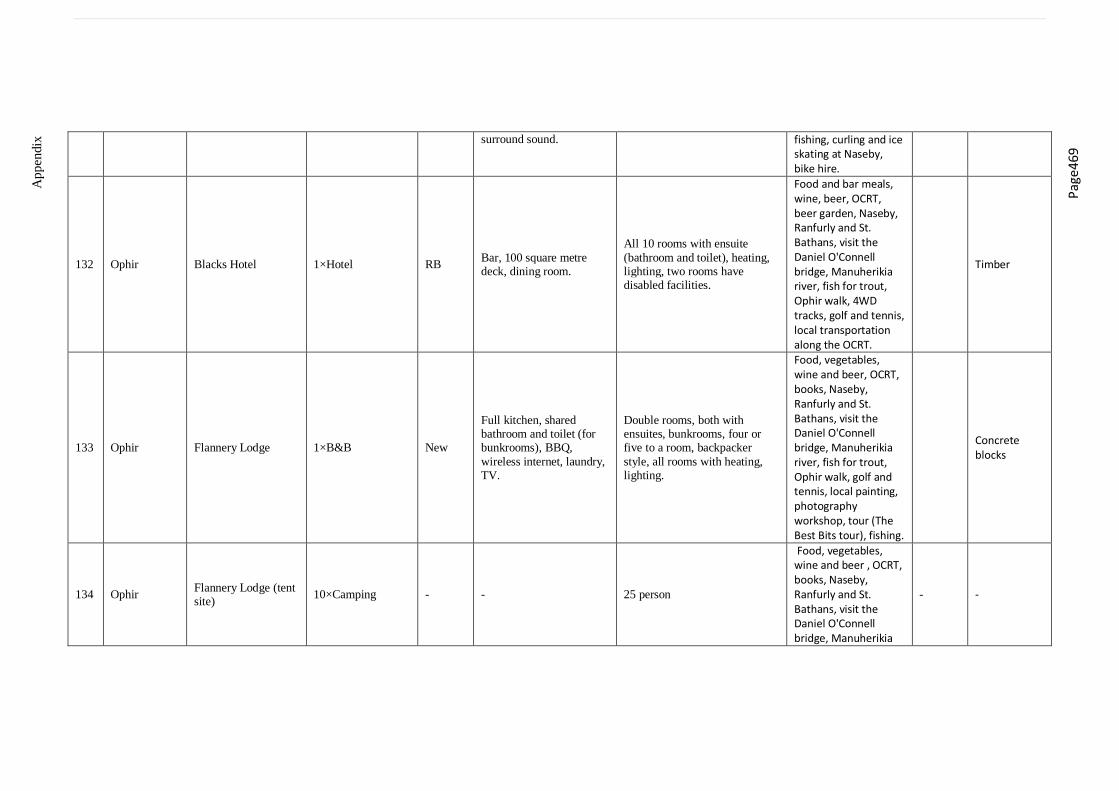
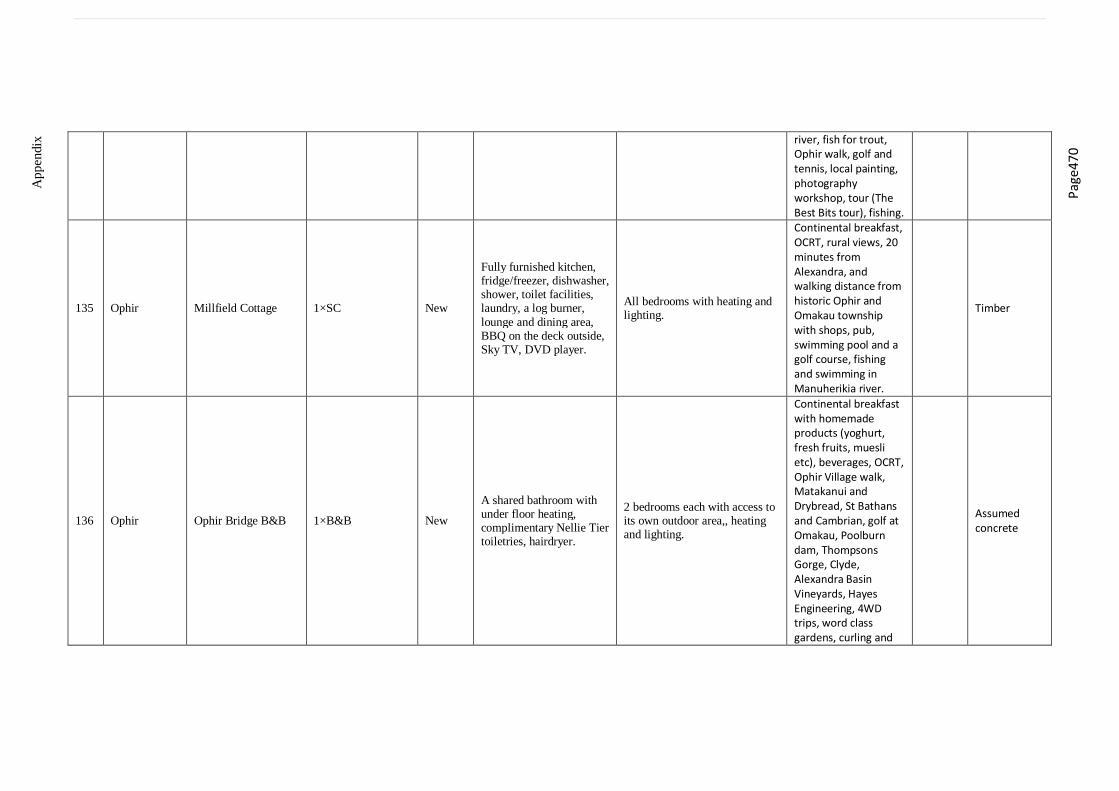
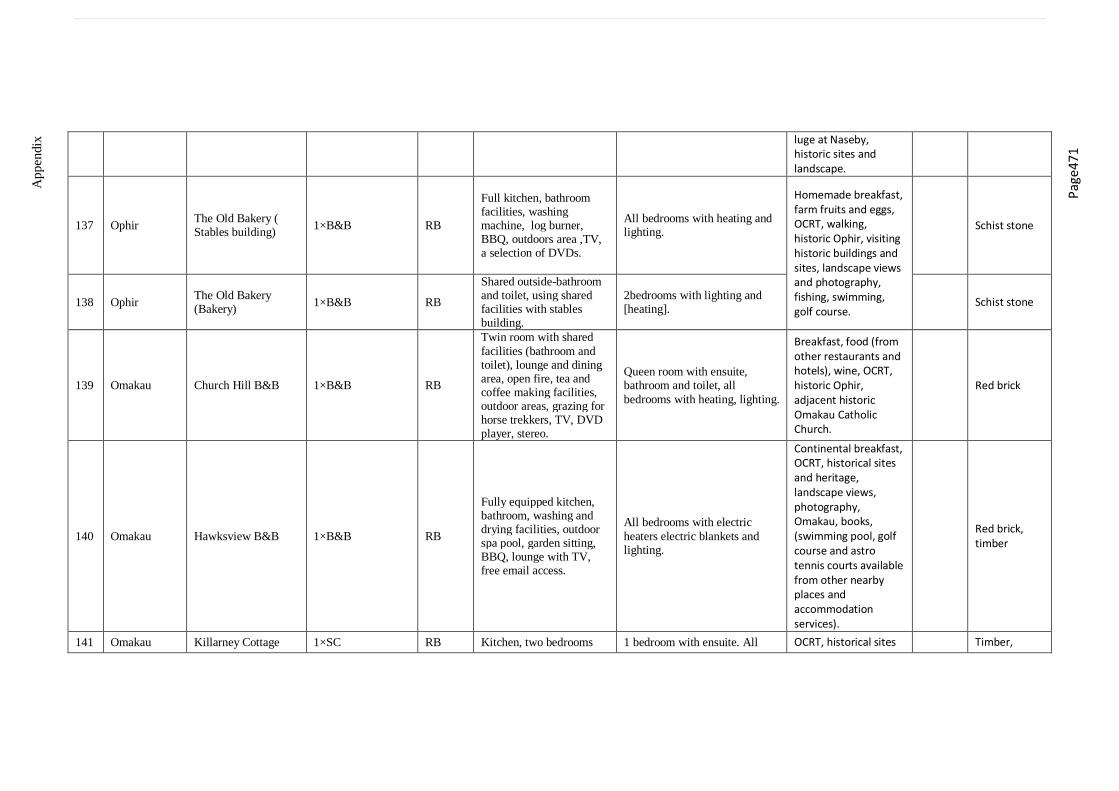
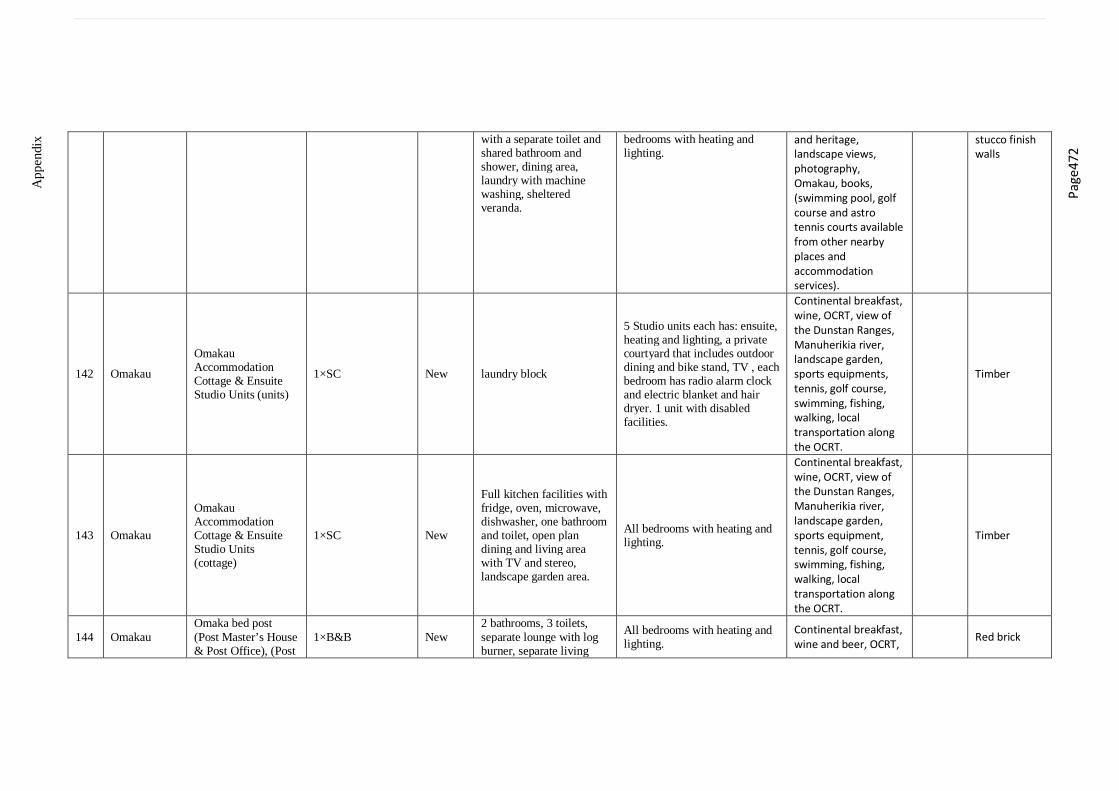
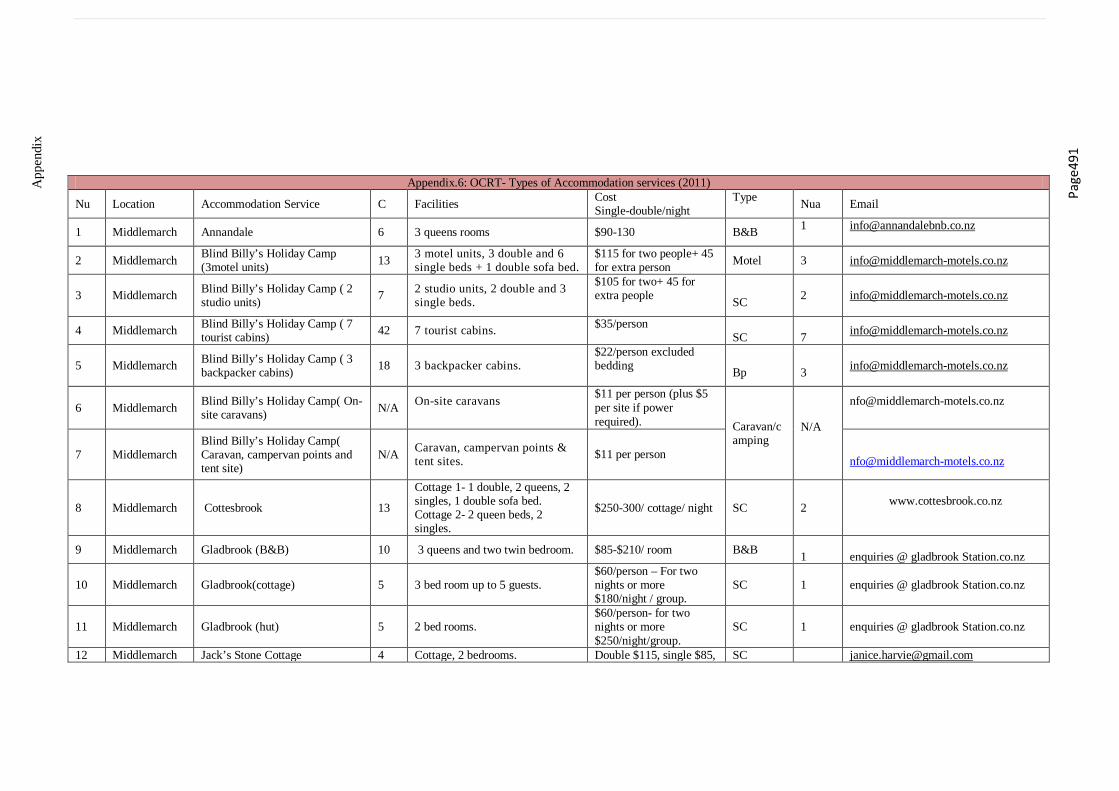
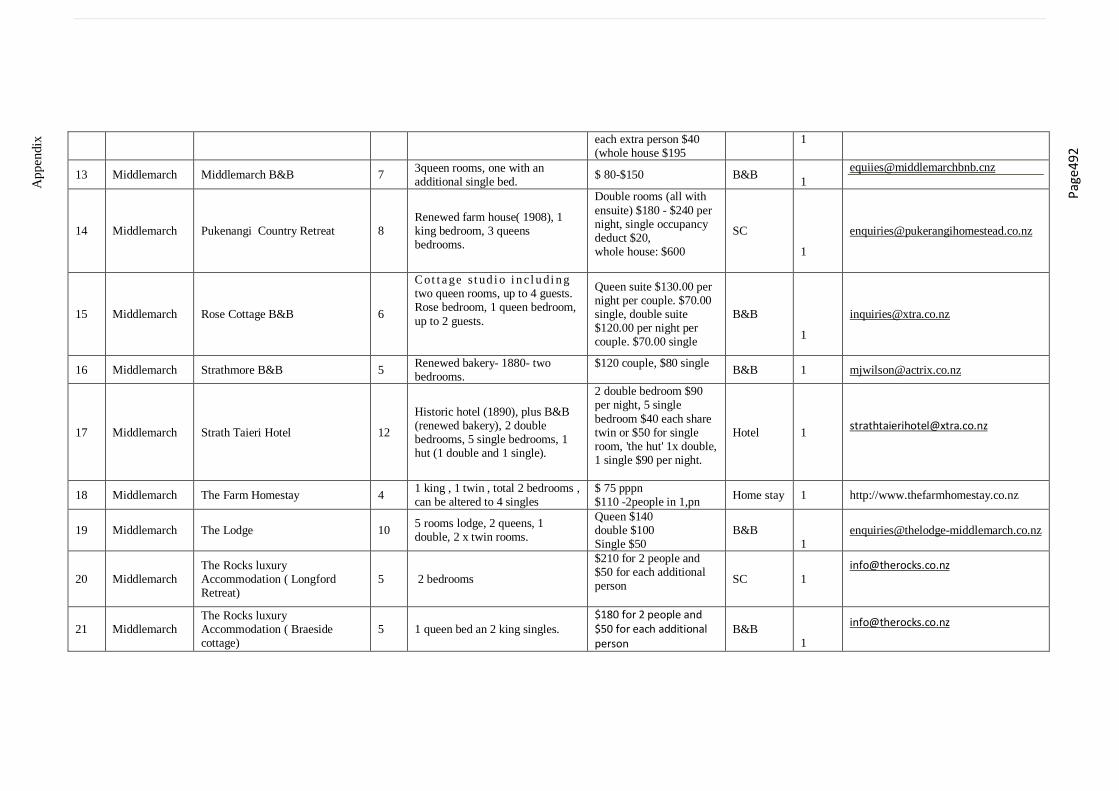
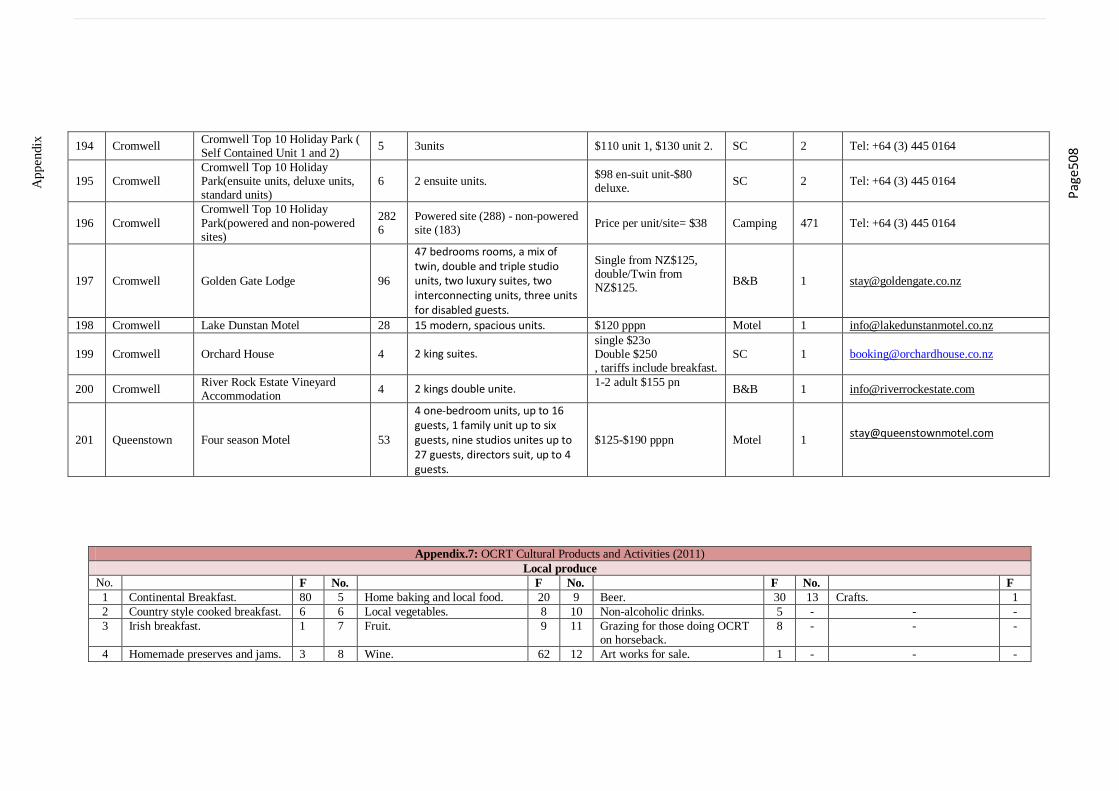
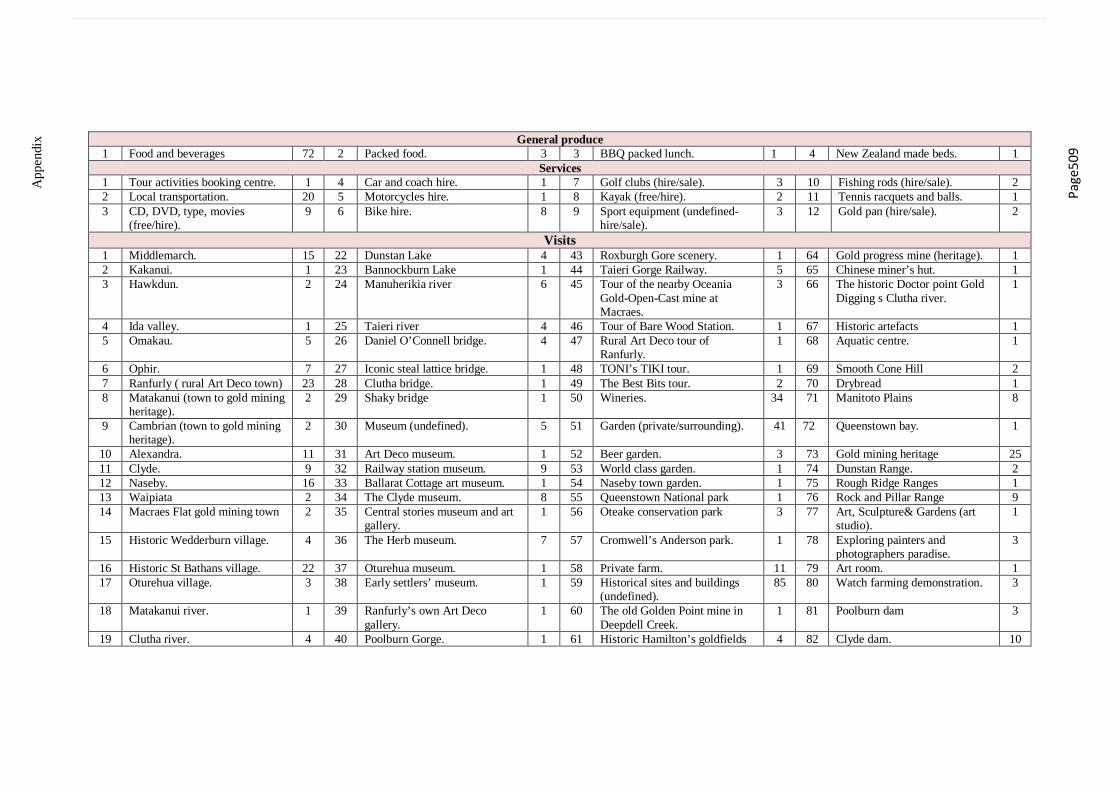
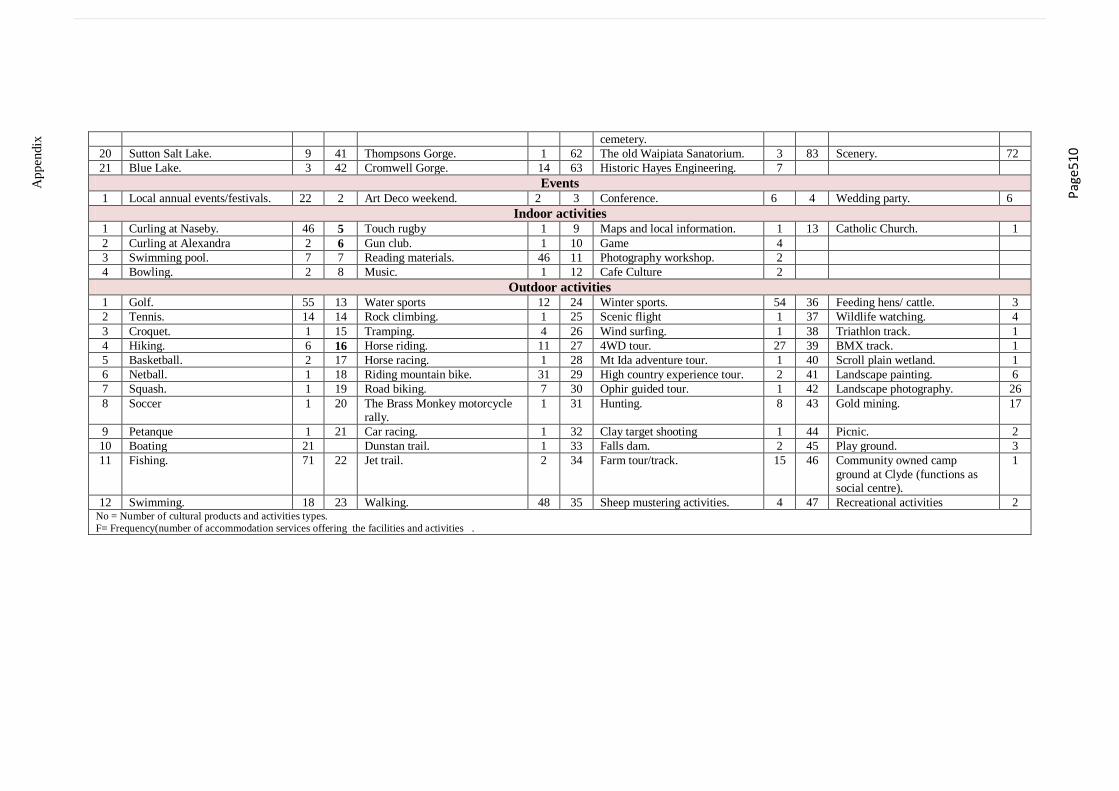
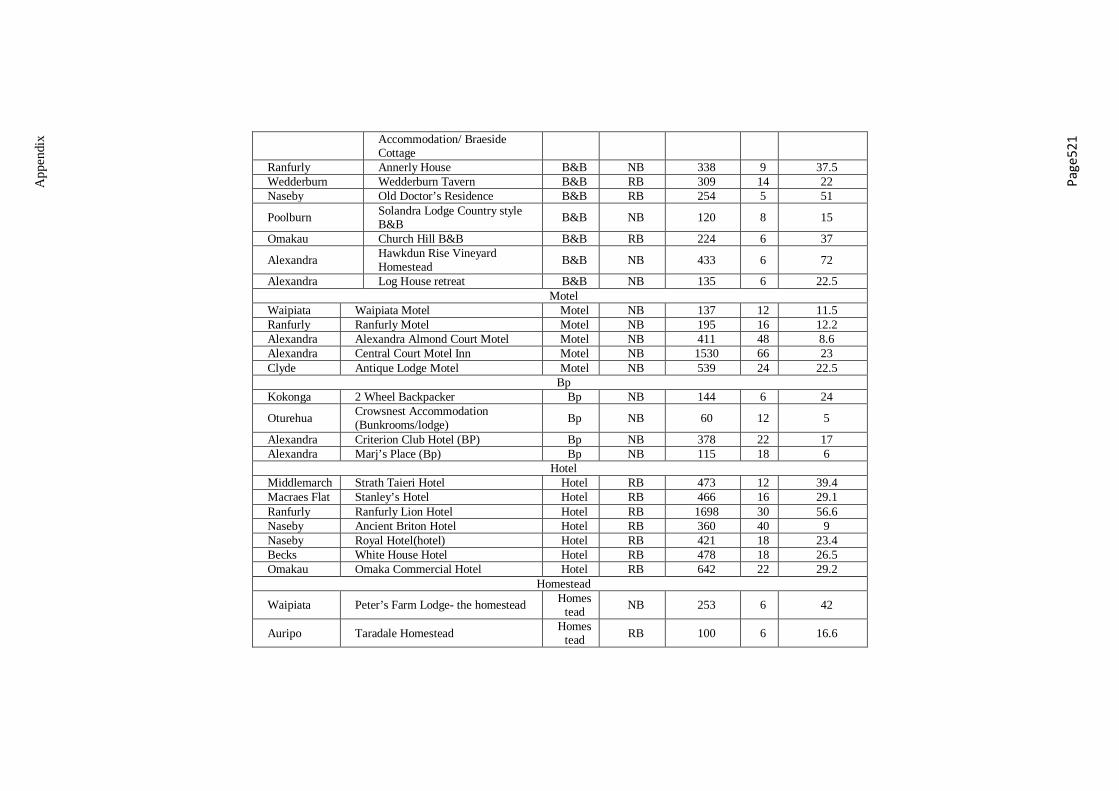
Appendix 5: OCRT- accommodation facilities, area and materials 439 Appendix 6: OCRT- types of accommodation services (2011) 491 Appendix 7: OCRT- cultural products and activities (2011) 508 Appendix 8: OCRT- accommodation services –materials used by type of accommodation service
511
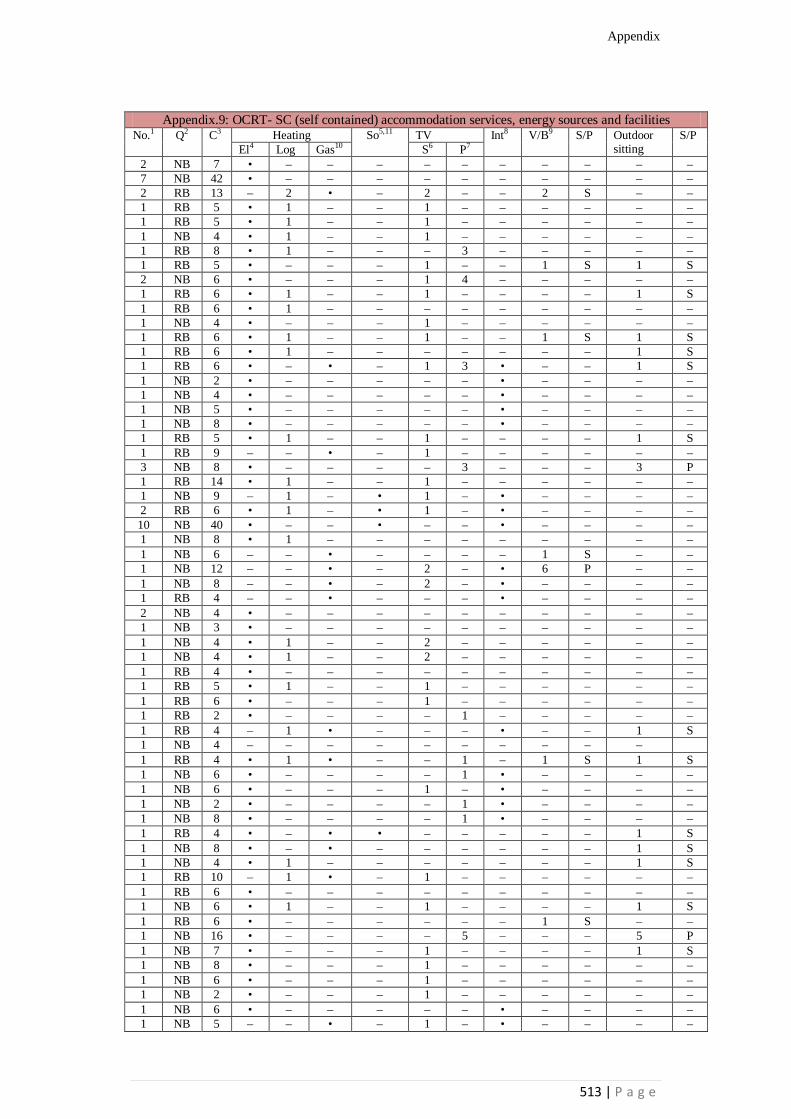
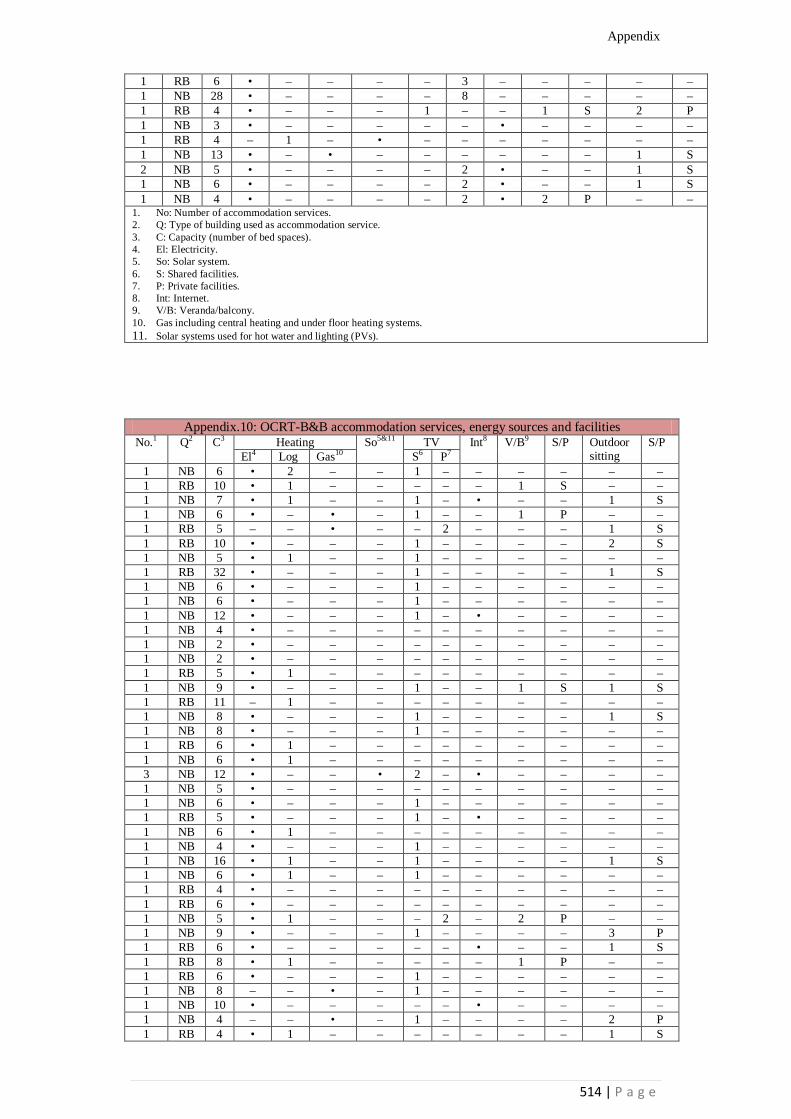
Appendix 9: OCRT- SC (self contained) accommodation services, energy sources and facili-tates
513
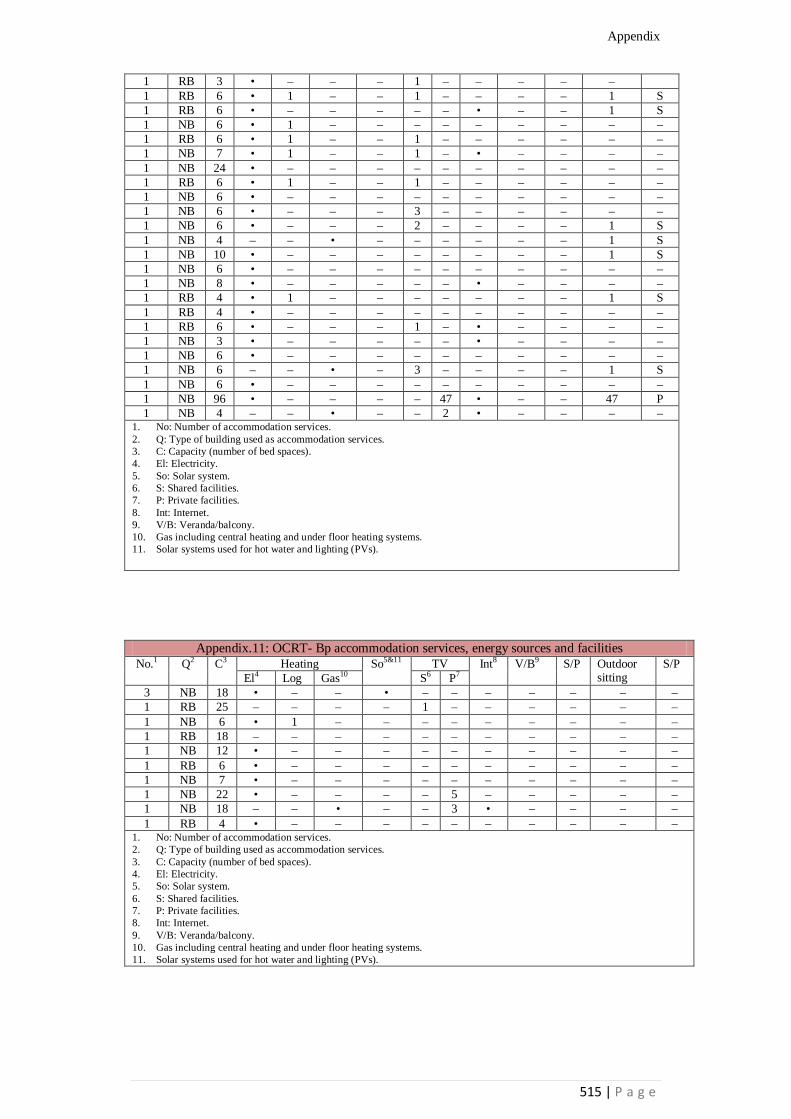
Appendix 10: OCRT- B&B accommodation services, energy sources and facilities 514 Appendix 11: OCRT- Bp accommodation services, energy sources and facilities 515 Appendix 12: OCRT- motel accommodation services, energy sources and facilities 516 Appendix 13: OCRT- homestead accommodation services, energy sources and facilities 516 Appendix 14: OCRT- hotel accommodation services, energy sources and facilities 517 Appendix 15: OCRT- camping accommodation services, energy sources and facilities 518 Appendix 16: OCRT- all types of accommodation services, energy sources and facilities 519 Appendix 17: OCRT- all accommodation services by type - energy sources and facilities 520 Appendix 18: OCRT- accommodation services- area per bed space (2011) 520 Appendix 19: OCRT- accommodation services-average area of outdoor sitting spaces 522 Appendix 20: OCRT- types of outdoor activities and their frequency 523 Appendix 21: Visits offered by OCRT- accommodation services to visitors (2011) 524 Appendix 22: Naseby- all types of accommodation services – energy sources and facilities 526 Appendix 23: Naseby- self contained accommodation services, energy sources and facilities 526 Appendix 24: Naseby- B&B accommodation services, energy sources and facilities 527 Appendix 25: Naseby- hotel accommodation services, energy sources and facilities 527 Appendix 26: Naseby- camping accommodation services, energy sources and facilities 527 Appendix 27: Naseby- all accommodation services by type- energy sources and facilities 527 Appendix 28: Naseby- cultural products and activities 528 Appendix 29: Cromwell- self-contained accommodation services, energy sources and facili-ties
529
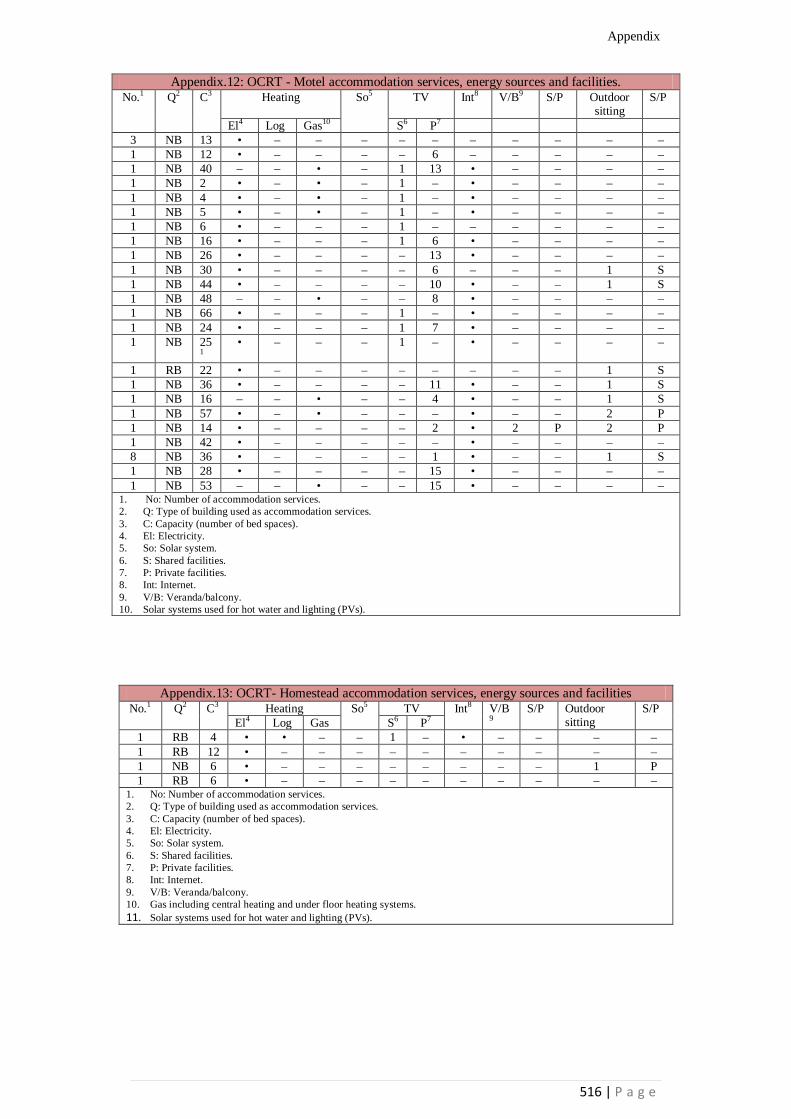
Appendix 30: Cromwell- B&B accommodation services, energy sources and facilities 529 Appendix 31: Cromwell- motel accommodation services, energy sources and facilities 530 Appendix 32: Cromwell- camping accommodation services, energy sources and facilities 530 Appendix 33: Cromwell- all types of accommodation services, energy sources and facilities 531 Appendix 34: Cromwell- cultural products and activities 532 Appendix 35: Cromwell- outdoor activities 533 Appendix 36: Cromwell- subjects offered to visit and their frequency 533
xvii | P a g e
Glossary AT: Alternative Tourism B&B: Bed and Breakfast BBQ: Barbecue BC: Bio Capacity Bp: Backpacker C: Capacity (number of bed spaces) cap: Capita CBET: Community Based Ecotourism of Thailand CF: Cultural Footprint CODC: Central Otago District Council CPC: Central Product Classification CTD: Community Tourism Development DOC: Department Of Conservation eaNNp: Environmental Adjusted Net National Income ECF: Economic Footprint EF: Ecological Footprint EL: Electricity FCS: The Framework for Cultural Statistics GDP: Gross Domestic Products GDPs: Sustainable Portion of GDP gha: Global Hectare GJ: Gigajoule GNP: Gross National Product CSP: Tidal and Concentrating Solar Power GST: Goods, Services Tax HS: Harmonized Commodity Description and Coding System ICATUS: International Classification of Activities for Time-use Statistics ICH: Intangible Cultural Heritage IFACCA: The International Federation of Arts Councils and Culture Agencies Int: Internet ISCO: International Standard Classification of Occupations ISIC: International Standard Industrial Classification kWh: Kilowatt Hour MCMS: The Ministry of Culture, Madrid, Spain MJ: Megajoule NB: New Building NGO: Non Governmental Organisation NI: North Island NV: Number of Visitors NRC.U.S: National Research Council (U.S.) NZCTU: New Zealand Council of Trade Unions NZTS: New Zealand Tourism Strategy OCRT: Otago Central Rail Trail PV: Solar photovoltaic panel OECD: Organisation for Economic Development and Co-operation QCPA: Quantity of Cultural Product RB: Refurbished Building SC: Self-Contained SCT: Sustainable Community Tourism Sg: Genuine Saving SI: South Island SNZ: Statistics New Zealand So: Solar Water Heating System SPC: Secretariat of the Pacific Community TAT: Tourism Authority of Thailand TIES: The International Ecotourism society T-km: Tourism-kilometre UIS: The United Nations Education Scientific and Cultural Organisation
xviii | P a g e
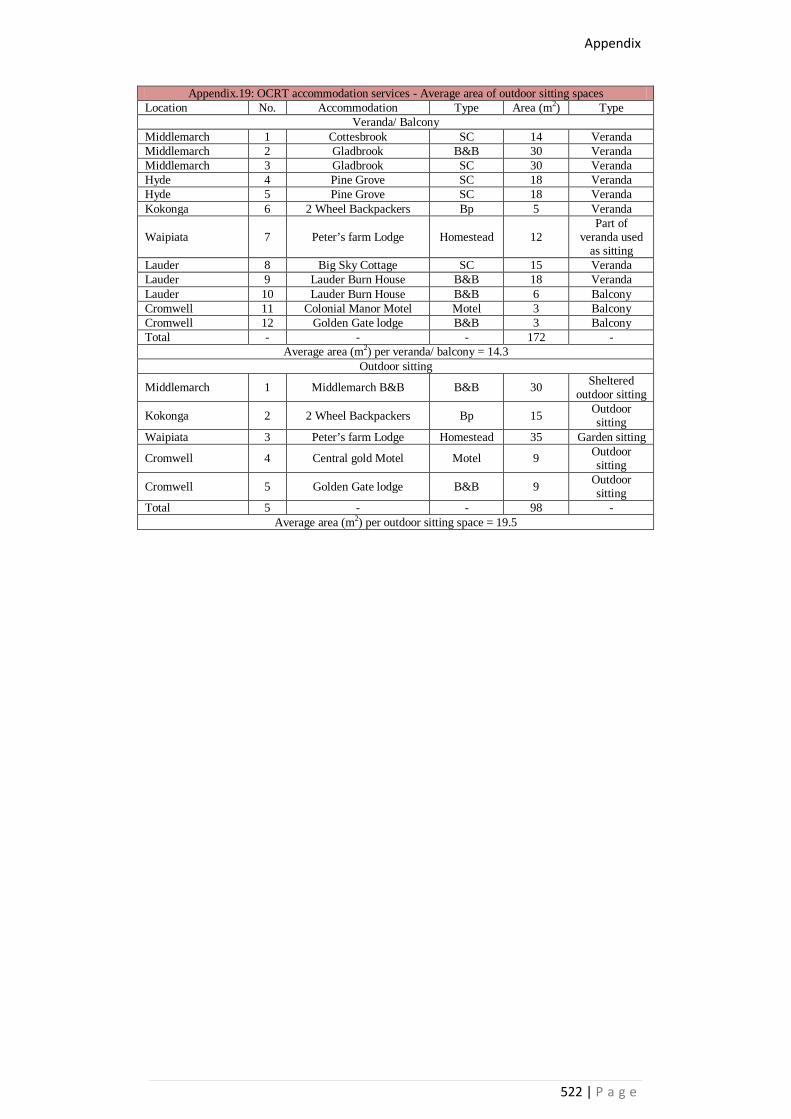
UN: United Nations UNCSD: United Nations Commission on Sustainable Development UNDP: United Nations Development Programme UNEP: United Nations Environment Programme V/B: Veranda/ Balcony WCED: World Commission on Environment and Development WCOCAD: The World Commission on Culture and Development WWF: World Wildlife Fund
Chapter 1: Abstract and Introduction
1 | P a g e
Chapter 1: Abstract and Introduction
1.1. Thesis Abstract This thesis proposes a composite framework for the evaluation of the environmental impact of tourism development on host destinations. In this study, the environmental impact of tourism is considered as a social-ecological phenomenon that can be catego-rized into the two aspects of natural and social-cultural impacts. Ecotourism is intro-duced as a type of sustainable tourism in that its policies and principles for development are based on conservation of environmental heritage (including natural and cultural her-itage) via engagement of local people and communities in the tourism development pro-cess. The proposed composite framework arises from the integration of an ecological and a cultural framework for the sustainable development of tourism. This framework places the conservation of natural resources as the main ecological outcome for eco-tourism. The proposed framework uses the ecological footprint (EF) of the main tourism activi-ties and services (including transportation, food and accommodation services) as the ecological indicator for evaluation of ecotourism development to ensure it is ecological-ly compatible. Ecological footprint (EF) is a way of measuring environmental impact. It assumes that everything needed for living, including all energy, goods and services can be obtained from land, and that any wastes produced can be absorbed by land (Wackernagel and Rees, 1996:9). Because land productivity varies considerably around the world the av-erage global productivity is the normal measure, and this is called global hectares (gha). The ecological footprint of a product or activity produced/ consumed and conducted by a defined group of people can be measured through the following equation:
EF (gha) = Lifecycle energy use of a given group of people (product and activity pro-duced or conducted) Gigajoules (GJ) / carrying capacity of the Earth (GJ/gha)
The above equation determines the area required to produce resources and to absorb pollutants like carbon dioxide generated in the lifecycle energy use of the product or activity through using fossil fuels (coal, oil and natural gas).
Through using an ecological perspective, this thesis views culture as a system that links a group of people or a community to their surroundings through their use of local mate-rials and energies, and the production and consumption of products from these. The proposed framework determines the main cultural outcomes for ecotourism develop-ment such as conservation of heritage and making the host people aware of their cultural values. In addition, it introduces related activities such as social events, conservation of heritage and producing and consuming local products as contributive activities for achieving the outcomes stated above. Furthermore it investigates and refines a number of indicators that can be used as tools for evaluation of the cultural footprint of the de-
Chapter 1: Abstract and Introduction
2 | P a g e
velopment of ecotourism. Within these, local gross domestic product (GDP) as a social- economic indicator arising from tourism activities is also considered.
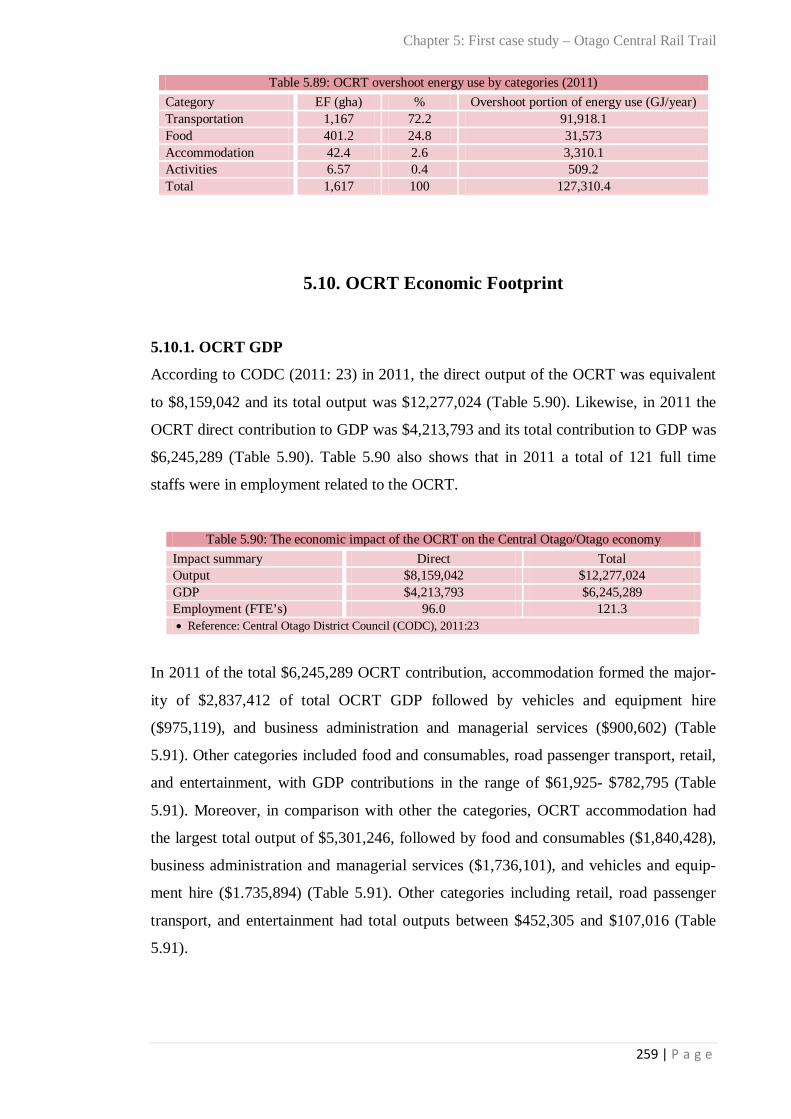
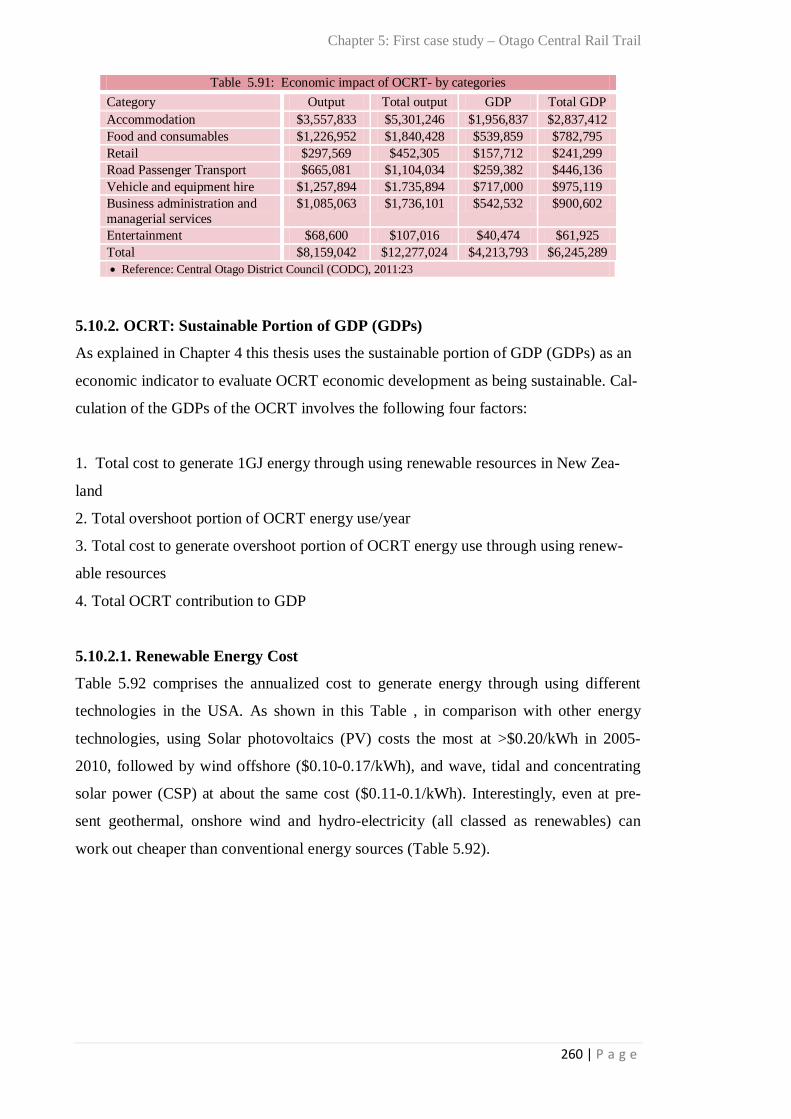
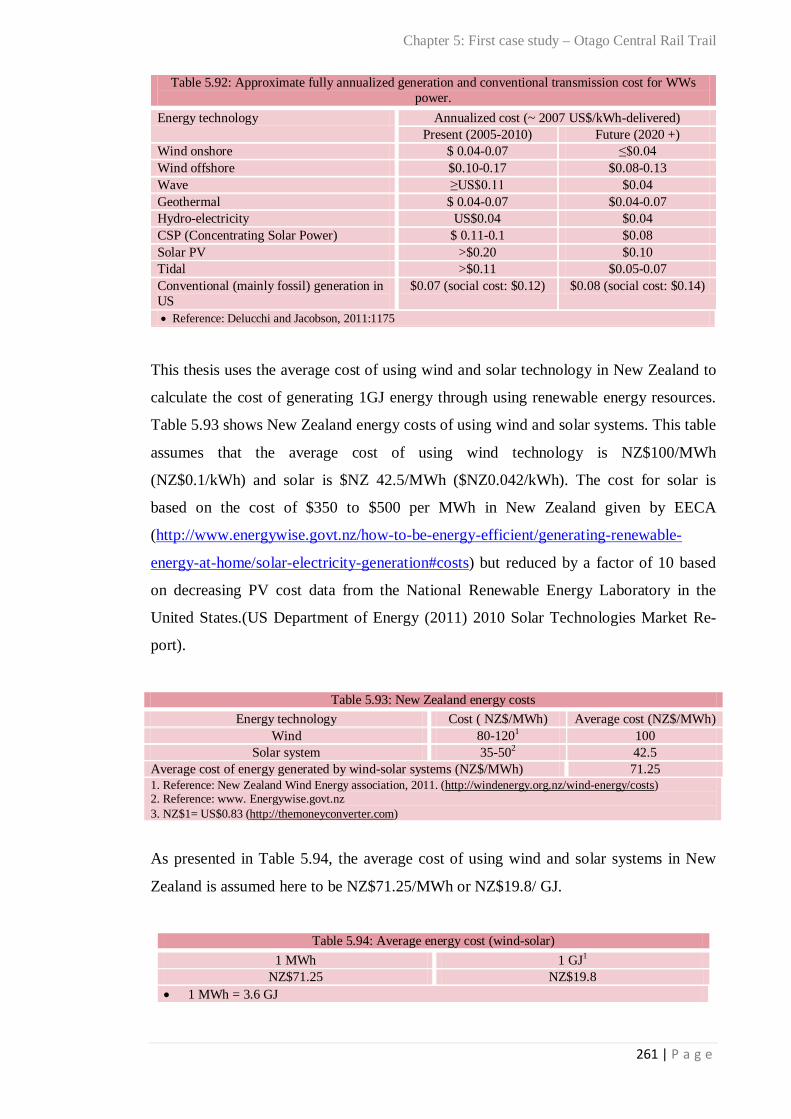
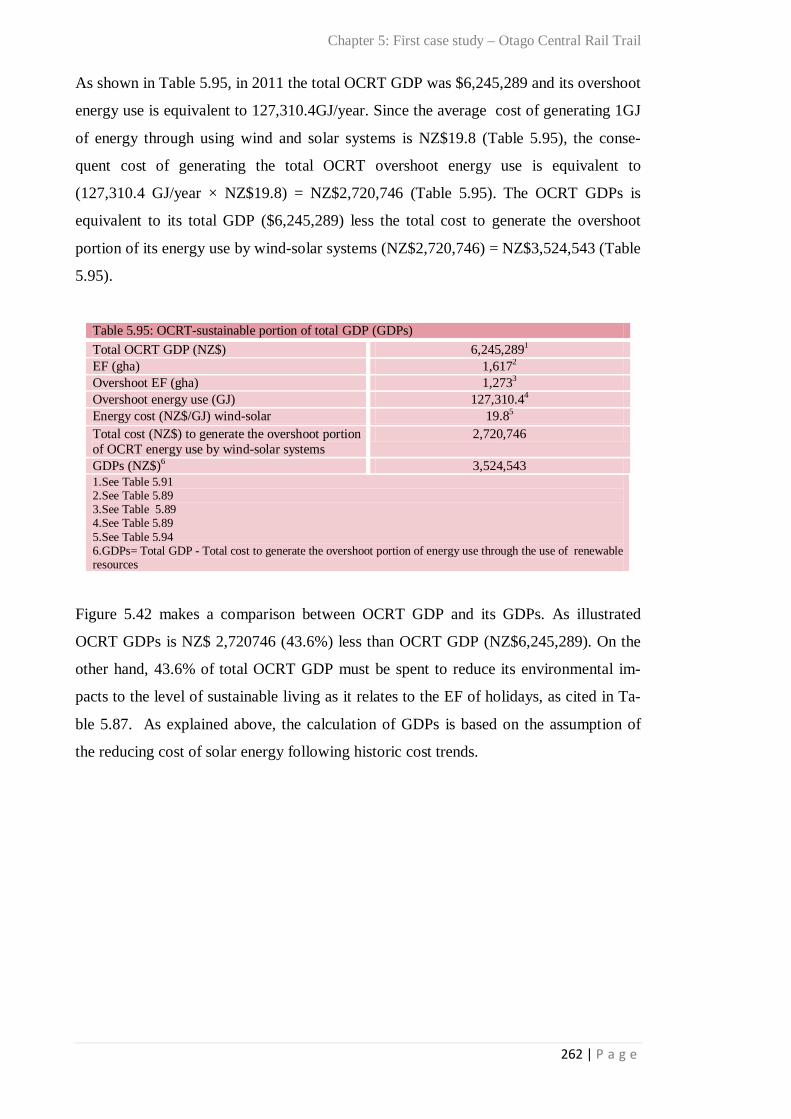
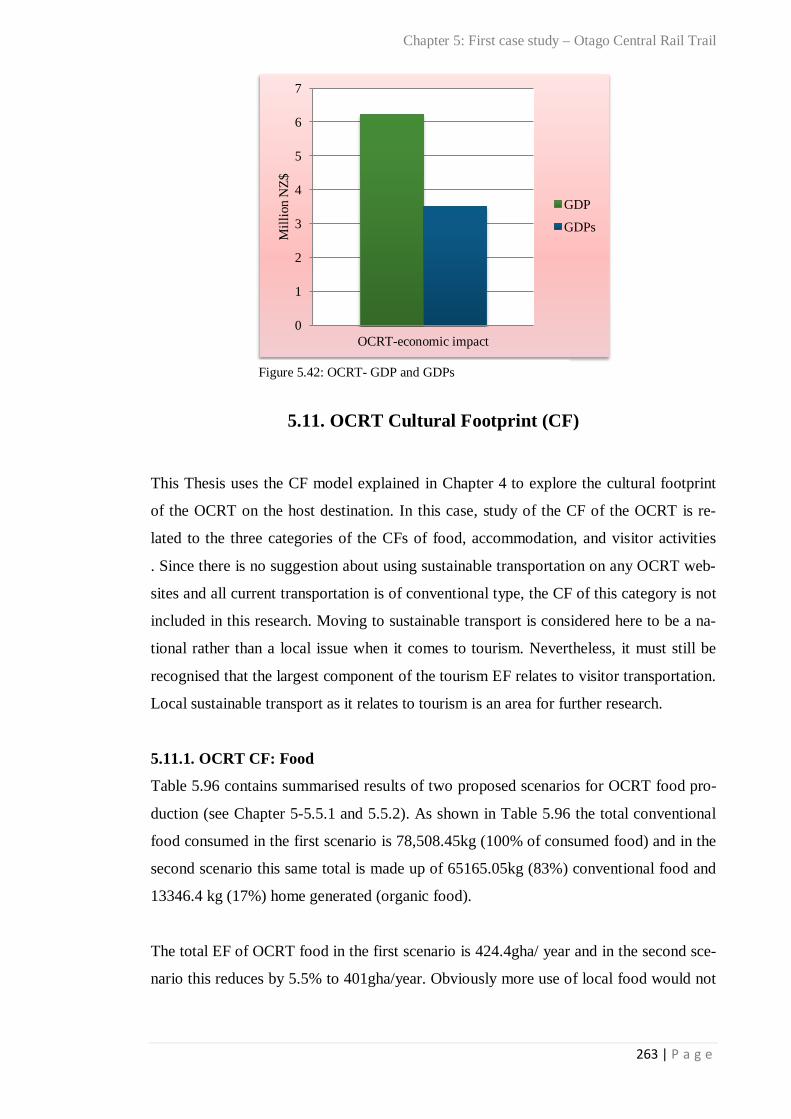
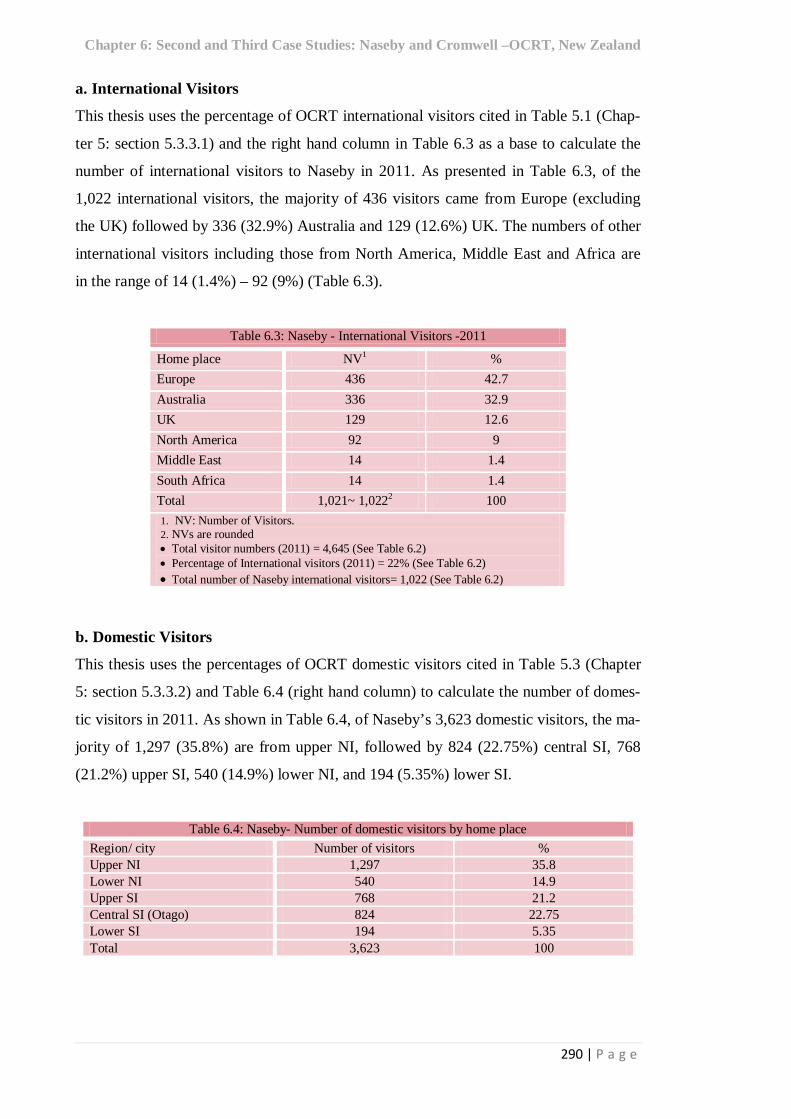
This thesis concludes by presenting a case study of ‘The Otago Central Rail Trail’ (OCRT) as an example of ecotourism. The OCRT was introduced in the New Zealand Tourism Strategy (NZTS) for 2015 as a successful model for community-based devel-opment of sustainable tourism. The investigation reviews the impacts of the OCRT on natural and cultural heritage by using the framework developed in the thesis and its re-lated ecological and cultural indicators. Through using the proposed holistic framework and the model for sustainable develop-ment of ecotourism, this thesis finds that, influenced by the development of the OCRT, many cultural heritage items including 60 bridges, 3 tunnels, and 78 buildings (used as OCRT accommodation services) have been refurbished. The restoration of this heritage can be considered as a policy that contributes to awareness of OCRT residents of their cultural heritage and identity. Likewise, as a part of the educational process related to ecotourism, this also makes an opportunity for OCRT visitors to learn about the cultural values of their host people. As shown in Table 5.84, in 2011, the total EF of 11,788 OCRT visitors including the EFs of the four categories of transportation, food, accommodation and activities is 1,617 gha (0.138 gha /visitor). In comparison with the EF of 0.03 gha/ visitor for sustainable tourism (see Table 5.86), the overshoot portion of the EF of the OCRT is equivalent to (0.138 – 0.03) 0.108 gha/ visitor. Likewise the total overshoot EF of 11,788 OCRT visi-tors is (11,788 visitors × 0.108 gha) 1,273 gha (see Table 5.86). This overshoot EF of the OCRT indicates that although the project has already been considered as a success-ful sustainable tourism project, still needs to reduce its total EF by 1,273 gha to be envi-ronmentally sustainable. As determined in Chapter 5 (see Table 5.88), the overshoot portion of the OCRT is cal-culated as 127,310.4 GJ/year. Since the costs to generate 1 GJ of overshoot energy use through using renewable energy sources (in this case wind + solar) is NZ$ 19.8, conse-quently the total cost to generate the overshoot energy use of the OCRT through using the latter systems (wind + solar) is equivalent to (127,310.4 GJ × NZ$ 19.8) NZ$ 2,720,746. Table 5.90 shows that in 2011, the total GDP of the OCRT is NZ$ 6,245,289 This means the total cost that must be spent to generate the overshoot portion of the OCRT energy use in a sustainable way (NZ$ 2,720,746) is 43.6% of its total GDP (NZ$ 6,245,289). Consequently the sustainable portion of the GDP (GDPs) of the OCRT is (NZ$ 6,245,289 – NZ$ 2, 720,746) NZ$ 3,524,543.
The results of this thesis demonstrate that using local products (e.g. home prepared foods) as a sustainable cultural behavior not only contributes to the ability of the host destinations located along the OCRT (such as Naseby and Cromwell, used as further case studies) to present their cultural products, but also contributes to reduce the envi-ronmental impacts and increase the economic outcomes of the OCRT. For example, producing 17% (13,346.4 kg) of the total of 65165.05 kg consumed food as home pre-pared food reduces by 5.5% the ecological footprint related to the food consumed by OCRT visitors. As determined in Chapters 5 and 6, in three case studies, producing
Chapter 1: Abstract and Introduction
3 | P a g e
home prepared food contributes in a sustainable way to the increasing of the economic outcomes by about NZ$3.5 / kg of food produced. This thesis indicates that in all three case studies, using refurbished buildings as ac-commodation services, which is considered as an activity that contributes to preserving the cultural identity of the host destinations also contributes to reducing of environmen-tal impacts and increasing the economic outcomes related to OCRT. For example in OCRT using 12.9% of bed space as refurbished buildings reduces by14.5% (7.3gha) the total 50.5 gha ecological footprint of accommodation services compared with when all accommodation buildings are assumed as new buildings. Chapters 5 and 6 determine that in OCRT using 21,378 m2 of refurbished buildings as accommodation services (12.9% of total bed spaces) increases by 5% the sustainable portion of GDP related to accommodation services. In Naseby also using refurbished buildings as accommodation services has the same sustainable ecological, cultural and economic outcomes as for the OCRT as a whole. The framework indicates the use of open air areas as being a cultural-ecological indica-tor for evaluation of architecture as being sustainable. Through using the framework, it is determined that using open air areas including balconies and verandas as part of OCRT accommodation buildings exerts environmentally friendly influences on the host destination. For instance in OCRT using 387 square meters of veranda and balcony as part of the 80,356m2 accommodation buildings decreases by 1.5% the total ecological footprint (50.5gha) of buildings used as accommodation services in OCRT.
The thesis results demonstrate that an architecture that will contribute to sustainable de-velopment through ecotourism has a cultural footprint area in which the architecture contributes to the host societies knowing and preserving their cultural identity, capitals and heritages. Simultaneously, it contributes to reducing the environmental impacts and increasing the economic outcomes of the host societies through ecotourism. This thesis determines that since all ecological, cultural and economic characteristics of sustainable architecture are linked together, a strategy to develop sustainable architecture is success-ful when it considers the linkage between all of these profiles and influences that they exert on each other.
1.2. Introduction
This thesis proposes a comprehensive framework and related indicators that can be used
as tools to explore and evaluate the main environmental, cultural and economic charac-
teristics of an architecture that contributes to sustainable development through ecotour-
ism. The need for such a comprehensive framework arises from the experiences of the
author who was involved with planning tourism projects in his home country between
1995 and 2007. This work revealed that the lack of a holistic strategy for tourism devel-
opment meant the environmental, cultural and economic heritage and capitals of the
host destinations were impacted by tourism. Likewise, one of the main goals of tourism
Chapter 1: Abstract and Introduction
4 | P a g e
development and its architecture, the goal of human well-being, can be ignored due to
the lack of a comprehensive approach to tourism and its development.
This thesis involves three main subjects: sustainability, ecotourism and architecture.
Since sustainability is considered as an umbrella that covers all human activities and
products, in this thesis sustainability and its policies and principles for sustainable de-
velopment are considered as factors that make a link between ecotourism and its related
architecture.
In addition, the holistic framework for sustainable development of ecotourism and ar-
chitecture arises from the dominant polices and principles of sustainability. This study
explores the current examples of the strategies (for example the New Zealand Strategy
for the Sustainable Development of Tourism) and the proposed models for sustainable
development of tourism, and determines the knowledge gap in this field that must be
bridged for sustainable development of ecotourism and its related architecture. In Chap-
ter 2, sustainability and its related policies and principles for development and strategies
for the sustainable development of ecotourism and architecture are investigated. The
literature review in Chapter 2 indicates lack of a comprehensive framework as the main
knowledge gap for the sustainable development of ecotourism and architecture.
1.2.1. Sustainability
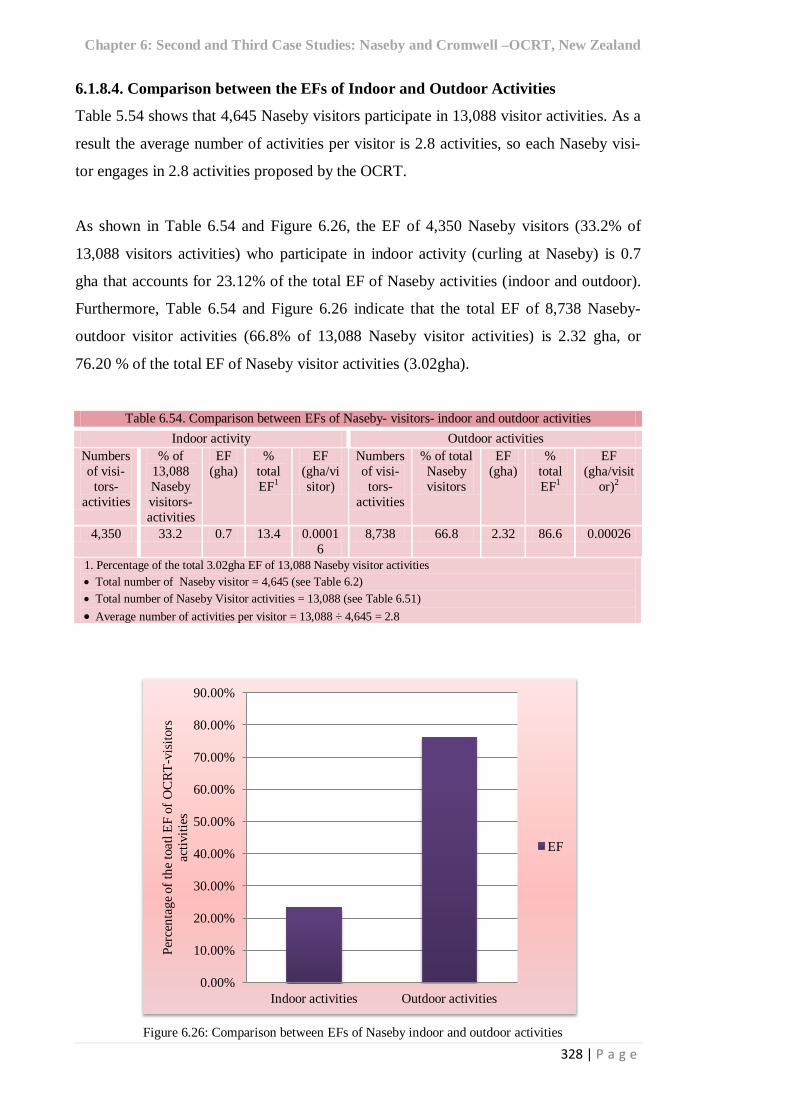
Sustainability is introduced as a multi-dimensional phenomenon that involves the three
categories of: environment, society and economy. In sustainable development these
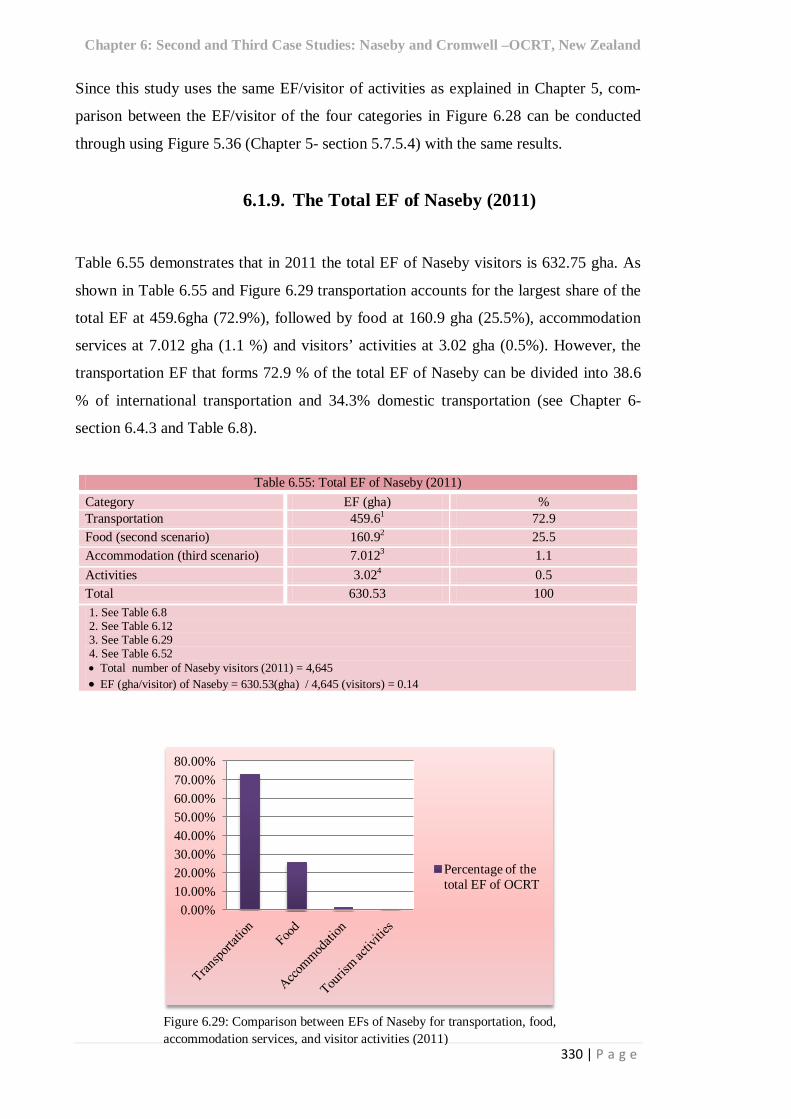
three categories overlap to preserve environmental resources, promote and conserve
socio-cultural capitals and heritage and develop the economic system in a way that re-
sponds to the needs of present and future generations.
Sustainable development is considered as a process in which all components of a given
society are engaged in environmental, cultural and economic development through a
social and educational process. Arising from this perspective the main anticipated out-
comes for sustainable development are categorised into the three categories of: envi-
ronmental, socio-cultural and economic outcomes.
The conservation of natural resources is viewed as the main environmental outcome for
sustainable development that is considered a social-ecological phenomenon rather than
Chapter 1: Abstract and Introduction
5 | P a g e
merely a technologically based process. Likewise achieving the environmental outcome
for sustainable development is linked with other aspects of social and economic policies
operated for development. In this thesis the main cultural outcomes for sustainable de-
velopment are considered as awareness of local and indigenous people about their envi-
ronmental and cultural capitals and heritage, and engagement of these culturally edu-
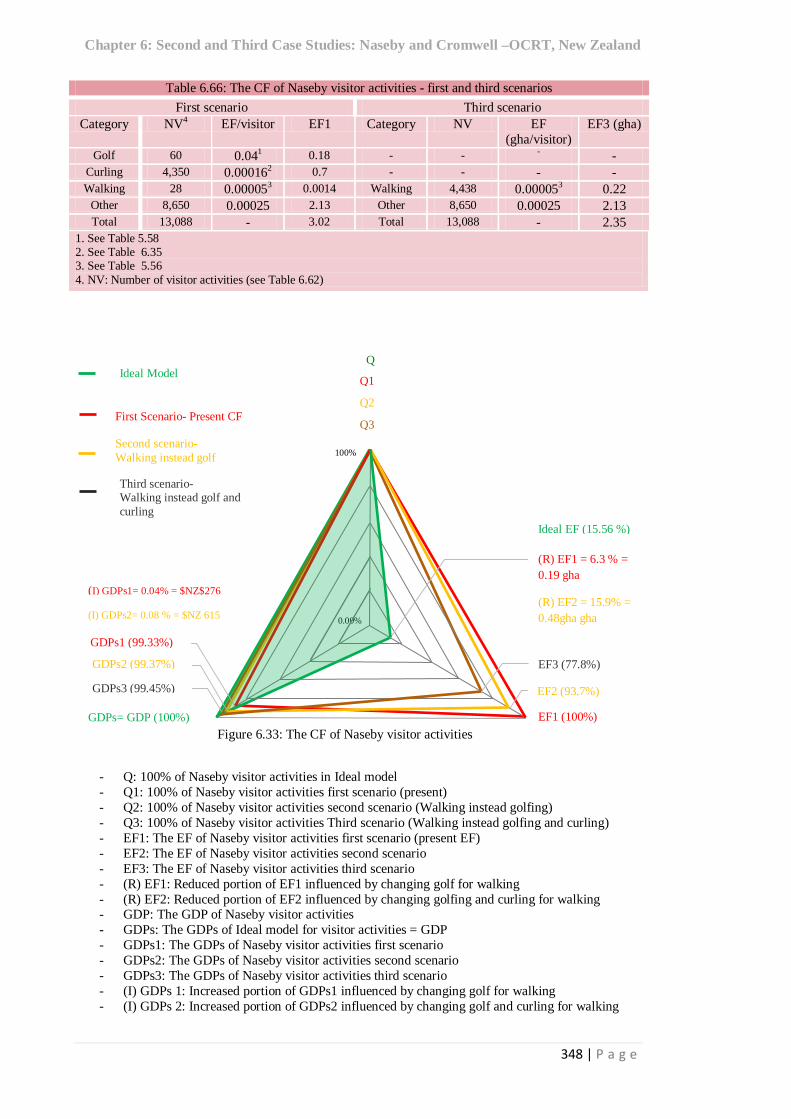
cated people in planning, management and monitoring of the sustainable development
process. The main economic outcomes for sustainable development are introduced as
equal distribution of natural, cultural and economic capitals among all components of a
given society and engagement of them in a horizontal economic development.
In this thesis all of the mentioned above outcomes for sustainable development are
linked together and contribute to each other during the course of operation.
1.2.2. Ecotourism
In this thesis ecotourism is considered as a sustainable part of mass tourism that follows
the main principles of sustainable development. The main anticipated cultural outcome
for the sustainable development of ecotourism is explained as awareness of people
about their environmental and cultural capitals and heritage. Ecotourism is introduced as
a set of purposeful nature based activities that has the ability to change the attitude of its
host society to environmental, social and economic problems caused by development of
capitalism. This can be viewed as influences exerted by ecotourism on its host destina-
tion towards being more sustainable. In this thesis these influences are defined as the
cultural footprint of ecotourism and its products and activities on the host destination.
1.2.3. Architecture
Architecture is viewed as one of the ecotourism products that can contribute to sustain-
able development through ecotourism. In this thesis a given host destination or commu-
nity is explained as an organism that has spiritual and physical interaction with its sur-
rounding environment. In addition, architecture is explained as part of the social prod-
ucts that contribute to the interaction between society and its surrounding environment
towards being sustainable through using spaces, materials and renewable source of en-
ergy in a sustainable way. The main cultural outcomes for architecture used as one of
the ecotourism products are the same as the anticipated cultural outcomes for sustain-
able development of ecotourism. These outcomes include awareness of people about
their cultural and environmental capitals and heritage and engagement of local people in
Chapter 1: Abstract and Introduction
6 | P a g e
the sustainable development process through architecture used in ecotourism develop-
ment.
1.2.4. Knowledge Gap
This thesis investigates the shortage of a comprehensive framework for assessing the
sustainable development of ecotourism and its related architecture that can be used as a
tool to determine the main ecological, cultural and economic characteristics of these two
sustainable phenomena. On the other hand the shortage of a holistic strategy for ecot-
ourism development and its architecture that has the ability to make a link between the
main characteristics of both ecotourism and architecture as being sustainable is intro-
duced as the main knowledge gap in these fields.
1.2.5. Key Research Question
Since the author of this thesis has already been involved with planning and development
of rural and urban tourism and ecotourism in his home country, Iran, from 1988 to
2007, this has revealed how the negative impacts of uncontrolled tourism development
and its modern products, such as architecture, can change the lifestyle of the host desti-
nation in a unsustainable way. It has also been determined that the top down approach
to the planning, management and monitoring of a process like tourism development is
not efficient when the major roles of local and indigenous people are ignored in whole
process.
Moreover, it has been determined that the sustainable development of tourism and its
architecture needs a holistic strategy beyond the economic and political goals arising
from the development of capitalism. As some of the currently used modernised tourism
products exert negative impacts on environmental resources, traditional lifestyle and
cultural heritage of the host societies in Iran, the main key question has been formed as:
What are the main characteristics of an architecture that will contribute to sus-
tainable development through ecotourism?
1.2.6. Comprehensive Framework
The comprehensive framework proposed for sustainable development of ecotourism and
its products and activities is separated into the two sections:
1) a framework for ecotourism development
Chapter 1: Abstract and Introduction
7 | P a g e
2) a framework for sustainable development of architecture (which here contains ac-
commodation services) used in ecotourism development.
The comprehensive framework indicates the main environmental, cultural and economic
outcomes for ecotourism and its architecture, and proposes the productive activities that
can contribute to achieving these outcomes. The comprehensive framework is concep-
tualised in a holistic model that has the ability to make a link between the social behav-
iours of the host societies and visitors, their environmental impacts and economic foot-
print. On the other hand the holistic model proposed for sustainable development of
ecotourism and its products (including architecture as a part of the used built up land)
determines an area introduced as their cultural footprint area formed by the social-
cultural behaviours of the ecotourism participants, and their ecological and economic
footprints.
This thesis uses three case studies in Otago, New Zealand: the Otago Central Rail Trail
(at regional scale), and the settlements of Naseby and Cromwell (at urban scale) that are
considered host destinations for rural and urban New Zealand ecotourism (soft ecotour-
ism). The proposed framework and holistic model for sustainable development of ecot-
ourism and architecture will be tested in these three case studies to determine the link-
age between ecological, cultural and economic characteristics of ecotourism and archi-
tecture in terms of sustainability.
In the 2009 provisional proposal for this thesis, Iran and New Zealand were proposed as
the case studies for comparison of the sustainable development of tourism. The main
reason for choosing these two countries was the differences between their environ-
mental circumstances, cultural background, heritage and capitals, and economic sys-
tems. Both countries attended the 1992 Rio summit and approved Agenda 21 as their
main policy for development. Consequently it was anticipated the outcomes for tourism
development in both countries would follow a similar strategy. However, as the envi-
ronmental, cultural and economic activities in the two countries are different, the pro-
ductive activities contributing to achieving sustainable development of tourism could be
different. For example, in New Zealand development of wineries could be seen as an
activity that contributes to achieving conservation of cultural heritage and development
of cultural capital, while in Iran, development of the Iranian rug (as a handcraft) or pro-
duction of saffron (in north-east Iran) could play a similar role. Consequently the main
Chapter 1: Abstract and Introduction
8 | P a g e
anticipated outcomes for both Iran and New Zealand could be same but the setting, pri-
orities and productive activities to achieve the forecasted outcomes would be different.
Over a year after the research was started the Iranian government issued a statement that
no overseas thesis could include an Iranian case study. There was a consequent urgent
need to select a second case study. In addition to the original New Zealand OCRT case
study, Naseby and Cromwell were selected as two locations within the OCRT for sepa-
rate investigation, and together these formed the second case study. These two places
were chosen because they have different cultural heritage, environmental circumstances
and attractions for visitors (as explained in the thesis). The differences between Naseby
and Cromwell in terms of these aspects allow the proposed framework for sustainable
development of ecotourism and its related architecture to be tested against the OCRT as
a whole.
I.2.7. Thesis Structure
This thesis contains seven Chapters comprising introduction (Chapter 1), literature re-
view (Chapter 2), research methodology (Chapter 3), comprehensive framework (Chap-
ter 4), first case study (Otago Central Rail Trail Chapter 5), second and third case stud-
ies (Naseby and Cromwell Chapter 6) and conclusion (Chapter 7).
The next Chapter investigates the three areas of sustainability ecotourism and architec-
ture, the relationship between these areas, and the knowledge gap in terms of sustain-
able development of ecotourism and its architecture. The final section of Chapter 2 in-
troduces the key research questions of this thesis which are integrated in its main key
research question briefly explained in section 1.2.5.
Chapter 2: Literature review
9 | P a g e
Chapter 2: Literature Review
This chapter reviews literature on sustainability, ecotourism and architecture as the three
main components considered in this thesis. The aim here is to identify: the relationship
between these areas the factors that exert influence on this interaction, and uncover the
knowledge gap in relevant policies and strategies for the development of ecotourism and
its related architecture through sustainability. The discussion begins with a definition of
sustainability, this is followed by explanation of its necessity, and its models, character-
istics, goals, principles, framework and related indicators.
The literature review continues with a definition of ecotourism, introducing its envi-
ronmental, social and economic effects on the host areas. It continues with an explana-
tion of strategies for the sustainable development of tourism and its subsectors, such as
ecotourism, by using the New Zealand Tourism Strategy 2015 (NZTS 2015) as an ex-
ample. The next part of this literature review discusses sustainable architecture and its
mutual relationship with environmental, societal and economic systems. Examples are
given through use of the clustered villages of Nuristan in Afghanistan and the historic
city of Kerman in Iran as examples of vernacular architectures and traditional urban fab-
rics. At the end, this literature review explains the main factors that make a link between
ecotourism and its related architecture; it discusses the shortage of the writings that fo-
cus on ecotourism’s architecture, and presents the key question of this thesis.
2.1. Sustainability
This thesis views sustainability as a key factor that plays an important role in defining
ecotourism and architecture and in determining the main policies and strategies for their
development. The reasons for this are discussed below.
2.1.1. Definition of Sustainability
Appleby (2011:7) argues that the roots of modern sustainability and related energy pol-
icy lie in the scenario proposed by the 18th century political economist Thomas Mal-
thus, commonly known as the Malthus Catastrophe or Nightmare. In this scenario Mal-
Chapter 2: Literature review
10 | P a g e
thus forecasted that “population growth would outpace agricultural production” (Ap-
pleby, 2011:7). Since the onset of the industrial revolution in the latter parts of the 18th
century and the subsequent development of capitalism, numerous catastrophic events
have happened in the world (for instance famines and conflict in African countries such
as Ethiopia and the Sudan) that suggest the truth of the ‘Malthus Catastrophe or Night-
mare’ as people struggle for control of insufficient resources.
The World Commission on Environment and Development (WCED) has put forth the
definition of sustainability as “meeting the needs of the present without compromising
the ability of future generations to meet their needs” (Kim and Rigdon, 1998:6). This
concept of sustainable development, which was established in the Brundtland Report
(WCED, 1987), attempts to support continuous development of human societies for the
present and future generations. “The concept also emphasizes balance of growth in so-
cial, economic and environmental aspects which are regarded as the key attributes that
support the development of a sustainable society.” (Robin and Poon, 2009:3616). How-
ever, this very definition raises questions, as ‘growth’ in environmental aspects within a
finite system like planet earth is itself not a sustainable activity.
As the Board on Sustainable Development of the U.S. National Academy of Science
identifies, through sustainable development “what is to be sustained fall into three major
areas of nature, life support system and community” (NRC.U.S, 1999:23). They also
identify intermediate categories for each such as earth, environment and cultures. Like-
wise, “what is to be developed [through sustainable development], also fall within three
major areas of people, economy and society” (NRC.U.S, 1999:25).
2.1.2. The Necessity for Sustainability
Nowadays, humans are faced with different issues like uncontrolled growth of popula-
tion, dramatically expanding urban areas and, consequently, increasing needs to use
more energy resources, as well as degradation of the environmental heritage and un-
equal distribution of capital.
Due to the industrialisation and the expansion of modernisation, urban areas throughout
the world have increased in size and population. According to Omer (2008:2272), about
50% of the world’s population are urban dwellers. In addition, he (2008:2272) reveals
Chapter 2: Literature review
11 | P a g e
that all population growth expected between 2000 and 2030 will be concentrated in ur-
ban areas because of the rural-to-urban shift of populations. Furthermore, with an ex-
pected annual growth of 1.8%, the world’s urban population will double in 38 years. In
terms of resource consumption, at present 2% of the land surfaces in the world are cov-
ered by cities, yet the people living in them consume 75% of the resources consumed by
humankind. Omer (2008: 2272) points out that the ecological footprint of cities is many
times larger than the areas they physically occupy. Continued growth of the world’s
population has caused serious need to use all sources of energy, particularly fossil fuels
like oil and gas. As many researchers such as Appleby (2011:7) point out if everyone in
the world lived like the average North American “we would need a planet five time big-
ger that the earth to live on” (Appleby, 2011:7). This is obviously an unsustainable
situation.
2.1.3. Models of Sustainability
Vale and Vale (2009:10) discuss the two models for portraying the meaning of sustain-
ability; the ‘weak model’ and the ‘strong model’ of sustainability. According to Vale
and Vale (2009:10) in the weak model of sustainability, the three main components of
sustainable development, the environment, human society and the economy are repre-
sented by three intersecting circles of equal size and values (Figure 2.1).
In the weak model of sustainability, the three main components are portrayed as com-
peting interests so that degradation of one can be compensated for by improvement in
Sustainability
Environment
Society
Economy
Figure2.1: Weak model of sustainability
Chapter 2: Literature review
12 | P a g e
another. In the strong sustainability model, as explained by Vale and Vale (2009:10) the
environment is considered as a circle in which society (as a base for human activities) is
set (Figure 2.2). In this model, the environment is considered as the main foundation,
which strongly exerts influences on society, culture and all their subsectors such as the
economy, architecture, politics, art etc. (Figure2.2).
As a reason to make an effort to move towards environmental conservation through sus-
tainable development as a priority policy, it could be conjectured that “if we destroy the
environment, which sustains us and provides our air, water and food, then we will de-
stroy human society; if we destroy human society; we will certainly destroy the econ-
omy” (Vale and Vale, 2009:11).
Although the main anticipated outcome for sustainable development is environmental
conservation, its process must be started from economic development in a sustainable
way which is conducted by educated societies. Natural capital, physical or produced
capital, human capital and social capital are four factors that determine sustainable de-
velopment. “Sustainability or the capability of future generations to meet their needs is
ensured when the total stock of these assets remains constant or is increased in the pro-
duction process” (Veron, 2001:602). As Graff et al (1995:205) reveal, in sustainable
development, economic, cultural and social developments are interrelated. They
(1995:205) argue that in sustainable development environmental problems cannot be
isolated from others such as poverty and social disintegration. Likewise, economic
growth makes poverty alleviation easier and cultural development can change the pat-
Figure 2.2: Strong model of sustainability
Environment
Society
Economy
Chapter 2: Literature review
13 | P a g e
tern of the consumption of natural resources in order to ensure their protection. Fur-
thermore, social education and development can also exert influences on economic
growth in an economically sustainable way. For example, decentralisation and democra-
tization in developed societies may lead local economic systems toward more equal dis-
tribution of capital among the local participants.
Environmental sustainability exerts positive impacts on development of human capital
because all humans are part of nature. Thus, the environment plays an important role in
ensuring human survival, health, social life, sustainable energy production, food pro-
duction and access to clean drinking water and clean air. Generally, sustainability is
viewed as a phenomenon that is a common area between environmental conservation,
cultural restoration and promotion and socio-environmental economic adaptation. Using
a social perspective, sustainability can be viewed as a way in which an educated group
of people or societies can choose to live in an effort to conserve their environmental and
cultural heritage and capitals and develop their economic system. It strives to present a
comprehensive strategy which covers all human activities and products and adapt them
with sustainable patterns of consuming the natural and cultural resources in the devel-
opment process.
2.1.4. Fundamental Characteristics of Sustainability
Culture, environment and economy, as categories that are subject to conservation and
development in the sustainability process, can be changed in terms of their relative posi-
tions depending on different places and times. Consequently, sustainability is an inher-
ently dynamic, indefinite and contested concept. “Sustainable development must, there-
fore, be seen as an unending process-defined not by fixed goals or the specific means of
achieving them, but by an approach to creating change through continuous learning and
adaptation” (Mog, 2004: 2139). Therefore, flexibility and adaptability in terms of dif-
ferent cultural, environmental and economic situations are the main factors, which can
be used as frameworks to evaluate sustainability. A sustainable development project
will be successful if its products (including cultural, natural and economic outputs) are
culturally appropriate, economically viable and environmentally sensitive.
To achieve sustainable development, indigenous people and their needs, natural re-
sources and the development of conservation policies to protect them, and local eco-
Chapter 2: Literature review
14 | P a g e
nomic systems and their shift toward sustainability must all be viewed as the main com-
ponents of progressive strategies. If a development project ignores some of these com-
ponents during its programming, management and implementation, it cannot be called a
sustainable project. For example, Mog (2004: 2143) argues that a project that reduces
land degradation but at the same time increases poverty or inequality, or achieves its
goals through the establishment of rigid institutions (e.g. forcing all farmers off a parcel
of land and establishing a strictly exclusionary protected area) would not be considered
successful in promoting sustainable development, no matter how great the improvement
in environmental quality. On the other hand a project which enhances environmental
quality in a culturally sensitive manner (e.g. through extension of appropriate conserva-
tion farming techniques) without having any positive impact on poverty, is also grossly
insufficient. As a result, projects which create significant positive change in many
realms while generating little or no negative impacts can be viewed as sustainable ac-
tivities.
2.1.5. Sustainable Development - Goals
One of the main aims for sustainable development is to reduce the use of non-renewable
energy resources. The World Summit on Sustainable Development in Johannesburg in
2002 committed itself to supporting and encouraging the expansion of renewable energy
resources to accelerate the shift towards sustainable consumption and production. It
could be argued that the main goal for the latter summit was to make productivity inde-
pendent from resource use. According to Omer (2008: 2270), breaking the linkage be-
tween resource use and productivity can be achieved by trying to ensure economic
growth does not cause environmental pollution. He (2008: 2270) argues that the main
policies for achieving the goal of a pristine environment are; improving resource effi-
ciency, examining the whole life cycle of the product, enabling consumers to receive
more information on products and services, and examining taxes, voluntary agreements,
subsidies, regulation and information campaigns regarding the best stimulation to inno-
vation. However, this approach still fails to recognise the fundamental problem that
there must be a limit to growth within a finite system.
2.1.6. Sustainability- Principles
One of the basic strategies to achieve the goals associated with sustainability is to make
societies aware of the components and structure of sustainability, its policies and bene-
Chapter 2: Literature review
15 | P a g e
fits. In 1991, the World Conservation Strategy (cited in Robin and Poon, 2009:3616)
stated the principles of a sustainable society include; respect and care for the commu-
nity; improvement in the quality of human life; conserving the earth’s vitality and diver-
sity; minimising the depletion of non-renewable resources; keeping within the earth’s
carrying capacity; changing attitudes and practices; enabling communities to care for
their own environments; providing a national framework for integrating development
and conservation; and creating a global alliance. According to the latter principles,
change of attitudes and practices can be viewed as a focal point for cultural shift toward
sustainability. Robin and Poon (2009:3616) point out that change of attitudes and prac-
tices means a transformation of mind-set and actions. These criteria demand changes in
the innate basic assumptions, values, beliefs and behaviour that are present in the estab-
lished culture of society.
2.1.7. Sustainability Frameworks and Indicators
Sustainable development is viewed as a multi-complex phenomenon that rests on three
pillars: “economic growth, social progress and protection of the environment and natu-
ral resources” (Hueting and Reijnders, 2004:250). Such a complex phenomenon cannot
be evaluated without the existence of a comprehensive framework that covers all the
components mentioned above. Although different frameworks and indicators like “eco-
logical footprint” (Wackernagel and Rees, 1996) and “Genuine Saving (Sg)” (Pearce et
al, 2001) in terms of sustainable development have already been suggested, most of
them do not cover all levels of production (global, national or local), environmental
conservation or social development. To explain more about indicators, their strengths
and weaknesses, some examples are given below.
2.1.7.1. Ecological Footprint
One of the alternative measurement mechanisms which emphasises environmental con-
servation is the ecological footprint. “The ecological footprint is an accounting tool that
estimates the resource consumption and waste assimilation requirements of a given
population or economy in terms of corresponding area” (Ness et al, 2007: 502). Accord-
ing to Ness et al (2007:502), ecological footprint is a multi-stage process which at-
tempts to estimate the average person’s annual consumption of food, housing, transport,
consumer goods and services in terms of the productive land needed to generate it.
Munda (2006:87) views the ecological footprint index as an indicator related to the idea
Chapter 2: Literature review
16 | P a g e
of urban carrying capacity. In this view, ecological footprint solves some of the prob-
lems of traditional carrying capacity simply by inverting the usual carrying capacity
proportions. Munda (2006:87) argues that ecological footprint computes the land area
required per person (or population) instead of presenting population per unit area.
The main core of the ecological footprint index is that every category of energy, mate-
rial consumption and waste discharged needs the productive or absorptive capacity of a
finite area of land or water. In fact, in terms of ecological footprint, if the land require-
ments for all categories of consumption and waste discharge by a defined population are
summed up, the total area represents that population’s ecological footprint. Of course,
this area can cover a region many times larger than the home region of the same popula-
tion. According to Munda (2006:87), the ecological footprint of a specified population
or economy is the area that would be required for providing all the energy and material
resources consumed, and absorbing all the waste discharged by a given population in a
given area.
a. Strengths and weaknesses of the Ecological Footprint
The Ecological Footprint (EF) index is an efficient way of showing the balance between
the quantity of products and environmental carrying capacity in a given area. In some
cases it will show how the ecological footprint of a given population can exceed the po-
litical frontiers of a country. It means, in the latter cases, economic development, con-
servation of natural resources and social promotion in a given area and population de-
pend on other countries, with their different economic systems, socio-cultural structures
and conservation policies.
Ecological Footprint can also look at components of a lifestyle. Looking at the land
used to produce, say, the current diet could cause intensive development of agriculture
production systems in an effort to lower the EF. Munda (2006:88) states that intensive
agricultural systems can reduce the horizontal expansion of a city but at the same time
will significantly increase energy consumption (in terms of intensive agricultural devel-
opment) and degradation of biodiversity, due to the use of fertilisers and pesticides and
the introduction of exotic species. Calculating the EF will reduce all these effects to a
single number for comparison with other food producing strategies.
Chapter 2: Literature review
17 | P a g e
Table 2.1 sets out the advantages and disadvantages of ecological footprints (EF) as de-
termined by Mayer (2008:286) and Walsh et al (2006:4). As demonstrated in Table 2.1,
the EF is a single unit ecological indicator that can be applied to different human activi-
ties and products, from food to transportation, to water consumption, to recreational ac-
tivities and built up land. Since the EF has the ability for continual updating, it can be
viewed as an efficient indicator for monitoring and managing the process of develop-
ment. The EF can be used to raise alarm about the shortcomings of policies related to
the conservation of finite natural capitals. It can also be used to make people aware of
environmental problems. As shown in this thesis, the EF has the ability to be combined
with other social and economic indicators, such as GDP. Its combination with such so-
cial economic indicators results in environmentally sensitive economic indicators such
as ‘Sustainable Portion of GDP’ (GDPs) (See Chapter 4- section 4.1.3.3).
Table 2.1 shows the accuracy and clarity of the EF and its results can also be viewed as
its dominant weaknesses. Since the measurement of the EF of a product and activity re-
lies on using related data, most of the shortcomings of the EF arise from the deficiency
of the information systems used for producing, managing, collecting and analysing data
at regional, national and global scales. On the other hand these weaknesses cannot be
considered as innate, but rather explained as weaknesses exerted on the EF by the defi-
ciencies of other factors, such current information systems.
Table 2.1: Advantages and disadvantages of the ecological footprint Advantage of EF Disadvantage of EF
Single unit indicator that allows disaggrega-tion.
Mostly hypothetical land uses
Widely applicable to activities Can oversimplify resource use Top down or bottom up Detailed studies incur uncertainty, particularly at
sub-national level. Useful communication tool Double counting is always a risk. Continually being updated and improved Mostly snapshots of consumption. Demonstrates the finite nature of natural capi-tals
Provides no clear policy guidance except to con-sume less or create additional productive land.
Growing credibility as a policy tool Based on sometimes doubtful assumptions Measurability and comparability for systems of any scale, from bio fuel production systems to urban areas, to nations and the human spe-cies.
Can be difficult to reconcile annual consumption with the necessarily much slower provision of bio-capacity.
Addressing intergenerational equity and in-ternational fairness.
May not be a completely accurate representation of strong sustainability given some methodologi-cal shortcomings.
Can be used to monitor a system over time if the index is calculated repeatedly with new data.
Reference: Mayer (2008:286) and Walsh et al (2006:4).
Chapter 2: Literature review
18 | P a g e
2.1.7.2. GDP and its Possible Adjustments
a. GDP
GDP is a very common macroeconomic indicator, having been used in the United States
since 1963 (Bagstad and Shammin, 2012:313). It is a measure of the monetary value of
the annual production of goods and services in a domestic location, so covers the natural
and human created capital in a particular place, such as a nation. It can be calculated in
nominal or real values (Lawn, 2003:106). Lawn further argues that if GDP is measured
in nominal values, it is measured in terms of the prices at the time of production and if
in real values, in terms of the prices of all goods in a particular year, which is often re-
ferred to as the base year. Consequently, differences in the quantity of goods and ser-
vices produced from year to year can be reflected by annual changes in real GDP.
In 1992, the United Nations Conference on Environment and Development in Rio de
Janeiro underlined the limitations of gross domestic product (GDP) as a measure of sus-
tainable development for a country. Agenda21 (1992: paragraph 40.4) found GDP to be
an example of common indicators that do not assess the sustainability of an economic
system. Rennings and Wiggering (1997:26) suggest that measuring the economic and
environmental aspects of sustainable development need to be complementary, while
Barrass et al (1997:101) go further by stating that growth in GDP will only align with
sustainable development if the environment and the resources it supplies are valued in
the same way. The same authors go on to say that conventional ways of assessing GDP
tend to undervalue the vital natural resources supplied by the environment, since no ac-
count is taken of their replacement times.
Bagstad and Shammin (2012:331) identify five common criticisms of GDP: (1) it con-
sists of simple addition of all expenditure, even expenditure that does not improve so-
cial welfare, such as that spent on defence; (2) it excludes the value of unpaid household
labour and volunteer work in the community; (3) it fails to account for the value of non-
renewable resource depletion while total resource stocks decline over time; (4) it fails to
account for income distribution, poverty, and the costs of inequality; (5) it lacks inclu-
sion of the positive contributions from natural, human and social capital types.
Chapter 2: Literature review
19 | P a g e
b. Adjustments to GDP
Given the shortcomings of GDP, economists have proposed adjustments to it to make it
a better measure of social wellbeing. One of the notable works is Daly and Cobb’s
(1989) index of Sustainable Economic Welfare (ISEW) which was later revised as the
Genuine Progress Indicator (GPI). ISEW/ GPI is a composite indicator which includes
economic, social and environmental indicators. Examples of the former are “Personal
consumption per capita” and “Value of household labour”, social indicators include
“Cost of crime” and “Loss of leisure time” and environmental indicators are based on
measurables such as “Cost of air pollution” and “Loss of forest cover” (Bagstad and
Shammin, 2012:331). GPI calculation includes the cost of environmental degradation as
well as factors for natural capital regeneration but is still arbitrary in what is included
and excluded (Pulselli et al, 2006:273).
In addition Pulselli et al argue that since ISEW/GPI is composed of a list of items which
indicate economic welfare or sustainability, ISEW/ GPI cannot be used as an indicator
of the real level of economic welfare at the same time as being an indicator of sustain-
ability. As explained by Pulselli et al (2006:273) ISEW/GPI does not really achieve its
anticipated outcomes as it was based on the strong sustainability model within which it
is not possible to substitute human capital for natural capital. Furthermore the authors
go on to say they believe ISEW/GPI does not make a clear distinction between national
and natural capitals or between the two forms of natural resources (non-renewable and
renewable). Nourry (2008:447) also points out that in ISEW/GPI, the incorporation of
the cost of environmental degradation is not sufficient to determine sustainability or
otherwise, so it cannot be strictly considered as an indicator of sustainable economic
welfare.
2.1.7.3. Sustainability Assessment
Ness et al (2007:500) have suggested another sustainability assessment tool that consists
of three umbrellas or general categorisation areas (Figure 2.3). These areas are indica-
tors and indices, which are further broken down into non-integrated and integrated
product-related assessment tools. In the non-integrated assessment the focus is on the
material and/or energy flows of a product or service from a life cycle perspective, while
the integrated assessment is a collection of tools usually focused on policy change or
Figure 2.3: Framework for sustainability assessment tools (Ness et al, 2007:500)
Chapter 2: Literature review
21 | P a g e
There is also the overarching category at the bottom of the figure used when market
values are needed in the three categories. In Figure 2.3, the proposed assessment tool
framework is based on the temporal focus of the tool along with its objective focus. The
arrow at the top of the framework shows the temporal focus, which is either retrospec-
tive (indicators/indices), prospective (integrated assessment) or both (product-related
assessment).
The objective focus of the tools is either spatial, referring to a proposed change in policy
(indicators/indices and integrated assessment), or at the product level (product-related
assessment). The monetary valuation tools on the bottom are used when monetary
valuations are needed in the above tools. “Thick lines around the boxes mean that these
tools are capable of integrating nature–society systems into a single evaluation” (Ness et
al, 2007:500).
2.1.7.4. Genuine Saving (Sg)
Genuine saving (Sg) is a proposed economic indicator for sustainability which is de-
fined by Pearce et al (2001), (cited in Hueting and Reijnders, 2004:258). The term is a
version of environmentally adjusted net national income (eaNNP) which includes ad-
justment for damages, compensation and depletion. The general equation is given be-
low.
eaNNp= C+ Sg
This is analogous to gross savings ‘S’ in the definition equation of gross national prod-
uct (GNP=C+S) and also analogous to net savings Sn (=S-dK) in net national product
(NNP=C+Sn). In these expressions, C=consumption, S=gross saving and
dK=depreciation of produced assets. Consequently, Sg=S - dK- r(R-G) - p(E-A), where
r=unit resource rent (defined as the difference between the price obtained for a unit of
extracted or harvested resource and its marginal costs of extraction or harvesting);
R=resource extraction or harvest; G=natural growth rate of the resource (zero for non-
renewable); p=marginal social damages from pollution; E=emissions; A=natural assimi-
lation (i.e., dissipation) of pollutants; and r(R-G) and p(E-A) are the values for deprecia-
tion of natural resources and the value of net pollution damage, respectively.
Chapter 2: Literature review
22 | P a g e
Hueting and Reijnders (2004:258) argue that welfare depends on total stocks of pro-
duced, natural and human assets. Moreover, they argue that the combination of labour
(technology) and elements from physical surroundings (the environment) give produced
capital. Consequently this system is dependent on only two factors, human beings and
the environment. As a result, a production level that guarantees conservation of vital
environmental functions with available technology is an unavoidable policy for envi-
ronmentally sustainable development.
Hueting and Reijnders (2004:258) have suggested some conditions for the calculation
of the Sg indicator and for versions of the related eaNNp. Some examples of these con-
ditions are summarised here. First, any increase in human assets must be used exclu-
sively for environmental protection and/or for growth of production that does not (fur-
ther) damage the environment. Secondly, likewise increases in stocks of produced assets
must be exclusively for the purpose of environmental protection or ‘clean’ growth.
Thirdly, resource revenues must be invested in environmental protection or ‘clean’
growth. These conditions are hard to satisfy because, for instance in relation to the first
and second conditions, “expenditures on environmental protection check production
growth” (Hueting and Reijnders, 2004:258) and “it is precisely the most environmen-
tally damaging sectors of the economy that account for the bulk of production growth”
(Hueting and Reijnders, 2004:258).
A sustainable development framework should be viewed as a multi-dimensional um-
brella in which all sectors are represented by efficient indicators for evaluating eco-
nomic, social and environmental development. If there are any conditions attached to
using these indicators, these conditions must be practical in terms of using the available
technologies and should not neglect the fact that sustainability is based on multi-
directional development. Thus, a multi-dimensional framework is of paramount impor-
tance for a correct indicator framework for sustainability.
2.2. Ecotourism
2.2.1. Definition of Ecotourism
Like sustainability, ecotourism is a concept that seems easy to recognise as a broad idea
but is difficult to define in detail.
Chapter 2: Literature review
23 | P a g e
2.2.1.1. General Views of a Definition Ecotourism
At present there is no consensus on the definition of the term ecotourism, and its identi-
fication and usage remain associated with a great deal of confusion and disagreement.
Buckley (2009:2) states that the earliest known use of the term ‘eco-tour’, undefined,
seems to have been by Parks Canada in the 1960s. Wearing (2008:6) states that ecotour-
ism is recognised as one of the segments of the tourism industry which is growing three
times faster than other parts. This definition only puts stress on the speed of growth as a
main difference between ecotourism and the other main sector of mass-tourism. Be-
cause of this, this definition cannot clarify and cover all the different dimensions of
ecotourism such as its relationship with the economic system, environment and people.
According to Blangy and Mehta (2006:233), the International Ecotourism Society
(TIES) views ecotourism as responsible travel to natural destinations which protects the
environmental resources and develops the well-being of the indigenous people. This
definition is complex as it brings together the idea of both ‘untouched’ landscape and an
‘untouched’ people within it, recognising that both may be changed by ecotourism.
In 1980, Ceballos Lascurain (cited in Weaver, 2009:3) introduced ecotourism as tourism
that involves travelling to relatively undisturbed or uncontaminated areas with the spe-
cific objective of studying, admiring, and enjoying the scenery and its wild plants and
animals, as well as any existing cultural manifestations (both past and present) found in
these areas. This definition only deals with a pristine landscape, ignoring to a large ex-
tent those who live in it. In addition, areas which have already been developed for other
purposes are omitted from ecotourism development in this definition.
2.2.1.2. Location and Definition of Ecotourism
The location where ecotourism occurs is one of the factors which give rise to different
opinions about its definition. For instance, in contrast with Lascurain whose definition
emphasizes undisturbed or uncontaminated areas as locations where ecotourism can
happen, Weaver (1999:795) argues that while such environments (for example protected
areas like national parks) for obvious reasons clearly constitute a desirable context for
appreciation of natural attractions, there is no a priori basis for excluding modified land-
scapes attractive to certain types of wildlife, such as reservoirs, managed forests, com-
munal or private lands adjacent to parks, and some types of agriculture lands as ecotour-
Chapter 2: Literature review
24 | P a g e
ism destinations. According to this view, even the remaining “changed” land and water
areas have the ability to accommodate demand for ecotourism and other recreational
pursuits. Furthermore, once a pristine landscape becomes an eco-tourist destination it is
no longer pristine, and must be changed. This suggests that ecotourism cannot just rely
on undisturbed landscape.
2.2.1.3. Sustainability and Definition of Ecotourism
Sustainability is the essential characteristic of ecotourism which basically becomes its
main difference with regard to other segments of the tourism industry. More recent
definitions have proclaimed some particularity for ecotourism such that it “must be eco-
nomically viable, ecologically sensitive, and culturally appropriate” (Wall, 1997, p.483).
According to this definition, if ecotourism and its development cause negative impacts
on the environmental resources, visitors, host communities and their economic systems,
it cannot be defined as “ecotourism”.
Perhaps the most restrictive definition is given by Butler (cited in Weaver,1999:794)
who insists that ecotourism must simultaneously satisfy eight descriptive criteria, in-
cluding consistency with a positive environmental ethos, biocentrism, enhancement of
the resource base, attainment of educational benefits, and conveyance of high informa-
tional and emotional dimensions. Although Butler has introduced these rigorous pa-
rameters to clarify the definition of ecotourism, it is clear that, among all segments of
mass-tourism, very few activities would qualify as “ecotourism” within his criteria.
Against this idea that sustainability is an umbrella that covers all ecotourism products
and policies, several qualifications have been suggested as the basis for introducing a
liberal ecotourism model. For example, Weaver (1999:794) argues that any insistence
that ecotourism must not negatively affect the environment or host society is unrealistic,
since it is impossible to ensure, categorically, that a particular visit or resort will not re-
sult in any significant long-term negative consequences. An emphasis on sustainability
in intention is thus more realistic than an insistence on sustainability in outcome. But, in
contrast to this view, Khan (2003:111) considers ecotourism as purposeful time spent in
an environment in a sustainable way that attempts to learn other culture and help eco-
nomically its host communities that work toward conservation of ecosystems.
Chapter 2: Literature review
25 | P a g e
2.2.1.4. Definition of Ecotourism as a Segment of Alternative Tourism
Ecotourism has come to be closely associated, and is even sometimes synonymous, with
equally controversial and much debated terms such as sustainable tourism and alterna-
tive tourism. Buckley (2009:18) defines ecotourism as a part of a much broader tourism
product sector, which includes nature, wild life, adventure, cultural and perhaps also
farm or rural tourism. Ecotourism is viewed by Weaver (1999:797) as a segment of al-
ternative tourism. Weaver (1999:797) also argues that alternative tourism (AT) is com-
monly defined, at least in its ideal configuration, as a locally controlled sector adhering
to vernacular architectural norms and attracting a more allo-centric or community
minded type of client. Figure 2.4 depicts an interpretation of the popularly perceived
relationships among the various types of tourism.
According to Weaver (1999:798), internally alternative tourism may be separated into
nature oriented and socio-cultural components, depending on whether the stress is on
natural or “authentic” cultural attractions. However, since the above perspective of
ecotourism requires coherence with sustainability, then only those instances of nature-
based AT that are situated on the sustainable side of Figure 2.4 can be classified as
ecotourism.
Figure 2.4: Perceived relationship between sustainability, mass tourism, alternative tourism (AT), and ecotourism
Ecotourism
Socio- Cultural
Sustainable Tourism Unsustainable
Tourism
Sustainable practice Unsustainable practice
Mass Tourism
AT
Chapter 2: Literature review
26 | P a g e
In contrast to the latter classification, according to several recent definitions (Blangy
and Mehta, 2006:233; Wall, 1997, p.483; and Weaver and Lawton, 2007:170), ecotour-
ism must be viewed overall as a sustainable activity which directly attempts to protect
and develop both environmental potential and socio-cultural structure in the host areas.
Consequently, ecotourism is similar to sustainable AT and has an ability to cover other
sustainable segments of mass tourism.
2.2.2. Ecotourism and Environmental Heritage
The relationship between tourism and the environment and the environmental implica-
tion of the development of tourism can be polarized into both negative and positive as-
pects. For example, on one side, “conservationists see both [tourism] developments and
tourists themselves as threats to survival of wildlife and of treasured natural resources”
(Coppock, 1982:270). Pigram (1980:559) points out that even some researchers such as
Cohen (1978), who conceded the existence of some beneficial effects from tourism, par-
ticularly in the economic, political and cultural spheres, appear convinced that, “in the
long run, tourism like any other industry, contributes to environmental destruction”
(Cohen 1978: 220).
On the other side, researchers such as Weaver and Lawton (1999:16) believe that alter-
native tourism as one part of mass tourism can be considered to be the legitimate form
of tourism, and the only one that could be considered sustainable. They (1999:16) argue
that special mention should be made of ecotourism, which is widely defined as a variant
of alternative tourism that puts primary emphasis on the natural environment to be used
and protected as the basis for product attraction. In addition, ecotourism “posits that the
basis of interaction with the natural environment is one of inherent appreciation and/ or
educational interests, and not merely as a suitable setting for a hedonistic or thrill seek-
ing experience (as in sunbathing and white-water rafting, respectively)” (Weaver and
Lawton, 1999:16).
There is no debate over the fact that uncontrolled development of tourism can exert
negative influences on natural conservation. Coppock (1982:272) categorizes these im-
pacts into five categories comprising loss of habitat; damage caused by the pressure of
human feet or vehicles on soil and vegetation; damage to flora and fauna by fire; dam-
age to, or destruction of, flora and fauna by pollution; and disturbance of fauna, espe-
Chapter 2: Literature review
27 | P a g e
cially birds and mammals. In addition, some other negative impacts such as increasing
the ecological footprint of the host destination as influenced by food consumed, trans-
portation used, an increase in built up land, water consumed and the sewage generated
resulting from tourism can be added to these other categories.
May (1991:113), in a general view, separates the impacts of tourism into two types, the-
se being those which are associated with structures (hotels, roads, aircraft etc.) and those
resulting from tourists themselves. Likewise, Coppock (1982:272) reveals that the im-
pacts of tourism on nature conservation are the products of conscious actions taken by
developers, promoters, planners or visitors and that some are the unintended and often
unconscious by-products of tourism.
Many researchers, such as Ferrell and Runyan (1991:26) and Marcouiller et al
(2004:1034), view the natural environment as a crucial potential for the attractiveness of
almost all travel destinations and recreation areas. May (1991:114) reveals that much
tourism occurs in locations which are particularly sensitive to change, e.g. rivers, forests
and lakes. According to Ferrell and Runyan (1991:30) it is characteristics of most natu-
ral features that they are physically altered by use. They (1991:30) suggest that positive
change should be the goal and negative change, which even in small amounts can be
critically damaging, should be omitted or reduced.
To clarify the relationship between ecotourism and environmental conservation, Buck-
ley (2009:149) views minimizing impacts on the natural environment as a key criterion
for its evaluation. On the other hand, one of the main goals for developing sustainable
ecotourism is to protect ecosystems which provide the services essential for human ac-
tivity. In terms of ecotourism, an ecosystem “in short can be described as supporting life,
supplying materials and energy, and absorbing waste products” (Gössling, 1999:303).
Although it is clear that human life seriously depends on conservation of natural re-
sources, currently, particularly in developing and industrialized countries, natural re-
sources are decreasing dramatically as the result of human activities. For example, ac-
cording to Gössling (1999:310), tropical rainforests, which contain more than half of all
species in the entire world and provide a range of essential services, are the biome in
Chapter 2: Literature review
28 | P a g e
greatest danger, declining by rather more than 150,000 km2 per year. Moreover, current
protective policies and programmes cannot cover all valuable natural resources.
Gössling (1999:310) states that in 1993, less than 5% of tropical forests is protected
within parks and reserves. Furthermore, exploitation of environmental heritage, con-
sumerism, and extremely high per capita demand for resources also support the loss of
biodiversity. Gössling (1999:304) further argues that the latter problems are caused by
tourist activities, like air travel which consumes fossil fuels and leads to significant
emissions, a lack of successful economic systems, and weaknesses of the present poli-
cies to value nature and its profits. Indeed, the root cause of the exploitation of natural
resources is substantially a multi-dimensional problem and needs a comprehensive solu-
tion.
Sustainable ecotourism as a multi-dimensional phenomenon could be viewed as a
means of mitigating the socio-economic situation at both local and international scale,
and supporting environmental conservation. Development of ecotourism and other seg-
ments of mass-tourism, without effective policies to manage and monitor the process of
development, causes issues such as loss of biodiversity, and expansion of poverty in the
adjacent and other areas which are not covered by development programmes. To ex-
plore and introduce some of the latter issues, it is useful to look at the example of Costa
Rica, a country which is widely cited as a popular ecotourism destination.
2.2.2.1. Case Study of Costa Rica
Costa Rica is a small country which has 51,100 km2 of land surface, being only 0.03%
of the earth’s surface. It is an ideal reference point for tropical ecology in the world.
Costa Rica has abundant majestic wet and dry forests, impenetrable coastal and inland
wetlands, wild rivers, productive estuaries, fog and rain-shrouded mountains, and active
volcanic landscapes that support some of the most impressive and dense biodiversity
found on the planet. “Costa Rica ranks about 20th among nations of the world in terms
of its biodiversity. Costa Rica has 28.2 species of terrestrial vertebrates per 1000 km2.
By contrast, Ecuador, which has the richest biodiversity in the world in absolute species
number, has only 9.2 species of vertebrates per 1000 km2” (Kohlmann et al, 2008:255).
Because of its fortuitous tropical setting, Costa Rica has also served as an important lo-
Chapter 2: Literature review
29 | P a g e
cation for agricultural production, including crops such as coffee, bananas, pineapples,
wood and wood products.
In terms of its protected areas, nearly 23% of Costa Rica’s land area is under some sort
of public park system. In 2007, the Costa Rican Tourism Institute reported that “be-
cause of its incredible ecological systems, Costa Rica has also attracted more eco-
tourists and adventure travellers per square kilometre than other countries in the world
(22.5 international eco-tourists/ km2)” (Kohlmann et al, 2008:256). In fact, Costa Rica’s
biodiversity has been a major reason for tourists and eco-tourists to visit this country
and has contributed to making ecotourism the primary source for foreign currency gen-
eration. Kohlmann et al. (2008:256) states that during the last decade, ecotourism has
surpassed coffee, bananas and beef production, which have been three traditional export
products of Costa Rica. In 2007, tourism generated US$ 1,895 million, while coffee
generated US$ 255 million and banana production generated US$ 674 million in foreign
currency.
In Costa Rica, natural resources have been used as the basic tools for development, but
use of these alone will not contribute to complete conservation policies in the protected
areas. On the other hand, a number of inefficient policies for development of ecotourism
and conservation of natural resources have caused some problems which now have to be
solved by Costa Rica’s government and related organizations. In Costa Rica, unequal
distribution of services is one of the problems in the protected areas. According to
Weaver (1999:800), of approximately 23,000 to 25,000 total accommodation rooms,
about 40% are located in San Jose and its environs, 30% in the Pacific province of Pun-
tarenas (mostly as beach hotels) and 15% in the North-Western province of Guanacaste
(also mainly as beach hotels). Most of the remainder are small facilities located within
other provinces. Furthermore, the number of specialized “ecolodge” type rooms is
around 500, or about 2% of the total inventory. These statistics expose that the output of
the system in Costa Rica is likely to be depletion of capital and destruction of natural
resources in one place and the exclusion of other places from ecotourism development.
In Costa Rica, partly as a result of financial constraints and the lack of compatible alter-
natives to traditional economic activities, there are several conflicts with the local popu-
lation in the protected areas. For instance, Bernard et al. (2009:175) reveals that with the
Chapter 2: Literature review
30 | P a g e
change of the Rio Macho Reserve into a National Park in 2000, local activities such as
coffee growing, livestock keeping, sheep and goat breeding, firewood collection, and
harvest of mosses became illegal. The alternatives like the cultivation and harvest of
wild blackberries, and the cultivation of colder climate fruits or cattle breeding are con-
sidered very unsatisfactory to the local people and they continue some of the illegal ac-
tivities which damage the natural resources.
2.2.3. Ecotourism and Local Economic Growth
Sustainable ecotourism development depends on a particular economic system that is
based on conservation of natural and cultural heritage and the contribution of local
communities so they gain benefits from their sustainable activities. As GLOBE 90
(1990:2) reveal, one of the main goals of sustainable development of tourism and its
related subsectors such as ecotourism is to develop greater awareness and understanding
of the significant contributions that tourism can make to the environment and economy.
In some societies, particularly among the less developed countries, the shift from tradi-
tional to industrial strategies for economic development has caused destruction of the
natural and cultural resources. Since post-industrialization, against the governing of
people through technocracy, sustainability is viewed as a way of avoiding resource deg-
radation and cultural decadence. In the following section, Thailand is used as a specific
example as this is a country which has experienced traditional, industrial and post-
industrial modes of economic development.
2.2.3.1. A Case Study of Thailand
Thailand is a country whose economy probably depends on the development of ecotour-
ism. According to Wang (2004:1), 6% of the Thai GDP is derived from tourism and al-
most 30% of the population is employed in tourism and related industries. Furthermore,
in Thailand, natural resources are considered the main attractive potentials which can
contribute to development of tourism and an environmentally based economic system.
Wang (2004:2) argues that there are eight categories of protected areas in Thailand
which include: national parks, forest parks, wild life sanctuaries, non hunting areas, na-
tional forest reserves, botanical gardens, arboretums, and biosphere reserves. Pipith-
vanichtham (1997:2) points out that since the establishment of Thailand’s first national
park in 1961, the number of national parks in Thailand has slowly increased. For exam-
Chapter 2: Literature review
31 | P a g e
ple, there were only 16 parks which covered 9,357 km2 in 1979, and this had grown to
45 parks covering 24,222 km2 in 1982.
Between 1950 and 1980, Thailand underwent a massive transformation fuelled by over-
seas development aid and technical assistance, all facilitated by having a development
oriented government. Wester and Yongvanit (2005:746) reveal that this transformation
caused an ecological transition in some areas such as Dong Mun that was associated
with rapid population growth, expanding demand for resources, increased connectivity
and control by external forces and technologies that enlarged expectation, and environ-
mental degradation.
Wester and Yongvanit (2005:738) also point out that until 1965 Thailand was in a pre-
industrial mode. It had a common property regime which allowed local communities
with small populations and limited technology to extract food, fodder, fuel and medi-
cines from the land. According to Wester and Yongvanit (2005:738-739) after that date,
forest management shifted to an industrial mode and exploitation of forests was part of
the overall plan for regional economic development. This changed policy caused devel-
opment of industrialised agriculture and infrastructures such as dams and roads and deg-
radation of natural resources like the forests.
According to Wester and Yongvanit (2005:746), in Thailand the industrial mode hap-
pened first in the form of licensed timber concessionaires, who extracted the high value
old growth wood, and later in the form of a plantation system based on single purpose,
low value woods grown on land legally under the jurisdiction of the Royal Forest De-
partment to the exclusion of all others. As a result of this policy, after 1970, severe re-
duction in the area of designated forest reserves occurred. Wester and Yongvanit further
reveal (2005:736) that in 1961 approximately 53% of the land area was forested. Influ-
enced by industrial development and unsustainable extraction of these resources, by
1986 the forested area had been reduced to 25% of total land.
After exploitation of natural resources during the industrialization period, the Thai gov-
ernment and related organizations attempted to find efficient strategies to recover and
restore the lost environmental heritage while keeping a healthy economic system.
Chapter 2: Literature review
32 | P a g e
Since 1976, tourism development has been considered a significant solution to solving
the latter issues. Pipithvanichtham (1997:1) points out that between 1976 and 1986 tour-
ism in Thailand became the country’s leading industry because of its generated revenue.
However, as tourism became increasingly important, several areas which were subject
to its development faced resource degradation and cultural decadence. Wang (2004:2)
explains that although economic benefits as an output of tourism development have
been claimed, outside investors reap the biggest benefits at the expense of the local
communities.
The negative impacts of tourism development on the natural resources, local economic
systems and socio-cultural structure led the Thai government and other organizations
such as the Tourism Authority of Thailand (TAT) to shift their policy towards more sus-
tainable tourism development, focusing on conservation and benefits to local communi-
ties. In the new strategy, local communities and indigenous people play an important
role. In fact, as Wang (2004:4) suggested, the key to assessing tourism potential for im-
proving nature conservation and community well-being is the direct involvement of lo-
cal communities and improvement of the linkage between conservation and enterprise
development. Consequently, this kind of tourism can be viewed as sustainable eco-
tourism.
Community Based Eco-tourism of Thailand (CBET) was introduced by Wang (2004) as
a strategy whose development is based on the participation of indigenous people. One
of the main goals for this system is the contribution to local well-being of the environ-
mental economic development. He further states (2004:3) that the CBET approach is a
response to the rising criticism of the negative impact of mass tourism and the abuse of
the term ecotourism. CBET has attempted to establish a sustainable method of tourism
in natural reserves while providing a source of community-building or development for
indigenous participants without exploitation of their natural habitats and cultural struc-
tures. Wang (2004:3) points out that there is a difference between community-based
ecotourism and other types of tourism because the former focuses on community devel-
opment and the participation of the marginalized sectors rather than on national or re-
gional development.
Chapter 2: Literature review
33 | P a g e
For more explanation about the CBET and its impacts on local societies, Wang (2004:6)
chooses to describe two hill-tribe villages from Mai Hong Son Province, Northern Thai-
land. Mae Huay Hee village has been involved in CBET for more than 5 years and the
degree of participation in tourism is high. In Mae Lana, approximately 80 km away
from Mae Huay Hee, the CBET initiative started only one year before the reporting, al-
though the locals had been involved in tourism for almost 10 years. A comparative
study between these two villages that were receiving different degrees of tourist activity
and experiencing different levels of participation was conducted to judge the impact
caused by CBET. The positive impact of CBET which is described (Wang, 2004:7) can
be attributed to the low number of tourist activities and the fact it is a controlled activity.
In addition, participation of local people in conservative projects and development of an
environmental economic system which “is based on the idea that environmental goods
and services are scarce” (Graaf et al, 1996:208), are other positive impacts of CBET.
In comparison with other types of tourism, ecotourism and its related activities which
have particular characteristics need specific management and consideration to be cor-
rectly implemented. Wang (2004:10) reveals that in comparison with other projects,
ecotourism projects are hardly likely to succeed immediately and yield immediate prof-
its. Even one successful project may need a lot of time to adapt to a new situation.
When there is conflict between the efforts to keep the number of visitors low to mini-
mize cultural and environmental intrusion and the local people’s desire to increase their
income, alternative forms of livelihood should be encouraged.
2.2.3.2. The Potential of Ecotourism
In conclusion, ecotourism projects should not be viewed as an enterprise that will solve
all issues. Consequently, it is necessary for related communities to integrate ecotourism
with other alternative productive options to reduce the expectations placed on having
one activity alone, and to reduce the tensions that arise from unmet expectations. Wang
(2004:12) argues that community-based ecotourism is a “multi-dimensional productive
and cultural/social system” which is not an isolated industry from other economic ac-
tivities. This system will lead to stability in the economy at the national, regional, or
community levels.
Chapter 2: Literature review
34 | P a g e
Ecotourism is not a ‘magic bullet’ that will suddenly result in conservation of natural
resources at the same time as development and increased foreign revenue. It can skew
development within a country, such as the development of a few places within Costa
Rica for housing and servicing tourists. At best, ecotourism that gives at least part of its
benefits back to the local communities that support it can have positive outcomes but
these may be slow to arrive and may not meet the expectations of those involved. In
some ways the problems of ecotourism establishment can be seen as a mirror at a small
scale of the problems of trying to move the whole world economy on to a much more
sustainable basis. Both will only succeed if those involved expect less, rather than more.
For the eco-tourist, less might mean less comfortable travel and accommodation and for
the local people involved, less might mean a lower level of life style improvement.
However, the big benefit of ecotourism is that local natural resources are conserved to a
much greater extent, which is the basis for all sustainability.
2.2.3.3. Definition of Soft Ecotourism in this Thesis
Arising from the environmental and economic characteristics of ecotourism discussed
above, soft ecotourism can be defined as a part of sustainable tourism that happens in
rural and urban places and their adjacent areas. Soft ecotourism aims to make local and
indigenous people aware of their environmental and cultural heritage and capital and
engage them in the sustainable development process. This process includes conservation
of natural resources and social-cultural heritage, production and development of envi-
ronmental and the social capitals, and development of an ecological-social economic
system in a sustainable way.
2.2.4. Strategy for Sustainable Development of Tourism
The anticipated goals and outcomes of tourism plans will inevitably determine their role
for environmental protection, social and economic development. According to Fennell
and Dowling (2003:8), at the beginning of the last two decades, some researchers such
as Murphy (1983) and Getz (1986) argued that most tourism goals and planning were
oriented towards business interests, economic growth and development. However, in-
fluenced by some phenomena such as global warming, degradation of environmental
resources, and evolution of sustainability polices, the strategies for tourism development
have been oriented to being more comprehensive to cover the multi dimensions of the
sustainability of tourism. This thesis uses the New Zealand Tourism Strategy 2015
Chapter 2: Literature review
35 | P a g e
(2007), as an example of the recent frameworks, here suggested by the government of
New Zealand, for the sustainable development of tourism.
2.2.4.1. New Zealand’s Tourism Strategy 2015 (2007)
During the last two decades, New Zealand’s attitude to defining the best kind of tourism
for the country has changed. “Twenty years ago, the debate about what kind of tourism
would be the best for New Zealand largely centered on how many international visitors
would be appropriate” (New Zealand Tourism Strategy 2015, 2007:14). Now tourism is
viewed as a much more complex phenomenon. For New Zealand’s government and
related organizations, there are many factors which must be considered to achieve their
goal of becoming a sustainable nation and promote the value of tourism to New Zea-
land’s visitors, economy, environment and communities. According to the New Zealand
Tourism Strategy 2015 (2007:14) these factors include the money that visitors expend
whilst they are in New Zealand, the time of year they come, and the sort of experiences
they expect during their travel. In order for the tourism sector to prosper, the New Zea-
land Tourism Strategy 2015 suggests increasing the amount that each visitor spends
during their visit, finding strategies to reduce seasonal fluctuations in visitor arrivals,
and providing products that are appropriate for visitors who are concerned about their
environmental footprint. The structure of the NZTS 2015 sets out four outcomes needed
to achieve these goals, as shown in Table 2.2.
Table 2.2: Anticipated outcomes for sustainable development of tourism in New Zealand’s Tourism Strategy 2015
Outcome Description Outcome 1 New Zealand delivers a world-class visitor experience. Outcome 2 New Zealand’s tourism sector is prosperous and attracts ongoing investment. Outcome 3 The tourism sector takes a leading role in protecting and enhancing New Zealand’s
environment. Outcome 4 The tourism sector and communities work together for mutual benefits.
• Reference: (NZTS 2015, 2007:6-7)
Together these four outcomes (Table 2.2) shape a suggested framework for the devel-
opment of sustainable tourism in New Zealand by 2015. As demonstrated in Table 2.2,
the anticipated outcomes for sustainable development of tourism can be categorized into
the four categories of promotion of the quality of services and products, economic de-
velopment in a sustainable way, environmental conservation and engagement of the lo-
cal communities and related organisations in the development process. In the next part
of this Chapter, the four outcomes and their related contributive activities as forecast by
Chapter 2: Literature review
36 | P a g e
the New Zealand government for the sustainable development of tourism are explained
as an example of a sustainable framework and strategy for tourism.
a. Outcome1: New Zealand Delivers a World-Class Visitor Experience
World class experiences are authentic, unique and delivered with superb service. To
achieve this goal the New Zealand government suggests a range of priorities for its de-
livery, which are shown in Table 2.3. These priorities can be conceptualised as increas-
ing the quality of planning, management and monitoring of the offered services, facili-
ties and products, and the economic and cultural engagement of local people and com-
munities in the development process (Table 2.3).
Table 2.3: NZTS 2015- setting priorities to deliver a world-class visitor experience (Outcome 1)
No. Priorities for delivery 1 New Zealand is seen by visitors as a desirable, high-quality destination 2 The New Zealand tourism industry offers booking services that are easy to use 3 The I-Site network is recognized by visitors as being a source of high-quality and objective visi-
tor information 4 Qualmark is recognised by consumers as a mark of quality 5 The tourism sector is committed to monitoring visitor satisfaction and perceptions of quality 6 New Zealand’s infrastructure supports a quality visitor experience at all stages of the journey 7 Domestic travelers help create a strong demand for visitor products and services 8 Maori actively participate and invest in the tourism sector
The New Zealand government proposes a list of necessary activities related to each pri-
ority (cited in Table 2.3) which must be done to achieve that priority. These activities
can be summarised as development of investment in tourism at global and domestic
scales; promotion of quality and accuracy of researches related to both domestic and
international tourism markets; using appropriate technology for each activity, service
and product; monitoring the quality of all related activities, facilities and products used;
managing and monitoring of the engagement of local and indigenous people (Maori) in
the development process, and encouraging them to present their cultural product at
word-class level (see Appendix1).
b. Outcome 2: New Zealand’s Tourism Sector Is Prosperous and Attracts Ongoing
Investment
Outcome 2 proposes an economic aspect of sustainable development policies for the
tourism market in New Zealand. Based on this economic perspective, NZTS 2015 as-
sumes that “the success of New Zealand’s tourism sector is ultimately dependent on the
performance of the businesses within it. If they are successful, the sector will keep
Chapter 2: Literature review
37 | P a g e
growing, which will deliver significant benefits to businesses themselves, to their com-
munities, and to the New Zealand economy as a whole” (NZTS 2015, 2007:30). The
New Zealand government also offers five priorities for a successful tourism sector and
these are shown in Table 2.4.
Table 2.4: NZTS 2015- setting priorities for a prosperous tourism sector (Outcome2) No. Priorities to deliver 1 Tourism businesses identify and put in place strategies that will consistently increase their returns
on investments.
2 Business delivers products and experiences that meet the expectations of high-value visitors. 3 Tourism attracts and retains an appropriately skilled workforce. 4 The tourism sector improves demand during the off-season. 5 New Zealand’s tourism research is accessible, timely, high quality, and relevant to the decisions
that need to be made.
The main objectives of the proposed economic priorities (Table 2.4) can be considered
as a contribution to increasing returns on investments; increasing the quality of products
compatible with the expectation of consumers; and increasing the demand for conduct-
ing researches in the context of the sustainable tourism strategy.
NZTS 2015 introduces the main actions that must be conducted to achieve the priorities
for a prosperous tourism sector. These activities can be summarised as community
based actions that aim to improve resource efficiency; work force management; tourism
services, products and facilities; and access to researches and information systems. In
addition, training and education of the workforces involved is considered to be one of
the pillar activities to make tourism economically successful in a sustainable way (see
Appendix 2).
Likewise, NZTS 2015 values both international and domestic tourism at the same level
and aims to develop them both to improve the economic benefits of tourism in New
Zealand. For instance, NZTS 2015 proposes investment in marketing initiatives that tar-
get domestic and international visitors who are more likely to travel in the shoulder and
off–peak seasons (see Appendix 2). As a result, increasing the number of visitors, both
domestic and international, can be viewed as one of the main goals and activities to
support the economic development of tourism in New Zealand up to 2015.
Chapter 2: Literature review
38 | P a g e
c. Outcome 3: The Tourism Sector Takes a Leading Role In Protecting and En-
hancing New Zealand’s Environment
The third anticipated outcome for the sustainable development of tourism demonstrates
an ecological aspect of the tourism strategy in New Zealand (Table 2.2). NZTS 2015
views tourism as a phenomenon that can contribute to environmental conservation
through its sustainable development. To achieve this goal by 2015, the New Zealand
government suggests eight priorities for tourism development in terms of environmental
conservation to be followed by the tourism sector and related organisations (Table 2.5).
These priorities consist of maintaining environmental resources for the next genera-
tions; producing environmentally friendly products through the development process;
reducing the carbon emission of the products, services and activities of tourism; using
renewable energies in the tourism sector; and management of produced waste in a sus-
tainable way through interaction with other related sectors (Table 2.5).
Table 2.5: NZTS 2015- setting priorities to protect and enhance New Zealand’s environment (Outcome 3).
No. Priorities for delivery 1 The tourism sector contributes to a whole-of-New Zealand approach to ensure that New Zea-
land’s environment will continue to be enjoyed by future generations and visitors, in the spirit of kaitiakitanga (guardianship)
2 The expectations of our visitors are clearly understood, and visitors are able to identify and select products that deliver good environmental performance easily
3 The tourism sector leads the way in introducing initiatives that will reduce carbon emissions and increase the energy efficiency of transport within and en route to New Zealand
4 The tourism sector improves its energy efficiency, energy conservation, and use of renewable energy at all levels
5 The tourism sector takes active steps to reduce and manage its waste, encourages other sectors to do the same, and engages with the local, regional, and national agencies that provide waste man-agement standards and facilities
6 Tourism businesses have the capability and knowledge to take a leading role in protecting and enhancing the environment
7 The tourism sector, DOC, and other key agencies continue to work together to make sure that conservation values are enhanced
8 Visitors’ tourism experiences give them the opportunity to learn about and contribute to New Zealand’s environmental and conservation goals
NZTS 2015 determines necessary activities to make tourism development an ecologi-
cally friendly phenomenon. These suggested activities contain some key points such as
providing a national environmental plan to be followed by New Zealand and its tourism
sectors; participation in global forums that attempt to manage and monitor environmen-
tal issues; contribution to stronger sustainable environmental policies, regulations and
standards; and development of ecological indicators that can be used as tools to measure
environmental impacts of tourism (see Appendix 3).
Chapter 2: Literature review
39 | P a g e
Furthermore, NZTS 2015 proposes use of products, services and facilities such as trans-
portation with fewer carbon emissions and involving less non-renewable energy. Re-
newable resources are seen as the main sources of energy to be used through the sus-
tainable development process at both international and domestic levels (see Appendix
3).
d. Outcome 4: The Tourism Sector and Communities Work Together for Mutual
Benefits
NZTS 2015 views sustainable development of tourism as a community-based activity
that attempts to engage local communities and participants in the whole development
process including its planning, management and monitoring (Table 2.6).The forecasted
priorities by NZTS 2015 (Table 2.6) also focus on making opportunities for local partic-
ipants to produce and present their cultural products and conserve their cultural heritage
through the sustainable development of tourism. This policy is linked with local eco-
nomic development in a sustainable way (Table 2.6).
Table 2.6: NZTS 2015- setting priorities for the tourism sector and communities to work together (Out-
come 4) No. Priorities for delivery 1 The tourism sector is an active partner in planning and managing our communities 2 Local authorities understand the benefits tourism offers and lead destination management and
planning initiatives and progress to maximise the benefits 3 Tourism decision-making by local government, communities, Iwi, and the tourism sectors is in-
formed by high–quality research 4 Regions and communities preserve and promote their local culture and character and incorporate
this into all aspects of the visitor experience 5 Core infrastructure and facilities are appropriately funded
Appendix 4 shows a range of community based activities suggested by NZTS 2015
which can support New Zealand tourism sectors to be more socially sustainable through
engagement with local participants and communities. The latter community based activ-
ities cover the social dimension of the sustainable development of tourism and, in some
aspects, are linked with the environmental and economic dimensions of sustainability.
For instance “making sure that high–quality research is available to local communities
to inform decision–making by local government and the tourism sector, including in-
formation on the social, economic, environmental, and cultural benefits of tourism to
communities” (NZTS, 2015) can be considered as an educational policy and activity
that attempts to make local people aware about the linkage between the environmental,
social and economic dimensions of sustainable development.
Chapter 2: Literature review
40 | P a g e
Some of the suggested activities that can contribute to the New Zealand tourism sector
becoming a socially sustainable activity, for example “assess core needs, and investigate
and consider funding models to improve the standard and provision of appropriate in-
frastructure” (NZTS, 2015), also benefit this sector in the achievement of other fore-
casted outcomes, such as “deliver[ing] a world-class visitor experience” as cited in Out-
come1 (Table 2.2).
2.2.4.2. Discussion
NZTS -2015 attempts to propose a framework that has the ability to cover all the differ-
ent dimensions of sustainability through development of tourism. As discussed above,
its four anticipated outcomes (Table 2.2) have the ability to lead tourism sectors and
their related services, products, facilities and activities to develop in a sustainable way
with positive social and economic effects and lower negative environmental impacts.
This strategy can be viewed as a bottom up approach to a democratised development
process that in turn will be supported by the New Zealand government.
However, some of the forecasted priorities for the sustainable development of tourism
(in particular economic and environmental priorities) might cancel each other out. For
example “invest in marketing initiatives that target those domestic and international
visitors who are more likely to travel in the shoulder and off–peak seasons” (Appendix
2), can increase the number of international visitors that in turn increases the ecological
footprint of tourism in New Zealand, itself a national and global environmental issue.
Although the development of ecological indicators is suggested by NZTS 2015 as an
environmental strategy for New Zealand tourism (Appendix 3), can support the tourism
sectors to do more accurate planning, management and monitoring of their services, ac-
tivities and products as being sustainable.
2.3. Sustainable Architecture
2.3.1. Historic Perspective on Sustainable Architecture
Architecture is one of humanity’s products. Its historic roots lie in the connections be-
tween the environment and its inherent potential to provide comfort and security for the
inhabitants. Williams (2007:103) argues that architecture up until 100 years ago had to
be ingenious in providing comfort by integrating passive elements of the natural place
Chapter 2: Literature review
41 | P a g e
into a design solution. Williams (2007:103) encapsulates these passive elements, includ-
ing warm air rising, prevailing breezes, ventilation chimneys, floor plans proportioned
and oriented to provide daylight and fresh air to all users, unique methods of construc-
tion, virtual elimination of waste, a symbiotic relationship between the structure and the
materials needed to build it, and the reuse or return to the earth of the materials after
they are used. The use of these elements was the very foundation of an architectural and
planning profession which was based on sustainable principles before sustainability was
defined.
Sustainability and sustainable architecture can be considered as a phenomena rising
from the traditions as officially defined in the modern style. Steele (2005:12) reveals
that in the spirit of its Latin origin, ‘tradere’ means ‘to carry forward’. In this context
tradition essentially represents the accumulated knowledge of past generations in rela-
tion to effective ways of dealing with the environment. In turn this led to place-specific
techniques that historically have been used to control microclimates by the people that
live in them.
There are many examples where traditions and technology have met each other to create
an ecological or sustainable architecture. Steele (2005:15) argues that since there are
traditions of technology in dealing with the environment, and as tradition itself is based
on making, which is the essence of technology, to set tradition and technology against
each other is to establish a false dialectic. Steele (2005:15) suggests that a more accurate
approach might be to try to discover where tradition and technology concur or overlap
and how this may be applied to environmental problems.
As an example of this approach, Gissen (2009:125) cites Hassan Fati’s [also Fathy]
work in Egypt. Beginning with designs in 1973 and after several experimental devel-
opments that were completed years later, Fati developed mud construction techniques
(as a compatible technique for the environment and traditions) for the sake of helping
impoverished rural populations. Gissen (2009:125) states that, significantly, Fati’s work
provided a material-based construction language for a postcolonial approach to architec-
ture. Fati’s mud architecture was characterized by its use of validated construction tech-
niques to make an ecological linkage between the materials and energies resident in a
place, architecture, and people as consumers. On the other hand, Fati’s architecture
Chapter 2: Literature review
42 | P a g e
which is characterized by being environmentally sensitive, culturally appropriate and
economically viable, can be considered as an effort based on the combination of tradi-
tions and techniques, to create a sustainable architecture and to shift a society toward
sustainability.
As will be explained in the next section, the characteristics of architecture discussed
above also appear in vernacular and traditional architectures that have historic back-
grounds and that are still used as places for living.
2.3.2. Learning from Vernacular Architecture
Humanity is in a period of luxury development, which has been raised by the needs of
capitalism to create new markets, and the technological advancement that exerts influ-
ence on every aspect of human lives. Because of this it may be unfashionable or impos-
sible to regress in time and place to live in vernacular buildings in a vernacular manner.
However, the dominant principles in vernacular architecture can be used to make
frameworks and guidelines to create an architecture which is correspondent with nature,
social-cultural values and local economic systems. Oliver (cited in Kazimee, 2008:4)
states that almost 90% of the world’s housing shortages will be met with self-help
means, using locally available resources and technologies and not through high-tech and
specialized methods. Kazimee (2008:4) explains that in applying the properties of ver-
nacular architecture to current times and seeing in the vernacular a solution for modern
urban problems, it is the notions of flexibility and working in traditional ways that are
important.
Vernacular cultures generated buildings and spaces that are accommodating of time and
place. Creating multifunctional and flexible spaces to be used at different times for dif-
ferent activities (which Kazimee introduces as a characteristic of vernacular architec-
ture), has been suggested by Vale and Vale (2009:129) as an option for optimizing the
use of space where it is limited. Vale and Vale (2009:129) use a caravan as an example
of timetabling various uses in a multi-functional space. In a caravan “the same space is
used for eating and later, when the table and benches have been converted into a bed,
also for sleeping. Where movement or transport is involved, timetabled use of space is
common” (Vale and Vale, 2009:129).
Chapter 2: Literature review
43 | P a g e
2.3.2.1. The Clustered Villages of Nuristan- Afghanistan
Kazimee (2008) describes the villages of the Nuristan region, located in the rugged geo-
graphical region of northeast Afghanistan, as fine examples of sustainable communities.
This is because they are adapted to the harsh cold climate zone of the southern slopes of
the Hindu Kush Mountains and residents depend on local resources for building their
homes and villages. He (2008:6) explains that these villages are clustered on the steep
slopes of the mountain sides because there is a limited amount of arable land available
in the Hindu Kush, so the lower valley and flat land is saved for agriculture and grazing.
Kazimee (2008:6) points out that the roofs of the dwellings are constructed above each
other, so that one household’s flat roof serves as the patio for the neighbor above (Fig-
ure 2.5).
According to Kazimee (2008:6) these stepped roof areas with their verandahs provide
the necessary flat exterior space or patios for many domestic and social tasks. In addi-
tion, as Kazimee (2008:6) points out, the patios are connected to each other with
notched logs used as ladders that serve as pathways for the vertical movement of people
through the village. This using of roofs as patios and pedestrian pathways can be viewed
as an example of the creation of multi-functional spaces to avoid wasting arable land.
Kazimee (2008:7) further states that in the villages of Nuristan, people use local materi-
als such as wood, soil and stone to construct their homes. The main stages of construc-
tion are conducted by the landowner with the help of neighbors if necessary. Participa-
tion of landowners and neighbors makes the construction process become a community
based activity. According to Kazimee (2008:7) the south facing terraced houses on the
hill respond logically to the climate and solar orientation, taking full advantage of the
Figure 2.5: Nuristan village, Afghanistan http://viaterra.net/photos/pakistan/pakistan_nuristani2.jpg viewed December 2010
At the scale of architecture, the courtyard is an open air area located in the centre of
houses (Figure 2.15). It connects the northern and southern parts of houses which are
used seasonally. Northern areas (Shah Neshin) are used during the hot seasons (Figure
2.15, right) and southern spaces (Figure 2.15, left), which receive the sunlight during
the cool seasons, are appropriate to live in during autumn and winter. Furthermore, the
courtyard plays an important role in dividing private spaces from semi-common spaces
in a house. Indeed the relationship between the courtyard and other elements of the cir-
culation system, such as the vestibule (Hashti) and corridors, forms a hierarchical circu-
lation system in a vernacular house to protect the privacy of the residents and contribute
to the facility of access to different spaces.
As shown in Figure 2.15 (left) during the hot seasons, people use the courtyard as a
place to sleep at night. The existence of a pool in the centre of the courtyard contributes
to reducing temperature during summer. In addition, people use the water from the pool
for washing and cleaning and children use it as a place for swimming during summer.
Figure 2.14: The open space (white areas) and built areas in the historical part of Kerman (Herdeg, 1990:37)
Chapter 2: Literature review
56 | P a g e
The courtyard is also used as a safe and private space by the female residents for com-
munication with female neighbours. Likewise, some customs such as wedding and
birthday celebrations or funeral customs and “Rohozi” (traditional performance art
which is held on the pool surface temporarily covered by wood to form a platform) are
held in the courtyard. In Kerman, the courtyard can be viewed as a multi-functional
space that is the heart of traditional houses. It can be seen as an environmentally appro-
priate element which functions as a social-cultural and commercial space at the scale of
urbanism and as the main space for conducting daily and family activities at the scale of
individual buildings.
b. Dome
The dome can be considered as an element which makes a visual relationship between
the different components of the city of Kerman. The use of domes as the roof of ba-
zaars, commercial and spiritual buildings, water storage structures, and traditional ice
boxes called “Yakhchal”, points out the compatibility of the dome with a variety of
functions and spaces. Many researchers such as Brill (1974) and Herdage (1990) have
described the dome as one of the main symbolic characteristic structures used in Islamic
cities. However, the use of this curved form by traditional architects arises from the es-
sential characteristics of materials such as brick and stone when they have to form the
roof covering. Brick is a material that can naturally resist compression forces and is
weak against bending and shear forces. The curved profile of the dome contributes to
reducing the shear and bending forces exerted on its elements. In Islamic architecture,
Figure 2.15: Left, courtyard used in summer as open air bedroom http://nazaronline.ir/files/fa/news/1389/7/3/1309_325.jpg viewed October 2011
Right, courtyard connects all internal spaces to each other http://images.travelpod.com/tw_slides/ta00/9d9/eca/kashan-traditional-house-kashan.jpg viewed October 2011
lamic cities, the Friday mosque has been made larger and higher than other buildings,
influenced by its social and physical functions and spiritual value.
In most of the Iranian cities in which brick or mud are used as the dominant materials
for construction, the Friday mosques are almost always covered by tiles of different
colours to be distinctive among other buildings and places. In terms of its spiritual
value, the “Iranian mosque, and in particular the Friday Mosque with its resplendent
ceramic sheath of the paradisal colours of blue, green and yellow, sought actually to
evoke the image of the Muslim paradise, with the sapphire of its water, the emerald of
its foliage and the gold of its fruits and vines” (Pereira, 1994:15).
In terms of its physical form and scale, particularly in desert areas, where Caravans
travelled at night to avoid the hot temperature of the desert in the day, in comparison
with other buildings and places in Islamic cities, Mosques have been made of a size
such that their elements including domes, minarets (lit by fire) or entrances could be
seen by Caravans for navigation. As a result, the size of the Friday mosque can be
viewed as a social and physical factor or indicator to control the vertical development of
most Islamic cities in Iran. Figure 2.17shows a conceptual cross section of an Islamic
city in which the Friday Mosque and its main elements, including the dome and mina-
rets, are depicted as the vertical benchmarks of the city.
Figures 2.18 and 2.19 show the scale of the Friday Mosque, and how its decorative but
also functional coverage by tiles and their colours makes a difference between this
space and other urban spaces with ordinary functions.
Figure 2.17: Conceptual cross section of an Iranian Islamic city
Chapter 2: Literature review
59 | P a g e
2.3.6.4. Economy
Rizvi (1991:2) believes that Islam is a complete way of life. He (1991:2) argues that
Islam is not only concerned with the spiritual uplifting of human beings, but is also
equally concerned about their material and physical well-being. As a result, Islam
guides its followers in financial and economic matters, in social and political affairs,
and also in the moral and personal spheres of human life. In Islamic cities and societies,
the economic system and its activities are influenced by religious economic laws such
as “Khums”. "Khums" literally means "one-fifth or 20%". In Islamic legal terminology,
it means "one-fifth of certain items which a person acquires as wealth, and which must
be paid as an Islamic tax". The Qur'an mentions it in the following verse: “Know that
whatever of a thing you acquire, a fifth of it is for Allah, for the Messenger, for the near
relative, and the orphans, the needy, and the wayfarer...” (8:41).
Rizvi (1991:2) states that as Khums are an important pillar of the Islamic economic sys-
tem, it is appropriate to briefly describe the system itself. However, it must always be
remembered that the Islamic economic system is not in itself complete; it is a part of the
over-all system of life. Islam is a compact system of life in which all its aspects (reli-
gious, ideological, social, political and ethical) are well synchronized. Muslims will
succeed only if they make the whole system work, and not just pick and choose from it
according to their likes and dislikes.
Figure 2.18: Friday Mosque of Kerman, main entrance http://www.destinationiran.com/gallery/wp-content/uploads/2010/05/kerman-friday-mosque.jpg viewed October 2011
Figure 2.19: Friday Mosque of Ker-man, decorative coverage of walls http://cascolytravel.com/images/28122.jpg viewed October 2011
Ecotourism and Architecture through Sustainable Development
Knowledge Gap Lack of an integrated strategy for sustainable development of and its products (architecture) that makes a link between: - Anticipated outcomes, - Forecasted priorities, - Indicators used. Lack of a holistic method to set environmental, cultural and economic characteristics of ecotourism and its products (architecture) in a framework for exploring their influences on each other.
Research Question
o What are the main characteristics of an architecture that can contribute to sustainable development through ecotourism?
Factors considered: Holistic strategy for sustainable development of ecotourism and its architecture that determines:
o Environmental, cultural and economic outcomes and their related priorities, products, activities and indicators.
o Environmental, cultural, economic influences exerted by the development of ecotourism and its re-lated products and activities on the host destinations.
o Influences that are exerted by environmental, cultural and economic characteristics of ecotourism and its related architecture on each other.
Research Methodology
Summary and Conclusions Addressing the research question
Quantitative Approach: - Proposal for a comprehensive framework for sustainable ecotourism and its related architecture to
measure and set its environmental, cultural and economic footprints in a holistic framework to explore their influences on each other.
Research Limitations Further developments identified
Chapter 3: Research Methodology
70 | P a g e
The strategy for this work is to determine the main characteristics of ecotourism and
architecture through determining their environmental, cultural and economic outcomes
and related priorities, productive activities and indicators.
This research identifies the lack of a comprehensive strategy that has the ability to set
all the environmental, cultural and economic characteristics of ecotourism and its re-
lated activities and products, such as architecture, in a holistic framework to evaluate
these characteristics as being sustainable. This is the identified knowledge gap in this
thesis. This gap is then expressed as a research question:
“What are the main characteristics of an architecture that can contribute to sus-
tainable development through ecotourism?”
To answer the research question, a quantitative method is used. The quantitative ap-
proach involves evaluation and measurement of the environmental, cultural and eco-
nomic footprints of ecotourism and its architecture and their interaction with each other.
This is conducted through using the proposed comprehensive framework for sustainable
development of ecotourism and its architecture. The quantitative method developed here
has the ability to be combined with a qualitative approach in future research. This com-
bination would allow researchers to measure how far apart the beliefs of people are
about a given subject when compared with their acts. The results of this research are
summarised and conclusions drawn, research limitations revealed, and aspects requiring
further development are discussed.
3.3. Justification of the Research Methodology
The research methodology is intended to answer the primary research question about the
main characteristics of an architecture that can contribute to sustainable development
through ecotourism. The methodology requires a quantitative approach. This research is
explorative is setting out to see if it is possible to design a method that links together
assessment of the cultural/economic/environmental aspects of sustainability. It is also
explorative in testing the method through using selected case studies and reflecting on
the results of the investigation through a comparative approach. The proposed method-
ology is faced with ten problems explained in the next section that must be solved.
Chapter 3: Research Methodology
71 | P a g e
3.3.1. Methodological Problems
The problems that the quantitative methodology faces can be represented by the follow-
ing questions:
3.3.1.1. What are the main elements of a comprehensive framework that comprises the
environmental, cultural and economic characteristics of ecotourism and its architecture
within an integrated approach?
3.3.1.2. What are the main environmental, cultural and economic outcomes for the sus-
tainable development of ecotourism and its architecture?
3.3.1.3. What are the priorities for achieving the anticipated outcomes of the sustainable
development of ecotourism and its architecture?
3.3.1.4. What indicators can be used to evaluate ecotourism and its architecture as being
sustainable?
3.3.1.5. How can the environmental, cultural and economic influences of ecotourism
and its products and activities (including architecture) on a given host destination be
measured and evaluated?
3.3.1.6. How can the differences between the existing circumstances of an ecotourism
project and its architecture and the goal of being sustainable be measured?
3.3.1.7. How can the ecological, cultural and economic indicators used for the evalua-
tion of ecotourism and its architecture be linked to each other in a holistic method?
3.3.1.8. What data are required?
3.3.1.9. How can the required data be collected?
3.3.1.10. How can the collected data be analysed?
3.3.2. Research Case Studies
The three case studies of the Otago Central Rail Trail (OCRT) (regional scale), Naseby
and Cromwell (site scale) have been chosen for evaluation through using the proposed
framework, model and indicators. The main reasons for choosing these three case stud-
ies are explained in following sections.
3.3.2.1. OCRT
This section introduces the main characteristics of the OCRT as an appropriate case
study for this thesis.
Chapter 3: Research Methodology
72 | P a g e
a. OCRT as a Community Based Soft Ecotourism
The OCRT is a community based soft ecotourism project that is managed and moni-
tored by the OCRT trust. This characteristic gives the opportunity for local people to
participate in its development. The OCRT and its community are linked to related or-
ganisations such as the Otago Regional Council and the Department of Conservation,
which also have an interest in its sustainable development.
b. Rural and Urban Destinations along the OCRT
The OCRT makes a linkage between many rural and urban destinations and their adja-
cent areas. This characteristic contributes to its visitor experience of various host desti-
nations with different environmental, cultural and economic particularities. Through
using the OCRT as a case study, the proposed framework and model can be used to in-
vestigate how soft ecotourism influences its host societies and how far its cultural foot-
print is from an ideal sustainable model for ecotourism.
c. The OCRT as a Successful Tourism Project
The OCRT has been claimed as a successful tourism project by the New Zealand gov-
ernment (New Zealand Tourism strategy 2015, 2007:62). This makes it an ideal case
study to explore the proposed framework, the model and the indicators in New Zealand
as a developed country.
3.3.2.2. Second Case Study: Naseby
Naseby and Cromwell are two of the host destinations for OCRT visitors according to
the OCRT trust, which describes them as attractive places for their visitors. In Naseby 6
of 26 accommodation buildings (excluding 72 camping sites) are refurbished buildings
and 20 are new buildings. Conservation of the cultural heritage of Naseby in terms of its
historical buildings used as accommodation services makes it distinctive in the ORCT.
In 2011, 4,350 of the total 11,788 OCRT visitors played curling at Naseby, making this
activity another reason for using Naseby as one of the most important host destinations
for OCRT visitors. The variety and frequency of other activities, products and services
offered by Naseby accommodation services is another reason to choose it as a case
study (see appendix 28).
Chapter 3: Research Methodology
73 | P a g e
3.3.2.3. Third Case Study: Cromwell
Unlike Naseby and as shown in Table 6.79 all accommodation services in Cromwell are
newly constructed buildings. Comparison between the cultural footprints of Naseby and
Cromwell related to their accommodation services through using the framework, the
model and the indicators, will determine how using refurbished building as cultural
heritage contributes to ecotourism and its architecture having a more sustainable cul-
tural footprint.
As shown in Table 5.48, in 2011, 22.5% of all OCRT visitors came to old Cromwell
town. Appendix 34 determines the variety of social and cultural products and activities
offered by Cromwell’s accommodation services to OCRT visitors. This is another rea-
son to choose this host destination as a case study. Comparison between the cultural
footprint (CF) of products and activities produced/ consumed and conducted by Naseby
and Cromwell visitors will demonstrate how the framework, model and indicators can
be used to compare two host destinations in terms of delivering sustainable tourism.
Using the three case studies of the OCRT, Naseby and Cromwell to test the framework
will also determine its strengths and limitations.
3.4. The Structure of the Methodology
Figure 3.2 shows the structure of the methodology used in this thesis included three
main sections of: the comprehensive framework for ecotourism and its architecture; data
collection and data analysing (Figure 3.2).
Chapter 3: Research Methodology
74 | P a g e
In this methodology, the comprehensive framework is the core of the methodology the
influences the other sections of data collection and data analysis. The main sections of
the methodology are explained below and the relationship between these sections de-
termined.
The Structure of the Research Methodology
Comprehensive framework for the sustainable development of ecotourism and architecture
This research analyses and evaluates the environmental impacts of the development of
ecotourism in the host destination (at the regional scale) through the use of related indi-
cators proposed in its environmental framework. To achieve this goal, this study calcu-
lates the ecological footprints (EFs) of:
a. 1. The types of transportation used
a. 2. The production and consumption of local and conventional foods
a. 3.The refurbished and new buildings used as accommodation services by types of ac-
commodation
a. 4.Tourism activities
The calculated EF (the sum of the above EFs) is then compared with a target sustainable
EF of holidays as the goal to be achieved through the sustainable development of the
OCRT. The present EF is compared with the target EF to calculate the overshoot por-
tion of the current EF (this process is explained in detail in Chapter 5, section 5.9.1).
This portion of ecological footprint can then be used as an indicator to evaluate the de-
velopment of ecotourism towards being environmentally sustainable.
b. Economic Analysis
The economic footprint of ecotourism in the host destination is calculated by using the
economic indicators (such as employment and GDPs) as proposed in the economic
frameworks for the sustainable development of ecotourism and its architecture.
b. 1. GDPs
In this analysis, GDPs (see Chapter 4) is considered a fundamental economic indicator
that clarifies how much of the GDP earned through development of ecotourism must be
spent to restore its environmental damages.
The total GDPs of an ecotourism project (OCRT) is calculated through measurement of:
- GDPs earned through transportation.
- GDPs earned through local products (food).
- GDPs earned through accommodation services.
- GDPs earned through tourism activities and related services.
Chapter 3: Research Methodology
80 | P a g e
b. 2. Employment
The number of staff employed in the OCRT is used as an economic indicator for the
development of ecotourism and architecture.
c. Cultural Analysis
This thesis proposes a quantitative method to calculate the Cultural Footprint (CF) (de-
fined in Chapter 4) of an activity or a product such as ecotourism or architecture that, in
turn, can be used as a cultural indicator to evaluate its development as being culturally
sustainable. This thesis uses the following steps to calculate the CF of ecotourism and
its accommodation services at a regional scale:
c. 1. Quantities of Ecotourism Products and Activities
Calculation of the CF needs to use quantitative data including:
- The quantities of conventional and local products used such as foodstuffs (kg). It
should be remembered that the quantities of local products (cultural products) are in-
troduced as cultural indicators for the sustainable development of ecotourism in its
related cultural framework.
- Calculation of the quantities of refurbished and new buildings used as accommoda-
tion services (m2 or number of bed spaces). The measured factors include: areas of
open and indoor spaces; number of bed spaces; volume of materials used; facilities
used; and energy used, for example, all by types of accommodation services.
- Calculation of the number of visitors per tourism activity. Activities include: sports
and recreational activities; visiting historical sites and buildings; and art activities
(such as landscape photography). In this thesis, the activities mentioned are intro-
duced as part of the socio-cultural behaviour of visitors and host people.
c. 2. The Reduced/ Increased Portion of EF
The portion of the EF of ecotourism and architecture which is reduced or increased is
influenced by using cultural products, and is calculated through using two scenarios for
the measurement of EF.
In the first scenario, the EF of the products used is calculated as the sum of:
- The EF of conventional products used (for example conventional foods), and that of
cultural products used (for example local and organic foodstuffs).
Chapter 3: Research Methodology
81 | P a g e
- The EFs of the new and refurbished buildings (including open air spaces such as
balconies and verandas) used as accommodation services.
- The result of this scenario (EF1) is the same as the result of the ecological analysis
for products used (3.2.4.1-a).
In the second scenario, the ecological footprint of the products used (EF2) is calculated
based on the assumption that:
- All the products used are conventional (such as conventional foods).
- All accommodation services are new buildings without open air spaces (verandas
and balconies).
The difference between the results of these two scenarios (EF1-EF2) shows the reduced
or increased portion of EF influenced by the use of:
- Local products (which are considered to be cultural products).
- Refurbished buildings and open air spaces.
c. 3. Increased / Reduced Portion of GDPs
This research calculates the increased and reduced portion of GDPs influenced by the
use of local products and refurbished buildings as accommodation services using the
two following scenarios:
- Measurement of GDPs based on EF1 = (GDPs1)
- Measurement of GDPs based on EF2 = (GDPs2)
Difference between GDPs1 and GDPs2 (GDPs1-GDPs2) is equivalent to the portion of
GDPs that is reduced or increased by using local products, refurbished buildings as ac-
commodation services, and using open air areas as parts of the related architecture.
c. 4. The CF of Local Products and Accommodation Services
The CF of using local products can be shown through using a triangular framework in
which the quantity of cultural products used, the reduced/ increased portion of the EF of
ecotourism, and the reduced/ increased portion of GDPs as influenced by the product(s),
are set on each apex of the framework (Figure 3.3).
Chapter 3: Research Methodology
82 | P a g e
In Figure 3.3 the present CF of local products is shown as the area defined by Q 2, EF2
and GDPs2. In this figure Q 2 is the present quantity of product that contains Q 3 (the
present quantity of conventional product) and Q 4 (the quantity of local products).
Q 2 = Q 3 + Q 4
In Figure 3.3, Q is the quantity of the Ideal model for sustainable living. In the Ideal
model for sustainable living the EF of producing and consuming Q is the sustainable
ecological foot print.
Shown in Figure 3.3, Q 1 is the quantity of products assumed as 100% conventional
products.
EF 1 in Figure 3.3 presents the EF of consuming and producing 100% conventional
products (Q 1).
Demonstrated in Figure 3.3, the EF2 is the present EF of producing Q 2 (including Q3
and Q 4). In addition in this figure, Ideal EF is the sustainable ecological footprint of
products.
In Figure 3.3, the GDP is the total GDP related to products. In the Ideal model of sus-
tainability, since the overshoot portion of the EF is zero, the total GDP= GDPs. Shown
in Figure 3.3, GDPs1 is the sustainable portion of GDP when 100% of products are
conventional. Moreover in this figure, GDPs2 is the present GDPs related to producing
Q 2 that contains Q 3 and Q 4. As illustrated in Figure 3.3 the difference between EF 1
and EF2 shown as (R) EF 1 is the reduced portion of the EF 1 influenced by producing
and consuming Q 4. Moreover comparison between the Ideal EF and other EFs (EF 1
and EF2) indicates the overshoot portion of each EF. Furthermore, in Figure 3.3, the
difference between GDPs1 and GDPs2 shown as (I) GDPs1 indicates increased portion
of total GDPs influenced by producing Q 3.
The model illustrated in Figure 3.3 has the ability to show the present CF of the prod-
ucts, also it can be used to determine how much of the total GDP must be spent to
change the present EF of the products to fit with its ideal ecological footprint. Figure 3.3
illustrates a model that can be used to show the CF area of other cultural products and
activities. Also this model can be used to compare the CFs of different activities or
products with each other at the different scales of the region, community, site and build-
Chapter 3: Research Methodology
83 | P a g e
ing. In addition, this model can be used as a tool for planning, management and mentor-
ing of the process of development as being sustainable.
d. Calculation of the CF of Tourism Activities
The CF of tourism activities is done through the following steps:
d. 1. Calculation of the number of visitors for each activity.
d. 2. Calculation of the EF of each visitor’s activities.
d. 3. Calculation of the GDPs per visitor for each activity.
The results determine the environmental and economic footprints of each tourism activ-
ity which is considered to be a part of visitors’ cultural behaviour that are contributing
through ecotourism to development. Setting these results in a common framework
shows a part of the CF of ecotourism in the host destination. This study makes a com-
parison between the numbers of visitors, EF and GDPs of each type of tourism activities
(such as walking, golfing and curling) through setting them in the holistic framework
mentioned. At the regional scale, it allows this research to explore which types of tour-
ism activities (as proposed cultural behaviours) are more culturally appropriate, envi-
GDPs1
GDPs2 (I) GDPs1
0.00%
100%
Figure 3.3: A sample model to show the CF of local products
Q 4
100% EF 1
Ideal EF
Q
Q 2
Q 1
100% GDP
Ideal Model
First scenario
Second scenario (present)
EF2
Q 3
(R) EF 1
Chapter 3: Research Methodology
84 | P a g e
ronmentally sensitive, and economically viable. The CF of these activities is considered
a part of the total CF of ecotourism development.
e. Total CF
The total CF of ecotourism development determines the influences exerted by the total
cultural products and activities on the EF and GDPs of ecotourism. In Figure 3.3, quan-
tities of all cultural products and activities (QCPA) can be set on the top apex of the
Figure Also the reduced/increased portions of GDPs and EF can be set on the left and
right bottom vertices of the model.
3.4.3.2. Analysis at the Site/Individual Building Scale
At the site/individual building scale, this thesis analyses the ecological, cultural and
economic footprint of ecotourism and its related architecture (as used as accommoda-
tion services in the OCRT) in the host destinations through the use of Naseby and
Cromwell as second and third case studies. Both these case studies are settlements lo-
cated along and influenced by the OCRT. The factors for which their footprints are ana-
lysed include: transportation used; products (such as food and beverages); built up land
(accommodation services); and tourism activities and services such as cycling, walking,
golf and curling. The analysis at the site/architecture scale for Naseby and Cromwell
follows the same method explained above for the regional scale of the OCRT.
This thesis makes a comparison between the results of the analysis for Naseby and
Cromwell to find how an ecotourism project can exert different ecological, cultural and
economic influences on these two areas. These belong to different bioregions, with dif-
ferent cultural heritages, capitals and behaviours, but that are linked together through a
community based ecotourism project.
The comparison between the environmental, cultural and economic characteristics of
the accommodation services used allows this thesis to test the proposed holistic frame-
works for ecotourism and architecture, which are here used to determine the ecological,
cultural and economic characteristics of an architecture that contributes to sustainable
development through ecotourism.
Chapter 3: Research Methodology
85 | P a g e
3.5. Importance and Limitations
This section discusses the strengths and weaknesses of the proposed methodology.
3.5.1. Importance of the Methodology
3.5.1.1. Comprehensive Approach
The methodology aims at a comprehensive approach to the sustainable development of
ecotourism and its architecture. For a first time this thesis presents an original method-
ology that can make a linkage between the surrounding environment, culture and eco-
nomic system in a given host destination for ecotourism (and its architecture) in order to
measure its level of sustainability. This also relies on the comprehensive framework in-
cluded as the main part of this methodology. The comprehensive framework, its impor-
tance and limitations will be discussed in detail in the next chapter (Chapter 4).
3.5.1.2. The Integration of Environmental, Social and Economic Indicators
Integration of ecological, social and economic indicators in a quantitative method
makes an opportunity for this thesis to explore the environmental, social-cultural and
economic influences exerted by ecotourism and its architecture on a given host society.
Likewise this relies on using the proposed holistic framework and model.
3.5.1.3. Compatibility with Quantitative Methodologies
The quantitative methodology can be used as complementary method to any qualitative
methodology for assessment of the sustainable development of ecotourism and its archi-
tecture.
3.5.1.4. Using Existing Information Systems and Available Technologies
This methodology uses existing information systems, and available research results to
show how these can be used for this research. The reason for doing this is to explore the
limitations of the existing information systems, data and available research. The study
was made without site visits; so as to ascertain if it were possible to draw meaningful
conclusions from publicly- available data. If this could be shown to be the case it would
increase the value of the methodology, as it would be able carried out remotely, and at
lower cost, increasing its applicability.
Chapter 3: Research Methodology
86 | P a g e
3.5.1.5. Indicating Required Data through Related Indicators
The methodology indicates the required data needed from the proposed environmental,
cultural and economic indicators. This allows determination of the data linked to the
sustainable development of ecotourism and its architecture, thus avoiding collecting ir-
relevant data.
3.5.1.6. Integrated Analysis
The methodology proposes an method in which the ecological, social and economic
data are analysed in a way that indicates the interaction between them. It allows the the-
sis to cover all dimensions of sustainability related to the development of ecotourism
and its related products and activities.
3.5.2. Limitations
3.5.2.1. Shortcoming of Available Information Systems
One of the main problems of the approach is relying on other peoples’ data and results,
with no means of checking their accuracy. However, development of the method and
testing it will be done by attempting to collect data from the same type of sources, in
this case information published on official OCRT accommodation websites, and re-
search in the public domain related to the OCRT.
3.5.2.2. Accuracy
Since the methodology relies on using existing information systems with their short-
comings, the quantitative results cannot be completely accurate, although comparisons
between results produced by the research will still be relevant. However the intention of
thesis is not to come out with accurate results but rather to make people aware of the
problem and hence improve data collection for more accurate results.
3.6. Chapter 3: Summary
This chapter describes the quantitative methodology used in this thesis for answering
the research questions in Chapter 2. From the literature review, the three areas of sus-
tainability, ecotourism and architecture and their relationship with each emerged as the
point of focus for the research. Sustainability and its policies and principles are the fac-
tors that link ecotourism and its architecture to each other as being sustainable. This the-
Chapter 3: Research Methodology
87 | P a g e
sis aims to propose a methodological framework for sustainable development of both
ecotourism and architecture.
The comprehensive framework for ecotourism and its architecture needs to be able to:
• Comprise all environmental, social and economic characteristics of ecotourism
and its architecture such that these dimensions can be linked to each other.
• Measure the ecological, cultural and economic influences exerted by ecotourism
and its architecture on a given host society.
• Use efficient indicators for evaluation of ecotourism and its architecture through
a holistic approach to sustainable development.
• Be used as a comprehensive tool for evaluating of ecotourism and its architec-
ture through whole process of sustainable development.
Figure 3. 1. shows the research structure. The research is explorative and aims to design
a method that links together assessment of the environmental/ cultural/ economic as-
pects of ecotourism and its architecture through sustainability. The method will be
tested on selected case studies through taking a comparative approach.
Problems with this process are lack of first hand data will mean relying on secondary
data sources. However, this is also an opportunity to test such sources and make rec-
ommendations about data collection improvements.
In this thesis the EF is the main ecological indicator for evaluation of ecotourism and
architecture. To solve shortcomings identified with this indicator earlier, the thesis pro-
poses a comparative method to use the EF and other indicators for evaluation of ecot-
ourism and its products and activities as being sustainable. As shown in Figure 3.2, the
comprehensive framework uses the quantity of the social products and activities (for
example the quantity of food consumed by visitors, or the number of visitors who play
golf) (also see Chapter 4). These quantities are then converted to EFs. GDPs forms the
main ecological-social economic indicator for evaluation of ecotourism and its architec-
ture as being economically sustainable.
The methodology proposes an original method for analysing the data related to each of
the environmental, social and economic indicators through use of an holistic model that
is called the Cultural Footprint model (CF model) (Figure 3.3). Using this model allows
Chapter 3: Research Methodology
88 | P a g e
exploration of the ecological, social and economic influences exerted by development of
ecotourism and its architecture on a given host society. Furthermore the CF model has
the ability to be used as a tool to compare the ecological, social and economic influ-
ences of ecotourism and its products and activities on different host destinations.
One of the strengths of the methodology is its comprehensive approach to the sustain-
able development of ecotourism and its architecture. Using the CF model allows the
thesis to analyse the ecological, social and economic footprint of ecotourism and its ar-
chitecture in relation to each other through a holistic approach to sustainable develop-
ment. The main limitation of the methodology is having to rely on existing information
systems which will affect the accuracy of the results. However, using the comparative
methodology will help to reduce the negative impacts of this shortcoming on the results.
As discussed above proposing the comprehensive framework is one key goal of this the-
sis. Chapter 4 introduces the framework in detail.
Chapter 4: Comprehensive Framework
89 | P a g e
Chapter 4: Comprehensive Framework for the Sus-tainable Development of Ecotourism and Its Related
Architecture
This Chapter presents a comprehensive framework for assessing the sustainable devel-
opment of ecotourism and its related products and activities. This framework is divided
into two segments. The first segment contains a holistic framework for the sustainable
development of ecotourism and the second section introduces a multi-dimensional
framework for the sustainable development of architecture through ecotourism.
Each of the frameworks contains three subsectors, these being the cultural, environ-
mental and economic frameworks. Each of the three is further considered in terms of
their related outcomes; productive activities; and indicators and required data. This the-
sis attempts to conceptualise the results of these holistic frameworks as a simplified cul-
tural footprint model (CF-model). This model has the ability to put all ecological, cul-
tural and economic characteristics of an activity, such as ecotourism, or a product, such
as architecture, in a holistic framework so that its sustainability can be evaluated.
Moreover to construct the CF-model, this chapter proposes a new method to measure
the sustainable portion of GDP (GDPs) to be used as an economic indicator for sustain-
ability that has ecological and social characteristics.
4.1. A Framework for Assessing the Sustainable Development of
Ecotourism
4.1.1. Ecological Framework for the Sustainable Development of Ecotourism
This study presents a social-ecological framework that portrays the main ecological
goals which can be used as a pivotal part of an integrated set of principles for the sus-
tainable development of ecotourism. In addition, ecological indicators and their required
data are presented as the main output of this part of the thesis, in order to evaluate the
compatibility of ecotourism products, services and activities with the environment.
Chapter 4: Comprehensive Framework
90 | P a g e
4.1.1.1. Environment and Framework for Development of Ecotourism
Any discussion of the sustainable development of ecotourism and its framework should
reference its environmental impacts because, according to the definition of sustainabil-
ity as a multi-dimensional phenomenon, these form a significant part of a framework for
sustainability through development of ecotourism. In this view, as explained by Pigram
(1980:557):
[The] environment is not just a constraint, it is a resource; it is not just a
problem, it is an opportunity. That mankind has advanced as far as he has is
as much due to the abundance of the natural environment as to his own
skills in exploiting those resources. Properly safeguarded, the environment
can continue to nurture his economic, social and cultural progress. The
need therefore is to understand the characteristics of the environment within
which development is to take place and the extent to which it can be manip-
ulated to serve mankind’s needs.
Anticipation of what an ecological framework for ecotourism development might be is
related to the different approaches to mainstream thinking about sustainable develop-
ment. Weaver and Lawton (1999:12) introduce a set of moderate operating principles
for ‘mainstream’ sustainable development shown in Table 4.1.
Table 4.1: Operating principles for ‘mainstream’ sustainable development.
Operating principle (Weaver and Lawton 1999:12, Modified from Murphy, 1994). Category
Establishing ecological limits and more equitable standards of consumption Ecological Redistribution of economic activity and re-allocation of resources to fulfill principles of equity
Economic
Control of human population level Socio-cultural Preservation of basic resources that support the earth’s essential support systems Ecological More equitable access to resources and increased technological effort to use them more effectively
Ecological
Attention to carrying capacity and sustainable yield Ecological Retention of renewable resources Ecological Maintenance of biodiversity and cultural diversity Socio-cultural Minimization of adverse impacts on air, water and other natural elements Ecological Local community control Social Planning and policy at a broad national and international level Political Economic viability Economic Maintenance of environmental quality Ecological Environmental auditing as a dominant monitoring procedure Ecological
Chapter 4: Comprehensive Framework
91 | P a g e
The proposed operating principles (Table 4.1) entail a combination of ideologies pre-
sented by resource conservationists and resource preservationists. In this approach the
‘resource conservationists’ address those who are supportive of economic growth, but
only under conditions which do not threaten the natural resource base. Likewise the ‘re-
source preservationists’ address those who are supportive of ecosystem integrity, but do
not advocate a drastic de-population of the earth, or radical reduction in material life-
style.
Table 4.1 shows a composite framework for sustainable development in which the com-
ponents are interwoven with each other. This study sorts these operating principles into
the four categories of ecological, economic, socio-cultural and political principles (Ta-
ble 4.1-right column). Even for “mainstream” sustainable development, as shown in
Table 4.1, ecological principles play a crucial role in achieving the forecasted outcomes
for sustainable development.
4.1.1.2. Ecological Framework and Environmental Awareness
Environmental conservation should not be considered as a merely technological or eco-
nomic activity; rather it should be viewed as a social-ecological phenomenon. May
(1991:118) argues that if tourism is to play a conservative role in the maintenance and
enhancement of the environment in the developing world, where many of the worst ex-
cesses of the so-called developed world have not yet been seen, it needs to consider the
values which developers, host communities and visitors alike place on the environment.
He (1991:118) introduces the idea of having a “better understanding of the values at-
tached to people’s environments” as the first step to bringing humanity closer to the
goal of sustainability. Thus, awareness about environmental and natural values, and ef-
ficient strategies to conserve the natural heritage and its economic and social impacts on
the host destinations could be pivotal parts of an ecological framework for the sustaina-
ble development of tourism.
Environmental awareness, as one of the main social-ecological outcomes for the sus-
tainable development of tourism, can be conducted through an educational process
which makes host communities, local and indigenous people, stakeholders and develop-
ers ready to be engaged in the environmental conservation process. Furthermore, this
environmental awareness plays an important role to “move visitor experiences beyond
Chapter 4: Comprehensive Framework
92 | P a g e
passive enjoyment to an active role that promotes positive environmental ethics and fos-
ters preferred behavior” (Fallon and Kriwoken, 2003: 289).
4.1.1.3. Social-Ecological Goals for Ecotourism Development
As Murphy (1983:181) points out, all planning (including planning for the sustainable
development of tourism) needs goals to supply a frame of reference for detailed physi-
cal planning and for the constant management decisions that follow. He (1983:183) ar-
gues that these goals are abstract and continuous concepts intended to prepare a general
direction rather than specific guidelines, but that they must have general support and be
feasible to be effective.
This study views the environmental impacts of ecotourism development on the host des-
tinations as a social-ecological issue caused by an unsustainable pattern of resource con-
sumption, lack of social and cultural sensitivity to natural heritage, and lack of envi-
ronmental awareness, plus expansion of the ecological footprint (EF) of tourism activi-
ties, products and services through the development process.
Table 4.2 shows the anticipated ecological outcomes which can be achieved from the
sustainable development of ecotourism. By introducing these goals, this thesis attempts
to progress the attitude of the tourism industry towards the environment from one of
being merely economically exploitative to one of stewardship. The latter is something
required for natural and environmental conservation.
Environmental awareness together with engagement of local and indigenous people in
the natural conservation process are considered goals which can be achieved through a
community approach to tourism development. In this view, these two prime goals play a
pivotal role as the basic principles for the realization of the other forecasted ecological
outcomes (Table 4.2). Furthermore, in this approach, education as potentially a main
tourism activity can be explained as a transversal domain which has a close and effec-
tive relationship with all the other ecotourism activities shown in Table 4.2.
Chapter 4: Comprehensive Framework
93 | P a g e
Table 4.2: Ecological outcomes for development of sustainable ecotourism Ecological outcomes Productive activities
Environmental awareness Engagement of local and indigenous people as well as all related organizations (individuals, govern-mental and NGOs) in environmental education.
Engagement of local and indigenous people in the conservation process.
Employment of local and indigenous participants in the development process as employed or volun-teer staff.
Attention to carrying capacity and sustainable yields
Making a balance between carrying capacity, re-source consumption and the ecological footprint of tourism activities, products and services.
Protection of environmental resources and mainte-nance of biodiversity
Using policies to reduce the ecological footprint of tourism activities, products and services
Contribution through using renewable resources to generate energy used by tourism products and ser-vices.
Enhancing use of green technologies based on re-newable resource consumption and decreasing de-mands for fossil fuels to generate consumed ener-gy.
4.1.1.4. Definition of an Indicator
An indicator “can be an objective measurement, such as a number, a specific rate or ra-
tion; it can however, also refer to an opinion, or to a perception that points to a specific
condition or situation, and can be used to measure changes in that condition or situation
over time” (Secretariat of the Pacific Community -SPC, 2010:1). In other words these
pointers can be used to look closely at the resultant outcomes of initiatives and actions
or interventions. In addition, indicators provide the benchmarks needed to monitor and
measure promotion of a particular goal. The first section introduces the ecological, cul-
tural and economic indicators used in this thesis for evaluation of ecotourism and its
architecture, and the following, the proposed ecological indicators for sustainable de-
velopment of ecotourism.
a. Ecological Indicators
“Ecological indicators are mainly used to assess the condition of the environment, as
early-warning signals of ecological problems, and as barometers for trends in ecological
resources” (Niemi and MacDonald, 2004: 89). Esther et al (2005:218) consider ecologi-
cal indicators necessary for evaluating the effect of human activity on nature and the
environment. As Christian et al (1996:89) reveal, most sets of ecological indicators pro-
posed so far have focused on the state of the environment rather than on the interaction
between society and ecosystems. Current environmental issues are caused not only by
using technologies dependent on fossil fuels but also by social-cultural patterns of con-
sumption of environmental resources. As a result, the solutions for these problems must
be considered as social cultural policies. Thus, ecological indicators can be introduced
Chapter 4: Comprehensive Framework
94 | P a g e
as phenomena arising from socio-ecological principles. According to Christian et al
(1996:89), the principles that form the basis of the socio-ecological indicators, focus on
the societal activities and interactions between nature and society through the use of ma-
terials and energies.
a. 1. The EF
One of main aims of this thesis is to explore the current environmental impacts of tour-
ism and propose guidelines for reducing these impacts. As discussed in Chapter 3, due
to its strengths, the EF is used as a basic ecological indicator to evaluate ecotourism and
its architecture as being environmentally sustainable.
The EF was used in master’s study (O’Connor, 2009) to assess the impact of interna-
tional tourists in New Zealand. The EFs were calculated of five categories of activities
and services undertaken by international visitors to New Zealand: food; accommoda-
tion; transport; and goods, using the 2003 version 3,2 calculator (O’Connor, 2009:103).
According to O’Connor (2009:103) a survey was conducted in September 2008, from
which 236 responses were received, resulting in a 33% response rate. O’Connor
(2009:92) calculates the EF of New Zealand international tourists as 8.26 gha/capita,
which is 2.36 gha/capita more that the EF of a New Zealand resident (5.9 gha). She ar-
gues that the EF for tourists still sits at 55% of New Zealand biocapacity.
O’Connor (2009:104) points out that the main tourist energy consumption is for
transport, goods and purchases, and activities and attractions. She (2009:104) argues
that cropland, as the second largest land area of the EF, contributed to food having the
largest overall land area in the tourist EF.
O’Connor (2009) suggests lack of information; financial issues and time for research
are the main limitations for calculating the EF of New Zealand tourists. She also deter-
mines approximation of the results arising from shortcomings in available information
as another limitation of her research. This parallels discussions of the limitations of the
EF in Chapter 3 Both studies indicate development of information systems as one of the
necessities for sustainable development of tourism.
Chapter 4: Comprehensive Framework
95 | P a g e
Table 4.3 determines the proposed social-ecological indicators for evaluating the envi-
ronmental impacts of ecotourism development on the host destinations and achieving
the ecological goals of ecotourism shown in Table 4.2. Indicators ‘1a’ and ‘1b’ (Table
4.3), which indicate the number of participants in environmental education and the con-
servation process are also introduced as social cultural indicators. These indicators can
also be viewed as complementary indicators to the EF to evaluate the success of the so-
cial dimension of environmental conservation principles.
Table 4.3: Ecological indicators for evaluation of the environmental impacts of ecotourism development
on the host destinations Ecological outcome Indicator Definition
Environmental awareness 1a The number of local people who participate in the educational process
Engagement of local and indige-nous people in the conservation process.
1b The number of people who engage in the environ-mental conservation process including volunteer or employed participants
Attention to carrying capacity and sustainable yield
1e Ecological footprint of tourism activities, products and services
Protection of environmental re-sources and maintenance of biodi-versity
1e Ecological footprint of tourism activities, products and services
Contribution through use of renew-able resources to generate energy used by tourism products and ser-vices.
1e Ecological footprint of tourism activities, products and services
4.1.1.5. EF by Types of Ecotourism Products and Activities
This thesis attempts to calculate the pressure on natural resources exerted by visitors in
their host destinations. As mentioned above, the EF is used as an indicator to evaluate
tourism activities, products and services as being environmentally compatible. As a first
attempt to achieve this goal, the EF of a visitor is divided into the three categories of;
food consumption, accommodation services (as the most important additional infra-
structural factor related to tourism expansion) and transportation (Table 4.4).
Mahravan and Vale (2010) calculated the ecological footprint of food, transportation,
consumed water and accommodation services for the Otago Central Rail Trail (OCRT)
visitors in 2009. Their study (2010:1393) shows that the total OCRT- EF is equivalent
to 7,281gha, and the consumed water EF is equivalent to 116 gha, or just 1.6% of the
total EF for OCRT visitors in 2009. This earlier study (2010:1393) shows that in com-
parison with food EF (2,570 gha), transportation EF (4,356 gha) and accommodation EF
(239 gha), the consumed water EF is so small that, to simplify the list of ecological in-
Chapter 4: Comprehensive Framework
96 | P a g e
dicators used in this thesis, it can be ignored. In addition, as O’Connor (2009) reveals,
the EF of waste related to New Zealand tourism accounts for 5% of the total EF of New
Zealand international tourism. Consequently, this thesis focuses on the four categories
of transportation, food, accommodation and tourism activities and ignores other factors
with small EFs.
Table 4.4: Tourist EF and its sub-categories Category Sub-categories
Visitors’ ecological footprint
Transportation EF Food EF Accommodation services EF Visitor activities
4.1.1.6. Required Data
Since the EF of tourism products and activity is calculated yearly, the required data
must relate to a year, which is the baseline year of the EF. Table 4.5 shows the required
data related to each EF category. This thesis aims to use the data related to 2011 to cal-
culate the EF of tourism in the three case studies. Since some of the required data relat-
ed to 2011 are not available, data related to the previous years are used to calculate the
EF and where this happens will be addressed throughout the thesis.
As shown in Table 4.5, the data required to measure the EF of the transportation used
by visitors are divided into two categories: required data related to transportation used
by international visitors and data related to travel by domestic tourists. The differences
between these two sets of data can be explained as the differences between the types of
transportation used and their different EFs and the total tourism-km travelled (interna-
tional visitors travel a lot further).
In this thesis, visitors travelling along the Otago Rail Trail, whether by foot or on bicy-
cles are viewed as participating in visitor activities and EF is separately calculated sepa-
rately. Thus to avoid double counting in the EF of visitors activities related to travel-
ling, in Table 4.5 transportation used while in Otago is excluded. In Table 4.5, transpor-
tation comprises the types of transportation used to access the OCRT.
In Table 4.5 it is assumed both international and domestic visitors effectively eat the
same amount of food and use the same types of accommodation services in a host desti-
Chapter 4: Comprehensive Framework
97 | P a g e
nation. Thus, as shown in Table 4.5, to calculate the EFs of food and accommodation
services consumed and used by visitors, the total number of visitors (international and
domestic) is used. Likewise, some data such as ecological carrying capacity and visitor
nights are common between all relevant EF categories.
Table 4.5: EF categories and required data EF Category Required Data
Transportation
International Transportation
Number of international visitors by home place Total number of international visitors Distance between international visitor home places and host destination by types of transportation used Total international tourism- km International T-km by types of transportation used Energy use MJ/ Passenger-km by types of transportation used Total Energy use MJ Ecological Carrying Capacity
Domestic
Transportation1
Number of domestic visitors by visitor home place Domestic tourism- km by type of transportation used Energy use MJ/ (domestic) Passenger-km by types of transporta-tion used Total Energy use MJ (for domestic visitors)
Food
Number of visitors Average number of nights visitors stay during their visit Food eaten out per visitor Energy use MJ per kg food Total energy use (for food consumed by visitors) Ecological carrying capacity
Accommodation
Average number of visitor nights by types of accommodation used Number of visitors Total visitor nights by types of accommodation used Energy use per visitor night by types of accommodation used Total energy use by types of accommodation used Ecological carrying capacity2
1. Domestic transportation comprises the access to the OCRT and travelling along the OCRT is excluded. 2. Ecological carrying capacity is used to calculate the EF of the products (e.g. accommodation services) and ac-
tivities (e.g. walking and golfing) through following equation: EF = Total lifecycle energy use / Ecological carrying capacity.
4.1.1.7. Discussion
This section considers the process of environmental conservation through the develop-
ment of sustainable ecotourism as a social-ecological process based on a community
approach to tourism. Forecasted ecological outcomes for the sustainable development of
tourism tend to engage local and indigenous participants (who achieve environmental
awareness through taking part in an educational process) in the environmental conserva-
tion procedure. Likewise, reducing the negative impacts of ecotourism on natural re-
sources, which can be achieved by decreasing the EF of ecotourism products, services
Chapter 4: Comprehensive Framework
98 | P a g e
and activities, forms a crucial part of the anticipated ecological goals for tourism in this
study.
The three categories of transportation, food and accommodation are introduced as the
important representative products and services of ecotourism because they have the
highest energy use and the biggest EF. Consequently, in this thesis, the EFs of these
three categories are used as ecological indicators to evaluate the environmental compat-
ibility of ecotourism development in the host destinations. This study, therefore, also
presents a list of the required data which can be used to measure two things:
a. The level of environmental awareness among local and indigenous people and the
number of participants in environmental conservation through tourism development.
b. The ecological footprint of tourism’s products, services and activities.
This ecological framework, related indicators and required data are viewed as a sub-
sector of an integrated framework for the sustainability of ecotourism development.
4.1.2. Cultural Framework for the Sustainable Development of Ecotourism
To attempt to achieve sustainability through the development of ecotourism needs con-
stant monitoring and this could be done through the evaluation of the cultural footprint
of tourism as well as its ecological and economic impacts on the host destinations. This
study attempts to introduce an efficient cultural framework for this, together with its
related indicators and required data. This can then be used to evaluate the CF of eco-
tourism through sustainable development in a host destination.
This study introduces a theoretical base for the creation of a cultural framework which
includes definition of pivotal factors (such as culture, development, and cultural dimen-
sion of development) that play important roles in structuring a cultural framework. To
support the latter theory, this study presents some examples of existing frameworks for
cultural statistics, and cultural frameworks for sustainable tourism. One of the main out-
comes of this study will be a cultural framework for ecotourism and development of
sufficient cultural indicators with their required data. These can then be used as a tool
for evaluating the CF of ecotourism in the host destinations. This cultural framework is
considered as complementary to the ecological and economic frameworks to create an
overall comprehensive framework which has the ability to evaluate sustainability
through development of ecotourism.
Chapter 4: Comprehensive Framework
99 | P a g e
4.1.2.1. Culture
As defined by The Mexico Declaration on Cultural Polices in 1982, “culture is the
whole of distinctive traits – spiritual and material, intellectual and affective characteriz-
ing a society or a social group” (Breis, 1992:2). It is the sum total of the ways through
which a group builds up a pattern for living that is transmitted from one generation to
another. Cochrane (2006:322) argues that culture consists of patterns, explicit and im-
plicit, of and for behavior acquired and passed on by symbols, constituting the distinc-
tive achievement of human groups, including their embodiments in artifacts. The essen-
tial core of culture consists of traditional (i.e. historically derived and selected) ideas
and especially their attached values; cultural systems may, on the one hand, be consid-
ered as products of action, and on the other as conditioning elements of further action.
Gerring and Barresi (2003) have suggested a ‘min-max’ strategy to produce a core defi-
nition of the concept of culture. They (2003:205) break down this min-max strategy into
three steps (as shown in Table 4.6), comprising sampling usage, typologizing attributes
and constructing minimal and ideal-type definitions.
Table 4.6: The process of Min-Max Definition (Gerring and Barresi, 2003:205) 1 Sample (sample representative usages and definitions within a linguistic context) 2 Typologize (arrange non-idiosyncratic attributes in a single typology). 3 Define
(a) Minimal (identify those few attributes that all non-idiosyncratic uses of the term have in common).
(b) Ideal-type (identify those attributes that define a term in its purest, most ‘ideal’, form).
“Minimal definitions identify the bare essentials of a concept, sufficient to [bind] it ex-
tensionally while maintaining all non-idiosyncratic meanings associated with the term”
(Gerring and Barresi, 2003:207). They (2003:207) point out that minimal definitions
embody all definitional attributes that are necessary and therefore, are always present.
Gerring and Barresi (2003:208) state that in contrast, ideal-type definitions aim for a
collection of attributes that is ‘maximal’ in that it includes all non-idiosyncratic charac-
teristics that together define the concept in its purest, most ‘ideal’ form. As Cochrane
(2006: 322) argues, the ideal definition is ‘fuzzier’ but the minimal definition has rela-
tively clear borders. Table 4.7 shows attributes of minimal and ideal-type definitions of
culture.
Chapter 4: Comprehensive Framework
100 | P a g e
Table 4.7: ‘Culture’: Min-Max Definitions (Gerring and Barresi, 2003:210). Minimal Attributes: Production and Transmission: Characteristics:
Social Ideational or symbolic Patterned Shared
Ideal-Type Attributes: Production and Transmission: Characteristics:
Social Human Ideational Patterned Shared Enduring Cumulative Coherent Differentiated Comprehensive Holistic Non-interest-based Implicit
Functions: Casual Constitutive
Cochrane (2006:322) and Gerring and Barresi (2003:211) when taken together reveal
that culture is a set of beliefs or behaviors in its minimal form which are produced,
transmitted and learned socially and often spoken of as a heritage or tradition. Cochrane
(2006:322) states that only formal rules and behaviors which signify something other
than themselves can be viewed as cultural. Cultures are also captured by social scientists
by being recognized as phenomena having the near synonyms such as ‘ordered’ or ‘or-
ganized’. Gerring and Barresi (2003:211) use this as an attribute by saying that cultures
are patterned. Cochrane (2006:322) believes that there is a degree of pattern to a culture
(although it is not always obvious), as humans are born into a culture, rather than ran-
domly producing one. In addition, in terms of both minimal and ideal-type attributes, a
culture is shared by a social group such as a nation, an ethnic group, or tribe (see Table
4.7).
A culture, in its ideal type, as well as having the characteristics mentioned above, is en-
during in nature (being slow to change), coherent and interconnected, unique to a par-
ticular group, and comprehensive and holistic in the range of beliefs and practices cov-
ered by it (rather than being one dimensional and related to a single issue). Likewise,
beliefs and practices related to culture are general instead of being merely a function of
self-interest and formulized. The functions of culture are both casual and constitutive. In
fact, culture constrains and influences human actions and influences people and their
experiences by imparting a certain recognizable essence.
Chapter 4: Comprehensive Framework
101 | P a g e
4.1.2.2. Culture and Environment
This part of the study presents an ecological view of a society and its cultural structure
to explore the relationship between culture and environment. It begins with introducing
the interaction between an ecological organism and its components with their surround-
ing environment.
Williams (2007:2) explains that the biosphere (as the livable part of the environment for
plants, animals and humans) is composed of the earth plus the sliver of thin air extend-
ing out six miles from the earth’s surface and that all life in this zone relies on the sun’s
energy. “The biosphere has specific bioclimatic zones called biomes, which are tailored
to their climate, soil, physical features, and plant and animal life” (Williams, 2007:2).
Lawrence (2003:31) argues that ecology is defined as a science that deals with the inter-
relationship between organisms and their surroundings.
Humans are part of the environment, and all changes in nature and their habitat affects
them. It is important to know what is being affected and how. Odum (cited in Williams,
2007:3) devised an ecological model which illustrates the relationship between flows of
energy and materials, between system components and between producers and consum-
ers (Figure 4.1).
Williams (2007:3) remarks that all of life functions in the way shown in Figure 4.1. The
relationship between the components can be changed by changing the connections and
flows between the components and some of these changes can be caused by humans.
For example, construction of a dam to increase production of electricity or to contribute
to the development of agriculture can change the covering of plants and increase the ex-
pansion of desert in the adjacent areas located on the lower levels. This land use change
Sun
NUTRIENTS
Figure 4.1: Flows of energies and materials in an organism
Chapter 4: Comprehensive Framework
102 | P a g e
results in a gain to an organic community (people), but also the loss of contributions
from nature, such as failure to access clean water.
Odum’s model illustrates the simple and essential relationship between natural energies
and renewable resources (Figure 4.1). In this view, becoming a sustainable organism is
achieved by using natural energies and renewable resources. On the other hand, an or-
ganism is sustainable when all components, micro-organisms and communities are
adapted to fit with the natural laws that are dominant in the whole process of energy and
material cycles in nature. Humans are not exempted from being compatible with natural
laws. In this they are like all other natural organisms.
Using an ecological perspective, culture is a system which as Rapoport (1969) demon-
strates has an interconnection with the environment. Culture can be manifested through
the religious beliefs, intellectual and spiritual engagement, materials used, and products
(such as art, architecture, food, and textiles) of a given group or society. If a society is
viewed as an organism, culture can be defined as the way in which physically and spir-
itually it makes a linkage between the given society and its surroundings.
4.1.2.3. Culture and Development
Development is defined in the Final Report of Mondiacult (cited in Breis, 1992:2) as a
complex, global and multi-dimensional process, going beyond mere economic growth
to include all dimensions of life and all the energies of a community. In addition all
members of a society must take part in the effort to achieve the economic and social
transformation of its welfare.
The World Commission on Culture and Development (WCOCAD) (1996) analyzed de-
velopment in two different ways. Firstly, “according to the standard view, development
equals economic growth, sometimes qualified by insistence on a wide spread of the
benefits of growth” (WCOCAD, 1996:14). Secondly, as advocated by UNESCO,
UNDP’s annual Human Development Report and many distinguished thinkers, (cited in
WCOCAD, 1996:14), development is a process that enhances the effective freedom of
the people involved to pursue whatever they have reason to value. WCOCAD (1996:
14) indicates that in this view, not only the lack of essential goods and services, but also
a shortage of opportunities to choose a fuller, more satisfying, more valuable and valued
existence cause poverty of life. However, this raises the question of whose values form
Chapter 4: Comprehensive Framework
103 | P a g e
the benchmark—those of the existing community that may well relate to what the com-
munity can have based on sustainable use of the natural resources available, or of those,
such as UN thinkers based in the west, doing the assessment?
The cultural dimension of development can be viewed at global, national and regional
scales. One of the main aims for such development is promotion of cultural co-
operation. Such co-operation between peoples with widely different cultural back-
grounds and interests can only be achieved when they all share certain principles.
WCOCAD (1996:17) defines five ethical “pillars” as tools for achieving this goal, com-
prising: human rights and responsibility; democracy and the elements of civil society;
the protection of minorities; commitment to peaceful conflict resolution and negotia-
tion; and intergenerational equity. WCOCAD (1996) suggests a top-down approach for
cultural development based on these five pillars. This approach emphasizes that “it is
incumbent upon all governments to give effect to such principles. But the implementa-
tion of a global ethics requires other factors as well: transnational co-operation, interna-
tional organizations, and the global civil society” (WCOCAD, 1996:17).
4.1.2.4. FCS—a Framework for Cultural Statistics
As explained by The Institute for Statistics of the United Nations Education Scientific
and Cultural Organization (UIS) (2010:9), the Framework for Cultural Statistics (FCS)
is viewed as a tool for organizing cultural statistics both nationally and internationally.
This framework is based on a conceptual foundation and a common understanding of
culture that will enable the measurement of a wide range of cultural expression irrespec-
tive of the particular economic and social mode of its production. One of the main aims
for this framework is the production of internationally comparable data related to cul-
tural activities and products.
According to UIS (2010:9) because of the greater availability of economic data and ex-
istence of the many international classification systems, in comparison with the social
dimension of culture, the measurement of its economic dimension is more fully devel-
oped in FCS. This framework as a classification instrument attempts to incorporate the
use of available international classification systems such as the International Standard
Industrial Classification (ISIC) for cultural production activities, the Central Product
Classification (CPC) for cultural goods and services, the International Standard Classi-
fication of Occupations (ISCO) for cultural employment, the Harmonized Commodity
Chapter 4: Comprehensive Framework
104 | P a g e
Description and Coding System (HS) for international flows of cultural goods, and the
UN Trial International Classification of Activities for Time-use Statistics (ICATUS) for
cultural participation.
The outcome of FCS is a tool and methodology which can be used at the international
and national levels as a foundation for organizing the collection and dissemination of
cultural data based on using the available economic data. According to UIS (2010:9)
FCS makes efforts to reflect the widest range possible of activities related to the produc-
tion, distribution and use of culture.
One of the main issues related to using FCS as a framework with its related indicators to
evaluate products as being culturally appropriate is a shortage of data and information
that can cover the social dimension of culture, including cultural participation and in-
tangible cultural heritage. As Horn (1983:25) points out, the scope of culture obviously
goes beyond the economic aspects, despite the fact some cultural activities can be fitted
into an economic schema of provision of goods and services.
4.1.2.5. Culture Cycle
A framework for cultural statistics contains information and data raised from different
sectors of the culture cycle. Thus, exploration and clarification of the culture cycle can
portray the areas from which the framework, indicators and data come.
UNESCO (2001) has suggested that “culture should be regarded as the set of distinctive
spiritual, material, intellectual and emotional features of society or a social group, and
that it encompasses, in addition to art and literature, lifestyles, ways of living together,
value systems, traditions and beliefs” (UIS, 2010:18). Based on this, the culture cycle
has been explained by UIS (2010) as shown in Figure 4.2.
The culture cycle covers all of the different phases of the creation, production, and dis-
semination of culture (Figure 4.2). In this view, culture can be approached as resulting
from a cognate set of processes. These processes capture institutionalized and non-
institutionalized activities. In addition, these cultural activities may or may not be gov-
erned by the state. The culture cycle in the diagram is divided into five stages: creation,
production, dissemination, exhibition/ reception/transmission, and consumption/ partic-
ipation (Figure 4.2). According to UIS (2010:19) these stages are presented in a cyclical
Chapter 4: Comprehensive Framework
105 | P a g e
instead of hierarchical model to emphasis the idea that relationships between the latter
stages can be complex and occur more as a network than in a linear form.
The UIS (2010:20) further explains that the term culture cycle includes the inter-
connection across cultural activities, including the feedback processes by which activi-
ties (consumption) inspire the creation of new cultural products and artifacts. For some
cultural activities, the process can be started at any stage of the culture cycle. For in-
stance in terms of cultural heritage, the stages of creation and production have occurred
in the past and culture cycle processes related to heritage include the other three stages.
As introduced by the UIS (2010:20), what is important for the culture cycle is to under-
stand and be able to track the totality of activities and necessary resources that are re-
quired to transform ideas into cultural goods and products. These, in turn, have to reach
consumers, participants or users. This approach is more than just being concerned with
making judgments on how ‘cultural’ any specific aspects of the cycle are.
4.1.2.6. Cultural and Related Domains
According to the UIS (2010:22) the FCS uses a pragmatic definition of culture which is
based on the representation of culture by domains for which the aim is to calculate cul-
Consump-
tion/Participation
Production
Exhibition/ Reception/
Transmission
Dissemination
Creation
Figure 4.2: Culture cycle (UIS, 2010: 20)
Chapter 4: Comprehensive Framework
106 | P a g e
tural activities, goods and services that are produced by industrial or non-industrial pro-
cesses.
Cultural goods and services capture artistic, aesthetic, symbolic and spiritual values.
Throsby (2001) (cited in UIS 2010:22) points out that there are differences between the
characteristics of cultural goods and services and other products. Throsby (2001) argues
that these differences arise from the system of assigning values to the former, which in-
cludes a characteristic of being irreproducible, and which is linked to their appreciation
or the pleasure they give. Cultural goods play an important role in conveying ideas,
symbols and way of life and cultural services facilitate the production and distribution
of these goods. UIS 2010 sets out the FCS cultural domains as shown in Figure 4.3.
Figure 4.3 reveals a set of common culturally productive industries, activities and prac-
tices which are represented as domains in the FCS including:
A: Cultural and natural heritage.
B: Performance and celebration.
C: Visual arts and crafts.
D: Books and press.
E: Audio-visual and interactive media.
F: Design and creative services.
G: Transversal domains (UNESCO 2006 and 2009).
FCS considers these domains to be cultural. According to UIS (2010:23) these domains
represent the minimum set of core cultural domains for which UNESCO would encour-
age countries to collect comparative data. Moreover, four other transversal domains are
included: intangible cultural heritage, education and training, archiving and presenta-
tion, and equipment and supporting materials, because of their important influences on
the culture cycle in terms of production and transmission of culture. These transversal
domains can be applied to all of the cultural and related domains (Figure 4.3). As shown
in Figure 4.3, related domains are separated into the two categories of: ‘H’- tourism and
‘I’- sports and recreation.
Chapter 4: Comprehensive Framework
107 | P a g e
4.1.2.7. Tourism as a Related Domain
The UIS (2010:30) views tourism as a domain which is qualitatively different from the
other cultural domains, as it cannot be readily classified as a sector in the traditional
sense. For instance, it cannot be measured by either a particular market or industrial
Rel
ated
Dom
ains
Equ
ipm
ent a
nd S
uppo
rtin
g M
ater
ials
A. Cultural and Natural Heritage - Museums (also virtual) - Archeological and Historical places - Cultural Landscapes - Natural Heritage
B. Performance and Celebration - Performing Arts - Music - Festivals, Fairs and Feasts
C. Visual Arts and Crafts - Fine Arts - Photography - Crafts
D. Books and Press - Books - Newspapers and Magazines - Other printed matter - Library (also virtual) - Book Fairs
E. Audio-Visual and Interactive Media - Film and Video - TV and Radio (also Internet live streaming) -Internet podcasting Vid ( l li )
H. Tourism - Charter Travel and Tourist Services - Hospitality and Accommodation
I. Sports and Recreation - Sports - Physical fitness and well being -Amusement and Theme Parks - Gambling
Inta
ngib
le C
ultu
ral H
erita
ge
(Ora
l tra
ditio
ns a
nd e
xpre
ssio
ns, r
itual
s, la
ngua
ges,
soci
al p
ract
ices
)
Edu
catio
n an
d Tr
aini
ng
Arc
hivi
ng a
nd P
rese
rvin
g
Cul
tura
l Dom
ains
Figure 4.3: Framework for Cultural Statistics Domains (UIS, 2010:24).
G. T
rans
vers
al D
omai
ns
Chapter 4: Comprehensive Framework
108 | P a g e
output. Rather tourism should be considered as an activity which is intimately related
with all other cultural and transversal domains.
The UIS (2010:58) also identifies the most important productive activities and their re-
lated products (goods and services) which can be classified in the tourism domain (Ta-
ble 4.8). Overall these productive activities can be classified into three categories com-
prising: types of transportation, types of accommodation (short-term accommodation
and camping grounds as examples), and travel activities (travel agency, tour operators
and reservation activities) (Table 4.8). Moreover the suggested goods and services
which are viewed as tourism products are limited to these productive activities.
Table 4.8: Framework for cultural statistics domains—related domains (tourism). (UIS, 2010:58)
RELATED DOMAINS Domain Productive activities Goods and services
H. Tour-ism
ISIC1 4 Description CPC2 2 Description 4911
4922 5011 5110
Passenger rail transport, Inter urban Other passenger land transport Sea and costal passenger water transport Passenger air transport
64131 64132 64133 64134
Sightseeing services by rail Sightseeing services by land, except rail Sightseeing services by water Sightseeing services by air
5510
Short-term accommodation activi-ties
63111
63112
63113
63114
Room or unit accommodation services for visitors with daily housekeeping services Room or unit accommodation services for visitors without daily housekeeping ser-vices Room or unit accommodation services for visitors in time-share properties Room or unit accommodation services for visitors in rooms for multiple occupancy
5520 Camping grounds, recreational vehicle parks and trailer parks
63120 63130
Camp site services Recreational vacation camp services
7911
Travel agency activities
85511 85521 85523 85524
Reservation services for air transportation Reservation services for accommodation Reservation services for cruises Reservation services for package tours
7912 Tour operator activities 85540 Tour operator services
7990
Other reservation services and related activities
85512 85513 85514 85519
85539
85550 85561 85562
Reservation services for rail transportation Reservation services for bus transportation Reservation services for vehicle rental Other transportation arrangement and res-ervation services Reservation services for event tickets, entertainment and recreational services and other reservation services Tourist guide services Tourism promotion services Visitor information services
1. ISIC: International Standard Industrial Classification 2. CPC: Central Product Classification
Overall then these products can be divided into the two categories of: transportation and
accommodation, within which both categories have their related reservation services
Chapter 4: Comprehensive Framework
109 | P a g e
(Table 4.8). The mutual relationship between tourism and other cultural domains
through sustainable development of the former obligates consideration of tourism in a
wider area, because its domain covers all other cultural productive activities and their
produced goods and services. On the other hand, a cultural framework that is aimed to
be used as a foundation for cultural indicators in order to evaluate the CF of tourism
must contain all the tools used and activities conducted during the development process.
4.1.2.8. Tourism and Transversal Domains
The UIS (2010:28) considers “transversal domains” (used by UNESCO 2006 and 2009)
as domains that are viewed transversely because they can be applied across the other
cultural domains, although these domains can stand alone as independent domains (Fig-
ure 4.3). These transversal domains are discussed in detail below.
4.1.2.9. G- Intangible Cultural Heritage
UNESCO (2003) defines Intangible Cultural Heritage (ICH) as the “practices, represen-
tations, expressions, knowledge, skills - as well as the instruments, objects, artifacts and
cultural spaces associated therewith - that communities, groups and, in some cases, in-
dividuals recognize as part of their cultural heritage” (UNESCO, 2003:2). These are
wide ranging definitions and suggest that a heritage which is transmitted from genera-
tion to generation and created by communities and groups in response to their environ-
ment, their interaction with nature and their history, will have the ability to reflect its
identification. Furthermore a unique feature which is defined for ICH by UIS (2010) is
that it can be defined as such when a community recognizes this as a part of its heritage.
An intimate link between sustainable tourism and ICH can be manifested such that the
cultural framework and indicators related to tourism must contain an expanded range of
cultural activities and products that are accepted as heritage by given communities and
groups. This means that a top-down approach to the creation of cultural frameworks and
indicators at international or national level may ignore local cultural activities or prod-
ucts because, according to their features, these heritage activities can be different from
one place to another or different communities at the local scale may have differing cul-
tural heritages.
Chapter 4: Comprehensive Framework
110 | P a g e
4.1.2.10. Education and Training
The education and training domain as part of the ICH domain can play an important role
in the expansion of the tourism domain and its related activities and products. Accord-
ing to UIS (2010:31) FCS refers to the cultural dimension of tourism, embracing cultur-
al tourism, spiritual tourism and ecotourism activities. In this view, FCS defines cultural
tourism as a “customized excursion into other cultures and places to learn about their
people, lifestyle, heritage and arts in an informed way that genuinely represents their
values and historical context including the experiencing of difference” (UIS, 2010:31).
Accordingly this definition can also cover spiritual tourism or ecological tourism (eco-
tourism).
This definition shows that learning about culture is a core activity for cultural tourism
and all other cultural activities and related goods and services can be used in the process
of learning or education through the development of tourism. On the other hand educa-
tion can be conducted in different ways, such as learning about culture by having face to
face contact with local people, visiting museums, direct interaction with architectural
spaces, or by using photography as a tool to record cultural events. These characteristics
of education allow viewing it as a part of comprehensive framework which has the abil-
ity to define cultural indicators and to evaluate the CF of sustainable tourism and its
sub-segments such as ecotourism.
4.1.2.11. Cultural Capital and Production of Goods and Services
One of the important goals for the sustainable development of ecotourism is the produc-
tion of welfare, goods and services for host communities and visitors. Cochrane
(2006:321) presents a model to introduce the role of interaction between cultural capital
and other forms of capital, such as natural capital, human-made capital and cultivated
natural capital, to produce welfare, goods and services for users, as shown in Figure 4.4.
In this model human-made capital is produced by the use of natural capital through its
provision of raw materials and environmental services. Sinks for human produced waste
products are also a part of natural capital (Figure 4.4).
Chapter 4: Comprehensive Framework
111 | P a g e
Although the processes described above will deplete natural capital stocks, this deple-
tion can be reduced by replacing what is taken with renewable natural resources, for in-
stance by planting trees or composting organic wastes. Berkers and Folke (1994, cited
in Cochrane, 2006:321) argue that cultural capital is positioned at the interface of natu-
ral capital and human-made capital and plays an important role in mediating and con-
trolling natural capital and human made capital interactions. Berkers and Folke (cited in
Cochrane, 2006:321) also explain the fundamental and co-evolutionary relationship be-
tween the different types of capital. In this example, three forms of capital combine to
produce final products (welfare, goods and services). Indeed, these products are dictated
by the nature of the latter capitals. This again illustrates the complex nature of culture
(society), environment and economy. In fact the idea that they can be simply separated,
as in the weak sustainability model, may be impossible. This idea will be explored fur-
ther in this part of the thesis.
Impact on ecosystem from manage-ment and pollution
Human-made capital Making the means of pro-duction- tools, machines, buildings, infrastructure
Cultural capital Cultural beliefs and practices
Welfare Goods and Services
Natural capital Raw materials, sinks,
environmental services, amenity services
Cultivated natural capital
Energy
Figure 4.4: The interaction between forms of capital and the protection of welfare (Cochrane, 2006:321)
Chapter 4: Comprehensive Framework
112 | P a g e
4.1.2.12. Cultural Frameworks and Indicators for the Evaluation of Tourism
Products: examples
a. Choi and Sirakaya Model (2006)
A 2006 study by Choi and Sirakaya presented sustainability indicators for the measure-
ment of community tourism development (CTD) within a sustainable framework. In
order to develop such objective indicators their study employed a modified Delphi tech-
nique. The Delphi technique is “a method for structuring a group communication proc-
ess so that the process is effective in allowing a group of individuals, as a whole, to deal
with a complex problem” (Linstone & Turoff page, 1975: 3). According to Linstone and
Turoff (1975) and Wechsler and Wolfgang (1978) in the Delphi method, the experts
answer questionnaires in two or more rounds. The earlier answers of the experts are re-
vised in light of the feedback from other members of their panel. Through this process
the range of answers will decrease and the group will converge towards a single answer.
Finally, the process is stopped after a pre-defined stop criterion (e.g. number of rounds,)
and the final results are indicated as the mean or median scores of the final rounds.
According to Choi and Sirakaya (2006:1274), based on the Delphi technique, a panel of
38 academic researchers in tourism, after three rounds of discussion, reached consensus
on the set of 125 indicators which were divided into six categories: political (32), social
(28), ecological (25), economic (24), technological (3) and cultural dimensions (13) for
CTD.
Choi and Sirakaya (2006:1274) further reveal that if the changes wrought by tourism
upon all aspects of community life are to be effectively tracked, the latter indicators
must be based on policy relevance, analytical soundness, and measurability. They
(2006:1275) point out those indicators with these characteristics can be used in various
settings and particularly at the local level where it matters the most.
Choi and Sirakaya (2006) suggest that sustainable community tourism (SCT) is com-
prised of ecological, social, economic, institutional/political, cultural and technological
dimensions at the international, national, regional and local community levels, and with-
in agriculture, tourism, political science, economic and ecology. However much of the
literature on sustainable tourism has focused on the traditional dimensions (economic,
social, cultural and ecological dimensions), and the other dimensions (political and
technological) have been viewed as sub-segments of the main traditional dimensions.
Chapter 4: Comprehensive Framework
113 | P a g e
As a result, in comparison with Choi and Sirakaya’s (2006) framework with its greater
number of dimensions, the traditional view suggests simpler frameworks and indicator
sets that could be used to evaluate sustainability through tourism.
According to the latter view, Choi and Sirakaya (2005:1281) have suggested some indi-
cators for evaluation of the cultural dimension of sustainability through the development
of tourism (Table 4.9). As shown in Table 4.9, the cultural framework is divided into
the four domains of: building and architecture, cultural (site) management, socio-
cultural fabric, and cultural education. According to the basic definitions of culture
which have been presented in this section, all the cultural domains (Table 4.9) are in-
terwoven together and in some cases the indicators which are suggested for a particular
domain could be used as indicators in the other domains. For instance, types of building
material and décor could be used as an indicator to evaluate goods and services which
are produced in relation to cultural education or cultural (site) management.
Table 4.9: Indicators for the cultural dimension (Choi and Sirakaya, 2005:1282)
Key themes Indicators/Issues
Building/architecture Comparability of new construction with local vernacular Types of building material and décor
Cultural (site) manage-ment
Cultural sites maintenance level Availability of cultural site maintenance funds and resources Commodification Number of officially designated sites and their management
Socio-cultural fabric Retention of local customs and language
Shift in level of pride in local cultural heritage Percent satisfied with cultural integrity/sense of security Loss of authenticity and becoming impersonal
Cultural education Type and amount of training given to tourism employees (guides) Type of information given to visitors before and during site visits (e.g.
tourist in-flight video or public awareness material)
Level of sensitivity of interpretive material and activities pursued
One of the important policy actions to further simplify cultural frameworks and indica-
tors and the evaluation of the CF of ecotourism, is to distinguish the cultural domain(s)
that have the ability to cover other domains, indicators, cultural goods and services.
This can be conducted by using the Delphi methodology. This method can reduce the
number of frameworks and make linkages between indicators which are currently
viewed as being separate.
Chapter 4: Comprehensive Framework
114 | P a g e
b. Cultural Framework for New Zealand
In 2006 the New Zealand government put forward a cultural outcomes framework
which by 2009 had been justified and improved (Tables 4.10 and 4.11). According to
Statistics New Zealand (SNZ) (2006:1), the government has recognized that a sense of
nationhood and identity depends to a significant extent on actively supporting New Zea-
land’s arts, culture and heritage. Likewise, it has admitted that economic growth, social
cohesion, the acceptance and encouragement of diversity, and creative thinking in a
range of fields can be contributed to by confidence in that culture, an appreciation of its
unique aspects, and a strong sense of cultural identity.
The cultural sector is considered by government as a factor which is driven by an infi-
nitely renewable resource - human creativity - that, when given nourishment and contri-
bution, provides the potential for job creation through the generation and exploitation of
human intellectual property. Because of these characteristics, the cultural sector plays a
pivotal role in the New Zealand government’s goal of achieving sustainable develop-
ment.
The New Zealand government has proposed a number of themes to structure the devel-
opment of cultural indicators. These themes are divided into the five domains of: en-
gagement, identity, diversity, social cohesion, and economic development (Table 4.10).
A number of desired outcomes are set under each theme. The total 10 outcomes that
have been proposed are set out in Table 4.10. These outcomes attempt to create a signif-
icant environment for the engagement of New Zealanders in the cultural dimension of
the sustainable development process as participants, consumers, creators, and providers
or as decision-makers, all with equal access to cultural capital. In this cultural frame-
work, the cultural structure of New Zealand is viewed as an integration of the cultures
of Maori and Pakeha in which both cultures are respected and valued by New Zea-
landers. This outcome can also foster a tolerant and inclusive society. In addition, it is
anticipated that the cultural outcomes will enhance community-based development by
the involvement of New Zealanders in sustainable development through cultural activi-
ties.
Culture-based economic development is another proposed outcome in Table 4.10. Alt-
hough, as indicated in Table 4.10, the arts, culture and heritage make a growing contri-
bution to the economy, sustainable development of the economic system ultimately has
Chapter 4: Comprehensive Framework
115 | P a g e
a relationship with the other outcomes. For example, participation of local people in
economic activities and equal distribution of capital are both recognised pillars of sus-
tainable economic development. The related indicators are described in Table 4.11.
Table 4.10: Cultural outcomes framework and related indicators for sustainable cultural development in
New Zealand. (Statistics New Zealand (SNZ), 2006:2). Themes Outcomes Related Indicators
Engagement
Engagement: New Zealanders engage in arts, culture and heritage events and activities as participants, consumers, creators or providers
Proposed indicators 1a,1b,1d,1f
Environment: There is an environment that supports crea-tivity and innovation for all cultures.
1b, 1c
Access: All New Zealanders have access to arts, culture and heritage events and activities.
1d, 1e
Value: Art, culture and heritage activities are valued by New Zealanders.
1a, 1b, 1d, 1f
Identity New Zealanders have a strong sense of identity, based on their distinct heritage and cultures.
2a, 2b, 2c
Strength: The cultures of Maori and Pakeha are strong and living, with both cultures being valued by New Zealanders.
2a, 2b, 2c
Diversity Diversity: New Zealand’s growing cultural diversity is freely expressed, respected and valued.
3a, 3b
Social cohesion Enhancement: Community relationships are enhanced by involvement in arts, culture and heritage events and activi-ties.
No current proposed indicators
Cohesion: New Zealanders’ shared cultural identity fosters a tolerant, inclusive society.
No current proposed indicators
Economic Devel-opment
Development: Arts, culture and heritage make a growing contribution to the economy.
5a, 5b, 5c
b. 1. Cultural Indicators for New Zealand
The proposed cultural indicators for New Zealand (2009) form a justified model for cul-
tural indicators, which have been developed by Statistics New Zealand (SNZ) from
those of 2006. As shown in Table 4.11, indicator 1d which is described in SNZ (2006:
18) as “How often people experience cultural activities, on average”, has been changed
in SNZ 2009 to “cultural experiences” (Table 4.11). Furthermore, the five indicators 1g,
1h, 2d, 2e and 3c have been added to the first set of cultural indicators in 2009 (Table
4.11).
Table 4.11 shows that a total of 19 cultural indicators are proposed for New Zealand in
2009. According to their definitions (Table 4.11) eight of them (1a, 1b, 1c, 1f, 3a, 5a, 5b
and 5c) are cultural-economic indicators and 11 of them can be viewed as indicators
which particularly focus on cultural experiences, events and heritage. Although eco-
nomic indicators cover 42% (8 out of 19) of total cultural indicators for New Zealand,
Chapter 4: Comprehensive Framework
116 | P a g e
as Table 4.10 shows, 52% (12 out of 23) of the indicators which are set out in the out-
comes are economic based indicators.
Table 4.11: Cultural indicators for New Zealand (SNZ, 2009:6-76)
T1 Ind2 Title Definition
Enga
gem
ent
1a
Cultural employment The number of people in cultural employment as a percent-age of total employment.
1b
Employment in creative occupations
The number of people employed in creative occupations as a percentage of total employment.
1c
Median incomes from creative occupations
The median income received by people in creative occupa-tions1 as a percentage of the median income of all employed people.
1d Cultural experiences This indicator is expressed as the average (per adult) fre-quency of experiencing cultural activities.
1e
Barriers to cultural expe-riences
This indicator is expressed as the proportion of adults en-countering barriers which prevent them from experiencing particular cultural activities.
1f Household spending on cultural items
This indicator shows the value of household spending on cultural goods and services as a proportion of all household expenditure.
1g Heritage protection The proportion of those sites either registered with the New Zealand Historical Places Trust, or listed as places with his-torical value in territorial authority District Plans that have been destroyed, relocated or partly removed during the peri-od.
1h Access to arts, culture and heritage activities and events
The proportion of shows, performances and exhibitions at a sample of venues outside the five main centers.
C
ultu
ral I
dent
ity
2a Speakers of te reo Maori This indicator is expressed as the proportion of Maori able to hold an everyday conversation in Maori.
2b
Local content on televi-sion
This indicator is expressed as the first run hours of local content, as a proportion of the total television schedule. Lo-cal content is generally defined as material that is both pre-dominantly made in New Zealand and reflects New Zealand identity and culture.
2c Maori TV ratings
This indicator is expressed as the viewer ratings for Maori TV by Maori, non-Maori and all viewers of this channel.
2d The importance of cul-ture to national identity
The proportion of New Zealanders who believe that culture and cultural activities are important to New Zealand’s sense of national identity.
2e New Zealand events Proportion of New Zealand shows, performances and exhi-bitions at a national sample of venues.
Div
ersit
y
3a Grants to minority ethnic cultural groups
This indicator is an index of the percentage of grants made by the New Zealand Lottery Grants Board (LGB) for arts, culture and heritage purposes to non-Maori and non-New Zealand European ethnic organizations and individuals, rela-tive to those ethnic groups’ percentage in the population of New Zealand.
3b
Attendance /participation at/in ethnic cultural ac-tivities
This indicator is expressed as the percentage of the popula-tion aged 15 years and over attending/participating in at least one cultural activity in the year before survey.
3c Minority culture activi-ties
The proportion of arts, culture and heritage events and activ-ities produced by minority cultures, taking place at a nation-al sample of venues.
Soci
al
Coh
e- - No indicator - Non-Maori attendance at
Maori cultural events. Proportion of non-Maori attending a sample of Maori cul-tural events
Chapter 4: Comprehensive Framework
117 | P a g e
- Other ethnicities attend-ance
Involvement in community arts, cultural and heritage groups which are not Maori or New Zealand European /Pakeha.
- Community cultural ex-periences
The percentage of people taking part in religious activities, ethnic cultural activities, and other secular activities (NZFCS sub categories 811, 821 and 822), and the frequen-cy of participation.
Econ
omic
dev
elop
men
t
5a Income of the cultural industries
This indicator is expressed as the value of the sales of goods and services and other income of the cultural industries in constant prices.
5b Value added contributed by the creative industries
This indicator is expressed as the value added by the crea-tive industries in year 2005 dollars expressed as an index (2005 equals 100 on the index).
5c The creative industries’ proportion of total indus-try value-added
This indicator is expressed as the proportion of total industry value added produced by the creative industries. It can be read in conjunction with the previous indicator (5b), which measured changes in value added in the creative industries. Total industry value added is gross domestic product less unallocated indirect taxes (i.e. less GST, import duties and stamp duty).
1. T: Theme 2. Ind: Indicator
c. Integrated Cultural Frameworks and Indicators for New Zealand
Figure 4.5 proposes a model for the integration of the FCS and the cultural framework
and indicators for New Zealand. This model shows that there are mutual relationships
between the themes proposed by SNZ (2009) and the cultural domains suggested by
UNESCO, 2009 (cited in UIS, 2010) (Figure 4.5).
The model shows that all cultural domains and related domains can be set under each of
the themes (Figure 4.5). On the other hand, the cultural domains, their productive activi-
ties and their related cultural goods and services can be viewed as factors in which each
theme must be involved in order to achieve its complete anticipated outcomes. For ex-
ample, in terms of the engagement of New Zealanders in cultural activities, this can be
placed into the 8 categories of: engagement in cultural heritage; performance and cele-
bration; visual arts and crafts; books and press; audio-visual and interactive media; de-
sign and creative services; tourism; and sports and recreation (Figure 4.5).
Chapter 4: Comprehensive Framework
118 | P a g e
Tourism can also be considered as a related domain in which most of the proposed
themes are involved (Figure 4.6). On the other hand, the anticipated cultural outcomes
for sustainable development of tourism can be categorized as subsets of the themes that
are introduced in Figure 4.6.
The cultural outcomes of tourism and the goods and services produced for it can be con-
sidered as pivotal and supporting tools which are set under the transverse cultural do-
mains and in particular the education and training domain (Figure 4.6). These outcomes
in terms of goods and services can be used as educational tools to make a host society
into a place for cultural education.
Cultural Domains
A. Cultural and Natu-ral Herit-age
B. Perfor-mance and cele-bration
C. Visual Arts and Crafts
D. Books and Press
E. Audio-Visual and Interactive Media
F. Design and Crea-tive ser-vices
Related Domains
I. Sports and Recreation
H. Tourism
Themes
Engagement Cultural Identity Diversity Social Cohesion Economic Devel-opment
Related Indicators
1a, 1b, 1c, 1d, 1f, 1e 2a, 2b, 2c 3a, 3b No current proposed indicators
5a, 5b, 5c
Intangible Cultural Heritage (Oral traditions and expressions, rituals, languages, social practices)
Education and Training
Archiving and Preserving
Equipment and Supporting Materials
Figure 4.5: Integration of FCS cultural domains and indicators
G
Chapter 4: Comprehensive Framework
119 | P a g e
Schianetz et al (2007:1485) reveal that sustainability must be conceived of as a transi-
tion and learning process, and as a “moving” rather than a static goal. They (2007:1485)
state that these findings are particularly important with respect to the tourism industry,
which is an inherently non-linear, complex and dynamic system that has to be managed
adaptively.
Schianetz et al (2007:1485) explain that adaptive management approaches are based on
continuous and collective learning concepts that acknowledge uncertainties, and allow
for timely adjustment of planning and management strategies. This implies that in order
to advance sustainability in the tourism industry, approaches are needed that promote
learning at an organizational as well as a place related destination or regional level. In
this view sustainable tourism with its social-cultural essence can be considered as a po-
tential form of education (learning).
Themes
Engagement Cultural Identity Diversity Social Cohesion Economic Devel-opment
Related Indicators
Tourism
1a, 1b, 1c, 1d, 1f, 1e
2a, 2b, 2c 3a, 3b No current populat-ed indicators
5a, 5b, 5c
Intangible Cultural Heritage (Oral traditions and expressions, rituals, languages, social practices)
Education and Training
Archiving and Preserving
Equipment and Supporting Materials
Figure 4.6: Tourism, FCS cultural frameworks, and SNZ themes and indicators
Chapter 4: Comprehensive Framework
120 | P a g e
Minnaert et al (2009:320) reveal another approach in which the focus is on ideas, in
terms of experiential learning that is linked to experience in a non-institutionalized set-
ting, such as going on holiday. According to Minnaert et al (2009:321) learning which
is rooted in experience was introduced at the end of the 1970s and during the 1980s, and
it represented an alternative to the more traditional, cognitive learning theories. It can be
explained as education that “begins with the experience followed by reflection, analysis
and evaluation of the experience” (Boydell, 1976, cited in Minnaert et al, 2009:321).
From this perspective, tourism activities can offer participants the chance to envisage
new situations, meet different social interaction situations, and compare these to their
behavior patterns. For instance, a holiday can create an opportunity for visitors to ex-
plore a new environment, engage in new activities, and meet exotic societies and cul-
tures. It can provide the encounters participants need to start their cultural education,
even if this education is not anticipated.
Cultural education and learning through participation in tourism can be explained as a
comprehensive social activity which “reintroduces people to their cultural roots and re-
invigorates people’s interest in [their] history and culture” (McKercher et al, 2005:539),
and which is largely rooted in participating in community-based practices carried out by
the host communities and related organizations. In this view, the forecasted indicators
for each theme can be used as indicators to evaluate the cultural footprint of tourism on
both the host communities and visitors through development of this educational process.
4.1.2.13. Cultural Framework for Sustainable Development of Ecotourism
a. Cultural Outcomes
Based on the educational approach described above, the cultural outcomes for sustaina-
ble development of tourism can be put into the eight categories shown in Table 4.12.
Chapter 4: Comprehensive Framework
121 | P a g e
Table 4.12: Cultural outcomes for sustainable development of tourism (based on cultural education). Development of Tourism based on Cultural Education
Cultural Outcomes Awareness of local participants about their existing cultural heritage and the methods to protect this through the educational process. Participation of local people in the cultural development process (pro-gramming, management and monitoring for the production, consump-tion and presentation of cultural products) Democratized environment for participation of people in cultural de-velopment with equal access to the cultural sources. Culture-based development of economic systems that guarantees equal distribution of cultural capital and income among the local people. Combination of ordinary tourism activities with compatible cultural activities Protection and restoration of tangible cultural heritage Protection and restoration of intangible cultural heritage (oral traditions and expressions, rituals, languages, social practices) Tourist experience of authentic culture (as the better alternative) or staged authentic cultural heritage of the host destinations.
a. 1. Awareness
One of the main stages in the cultural development process is the awareness of local
people and communities about what they have in terms of their cultural capital and her-
itage. Reid et al (2004:626) introduce ‘Community Awareness Raising and Value Iden-
tification’ as one of the important components of the model for community tourism (and
ecotourism) development planning offered by him (Figure 4.7.). This model provides a
macro framework for community tourism development planning focused at the local
level.
Figure 4.7: Community tourism planning model (Reid et al, 2004:625)
Progress Catalyst
Development Group
Organisation Structure Product Development
and Marketing
Monitoring Phase
Organisation and Planning Phase
Gearing up Phase
Community Assessment
Implementation Monitoring &
Evaluation
Community Aware-ness & Value Identi-
fication
Chapter 4: Comprehensive Framework
122 | P a g e
As shown in Figure 4.7, the model’s third step concentrates on raising community
awareness about tourism. This awareness can be introduced in terms of the tourism de-
velopment process, local cultural, environmental and economic potentials and values,
market, products, and impacts of tourism on the host destination.
As a first stage in the engagement of local and indigenous people in the development
process, they should know about their cultural values that may have been ignored or
hidden behind new lifestyles. This outcome can be achieved by education of the host
people through an educational process that needs particular programming, management
and a supportive environment and necessary equipment. The number of people who par-
ticipate in the educational process and the time that they spend in learning, as well as
the places and tools which are allocated for education, can be considered as indicators
for the cultural footprint of tourism. Without this initial education, ecotourism as cultur-
al tourism that engages with the local community will not be possible. In addition, how
well this engagement occurs and how much it benefits the local people is also depend-
ent upon the type and level of education.
a. 2. The Participation of People in the Development Process
Local and indigenous participants who belong to the host culture and have significant
knowledge about their cultural capital can play an important role in terms of program-
ming, management and monitoring for the production, consumption and presentation of
cultural products (Table 4.12). However, the necessity for the existence of related com-
munities and NGOs to organize this process is unavoidable. Furthermore, another role
for these NGOs and communities is to harmonize the local development policies with
national strategies for development. As a result, sustainable development of ecotourism,
based on cultural education, can be considered a community based activity within the
wider national goals.
a. 3. A Culturally Sensitive Economic System
The culture based development of economic systems is another anticipated outcome for
sustainable development linked to ecotourism. From this viewpoint, as some conver-
gence theorists have argued “culture changes with each stage of economic develop-
ment” (Frederking, 2002:107). As host communities and groups progress through the
various stages of development, a convergence of the cultural values will be created.
This view emphasizes the influences of economic development (as a dominant theme)
Chapter 4: Comprehensive Framework
123 | P a g e
on cultural systems. In contrast others have argued that “culturalists maintain that the
groups preserve their unique traits” (Frederking, 2002:107). According to this view,
“different cultures create and perpetuate models of development which may be similarly
economically successful and simultaneously rich in the norms and values which under-
lie those activities” (Frederking, 2002:107). This has a relationship with the earlier dis-
cussion of Kerman in Iran. Although the city has developed in a modern way, the histor-
ic area at the centre of the city, normally the most expensive land in any city, is so
linked to the cultural and religious values of the residents that it has been retained, vir-
tually unchanged. This is a group preserving its unique traits.
Frederking (2002) presents a comparative study to explain different empirical examples
in terms of the existence of an endogenous relationship between culture and economic
development. The Punjabi community in Southall, London (which is commonly re-
ferred to as “Little India” in London) is introduced as his first case study. Frederking
(2002) portrays “Little India” as a community which has created an ethnic enclave and,
by separating the community geographically, one whose culture appears to be a con-
sistent and integral part of their economic activities. According to Frederking
(2002:108) in Southall, the main characteristic of “Little India” is the production and
consumption of Indian cultural products such as the Indian language, food, and books.
In addition, most of the businesses and services and productive activities are managed
or owned by Punjabis. As a result of the social-cultural and economic dominations of
Punjabis in Southall, according to Frederking (2002:108), a very profound image of
Southall emerges, which from even a brief encounter with the area is the image of a
self-contained, self-sufficient community.
The Gujarati community in Wembley, London is the second area which Frederking
(2002) uses to discuss cultural and economic mechanisms. Frederking (2009:109) ar-
gues that in Wembley, at the same time that Indians appear to be the majority group in
the neighborhood, in contrast with Southall, the community is far from being an exclu-
sively Indian area. He points to the multi-ethnic face of Wembley, with much more di-
versity in terms of individuals and business activities. Evidence comes from the local
offering of western variations of Indian products, thus creating a difference between
Wembley and Southall.
Chapter 4: Comprehensive Framework
124 | P a g e
The Punjabi and Gujarati communities present two different aspects in terms of the rela-
tionship between economic mechanisms and culture in an area. The Punjabi community
attempts to conserve its cultural heritage by isolation of the community from foreign
cultures, including that of the host country, whereas the Gujaratis have created a multi-
ethnic economic system which leads to close relationships and interactions between var-
ious cultures. Although the Gujarati community mechanism may have negative impacts
on the authenticity of the cultural products, it creates an environment for engagement of
different social fields in the development process. However the main cultural structures
and behaviors are changed in Wembley through being influenced by consuming western
products, so that an equal opportunity for presentation of cultural products is available
for the different ethnic groups.
A culture based economic system for the sustainable development of tourism could be
created by the combination of the positive dimensions of the two latter economic sys-
tems. According to the Punjabi pattern, a tourism economic system must be managed
and developed by local or indigenous participants and communities. In addition, pro-
duction and consumption of the host cultural products must have a priority over import-
ed foreign products. However, according to the Gujarati pattern, if the host area is part
of a multicultural community, all participants with different cultures should have an
equal opportunity to present their cultural products and conserve their heritage. There-
fore, a culture based economic system related to both mono-cultural and multi-cultural
communities must contribute to an equal distribution of cultural income streams be-
tween the local participants.
These discussions suggest that employment of local people in culture based economic
activities, gross domestic cultural products, and moves to restore and protect cultural
heritage can be used as indicators to evaluate the economic outcomes of ecotourism that
is culturally appropriate.
a. 4. Combination of Ordinary Tourism Activities with Compatible Cultural Activ-
ities
Localized foreign tourism activities as a result of tourists originally coming from other
areas with different cultural and behavioral patterns can be considered as one of the
main outcomes for tourism development. This outcome can be achieved by the combi-
nation of some ordinary tourism activities (such as hunting, fishing, boating and horse
Chapter 4: Comprehensive Framework
125 | P a g e
riding) with compatible host cultural activities. For example, in New Zealand hunting,
as an example of an ordinary tourism sporting activity, can be combined with learning
about the methods and equipment which have been used by Maori people for hunting,
as these are part of their historical and cultural activity and products. In this case, an or-
dinary tourism recreational activity substantially shifts to being a cultural-educational
activity managed and presented by Maori participants. The number of visitors who par-
ticipate in these culturally justified activities can be used as a cultural indicator for the
development of tourism (and ecotourism) as being culturally appropriate.
a. 5. Protection and Restoration of Tangible Cultural Heritage
Tangible cultural heritage, which covers the wide domain of physical cultural resources,
includes “movable or immovable objects, sites, structures, group of structures, and natu-
ral features and landscapes that have archeological, paleontological, historical, architec-
tural, religious, aesthetic, or other cultural significance” (World Bank, 2010:173). The
World Bank (2006, cited in the World Bank 2010:173) recognizes that physical cultural
resources are important as sources of valuable scientific and historical information, as
assets for economic and social development, and as integral parts of a people’s cultural
identity and practices.
These physical cultural resources are subjects that could be restored and protected
through the development of sustainable ecotourism. These heritages can be viewed as
having the potential to attract visitors to the host areas and also as part of the participa-
tion of visitors and indigenous peoples in the cultural-educational process. The level of
restored physical cultural resources can be used as a measurable indicator for ecotour-
ism development. However the quality of restoration and protection must be also quali-
fied according to the relevant standards and restoration must be conducted and approved
by appropriate processes.
a. 6. Protection and Restoration of Intangible Cultural Heritage
According to UNESCO (2003:2), and as quoted above, the intangible cultural heritage
is a combination of cultural knowledge and skills and the artifacts these produce that a
community of individuals would regard as part of their cultural heritage. This intangible
cultural heritage is transmitted from generation to generation and is constantly recreated
by communities and groups in response to their environment, their interaction with na-
ture and their history. UNESCO (2003:2) sorts intangible cultural heritage into five cat-
Chapter 4: Comprehensive Framework
126 | P a g e
egories: oral traditions and expressions, including language as a vehicle of intangible
cultural heritage; performing arts; social practices, rituals and festive events; knowledge
and practices concerning nature and the universe; and traditional craftsmanship.
Preservation and restoration of the intangible cultural heritage, as one of the cultural
outcomes for the sustainable development of tourism, can be achieved through the de-
velopment of community based cultural activities and events such as traditional celebra-
tions, festivals and concerts. Likewise, cultural goods and services such as local foods,
some types of accommodation services, art, crafts, and vernacular sports can be consid-
ered as tools which have the ability to make explicit intangible cultural values for visi-
tors. For example, some types of accommodation services that create an opportunity for
visitors to stay with the local or indigenous people, contribute to them learning about
the intangible cultural heritage of their hosts through the consumption of traditional
products such as local foods, language, and through using vernacular equipment and
spaces.
The proposed indicators for protection and restoration of intangible cultural heritage
cover the cultural products, goods and services that contribute both to the way host
communities can present their intangible cultural heritage, and to visitors who “come to
feel rather than to gaze” (Poria et al, 2003:238) so they can become familiar with the
deeper features of the host culture.
a. 7. Authentic Culture or Staged Authenticity at the Host Destinations
Development of ecotourism based on cultural education focuses on the concept of au-
thenticity as one of its outcomes. Cohen (1988:373) argues that authenticity is an emi-
nently modern value whose emergence is closely related to the impact of modernity up-
on the unity of social existences. In pre-modern society, identity has been defined pri-
marily by social place and the individual has been identified and constituted in and
through the certainty of his or her social role.
Cohen (1988:373) further argues that as institutions become “weightless” and lose their
reality, the individual within them is said to turn into himself. Since modern society is
inauthentic, the modern man who desires to overcome the contrast between the authen-
ticity seeking self and society has to seek elsewhere for an authentic life.
Chapter 4: Comprehensive Framework
127 | P a g e
The opposition between self and society which has now reached its maximum could be
reduced by the sustainable development of ecotourism. As a solution, the quest for au-
thenticity must be considered as one of the prominent motifs of sustainable ecotourism.
Ecotourism can give an opportunity to visitors who desire to obtain experiences and
products that are authentic, by the production and presentation of original and local
products that are not contaminated by being fake or impure. These authentic cultural
products can be used as indicators to evaluate the footprint of ecotourism related to the
authenticity of the host community’s life and their products.
b. Cultural Indicators for Development of Tourism based on Cultural Education
This section discusses the main characteristics of cultural indicators and proposes in-
dictors that can be used to evaluate ecotourism and its related products and activities as
being culturally sustainable.
b. 1. The Main Characteristics of Cultural Indicators
Madden (2005:221) introduces a cultural indicator as a statistic that can be used to make
sense of, monitor, or evaluate some aspect of a culture, such as its architecture, or cul-
tural policies, programmes, and activities. The USAID defines an indicator as “a varia-
ble [whose] purpose it is to measure changes in a phenomenon or progress” (MDF
Training and Consultancy (MDF), 2005:1).
Cultural indicators can be categorised into the two types of quantitative and qualitative
indicators. “Quantitative indicators measure change through numerical or statistical
facts or physical outputs” (Chapman, 2000:2) and “qualitative indicators are language-
based descriptions of cultural phenomena” (Madden: 2005:220). MDF (2005:1) reveals
that an indicator is a quantitative or qualitative factor or variable that provides a simple
and reliable means to measure achievement, to reflect changes connected to an interven-
tion, or to help assess the performance of a development actor.
A cultural indicator as defined by SPC (2010:2) is a measure that points out something
about the state or situation of a culture in a country. SPC (2010:2) explains that these
indicators can be narrowed down within the regional and local scale to measure more
specific areas of culture such as oral culture (as intangible culture constructed / ex-
pressed in local language), traditional practice (skills/ values), arts, crafts, vernacular
architecture and cultural sites.
Chapter 4: Comprehensive Framework
128 | P a g e
The Ministry of Culture, Madrid, Spain (MCMS) (1985:68) has defined a cultural indi-
cator as a direct and valid statistical measurement that makes it possible to observe the
level of a fundamental cultural concern and its variations over a period of time. Arising
from this definition, this thesis proposes two fundamental properties for a cultural indi-
cator:
- First, “it must be a direct measurement, that is, it must refer to the very essence of
the cultural concern and not to the instruments or agencies used to satisfy that con-
cern” (MCMS, 1985:68).
- Second, “it must be valid in the sense that changes in the indicator must correspond
to changes in the cultural element being measured, it being assumed that there is no
variation in these remaining elements” (MCMS, 1985:68).
In addition to these two fundamental properties, MCMS (1985:68) suggests further re-
quirements for a cultural indicator including:
- Capacity for aggregation and disaggregation
- Comparability in space or time
- Intelligibility
- Comprehensiveness
- Capacity for co-ordination
- Reliability
- Timeliness
- Viability
One of the main purposes of using cultural indicators is to calculate the level of particu-
lar cultural concerns of individuals. Consequently, it is necessary that the cultural indi-
cators should allow aggregation or disaggregation at different levels (for instance na-
tional, regional or community scale) for the purpose of analysis.
A cultural indicator should have the ability to be used for the same group or society at
different points in time to measure and judge whether anticipated cultural outcomes in a
particular framework have been promoted or have worsened. Furthermore, the cultural
indicator should allow comparison between different groups, communities or societies
that belong to different places (geographical regions or countries).
Chapter 4: Comprehensive Framework
129 | P a g e
Simplicity is also a characteristic of a cultural indicator that allows its interpretation in a
particular time or space. However, it does not mean that the basic theory behind it and
the technique of its elaboration must be simple.
MCMS (1985:68) also suggest that as cultural indicators should be kept to a minimum,
they should be devised adequately, so that the greatest quantity of information possible
about the cultural concern to be measured can be interpreted. MCMS (1985:69) points
out that cultural indicators should form a co-ordinated, consistent and interrelated whole
and consequently be drawn up with a soundly constructed framework so that different
data series may be associated and interrelated.
Cultural statistics are the basis for the elaboration of the cultural indicators arising from
a cultural framework. As Pattanaik (1997:11) states, the evaluative framework based on
functioning rather than commodities, can be used to abstract information, at least con-
ceptually, from a large number of details to focus on a related small number of ends
(their functioning). He (1997:11) argues that in practice, if the exercise is to remain trac-
table, attention must be restricted to the small number of functionings that are consid-
ered to be crucial and that can be captured through suitable indicators.
According to MCMS (1985:70) and Pfenniger (2004, cited in Madden, 2005:228), cul-
tural indicators and the required data for their assessment should be available at the right
moment to guide, evaluate and monitor cultural policy effectively. These cultural indi-
cators should also be operational and must be stated in a realistic way instead of being
ideal but unrealisable.
The International Federation of Arts Councils and Culture Agencies (IFACCA)
(2005:10) has summarised and ranked the main attributes of a good [cultural] indicator
based on the number of times they appear in the literature consulted (Table 4.13).
Chapter 4: Comprehensive Framework
130 | P a g e
Table 4.13: Attributes of a good [cultural] indicator. (IFACCA, 2005:10).
Attribute No. of citations Grounded in theory 9 Relevant (serve a practical or valued purpose) 6 Grounded in and/or linked to policy practice 5 Comparable across regions 5 Comparable across time periods 5 Measurable (able to be measured, and data available). 4 Easily understood 4 Unambiguous/clear 4 Able to be disaggregated by population subgroups 4 Consistent with purpose 4 Timely (up-to-date) 3 Measurable over time 3 Universal 2 Able to be benchmarked 2 Contextualised (presented with additional contextual information) 2 Revisable 2 Methodologically defensible 2 Reliable 1 Sensitive to cultural diversity 1 Realistic 1 Capture the essence of an issue 1 Designed through consultation 1 Trusted 1 • Sources: Belgian Government (2001), Brown and Corbett (1997), Chapman (2000), Cobb and
IFACCA (2005:10) points out that the attributes are not necessarily mutually exclusive,
and some rudimentary interpretation and grouping can be undertaken. Consequently,
although according to the IFACCA (2005:10) the list cannot be taken as a scientific
survey of opinion, this study uses this list as both providing a quick summary of rec-
ommendations made by indicator developers, and as highlighting the priorities per-
ceived by these developers.
b. 2. Classification of Cultural Indicators
Madden (2005:224) proposes two main types of uses for cultural indicators: monitoring
(observing cultural phenomena) and evaluation (measuring the efficacy of cultural poli-
cies and programmes). Brown and Corbett (1997, cited in Madden, 2005:224) catego-
rise cultural indicators into a five-part typology of basic uses of [cultural] social indica-
tors in policy:
- Description, for the sake of knowledge about society [and culture].
Chapter 4: Comprehensive Framework
131 | P a g e
- Monitoring, to track outcomes that may require policy intervention.
- Setting goals, to establish quantifiable thresholds to be met within specific time-
frames.
- Outcomes-based accountability, to hold managers, agencies, government and com-
munities responsible for improving social well being and for meeting established
goals.
- Evaluation, to determine which programmes and policies are effective (or destruc-
tive) and why.
As Madden (2005:227) points out, cultural indicators can be classified hierarchically
based on the scale of detail at which they are applied. He (2005:227) classifies cultural
indicators into the three categories of macro, meso and micro indicators. Madden
(2007:227) describes macro indicators as indicators used for monitoring and evaluation,
e.g. cultural indicators of development, and indicators of cultural rights. He (2005:227)
considers meso indicators for use for regional or cross-agency policy monitoring and
evaluation, e.g. indicators that measure outcomes of an arts council policy. Micro indi-
cators are suggested for “agency programme monitoring and evaluation, e.g. indicators
that measure outcomes of an arts event” (Madden, 2005:227).
b. 3. Ecotourism Related Cultural Indicators
Anticipated cultural outcomes as a framework for the development of ecotourism based
on cultural education need to be evaluated by efficient cultural indicators with particular
characteristics such as “measurability, data availability, data quality “(Duxbury, 2003:8)
and “International comparability” (Breis, 1992:11). As Breis (1992:6) points out, the
sequence for the creation of cultural indicators should be based on some type of con-
structed theory as a first attempt, and the subsequent search for the required data wheth-
er quantitative or non-quantitative.
According to Duxbury (2003:9), throughout the entire process of producing cultural in-
dicators, all actions and decisions must be permeated by the question of intent and
meaningfulness. Likewise, the main purpose and necessity for indicators must be clari-
fied and the relevant subjects which need to be assessed must be explained through the
constructed theory behind the process. Although cultural indicators must be comprehen-
sive in order to consider all the different dimensions of cultural outcomes, these can be
limited by some factors such as limitation of resources to do assessment and gaps be-
Chapter 4: Comprehensive Framework
132 | P a g e
tween indicator statements/topics and data available to address or measure the cultural
footprint of a phenomenon, such as ecotourism development.
As Pearce (cited in Travis, 1982:259) points out, “the social [cultural] impact of tourism
will vary according to the differences between the visitors and the visited, whether in
terms of numbers, race, culture, or social outlook.” Particularly in multi-cultural desti-
nations, as Travis (1982:259) reveals, there may be several host cultures as well as sev-
eral tourist cultures represented in one place, at one point in time, so it is not possible to
see cultural impacts simply in the monolithic terms of host culture and visitor culture.
As a result, in this case integration of the anticipated cultural indicators must be able to
cover all valuable cultural productive activities and related goods and services. The lat-
ter are defined as items that are worthy of being presented at national or global level.
Furthermore, influenced by the existence of different cultures or communities (with var-
ious social structures in one destination), the suggested cultural framework and related
indicators can be considered as parts of a policy to make a linkage between these vari-
ous cultural systems and communities. However, to achieve this goal, some incompati-
ble existing cultural heritage or social behavior might need to be adjusted, modified or
completely ignored, particularly when these social-cultural behaviors are against human
rights or cause conflict between communities.
b. 4. Cultural Indicators and Tourism Resources
Tourism resources are placed by Jafari and Ritchie (1981:17) into the three categories of
natural, man-made and socio-cultural resources. To explain the man-made resources
they (1981:17) argue that the term “sight-seeing” commonly refers to the observation of
some man-made creation or building such as museums, churches, tall buildings, or other
architectural masterpieces. In this view, the resources just refer to attractive buildings
and associated landscapes as man-made tourism resources and other man-made re-
sources such as food, textiles and handcrafts, which can be introduced as tangible cul-
tural heritage, are neglected in this definition.
In terms of the socio-cultural resources of tourism, Jafari and Ritchie (1981:17) state
that this category of resources represents the cultural heritage and social fabric of the
peoples of the world, and includes both tangible (e.g. the man-made resources listed
above) and intangible manifestations (e.g. cultural events and festivals). They (1981:17)
introduce socio-cultural resources as the primary reasons for traveling. As a result of the
Chapter 4: Comprehensive Framework
133 | P a g e
discussion above, tourism resources can be placed into the two categories of natural and
social-cultural resources. In this view, social-cultural resources cover all man-made or
tangible resources as well as intangible cultural activities and products.
This categorization of tourism resources can exert an influence on decision making re-
lated to the cultural framework and indicators for ecotourism development. Otherwise,
the themes which are viewed as the cultural outcomes of ecotourism, being influenced
by categorization of tourism resources as shown above, can be further sorted into the
two areas of protection and development of intangible cultural heritage, and production,
and consumption and conservation of tangible cultural capital. Following this, related
cultural indicators can be classified into these two common groups. The first group can
be used to qualify protection, development and presentation of the intangible cultural
heritage (such as traditional festivals, concerts, and other celebrations) through partici-
pation of local and indigenous people in the development process. The second group of
cultural indicators is viewed as the tools to assess qualitatively the production, con-
sumption and protection of tangible cultural capital and products (such as vernacular
architecture, handcrafts, food and textiles).
Ecotourism development based on cultural education aims to engage local and indige-
nous people in the protection of cultural heritage and in decision making related to the
sustainable development process. As Reid et al (2004:625) reveal, it is important that
deliberate measures such as cultural productive activities are carefully introduced to en-
able participants to take advantage of the opportunities brought by ecotourism. Without
the careful implementation of such measures, which are viewed as part of the cultural
activities related to ecotourism, the ecotourism industry might gradually lose the host
communities’ support. This, in turn, might threaten the sustainability of development in
the future.
b. 5. Anticipated Cultural Indicators
This thesis attempts to present cultural indicators for the development of sustainable
ecotourism (as a subsector of sustainable tourism) based on cultural education. Accord-
ing to the above discussion, data availability, measurability and international compara-
bility are viewed as factors that form a framework for choosing these indicators.
Chapter 4: Comprehensive Framework
134 | P a g e
As shown in Table 4.14, suggested cultural indicators can be categorized into three
main types:
- The number of local and indigenous participants who participate in the development
process including education, management, monitoring, protection of cultural herit-
age and economic activities (1a, 2a, 3a) (Table 4.14).
- The quality of tools, goods, services and places which are used or protected during
the development process (1b, 1c, 3c, 4a, 5a, 6a, 7a) (Table 4.14).
- The economic benefits which participants earn from tourism development based on
cultural education (3b) (Table 4.14).
Table 4.14: Proposed cultural indicators for development of ecotourism based on cultural education
Cultural Outcome Ind Title Definition Awareness of the local participants of their existing cultural heritage and the methods to protect this through the educa-tional process
1a Cultural education The number of local people who participate in the educational pro-cess
1b Educational places The areas, buildings and related infrastructure which are used for education
1c Educational tools and equipment
The tools and equipment that are used for education
Participation of local people in the cultur-al development process (programming, management and monitoring for the pro-duction, consumption and presentation of cultural products)
2a Participation in cultural development process
The number of people who engage in the cultural development process including volunteer or employed participants
Culture-based development of economic systems that guarantee equal distribution of cultural capital and income among the local people
3a Employment of local people
The number of local people em-ployed in the culture-based eco-nomic system
3b GDPs1 Sustainable portion of GDP 3c Restored and protected
cultural heritage (this indicator covers indica-tors 5a and 5a)
The quantity of the intangible and tangible cultural heritage that is protected or restored through de-velopment of tourism
Combination of ordinary tourism activi-ties with compatible cultural activities
4a Local-national or inter-national cultural prod-ucts
The quantity of local products which are combined with national or international products
Protection and restoration of tangible cultural heritage
5a Restored tangible cul-tural heritage
The quantity of tangible cultural heritage that is protected or re-stored through development of tourism
Protection and restoration of intangible cultural heritage
6a Products related to in-tangible cultural herit-age
Cultural goods and services that contribute to restoration of intangi-ble heritage
Tourist experience of authentic culture 7a Authenticity Original cultural products that are labeled as local products
1. GDPs is explained in the following section of this chapter
As demonstrated in Table 4.14, the anticipated cultural indicators attempt to assess
quantitatively the engagement of local and indigenous people in the sustainable devel-
opment process through assessing cultural activities and products related to cultural ed-
ucation. The integrated findings of these cultural indicators create a base for evaluating
Chapter 4: Comprehensive Framework
135 | P a g e
policies and practices to be culturally appropriate through collecting and analyzing data
related to each indicator.
c. Required Data Related to the Cultural Indicators
Table 4.15 shows a list of data which can be used to measure the cultural footprint of
the sustainable development of tourism (in particular cultural education tourism which
is viewed as the cultural dimension of ecotourism).
Table 4.15: Required data related to anticipated cultural indicators
Indicator Title Required Data
1 a
Cultural education
D1. Creators In any one year, for people undertaking both paid and unpaid activity, the number, location, sex, age , ethnicity, cultural occupation/ activity type, hours worked, income, qualifications and training, plus whether this activ-ity is a primary or secondary occupation ( and if secondary, then primary occupation/ activity also). D2. Organizations In any financial year, by location: The number of organizations which are related to cultural education. Number of paid workers, by sex, age, and ethnicity, by type. D3. Participants The number of local and indigenous people who participate in cultural education process, by sex, age, ethnicity, by type of anticipated activity related to tourism development.
1b Educational place(s) D4. In any one year, the number of buildings and landscapes by area which are used for educational activities and services.
1c
Educational tools and equipment
D5. In any one year, the quantity of tools and equipment used in education process by type (magazines, books, media, Internet , radio).
2a
Participation in cultural development process
D6. In any one year, the number of local and indigenous people who en-gage in the educational development of tourism by sex, age, ethnicity, type of activity, level of education.
3a
Employment of the local people
In any financial year, by location, sex, age, ethnicity, level of education, activity: D7. The number of employed local and indigenous people by type of em-ployment (full or part time). D8. The number of volunteers. D9. Annual income ($ 000) by type of employment (full or part time).
3b GDPs D10. In any financial year, a part of GDPs which is generated by produc-tion and presentation of cultural products.
3c
Restored and protected tangible cultural heritage
D 11. In any one year, the quantity (area/number) of restored tangible cul-tural heritage by type (architecture, handcraft, etc.).
4a
Local-national or Inter-national cultural prod-ucts
D12. In any one year, the number of produced cultural products which are combined with national or international products, by type (cultural events such as festivals, concerts; architecture; publications, sport tournaments, etc.), and by level (local, national or international).
6a
Products related to in-tangible cultural heritage
D13. In any one year, the number of products related to intangible cultural heritage by type (publication, music, performance arts, radio programmes).
7a
Authenticity D14. In any one year, the quantity of cultural products which are locally produced and consumed, purchased or visited by visitors, by type (food, architecture, music, cultural events, etc.).
O’Mahony et al (2009:1135) introduce the achieving of sustainable tourism as an itera-
tive process based on constant monitoring of impacts and the introduction of required
preventive and / or corrective measures whenever necessary. As a result, they
Chapter 4: Comprehensive Framework
136 | P a g e
(2009:1135) reveal that the role of data and information is central to both the implemen-
tation and monitoring of sustainable tourism development.
In order to appreciate and understand fully the major factors influencing the perfor-
mance of cultural education through the sustainable development of ecotourism, this
thesis offers a range of data to measure or to explain the various benefits or aspects of
cultural education. These range from the education and awareness of the local and in-
digenous participants about their cultural capital and its potential, protection of cultural
heritage, and strengthening of identity and development of cultural products related to
the various economic, commercial and artistic opportunities (Table 4.15).
Table 4.15 shows data relating to all facets of cultural education, for instance, the crea-
tors (D1), related organizations (D2), participants in the development process (D3 and
D6), cultural products (D13 and D14), required places, tools and equipment to be used
for cultural education (D4 and D5), the activities that support progressing cultural edu-
cation and development of tourism (D11 and D13) and the factors affecting cultural
products to be improved, modified, justified or combined with imported cultural prod-
ucts (D12).
Integration of the data shown in Table 4.15 can be used to evaluate the progress towards
achieving the anticipated cultural outcomes for the sustainable development of ecotour-
ism. However, this cultural framework, its cultural outcomes, indicators and required
data must be integrated with the ecological and economic frameworks and related indi-
cators and data to create a comprehensive framework (Figure 4.8) which will have the
ability to evaluate all dimensions of sustainability through development of tourism and
its sub-sectors, such as ecotourism.
Chapter 4: Comprehensive Framework
137 | P a g e
However, it is possible that in the integration of the cultural, ecological and economic
frameworks, some of the indicators and related data will overlap each other. This can
contribute to the creation of a smaller framework for the sustainable development of
tourism and this process will be explored in the case study section of this thesis.
4.1.3. Economic Framework for Sustainable Development of Ecotourism
As previously shown in the model of sustainability (Chapter 2), the economy should be
an area which has a social and ecological interaction with society and its surrounding
environment. This model considers such an economy to be a multi-dimensional activity
which is sensitive about the social-ecological footprint of its product and outcomes in
terms of being socially appropriate and environmentally friendly. Arising from this so-
cial-ecological perspective, UNEP (2011:01) defines a green economy as one that re-
sults in improved human well-being and social equity, while significantly reducing en-
vironmental risks and ecological scarcities. However in this definition, the prefix of
‘green’ does not merely put emphasis on being ecologically friendly and it can be as-
sumed to be the same as the prefix ‘sustainable’ for an economy.
Relying on the above definition of a green or sustainable economy and as discussed in
the literature on sustainability and its proposed strategies for development (Chapter 2),
the main outcomes of sustainable economic development can be categorised into the
three areas of socio-cultural, ecological and economic outcomes which are linked to-
gether in a sustainable way.
4.1.3.1. Socio-Cultural Outcomes
The main social outcomes of sustainable economic development as proposed in the
above cultural framework for ecotourism in this chapter, and as pointed out by research-
Cultural Framework
Ecological Framework
Economic Framework
Figure 4.8: Comprehensive framework for sustainability and its segments
Chapter 4: Comprehensive Framework
138 | P a g e
ers such as Costanza (2009:20), are opportunities for the involvement of local partici-
pants in activities that achieve economic growth and equal distribution of capitals
among all components of a society. This can be viewed as a strategy that contributes to
horizontal economic development through ecotourism.
The second cultural outcome for sustainable economic development relies on the strat-
egy that results from the conservation of cultural heritage and that makes an opportunity
for the people engaged to present their cultural products and capitals. This has been
conceptualised in Table 4.10 as “development: arts, culture and heritage make a grow-
ing contribution to the economy”.
4.1.3.2. Environmental Outcome
Sustainable economic strategy relies on the idea that the conventional economic systems
are the cause of environmental issues for human life through degradation of natural re-
sources. Furthermore, these issues can be solved through changing social behaviours in
terms of patterns of resource consumption.
As Organisation for Economic Development and Co-operation (OECD) (2008) reveals,
two points are essential for achieving sustainable economic development. First: “eco-
nomic growth alone is not enough to solve the world’s problem” (OEDC, 2008: 2).
Second: “the economic, social and environmental aspects of any action are intercon-
nected” (OEDC, 2008: 2). As a result, considering only one of these aspects at a time
leads to ignoring other aspects of the sustainable environmental outcomes of an eco-
nomic system. For example, if the environmental issues are assumed to be merely tech-
nical problems, the technical progress that attempts to reduce environmental impacts
and increase human well being can cause other unrelated issues. For instance, as OECD
(2008:3) argues, cars are now much more fuel-efficient than before, but air pollution is
getting worse because so many more people have cars.
The main anticipated environmental outcome for sustainable economic development
can be introduced as conservation of environmental resources through a social-
economic educational process.
Chapter 4: Comprehensive Framework
139 | P a g e
4.1.3.3. Economic Indicators
The shortage of efficient economic indicators can be seen as one of the critical issues
for measuring the economic footprint of an activity (such as ecotourism) or a product
(such as architecture) as being economically sustainable. As many researchers and relat-
ed organisations such as NZCTU (2010:22) and UNEP (2011:26) have shown, the use
of conventional economic indicators, such as GDP and other macroeconomic aggre-
gates, can lead to a distorted picture of economic performance, particularly since such
measures do not reflect the extent to which production and consumption activities may
be drawing down natural capital.
As previously discussed in Chapter 2, many attempts have also been conducted to intro-
duce economic indicators that have the ability to cover the social and ecological dimen-
sions of sustainable economic development but the results contain potential weaknesses
that must be justified. For instance, NZCTU (2010) proposes taxation as a strategy to
monitor and control the environmental degradation caused by economic development.
NZCTU (2010:21) suggests that polluters should face taxes on their emissions, includ-
ing greenhouse gas emissions with the aim of them paying the costs of all significant
“externalities” (side effects such as pollution and global warming). But, how the level of
environmental pollution or degradation should be measured is a question still to be an-
swered.
a. Measurement of Sustainable Portion of GDP
This thesis aims to help develop economic indicators that have the ability to calculate
economic progress and can be comprehensive measures of well-being and environmen-
tally sustainability. To achieve this aim, an economic indicator is needed that is as clear
and appealing as GDP but more inclusive of other dimensions of progress, in particular
the environmental and social aspects.
As discussed above, development of local and domestic products can be viewed as fun-
damental social-cultural priorities in a sustainable development strategy. This progress
can clearly be economically measured using GDP. However, to measure the environ-
mental impacts of these products by GDP, it is essential to integrate both gross domestic
product and the cost that must be spent to conserve or restore the environment which is
damaged during the process of development.
Chapter 4: Comprehensive Framework
140 | P a g e
a. 1. Equation
This research proposes a method to calculate the sustainable portion of GDP (called
here GDPs) that can be introduced as an economic indicator which measures both the
social-economic benefits of producing local and domestic products and their environ-
mental impacts in an integrated concept.
The method to measure GDPs involves five factors which are listed below, and then ex-
plained in detail:
- EF (gha): Ecological footprint of an activity or a product.
- GDP ($): Earned GDP from this activity or product.
- EF1 (gha): Overshoot portion of EF of the product or activity relative to the avail-
able bio capacity
- E1 (GJ): Overshoot portion of the life cycle energy use of the product or activity
relevant to the energy equivalent of bio capacity.
- CE1 ($): The cost to generate the overshoot portion of the life cycle energy used
through the use of renewable resources.
a. 2. Ecological Footprint (EF)
The ecological footprint (EF) measures the extent to which humanity is using nature’s
resources faster than they can regenerate. EFs are usually presented together with bio
capacities (BCs), which measure the bio-productive supply. The EF of a given product
or an activity is equal to the area (gha) needed to absorb the CO2 emissions generated
through using fossil fuel to produce its life cycle energy use (GJ).
- EF1
If an EF is larger than the available BC for a selected time period the EF/BC re-
source accounting results in a deficit or overshoot (EF1). A deficit occurs in the
case where human resource extraction and waste generation exceed an ecosystem’s
ability to regenerate the extracted resources and to absorb the generated waste.
- E1 (GJ)
Overshoot portion of the life cycle energy use of the product or activity such that its
CO2 emissions are more than the related BC.
Chapter 4: Comprehensive Framework
141 | P a g e
- CE1 ($)
CE1 is assumed equal to the money needed to generate the overshoot portion of the
life cycle energy used (E1) through the use of renewable resources. Its value de-
pends on the level, type and cost of the available technology and renewable re-
sources. As a result, CE1 can be different from one location to another or from re-
gion to region or country to country.
The following equation can be used to evaluate the sustainable portion of GDP (GDPs):
GDPs = GDP – CE1
b. The Main Characteristics of GDPs
GDPs is introduced here as a multi-dimensional indicator that has the ability to measure
and evaluate the socio-economic and environmental success of human products and ac-
tivities as being sustainable.
b. 1. Social-Cultural Characteristics
Making opportunities for local and indigenous people to produce and present their cul-
tural capitals and products is one of the fundamental cultural outcomes for the sustain-
able development of an activity such as ecotourism. Since GDPs emphasises the devel-
opment of local and domestic products, it can be determined as a social-economic indi-
cator that contributes to the evaluation of success in achieving this cultural outcome.
b. 2. Environmental Characteristics
GDPs is an economic indicator that is sensitive to the environmental impacts of human
products and activities. Integration of EF and economic development in GDPs allows it
to be considered as a social-economic indicator as well as an ecological indicator.
GDPs addresses the amount of GDP that must be spent to conserve and restore damaged
environmental resources. It can contribute to the more accurate accounting of other eco-
nomic indicators such as Goods, Services Tax (GST).
4.1.4. Cultural Footprint of Ecotourism
4.1.4.1. Definition
The thesis introduces ecotourism as a sustainable phenomenon that aims to conserve the
natural and cultural heritage of its host societies and engage them in social-economic
Chapter 4: Comprehensive Framework
142 | P a g e
development through an educational process. The anticipated outcomes of ecotourism
are linked together, influenced by the strategy for sustainable development in a way so
that achieving each of them contributes to the others, all being set under the umbrella of
sustainability.
Figure 4.9 shows the relationship between the cultural changes to the host society
caused by the development of ecotourism and its following environmental and econom-
ic changes. Based on its anticipated cultural outcomes, the cultural footprint (CF) of
ecotourism can be conceptualized as the influences exerted by ecotourism on a given
host society that change its attitudes to existing cultural and natural heritage and capital,
and that develops cultural communication between it and its visitors.
Since the economic development of ecotourism is introduced as a social-economic ac-
tivity that is environmentally sensitive as well, the cultural changes of the host society
can direct the economic system toward sustainable economic strategies.
Cultural influence
Ecotourism
Figure 4.9: Relationship between ecotourism, culture of the host society, environment and economic system
Using minimal resources and optimizing size of spaces used for accommodation services Using some parts of open areas to generate food, energy and some required materials and presenting these activities to ecotourists Horizontal distribution of accommodation services Development of accommodation services at the local level Use existing buildings for accommodation services – these might be repaired or made to match with sustainable patterns of architecture Using renewable resources for heating and cooling Using local and durable materials for construction with lowest EF Using local manufacturers and equipment made from natural products with low EF in interior spac-es
Table 4.16 shows a range of productive activities that can contribute to architecture to
achieve this outcome. Since environmental conservation has been explained as a social-
ecological activity that can be conducted through the use of available technologies, the
anticipated activities shown in Table 4.16 have social-ecological and technical-
ecological characteristics. All these activities can be conducted in a community based
process that attempts to engage local and indigenous people (as components of the or-
ganism) in the conservation process. This will thereby make them aware of the impact
Chapter 4: Comprehensive Framework
150 | P a g e
of their behavior on the environment and the benefits of using renewable resources to
reduce these impacts through an educational process.
Indeed, when this approach is applied to the sustainable development of architecture, as
Ding (2008:463) reveals, it involves the efficient allocation of resources, minimum en-
ergy consumption, low embodied energy intensity in building materials and construc-
tion processes, reuse and recycling, using renewable resources of energy and materials
and changing unsustainable socio-cultural patterns of materials, energies and spaces
consumption.
4.2.1.2. Ecological Indicators
Table 4.17 shows a range of proposed social-ecological indicators that can be divided
into two types of indicators focused on the pattern of using spaces at different scales (E
1-4), and indicators focused on use of materials and energy resources (E 5-7). In Table
4.17, the EFs of materials and manufactures (E 5-7) are used as separate ecological in-
dicators from the other indicators (E 1-4). However, it should be remembered that indi-
cators E 1-4 arise from policies aimed at reducing the EF of all human activities and
products, such as the patterns of use of spaces, materials and energy resources.
Table 4.17: Social-ecological indicators
Indicator Description Unit E 1 The area used as accommodation services m2
/visitor
E 2 Public open air area used for generation of food, energy and some required materials.
m2/visitor
E 3 Distance between accommodation services. km E 4 Modified or repaired buildings used for accommodation services m2
/visitor E 5 Renewable resources used to generate energy GJ E 6 EF of local materials used to build accommodation services GJ/gha
E 7 EF of manufactured components produced locally GJ/gha 4.2.1.3. Required Data
The quantity and quality (refurbished and new) of architectural spaces at the different
scales of region, site and building can be considered as forming the required data related
to indicators E 1-4. Moreover the quantity and types of materials and manufactures used
form the required data to measure EFs related to indicators E 5-7.
Chapter 4: Comprehensive Framework
151 | P a g e
4.2.2. Cultural Framework for Sustainable Architecture Used in Ecotourism De-
velopment
4.2.2.1. Anticipated Cultural Outcomes for Sustainable Architecture
As shown in Table 4.18, this study anticipates some cultural outcomes for architecture
that can be used as tools to explore its cultural footprint on host destinations through the
sustainable development of ecotourism. The main cultural outcomes can be introduced
as engagement of educated local and indigenous people in protection and presentation
of their cultural capitals, and development of cultural interaction between visitors and
the host communities (Table 4.18).
Table 4.18: Forecasted cultural outcomes for sustainable architecture and its related productive activities. Cultural outcomes Productive activities
• Changing attitudes of local and indige-nous people to their cultural capitals in-cluding vernacular architecture. Making valuable local products which are also en-vironmentally compatible and can be used as goods and services by visitors
• Development of cultural relationships be-tween host communities and visitors
• Opportunity for visitors to be familiar with a part of host culture through using its architecture and related products
• Opportunity for host people to present their intangible cultural products includ-ing architecture and its related compo-nents.
Modifying and justifying the existing buildings to avoid unsustainable and unnecessary develop-ment of services Development of types of accommodation services which contribute to close relationships between host people and visitors Equal distribution of accommodation services in any project to avoid massing of capitals in a par-ticular place and depression of other areas. Avoiding luxuries and fashions and giving more focus and attention to local values in architecture. Using local and available technologies for con-struction. Engagement of local communities, organizations and people in the processes related to accommoda-tion services (planning, management, investment, and construction etc).
Table 4.18shows a range of productive activities that can contribute to achieving to the
latter cultural outcomes. However, some of the productive activities introduced in Table
4.16 can also be viewed as social-cultural productive activities.
4.2.2.2. Cultural Indicators
This section proposes cultural indicators which are classified into the two types of
macro and micro indicators to evaluate the sustainability of architecture (in particular
accommodation services) through the sustainable development of ecotourism. This clas-
sification arises from the essential characteristics of the cultural indicators explained
above.
Table4.19 determines the cultural indicators to be used for the evaluation of architecture
related activities (shown in Table 4.18) as being culturally sustainable.
Chapter 4: Comprehensive Framework
152 | P a g e
Table 4.19: Cultural indicators to evaluate culturally appropriate architecture. Cultural Indicator
Description Unit Level/Scale
C1 Modified or new buildings used for accommoda-tion services.
m2/visitor Region
C2 Farm stay/ home stay accommodation services m2/visitor Region C3 Distances between accommodation services km Region C4 Proportion of built up land (accommodation) to
public open air areas. % Site
C5 Public open air areas as multi-functional spaces for cultural events
m2/visitor Architecture/ site/region
C6 Locally constructed building(s) used as accommo-dation services.
m2/visitor Architecture/ Site/region
C7 Types of materials used for construction m3/visitor of different types
Architecture/ Site/region
C8 The number of local communities, organizations and people engaged in the processes related to ac-commodation services (planning, management, investment, and construction).
number in dif-ferent categories
Architecture/ site/region
As shown in Table 4.19, these objective cultural indicators can be classified, according
to the level of detail at which they are applied, into three scale types: macro (regional-
C1, C2, C3), micro (one specific site-C4), and macro - micro (composite indicators-C5,
C6, C7).
This thesis attempts to use objective cultural indicators which are measurable. More-
over, these indicators must be comparable for use in different places with different cul-
tural and environmental circumstances. It should be remembered that most of the envi-
ronmental indicators which are used to evaluate architecture as being environmentally
sensitive can also be viewed as cultural indicators to evaluate its cultural footprint.
4.2.2.3. Required Data
Table 4.20 shows a range of required data to be used for evaluation of the CF of archi-
tecture (in particular accommodation services) through the sustainable development of
ecotourism.
Chapter 4: Comprehensive Framework
153 | P a g e
Table 4.20 : Required data for evaluation of the CF of architecture Required
Data Description unit Level
C-D1 The area of modified or new buildings used as accommo-dation services at the scale of region or site
m2 Macro
C-D2 The number of visitors per year at the scale of region or site
Visitor/year Macro
C-D3 The number of visitors per year at the scale architecture Visitor/year Micro C-D4 Types of accommodation services at the scale of region or
site or community. m2/type Macro
C-D5 Distance between accommodation services at the scale of region or site or community
km Macro
C-D6 Multi-functional spaces (closed and open air) used for cul-tural events at the scale of region or site or community
m2 Macro
C-D7 Multi-functional spaces (closed and open air) used for cul-tural events at the scale of architecture
m2 Micro
C-D8 Buildings which are constructed by using local technolo-gies at the scale of region or site or community
m2 Macro
C-D9 Buildings which are constructed by using local technolo-gies at the scale of architecture.
m2 Macro
C-D10 Types of main materials used for construction at the scale of region or site or community
m3/type Micro
C-D10 Types of the main materials used for construction at the scale of architecture.
m3/type Micro
C-D11 Number of local communities, organizations and people engaged in the processes related to accommodation ser-vices (planning, management, investment, and construc-tion) at the scale of region or site or community.
Number/ category
Micro
C-D12 The number of local communities, organizations and peo-ple engaged in the processes related to accommodation services (planning, management, investment, and construc-tion) at the scale of architecture.
Number/ category
Macro
As shown in Table 4.20, the required data can be categorised into the two types of
macro and micro scale data. The macro scale data refers to the cultural footprint of the
development policies at the scale of region or community or site, and micro scale data
refers to the cultural footprint of a building at the scale of an individual unit. Since re-
gional dimensions of the cultural footprint refer to the participation of local people (with
similar cultural backgrounds) in the sustainable development process through engage-
ment in forecasted cultural activities (cited in Table 4.18), macro scale data can be used
to measure the quantity of this engagement at the scale of a region, a community or a
site.
The cultural footprint of a building refers to the interaction between architecture as a
micro-organism and its surrounding environment, in particular through using materials
and sources of energy as influenced by the dominant cultural system. Micro scale data
can be used to measure the cultural footprint of architecture at the scale of a building.
Chapter 4: Comprehensive Framework
154 | P a g e
As a result, the combination of the required macro and micro data can be considered as
a tool for the comprehensive measurement of the cultural footprint of architecture.
4.2.3. Economic Framework
This section presents an economic framework for architecture as used in the sustainable
development of ecotourism. Since architecture is one of the ecotourism products, its
economic policies and principles are dominated by the social-economic strategies of
ecotourism. Furthermore, in this case, the main environmental and social outcomes for
the economic development of architecture can be viewed as the same as those anticipat-
ed for the economic development of ecotourism, but in an area limited to architecture
and its profiles.
4.2.3.1. Environmental Outcomes and Activities
The main environmental outcome for the economic development of architecture is in-
troduced as being the same as that anticipated for ecotourism, as demonstrated in sec-
tion 4.1.3.2. As shown in Table 4.21, the economic productive activities that must be
accomplished in the field of architecture can be an economic contribution to the envi-
ronmental activities forecasted for architecture in Table 4.16.
Table 4.21: Environmental outcome and related productive activities for economic development of archi-tecture Environmental outcome Productive activities Conservation of the environmental resources
Economic contribution to: Using minimal resources and optimizing size of
spaces used for accommodation services; Using some parts of open areas to generate food,
energy and some required materials and presenting these activities to Eco-tourists;
Horizontal distribution of accommodation services; Development of accommodation services at the local
level; Use existing buildings for accommodation services –
these might be repaired or made to match with sus-tainable patterns of architecture;
Using renewable resources for heating and cooling; Using local and durable materials for construction
with lowest EF; Using local manufacturers and equipment which is made from natural products with low EF in interior spaces.
Chapter 4: Comprehensive Framework
155 | P a g e
4.2.3.2. Indicator
Since GDPs has been introduced as an economic indicator that is involved in the eco-
logical and social dimensions of development, this research suggests using GDPs as a
fundamental economic indicator for the evaluation of the economic-ecological impacts
of architecture used in ecotourism development.
4.2.3.3. Cultural Outcome and Activities
The main forecasted social-cultural outcome for the economic development of architec-
ture is the same as the outcomes introduced in Table 4.18. Moreover its forecasted pro-
ductive activities can be explained as an economic contribution to the anticipated activi-
ties, as explained in Table 18.
4.2.3.4. Indicators
GDPs and employment of local people are the two main economic indicators that are
proposed for evaluating the social dimension of the economic development of architec-
ture through ecotourism. However, GDPs also has the ability to cover the second indica-
tor (employment), because contribution to the development of local products also makes
opportunities for local people to be engaged in the economic development process.
4.2.4. CF of Architecture
The CF of architecture at the different scales of region, site and building can be evaluat-
ed and determined though using the CF model introduced in this chapter the CF model
allows this research to make a link between the cultural, ecological and economic pro-
files of an architecture that can contribute to sustainable development through ecotour-
ism.
The description of the comprehensive framework and its derivation has unavoidably
been quite complex and highly theoretical. Chapters 5 and 6 will demonstrate its use for
evaluation of an objective case study. This will clarify how the framework operates in
practice.
Chapter 4: Comprehensive Framework
156 | P a g e
4.3. Chapter 4: Summary
Chapter 4 presents the comprehensive framework for the sustainable development of
ecotourism and its architecture that is a pivotal part of the methodology as explained in
Chapter 3. The aim of the framework is to introduce a method that can solve the meth-
odological problems discussed in Chapter 3 and contribute to answering the research
questions in Chapter 2.
The comprehensive framework is in two sections: the framework for ecotourism; and
the framework for architecture (Figure 4.13). In response to the methodological prob-
lems discussed, the comprehensive framework integrates the three sub-sections of the
ecological, cultural and economic frameworks for both ecotourism and architecture in
the related cultural footprint (CF) model (Figure 4.13).
The framework indicates five ecological outcomes for the development of ecotourism
(Table 4.2). The outcomes emphasize awareness of local and indigenous people about
their environmental heritage and capital through an educational process, and subsequent
engagement of such people in the development of ecotourism (Table 4.2). Furthermore,
environmental conservation through using renewable resources to generate the energy
used by tourism is another anticipated goal for the sustainable development of ecotour-
ism.
Chapter 4: Comprehensive Framework
157 | P a g e
Cul
tura
l Fra
mew
ork
Comprehensive Framework for Sustainable Development of Ecotourism and its Architecture
Framework for Ecotourism Framework for Architecture E
colo
gica
l Fra
mew
ork
Social- ecological outcomes
Setting priorities
Ecological indicators
Required data
Cultural outcomes
Setting priorities
Cultural indicators
Required data
Eco
nom
ic F
ram
ewor
k
Economic outcomes
Setting priorities
Required data
Setting priorities
Eco
logi
cal F
ram
ewor
k
Social- ecological outcomes
Setting priorities
Ecological indicators
Required data
Cul
tura
l Fra
mew
ork
Cultural outcomes
Setting priorities
Cultural indicators
Required data
Eco
nom
ic F
ram
ewor
k
Economic outcomes
Setting priorities
Required data
Setting priorities
CF of ecotourism products and activi-ties (excepted architecture)
CF of architecture (used in ecotourism development)
Total CF of ecotourism and its architecture
Figure 4.13: Structure of the compressive framework proposed through Chapter 4.
Chapter 4: Comprehensive Framework
158 | P a g e
Table 4.12 shows the eight anticipated cultural outcomes for the sustainable develop-
ment of tourism that can be also applied to ecotourism and its architecture. These out-
comes can be conceptualised as engagement of the host society in the conservation and
development process of their cultural heritage and capitals through an educational proc-
ess that also economically benefits them and ecologically protects their environment.
The comprehensive framework considers the economic development of ecotourism and
its architecture as a social-ecological economic phenomenon. In this approach, the main
policies for economic development rely on sustainability principles and polices. The
framework indicates the social-cultural outcomes for the sustainable economic devel-
opment of ecotourism and architecture as making opportunity for the engagement of the
host societies in horizontal economic development, while the development process fol-
lows the sustainability strategies.
As demonstrated in Table 4.2, five priorities are proposed for achieving the ecological
outcomes for the sustainable development of ecotourism. These include social ecologi-
cal policies (e.g. engagement of people as well as all related organizations in environ-
mental education) and social-economic strategies (e.g. employment of local and indige-
nous participants in the development process as employed or volunteer staff). These
priorities aim to inform and benefit people through development of ecotourism as being
ecologically sustainable (Table 4.2).
The framework introduces seven productive activities for achieving the forecasted eco-
logical outcomes for architecture used in ecotourism development (Table 4.16). Con-
ceptually, these are strategies for using materials, energy resources and spaces created,
and management and organisation of services related to ecotourism architecture at re-
gional and local scales (Table 4.16).
In this chapter the cultural priorities are viewed as the development of products and ac-
tivities that contribute to achieving the forecasted cultural outcomes for the sustainable
development of ecotourism. These can be summarised as:
- Development of cultural education and its related educational tools, equipment and
spaces;
Chapter 4: Comprehensive Framework
159 | P a g e
- Restoration of cultural heritage and development of cultural capitals and products in
a way that ecologically and economically benefits the host society ;
- Protection of host authenticity.
The six cultural priorities proposed for the development of architecture through ecotour-
ism (Table 4.18) can be summarised as using types of architecture and related services
that contribute to:
- Restoring the cultural heritage;
- Cultural interaction between host society and visitors;
- Avoiding luxuries and fusions;
- Using available technologies;
- Democratic engagement of local people in the development process.
Economic priorities proposed for ecotourism and its architecture are considered the
same as the ecological and cultural productive activities that economically benefit the
host destinations of ecotourism in a sustainable way.
Chapter 4 presents the ecological indicators for the development of ecotourism (Table
4.3) and its architecture (Table 4.17). In terms of ecotourism, the ecological indicators
include: the number of people who engage in the sustainable development of ecotour-
ism through an educational process; and, the EF of products and activities produced/
consumed / conducted in relation to ecotourism (Table 4.3).
The ecological indicators for evaluation of architecture can be categorised into the three
categories of quality (e.g. using refurbished buildings), quantity (e.g. the area used as
accommodation) and the EF of the architecture involved (Table 4.17).
Mahravan and Vale (2010) and O’Connor (2009) reveal that the EFs of some tourism
products and activities (such as waste and water consumption) are small, whereas the
EFs of transportation, food, accommodation services and tourism activities form the
major part of the overall EF. Consequently these four categories have been chosen for
evaluation using the comprehensive framework. The EFs of these categories are also
used as the main ecological indicators to evaluate the three case studies, introduced in
previous chapters, as being ecologically sustainable.
Chapter 4: Comprehensive Framework
160 | P a g e
The cultural indicators for development of ecotourism (Table 4.14) and its architecture
(4.19) can be summarised as the priorities proposed for both ecotourism and architec-
ture. However, as will be discussed in the conclusion, some indicators can be covered
by other indicators to shorten the list and to solve shortcomings in the related data.
Due to a deficit of efficient economic indicators for the sustainable development of
ecotourism and its products, this thesis introduces GDPs as a new economic indicator.
The GDPs aims to connect the economic development of ecotourism and architecture to
the ecological and the social indicators proposed for these categories as being economi-
cally sustainable.
The framework proposes the CF model as an original system to analyse the cultural
footprint of ecotourism and its products and activities. The CF model indicates the envi-
ronmental influences exerted by ecotourism and its products and activities on a given
host destination. The model can also be a tool to compare the current ecological, social
and economic circumstances of an ecotourism project and its sustainable pattern (ideal
model). In addition the CF model can be used to compare different ecotourism projects
in terms of being sustainable. Furthermore, it can be used to compare the cultural foot-
print of a project at different times.
The framework thus answers the research question “What are the main characteristics of
an efficient strategy for the sustainable development of ecotourism and its products,
such as architecture?” (Chapter 2, section 2.6.1.1) as:
- A holistic approach to sustainable development that covers all ecological, cultural
and economic dimensions of ecotourism and its architecture as being sustainable.
- Proposing ecological, cultural, economic outcomes, priorities, related indicators and
required data for evaluation of ecotourism and its architecture as being sustainable.
In response to the research question “What are the relationships between the anticipated
outcomes for ecotourism and its architecture and how are they linked to each other?”
(Chapter 2, section 2.6.1.2) it could be said that:
The anticipated outcomes are linked together through sustainable policies and strategies.
This means that all the anticipated outcomes simultaneously must be ecologically sensi-
tive, culturally appropriate and economically sustainable.
Chapter 4: Comprehensive Framework
161 | P a g e
The framework answers the research question “what are the main priorities for the de-
velopment of ecotourism and its related architecture that can contribute to achieving
their forecasted outcomes in a sustainable way?” through proposing the priorities dis-
cussed in this Chapter. Other research questions will be answered through testing the
CF model and the results (Chapters 6 and 7).
Chapter 5: First case study – Otago Central Rail Trail
162 | P a g e
Chapter 5: First Case Study – Otago Central Rail Trail
(OCRT), Otago, New Zealand
5.1. Introduction
The thesis results are presented in Chapters 5 and 6. This chapter describes the case
study of the ‘The Otago Central Rail Trail (OCRT)’ introduced in the New Zealand
Tourism Strategy (NZTS) 2015 as a successful example of sustainable tourism devel-
opment. Since the OCRT crosses many rural and urban places and their adjacent areas
with different environmental, cultural and economic characteristics, it can be considered
as the integration of both rural and urban ecotourism projects. This chapter investigates
the impacts of the OCRT as a tourism project (managed by the OCRT community and
other related organizations) and its related architecture on cultural heritage, local eco-
nomic systems and natural resources at regional scale. The investigation is conducted
through using the comprehensive framework proposed for the sustainable development
of ecotourism and its products (including architecture) and activities (see Chapter 4).
This chapter responds to four research questions (Questions 2.6.1.4 to 2.6.1.7) intro-
duced in Chapter 2. Through answering these how the proposed priorities for the sus-
tainable development of ecotourism and its architecture influence each other and the
host society at the regional scale ecologically, socially and economically, will be clari-
fied. Chapter 5 also sets out how these influences can be measured and evaluated
through using the comprehensive framework introduced in Chapter 4.
5.2. Otago Central Rail Trail (OCRT) – Background
Originally the Otago Central Railway that is located in the South Island of New Zealand
(Figure 5.1) was constructed to transport gold out from the booming Central Otago
goldfields of the late 1800s and into the bustling city of Dunedin (Graha, 2009:3). In the
forty years it took to complete the railway, over 60 bridges and 3 tunnels were built as
part of the railway between Middlemarch and Clyde. According to Burns and Corbet
(2007:62) the railway closed in 1990, at a time when the rural community was in a state
Chapter 5: First case study – Otago Central Rail Trail
163 | P a g e
of stagnation. Graham (2009:4) points out that through the early 1990s, towns in Central
Otago as in other rural areas in New Zealand lost many of their services and suffered
from a reducing population, as banks and post offices closed and many businesses
moved away. However, as explained by Burns and Corbet (2007:62) some local people
viewed the closed railway line as an opportunity and potential attraction for developing
the tourism industry in Central Otago.
Figure 5.1: OCRT, Otago region, New Zealand http://www.linz.govt.nz/sites/default/files/survey-titles/land-registration/land-districts/images/land-districts.jpg viewed August 2012
Chapter 5: First case study – Otago Central Rail Trail
165 | P a g e
A trip along the entire 150 km length of the Otago Central Rail Trail may begin at either
end, at Clyde (see Figures 5.3 and 5.4) or Middlemarch (see Figures 5.3 and 5.5), and
can be cycled in approximately 4 days, walked in approximately 6 days, or experienced
by any number of shorter station to station trips.
Figure 5.3: OCRT, Naseby and Cromwell, Otago, New Zealand http://www.centralotagonz.com/rail-trail-map viewed August 2012
Figure 5.4: Clyde, Otago, New Zealand http://upload.wikimedia.org/wikipedia/commons/thumb/8/84/Panorama_of_Clyde,_Otago,_New_Zealand.jpg/640px-Panorama_of_Clyde,_Otago,_New_Zealand.jpg viewed September 2012
Chapter 5: First case study – Otago Central Rail Trail
166 | P a g e
The OCRT’s highest point is near the township of Wedderburn, 618 m above sea level,
with gentle descents in either direction. Whether visitors are engaged in a multi-day ex-
cursion or a one day trip, a large selection of accommodation providers, restaurants, and
other businesses support these rail trail visitors both in communities adjacent to the rail
trail and at nearby off-trail locations.
5.3. OCRT- Visitors
In this study OCRT visitors are classified into the two groups of international and do-
mestic visitors. In this section information related to each group of OCRT visitors in-
cluding the number of visitors, OCRT visitor nights, and the home place of visitors by
their types is presented.
5.3.1. OCRT Visitor Numbers
As shown in Figure 5.6, in 2009, 10,058 visitors visited the OCTR. This number in-
creased to 12,157 visitors in 2010 (Figure 5.6). In 2011, in comparison with the year
2010, the number of OCRT visitors decreased to 11,788 visitors (Figure 5.6).
Figure 5.5: Middlemarch, Otago, New Zealand http://www.otagorailtrail.co.nz/index.php?option=com_content&task=view&id=26&Itemid=57#photos1 viewed August 2012
3.2% other international and 5.20% UK and USA (2.60% each).
0.00% 2.00% 4.00% 6.00% 8.00%
10.00% 12.00% 14.00% 16.00% 18.00%
Auc
klan
d C
ante
rbur
y O
ther
Nor
th Is
land
O
tago
N
ot st
ated
N
elso
n/M
arlb
orou
gh
Sout
hlan
d Lo
cal
Wel
lingt
on
Aus
tralia
Eu
rope
U
K &
Irel
and
Nor
th A
mer
ica
Wes
t Coa
st
Mid
dle E
ast
Perc
enta
ge o
f vis
itors
2009( n= 602)
Figure 5.8: OCRT visitor home place – 2009 (CODC, 2009:9)
Chapter 5: First case study – Otago Central Rail Trail
169 | P a g e
In 2011, the majority of the 648 OCRT visitors sampled (40%) came from the North
Island, closely followed by 38% from the South Island and 22% international (Figure
5.10).
Since the home place of OCRT visitors is presented in different local, regional, national
and international scales by the three surveys (CODS, 2009; Reis et al, 2010;
CODC,2011), the results cannot be set out in a figure or table to be compared with each
other. As a result, to make a link between OCRT visitor data arising from the three sur-
0.00%
5.00%
10.00%
15.00%
20.00%
25.00%
30.00%
Perc
enta
ge o
f vis
itors
2010 (n=154)
40% 38%
22%
0%
5%
10%
15%
20%
25%
30%
35%
40%
45%
North Island South Island International
Perc
enta
ge o
f vis
itors
2011 (n=648)
Figure 5.9: OCRT- visitor home place- 2010 (Reis et al, 2010:7)
Figure 5.10: OCRT visitor home place- 2011 (CODC, 2011:12)
Chapter 5: First case study – Otago Central Rail Trail
170 | P a g e
veys, this study uses the CODC (2011) data as a base format. The OCRT visitor data
from CODC (2009) and Reis (2010) are then converted to match the format used in
CODC (2011) as shown in Figure 5.11.
Figure 5.11 shows that in 2009, of 602 OCRT visitors sampled, 45.5% came from the
South Island followed by 35.9% from the North Island and 11.5% from overseas. In
2009, 7% of OCRT visitors did not state their home place (Figure 5.11). In 2010, the
majority or 61% of 154 OCRT visitors sampled came from the North Island followed
by 23.4% from the South Island and 15.6% international (Figure 5.11). In 2011, the ma-
jority or 40% of 648 OCRT visitors sampled came from the South Island followed by
38% from the North Island and 22% international (Figure 5.11). What this figure shows
is that domestic visitors were relatively stable in total, though their home place varied,
but international visitor numbers rose.
5.3.3.1. OCRT International Visitors
Table 5.1 shows that in 2009, 11.5% (69 visitors) of all 602 OCRT visitors sampled
came from overseas. Of these in 2009, the majority or 3.5% of total sample were from
Australia followed by 3.2% Europe, 2.3% UK, 2.2% North America and 0.3% Middle
East. As shown in Table 5.1, in 2010, the majority of overseas visitors still came from
Australia but had doubled, being 7.1% of the total 154 OCRT visitors sampled, while
those from the UK and North America were very slightly up, with 5.2% UK and North
America (2.6% each), leaving 3.2% of total as other international. However, this
changed in 2011. Table 5.1 indicates that of 648 OCRT visitors sampled in 2011, the
0.00%
10.00%
20.00%
30.00%
40.00%
50.00%
60.00%
70.00%
Perc
enta
ge
North Island
South Island
International
Not stated
Figure 5.11: OCRT- visitors (2009- 2011)
Chapter 5: First case study – Otago Central Rail Trail
171 | P a g e
majority or 42.7% were now from Europe (except UK) followed by 32.9% Australia,
12.6% UK, 9% North America and 1.4% each from the Middle East and South Africa.
Table 5.1. OCRT- International visitors (2009-2011)
Home place 2009 (n=602) 2010 (n=154) 2011 (n=648) NV3 % NV3 % NV3 %
Europe 19 3.2 - - 61 42.7 Australia 21 3.5 11 7.1 47 32.9 UK 14 2.31 4 2.6 18 12.6 North America 13 2.2 42 2.6 13 9 Middle East 2 0.3 - - 2 1.4 South Africa - - - - 2 1.4 Other International - - 5 3.2 - - Total 69 11.5 24 15.5 143 22 1. In 2009, UK includes UK and Ireland. 2. 1n 2010, USA used as the home place of visitors from America. 3. NV: Number of international visitors.
As shown in Figure 5.6 the total number of OCRT visitors in 2011 was 11,788. This
study uses the percentages of OCRT visitor home place (cited in Table 5.1) that are
based on OCDC (2011:12) (n=648) to calculate the total numbers of OCRT interna-
tional visitors by their home place (Table 5.2).
In 2011, of 11,788 OCRT visitors coming from overseas the majority or 1,107 (42.7%)
were from Europe followed by 853 (32.9%) Australia, 327 (12.6%) UK, 234 (9%)
North America, and 72 (2.8%) Middle East and South Africa (1.4% each) (Table 5.2).
In total this was 22% of all visitors.
Table 5.2: OCRT- International visitors (2011)
Home place NV3 % Europe 1,107 42.7 Australia 853 32.9 UK 327 12.6 North America 234 9 Middle East 36 1.4 South Africa 36 1.4 Other Interna-
tional - -
Total 2,593 22 1. NV: Number of Visitors. 2. Total visitor numbers (2011) = 11,788 3. Percentage of International visitors (2011) = 22%
Chapter 5: First case study – Otago Central Rail Trail
172 | P a g e
5.3.3.2. OCRT Domestic Visitors
Figure 5.12 shows that in 2009, 30% of the 602 OCRT domestic visitors sampled were
from the upper North Island (NI) followed by 27.5% upper South Island (SI), 18.40%
Central SI (Otago), 9% Lower NI, 7.30% Lower SI, and 7% did not state their home
place.
In 2010, although the majority (56.54%) of 154 OCRT visitors sampled came from Up-
per NI, other relative positions had changed with 15.76% from Lower NI, 12.30% Cen-
tral SI (Otago) and 15.4% Upper SI and Lower SI (each 7.7%) (Figure 5.12).In 2011,
the majority (35.8 %) of 648 OCR visitors sampled were still from the Upper NI fol-
lowed by 22.75% central SI, 21.20% Upper SI, 14.90% Lower NI and 5.35% Lower SI
(Figure 5.12).
This study calculates the numbers of OCRT domestic visitors in 2011 by their home
place (Table 5.3), based on the percentages of OCRT domestic visitors from the OCDC
survey (2011) shown in Figure 5.12. According to CODC (2011) 78% of the total 648
OCRT visitors sampled are domestic visitors (Figure 5.8). Using this portion as a base,
9,195 (78%) of 11,788 (total number of OCRT visitors in 2011, shown in Figure 5.6)
can be considered domestic visitors (Table 5.3).
0%
10%
20%
30%
40%
50%
60%
Upper NI
Lower NI
Upper SI
Central SI
(Otago)
Lower SI
Not Stated
Perc
enta
ge o
f dom
estic
vis
itors
2009
2010
2011
Figure 5.12: OCRT- domestic visitors (2009-2011)
Chapter 5: First case study – Otago Central Rail Trail
173 | P a g e
From the discussion above, in 2011 most domestic visitors came from Upper NI, the
estimated number being 3,292 (35.8%) of 9,195 (100%). This is followed by 2,092
(22.75%) from central SI (Otago), 1,949 (21.2%) Upper SI, 1,370 (14.9%) Lower NI
and 492 (5.35%) Lower SI (Table 5.3). In 2011, as Figure 5.13 illustrates, of 11,788
(100%) OCRT visitors, 9,195 (78%) were domestic and 2,593 (22%) were international.
5.4. OCRT Transportation
This section explores types of international and domestic transportation used by OCRT
visitors and calculates their Ecological Footprints (EFs). The total EF of OCRT trans-
portation is calculated through integration of the EFs of international and domestic
transportation.
0%
10%
20%
30%
40%
50%
60%
70%
80%
90%
Domestic visitors International visitors
Perc
enta
ge o
f vis
itors
2011
Table 5.3: OCRT- Number of domestic visitors by home place Region/ city Number of visitors % Upper NI 3,292 35.8 Lower NI 1,370 14.9 Upper SI 1,949 21.2 Central SI (Otago) 2,092 22.75 Lower SI 492 5.35 Total 9,195 100
Figure 5.13: OCRT- domestic and international visitors (2011)
Chapter 5: First case study – Otago Central Rail Trail
174 | P a g e
5.4.1. OCRT- Types of International Transportation
Since travelling from overseas to New Zealand by car, bus and train is not possible be-
cause of its geographical location, and because of the long travel times involved using
ships, in this study of international transportation only airlines are considered.
5.4.1.1. OCRT International Tourist-kilometres (T-Km)
Table 5.4: shows that 2,593 OCRT visitors (22%) are international tourists and the total
distance between their home places and Auckland’s international airport is equivalent to
32,041,486 Tourist-km (T-km). International distances are calculated here as a one way
trip because their ecological footprint is assumed to be related to where the plane is re-
fueled and so is divided between New Zealand and the home country. It could equally
be argued that the full international trip should be counted, as belonging to the individu-
al tourist’s holiday that included the OCRT, but this has not been done in this thesis.
Due to international tourists having to travel from Auckland to Dunedin and back this
part of the journey is a domestic return flight and is equivalent to 5,590,508T-km, which
is shown in Table s.5.4 and 5.7 as ‘Air domestic international visitors’.
Table 5.4: OCRT- International Tourist-km Home place
Assumed city of origin
(central in country of
origin)
Distance between central
cities and Auckland
(km).
Visitors Total In-ternational
T-km
Auckland to Dunedin
(km, return)
Air domestic International visitors T-km
from Auckland to Dunedin (re-
turn)
No %
Australia Sydney and Mel-bourne
2,512 853 32.9 2,142,736 2,156 1,839,068
Europe Frankfurt 18,180 1,107 42.7 20,125,260 2,156 2,386,692 UK London 18,334 327 12.6 5,995,218 2,156 705,012
North America
Montana Billings
11,950 234 9 2,796,300 2,156 504,504
Middle East
Tehran 15,005 36 1.4 540,180 2,156 77,616
South Africa
Pretoria 12,272 36 1.4 441,792 2,156 77,616
Total - - 2593 100 32,041,486 - 5,590,508
As demonstrated in Table 5.4, to calculate the international T-km, the distance between
the capital city of the home country of each visitor (except Australia) and Auckland was
calculated and used as the international T-km. Since in Australia, just over half the pop-
ulation live in Sydney and Melbourne (Australian Government, 2010), the average dis-
tances between these cities and Auckland has been calculated and used as the interna-
Chapter 5: First case study – Otago Central Rail Trail
175 | P a g e
tional visitor distance from Australia. The flight distances between the international vis-
itors home countries and Auckland have been calculated using a Flight Distance Calcu-
• Distance between Upper SI and Middlemarch is calculated as the average of distances between Nelson and Middlemarch and Marlborough and Middlemarch.
• Average distance between Central Otago cities and OCRT.
OCRT visitors who come by car/van from Upper NI (Auckland) and Lower NI (Wel-
lington) (grey areas in Table 5.6) need to use the ferry to cross to the South Island. Dis-
tances between these places and Middlemarch are separated into three parts; home to
Wellington (except Wellington); Wellington to Picton by ferry; and Picton to Middle-
march (Table 5.6). Car visitors are here assumed to be 87% of total (8,000 out of 9,195
domestic visitors. The first scenario assumes that all OCRT visitors (9,195 total) come
by car (Table 5.6).However, according to Matthews only 87% of recreational travel is
Chapter 5: First case study – Otago Central Rail Trail
177 | P a g e
by car and in New Zealand 1% of people going on holiday are pedestrians (Matthews,
2009:13). In this study pedestrians have been ignored as the OCRT is far from the plac-
es of origin of visitors. Using Matthews’ break down of recreational travel in Table 5.5
as a basis, the second scenario assumes the remaining 13% of visitors are split so that
10% reach the OCRT trail by bus and the remaining 3% use domestic air travel (Table
5.7. a). All bus travel is assumed to be in the SI and the distances are calculated based
on the split shown for car travel in Table 5.6. Similarly, air travel is split proportionally
Auckland to Dunedin and Wellington to Dunedin.
Table 5.7.a : OCRT- domestic transport based on Mathews (2009:13) Type of transport
Car/van/driver/passenger road travel
Car/van/driver/passenger ferry travel
Bus Air domestic
% of total 87 10 3 Tourist-km 13,080,119 827,944 768,133 400,178 Number of visitors
8000 919 (395 Up-per SI; 423 Otago; 101
Invercargill)
276 (177 from Auckland,
2120km; 99 from Welling-ton, 1262 km)
These two scenarios will be used to work out the EF of domestic travel, to see the effect
of the assumptions made.
5.4.3. The Ecological Footprint (EF) of OCRT-Transportation
Table 5.8 shows that international and domestic transportation energy use of OCRT in-
ternational visitors (2011) is equivalent to 61,743,029 MJ or 61,743 GJ. The land to en-
ergy conversion capacity of New Zealand is assumed to be equivalent to 100 GJ/gha
(Field, 2011:11). As demonstrated in Table 5.8 the EF of OCRT transportation for in-
ternational visitors is equivalent to 61,743 GJ/ 100 GJ/gha= 617 gha.
5.4.3.1. Scenario 1 for Domestic Visitors
Using the same method, the EF of domestic visitors assuming that all travel is by car is
552 gha (Table 5.7.b)
Table 5.7.b: OCRT- domestic transport scenario 1 Transport mode Tourist-km MJ/passenger-km Total energy use per yr
by OCRT visitors (MJ) Car/van driver and passenger 15,034,620 3.1 (average) 46,607,322 Car-ferry 951,660 9.06 8,622,040 Total 55,229,362 EF for domestic travel 552gha
Chapter 5: First case study – Otago Central Rail Trail
178 | P a g e
5.4.3.2. Scenario 2 for Domestic Visitors
The EF of domestic visitors assuming that 87% come by car and the others use bus and
air travel, is 504 gha (Table 5.7.c)
Table 5.7.c: OCRT- domestic transport scenario 2
Transport mode Tourist-km MJ/passenger-km Total energy use per yr by OCRT visitors (MJ)
Car/van driver and passenger 13,080,119 3.1 (average) 40,548,369 Car-ferry 827,944 9.06 7,501,173 Bus 768,133 1.01 775,814 Air travel 400,178 3.88 1,552,691 Total 50,378,047 EF for domestic travel 504gha
Taking the larger result from the two domestic transport scenarios and adding it to the
international air travel gives the following result, as shown in Table 5.8. The total trans-
portation EF for international and domestic visitors is 1,169gha.
5.4.3.3. OCRT- Transport EF
Table 5.8: OCRT- transport EF
Transport mode Tourist-km Energy use MJ/passenger-km
Total energy use per yr by OCRT visitors (MJ)
Air international 32,041,486 1.25 (Boeing 747) 40,051,858 Air domestic (International visitors from Auckland to Dun-edin)
5,590,508 3.88 21,691,171
Sub total 61,743,029 EF international travel 617gha EF domestic travel 552gha Total transport EF 1169gha
What this demonstrates is 22% of OCRT visitors because they are international account
for 53% of the transportation EF, a not unexpected result.
5.5. OCRT: Food
The food EF of OCRT visitors is equal to the area which is needed to produce the food
consumed by tourists during their use of the OCRT. The four factors involved in this
assessment are: the number of OCRT visitors, average number of nights they stay dur-
ing their visit, food eaten out per visitor, and the EF of the consumed food per visitor.
Chapter 5: First case study – Otago Central Rail Trail
179 | P a g e
As shown in Figure 5.6, 11,788 visitors used the OCRT in 2011 and as Figure 5.7
shows, each tourist stayed an average of 3.6 nights. Thus, for this calculation the total
visitor nights for tourists coming to the OCRT are 42,437 visitor nights. Because of the
lack of local information, the food consumption data presented by Collins et al (2005)
are used to calculate the EF of food consumption for OCRT visitors.
This thesis uses two scenarios to calculate the EF of food consumed by OCRT visitors
in 2011. In the first method, the EF is calculated based on the assumption 100% of food
consumed is conventional food eaten out. In the second method, the total amount of
food eaten by OCRT visitors is separated into the two areas of local (home prepared)
food and conventional food. Comparison between the results of the two methods will
indicate the influence exerted by the use of home cooked food (as a cultural product) on
the EF and the Economic Footprint (ECF) of the OCRT.
5.5.1. The EF of OCRT Consumed Food—First Scenario
In the first scenario, the total amount of food eaten by OCRT visitors has been assumed
to have a footprint equivalent to that of food consumed outside the home by Cardiff res-
idents. This totals 67.04 kg per resident/yr (Collinset al, 2005:25) with a footprint of
0.429 gha/ resident (Collins et al, 2005:32). This means 1kg of food eaten out has an EF
of 0.429/67.04 gha/kg=0.006 gha/kg. The average amount of food eaten by a Cardiff
resident each day is 1.85 kg, and this value has been used for visitors to OCRT. The re-
sults are shown in Table 5.9. The EF of tourist food is equivalent to 1.85×0.006=0.01
gha/visitor night (Table 5.9). The total ecological footprint of food consumed by OCRT
visitors is equivalent to 42,437×0.01=424.4 gha and the EF of food consumed by ORCT
visitors/visitor is equivalent to 424.4/11,788=0.036 gha (Table 5.9)
Table 5.9: EF of food consumed by OCRT visitors (2011) Item Data Reference
OCRT visitor numbers (2011) 11,788 Average visitor nights/ visitor 3.6 Total visitor nights 42,437 EF of food eaten out gha/cap 0.429 Collins et al, 2005:32 EF of tourist food gha/visitor night
0.01
Total EF of food consumed by OCRT visitors (gha)
424.4 (gha)
EF of food consumed by OCRT visitors/visitor(gha)
0.036 (gha/visitor)
Chapter 5: First case study – Otago Central Rail Trail
180 | P a g e
5.5.2. The EF of OCRT Consumed Food—Second Scenario
This thesis explores the local products (such as food, beverages, and wine) offered to
OCRT visitors by the 783 separate accommodation services available with their 5,543
bed spaces. These accommodation services are located along the OCRT from Middle-
march to Clyde (Appendix5).This information has been collected through the use of the
official website of the OCRT and by referring to the 201 websites belonging to each ac-
commodation service, which are accessed through the OCRT website (Appendix5). The
information related to OCRT products and activities arising from Appendix5 is summa-
rised and set out in Appendix7. This appendix is used as the base to develop the related
figures and Table s about OCRT locally produced food used in the following part of this
section.
Figure 5.14 and Table 5.10 demonstrate that in 2011, 234 separate OCRT accommoda-
tion services offered local produce in four identifiable categories. Of these, 56.40% of-
fered home baking and local food and beverages to their visitors, followed by 39.3%
offering locally produced alcoholic drinks, 3.4% local grazing (for horses) and 0.9%
local art works and crafts.
Table 5.10 shows that 132 OCRT accommodation services (16.9 % of the total 783
OCRT accommodation services) make available local and home baked foods. As a re-
sult an equivalent 937 (16.9% of 5,543) bed spaces serve local food to their users. As
0.00%
10.00%
20.00%
30.00%
40.00%
50.00%
60.00%
Local foods and beverages
Alcoholic drinks
Art works and crafts
Grazing
Perc
enta
ge o
f acc
omm
odat
ion
serv
ices
Figure 5.14: OCRT- Frequency of local produce offered by accommodation services to visitors (2011).
Chapter 5: First case study – Otago Central Rail Trail
181 | P a g e
discussed above, in 2011 total visitor nights were equivalent to 11,788 (OCRT visitors ×
3.6 (average visitor nights/visitor – see Figure 5.7) = 42,437. As the number of total
available bed spaces of the OCRT is 5,543 bed spaces, consequently, the average num-
ber of visitor nights per bed space is 42,437 (total visitor nights) / 5,543 (total bed
spaces) = 7.7 (visitor nights / bed space).
It should be remembered that 3.6 (average visitor nights/visitor) is a number that in-
volves two factors, the number of OCRT visitors and the number of nights that they stay
in OCRT. But 7.7 (visitor nights/bed space) is a number that indicates the time that each
of the bed spaces is used based on total visitor nights. If the total numbers of bed spaces
were equal with the total number of visitors, both average visitor nights/visitor and av-
erage visitor nights/ bed space would be equal, but that does not happen in OCRT. As a
result, the total visitor nights that visitors use local foods are 937 (bed spaces available
in establishments which offer local food) × 7.7 (nights per bed space) = 7,215.
Table 5.10: OCRT- local produce (summary)
Produce F % of 783 accommodations ser-vices
Bed spaces Visitor nights1
Local food and beverage 132 16.9 937 7,215 Alcoholic drinks 92 11.7 649 4,997 Art works and crafts 2 0.3 17 131 Grazing (for those doing OCRT on horseback)
8 1 55 424
Total 234 29.9 1,658 12,767 1. Average visitor nights/ bed space = 42,437 (total visitor nights) / 5,543 (total bed spaces) = 7.7
As shown in Appendix 5, all OCRT accommodation services that produce local and
home cooked foods use productive gardens and local farm produce as their main
sources when preparing such food. Assuming that OCRT local foods are the equivalent
of organic food, it is possible to compare the EF of local and conventional food con-
sumed by OCRT visitors.
The difference between The EFs of conventional and organic foods arises from the en-
ergy used to produce and process these types of food. Collins and Fairchild (2009:11)
argue that the ecological footprint for food and drink consists of two main components:
‘real land’ requirements (i.e. crop, pasture, sea) and ‘energy land’. “The former relates
to the area of land required to rear and grow food produce, the latter relates to the em-
bodied energy required for food production and its processing.” (Collins and Fairchild,
2009:11). Due to a lack of information, Collins and Fairchild (2009) assume the real
Chapter 5: First case study – Otago Central Rail Trail
182 | P a g e
land for conventional and organic foods is equal. They (2009:15) argue that since the
production of conventional food is more energy intensive than the production of organic
food it consequently has a bigger EF than organic food.
Table 5.11 indicates that in comparison with conventional food, organic food has a 40
% (0.52gha) lower EF.
Table 5.11: The effect on footprint of consuming food from 100% organic sources.
100% conventional 100% organic Ecological footprint of food (gha/person)
1.315 0.799
Ecological footprint of transport-ing food (gha/person)
0.022 0.022
Total ecological footprint 1.337 0.817 • Reference: Collins et al, 2005: 36
Consequently, this study uses 60% of the EF of conventional food (0.429gha/cap) as the
EF of local and home baked food (0.254gha/cap) to calculate the whole EF of OCRT
food in 2011 (Table 5.12). The EF of 1 kg home cooked food is equivalent to 0.254/
67.04 (eaten out food/resident/year in Cardiff) = 0.0037 gha/kg (Table 5.12). Table 5.10
shows that 132 OCRT accommodation services with the capacity of 937 bed spaces of-
fered local food to their visitors. The total visitor nights those OCRT visitors consumed
local food is 7,215 (Table 5.10). The EF of OCRT local food is equivalent to 0.0068
gha/ visitor night (0.0037 gha/ kg × 1.85 kg) and the total EF of OCRT local food per
year is equivalent to (7,215 visitor nights × 0.0068 gha/ visitor night) or 49 gha (Table
5.12). The number of visitor nights when OCRT visitors consumed conventional food is
35,222 visitor nights (42,437 total OCRT visitor nights – 7,215 visitor nights when local
food is consumed). The EF of OCRT conventional food is 352.2 gha (Table 5.12).The
total EF of OCRT local and conventional food as shown in Table 5.12 is 401.2 gha.
Table 5.12: Ecological footprint of home cooked and conventional foods consumed by OCRT visitors
(2011) Home cooked and local food EF Conventional food EF EF of local food gha/cap 0.254 EF of 1 kg conventional food eaten out
(gha/cap) 0.429
EF of 1 kg local food gha/kg 0.0037 EF of tourist food (gha/visitor night) 0.01 EF of local food gha/ visitor night 0.0068 EF of local food of 7,215 visitor nights (gha)
49 Total EF of consumed conventional food by OCRT visitors/ 35,222 visitor nights (gha)
352.2
Total EF of home cooked and conventional foods 401.2
Chapter 5: First case study – Otago Central Rail Trail
183 | P a g e
5.5.3. Environmental Effects of Using Local Food
Comparing the results of the two scenarios shows that producing 17% of OCRT food
locally reduces the total EF of food by 23.2 gha (5.5% of 424.4 gha) (Table 5.13).
Table 5.13: The effect of consuming home cooked food on ecological footprint of food consumed by
OCRT visitors (2011) 100% conventional eaten
out food 83% conventional eaten out food and
17% home cooked (organic) food OCRT EF of food 424.41 401.22
Reduction in EF of food con-sumed by OCRT visitors (gha)
This research categorises the total number of 783 OCRT accommodation services into
seven categories; self-contained (SC), bed and breakfast (B&B), backpacker (Bp), mo-
tel, homestead, hotel and camping. Again categories have been derived through using
the official web site of OCRT and 210 related accommodation services websites (Ap-
pendix 5 and 6). Table 5.14 summarises the parts of Appendix 5 that address available
bed spaces by types of accommodation service.
As shown in Table 5.14, in 2011, of the total 783 separate accommodation services the
majority or 71.1% are camping sites followed by 11.8% SC and 8.5% B&B. There are
small numbers of other types of OCRT accommodation services including Bp, motel,
homestead, and hotel in the range of 1.5- 4.2% of total (Table 5.14).As shown in Table
5.14 the majority of available bed spaces are in camping sites (59.8%) followed by 12%
motel, 9.8% B&B and 9.2% SC. Other types of OCRT accommodation services includ-
ing, Bp, homestead and hotel hold between 0.5 – 6.2% of available bed spaces (Table
5.14 and Figure 5.15).
Chapter 5: First case study – Otago Central Rail Trail
184 | P a g e
Table 5.14. OCRT types of accommodation services (2011) Type Number of
type % Available bed spaces %
SC1,4 92 11.8 510 9.2 B&B2 66 8.5 541 9.8 Bp3 12 1.5 136 2.5 Motel5 33 4.2 665 12 Homestead 4 0.5 28 0.5 Hotel6 19 2.4 346 6.2 Camping 557 71.1 3,317 59.8 Total 783 100 5,543 100 1. SC: Self contained 2. B&B: Bed and breakfast 3. Bp: Backpacker 4. Capacity of 1 unknown SC accommodation service is calculated as average bed spaces of all SC = 6 5. Capacity of 1 unknown motel is calculated as average bed spaces of all motels = 20 6. Capacity of 1 unknown hotel is calculated as average bed spaces of all hotels = 18
5.6.2. Quality of OCRT Accommodation Services
According to the information shown in Appendix5 and summarised in Table 5.15 this
study qualitatively classifies OCRT accommodation services into the two types of new
(NB) and refurbished (RB) buildings.
0.00%
10.00%
20.00%
30.00%
40.00%
50.00%
60.00%
70.00%
80.00%
Number of type
Avilable bed spaces
Figure 5.15: OCRT- Percentage of type and available bed spaces by types of ac-commodation services.
Chapter 5: First case study – Otago Central Rail Trail
185 | P a g e
Table 5.15:OCRT- Refurbished (RB) and new buildings (NB) used as accommodation services and their capacity
Type TNA %1 RB %1 NB %1 Capacity
RB NB C %2 C %2
SC 92 11.8 30 3.8 b
7.9 159 2.9 351 6.3
B&B 66 8.5 22 2.8 44 5.6 159 2.9 382 6.9 Bp 12 1.5 4 0.5 8 1 53 1 83 1.5 Motel 33 4.2 1 0.1 32 4.1 22 0.4 643 11.6 Homestead 4 0.5 3 0.4 1 0.1 22 0.4 6 0.1 Hotel 19 2.4 18 2.3 1 0.1 298 5.4 48 0.9 Camping 557 71.1 - - 557 71.1 - - 3317 59.8 Total 783 100 78 10 705 90 713 12.9 4830 87.1 1. The percentages of the number of renewed/historic and new constructed buildings are calculated based on
total number of accommodation services (n=783). 2. The percentages of the capacities of renewed/historic and new constructed buildings are calculated based on
total capacity of OCRT accommodation services (5543 bed spaces). • TNA= Total Number of Accommodation Services of the Type. • RB= Refurbished Buildings used as accommodation services. • NB= New Buildings used as accommodation services. • C=Capacity
In OCRT, RB accommodation services cover a range of historical and restored build-
ings with different original functions, but currently all of them are used for visitor ac-
commodation. Table 5.15 shows the number and percentage of NB and RB buildings
used as accommodation services in the OCRT. Moreover, this table demonstrates the
number and percentage of available bed spaces of NB and RB OCRT accommodation
services by type. As shown in Table 5.15 and Figure 5.16, of 781 OCRT accommoda-
tion services, only 10% are RB and 90% are NB.
Table 5.15 and Figure 5.17 show that of all OCRT available bed spaces 12.9% are RB
and 87.1% are NB.
Chapter 5: First case study – Otago Central Rail Trail
186 | P a g e
Figure 5.18 and Table 5.15 indicate that of the 10% (78) RB accommodation services,
the majority or 3.8% of total (30) are SC, followed by 2.8% (22) B&B, and 2.3% (18)
hotel. Other RB types of accommodation including Bp, motel, homestead and camping
only make up 0-0.5% of total. Moreover as shown in Figure 5.18 and Table 5.15, of
90% of total (705) NB accommodation services, the majority or 71.1% (557) are camp-
10%
90%
0.00%
10.00%
20.00%
30.00%
40.00%
50.00%
60.00%
70.00%
80.00%
90.00%
100.00%
Num
ber o
f Use
rs
Total number of accommodation services = 783
RB
NB
12.90%
87.10%
0.00%
10.00%
20.00%
30.00%
40.00%
50.00%
60.00%
70.00%
80.00%
90.00%
100.00%
Num
ber o
f Use
rs
Total Capacity of Accommodation services = 5,543
RB
NB
Figure 5.17: OCRT- RB and NB accommodation services – available bed spaces (2011)
Figure 5.16: OCRT- RB and NB buildings used as accommodation services
Chapter 5: First case study – Otago Central Rail Trail
187 | P a g e
ing sites (powered and non-powered) followed by 7.9% (62) SC, 5.6% (44) B&B and
4.1% (32) motel. Other NB types of accommodation services including B&B, Bp and
hotel only make up 0.1-1 % of total (Figure 5.18 and Table 5.15).
Table 5.15 and Figure 5.19 indicate that of the 12.9% (713 out of 5,543) RB available
bed spaces, the majority 5.4% are found in the hotel category, while 5.8% of total are
equally divided between SC and B&B (2.9% each type). Other RB bed spaces including
Bp, homestead, motel and camping sites only make up 0-1% of total (Table 5.15 and
Figure 5.22: OCRT- SC accommodation services- energy source, facilities and spaces (2011)
El: Electricity So: Solar system TV (S): Shared TV TV (P): Private TV Int: Internet V/B (S): Shared veranda/ balcony V/B (P): Private veranda/balcony Outdoor sitting (S): Shared outdoor sitting Outdoor sitting (P): Private outdoor sitting
Chapter 5: First case study – Otago Central Rail Trail
193 | P a g e
spaces including 50 (9.8%) RB and 73 (14.3%) NB have access to shared and private
outdoor sitting areas (Figure 5.22 and Appendix16).
5.6.4.2. OCRT B&B Accommodation Services: Energy Sources, Facilities and
Open Air Spaces (2011)
Figure 5.23 and Appendix16 demonstrate that of 541 B&B bed spaces 499 (82.7%) use
electricity for heating. As shown in Figure 5.23 and Appendix16, 356 (65.8%) of these
499 bed spaces are NB and 143 (26.4%) are RB. In addition, of 136 (25.1%) B&B bed
spaces 66 (12.2%) RB and 70 (12.9%) NB use logs, again showing refurbished build-
ings are more likely to use wood as an energy source. Of the remaining 37 B&B bed
spaces 5 (0.9%) RB and 32 (5.9%) NB use gas for heating.
Figure 5.23 and Appendix 16 indicate that 12 (2.2%) NB of 541 B&B bed spaces have a
solar water heating system. For equipment, 353 (65.2%) of 541 B&B bed spaces have
TV (shared and private) made up of 85 (15.7%) RB and 268 (49.5%) NB bed spaces
(Figure 5.23 and Appendix 16).
As demonstrated in Figure 5.23 and Appendix16, 182 (33.6%) B&B bed spaces are
equipped with the Internet including 23 (4.2%) RB and 159 (29.4%) NB, again showing
refurbished buildings are less likely to have the Internet. For outdoor space, 38 (7.2%)
OCRT B&B bed spaces comprising18 RB and 20 NB have 6 verandas and balconies
Table 5.17 presents the calculated occupancy rates of Central Otago accommodation
services (2010 and 2011) as published by New Zealand Statistics (2011:5). This table
determines the occupancy rate of motels/apartments at 43.1% and holiday parks at
10.1% in 2010. Moreover, the overall occupancy rate of accommodation services in-
cluding holiday parks in 2010 is estimated to be 14.9%. In addition total occupancy rate
of types of accommodation services excluding holiday parks is estimated to be 31%.
(Table 5.17).The “occupancy rates excluding holiday parks are included because the
capacity of holiday parks can distort total occupancy rates”. (New Zealand Statistics,
2011:5).
The occupancy rate of Central Otago motels dropped to 41.1% in 2011. In addition, as
shown in Table 5.17, the occupancy rate of Central Otago holiday parks also dropped
from 10.1% to 9.4% in 2011. The overall occupancy rates of Otago Central accommo-
dation including holiday parks and excluding holiday parks dropped to 14.3% and
30.4% respectively in 2011 (Table 5.17).
0.00%
10.00%
20.00%
30.00%
40.00%
50.00%
60.00%
70.00%
80.00%
90.00%
100.00%
NB RB
Perc
enta
ge o
f bed
spa
ces EL
Log
Gas
So
TV
Internet
Outdoor sitting
Figure 5.30: Comparison between OCRT- NB and RB accommodation bed spaces in terms of energy sources, facilities and open air spaces
Chapter 5: First case study – Otago Central Rail Trail
201 | P a g e
Table 5.17: Central Otago accommodation variables by accommodation type and year Occupancy rates (1) (%)
Type of accommodation Annual Year ended
September 2010 September 2011 Hotels2 C C Motel2/ apartments 43.1 41.1 Backpackers2 C C Holiday parks2 10.1 9.4 Total2 14.9 14.3 Total excluding holiday parks2.
31 30.4
1. Occupancy rates are calculated as the ratio of visitor occupied unit nights to monthly capacity 2. Hotels: includes both hostels and resorts 3. Motels: includes motor inns, apartments and motels. 4. Backpackers: includes Backpackers/hostels 4. Holiday parks: includes Caravan parks/camping grounds C to be calculated • Reference: Statistics New Zealand, Central Otago, September 2011:5
Since the occupancy rates of Central Otago hotels, backpacker, self-contained and
homestead accommodation are not available in New Zealand Statistics (2011), to obvi-
ate this shortage of information, this study uses the occupancy share of OCRT accom-
modation services in 2005, from Department of Conservation (DOC) (June 2011) as
shown in Table 5.18.
Table 5.18 indicates that the occupancy share of hotel/ motel in OCRT is 32% followed
by B&B (27%), motor home/ camping (24%), backpackers (14%) and own home/ holi-
day home/ friends and relatives (3%).
Table 5.18: OCRT- Occupancy share by type of accommodation service
Types % of visitor nights (2005)1 Hotel/Motel 32 B&B 27 Motor home/Camping 24 Backpackers 14 Own home/Holiday home/friends and relatives 3 Total 100 1. Reference: OCRT, 2005:10 • Total visitor numbers in 2005= 8,923 (Department of Conservation, June 2011)
This thesis uses the occupancy share cited in Table 5.18 to measure the occupancy of all
OCRT accommodation types in 2011. The occupancy share of hotel/motel which is
32% in 2005 (Table 5.18) is separated into the two occupancy shares of hotel (10.9%)
and motel (21.1%) in 2011(Table 5.19) based on the following discussion.
Chapter 5: First case study – Otago Central Rail Trail
202 | P a g e
As indicated in Table 5.14, in 2011 the OCRT motels and hotels contain 665 and 346
bed spaces respectively, making 1011 in total. In 2011, the 665 OCRT motel bed spaces
comprise 65% of total (1011) motel/hotel bed spaces. In addition, 346 OCRT hotel bed
spaces make up 34.2% of total (1011) motel/hotel-bed spaces in 2011. This study uses
these proportions to divide the 32% occupancy of motel/hotel (cited in Table 5.18) into
the two occupancy shares of 21.1% (65% of 32) motel and 10.9% (34.2% of 32) hotel
Type of accommodation service % of visitor nights (2005)
Visitor nights (2011)
Available bed spaces
100% occu-pancy per year1
SC 13.1 5,559 510 186,150 B&B 13.9 5,899 541 197,465 Bp 14 5,941 136 49,640 Motel 21.1 8,954 665 24,2725 Homestead 3 1,273 28 10,220 Hotel 10.9 4,626 346 126,290 Camping 24 10,185 3,317 1,210,705 Total 100 42,437 5,543 2,023,195 1. 100% occupancy rate of each type of accommodation service / year= number of available bed spaces × 365 (days)
Since this thesis uses the occupancy shares of OCRT accommodation services proposed
by Department of Conservation (2011- see Table 5.18) as basic data in which the occu-
pancy share of the OCRT self-contained accommodation services is not included, the
occupancy share of SC accommodation service in 2011 is calculated through the fol-
lowing discussion.
As demonstrated in Table 5.18, the occupancy share of B&B accommodation services is
27% in 2005. This research makes this assumption that in 2005 B&B occupancy share
contains both occupancy shares of B&B and SC accommodation services. Based on this
assumption, the 27% occupancy of B&B accommodation in 2005 (see Table 5.18) is
divided into the two portions of B&B and SC occupancy shares according to the per-
centage of their available bed spaces in 2011 through the following explanation.
As shown in Table 5.14, OCRT SC and B&B accommodation services comprise respec-
tively 510 (48.5%) and 541(51.5%) of the total 1051 (510 +541) SC/B&B bed spaces in
2011. This thesis divides the 27% occupancy share of B&B accommodation calculated
Chapter 5: First case study – Otago Central Rail Trail
203 | P a g e
in 2005 (see Table 5.18) into the two portions of 13.1% (48.5% of 27) SC and 13.9%
(51.5% of 27) B&B accommodation (Table 5.19).
Furthermore, the occupancy share of OCRT homestead accommodation in 2011(3%) is
assumed as equal to own home/holiday home/friends and relatives occupancy share cal-
culated in 2005 (Tables 5.18 and 5.19). The total of OCRT visitor nights (42,437) is
multiplied by the occupancy share of each type of accommodation services to calculate
their related visitor nights (Table 19).
5.6.6. OCRT Accommodation Services: Area
This chapter calculates the areas of a representative sample of 41 of the OCRT accom-
modation services buildings (21RB and 20NB) made up of 10 SCs, 13 B&Bs, 4Bps, 5
motels, 2 homesteads and 7 hotels and their area per bed space (m2) to calculate an av-
erage area per bed space for each type of accommodation service used in OCRT (Ap-
pendix18). The area of each of the 41 accommodation services is calculated using Map
Tool2 for floor area calculation and scaled elevation based on information published in
the websites and satellite Google Maps.
The resulting information shown in Appendix 18 is summarised in the following Table
5.20 determines the capacity (C), floor area and area per bed space of the chosen types
of OCRT accommodation and their numbers. As shown in Table 5.20, the largest area
of building per bed space is in B&B at 40m2 followed by a similar group of just under
30m2/bed (29.5m2/bed SC, 29.4 m2/bed homestead, and 29.1 m2/bed hotel), with a
smaller area of 16.9 m2/bed for motel and, as might be expected, the lowest area of 12
m2/bed for Bp.
Table 5.20: OCRT- average area per bed by type of accommodation (2011) Category No. C Floor space m2 Area per Bed m2 SC 10 61 1,817 29.5 B&B 13 93 3,436 40 Bp 4 58 697 12 Motel 5 166 2,812 16.9 Homestead 2 353 12 29.4 Hotel 7 156 4,538 29.1 Camping1 - - - 6 Total 41 887 13,312 - 1. The average area of camping sites is assumed 6m2 per bed space
Chapter 5: First case study – Otago Central Rail Trail
204 | P a g e
Table 5.21 shows the average area, number of bed spaces and total area of each type of
OCRT accommodation service and whether they are NB or RB (called here quality or
Q). In this table the area of each type of accommodation services is calculated as its av-
erage area/bed space multiplied by the number of bed spaces.
Comparing the areas of types of NB OCRT accommodation services, camping sites
comprise the majority or 19,902 m2 followed by B&B (15,280m2), motel (10,866.7m2)
and SC (10,354.5m2) (Table 5.21). Other types of NB accommodation services includ-
ing Bp, hotel and homestead contain areas in a range of 176.4-1,396.8 m2 (Table 5.21).
In addition, RB hotels contain the largest RB area of 8,671m2 followed by B&B (6,360
m2) and SC (4,690.5 m2). The areas of other refurbished accommodation services in-
cluding Bp, hotel and homestead are between 371.8- 646.8 m2 (Table 5.21).
Table 5.21: OCRT- area of accommodation services by type and quality Category Q Average area/bed
space (m2) Bed space Area (m2)
SC NB 29.5 351 10,354.5 RB 29.5 159 4,690.5
B&B NB 40 382 15,280 RB 40 159 6,360
Bp NB 12 83 996 RB 12 53 636
Motel NB 16.9 643 10,866.7 RB 16.9 22 371.8
Homestead NB 29.4 6 176.4 RB 29.4 22 646.8
Hotel NB 29.1 48 1,396.8 RB 29.1 298 8,671.8
Camping site NB 6 3,317 19,902 RB - 0.00 -
Total - - 5,543 80,350
The total area of OCRT NB accommodation services is 58,972 m2 and RB accommoda-
tion is 21,378 m2, making a total of 80,350 m2 (Table 5.22.).
Table 5.22: OCRT- area of accommodation services by quality Quality of buildings Area (m2)
NB buildings 58,972 RB buildings 21378
Total 80,350
Chapter 5: First case study – Otago Central Rail Trail
205 | P a g e
5.6.7. OCRT Accommodation Services: Occupied Area
Table 5.23 demonstrates that OCRT B&B accommodation services have the largest oc-
cupied area of 235,960 m2, followed by SC (163,990 m2), motel (151,322.6 m2) and ho-
tel 134,616.6 m2. Bp and homestead contain smaller areas at 71,292 m2 and 37,426.2 m2
respectively (Table 5.23).The occupied area (m2/year) of each type of accommodation
as shown in Table 5.23 is calculated through the following steps:
Occupancy share of each type × Total OCRT visitor nights = Visitor nights of each type
Visitor nights/year × Area/bed (m2) = Occupied area (m2)/year
5.6.7.1. Example: SC Occupied Area (m2) / year (2011)
Plumbing 170 9% 170 6% Finishes 210 12% 160 6% Total 1,810 100% 2,640 100% 1. 30% of walls covered by windows (Mithraratne et al, 2007: 154) • Reference: Mithraratne et al, 2007: 159 Table 5.26 contains the calculated embodied energy of OCRT accommodation services
by types of construction through the measurement of the embodied energy of wall, roof,
floor and foundation as used in each type of construction.
a. 1. OCRT Accommodation Services with Timber Structure: Embodied Energy
As shown in Table 5.26, the embodied energy of walls (30% covered by windows),
roofs, floors and foundations used in an OCRT timber structure are assumed to have
equal GJ/m2 (and MJ/m2 embodied energies) to the light construction in Table 5.25.
a. 2. OCRT Accommodation Services with Timber and Masonry Structure: Em-
bodied Energy
Table 5.26 determines that OCRT timber and masonry type of construction uses timber
frame, brick veneer for walls, timber frame for roofs and floors, and light foundations.
The embodied energy for OCRT timber frame and brick veneer wall (Table 5.26) is as-
sumed to be equal with the embodied energy for heavy construction walls (30% covered
by windows) cited in Table 5.25 (0.82 GJ/m2). Furthermore, the embodied energy for
roofs and floors (Table 5.26) are assumed to be equal with the embodied energy for
heavy construction roofs and floors in Table 5.25.\ (0.34 GJ/m2 and 0.74 GJ/m2 respec-
tively).
Chapter 5: First case study – Otago Central Rail Trail
209 | P a g e
Table 5.26: Initial embodied energy intensities for OCRT- accommodation services by type of construction. Type of con-struction
Brick mixed with other ma-terials (old technology)
Brick2 3.9 Timber frame (light con-struction)
0. 4 Heavy con-
struction
0.74 Heavy con-struction.
0.08
Brick mixed with other ma-terials (new technology)
Brick (0.35 m wide ×3m high)
1.8 Timber frame (light con-struction)
0.4 Heavy con-
struction
0.74 Heavy con-struction.
0.08
Stone3 (local) Stone (0.4m wide ×3m high)
0.36 Timber frame (light con-struction)
0.4 Heavy con-
struction
0.74 Heavy con-struction.
0.08
Stone3 (im-ported)
Stone (0.4m wide ×3m high)
5.75
Timber frame (light con-struction)
0.4 Heavy con-
struction
0.74 Heavy con-struction.
0.08
Concrete4 Ready mixed concrete ( 0.2m wide×3m high
1.93 Timber frame (light con-struction)
0.4 Heavy con-
struction
0.74 Heavy con-struction.
0.08
1. Mud brick wall 0.35m wide and 3m high in 100m2 building (only exterior walls calculated) = 40.5 m3 = 0.4 m3/m2 2. Brick wall 0.35m wide and 3m high in 100m2 building (only exterior walls calculated) = 40.5 m3= 0.4 m3/m2 3. Stone wall 0.4m wide and 3m high in 100m2 building (only exterior walls calculated) = 46.1 m3 = 0.46 m3/ m2 4. Concrete wall 0.2m wide and 3m high in 100m2 building (only exterior walls calculated) = 23.5 m3 = 0.2 m3/ m2 *Reference: Australia’s guide to environmentally sustainable homes. www.yourhome.gov.au/technical/fs52.html
a. 3. OCRT Accommodation Services with Mud Brick Structure: Embodied En-
ergy
As shown in Table 5.26, the type mud brick (mixed with other materials) uses mud
brick walls the embodied energy of which is calculated through the following steps:
1. Embodied energy of mud= 0.0016 MJ/kg (Chel and Tiwari, 2009:1968)
2. The weight of 1m3 mud packed = 1, 906 kg (www. simetric.co.UK)
3. Embodied energy of 1m3 mud packed = 1,906 × 0.0016 = 3.05 MJ/m3= 0.003 GJ/m3
4. Mud brick wall 0.35m wide and 3m high in 100 m2 building (exterior walls only)
and assuming windows occupy 30% of total area of exterior walls (36 m2 of 120
m2) = 27.9 m3 = 0.28 m3/m2
5. Embodied energy of mud brick wall 0.35 m wide and 3 m high in 100 m2 building
assuming windows occupy 30% of total area of exterior walls (36 m2 of 120 m2) =
In Table 5.26, the embodied energy of roofs in OCRT concrete construction is assumed
equal with the embodied energy of light construction roofs (0.4 GJ/m2) in Table 5.25.
Furthermore, in this type of OCRT construction, the embodied energy for floors and
foundations are assumed equal with the embodied energy for heavy construction floor
and foundation (0.74 GJ/m2 and 0.08 GJ/m2) in Table 5.25.
a. 9. OCRT Accommodation Services: Embodied Energy Summary
Using the results from Table 5.26, the integrated embodied energy of wall, roof, floor
and foundations used in each type of OCRT accommodation is presented in Table 5.27
and Figure 5.30.a. As revealed, imported stone construction has the largest embodied
energy of 6.97 GJ/m2 and a timber structure has the lowest embodied energy at 1.1
Chapter 5: First case study – Otago Central Rail Trail
214 | P a g e
GJ/m2. The embodied energy of other types of OCRT constructions are in the range of
1.4–5.12 MJ/m2.
Table 5.27. Embodied energy of OCRT- types of construction (2011)
Type of building structure Embodied energy use (GJ/m2) Timber 1.1 Timber and masonry 2.04 Mud brick (mixed with other materials) 1.4 Brick1 mixed with other materials (old technology) 5.12 Brick1 mixed with other materials (new technol-ogy)
Mud brick (mixed with other materials) Brick mixed with other materials (old technology) Brick mixed with other materials (new technol-ogy) Stone (local)
Stone (imported)
Concrete
Figure 5.30.a: Embodied energy of OCRT- types of construction (2011)
Chapter 5: First case study – Otago Central Rail Trail
215 | P a g e
Table 5.28: Mean energy intensities for various accommodation categories Category Energy use (MJ/m2/year) Energy use per visitor night
Brick mixed with other materials (old tech-nology)
5.12 177 18.1 0. 3 23 6.9 25 0.25
Stone (local) 1.58 590 18.6 0. 3 77 23.1 41.7 0.42 Concrete - - - - - - - - Total 382.4 582.5 964.9 9.65 1. See Table 5.24 • Occupancy rate of OCRT SC = 13.1% (see Table 5.17) • Area per bed space = 29.5m2 (see Table 5.18)
Chapter 5: First case study – Otago Central Rail Trail
218 | P a g e
the largest operating energy use of 375.3 GJ/year and 573.3 GJ/year life cycle energy
(based on a 50 year life) followed by timber and masonry (282 and 557.8 GJ/year) and
brick mixed with other materials (83.4 and 288.2 GJ/year). Other types of B&B con-
struction have operational and life cycle energy between (43.7 and 72.5 GJ/year) – (61.8
and 108.6 GJ/year).
Comparing the EF of B&B construction types, timber has the largest EF (5.73gha) fol-
lowed by timber and masonry (5.6gha) and brick mixed with other materials (2.9gha)
(Table 5.30). The annual EF of other types of B&B construction including mud brick
(mixed with other materials), concrete and local stone are between 0.73 and 1.4 gha.
The total life cycle energy and EF of OCRT B&B accommodation services are 1,743
GJ/year and 17 gha /year (Table 5.30).
Table 5.30: OCRT- Life cycle energy use of B&B accommodation services (2011) Material Embod-
Brick mixed with other materials (old tech-nology)
5.12 2000 204.8 0.3 278 83.4 288.2 2.9
Stone (local) 1.58 1480 46.8 0.3 206 61.8 108.6 1.1 Concrete 3.15 1360 85.7 0.3 189 56.7 142.4 1.4 Total 840.2 859.2 1,743 17 1. See Table 5.24 2. Occupancy rate of OCRT B&B = 13.9% (see Table 5.17) 3. Area per bed space = 40m2 (see Table 5.18) c. 3. BP Accommodation Services: Life Cycle Energy Use and EF
As shown in Table 5.31 Bp timber and timber mixed with masonry construction equally
account for the largest floor area of 1,296 m2 (648 m2 each) followed by brick mixed
with other materials (216 m2). Other type of constructions including mud brick (mixed
with other materials) and local stone occupy smaller areas of 48 and 72 m2 respectively
(Table 5.31).
Chapter 5: First case study – Otago Central Rail Trail
219 | P a g e
Table 5.31 indicates that the 648 m2 of Bp timber and masonry construction have the
largest embodied energy of 26.4GJ/year, followed by brick mixed with other materials
(22.1GJ/year) and timber (14.3GJ/year). Other types of B&B constructions including
mud brick (mixed with other materials) and local stone account for 2GJ/year and
1.5GJ/year respectively (Table 5.31).
As shown in Table 5.31, in comparison with other types of Bp construction, timber and
timber mixed with masonry have the largest occupied area of 182 m2 (91m2 each). Other
types are smaller with brick mixed with other materials (30 m2), mud brick mixed with
other materials (10m2) and local stone (7 m2). Likewise, Bp timber and timber mixed
with masonry constructions account for the largest value of operating energy at 111
GJ/year (each uses 55.5 GJ/year). Other types of Bp construction including mud brick
(mixed with other materials), brick (mixed with other materials) and local stone have
operational energy values of between 4.27 and 18.3 GJ/year (Table 5.31).
In comparison with other types of Bp construction, the timber and masonry type has the
largest life cycle energy of 81.6 GJ/year, followed by timber (69.8 GJ/year), brick
mixed with other materials (40.4 GJ/year), mud brick mixed with other materials (8.1
GJ/year) and local stone (5.77 GJ/year) (Table 5.31).
Comparing the EFs of Bp constructions, timber and masonry has the largest EF (0.8
gha) followed by timber (0.7 gha) and brick mixed with other materials (0.4 gha), mud
brick mixed with other materials (0.008 gha) and local stone (0.06gha). The total life
cycle energy and EF of OCRT Bp accommodation services are 205 GJ/year and 2.05
gha /year respectively (Table 5.31).
Chapter 5: First case study – Otago Central Rail Trail
220 | P a g e
Table 5.31: OCRT- life cycle energy use of Bp accommodation services (2011) Material Embodied
Brick1 mixed with other mate-rials (old technology)
5.12 216 22.1 0.61 30 18.3 40.4 0.4
Stone (lo-cal)
1.58 48 1.5 0.61 7 4.27 5.77 0.06
Concrete 3.15 - - 0.61 - - - - Total 66.3 139.67 205 2.05 1. Occupancy rate of OCRT-Bp = 14% (see Table 5.17) 2. Area per bed space = 12m2 (see Table 5.18) c. 4. OCRT Motels: Life Cycle Energy Use and EF
As shown in Table 5.32 timber construction forms the largest single area of motels at
6,033 m2 followed by timber and masonry (2,755 m2), and concrete (1,335 m2). Other
types of construction are brick (mixed with other materials) and local stone and these
occupy areas of 744 and 372 m2 (Table 5.32).
Table 5.32 indicates that motel timber construction accounts for the largest embodied
energy value of 132.7 GJ/year (6,033 m2 ×1.1 GJ/ m2/ 50 years/ 50), followed by timber
Concrete 3.15 1,335 84.1 0.25 282 70.5 154.6 1.5 Total 417.2 592.6 10.1 1. Occupancy rate of OCRT-Motel = 21.1% (see Table 5.17) 2. Area per bed space = 16.9 m2 (see Table 5.18) c. 5. OCRT Homestead: Life Cycle Energy Use and EFAs shown in Table 5.33
homestead accommodation in local stone construction contains the largest area of 470
m2 followed by timber and mud brick (mixed with other materials) each with 179 m2.
Chapter 5: First case study – Otago Central Rail Trail
222 | P a g e
Table 5.33 shows that homestead stone construction accounts for the largest embodied
energy value of 14.9 GJ/year. Mud brick and timber have lower embodied energy val-
ues of 4.9 GJ/year and 3.9 GJ/year (Table 5.33).
As shown in Table 5.33, homesteads of stone contain the largest occupied area of 470
m2. They also account for the largest operational energy (3.5 GJ/year) and life cycle en-
ergy (18.4GJ/year). Timber is lower at 1.25 GJ/year and 5.12 GJ/year, almost the same
as mud brick at 1.25 GJ/year and 6.15GJ/year (Table 5.33).This means for the home-
stead category, stone construction accounts for the largest annual EF (0.18 gha) fol-
lowed by mud brick (mixed with other materials) (0.06 gha) and timber (0.05gha) (Ta-
ble 5.33).
Table 5.33: OCRT- Life cycle energy use of homestead accommodation services (2011)
Material Embodied energy Over a 50-year life cycle (GJ/m2)
Brick mixed with other mate-rials (old technology)
- - - - - - - -
Stone (local) 1.58 470 14.9 0.25 14 3.5 18.4 0.18 Concrete - - - - - - - - Total 23.7 6 0.3 1. Occupancy rate of OCRT-homestead = 3% (see Table 5.17) 2. Area per bed space = 29.4 m2 (see Table 5.18) 3. Operation energy (GJ/ m2/year) of homestead accommodation is assumed to be the same as operation energy of
motel. c. 6.OCRT Hotels: Life Cycle Energy Use and EF
As shown in Table 5.34, timber and masonry hotel construction accounts for the largest
area in this category of 5,442 m2 area followed by local stone (2,299 m2), timber (1,862
m2), and brick mixed with other materials and mud brick (mixed with other materials)
with equal areas of 233 m2 (Table 5.34). In addition, the timber and masonry type ac-
counts for the largest embodied energy value of 222GJ/year, followed by stone (72.6
GJ/year) (Table 5.34). The types of mud brick (mixed with other materials) and brick
Chapter 5: First case study – Otago Central Rail Trail
223 | P a g e
(mixed with other construction) have embodied energy of 6.5 and 23.9 GJ/year (Table
5.34).
As determined in Table 5.34, hotel timber and masonry construction contains the big-
gest occupied area (593 m2) and has the largest annual operating energy of 338
GJ/year). Other types of hotel construction including timber, mud brick, brick and stone
contain occupied areas between 25-251m2 and have operational energy use in the range
14-143 GJ/year (Table 5.34).
Moreover, the same hotel category of timber and masonry construction accounts for the
largest life cycle energy of 560 GJ/year and has the biggest EF (5.6 gha) (Table 5.34).
The life cycle energy uses of other types of construction are between 20.5-215.5
GJ/year and their EFs are in the range of 0.2-2.2 gha. (Table 5.34).The total life cycle
energy use of OCRT hotels is 481.1 GJ/year and its total annual EF is 9.8 gha (Table
5.34).
Table 5.34: OCRT- life cycle energy use of hotel accommodation services (2011)
Material Embodied energy Over a 50-year life cycle (GJ/m2)
Hotel 43 3 0 0 44 3 29 6 Total 106 13 49 14 462 42 243 73
1: Veranda 2: Balcony 3: Number of bed spaces sharing area 4: Number of veranda/ balcony 5: Number of bed spaces using private area 6: Number of outdoor sitting spaces. 7. Outdoor sitting with timber pergola roof taken as veranda
Chapter 5: First case study – Otago Central Rail Trail
228 | P a g e
This thesis calculates the areas of 12 selected V/Bs (6 NB and 6 RB) found in OCRT
accommodation services to measure the average area (m2) of all V/Bs used in OCRT
accommodation services (Appendix19). This calculation is conducted through using the
roof plans, and scaled views and elevations (Appendix19), published in websites and
from satellite maps. The calculation of the areas is conducted by using Map tool 2 and a
scaled ruler.
As shown in Appendix19, in OCRT accommodation services, the average area per V/B
is 14.3 m2. Table 5.40 includes the areas of the number of V/Bs used in each type of
OCRT accommodation service. As shown in Table 5.40, of 27 V/Bs with a total area of
387 m2, the majority are used in SC accommodation services (16 V/Bs with an area of
229 m2), followed by 6 in B&B (86m2), 3 in hotels (43m2) and 2 in motels (29 m2).
Table 5.40: OCRT- outdoor sitting used as part of accommodation services (summary) Type V/B
No.1 Area (m2)2
SC 16 229 B&B 6 86 Bp 0 0 Motel 2 29 Homestead 0 0 Hotel 3 43 Total 27 387
1. Number of V/B 2. Average area (m2) per veranda/balcony = 14.3
Table 5.41 sets out the initial embodied energy of a V/B element based on its floor and
roof. Since the embodied energy of V/B foundation has already been calculated and in-
cluded in embodied energy of indoor spaces, it is ignored in Table 5.41. As the embod-
ied energy of partition walls between a veranda/balcony and indoor spaces has already
been calculated and included in embodied energy of indoor spaces, it is not calculated in
Table 5.41. As result, in Table 5.41, the total embodied energy for a V/B over a 50 year
life is 620 MJ/m2 or 0.62 GJ/m2. Consequently the annual embodied energy intensity for
a V/B is equivalent to 0.62 GJ/m2 ÷ 50= 0.012 GJ/m2/year.
Chapter 5: First case study – Otago Central Rail Trail
229 | P a g e
Table 5.41: OCRT- accommodation services-initial embodied energy intensities for Veranda/Balcony Building element
Embodied energy intensity over a 50 year life (MJ/m2) Light construction3
Foundation1 - - Floor 220 35.5% Walls2 - - Roof 400 64.5% Total 620 100% 1. Embodied energy of foundation has already been calculated and added to embodied energy of indoor spaces. 2. Embodied energy of partition walls between veranda/balcony and indoor spaces has already been calculated and included embodied energy of indoor spaces. 3. Reference: Mithraratne et al, 2007:159
Table 5.42 shows that the embodied energy of 387 m2 OCRT accommodation service
V/Bs is 4.6 GJ/year. Since V/Bs are open areas and do not use energy in operation (in
particular for heating), their operating energy is assumed to be zero. Thus as shown in
Table 5.42, the life cycle energy use of 387 m2 is equal to its embodied energy (4.6
GJ/year) and its annual EF is 0.046 gha.
Table 5.42: OCRT-accommodation services, life cycle energy and EF of outdoor sitting space (ve-randa/balcony)
Type Embodied energy (GJ/m2 per year)
Area (m2)
Embodied energy (GJ/year)
Operating energy
Life-cycle energy (GJ/year)
EF (gha/ year)
Veranda/balcony 0.012 387 4.6 0 4.6 0.046
In Table 5.43 the total area of OCRT accommodation services is separated into the two
areas of 79,978 m2 indoor spaces and 378 m2 V/B. The annual EF of OCRT accommo-
dation services (indoor spaces) as shown in Table 5.43 is 0.00053gha/m2 (43.1gha ÷
80,356m2). Thus the annual EF of 79,978 m2 indoor spaces is equivalent to 79,978m2 ×
0.00053 gha/m2 = 42.3 gha (Table 5.43). Likewise the annual EF of V/Bs with the area
of 378 m2 area is equivalent to 0.046gha (see Tables 5.42 and 43). As a result the total
annual EF of 80,356 m2 OCRT accommodation services comprising 79,978 m2 indoor
spaces and 378 m2 V/B is equivalent to the sum of 0.046 gha and 42.3 gha = 42.4 gha
(Table 5.43).
As shown in Tables.5.37 and 5.38, the results from the second scenario in which all
OCRT accommodation services are assumed to be indoor spaces give a total annual EF
of 43.2 gha. In addition, in the third scenario, in which outdoor spaces are considered,
the annual EF reduces to 42.4gha. This is a small 1.9% reduction in annual EF. Alterna-
tively, thinking of the EF as a land area, 0.8 gha (8000m2) ÷ 387 m2 = 20.7 m2, so 1m2
V/B reduces the EF of OCRT accommodation services by 20.7m2.
Chapter 5: First case study – Otago Central Rail Trail
230 | P a g e
Table 5.43: Reduced EF of OCRT-accommodation serviced influenced by the use of veranda/balcony Indoor spaces Outdoor sitting (veranda/balcony)
Area (m2)1 EF (gha/m2) EF (gha) Area (m2) EF (gha/m2) EF (gha) 79,978 0.00053 42.3 387 0.00012 0.046
1. Total area of OCRT accommodation services (m2) = 80, 356 (see Table 5.19) • Total EF of OCRT accommodation services (second scenario) gha= 43.2 (see Table 5.34) • Total EF of OCERT accommodation services (indoor space + Veranda/ balcony) gha = 42.4 • Reduction in OCRT- EF influenced by the use of 387 m2 veranda and balcony (0.48% of 80,356m2) = 0.8 gha
5.7. OCRT Visitor Activities
This section investigates the environmental impacts of OCRT visitor activities (as part
of their social-cultural behaviours) through calculation of their annual EF. This study
explores the frequency of activities offered by OCRT accommodation services to visi-
tors through using the official websites of the OCRT community and 201websites of
783 OCRT accommodation services. The offered activities are explained in Appendix 5
and they are classified into indoor and outdoor activities in Appendix 7.
In addition the frequency of the offered activities shown in Appendix 7 and summarised
in Tables 5.44 and 5.45 can be considered as an indicator of the attitude of OCRT par-
ticipants and members (in this case accommodation owners) to the types of sustainable
tourism activities. Comparison between the EFs of the conducted activities and their
frequency also can indicate a social-ecological perspective of the attitude of tourism
participants to being sustainable.
5.7.1. Indoor Activities (Frequency)
Table 5.44 sets out OCRT indoor activities offered by accommodation services to visi-
tors. These activities are classified into seven types: curling at Naseby, indoor sports
(except curling at Naseby), indoor water sports, education, art activities, cul-
tural/spiritual activities, and games (Table 5.44). According to CODC, 2011:18, the
curling at Naseby is considered as the only indoor curling sport and attracts about
36.6% (see Table 5.48) of OCRT visitors in 2011, while curling at Alexandra is in-
cluded in other activities. Since this study attempts to evaluate the environmental, cul-
tural and economic footprint of curling at Naseby on OCRT (at regional scale) and on
Naseby (at urban scale) its frequency is separated from curling at Alexandra in Table
5.44. This makes an opportunity to explore the relationship between frequency of curl-
ing at Naseby and its environmental, cultural and economic impacts.
Chapter 5: First case study – Otago Central Rail Trail
231 | P a g e
Table 5.45 presents a summary of OCRT indoor activities and their frequency (F) cited
in Table 5.44. As determined in Table 5.45 and Figure 5.32, of the total 116 (100%) in-
door activities offered to OCRT visitors, education has the majority share of 49 (42.2%)
followed by curling at Naseby at 46 (39.7%). The frequency of other indoor activities
including indoor sport (except curling at Naseby), indoor water sports, art, cul-
tural/spiritual activities and games occur in the F range of 1(0.9%)-8(6.9%).
Table 5.44: OCRT- Classification of the indoor activities offered by accommodation services to visitors (2011)
Indoor sports
F1 Indoor sports (except curling at Naseby)
F1 Indoor water sports
F1 Education F1 Art F1 Cul-tural/spiritual activi-ties
F1
Games F1
Curling at Naseby
46 Curling at Alexandra
2 Swim-ming pool
7 Reading materials
46 Mu-sic
1 Catholic Church
1 Games 4
- - Bowling 2 Aquatic centre
1 Maps and local in-formation
1 - - Cafe Culture
2 - -
- - Gun club 1 - - Photogra-phy work-shop
2 - - - - - -
Total 46 5 8 49 1 3 4
1. F: Frequency
Table 5.45: OCRT- Indoor activities offered by accommodation services to visitors - (summary). Activities F %
Indoor sports (curling at Naseby) 46 39.7 Indoor sports (except curling at Naseby) 5 4.3 Indoor water sports 8 6.9 Education 49 42.2 Art 1 0.9 Cultural/spiritual activities 3 2.6 Games 4 3.4 Total 116 100
Chapter 5: First case study – Otago Central Rail Trail
232 | P a g e
5.7.2. OCRT Outdoor Activities (Frequency)
This study explores 47 types of outdoor activity offered by OCRT accommodation ser-
vices to visitors in 2011 as shown in Appendix 7, and based on access to information
about outdoor activities through using 201 OCRT accommodation websites. The 47 of-
fered outdoor activities are explained by their related accommodation service in Appen-
dix 7. This Thesis classifies the 47 types of OCRT outdoor activities into seven types:
sports (at a playground), motorised sports and activities, water sports, winter sports, cy-
cling, sports on horseback, recreational activities, art activities, farm activities, walking
and climbing (See Appendix 20 and its summary, Table 5.46).
Table 5.46 shows that of total 492 OCRT outdoor activities, water sports form the larg-
est category at 122 occurrences, followed by sports at a playground (86), winter sports
(54), walking (52), and cycling (42). The frequencies of other OCRT outdoor activities
Figure 5.32: OCRT- frequency of indoor activities offered by accommodation services to visitors
Chapter 5: First case study – Otago Central Rail Trail
233 | P a g e
Table 5.46: OCRT- Frequency of the outdoor activities offered by accommodation services to visitors.
Outdoor activity F % Sports (at a playground) 86 17.5 Motorised sports and activities 31 6.3 Water sports 122 24.8 Winter sports 54 11 Cycling 42 8.5 Sports on horseback 12 2.4 Recreational activities 38 7.7 Art activities 32 6.5 Farm activities 22 4.5 Walking 52 10.6 Climbing 1 0.2 Total 492 100 Figure 5.33 illustrates the types of OCRT outdoor activities by their percentage fre-
quencies as cited in Table 5.46 (right column).
5.7.3. OCRT Other Visitor Opportunities by Accommodation Service
Apart from the indoor and outdoor activities discussed above, other suggestions as to
things visitors can do are offered by ORTC accommodation services. Appendix 21 con-
tains summarised information about these and their frequency of occurrence. Here,
these opportunities for tourist visits are categorised into five groups: cities and villages
of note, historic sites and buildings, industrial archaeology sites, scenery, gar-
den/farm/park, and museum/art gallery (Appendix 21). Table 5.47 offers summarised
information related to OCRT visiting opportunities offered as cited in Appendix 21.
0.00%
5.00%
10.00%
15.00%
20.00%
25.00%
30.00%
Figure 5.33: Percentage frequencies of OCRT outdoor activities offered by accommodation services to visitors (2011) Total Frequency of OCRT outdoor activities = 492 (see Table 5.43)
Chapter 5: First case study – Otago Central Rail Trail
234 | P a g e
Table 5.47 and Figure 5.34 determine that in comparison with other subjects, visits to
scenery are suggested most frequently with 132 occurrences (24.1% of a total of 548),
followed by historic sites and buildings (118-21.5%) and garden/farm/park (100-
18.3%). The frequency of other subjects to visit including cities and villages, industrial
archaeological sites, and museum/art gallery are in the range of 40 (7.3%) – 97(17.7%),
see Table 5.47 and Figure 5.34.
Table 5.47: OCRT- accommodation services- opportunities for visits
Subjects F % Cities and villages 97 17.7 Historic sites and buildings 118 21.5
This Thesis uses the CODC research (2011) as a base to calculate the number of OCRT
visitors per activity in 2011. According to CODC (2011:18) in 2011, 160 OCRT visitors
nominated a total of 354 activities that they did or were going to undertake while in
Central Otago. These nominated activities are aggregated in Table 5.48, and show that
of the 160 OCRT visitors the most visited site was the Taieri Gorge Railway 74 visitors
(46.3%), followed by curling 59 visitors (36.9%), visits to gold mining towns 56 visitors
0.00%
5.00%
10.00%
15.00%
20.00%
25.00%
30.00%
Figure 5.34: Frequency of the subjects to visit offered by OCRT accommodation services to visitors (2011)
Chapter 5: First case study – Otago Central Rail Trail
235 | P a g e
(35%), sightseeing tours 49 visitors (30.6%) and visits to old Cromwell town 36 visitors
(22.5%). Other activities as shown in Table 5.48 fell in the range of 1 visitor (0.6%) -27
visitors (16.9%).
Table 5.48: OCRT activities conducted by visitors 2011 (n=160)
Activities Count % of visitors Taieri Gorge Railway 74 46.3 Curling 59 36.9 Gold mining towns 56 35 Sightseeing tours 49 30.6 Old Cromwell town 36 22.5 Wineries 27 16.9 Visiting friends and relatives 24 15 Hayes engineering 13 8.1 Mountain biking Naseby 4 2.5 fishing 3 1.9 Golf 2 1.3 Swim at Ophir and Alexandra 1 0.6 Clyde dam Tour 1 0.6 Golden Progress mine 1 0.6 Walking 1 0.6 Ophir- high country farm 1 0.6 Biking 1 0.6 Fruit picking along trail 1 0.6 Other 354 - • Reference: CODC, 2011:18
This chapter calculates the number of OCRT visitors per activity through using the per-
centage proportional split of the 160 visitors (cited in Table 5.48) and applying it to the
total 11,788 OCRT visitors in 2011 (Table 5.49). This calculated split for the number of
visitors is then used as the basis to calculate the EF of each OCRT tourism activity.
Chapter 5: First case study – Otago Central Rail Trail
236 | P a g e
Table 5.49: OCRT activities conducted by 11,7881visitors -2011 Activities % of visitors2 Number of Visitors Taieri Gorge Railway 46.3 5,458 Curling 36.9 4,350 Gold mining towns 35 4,126 Sightseeing tours 30.6 3,607 Old Cromwell town 22.5 2,652 Wineries 16.9 1,992 Visiting friends and relatives 15 1,768 Hayes engineering 8.1 955 Mountain biking Naseby 2.5 295 fishing 1.9 224 Golf 1.3 153 Swim at Ophir and Alexandra 0.6 71 Clyde dam Tour 0.6 71 Golden Progress mine 0.6 71 Walking 0.6 71 Ophir- high country farm 0.6 71 Biking 0.6 71 Fruit picking along trail 0.6 71 1. See Figure 5.2. 2. % split of 11,788 visitor assumed same as for 160 visitors cited in Table 5.45. • Reference: CODC, 2011:18
5.7.5. OCRT: EF of Visitor Activities
5.7.5.1. EF of Indoor Activities (Curling at Naseby)
a. Embodied Energy
Table 5.50 shows that the total area of the Naseby Indoor Curling Centre is 1,300 m2.
To calculate the embodied energy of the Naseby Indoor Curling Centre, its structure is
assumed to involve materials similar to the super insulated construction (see Table 5.25)
set out in Mithraratne et al (2007:159). Table 5.50 determines that the embodied energy
intensity of the Naseby Indoor Curling Centre is 1,248,000 MJ over a 50 year life,
which is equivalent to (1,248,000/50) 40,040 MJ/year (40GJ/year).
Table 5.50: Naseby Indoor Curling Centre, embodied energy
Total area (m2)
Super insulated construction Building element Embodied energy
intensity over 50 years (MJ/m2) 1
Embodied en-ergy intensity over 50 years (MJ)
Embodied energy inten-sity (MJ/year)
1,300
Foundation 30 39,000 780 Floor 370 481,000 9,620 Walls 580 754,00 15,080 Roof 560 728,000 14,560 Total - 1,248,000 40,040
1. Reference: Mithraratne et al, 2007:159
Chapter 5: First case study – Otago Central Rail Trail
237 | P a g e
b. Operational Energy Use
Due to the shortage of information about the operating energy of Naseby Curling Club,
this thesis assumes its annual operational energy use is similar to the “Oliver Curling
Club, British Colombia” (Renewable Energy magazine (RE)-2000) and uses this to cal-
culate the total life cycle energy use of Naseby Curling Club.
b. 1. Oliver Curling Club
According to RE (2000:2) the Oliver Curling Club is a two-storey, wood frame building
constructed in 1974. As pointed out by RE (2000:2) the Club includes approximately
167m2 of floor space, in addition to the 836 m2 four-sheet ice surface and its walls are
insulated to R12 ft²°Fh/Btu (approximately 2.1 m2oC/W) and the ceiling to R 20
ft²°Fh/Btu (approximately 3.5 m2oC/W), which are about the same as required in the
New Zealand Building Code. The Oliver Curling Club (RE, 2000:2) has an ammonia
refrigeration system to make ice, and electric heaters warm the viewing area and locker
rooms, second floor lounge and the ice area.
b. 2. Oliver Curling Club: Operating Energy
As shown in Table 5.51 the average energy consumption of the Oliver Curling Club is
41,800 kWh/ year, which is equivalent to 150,480 MJ/year. Since the total area of the
Oliver Curling Club is 1,170m2, its annual average energy consumption = (150,480 MJ
÷ 1,170 m2) = 128.6 MJ/m2 or 0.35 MJ/m2 per day (Table 5.51).
Table 5.51: Oliver Curling Club- Operating energy use per square metre per year
Area (m2) 1 Average en-ergy consump-tion (kWh in 4 years)2
Average en-ergy consump-tion (kWh/year)
Average en-ergy consump-tion (MJ /year)
Average en-ergy consump-tion (MJ/m2/year)
Average en-ergy consump-tion (MJ/m2/day)
1,170 167,200 41,800 150,480 128.6 0.35 1. Area of Oliver Curling Club= 1,170 m2 including 834 m2 four-sheet ice surface + 334m2 two storey building. 2. Reference: Renewable Energy (RE) magazine, 2000: 4. b. 3. Naseby Curling Club: Operating Energy
As shown in Table 5.52 the area of Naseby Curling Club (1300 m2) includes the 980 m2
four-sheet ice surface and a 320 m2 two storey building. Thus the average energy con-
sumption of Naseby Curling Club is 167,180 MJ/Year (1,300 m2 × 128.6 MJ/m2/year)
Chapter 5: First case study – Otago Central Rail Trail
238 | P a g e
Table 5.52: Naseby Curling Club- Operating energy use per square metre per year Area (m2) 1-2 Average energy con-
sumption (MJ/year) Average energy consump-tion (MJ/m2/year)
Average energy consumption (MJ/m2/day)
1,300 167,180 128.63 0.35 1. Area of Naseby Curling Club (1300 m2) includes 980 m2 four-sheet ice surface and 320 m2 two storied building. 2. Area of Naseby Curling Club has been calculated by using the elevation of building and Z Map Tools, and Oliver
Curling Club average energy consumption (See Table 5.51).
c. EF of Naseby Curling Centre
The life cycle energy of Naseby Curling centre, which is the sum of its total embodied
energy (see Table 5.50) and operating energy (see Table 5.52) is equivalent to (40.04
GJ/year + 167 GJ/year) = 207.2 GJ/year (Table 5.53). The annual EF (gha) of Naseby
Curling Centre as shown in Table 5.53 is 207.2 GJ/year (life cycle energy use)/100
(global average carrying capacity) = 2.07 gha.
Table 5.53: Total ecological footprint1 of Naseby Curling Centre
Area (m2) Embodied energy (GJ/year)
Average energy consumption
(GJ/year)
Life-cycle energy (GJ/year)
EF (gha)
1,300 40.04 167.2 207.2 2.07
1. In this table the EF of Naseby Curling Centre is calculated based on life-cycle energy use irre-spective of visitor numbers.
d. EF of Naseby Curling Centre per Visitor As demonstrated in Table 5.54, in 2008, 13,000 New Zealand visitors (including 4,350
OCRT visitors- see Table 5.56) used the Naseby Indoor Curling Centre. The average
time that visitors book the sheet ice is 1.5 hours. As a result, the average energy con-
sumption of Naseby Curling Centre per visitor can be calculated through the following
equation:
Average energy consumption MJ/visitor/year = 13,000 (visitors) ÷ 167,180 MJ/year
(average energy consumption of Naseby Curling Centre) = 11.6 MJ/visitor/year (Table
5.54).
Table 5.54: Naseby Curling Club – annual operating energy use per visitor
Area (m2) Average energy con-sumption (MJ /year)
Visitors per year (2008) 1 Average energy consumption (MJ/visitor/ year)
Chapter 5: First case study – Otago Central Rail Trail
239 | P a g e
As shown in Table 5.55, the Naseby Curling Centre is open seven hours a day through-
out the year. Its total working time per year is thus (7 hours/day × 365 days) 2,555 hours
(Table 5.55). In Naseby indoor curling there are four sheets of ice and at any time a
maximum of 32 people can curl in the indoor rink. (www.curling.co.nz) and minimum
time to book a sheet is one hour (www.curling.co.nz) (Table 5.55).
Table .5.55: Naseby Curling Centre – working time
Naseby Curling Centre working time (hours per day)1 7 Numbers of ice sheets 4 Maximum number of people who can curl in one time 32 Naseby Curling Centre working time (hours per year) 2,555 Maximum number of player (1 hour per player) per year 91,380 Max time that each visitor (13,000) can play curling (hours/per year) 5 Min time that a visitor can book to play indoor curling1 1 average time that a visitor could play indoor curling (hours/visitor) 3 1. Reference: www.curling.co.nz
As shown in Table 5.56, in 2011, 4,350 OCRT visitors who play curling at Naseby
cover 33.5% of its whole visitors (13,000 visitors). Thus the annual EF of the 4,350
OCRT visitors is equal to 33.5% of the EF of 13,000 visitors (2.07gha-see Table 5.53) =
0.7 gha (Table 5.56), consequently the annual EF of an OCRT visitor playing curling is
equivalent to 0.7 (gha) ÷ 4,350 visitors = 0.000016 gha. The annual EF of the Naseby
Curling Centre is 0.00016 gha /visitor.
Table 5.56. OCRT- Visitors- curling EF (gha) (2011)
Total num-ber of OCRT visi-tors
% of OCRT visi-tors who play in-door curling at Naseby Curling Centre1
Total number of OCRT- visitors who play curling at Naseby curl-ing centre1
EF of 13,000 visi-tors of Curling cen-tre (gha)
EF of 4,350 OCRT visi-tors ( 33.5 % of 13,000 Naseby indoor curling centre visitors) gha2
11,788 36.9% 4,350 2.073 0.7 (33.5 % of 2.07) 1. See Table 5.48 2. EF of Naseby Curling Centre (indoor curling) per visitor / year = (0.7 gha ÷ 4,350 visitors) 0.00016 (gha) 3. See Table 5.53
5.7.5.2. EF of OCRT Outdoor Activities
a. OCRT: the EF of Walking
As indicated in Table 5.57, the total energy of walking is in a range 0.37-2.21 MJ/km.
Table 5.57 shows that of 11,788 OCRT visitors 0.6% (71) walk.
Chapter 5: First case study – Otago Central Rail Trail
240 | P a g e
Table 5.57. Range of energy values relating to different aspects of travel, and range of total values (MJ/ km)
Mode Embodied energy Food/fuel shower Total Walking 0.25 0.12-1.96 No shower 0.37-2.21 Cycling 0.03-0.08 0.06-1.42 No shower 0.09-1.50 Cycling(shower 0.03-0.08 0.06-1.42 0.57-2.52 0.60-4.02 Driving (average) 0.50 3.19 No shower 3.69* * The value for average driving is included as a comparison • Reference: Vale and Vale, 2009:109 Since the distance that a person can walk (easy walking) in an hour is equal to 5 km
(Browning et al, 2005:390), the total distance that 71 OCRT visitors can walk in an hour
is 355km.(Table 5.58). As a result, the distance that 71 OCRT visitors can walk in a
typical assumed walk of 3 hours duration is 1,065km (355×3) (Table 5.58).
Since the EF of food consumed by OCRT visitors has already been calculated in food
category, the minimum value of 0.37 MJ/km (see Table 5.57) is used to calculate the EF
of OCRT visitors- walking.
As shown in Table 5.58, the energy use (MJ) of 71 OCRT visitors who walk for 3 hours
(1,065km) is equivalent to 394.05 MJ (0.394 GJ) and their EF is equivalent to 0.394 GJ
(energy use) ÷ 100 (global average carrying capacity) = 0.0039 gha. In addition, the EF
of an OCRT visitor who walks 3 hours is 0.00005 gha /visitor (Table 5.58).
Table 5.58: Ecological footprint of OCRT- visitors (walking)
Total number of OCRT visitors 11,788 % of visitors who walk (see Table 5.45) 0.6 Total number of OCRT visitors who walk (see Table 5.49) 71 Distance that a person can walk (easy walking) (km/hour) 51
Distance that 71 OCRT visitors can walk an hour (km) 355 Distance that 71 OCRT visitors can walk in 3 hours (km) 1, 065 Energy use of walking (MJ/km) (see Table 5.57) 0.372
Energy use (MJ) of 71 OCRT visitors who walk 3 hours (1,065km) 394.053
EF of 71 OCRT visitors who walk 3 hours (gha) 0.0039 EF (gha) of an OCRT visitor who walks 3 hours 0.00005
1. Reference: (Browning et al, 2005:390) 2. See Table 5.57 3. 394.05 (MJ)= 0.394 (GJ)
b. EF of Golf
As demonstrated in Table 5.59, golf is classified into two types; the walking golfer and
the driving golfer. The integration of each golfer’s share of the land and the embodied
energy of equipment used in each type of golf determines its total impact
(MJ/participant/year). As shown in Table 5.59, the total impact of a walking golfer and
Chapter 5: First case study – Otago Central Rail Trail
241 | P a g e
driving golfer who play 38 rounds per year (Vale and Vale, 2009: 269) are 2,393 and
5,621 MJ/participant/year respectively. Since the average of OCRT visitor nights is 3.6
(see Figure 5.7), this study makes this assumption that each OCRT visitor who on aver-
age stays in OCRT 3.6 nights, plays 3 rounds of golf per 3.6 nights.
As shown in Table 5.59 the average impacts of each player who play 38 rounds is
4007(MJ/participants/38 rounds/year). Consequently the average impact of golfing per
visitor per round is equal to 4007 (MJ/participants/38 rounds/ year) ÷ 38 (rounds) = 105
MJ/participants/round/year). As a result, the average impact of each OCRT visitor who
plays 3 rounds f golf is equal to 105 (MJ/participants/rounds/year) × 3 = 315
MJ/participant = 0.315 GJ/ participant
Table 5.59: Total impact per player of land and equipment associated with Golf
Type Land area
Energy equivalent of land (MJ/38 rounds/year)
Embodied energy of equipment (MJ/ year)
Total impact(MJ/ partici-pant/38 rounds/year)1-2
Golf (walking golfer)
170 2,295 98 2,393
Golf (driving golfer)
170 2,295 3,326 5,621
1. Average impact of both Golf (walking and driving) = 4007 MJ/participant/38 rounds/year 2.Average impact of both Golf (walking and driving) = 105 MJ/participant/ round/year 3. Average impact of both Golf (walking and driving) = 315 MJ/participant/3 rounds/year
• Reference: Vale and Vale, 2009:276
Table 5.60 determines that of 11,788 OCRT visitors only 1.3% (153) play golf (Table
5.40). Table 5.60 shows that the total impact of the 153 OCRT visitors who play 3
rounds of golf is equivalent to 153 × 315 MJ/participant/year (See Table 5.59) = 48,195
MJ/ participant/year. As a result the annual EF of these 153 visitors is equivalent to
48.195 GJ/year/100 = 0.48 gha. In addition, the EF of an OCRT visitor who plays golf
is equivalent to the total EF of 153 visitors (0.48gha) ÷ total number of OCRT visitors
who play golf (153) = 0.003 gha/participant/year.
Table 5.60: EF of OCRT visitors – golf (2011)
Total Numbers of OCRT visitors
% of OCRT visitors who play golf
Numbers of OCRT visitors who play golf.
Total impact (MJ/ partici-pant/3 rounds/year)1
Total impact of OCRT visitors who play golf (MJ/year)
EF (gha)2
11,788 1.3 153 315 48,195 0.48 1. Average impact of Golf (walking and driving) = 315 MJ/participant/ 3 rounds/ year (See Table 5.59) 2. The EF of an OCRT visitor who plays golf (gha/participant) = 0.48(gha)÷ 153 (visitor)= 0.003 (gha/visitor)
Chapter 5: First case study – Otago Central Rail Trail
242 | P a g e
c. EF of Other Activities (except curling, walking and golf)
Becken (2001) proposes a method for the classification of tourism attractions and activi-
ties as shown in Table 5.61. According to Becken (2001:2) these can be put into the
three categories of attraction, entertainment, and activity (Table 5.61). These three main
categories comprise related sub-categories as shown in Table 5.61.
Table 5.61: Classification of tourism attractions and activities. Generic category Sub-category Types of operation/ establish-
ments
Attractions
Building Art gallery, Historic building, Museum, Visitor centre.
Park Aquarium, Botanical garden, Wildlife park, Zoo.
Amusement Experience centre, Gondola, Sporting complex, Theme park.
Industry Brewery, Farm show, Wine trail and tasting.
Table 5.62 contains the average, minimum and maximum energy use suggested by
Becken (2001:3) for each of the three categories of tourism activities and attractions. As
shown in Table 5.62, the total annual energy use of the three categories varies consid-
erably from a minimum energy use of 9GJ to the maximum of 77,020GJ (Table 5.62).
Chapter 5: First case study – Otago Central Rail Trail
243 | P a g e
Table 5.62: Energy use per annum for the three categories. Energy use Attraction Entertainment Activity Average (GJ) 411 1,599 495 Min (GJ) 4 36 9 Max (GJ) 53,223 77,020 29,208 • Reference: Becken, 2001:3
The energy use per visitor for the three categories of attraction, entertainment and activ-
ity are also calculated by Becken (2001) and presented in Table 5.63. Although the
minimum energy use/visitor is relatively constant across the three categories, the maxi-
mums vary considerably, with activities being clearly the most energy consuming.
Table 5.63: Energy use per tourist for the three categories.
Attraction Entertainment Activity Average (MJ/ tourist) 6.2 9.4 95.6 Min (MJ/ tourist) 0.6 0.8 0.6 Max (MJ/ tourist) 174.0 38.5 2902.8 • Reference: Becken, 2001:3
Becken (2001:5) also sets out the energy use per visitor of key operator types as shown
in Table 5.64. In this analysis, the maximum energy is used by diving (800MJ/tourist)
and the minimum by a farm show. Operator types that involve transport have the higher
values in Table 5.64.
Table 5.64: Energy use per tourist of key operator types. Operator type Energy (MJ/tourist) Farm show 7 Museum 10 Zoo/wildlife park 16 Experience centre 29 Rafting 36 Guided walks (including transport to sites) 110 Scenic boat cruise 165 Scenic flight 340 Diving 800 • Reference: Becken, 2001:5
This thesis uses the categorisation of tourism activities and attractions proposed by
Becken (2001) as discussed above to classify OCRT tourism activities in the following
table.
Chapter 5: First case study – Otago Central Rail Trail
244 | P a g e
Table 5.65: Classification of OCRT tourism attractions and activities. Generic category Sub-category Types of operation/establishment Average
MJ/tourist
Attractions Building Hayes engineering, Gold mining
towns, Old Cromwell town, Taieri, Golden progress mine
6.2
Park - - Amusement - -
Industry Wineries, Ophir high country farm, fruit picking along trail
6.2
Natural attraction - Entertainment Performance, Other -
Activity
Air activity - - Sea activity - -
Adventure activity Mountain biking at Naseby 95.6 Nature recreation Fishing, swim at Ophir, Sightseeing,
Clyde dam tour, biking. 95.6
• Reference: Becken, 2001:2
Likewise, the average energy use of each type of operation/establishment as calculated
by Becken (2001:3) (Table 5.63) is considered here to represent the energy use of
OCRT types of operation/establishment (Table 5.65).
c. 1. EF of Biking (excluding mountain biking, Table 5.49)
As shown in Table 5.66, in 2011, 71 visitors (0.6 % of 11,788 OCRT visitors) engaged
in biking (mountain biking is a separate category, see Table 5.49). The total impact of a
participant who bikes is 95.6 MJ/year (see Table 5.65) thus the total impact of 71 OCRT
visitors is 71× 95.6 MJ/ visitor/year = 6,788 MJ/year = 6.8 GJ/year (Table 5.66). As a
result, the EF of 71 OCRT visitors who bike is 6.8 GJ/year ÷ 100 (average global carry-
ing capacity) = 0.068 gha/year (Table 5.66). Moreover the EF of an OCRT visitor who
bikes is 0.068 ÷ 71 = 0.0009 gha/visitor/year.
Table 5.66: EF of OCRT visitors – biking (2011) Total Num-
bers of OCRT visi-
tors
% of OCRT visi-tors who play
biking
Numbers of OCRT visitors who play bik-
ing.
Total impact (MJ/ partici-
pant)1
Total impact of 71 OCRT visi-tors who play biking (MJ)
EF (gha)3
11,788 0.6 71 95.6 6,7882 0.068 1. (See Table 5.65) 2. 6,788 MJ/year = 6.8 GJ/ year 3. EF (gha/ visitor/ year) of an OCRT visitor – biking = 0.0009
Chapter 5: First case study – Otago Central Rail Trail
245 | P a g e
c. 2. The EF of OCRT Visitors: Mountain Biking at Naseby
Table 5.67 shows 295 (2.5% of 11,788 OCRT) visitors go mountain biking at Naseby
(see Table 5.49). The total impact of a participant who does this is 95.6 MJ/year (see
Table 5.65). Consequently the total impact of 295 OCRT visitors is 295× 95.6 MJ/ visi-
tor/year = 28,202 MJ/year = 28.2 GJ/year (Table 5.67). As a result, the EF of 295
OCRT visitors who go mountain biking is 28.2 GJ/year ÷ 100 (global average carrying
capacity) = 0.28 gha (Table 5.67). In addition the EF of an OCRT visitor who goes
Hayes engineering 955 8.1 0.00006 0.06 Mountain biking at Naseby
295 2.5 0.0009 0.28
Fishing 224 1.9 0.0009 0.21 Swim at Ophir 71 0.6 0.0009 0.068 Clyde dam tour 71 0.6 0.0009 0.068 Golden progress mine
71 0.6 0.00006 0.004
Ophir high country farm
71 0.6 0.00006 0.004
Biking 71 0.6 0.0009 0.068 Fruit picking along trail
71 0.6 0.00006 0.004
Total 26,077 100 - 6.57 1. Number of visitor activities except golf, curling and walking = 21,503 2. EF of visitor activities except golf, curling and walking = 5.4 (gha) 3. EF/visitor of other visitor activities except golf, curling and walking = 0.00025gha
0 0.5
1 1.5
2 2.5
3 3.5
4
Sigh
tsee
ing
Cur
ling
Gol
f V
isiti
ng fr
eind
s and
…
Taie
ri M
ount
ain
biki
ng a
t …
Gol
d m
inin
g tow
ns
Fish
ing
Old
Cro
mw
ell t
own
Win
eres
s C
lyd
dam
tour
Sw
im a
t Oph
ir Bi
king
H
ayes
eng
inee
ring
Frui
t pic
king
G
olde
n pr
ogre
ss m
inin
g W
alki
ng
gha
EF (gha)
Figure 5.35: OCRT- the EF of visitor activities (2011)
Chapter 5: First case study – Otago Central Rail Trail
252 | P a g e
Figure 5.36 compares the types of OCRT tourism activities by their EF per visitor. This
figure shows a distinct difference between the EF of golfing (0.003 gha /visitor) and all
other types of tourist activity.
5.7.5.4. Comparison between the EFs of Indoor and Outdoor Activities
As shown in Table 5.83 and Figure 5.37 the EF of one OCRT indoor activity (curling at
Naseby) is equivalent to 10.7% (0.7 gha) of the Total EF of OCRT visitor activities
(6.57 gha). Likewise, the total EF of outdoor activities (5.85) accounts for 89.3% of the
total EF of OCRT visitor activities (6.57gha). However, it should be noted that 8.1%
(0.48) of the EF of outdoor activities (5.87) is the EF of golfing (0.48gha) which is con-
ducted by just 1.3% (153) of total OCRT visitors (See Table 5.82 and Figure 5.35).
Table 5.83: Comparison between EFs of OCRT visitors - indoor and outdoor activities (2011) Indoor activity (curling at Naseby) Outdoor activities
As illustrated in Figure 5.39, the majority of the 21,503 OCRT visitor activities fall into
the other activities (except golf, curling and walking) category, followed by curling
(4,350), golf (153) and walking (71).
0.00%
10.00%
20.00%
30.00%
40.00%
50.00%
60.00%
70.00%
80.00%
90.00%
100.00%
Indoor activities Outdoor activities
Pers
enta
ge o
f the
toat
l EF
of O
CRT
-vi
sito
rs a
ctiv
ities
EF
0
1
2
3
4
5
6
Golf Other activities
Curling Walking
gha
EF (gha)
Figure 5.37: comparison between the EF of OCRT visitors indoor and outdoor activities.
Figure 5.38: Comparison between the EFs of golf, curling, walking and other OCRT visitor activities (2011).
Chapter 5: First case study – Otago Central Rail Trail
254 | P a g e
Figure 5.40 compares the EFs of these same four categories. Golf now dominates show-
ing how a small number of people can have a large effect on overall EF.
5.8. The Total EF of OCRT (2011)
Table 5.84 demonstrates that the total EF of the OCRT is equivalent to 1,617 gha,
which derives from the integration of the EFs of transportation, food, accommodation
0
5,000
10,000
15,000
20,000
25,000
Num
ber o
f vis
itor/a
ctiv
ities
Total number of visitors per activity = 26,077 (see table. 5.77)
Number of visitors
0
0.0005
0.001
0.0015
0.002
0.0025
0.003
0.0035
Golf Curling Walking Other activities
gha/
visi
tor
EF gha/visitor
Figure 5.39: Comparison between the numbers of OCRT visitors who engage in golf, curling, walking and other activities (2011)
Figure 5.40: The EF (gha/visitor) of golf, curling, walking and other activities
Chapter 5: First case study – Otago Central Rail Trail
255 | P a g e
services and activities used and engaged in by 11,788 OCRT visitors in 2011. As shown
in Table 5.84 and Figure 5.41 transportation has the largest footprint of 1,167gha
(72.2%) of the total EF, followed by 401.2 gha (24.8%) food, 42.24 gha (2.6%) accom-
modation services and 6.57 gha (0.4%) visitor activities. However, the total EF of trans-
portation can be divided into 38.2% of total EF for international transportation and 34%
for domestic transportation (Table 5.84). This shows the importance of getting to a tour-
ist destination for overall environmental impact.
Table 5.84: Total EF of OCRT (2011)
Category EF (gha) % EF (gha/visitor5) Transportation 1,1671 72.25 0.1 Food 401.22 24.8 0.034 Accommodation 42.43 2.6 0.0036 Activities 6.574 0.4 0.00056 Total 1,617 100 0.138 1. See Table 5.7 2. See Table 5.11 3. See Table 5.40 4. See Table 5.82 5. 72.2% includes 38.2% (617.4gha) EF International transportation + 34% (549.3gha) EF of domestic transportation) (see Table 5.8) 5. Total OCRT visitor numbers = 11,788 (see Figure 5.6)
0.00%
10.00%
20.00%
30.00%
40.00%
50.00%
60.00%
70.00%
80.00%
Percentage of total EF of OCRT
Figure 5.41: Comparison between the EF categories of OCRT- transportation, food, accommodation services and visitors activities (2011)
Chapter 5: First case study – Otago Central Rail Trail
256 | P a g e
Figure 5.41.a compares the EF of OCRT visitors (0.138 gha/ capita), the present global
average EF of holidays (0.3 gha/ capita) (Vale and Vale, 2009:358) and the sustainable
EF (goal) for holidays (0.1 gha/ capita) (Vale and Vale, 2009:358). As illustrated, the
EF of the OCRT is 66% smaller than the global average EF of tourism but its EF still
needs to be reduced by 38% to be ecologically sustainable. According to O’Connor
(2009:92) in 2008 the EF of New Zealanders was 5.9 gha/ capita. As a result the EF of
OCRT visitors (0.136 gha) is equivalent to 2.3% of the EF of New Zealanders.
5.9. OCRT: Overshoot Portion of EF
5.9.1. The EF of Sustainable living
Vale and Vale (2009:358) using data from the Cardiff Report (2001:97), propose the
EFs of sustainable living for the ten categories of life activities and products shown in
Table 5.85 and compare these proposed EFs with their present amounts. Vale and Vale
(2009:358) classify the ten categories into the two areas of individual and collective
products and activities (Table 5.85). The individual products and activities including;
food and drink, domestic energy, domestic travel, stuff, housing, and holidays, are pro-
posed to have EFs in the range of 0.03-0.43 gha/capita for being sustainable (Table
5.85). Moreover the sustainable EFs of the collective categories, including infrastruc-
ture, government, and services, are calculated to be in the range of 0.24-0.47 gha/capita
0
0.05
0.1
0.15
0.2
0.25
0.3
0.35
EF (g
ha/c
apita
) OCRT Vistitor
Global average for tourism Goal
Figure 5.41.a: The average EF of OCRT- visitors and global tourism, and the goal for sustainable tourism (gha/ visitor)
Chapter 5: First case study – Otago Central Rail Trail
257 | P a g e
(Table 5.85). As shown in Table 5.85, the total EF of sustainable living (as the goal) is
equivalent to 1.85 gha/capita and the total EF at present (2009) is 6.41gha/capita.
As presented in Table 5.85, the sustainable EF of holidays is calculated to be 0.03 gha
/capita and, according to the Cardiff report (2001:97), this includes the EFs of transpor-
tation, food, accommodation and waste water that are consumed/used/produced by Car-
diff visitors. This study uses the sustainable EF of holidays (Table 5.85) as the goal to
be achieved through the sustainable development of the OCRT and compares its present
EF with its target EF to calculate the overshoot portion of the current EF.
Table 5.85: The ecological footprint of sustainable living
Individual Now Goal Food and drink 1.33 0.43 Domestic energy 0.99 0.33 Domestic travel 0.99 0.33 Stuff 0.64 0.21 Housing 0.16 0.05 Holidays 0.10 0.03 Individual total 5.00 1.38 Collective Infrastructure 0.74 0.24 Government 0.41 0.14 Services 0.26 0.09 Collective total 1.41 0.47 Total revised footprint 6.41 1.85 • Reference: Vale and Vale, 2009:358
Table 5.86 compares the present EF (0.138 gha/visitor) of the OCRT (see Table 5.84)
and its goal (0.03 gha/visitor) for being environmentally sustainable. The difference be-
tween these two EFs (0.138 gha/visitor – 0.03 gha/visitor) shows the overshoot portion
of the OCRT EF, which is 0.108 gha/visitor (Table 5.86).
Table 5.86: The ecological footprint of OCRT- sustainable tourism (2011) Overshoot portion of OCRT visitors- EF (gha/visitor/year)
Now Goal Overshoot EF(gha/visitor/year) 0.138 0.03 0.108
• Total overshoot EF (gha) of 11,788 OCRT visitors = 1,273
Chapter 5: First case study – Otago Central Rail Trail
258 | P a g e
5.9.2. The Overshoot Portion of OCRT EF Energy
As EF (gha) = energy used ÷100 (carrying capacity of land)
Consequently
Energy used = EF (gha) × 100 (carrying capacity of land)
As shown in Table 5.82 the EF of OCRT is 0.138, so its energy use is equivalent to:
Chapter 5: First case study – Otago Central Rail Trail
259 | P a g e
Table 5.89: OCRT overshoot energy use by categories (2011) Category EF (gha) % Overshoot portion of energy use (GJ/year) Transportation 1,167 72.2 91,918.1 Food 401.2 24.8 31,573 Accommodation 42.4 2.6 3,310.1 Activities 6.57 0.4 509.2 Total 1,617 100 127,310.4
5.10. OCRT Economic Footprint
5.10.1. OCRT GDP
According to CODC (2011: 23) in 2011, the direct output of the OCRT was equivalent
to $8,159,042 and its total output was $12,277,024 (Table 5.90). Likewise, in 2011 the
OCRT direct contribution to GDP was $4,213,793 and its total contribution to GDP was
$6,245,289 (Table 5.90). Table 5.90 also shows that in 2011 a total of 121 full time
staffs were in employment related to the OCRT.
Table 5.90: The economic impact of the OCRT on the Central Otago/Otago economy
Impact summary Direct Total Output $8,159,042 $12,277,024 GDP $4,213,793 $6,245,289 Employment (FTE’s) 96.0 121.3 • Reference: Central Otago District Council (CODC), 2011:23
In 2011 of the total $6,245,289 OCRT contribution, accommodation formed the major-
ity of $2,837,412 of total OCRT GDP followed by vehicles and equipment hire
($975,119), and business administration and managerial services ($900,602) (Table
5.91). Other categories included food and consumables, road passenger transport, retail,
and entertainment, with GDP contributions in the range of $61,925- $782,795 (Table
5.91). Moreover, in comparison with other the categories, OCRT accommodation had
the largest total output of $5,301,246, followed by food and consumables ($1,840,428),
business administration and managerial services ($1,736,101), and vehicles and equip-
ment hire ($1.735,894) (Table 5.91). Other categories including retail, road passenger
transport, and entertainment had total outputs between $452,305 and $107,016 (Table
5.91).
Chapter 5: First case study – Otago Central Rail Trail
260 | P a g e
Table 5.91: Economic impact of OCRT- by categories Category Output Total output GDP Total GDP Accommodation $3,557,833 $5,301,246 $1,956,837 $2,837,412 Food and consumables $1,226,952 $1,840,428 $539,859 $782,795 Retail $297,569 $452,305 $157,712 $241,299 Road Passenger Transport $665,081 $1,104,034 $259,382 $446,136 Vehicle and equipment hire $1,257,894 $1.735,894 $717,000 $975,119 Business administration and managerial services
$1,085,063 $1,736,101 $542,532 $900,602
Entertainment $68,600 $107,016 $40,474 $61,925 Total $8,159,042 $12,277,024 $4,213,793 $6,245,289 • Reference: Central Otago District Council (CODC), 2011:23
5.10.2. OCRT: Sustainable Portion of GDP (GDPs)
As explained in Chapter 4 this thesis uses the sustainable portion of GDP (GDPs) as an
economic indicator to evaluate OCRT economic development as being sustainable. Cal-
culation of the GDPs of the OCRT involves the following four factors:
1. Total cost to generate 1GJ energy through using renewable resources in New Zea-
land
2. Total overshoot portion of OCRT energy use/year
3. Total cost to generate overshoot portion of OCRT energy use through using renew-
able resources
4. Total OCRT contribution to GDP
5.10.2.1. Renewable Energy Cost
Table 5.92 comprises the annualized cost to generate energy through using different
technologies in the USA. As shown in this Table , in comparison with other energy
technologies, using Solar photovoltaics (PV) costs the most at >$0.20/kWh in 2005-
2010, followed by wind offshore ($0.10-0.17/kWh), and wave, tidal and concentrating
solar power (CSP) at about the same cost ($0.11-0.1/kWh). Interestingly, even at pre-
sent geothermal, onshore wind and hydro-electricity (all classed as renewables) can
work out cheaper than conventional energy sources (Table 5.92).
Chapter 5: First case study – Otago Central Rail Trail
261 | P a g e
Table 5.92: Approximate fully annualized generation and conventional transmission cost for WWs power.
Chapter 5: First case study – Otago Central Rail Trail
262 | P a g e
As shown in Table 5.95, in 2011 the total OCRT GDP was $6,245,289 and its overshoot
energy use is equivalent to 127,310.4GJ/year. Since the average cost of generating 1GJ
of energy through using wind and solar systems is NZ$19.8 (Table 5.95), the conse-
quent cost of generating the total OCRT overshoot energy use is equivalent to
(127,310.4 GJ/year × NZ$19.8) = NZ$2,720,746 (Table 5.95). The OCRT GDPs is
equivalent to its total GDP ($6,245,289) less the total cost to generate the overshoot
portion of its energy use by wind-solar systems (NZ$2,720,746) = NZ$3,524,543 (Table
5.95).
Table 5.95: OCRT-sustainable portion of total GDP (GDPs) Total OCRT GDP (NZ$) 6,245,2891
EF (gha) 1,6172
Overshoot EF (gha) 1,2733
Overshoot energy use (GJ) 127,310.44
Energy cost (NZ$/GJ) wind-solar 19.85
Total cost (NZ$) to generate the overshoot portion of OCRT energy use by wind-solar systems
2,720,746
GDPs (NZ$)6 3,524,543 1.See Table 5.91 2.See Table 5.89 3.See Table 5.89 4.See Table 5.89 5.See Table 5.94 6.GDPs= Total GDP - Total cost to generate the overshoot portion of energy use through the use of renewable
resources
Figure 5.42 makes a comparison between OCRT GDP and its GDPs. As illustrated
OCRT GDPs is NZ$ 2,720746 (43.6%) less than OCRT GDP (NZ$6,245,289). On the
other hand, 43.6% of total OCRT GDP must be spent to reduce its environmental im-
pacts to the level of sustainable living as it relates to the EF of holidays, as cited in Ta-
ble 5.87. As explained above, the calculation of GDPs is based on the assumption of
the reducing cost of solar energy following historic cost trends.
Chapter 5: First case study – Otago Central Rail Trail
263 | P a g e
5.11. OCRT Cultural Footprint (CF)
This Thesis uses the CF model explained in Chapter 4 to explore the cultural footprint
of the OCRT on the host destination. In this case, study of the CF of the OCRT is re-
lated to the three categories of the CFs of food, accommodation, and visitor activities
. Since there is no suggestion about using sustainable transportation on any OCRT web-
sites and all current transportation is of conventional type, the CF of this category is not
included in this research. Moving to sustainable transport is considered here to be a na-
tional rather than a local issue when it comes to tourism. Nevertheless, it must still be
recognised that the largest component of the tourism EF relates to visitor transportation.
Local sustainable transport as it relates to tourism is an area for further research.
5.11.1. OCRT CF: Food
Table 5.96 contains summarised results of two proposed scenarios for OCRT food pro-
duction (see Chapter 5-5.5.1 and 5.5.2). As shown in Table 5.96 the total conventional
food consumed in the first scenario is 78,508.45kg (100% of consumed food) and in the
second scenario this same total is made up of 65165.05kg (83%) conventional food and
13346.4 kg (17%) home generated (organic food).
The total EF of OCRT food in the first scenario is 424.4gha/ year and in the second sce-
nario this reduces by 5.5% to 401gha/year. Obviously more use of local food would not
0
1
2
3
4
5
6
7
OCRT-economic impact
Mill
ion
NZ$
GDP
GDPs
Figure 5.42: OCRT- GDP and GDPs
Chapter 5: First case study – Otago Central Rail Trail
264 | P a g e
just be an advertising advantage for OCRT tourism but would also reduce its environ-
mental impact.
As shown in Table 5.96, in the second scenario the overshoot portion of the energy re-
lated to the food consumed is 31,573 GJ/year. This is calculated by working out the EF
of providing the same food in a sustainable way. As shown in Table 5.86, in the overall
OCRT, overshoot EF is 0.108gha/visitor, and the total overshoot in 2011 was 1,273gha.
Since the EF of consumed food in the first scenario (EF1) is 23.2 gha bigger than the EF
of food in the second scenario (EF2), the overshoot portion of the energy related to food
consumed in the first scenario is calculated through the following steps:
EF1- EF2= 23.2 gha
Overshoot energy of the first compared to the second scenario = 23.2 gha × 100 (aver-
age global carrying capacity) = 2,320 GJ/year
Since the overshoot portion of energy use related to the current situation with regard to
food eaten by visitors to the OCRT has already been calculated (see Table 5.89), it is
used as a base to calculate the overshoot energy related to the first scenario through the
following steps.
Overshoot energy consumed food (second scenario) = 31,573 (GJ/year)
Overshoot portion of energy used of the first scenario = 31,573 GJ/year (overshoot en-
ergy second scenario) + 2,320 GJ/year (difference between first and the second scenar-
ios expressed as energy) = 33,893 GJ/year (Table 5.96).
Moreover the overshoot portions of EF2 and EF1 are calculated by dividing their over-
shoot energy into 100 (average carrying capacity of the land) (Table 5.96). Conse-
quently the overshoot portion of EF2 is 31,573÷ 100 = 315.73gha/year (see Table 5.96)
and the overshoot portion of EF1 is 33,893 ÷ 100 = 338.93gha/year (see Table 5.96). As
the cost to generate 1GJ energy through using wind-solar systems is NZ$19.8, the cost
to generate the overshoot energy of food in the first scenario is 33,893 GJ × NZ$ 19.8 =
NZ$671,081 (see Table 5.96). Likewise the total cost to generate the overshoot energy
through using wind-solar systems in the second scenario is NZ$19.8× 31,573 GJ/year =
NZ$625,145 (Table 5.96).
Chapter 5: First case study – Otago Central Rail Trail
265 | P a g e
As shown in Table 5.96, the food GDP in both scenarios is NZ$782,795. As a result
GDPs1=NZ$782,795 (GDP) – NZ$671,081 = NZ$111,417
and GDPs2 = NZ$782,795(GDP) – NZ$625,145 = NZ$157,650
The difference between GDPs1 and GDPs2 gives the NZ$45,936 of contribution to
GDPs through producing 13,346.4kg home generated (organic) food by OCRT accom-
modation services. In addition it can be considered that producing 1kg home generated
(organic) food increases GDPs by NZ$3.44 (NZ$45,936÷13,346.4kg) (Table 5.96).
Table 5.96: OCRT- Local product (food) – contribution to GDPs
First scenario (100% conventional food) Second scenario (83% conventional food and 17% home generated (Organic) food
Total conventional food (kg) 78,508.45 Total conventional food (kg) 65165.05 Total home generated food (kg)
0.00 Total home generated food (kg)
13,346.4
Total EF of consumed food gha/year – (EF1)
424.4 Total EF of consumed food gha (EF2)
401.2
Overshoot portion of energy of consumed food (GJ/year)
33,893 Overshoot portion of energy of consumed food (GJ/year)
31,5731
Overshoot portion of EF1 (gha/year)
338.93 Overshoot portion of EF2 (gha/year)
315.73
Cost to generate 1GJ energy through using wind-solar sys-tems (NZ$)
19.8 Cost to generate 1GJ energy through using wind-solar systems (NZ$)
19.8
Total cost to generate over-shoot energy through wind- solar systems (NZ$)
671,081 Total cost to generate over-shoot energy through wind-solar systems (NZ$)
625,145
Total food GDP (NZ$) 782,795 Total food GDP (NZ$) 782,795 Total food GDPs1 111,714 Total food GDPs 2 157,650 1. See Table 5.89 • Increased portion of GDPs influenced by using 13,346.4 (kg) home cooked food = NZ$ 45,936= NZ$ 3.44/ kg
5.11.1.1. Sustainable Life: Food (Ideal Model)
Table 5.96 shows that the present EF of the 78,508.45kg OCRT food consumed (second
scenario) is 401.2 gha and its overshoot portion of EF2 is 315.73gha. As a result the
sustainable EF of OCRT food consumed can be determined through the following equa-
tion:
a. 401.2 gha (EF2) – 315.73gha (overshoot portion of EF2) = 85.47gha = sustainable
life EF of OCRT food
In the ideal model for OCRT food consumed, since the overshoot portion of energy use
is equal to zero, the GDPs is equal to the total GDP of OCRT food (NZ$782,795, see
Table 5.96). This study uses the ideal model of OCRT food consumed by visitors to
Chapter 5: First case study – Otago Central Rail Trail
266 | P a g e
compare the two scenarios shown in Table 5.96 with the sustainable life model for food
consumption.
As shown in Figure 5.43, the area of the triangle described by ‘Q 1, EF 1, and GDPs1’
illustrates ordinary life, or the area in which all OCRT visitors consume 100%
(78,508.45 kg) conventional food (first scenario). In this area, the development of the
OCRT does not exert any influence on its host destination and visitors to produce and
consume local food. In Figure 5.43 the EF of using 100% conventional food (EF 1) is
424.4 gha/ year and this figure is used to represent 100% of the EF of OCRT food con-
sumed by visitors. In the ordinary life area, GDPs1 is NZ$111,714 (see Table 5.96).
Comparison between the first scenario and the ideal model of OCRT food consumption
indicates that in the first scenario EF 1 (424.4 gha) is 79.9% bigger than the ideal EF for
food consumption (85.47gha-see 5.11.1.1.a) (Figure 5.43 and Table 5.96). Moreover, as
shown in Figure 5.43 in the first scenario, GDPs1 is equal to 14.3% of the total GDP of
OCRT food. On the other hand, 85.7% of the total GDP of food must be spent to change
EF 1 to the ideal EF through generating the overshoot portion of food energy use by us-
ing wind-solar systems.
In Figure 5.43, the area of the triangle ‘Q 2, EF2, and GDPs2’determines the area of the
OCRT CF through producing and consuming home generated (organic) food. As dem-
onstrated in Figure 5.43 in the CF, total food consumed by OCRT visitors Q 2
(78,508.45 kg) is divided into the two portions of 17% (13,346.4) home cooked food
(Q 3) and 83% (65,165.05 kg) conventional food (Q 4). The GDPs2 in the area of the
CF is NZ$157,650, which is 5.8% (NZ$45,936) more than GDPs1(NZ$111,714) in the
ordinary life area (Table 5.96).
Figure 5.43 and Table 5.95 indicate that using 17% home generated (organic) food re-
duces the total EF (EF 1) of OCRT food consumed by 5.5% (shown in Figure 5.43 as R-
EF1). Moreover, as illustrated in Figure 5.43, producing 17% local food increases
GDPs1 by 5.8% (NZ$ 45,936), shown in the figure as (I) GDPs1.
Comparison between the ideal model and present pattern of OCRT food consumption
shows that EF2 (401.2 gha) is 74.4% (315.7 gha) more than the ideal EF (85.47gha) and
Chapter 5: First case study – Otago Central Rail Trail
267 | P a g e
79.9% (NZ$625,145) of the GDP (NZ$782,795) of food must be spent to reduce this
overshoot portion of EF2 to the ideal EF (Table 5.96 and Figure 5.43).
- Q: 100% local food in ideal model - Q 1: 100% conventional food – first scenario - Q 2: 83% conventional food + 17% home generated food - second scenario - Q 3: 17% home generated food (second scenario) - Q 4: 83% conventional food (second scenario) - GDPs1: sustainable portion of GDP – first scenario - GDPs2: Sustainable portion of GDP – second scenario - (I) GDPs1: increased portion of GDPs1 - EF 1: ecological footprint of food- first scenario - EF2: ecological footprint of food- second scenario - R- EF 1: reduced portion of total EF 1 of consumed food
5.11.2. OCRT CF: Accommodation Services
This study explores the CF of the 788 OCRT accommodation services through using
three scenarios. In the first scenario, all buildings used as accommodation services are
assumed to be newly constructed buildings (NB) without any open air areas (veranda
and balcony). In the second scenario 10% of OCRT accommodation buildings are RB
and 90% are NB. In addition, in the second scenario all areas of buildings including in-
door and outdoor (V/B) spaces are calculated as indoor spaces. In the third scenario
90% (58,972 m2) of buildings are NB, 10 % (21,378 m2) are RB and 387 m2 of total
building area is outdoor sitting space (V/B) (Table 5.97).
Figure 5.39: The cultural footprint (CF) of OCRT visitors’ food
80%
17 %
0.00%
60%
40%
100%
Q
Q 3
Q 1
80%
17 %
0.00%
60%
40%
100%
Q
Q 3
Q 1
(R) EF1 (5.5%)
Q 4
EF 1(100%) GDP-Food (100%)
GDPs1(14.3%)
GDPs2 (20.1%)
EF2 (94.5%)
Food- Ideal EF (20.1%)
Q 2 Ordinary life- area-first scenario
Ideal model - Food
Second scenario –Present OCRT-food
(I) GDPs1= 5.8%
Chapter 5: First case study – Otago Central Rail Trail
268 | P a g e
The third scenario determines the present quantity, quality, EF and GDPs of the OCRT
accommodation services. Comparison between the EFs and GDPs of the first and the
second scenario indicates the ecological and economic effects of using RB buildings (as
cultural heritage and capital) on a host destination. Likewise, comparison between the
second and third scenario suggests the environmental and economic footprint of using
open air areas (V/B) in accommodation services as an element of architecture. In addi-
tion, comparison between the first and third scenario reflects the total environmental
and economic effects of using RB buildings as accommodation services and V/B as a
part of architecture.
Table 5.97 shows that in the first scenario the total EF of using 100% (80,356 m2) NB
as accommodation services is 50.5 gha, and the total GDP of OCRT accommodation
services is equivalent to NZ$2,837,412 (see Table 5.91). Since the overshoot portion of
energy use related to the third scenario (current situation) has already been calculated
(see Table 5.89), it is used as a base to calculate the overshoot energy related to the first
and second scenario through the following steps:
Overshoot energy use (third scenario) = 3,310.1 GJ/year
EF 1: Ecological footprint of accommodation services (first scenario) = 50.5 gha/year
EF 3: Ecological footprint of accommodation services (third scenario) = 42.4 gha/year
Increased in EF 1 relative to EF 3= (EF 1) – (EF 3) = 50.5 – 42.4 = 8.1 gha/year
Increased portion of overshoot energy for first scenario relative to third scenario = 8.1
gha × 100 GJ/gha (global average carrying capacity of land) = 810 GJ
The overshoot energy of the first scenario = 810 GJ + 3,310.1 GJ (overshoot energy of
the third scenario) = 4,120.1 (Table 5.97).
As the cost to generate 1GJ of energy using wind-solar systems is NZ$19.8, conse-
quently the total cost to generate the overshoot energy of the first scenario is: NZ$19.8×
4,120.1 GJ = NZ$81,578.
GDP earned through OCRT accommodation services in all three scenarios is equivalent
to NZ$2,837,412. The sustainable portion of GDP in the first scenario (GDPs1) is
equivalent to: NZ$ 2,837,412 (total OCRT accommodation GDP) - NZ$ 81,578 (cost to
generate overshoot energy of the first scenario) = NZ$2,755,834.
Chapter 5: First case study – Otago Central Rail Trail
269 | P a g e
In the second scenario, the area of OCRT accommodation buildings (80,356 m2) is di-
vided into the two parts of NB buildings (58,972 m2) and RB buildings (21,378 m2)
(Table 5.96). In the second scenario the total EF of OCRT accommodation services (
EF2) is 43.2 (gha) and total accommodation GDP is NZ$2,837,412, as for GDP in the
first scenario.
The overshoot energy use for the third scenario is used as a base to calculate the over-
shoot energy use of OCRT accommodation services in the second scenario through the
following steps:
Overshoot energy use (third scenario) = 3,310.1 GJ/ year
EF 3: Ecological footprint of accommodation services (third scenario) = 42.4 gha/year
Increased portion of EF2 over EF 3 = (EF2) – (EF 3) = 43.2 – 42.4 = 0.8 gha
Increased overshoot energy use of second scenario relative to third scenario = 0.8 gha ×
100 GJ/ gha (global average carrying capacity of land) = 80 GJ
The overshoot energy use of the second scenario = 80 GJ + 3,310.1 GJ (overshoot en-
ergy use of the third scenario) = 3,390.1 GJ (Table 5.97)
As the cost to generate 1 GJ of energy through using wind-solar systems is NZ$19.8,
the total cost to generate the overshoot energy of the second scenario is: NZ$19.8 ×
3,390.1 GJ = NZ$67,124 (Table 5.97). The sustainable portion of GDP in the second
scenario (GDPs2) is equivalent to: NZ$ 2,837,412 (total OCRT accommodation GDP) -
NZ$67,124 (cost to generate overshoot energy of the second scenario) = NZ$2,770,288
(Table 5.97).
In the third scenario, the area of OCRT accommodation buildings (80,356 m2) is di-
vided into the two areas of NB buildings (58,972 m2) and RB buildings (21,378 m2)
(Table 5.97). In this scenario the total area (80,356 m2) of NB and RB is made up of 378
m2 V/B and 79,978 m2 indoor spaces.
In the third scenario the total EF of OCRT accommodation services (EF 3) is equivalent
to 42.4 (gha) and total accommodation GDP is NZ$2,837,412, the same as GDP in the
first and second scenarios (Table 5.97). EF 3 that contains the EFs of NB and RB build-
Chapter 5: First case study – Otago Central Rail Trail
270 | P a g e
ings and open air spaces (V/B) used as part of the accommodation services is the pre-
sent EF of OCRT accommodation services (Table 5.97).
As shown in Table 5.97, the total overshoot energy use in the third scenario (the present
overshoot energy of OCRT accommodation services) is 3,310.1 GJ. Since the cost to
generate 1 GJ of energy through using wind-solar systems is NZ$ 19.8, then the total
cost to generate 3,310.1 GJ through using wind-solar systems is: NZ$19.8 × 3310.1(GJ)
= NZ$65,540 (Table 5.97).
Table 5.97: OCRT- Accommodation services- CF (2011) First scenario Second scenario Third scenario
All OCRT accommodation build-ings are NB
90 % of 788 OCRT accommoda-tion buildings are NB and 10 %
RB (V/B not considered)
90% of 788 accommodations (including camp sites and build-ings) are NB and 10% are RB
buildings including 387m2 V/B Total number of accommodation ser-vices
7881 Total number of ac-commodation ser-vices
788 Total number of accommodation services
788
NB accommodation area (m2)
80,3562 NB accommodation area (m2)
58,9722 NB accommoda-tion area (m2)
58,9722
RB accommodation area (m2)
0.00 RB accommodation area (m2)
21,3782 RB accommoda-tion area
21,3782
Total EF (EF 1) (gha)
50.53 Total EF (EF2) (gha) 43.24 Total EF (EF 3) (gha)
42.4
GDP (NZ$) 2,837,412 GDP (NZ$) 2,837,412 GDP (NZ$) 2,837,412 Overshoot energy use (GJ/year)
4,120.1 Overshoot energy use (GJ/year)
3,390.1 Overshoot energy use (GJ/year)
3,310.1
Cost to generate 1 GJ energy using wind- solar systems (NZ$)
19.8 Cost to generate 1 GJ energy using wind- solar systems (NZ$)
19.8 Cost to generate 1 GJ energy using wind- solar sys-tems (NZ$)
19.8
Cost to generate 4,120.1 GJ energy using wind-solar systems (NZ$)
81,578 Cost to generate 3390.1GJ energy using wind-solar systems (NZ$)
67,124 Cost to generate 3,310.1 energy using wind-solar systems (NZ$)
65,540
GDPs1 2,755,834 GDPs2 2,770,288 GDPs3 2,771,872 1. See Table 5.15 2. See Table 5.23 (the sum of areas include 378m2 V/B) 3. See Table 5.36 4. See Table 5.37
The GDPs of the third scenario GDPs 3 (the present GDPs of OCRT accommodation
services) is calculated through the following equation:
GDPs 3 = NZ$2,837,412 (total GDP of OCRT accommodation services) – NZ$65,540
(cost to generate 3,310.1 GJ energy through using wind-solar systems) = NZ$2,771,872
(Table 5.97).
Chapter 5: First case study – Otago Central Rail Trail
271 | P a g e
5.11.2.1. Sustainable living OCRT Accommodation Services (Ideal Model)
This section determines an ideal model for OCRT accommodation services such that the
EF is in an environmentally sustainable range. The GDPs for this model is then calcu-
lated. This ideal model is used to compare each of the three scenarios for OCRT ac-
commodation services (Table 5.96) with an environmentally and economically sustain-
able version to explore how using RB buildings as accommodation and V/B as parts of
architecture (as social behaviours) can contribute to achieving this ideal model.
a. Sustainable EF
As shown in Table 5.97 the total overshoot energy of OCRT accommodation services at
present is 3,310.1 GJ/year. As a result the overshoot portion of the EF can be calculated
through the following steps:
Overshoot portion of the EF of OCRT accommodation services = 3,310.1 GJ (overshoot
energy use) ÷ 100 (carrying capacity of land) = 33.1 gha
Table 5.96 shows that EF 1 (present EF of OCRT accommodation services) is 42.4 gha
So the sustainable EF of OCRT accommodation services is equivalent to:
42.4 gha (present EF of OCRT accommodation services) – 33.1gha (overshoot portion
of the EF of OCRT accommodation services) = 9.3 gha
b. Sustainable Living GDPs
Since for sustainable living the EF of accommodation services is not in overshoot, con-
sequently, in this position both the overshoot energy use and the cost to generate this
through using wind-solar systems are zero. Consequently: assuming that the Ideal
model has the same GDPs as the current model, GDPs of sustainable accommodation
services = Total GDP of accommodation services – 0.00 (total cost to generate over-
shoot energy of accommodation services) = Total GDP of accommodation services =
NZ$2,837,412 (see Table 5.97).
5.11.2.2. Comparison between the Ideal Model, First and Second Scenarios
Figure 5.44 comprises the quantities, EF and GDPs of OCRT accommodation services
for the ideal model and first and second scenarios as discussed above. This figure gives
the opportunity to explore the ecological and economic influences exerted by using RB
buildings as accommodation on the host destination.
Chapter 5: First case study – Otago Central Rail Trail
272 | P a g e
As shown in Figure 5.44, in the ideal model of accommodation services, Q is 100% of
the OCRT accommodation area (80,356 m2) with an EF of 9.3 gha EF and a GDPs of
NZ$ 2,837,412, which is equal to 100% of the GDP of OCRT accommodation services.
In the ideal model as discussed above the overshoot portion of EF and energy use are
zero. In the first scenario, Q1 is the total area of OCRT accommodation services
(80,356 m2) for which 100% of accommodation services are assumed to be new build-
ings (NB) (Figure 5.44). In the second scenario as illustrated in Figure 5.44, Q 2 is the
OCRT accommodation area (80,356 m2) divided into the two parts; 73.4% (58,972 m2-
see Table 5.97) NB and 26.6% (21,378 m2-see Table 5.97) RB.
In Figure 5.44, EF 1 is the biggest EF in comparison with the EFs of the other scenarios
and it is considered as the 100% EF benchmark. Moreover, in Figure 5.44, EF2 and
ideal EF are compared with EF 1 in percentage terms.
As shown in Figure 5.44, in the ideal model of OCRT accommodation services the ac-
ceptable EF is 9.3 gha or 18.4% of EF 1 (EF 1 is 50.5gha-see Table 5.96). Alternatively,
in the first scenario in which all accommodation is assumed as NB, the EF (EF 1=
50.5gha) is 82% bigger than the sustainable EF (ideal EF= 9.3gha).
As illustrated in Figure 5.44, the EF of OCRT accommodation services in the second
scenario (EF2= 43.2gha- see Table 5.97) is 85.4% of EF 1(50.5). Consequently in this
scenario (R) EF 1 (reduced portion of EF 1) is equal to 14.6% of EF 1= 7.3 gha.
As shown in Figure 5.40, the total GDPs1 (GDPs of the first scenario = NZ$2,755,834)
is equal to 97.1% of total GDP of OCRT accommodation services (NZ$2,837,412). On
the other hand, in the first scenario 2.9% (NZ$82,285) of the total GDP of OCRT ac-
commodation services must be spent to generate the overshoot portion of accommoda-
tion energy use through wind-solar systems to change EF 1 to the ideal EF.
Figure 5.44 determines that GDPs2 (NZ$2,770,288-GDPs of second scenario) is equal
to 97.6% of total OCRT accommodation GDP (NZ$2,837,412). Indeed in the second
scenario 2.4% (NZ$68,098) of the total GDP of OCRT accommodation services must
be spent to generate the overshoot portion of OCRT accommodation energy use through
wind-solar systems to reduce EF2 to an ideal EF. Likewise, as determined in Figure
5.44, (I) GDPs1 (increased portion of GDPs1) is equal to 0.5% of total OCRT accom-
Chapter 5: First case study – Otago Central Rail Trail
273 | P a g e
modation GDP. This means using 21,378 m2 (26.6% of total OCRT accommodation
services area) of accommodation buildings as RBs contributes to an increase of 0.5% in
GDPs1.
5.11.2.3. Comparison between the Ideal Model, Second and Third Scenarios
As shown in Figure 5.44, in the third scenario Q 3 is the total area of OCRT accommo-
dation services in which 73.4% (58,972 m2) of the area is NB and 26.6% (21,378 m2) is
RB. Furthermore, in the third scenario of total Q 3 (80,356 m2) 387 m2 (0.5%) is V/B
and 79,996 m2 (99.5%) is indoor spaces (Figure 5.44).
In the third scenario, the total EF of OCRT accommodation services (EF 3) is 42.4 gha
(see Table 5.97) which is equal to 84% of EF 1 (Figure 5.44). As shown in Figure 5.44,
EF 3 (84% of EF 1) is 1.5% smaller than EF2 (85.5% of EF 1). On the other hand (R)
EF2 is equivalent to (EF2) – (EF 3) = 1.5% of EF 1 (EF of the first scenario that is used
as a base or 100% EF of OCRT accommodation services). EF 3 is the present EF of
OCRT accommodation services, which is still 65.6% (84%-18.4%) bigger than the ideal
EF, and is shown in Figure 5.44.
Figure 5.44 and Table 5.97 show that the GDPs of the third scenario (GDPs 3) which is
the present GDPs of OCRT accommodation services is 1% (NZ$28,374 of
NZ$2,837,412) more than GDPs2. Furthermore, GDPs 3 is 2.3% (NZ$ 65,261) less
than the total GDP (NZ$2,837,412) of OCRT accommodation services (Figure 5.44 and
Table 5.97). This means (I) GDPs2 is influenced by using 387 m2 V/B at a value equal
with 1% of total GDP of OCRT accommodation services. In addition, Figure 5.40
shows that in the third scenario (present circumstance of OCRT accommodation ser-
vices) 2.3% (NZ$65,260) of its GDP must be spent to generate its overshoot portion of
energy use through using wind-solar systems to reduce its present EF to the ideal EF.
Chapter 5: First case study – Otago Central Rail Trail
274 | P a g e
- Q: (100%) area of 788 OCRT accommodation services (80,356 m2) - ideal model
- GDP: Total NZ$2,837,412 GDP of OCRT accommodation services (see Table 5.95)
- GDPs: Total sustainable portion of OCRT accommodation services – ideal model
- Q 1: Total (100%) area of 788 OCRT accommodation services (80,356m2) – 100% NB accom-
modation services - first scenario
- EF 1: Total EF of OCRT accommodation services - first scenario
- (R) EF 1: Reduction of OCRT EF 1 influenced by using RB buildings as OCRT accommodation
services
- GDPs1: Total GDPs of OCRT accommodation services - first scenario
- (I) GDPs1: Increased portion of GDPs1 from using RB buildings as part of OCRT accommoda-
tion services
- Q 2: Total (100%) area of 788 OCRT accommodation services (80,356m2); 73.4% (58,972m2)
NB and 26.6% (21,378m2) RB - second scenario
- Q 3: Total (100%) area of 788 OCRT accommodation services (80,356m2); 73.4% (58,972m2)
NB and 26.6% (21,378m2) RB. Of total Q 3 (80,356m2) 387m2 (0.5%) is V/B and 79,996m2 is
indoor spaces - third scenario
- Q 4 (NB area): 73.4% (58,972m2) of total OCRT accommodation area (80,356m2) - second sce-
nario
- Q 5 (RB area): 26.6% (21,378m2) of total OCRT accommodation area (80,356m2)- second sce-
nario
- EF2: EF of 80,356m2 OCRT accommodation services (Q 2) including EFs of Q 3 and Q 4
- GDPs2: Total GDPs of OCRT accommodation services - second scenario
Ideal Model
First scenario
Second scenario
Third scenario
GDPs3 (97.7 % GDP)
Ideal- EF (18.4% of EF 1)
GDPs2 (97.6 % GDP)
GDPs1 (97.1% GDP)
GDPs = 100% GDP
(I) GDPs1 (0.5%) V/B
Q
Q 2
Q 1
80%
0.00%
26.6 %
60%
40%
100%
Q 3
Q 5
Q 4
Figure 5.44: The CF of OCRT accommodation services- using RB buildings and V/B as parts of accommodation services
R- EF2 (1.5%)
EF 1(100%)
EF2 (85.5% of EF 1) EF 3 (84% of EF 1)
R- EF 1 (14.5%)
(I) GDPs2 (0.1%)
Chapter 5: First case study – Otago Central Rail Trail
275 | P a g e
5.11.3. The CF of OCRT Visitor Activities
5.11.3.1. Overshoot EF of OCRT Visitor Activities
As shown in Table 5.98, other activities (excepting curling, golf and walking) have the
largest share at 82% (5.39 gha) of the total EF of OCRT activities (6.57gha), followed
by curling (10.65%), golf (7.3%) and walking (0.06 %). Table 5.98 shows that the total
overshoot of OCRT activities is equal to 10.18 gha (see also Table 5.88). The overshoot
portion of each of the above EF categories (Other activities, curling, walking and golf)
is calculated by the following equation:
Overshoot of the EF of each category = the percentage of the EF of activity ×total over-
shoot EF of OCRT activities (10.18gha)
For example:
Overshoot EF of golf = 7.3% × 10.18(gha) = 0.74 gha (see Table 5.98).
Furthermore the overshoot energy use of each category is calculated as its overshoot EF
× 100 (global average carrying capacity) (Table 5.98).
As shown in Table 5.98, in comparison with the other categories, other activities have
the largest overshoot energy at 835 GJ, followed by, curling (108GJ), golf (74) and
walking (0.6 GJ).
5.11.3.2. OCRT Activities: GDP
This thesis proposes that the sum of the monies for vehicle-equipment hire
(NZ$975,119), road passenger transport (NZ$446,136) and entertainment ($61,925), as
shown in Table 5.91, are used to represent the total GDP of OCRT visitor activities
(NZ$1,483,200) (Table 5.98). As the total number of OCRT annual visitor activities is
26,077 (see Table 5.82) then the GDP/visitor activity can be calculated as follows:
Other 21,503 0.00025 5.39 Other 21,503 0.00025 5.3 Total 26,077 - 6.57 26,077 - 5.5
1. See Table 5.58 2. See Table 5.54 3. See Table 5.56 4. NV: Number of visitor activities As shown in Table 5.100 and Figure 5.45 in comparison with the first scenario, in the
third scenario the EF 3 is reduced by 16.28 % (1.07 gha) when compared with EF 1 be-
cause of the change in activities. In addition, the overshoot portion of the EF of OCRT
activities that in the first scenario is 5.09 gha (see Table 5.98) in the third scenario is
reduced to 4.02 gha (5.09gha – 1.07gha). As a result the overshoot energy use of OCRT
activities in the third scenario is equal to 4.02gha × 100 (carrying capacity of land) =
402 GJ. In addition, the total cost to generate the overshoot energy use of OCRT visitor
activities in the third scenario is equal to:
402 GJ (overshoot portion of energy use) × NZ$19.8 (the cost to generate 1GJ energy
through using wind-solar systems) = NZ$7,959.
Since the total GDP of OCRT visitor activities is NZ$1,483,200 (Table 5.98), the GDPs
of the third scenario is equal to NZ$1,483,200 (GDP) - NZ$7,959 (the total cost to gen-
erate overshoot energy use of OCRT visitor activities in the third scenario) = NZ$
1,475,241 (GDPs 3). As shown in Figure 5.45, GDPs 3 is equal to 99.5% of the total
GDP of OCRT visitor activities and (I) GDPs 3 is equal to:
GDPs 3 – GDPs2 = 0.1% of GDP (NZ$1,483,200) = NZ$1,483.
5.11.3.8. Comparison between the Ideal Model and the Third Scenario
As illustrated in Figure 5.45, in the ideal model (the green area in the figure) the envi-
ronmentally sustainable EF for OCRT visitor activities is 22.5% of EF 1(1.48 gha- see
above discussion).
Chapter 5: First case study – Otago Central Rail Trail
280 | P a g e
Figure 5.45 indicates that to change the EF of OCRT visitor activities in the third sce-
nario (EF 3 to sustainable 1.48 gha EF), 0.1% (NZ$1,483) of total GDP of OCRT ac-
tivities (NZ$1,483,200) must be spent to generate its overshoot portion of energy use.
Chapter 5: Summary
This chapter uses the comprehensive framework for the sustainable development of
ecotourism and its architecture to evaluate the ecological, social and economic influ-
ences exerted by the OCRT on its host society. As Mahravan and Vale (2010) and
O’Connor (2009) reveal, in New Zealand, the largest portions of the tourism EF are the
four categories of transportation, food, accommodation services and tourism activities.
Therefore this thesis uses these four categories as the main factors to be evaluated using
the comprehensive framework and the model.
This chapter demonstrates that the 2011 EF of the OCRT is equivalent to 1,617 gha
(0.138 gha/visitor) which derives from the integration of the calculated EFs of transpor-
tation, food, accommodation services and activities used by 11,788 OCRT visitors that
year (see Table 5.84). As shown in Table 5.84 transportation has by far the largest foot-
print of 1,169 gha (72.2%) of the total EF, followed by 401.2 gha (24.8%) for food, 42.4
gha (2.6%) accommodation services and 6.6 gha (0.4%) visitor activities. The total EF
of transportation can be further divided, giving 38.2% (617 gha) of total EF for interna-
tional and 34% (552gha) for domestic transportation. This shows the importance of get-
ting to a tourist destination in its overall environmental impact.
This chapter uses a comparative method by using different scenarios to investigate the
current ecological, social and economic influences of the OCRT and its architecture on
its host society. Using the scenarios allows this thesis to determine how far the OCRT is
from its sustainable goal. For instance, this chapter demonstrates that the total overshoot
EF of the OCRT is equivalent to 1,273 gha (Table 5, 95). This means the existing EF of
the OCRT is 1,273 gha more than its sustainable EF of 388 gha (1,617- 1273) (Table
5.95).
This chapter indicates that 43.6% of OCRT total GDP must be spent to reduce its EF to
its sustainable EF of (1,617- 1273) 388 gha (Table 5.95).
Chapter 5: First case study – Otago Central Rail Trail
281 | P a g e
In response to the research question: “How do the priorities for the sustainable devel-
opment of ecotourism and its products influence each other?” (2.6.1) this chapter deter-
mines that changing the social behaviours of the host society and visitors can influence
their ecological and economic footprints. For example, consuming organic food instead
of conventional food, and using refurbished buildings as accommodation instead of
constructing new buildings, not only contribute to conserving cultural identity in the
host society, but also contribute to reducing their ecological footprint and consequently
increasing their economic footprint.
Furthermore in response to the research question: “What are the main environmental,
cultural and economic characteristics of the activities and products proposed for the sus-
tainable development process of ecotourism?” (2.6.1), Chapter 5 indicates that the prod-
ucts and activities which simultaneously contribute to the cultural, environmental and
economic development of the host society of an ecotourism project can be considered as
having the sustainable cultural footprint as their main characteristic.
This chapter uses the framework and the model through a comparative method to show
how the environmental, social and economic influences of ecotourism products and ac-
tivities can be evaluated as being sustainable. Using the CF model and its results can
thus be seen as the answer to question 2.6.1.7.
In the next chapter the comprehensive framework and the model will be used to explore
and compare the cultural footprints of ecotourism and its architecture in two different
host societies (Naseby and Cromwell) as the second and third case studies.
Chapter 6: Second and Third Case Studies: Naseby and Cromwell –OCRT, New Zealand
282 | P a g e
Chapter 6: Second and Third Case Studies: Naseby
and Cromwell –OCRT, New Zealand
This chapter uses the proposed comprehensive framework for the sustainable develop-
ment of ecotourism and its architecture at the scale of the site and individual building.
The results provide further answers to research questions at these different scales. In
addition this chapter shows how the framework and model can be used to compare dif-
ferent ecotourism host destinations as being sustainable. To achieve this goal, two case
studies of Naseby and Cromwell, as the host destinations of soft ecotourism (OCRT)
with different environmental, cultural, economic heritage and capitals, are used. Also
Naseby and Cromwell are shown to be two host destinations with different attractions
that arise from their particular social ecological characteristics. The outcome of this
chapter will demonstrate the influences exerted by ecotourism and its architecture on the
two case studies from the viewpoint of sustainable development.
6.1. Case Study 2: Naseby
6.1.1. Introduction
This thesis is based on Naseby as a host destination of OCRT visitors with a rich envi-
ronmental and cultural heritage and associated capitals. As explained in Chapter 3 the
main reasons for choosing Naseby as a case study are its use of refurbished buildings as
accommodation services, existence of the curling club visited by 4,350 OCRT visitors
in 2011, and the variety of products and activities offered to visitors at this place (see
3.3.2.2).
This research attempts to explore the ecological, cultural and economic footprints of the
OCRT as a soft ecotourism project at this destination, and their interaction with each
other. This exploration is conducted through using the proposed holistic framework for
the development of ecotourism and its architecture as proposed earlier in this thesis.
Chapter 6: Second and Third Case Studies: Naseby and Cromwell –OCRT, New Zealand
283 | P a g e
This section aims to investigate the influences exerted by ecotourism on the socio-
cultural behaviours of visitors and host communities that in turn could change their en-
vironmental and economic footprint to being sustainable.
The investigation of the influences of the OCRT and its architecture on Naseby is con-
ducted through measurement of the quantity of the cultural products and activities pro-
duced and consumed (numbers of visitors who participate in these activities), and calcu-
lation of their ecological and economic footprints. The results are compared with the
quantities of these factors in a sustainable scenario, as proposed for the development of
ecotourism and its products.
6.1.2: Background to Naseby
Naseby is a town located at elevation of 627m, 45° S and 170°E, about 15 kilometres
from Ranfurly in Central Otago, New Zealand (Figure 6.1). Naseby is set in a valley
surrounded by hills and 25 square kilometres of forest (Figure 6.2). As pointed out by
Sorrel (1999-cited in Naseby Vision, 2012: 2), in more recent times, Naseby has be-
come an important forestry centre with the initial forest having been planted as early as
1900. Naseby Community Program (NCP) (2010: 8) introduces the landscape and heri-
tage aspects of Naseby as fundamental factors that contribute to the perception of this
area as a special place.
Chapter 6: Second and Third Case Studies: Naseby and Cromwell –OCRT, New Zealand
284 | P a g e
Figure 6.1: Naseby-Central Otago- New Zealand http://www.no1guide.co.nz/images/map/Map_of_Central_Otago.jpg viewed August 2012
Chapter 6: Second and Third Case Studies: Naseby and Cromwell –OCRT, New Zealand
285 | P a g e
NCP (2010:7) reveals that Naseby came into existence in 1863 when gold was discov-
ered close to where it stands now and how Naseby was moved to get at the rich ground
beneath it. As noted in the Ancient Briton Hotel, Naseby website (2011:1) the town's
first buildings were of a wooden frame with a calico (cloth) construction and twenty
canvas shops lined each side of a muddy main street. The Ancient Briton Hotel (built in
1863) was the first hotel in Naseby (see Appendix 5 and Figures 6.3, 6.4 and 6.5).
When the town grew, the buildings become more permanent with timber frame con-
struction and with walls and roof covered with corrugated iron sheets. Some buildings
were made of flat schist and glacial moraine stone with a corrugated iron roof, and oth-
ers were constructed from adobe (sun dried mud brick) (see http://www. ancient-
briton.co.nz). As shown in Appendix 5, many of the original miners’ cottages and other
historic buildings and sites still remain in use today in Naseby. NCP (2010:36-37) in-
troduces a list of 23 such buildings, places, sites and objects that are registered as part of
the natural and cultural heritage of New Zealand.
Figure 6.2: A view of Naseby http://www.odt.co.nz/files/story/2010/04/naseby_township__nestled_close_to_the_naseby_fores_1659 772314.JPG viewed August 2012
Table 6.4: Naseby- Number of domestic visitors by home place Region/ city Number of visitors % Upper NI 1,297 35.8 Lower NI 540 14.9 Upper SI 768 21.2 Central SI (Otago) 824 22.75 Lower SI 194 5.35 Total 3,623 100
Table 6.3: Naseby - International Visitors -2011
Home place NV1 % Europe 436 42.7 Australia 336 32.9 UK 129 12.6 North America 92 9 Middle East 14 1.4 South Africa 14 1.4 Total 1,021~ 1,0222 100 1. NV: Number of Visitors. 2. NVs are rounded • Total visitor numbers (2011) = 4,645 (See Table 6.2) • Percentage of International visitors (2011) = 22% (See Table 6.2) • Total number of Naseby international visitors= 1,022 (See Table 6.2)
Chapter 6: Second and Third Case Studies: Naseby and Cromwell –OCRT, New Zealand
291 | P a g e
6.1.4. Transportation
This section explores the types of international and domestic transportation used by
Naseby’s visitors and calculates their EFs. The total EF of Naseby transportation is cal-
culated through integration of the EFs of international and domestic visitors.
6.1.4.1. International Transportation
a. Types of International Transportation Used
Since travelling from overseas to New Zealand by car, bus and train is not possible be-
cause of its geographical location and using a ship takes a long time, all international
travel is here assumed to be by air.
b. International Tourism-kilometres (T-km)
Table 6.5 shows that 1,022 Naseby visitors (22%) are international tourists and the total
distance between their home places and Auckland’s international airport is equivalent to
12,616,876 (T-km). International distances are calculated as a one way trip because the
assumption is made here that their ecological footprint is related to where the plane is
refueled and hence is divided between New Zealand and the home country. Because in-
ternational tourists have to travel from Auckland to Dunedin and back, this part of the
journey is a domestic flight and is equivalent to 2,201,246 T-km which is shown in Ta-
ble 6.5 as air domestic international visitors.
Table 6.5: Naseby - international T-km Home place
Assumed city of origin
(central in country of
origin)
Distance between central
cities and Auckland
(km).
Visitors Total in-ternational
T-km
Auckland to Dunedin
(km, return)
Air domestic international visitors T-km
from Auckland to Dunedin (re-
turn)
No %
Australia Sydney and Mel-bourne
2,512 336 32.9 844,032 2,156 724,416
Europe Frankfurt 18,180 436 42.7 7,926,480 2,156 940,016 UK London 18,334 129 12.6 2,365,086 2,156 278,124
North America
Montana Billings
11,950 92 9 1,099,400 2,156 198,352
Middle East
Tehran 15,005 14 1.4 210,070 2,156 30,184
South Africa
Pretoria 12,272 14 1.4 171,808 2,156 30,154
Total - - 1,022 100 12,616,876 - 2,201,246
Chapter 6: Second and Third Case Studies: Naseby and Cromwell –OCRT, New Zealand
292 | P a g e
6.1.4.2. Types of Domestic Transportation
The types and percentages of transport used for holidays in New Zealand as cited in
Chapter 5 and shown in Table 5.5 (Matthews, 2009:13) are used as a pattern for
transport used by domestic visitors to access Naseby.
a. Domestic Tourism Kilometres (T-km)
This study uses Auckland as the central city for the upper NI and, respectively, Welling-
ton (lower NI), Nelson/Marlborough (upper SI), Otago (central SI) and Southland
(lower SI), to calculate the distances between domestic visitors’ home place and Naseby
(Table 6.6).In addition , to measure the distance between home places of visitors who
came from the upper SI, the average distance between Nelson and Naseby and Marlbor-
ough and Naseby is used (Table 6.6).
Naseby’s visitors who travel by car/van from the upper NI (Auckland) and lower NI
(Wellington) (grey areas in Table 6.6) need to use the ferry to cross to the South Island.
Distances between these places and Middlemarch are separated into three parts; home to
Wellington (except Wellington); Wellington to Picton by ferry; and Picton to Middle-
march (Table 6.6).
Table 6.6: OCRT- domestic T-km Region Central city Distance to Middlemarch (km-return) Number
of Visi-tors
Domestic T-km
Upper
NI
Auckland
Auckland to Wel-lington
Wellington to Picton
Picton to Middlemarch
Total
1,297
3,893,594 1,318 204 1,480 3,002 Lower
NI Wellington - 204 1,480 1,684 540 909,360
Upper SI1
Nelson/ Marlborough
1,6861 1,686 768 1,294,848
Central SI
Otago 12522 125 824 103,000
Lower SI
Invercargill, Southland
488 488 194 94,672
Total - - - - 6,295,474 1. Distance between upper SI and Middlemarch is calculated as the average of distances between Nelson and Middlemarch and Marlborough and Middlemarch. 2. Average distance between central Otago cities and OCRT.
According to Matthews (2009:13), in New Zealand 1% of people going on holiday are
pedestrians but in this study these have been ignored. The remaining 3% of visitors is
assumed to be domestic air travel in Table 6.7. In addition, the ferry T-km of 377,728
Chapter 6: Second and Third Case Studies: Naseby and Cromwell –OCRT, New Zealand
293 | P a g e
(Table 6.7) is subtracted from the total car/van T-km of 5,980,700 to give the road T-
km.
Table 6.7: Types of transport used by OCRT domestic visitors (based on Matthews, 2009:13)
Type of Transport Car/van driver/passenger (%) Bus (%)
Car-Ferry (%)
Air domestic (%)
percent 89 2 6 3 Type of Transport Car/van driver/passenger (km) Bus
(km) Ferry (km)
Air domestic (km)
Tourist-km 5,602,972 125,909 377,728 188,864 Total domestic T-
km 6,295,474
• Numbers are rounded
6.1.4.3. The Ecological Footprint (EF) of Naseby Transportation
Table 6.8 shows that total transportation energy used related to Naseby (2011) is
equivalent to 45,963,318 MJ (45,963.318GJ). The global average land energy conver-
sion capacity is equivalent to 100 GJ/gha. As demonstrated in Table 6.8 the total EF of
Naseby transportation is equivalent to 45,963.318 GJ/ 100 GJ/gha= 459.6 gha.
Table 6.8: EF of Naseby Transportation (2011)
Transport Mode Tourist-km Energy use MJ/passenger-km
Total energy use per yr by OCRT visitors (MJ)
Air International
12,616,876 1.25 (Boeing 747) 15,771,095
Air domestic (International visitors from
Auckland to Dunedin)
2,201,246 3.88 8,540,834
Air domestic 188,864 3.88 732,792 Car/van driver and passenger 5,602,972 3.1 (average) 17369213
Bus 125,909 1.01 127,168 Car-ferry 377,728 9.06 3422216
Total Reference: Vale & Vale, 2009.
45,963,318
EF for all types of transportation used by Naseby visitors 459.6 gha1
1. Total EF of Naseby transportation includes: 243.1 gha ( EF of international transportation) + 216.5 gha (EF of domestic transportation)
Table 6.8 shows the total energy use of Naseby transportation (45,963.318GJ) that in-
cludes 24,311.929 GJ for air international and air domestic (international visitors from
Auckland to Dunedin) and 21,651.389 GJ for domestic transportations. As a result, the
total EF of Naseby transportation (459.6gha) is comprised of 52.9% (243.1 gha) interna-
tional and 47.1% (216.5 gha) domestic transportation.
Chapter 6: Second and Third Case Studies: Naseby and Cromwell –OCRT, New Zealand
294 | P a g e
6.1.5. Food
As shown in Table 6.1, 4,645 visitors came to Naseby in 2011 and the mean number of
nights that tourists stayed is assumed to be 3.6. Thus the total visitor nights for tourists
coming to Naseby/yr are 16,722 visitor nights. Due to the lack of local information, the
food consumption data presented by Collins et al (2005) are used to calculate the EF of
food for Naseby’s visitors.
This thesis uses two scenarios to calculate the EF of food consumed by Naseby visitors
in 2011. In the first scenario, the EF of food is calculated based on the assumption that
100% of food consumed is conventional food eaten out. In the second scenario, the total
food eaten by Naseby visitors is separated into the two areas of local (home prepared)
food (11.8% of total consumed food) and conventional food (88.2% of total consumed
food).
Comparison between the results of the two scenarios will indicate the influence exerted
by the use of home prepared food (as a cultural product) on the EF and the economic
footprint (ECF) of the OCRT.
6.1.5.1. The EF of Naseby Food- First scenario
In the first scenario, the total amount of food eaten by Naseby visitors has been assumed
to have a footprint equivalent to that of food consumed outside the home by Cardiff res-
idents. This totals 67.04 kg per resident/yr (Collins et al, 2005:25) with a footprint of
0.429gha/resident (Collins et al, 2005:32). This means 1kg of food eaten out has an EF
of 0.429/67.04 gha/kg=0.006 gha/kg. The average amount of food eaten by a Cardiff
resident each day is 1.85 kg, and this value has been used for visitors to Naseby. The
results are shown in Table 6.9. The EF of tourist food is equivalent to 1.85×0.006=0.01
gha/visitor night (Table 6.9). The total EF of food consumed by Naseby’s visitors is
equivalent to 16,722×0.01=167.22 gha and the EF of food consumed by Nasby’s visi-
tors/visitor is equivalent to 167.22/4,645=0.036 gha (Table 6.9).
Chapter 6: Second and Third Case Studies: Naseby and Cromwell –OCRT, New Zealand
295 | P a g e
Table 6.9: EF of food consumed by Naseby visitors (2011) Item Data Reference
Naseby visitor numbers (2011) 4,645 (See Table 6.2) Average visitor nights/ visitor 3.6 Total visitor night 16,722 EF of food eaten out gha/cap 0.429 Collins et al , 2005:32 EF of tourist food gha/visitor night
0.01
Total EF of food consumed by Naseby visitors (gha)
167.22 (gha)
EF of food consumed by Naseby visitors/visitor(gha)
0.036 (gha/visitor)
6.1.5.2. The EF of Naseby Food- Second Scenario
This thesis explores the local products (such as food, beverages and wine) offered to
Naseby visitors by 98 separate accommodation services with 611 available bed spaces.
(Appendix 5- Rows 75-90, Naseby). The information related to Naseby products arising
from Appendix 5, are summarised and set out in Table 6.10.
Table 6.10 demonstrates that in 2011, of the 98 separate Naseby accommodation ser-
vices with 611 bed spaces that offered local produce, 10.2% (10) with 72 bed spaces
offered home baking and local food and beverages to their visitors and 2% (2) with 27
bed spaces were offering locally produced wine. As shown in Figure 5.3, the OCRT av-
erage visitor nights is 3.6 visitor nights. Likewise, the total Naseby visitors are 4,645
visitors. Thus the total visitor nights of Naseby is (3.6 visitor nights × 4,645 visitors)
16,722. Since the total Naseby bed spaces are 611, the average visitor nights per bed
space is equivalent to 16,722 (visitor nights) ÷ 611 (bed spaces) = 27.4 (visitor nights/
bed space).Consequently as shown in Table 6.10 the total visitor nights that Naseby
visitors consume local food is equivalent to 72 × 27.5 = 1,973 visitor nights or 11.8% of
the total 16,722 Naseby visitor nights (Table 6.10).
Table 6.10. Naseby- local produce (summary) Produce F % % of 98 accommoda-
tions services Bed spaces Visitor nights1
Local food and beverage 10 83 10.2 72 1,9732
Wine 2 17 2 27 740 Total 12 100 12.2
1. Average visitor nights/ bed spaces= 16,722 (total visitor nights)/611 ( total numbers of bed spaces) = 27.4 2. 72 ( bed spaces) × 27.4 ( average visitor nights per bed space) = 1,973 visitor nights
This thesis uses the EFs of home cooked and conventional foods (per capita, per kg and
per visitor night) as discussed in Chapter 5 (section.5.5.2 and Tables 5.11 and 5.12) to
Chapter 6: Second and Third Case Studies: Naseby and Cromwell –OCRT, New Zealand
296 | P a g e
calculate the EFs of home cooked and conventional foods consumed by Naseby’s visi-
tors as cited in the following Table
Table 6.11 indicates that the EF of local food consumed by Naseby visitors in 2011 is
equivalent to (1,973 visitor nights × 0.0068 gha) 13.4 gha. As the total Naseby visitor
nights is 16,722 (see Table 6.1) and total visitor nights that visitors consume home
cooked food is 1,973, consequently the total visitor nights that Naseby’s visitors con-
sume conventional food is equivalent to 16,722 – 1,973= 14,749 visitor nights (see Ta-
ble 6.11). Moreover the EF of consumed conventional food by Naseby visitors in 2011
is equivalent to 14,749 visitor nights × 0.01 (EF of tourist conventional food- gha/visitor
night) = 147.5gha (Table 6.11). The total EF of consumed food in the second scenario
(present circumstance) including EFs of conventional and home prepared foods is 13.4
gha + 147.5 gha = 160.9 gha (Table 6.11).
Table 6.11: Ecological footprint of home cooked and conventional foods consumed by Naseby visitors (2011)
Home cooked and local food EF Conventional food EF EF of local food gha/cap 0.254 EF of 1 kg conventional food eaten out
(gha/cap) 0.429
EF of 1 kg local food gha/kg 0.0037 EF of tourist food (gha/visitor night) 0.01 EF of local food gha/ visitor night 0.0068 EF of local food of 1,973 visitor nights (gha)
13.4 Total EF of conventional food consumed by Naseby visitors/14,7491 visitor nights (gha)
147.5
Total EF of home prepared and conventional foods (gha) 160.9 1. 16,722 ( total visitor nights) – 1,973 (visitor nights that tourists consume local food) = 14,749
6.1.5.3. Environmental Effects of Using Local Food
Comparing the results of the two scenarios shows that producing 11.8% (3,650kg) of
food locally reduces the total EF of food by 6.32 gha (3.8% of 167.22 gha) (Table 6.12).
Table 6.12: The effect of consuming home prepared food on the EF of food consumed by Naseby visi-
tors (2011)
100% ( 30,936 kg) con-ventional eaten out food
88.2 % (27,286 kg) conventional eaten out food and 11.8 % (3,650 kg) home
prepared (organic) food Naseby EF of food 167.22 160.9 Reduction in EF of food con-sumed by OCRT visitors (gha)
6.32
Chapter 6: Second and Third Case Studies: Naseby and Cromwell –OCRT, New Zealand
297 | P a g e
6.1.6. Naseby Accommodation Services
6.1.6.1. Types of Accommodation Services
This thesis categorises the 98 Naseby accommodation services into the four categories
of self-contained (SC), bed and breakfast (B&B), hotel, and camping based on the in-
formation collected through using the official web site of the OCRT and 15 related
websites for Naseby accommodation services (Appendix 5 and 6-Rows:75-90). Table
6.13 summarises parts of Appendix 5 that address available bed spaces by types of
Naseby accommodation service.
As shown in Table 6.13 and Figure 6.11, in 2011, of the 98 separate Naseby accommo-
dation services the majority of 73.5% are camping sites followed by 18.4% SCs, 6.1%
B&Bs, and 2% hotels, as shown in Table 6.13 and Figure 6.11. This table also shows
how the percentages change when bed space numbers are considered by accommoda-
tion type. Camping still has the highest percentage of bed spaces followed by SC, as
before, but the relative positions of hotels and B&B have changed.
Table 6.13: Naseby- types of accommodation services
Figure 6.11: Naseby- percentage of type and available bed spaces by types of accommodation services (2011)
Chapter 6: Second and Third Case Studies: Naseby and Cromwell –OCRT, New Zealand
298 | P a g e
6.1.6.2. Quality of Accommodation Services
According to the information shown in Appendix 5 and summarised in Table 6.14 this
study qualitatively classifies Naseby’s accommodation services into the two types of
new (NB) and refurbished (RB) buildings. In Naseby, RB accommodation services
cover a range of historical and restored buildings with different original functions, but
currently all of them are used as accommodation services. Likewise new buildings here
are those that have been constructed after the establishment of the OCRT and are used
as accommodation services.
Table 6.14: Naseby- Accommodation services, refurbished (RB) and new buildings (NB) used as accommo-
dation services and their capacity Type TNA %1 RB %1 NB % Capacity
RB NB
C %2 C %2 SC 18 18.4 3 3.1 15 15.3 10 1.6 83 13.6
B&B 6 6.1 1 1 5 5.1 5 0.8 23 3.8 Hotel 2 2 2 2 - - 58 9.5 - - Camping 72 73.5 - 72 73.5 - - 432 70.7 Total 98 100 6 6.1 92 93.9 73 11.9 538 88.1 1. The percentages of the number of renewed/historic and new constructed buildings are calculated based on total num-
ber of Naseby accommodation services (n=98). 2. The percentages of the capacities of renewed/historic and new constructed buildings are calculated based on total ca-
pacity of Naseby accommodation services (611 bed spaces). • TNA= Total Number of Accommodation Services Types. • RB= Refurbished Buildings used as accommodation services. • NB= New Buildings used as accommodation services. • C=Capacity
Table 6.14 and Figure 6.12 show that, of 98 Naseby accommodation services, 6.1 % (6)
including 3.1% (3) SC, 1% (1) B&B and 2% (2) hotels are RB and 93.9 % including
15.3% (15) SCs, 5.1% (5) B&Bs and 73.5% (72) camping sites are NB.
Chapter 6: Second and Third Case Studies: Naseby and Cromwell –OCRT, New Zealand
299 | P a g e
Table 6.14 and Figure 6.13determine that 11.9% of 611 available bed spaces including
1.6% (10) SCs, 0.8% (5) B&Bs and (58) 9.5% hotels are RB and 88.1% including
13.6% (83) SCs, 3.8% (23) B&Bs and 70.7% (432) camping sites are NB.
SC B&B Hotel Camping NB 15 5 0 72 RB 3 1 2 0
0
10
20
30
40
50
60
70
80
Num
ber o
f acc
omm
odat
ion
serv
ices
SC B&B Hotel Camping NB 83 23 0 432 RB 10 5 58 0
0
50
100
150
200
250
300
350
400
450
500
Cap
acity
, Num
ber o
f Vis
itors
Figure 6.12: Naseby- Refurbished (RB) and new (NB) accommodation services (2011)
Figure 6.13: Naseby- capacity of RB and NB accommodation services 2011 (total bed spaces= 611)
Chapter 6: Second and Third Case Studies: Naseby and Cromwell –OCRT, New Zealand
300 | P a g e
6.1.6.3. Materials Used for Accommodation Services
In this thesis the materials used for Naseby accommodation services are explored
through using relevant information published in the 15 official websites of Naseby
OCRT accommodation services (Appendix 5). The main materials used for constructing
each type of accommodation service in 2011 (except camping sites) are set out in Ap-
pendix 5 and the summarised information is shown in Table 6.15, and Figures 6.14 and
6.15.
Table 6. 15: Naseby - materials used by type of accommodation (2011)
material(s)
bed spaces % Type of accommodation service SC B&B Hotel
No C No C No C Timber 114 63.7 16 73 11 23 1 18 Mud brick 8 4.5 1 8 Mixed brick2 and timber 45 25.1 - - 1 5 1 40
Mixed timber, aluminium fa-cade and wood joinery
12 6.7 1 12 - - - -
Total bed spaces 179 100 18 93 12 28 2 58 1. Brick includes: red brick, clay brick and brick. • No = Number of accommodation services. • C= Capacity (number of bed spaces).
This thesis classifies the types of materials used into the four types of timber, mud
brick, mixed brick and timber and mixed timber, aluminium facade and wood joinery
(Table 6.15). As shown in this Table and Figure 6.14, of the total 179 Naseby accom-
modation bed spaces the majority of 114 bed spaces (63.7%) are timber followed by 45
mixed brick and timber (25.1%), 12 mixed timber, aluminium facade and wood joinery
(6.7% ) and 8 mud brick (4.5%).
0.00%
10.00%
20.00%
30.00%
40.00%
50.00%
60.00%
70.00%
Perc
enta
ge o
f bed
spa
ces
Timber
Timber Mixed with other materials) Mud brick (mixed with other materials)
Figure 6.14: Naseby – bed spaces by type of materials used (2011)
Chapter 6: Second and Third Case Studies: Naseby and Cromwell –OCRT, New Zealand
301 | P a g e
Table 6.15 and Figure 6.15 indicate that the 93 Naseby SC bed spaces comprise 73
(79%) that use timber as the main construction material followed by 12 (12.9%) mixed
timber with other materials and 8 (8.6%) mud brick. Furthermore, of 28 Naseby B&B
bed spaces the majority of 23 (82.1%) use timber as the main material for construction
and 5 (17.9 %) use mud brick and timber. Similarly 40 (69%) out of 58 Naseby hotel
bed spaces are mixed mud brick and 18 (31%) are timber as the main construction mate-
rial.
6.1.6.4. Accommodation Energy Sources, Facilities and Spaces
As shown in Appendix 5 (Rows 75- 90) this thesis explores the energy sources and fa-
cilities used in 98 Naseby accommodation services through using related information
published in these accommodation websites. This thesis classifies this information by
types of Naseby’s accommodation services as shown in Appendix 5 and summarised in
Appendices 22-27. In this thesis, all heating systems (electricity, log, gas and solar) are
explored by type of accommodation service. Of possible facilities and equipment used,
TV, and internet are chosen to be explored, as using these facilities can be considered as
indicator for a modernised lifestyle (Appendices 22-27). Since using open air areas has
been introduced in this thesis as one of the environmental and cultural indicators for
evaluating architecture as being sustainable, verandas, balconies and outdoor seating are
also investigated. The following part presents this data classified by type of accommo-
dation service, shown in Appendix16 which summarise Appendices 9-15.
0%
10%
20%
30%
40%
50%
60%
70%
80%
90%
100%
SC B&B Hotel
Perc
enta
ge o
f bed
spac
es
Mud brick( mixed with other materials Timber(mixed with other materials) Timber
Figure 6.15: Naseby- used materials by types of accommodation services (2011)
Chapter 6: Second and Third Case Studies: Naseby and Cromwell –OCRT, New Zealand
302 | P a g e
a. SC Energy Sources, Facilities and Open Air Spaces (2011)
Figure 6.16 and Appendices 22 and 23 demonstrate that, of 93 SC bed spaces 54
(58.1%), including 48 (51.6%) NB and 6 (6.5%) RB use electricity for heating. In addi-
tion, 23 (24.7%) SC bed spaces including 6 (6.5%) RB and 17 (18.3%) NB use logs,
and 30 (32.3%) including 4 (4.3%) RB and 26 (28%) NB use gas for heating (Figure
6.16 and Appendix 23).
Likewise, of 93 Naseby SC bed spaces, 49 (52.7%) use a solar system for heating (wa-
ter-heating) (Figure 6.16 and Appendix 23). As illustrated in Figure 6.16and shown in
Appendix 23, 35 (37.5%) of 93 Naseby SC bed spaces including 6 (6.5%) RB and 29
(31%) NB bed spaces have a shared TV. In addition, 79 (85%) of Naseby SC bed
spaces including10 (10.8%) RB and 69 (74.2%) NB have access to the Internet (Figure
6.16and Appendix 23). Furthermore, 6 (6.5%) Naseby SC bed spaces (NB) can access a
shared V/B and 12 (12.9%) NB SC bed spaces have a private V/B (Figure 6.16 and Ap-
Figure 6.16: Naseby SC accommodation services - energy sources, facilities and spaces (2011)
El: Electricity So: Solar system TV (S): Share TV TV (P): Private TV Int: Internet V/B (S): Share veranda/ balcony V/B (P): Private veranda/balcony Outdoor sitting (S): Share outdoor sitting Outdoor sitting (P): Private outdoor sitting
Chapter 6: Second and Third Case Studies: Naseby and Cromwell –OCRT, New Zealand
303 | P a g e
b. B&B Energy Sources, Facilities and Open air Spaces (2011)
Figure 6.17 and Appendices 22 and 24 demonstrate that of 28 B&B bed spaces 23
(82.1%) NB and 5 (17.9%) RB use electricity for heating. In addition, 12 (24.7%) NB
B&B bed spaces have a solar system for heating (water-heating) (Figure 6.17 and Ap-
pendix 24).
As illustrated in Figure 6.17 and shown in Appendix 24, 23 (82.1 %) out of 28 Naseby-
B&B bed spaces including 5 (17.8%) RB and 18 (64.3%) NB bed spaces have a shared
TV. Likewise, 17 (60.8%) of 28 Naseby B&B bed spaces including 5 (17.85%) RB and
12 (42.85%) NB have access to the Internet (Figure 6.17 and Appendix 24).
c. Hotel Energy Sources, Facilities and Open Air Spaces (2011)
As illustrated in Figure 6.18 and shown in Appendices 22 and 25, all 58 (100%)
Naseby-hotel accommodation services are refurbished buildings and use electricity as
the main source for heating. Moreover, 40 (69%) of these bed spaces also use logs (Fig-
ure 6.18 and Appendix 25). Furthermore, 18 (31%) of 58 hotel bed spaces have a shared
TV and 18 (31%) have outdoor sitting areas (Figure 6.18 and Appendix 25).
Type of accommodation service % of visitor nights (2005) Visitor nights (2011)
SC 21.61 3,612 B&B 22.42 3,746 Hotel 323 5,351 Camping 24 4,013 Total 100 16,7224
1. SC % of visitor nights = 8.5% (50% of total Bp and homestead) + 13.1% (% of visitor nights of SC in 2005). 2. B&B % of visitor nights= 8.5% (50% of total Bp and homestead) + 13.9% (% of visitor nights of B&B in 2005). 3. Hotel % of visitor nights = 10.9 % + 21.1% 4. See Table 6.1
6.1.6.6. Area of Naseby Accommodation Services
This thesis uses the average area per bed space of OCRT accommodation services (Ta-
ble 5.20) as the average area per bed space of Naseby accommodation services. Table
6.17 indicates that the total area of 98 Naseby accommodation services is 8,144 m2, in-
cluding 2,744 m2 SC, 2,592 m2 camping, 1,688 m2 hotel and 1,120 m2 B&B.
Table 6.17 shows the annual occupied area of each type of Naseby accommodation ser-
vices, calculated as its total area multiplied by its percentage occupancy rate. The total
annual occupied area is 2,006 m2, including 662 m2 camping, 593 m2 SC, 540 m2 hotel
and 251m2 B&B.
Chapter 6: Second and Third Case Studies: Naseby and Cromwell –OCRT, New Zealand
308 | P a g e
Table 6.17: Naseby accommodation services - total area and occupied area (2011) Type No. C Area
1. See Table 5.20 (Chapter 5- section.5.66) • No: Number of accommodation type • C: Capacity
Table 6.18 contains the average area, number of bed spaces and total area of each type
of Naseby accommodation service by their quality. In this table the area of each type of
accommodation services is calculated as its average area/bed space multiplied by the
number of bed spaces.
In comparison with other types of NB Naseby accommodation services, camping sites
comprise the majority area of 2,592 m2 followed by SC (2,449 m2) and B&B (920 m2)
(Table 6.18). In addition, RB hotels contain the majority area of 1,688m2 followed by
SC (295 m2) and B&B (200m2) (Table 6.18).
Table 6.18: Naseby- area of accommodation services by type and quality
Category Q Average area/bed space (m2)
Bed space Area (m2)
SC NB 29.5 83 2,449 RB 29.5 10 295
B&B
NB 40 23 920 RB 40 5 200
Hotel NB 29.1 - - RB 29.1 58 1,688
Camping site NB 6 432 2,592 RB - - -
Total NB - 538 5,961 RB 73 2,183
Total area of Naseby NB accommodation services is 5,961m2 and RB accommodation
is 2,183 m2 (Table 6.19), making a total of 8,144 m2.
Table 6.19: Naseby- area of accommodation services by quality
Quality of buildings Area (m2) NB buildings 5,961 RB buildings 2,183
Total 8,144
Chapter 6: Second and Third Case Studies: Naseby and Cromwell –OCRT, New Zealand
309 | P a g e
6.1.6.7. The EF of Naseby Accommodation Services
This chapter explores the EF of Naseby accommodation services through using three
scenarios. In the first scenario, all buildings are assumed to be newly constructed (NB)
and in the second scenario these buildings are split between NB and RB accommodation
as found in 2011. However, in the first and second scenarios all areas of buildings (in-
door and outdoor spaces including verandas and balconies) are assumed to be indoor
spaces. In the third scenario that reflects the current position of Naseby accommodation
services the buildings include the current NB and RB split and considers both indoor
and open air (veranda and balcony) areas.
Comparison between the EFs of the first and the second scenarios can indicate the in-
fluence exerted on the EF of Naseby accommodation services by using refurbished
buildings. In addition, comparison between the EFs of the second and the third scenar-
ios determines the influence of using open air spaces on this EF.
a. First Scenario: All Buildings Are Assumed To Be New Buildings
a.1. The EF of SC Accommodation Services
As shown in Table 6.20, SC timber constructions with an area of 2,153 m2 account for
the largest portion of embodied energy of 47.4 GJ/year, followed by 354 m2 timber and
masonry (14.4 GJ/year) and 236m2 mud brick mixed with other materials (6.6 GJ/year).
In Table 6.20, SC operational energy is assumed to be 0.3 (GJ/m2/year), equal with
B&B operational energy use (Table 5.28). As determined in Table 6.20, SC timber con-
struction accounts for the largest operating energy of 139.5 GJ/year, followed by timber
and masonry (15.3 GJ/year) and mud brick mixed with other materials (15.3 GJ/year).
Table 6.20 also shows SC timber construction with an area of 2,153 m2 has the largest
life cycle energy of 186.9 GJ/year and other types of construction including timber
mixed with masonry and mud brick mixed with other materials use 37.2 and 21.9
GJ/year respectively. Consequently, the total EF of Naseby SC accommodation is 2.4
gha including 1.8 gha as the EF of timber construction, 0.37 gha for timber and masonry
construction, and 0.22 gha mud brick mixed with other materials.
Chapter 6: Second and Third Case Studies: Naseby and Cromwell –OCRT, New Zealand
310 | P a g e
Table 6.20: Naseby- life cycle energy use and the EF of self contained accommodation services (2011)
Material Embodied energy
over 50-year life
cycle (GJ/m2)1
Total Area (m2)2
Embodied energy
(GJ/year)
Opera-tional energy (GJ/
m2/year)3
Occupied area (m2)4
Operating energy
(GJ/year)
Life-cycle
energy (GJ/ year)
EF gha/y
ear
Timber 1.1 2,153 47.4 0. 3 465 139.5 186.9 1.87 Mud brick (mixed with other materials)
1.4 236 6.6 0. 3 51 15.3 21.9 0.22
Timber and ma-sonry
2.04 354 14.4 0. 3 76 22.8 37.2 0.37
Total - - 68.4 - - 177.6 246 2.46 1. See Table 5.27 (Chapter 5- section 5.6.8.1-a-8) 2. Total area of each type of SC construction = capacity of the type of construction (See Table 6.15) × SC aver-age area per bed (29.5m2) 3. See Table 5.28 (Chapter 5- section 5.6.8.1- c-1) and Chapter 5- section 5.6.8.1-c-1 4. Occupancy rate of OCRT SC = 21.6% (See Table 6.16)
a.2. EF of B&B Accommodation Services
Table 6.21 demonstrates that 920 m2 of Naseby B&B accommodation services of tim-
ber construction account for 20.4 GJ/year embodied energy and 354 m2 Naseby B&B of
mud brick construction use 14.4 GJ/year embodied energy.
In Table 6.21, B&B operating energy is assumed to be the same as that of the OCRT at
0.3GJ/m2/year (Table 5.28). As determined in Table 6.21, Naseby B&B accommodation
services of timber construction use 61.8 GJ/year operating energy and B&B mud brick
constructions use 13.5 GJ/year. Also, 920 m2 of Naseby B&B accommodation of timber
construction accounts for the largest life cycle energy of 82.2 GJ/year and B&B ac-
commodation of mud brick construction is 19.1 GJ/year.
The total EF of Naseby B&B accommodation services as shown in Table 6.21 is 1.01
gha including 0.82gha for the EF of timber construction and 0.19 gha for the EF of mud
brick mixed with other materials.
Chapter 6: Second and Third Case Studies: Naseby and Cromwell –OCRT, New Zealand
311 | P a g e
Table 6.21:Naseby- life cycle energy use of B&B accommodation services (2011) Material Embod-
Total 1,120 26 75.3 101.3 1.01 1. See Table 5.27 (Chapter 5: section 5.6.8.1-a-8) 2. Total area of each type of construction = capacity of the type of construction (see Table 6.15) × B&B average area per bed (40m2) 3. See Table 5.28 (Chapter 5: section 5.6.8.1- c-1) and Chapter 5: section 5.6.8.1-c-1
4. Occupancy rate of Naseby B&B = 22.4% (see Table 6.16)
a. 3. EF of Hotel Accommodation Services
Naseby hotel accommodation services comprise 524 m2 timber and 1,164 m2 mud brick
(mixed with other materials) and account for 11.5 and 32.6 GJ/ year respectively of em-
bodied energy (Table 6.22).
Hotel operating energy as shown in Table 6.22 is assumed to be 0.57 GJ/m2/year, equal
to OCRT hotel operating energy use as cited in Table 5.28. As determined in Table
6.22, in Naseby, the annual operating energy of timber hotels is 95.8 GJ/year and mud
brick is 212 GJ/year. In addition total life cycle energy use of Naseby hotels is 307.8
GJ/year this being the sum of the life cycle energy of timber (95.8 GJ/ year) and mud
brick (212 GJ/year) hotels.
As shown in Table 6.22 the total EF of Naseby hotel accommodation services is 3.47
gha, made up of the EF of timber hotels (1.07gha) and mud brick mixed with other ma-
terials hotels (2.4gha).
Chapter 6: Second and Third Case Studies: Naseby and Cromwell –OCRT, New Zealand
312 | P a g e
Table 6.22:Naseby - Life cycle energy use of Hotel accommodation services (2011) Material Embod-
ied en-ergy over 50-year life cycle (GJ/m2)1
Total Area (m2)
Embod-ied en-ergy (GJ/year)
Opera-tion en-
ergy (GJ/ m2/year)3
Occu-pied area (m2)4
Operat-ing en-ergy (GJ/year)
Life-cycle en-ergy use (GJ/ year)
EF gha/year
Timber 1.1 524 11.5 0.57 168 95.8 107.3 1.07 Mud brick (mixed with other materi-als)
1.4 1,164 32.6 0.57 372 212 244.6 2.4
Total - - 44.1 - - 307.8 366.3 3.47 1. See Table 5.27 (Chapter 5: section 5.6.8.1-a-8) 2. Total area of each type of construction = capacity of the type of construction (see Table 6.15) × hotel average area per bed (29.1m2 – see Table 5.20) 3. See Table 5.28 (Chapter 5: section 5.6.8.1- c-1) and Chapter 5: section 5.6.8.1-c-1
4. Occupancy rate of Naseby Hotels = 32% (see Table 6.16)
a. 4. EF of Camping Accommodation Services
As determined in Table 6.23 the embodied energy of Naseby camping sites is not avail-
able and this study considers the operating energy of this type of accommodation ser-
vice to be equal to its life cycle energy. Table 6.23 indicates that the total EF of 288
Naseby powered sites with 2,689 visitor nights and 0.025 GJ/visitor night operating en-
ergy use is equivalent to 0.67 gha
Table 6.23: Naseby- life cycle energy use of Camping (powered sites) accommodation services (2011) Material Embodied
energy over 50-year life
cycle (GJ/m2)
Total visitor nights
Embodied energy
(GJ/year)
Operation energy
(GJ/ visi-tor night)2
Operating energy
(GJ/year)
Life-cycle
energy use (GJ/
year)
EF gha/year
Assumed negligible
N/A 2,6891 N/A 0.025 67.2 67.2 0.67
1. 2,689 visitor nights = 66.7% (portion of camping bed spaces that are powered) of total camping (powered and non powered camp sites) visitor nights (4,013 visitor nights). 2. See Table 5.28
Total available powered camping bed spaces = 288
a. 5. EF of Naseby Accommodation Services (First Scenario)
The total 2011 EF of 98 Naseby accommodation services based on the assumption that
all are NB is 7.6gha/year (Table 6.24). As determined in Table 6.24, Naseby hotel ac-
commodation services have the largest EF of 3.47 gha followed by SC (2.46 gha), B&B
(1.01gha) and camping (powered sites) 0.67 gha.
Chapter 6: Second and Third Case Studies: Naseby and Cromwell –OCRT, New Zealand
313 | P a g e
Table 6.24: The total EF of Naseby accommodation services (first scenario) Types of accommodation EF (gha/year) SC 2.46 B&B 1.01 Hotel 3.47 Camping 0.67 Total 7.6
b. EF of Naseby Accommodation Services (Second Scenario)
In the second scenario the embodied energies of RB buildings are subtracted from the
whole life cycle energy use of Naseby accommodation services. Consequently, the life
cycle energy of Naseby accommodation services in the second scenario includes the
embodied energy of NB plus the total operating energy of both RB and NB buildings.
As RB accommodation services use the same energy sources and have the same facili-
ties as NB buildings, their operational energy use is assumed to the same as that of NB
(Table 6.25). In Table 6.25, the embodied energies of NB and RB accommodation ser-
vices are calculated through the following equation:
Embodied energy of NB/RB accommodation services = total embodied energy × per-
centage of NB/RB bed spaces
For example in Table 6.25, the total embodied energy of SC accommodation services is
68.4 GJ/year. NB SC bed spaces contain 89.2% (83 out of 93) of the total 93 SC bed
spaces (see Figure 6.13). Consequently, the embodied energy of NB SC accommodation
services is equivalent to: 68.4 GJ/year ×89.2% = 61.1 GJ/ year (Table 6.25).
Table 6.25 demonstrates that in the second scenario, the total life cycle energy use of
Naseby accommodation services is 710.3 GJ/year (Table 6.25). Likewise the EF of
Naseby accommodation services is 710.3 GJ/year ÷ 100 GJ/ha (global average carrying
capacity of land) = 7.1 gha (Table 6.25).
Chapter 6: Second and Third Case Studies: Naseby and Cromwell –OCRT, New Zealand
314 | P a g e
Table 6.25:Naseby accommodation services- life cycle energy of new and refurbished buildings Type Total em-
bodied energy
(GJ/year)
NB- Bed
space (%)
RB- Bed
space (%)
Embodied energy of NB
(GJ/year)
Total oper-ating en-ergy (GJ/
year)
Life-cycle energy
(GJ/year)
EF (gha/year)
SC 68.4 89.2 10.8 61.1 177.6 238.7 2.38
B&B 26 82.1 17.9 21.3 75.3 96.6 0.96 Hotel 44.1 0.00 100 0.00 307.8 307.8 3.08 Camping N/A 100 0.00 N/A 67.2 67.2 0.67 Total 157.88 - - 86.6 589.45 710.3 7.1 • Total area of Naseby accommodation services = 8,144 m2 (see Table 6.17) • Total EF of Naseby accommodation services = 7.1 gha • The EF of Naseby accommodation services gha/m2 = 7.1 ÷ 8,144 = 0.00087
Table 6.26 compares the EF of Naseby accommodation services arising from the two
scenarios (EF1 and EF2). It shows the influence of using RB buildings as accommoda-
tion means the EF is decreased by 6.6% (0.5 gha) from 7.6 gha to 7.1gha. As the total
area of Naseby RB accommodation services is 2,183 m2, the EF reduction per m2 is: 0.5
gha (5,000m2) ÷ 2,183 m2 = 2.3 m2. This means using 1m2 RB buildings as accommo-
dation services can reduce the EF of Naseby accommodation services by 2.3 m2.
Table 6.26: Reduced EF of Naseby accommodation services by use of RB as tourism accommodation EF1 (all buildings are assumed to be new) EF2 (Accommodation services include NB and
RB) 7.6 gha/year 7.1 gha/year
• Reduced EF of Naseby influenced by the use of RB (11.9% of total bed spaces) as a part of accommoda-tion services = 0.5 gha/year= 6.6% of EF1
c. EF of Naseby Accommodation Services (Third Scenario)
This section attempts to determine the influence of using open air spaces including ve-
randas and balconies (V/B) on the EF of Naseby accommodation buildings. In the sec-
ond scenario, calculation of the EF of Naseby accommodation services has been con-
ducted based on the assumption that all NB and RB spaces are indoor spaces. In this
scenario both indoor and outdoor spaces and their EFs are considered. The difference
between the results of the second and third scenario indicates the influence of using
open air areas on EF of Naseby accommodation services.
The number of V/B and outdoor sitting areas by type (shared and private) were found
through using Naseby accommodation websites (see Appendix 5- rows 75-90). Table
6.27 contains summarised information about the numbers and types of V/B and outdoor
sitting areas by type of accommodation, as explained in Appendix 5 (rows-75-90). Ta-
ble 6.27 shows that 6 Naseby SC bed spaces have access to 1 shared V/B and 12 bed
Chapter 6: Second and Third Case Studies: Naseby and Cromwell –OCRT, New Zealand
315 | P a g e
spaces can use 6 private V/Bs. Furthermore, as shown in Table 6.27, 18 Naseby hotel
bed spaces have access to 1 shared outdoor sitting area.
Table 6.27: Naseby- outdoor areas used as part of accommodation services
Type V1/B2 Outdoor sitting S3 NV4 P5 NV S No6 P No
1. V: Veranda 2. B: Balcony 3. S: Number of bedrooms sharing area 4. NV: Number of veranda/ balcony 5. P: Number of bedrooms using private area 6. No: Number of outdoor sitting spaces.
Table 6.28 shows that the embodied energy of 100.1m2 Naseby V/Bs is 1.2 GJ/year.
Since V/Bs are open areas and do not use operating energy (in particular for heating),
their operating energy is assumed to be zero. As a result, the life cycle energy use of
100.1m2 V/B is equal to its embodied energy (1.2 GJ/year) and its EF is 1.2 GJ/year
(life cycle energy use) ÷ 100 (global average carrying capacity of land) = 0.012 gha
(Table 6.28).
Table 6.28. Naseby accommodation services, life cycle energy and EF of outdoor sitting space (ve-randa/ balcony)
Type Embodied energy
(GJ/m2 per year)
Area (m2)1-2
Embodied en-ergy (GJ/year)
Operating energy
Life-cycle energy
(GJ/year)
EF (gha)
Veranda/balcony 0.0123 100.1 1.2 0 1.2 0.012 1. Total number of verandas/ balconies = 7 (See Table 6.27) 2. Average area (m2) of veranda/balcony = 14.3 (Table 5.40) 3. Embodied energy of veranda/ balcony ( GJ/m2/year) = 0.012 (Table 5.42)
In Table 6.29 the total 8,144 m2 of Naseby-accommodation services (see Table 6.17) is
separated into the two areas of 8,043.9 m2 indoor spaces and 100.1m2 V/B. The EF of
Naseby accommodation services (indoor spaces) as shown in Table 6.25 is 0.00087gha/
m2 (7.1gha ÷ 8,144 m2). Thus the EF of 8,043.9 m2 indoor spaces is 8,043.9m2×
0.00087 gha/m2 = 7 gha (Table 6.29). Likewise the EF of 100.1m2 V/B is 0.012 gha (see
Table 6.28). As a result the total EF of 8,144 m2 Naseby accommodation services in-
cluding 8,043.9 m2 indoor spaces and 100.1m2 V/B is the sum of 7 and 0.012gha =
7.012gha (Table 6.29).
Chapter 6: Second and Third Case Studies: Naseby and Cromwell –OCRT, New Zealand
316 | P a g e
As shown in Table 6.26, the EF from the second scenario in which all Naseby accom-
modation services are assumed to be indoor spaces (EF2) is 7.1 gha. Moreover, in third
scenario where outdoor spaces are the total EF (EF 3) is 7.012 gha. Thus 0.09 gha as the
difference between the two EFs (EF2 and EF 3) can be considered as the reduction in
Naseby EF from the use of 100.1m2 verandas and balconies (Table 6.29). On the other
hand, as 0.09 gha (900 m2) ÷ 100.1m2 = 8.9 m2, it can be considered that using 1m2 V/B
reduces the EF of Naseby accommodation services by 8.9 m2.
Table 6.29: EF of Naseby accommodation services influenced by the use of veranda/balcony Indoor spaces and powered camping sites Outdoor sitting (Veranda/balcony)
Area (m2) EF (gha/m2) EF (gha) Area (m2) EF (gha/m2) EF (gha) 8043.9 0.00087 7 100.1 0.00012 0.012
• Total area of Naseby accommodation services (m2) = 8,144 (see Table 6.19). • Total EF of Naseby accommodation services (second scenario) (gha)= 7.1 (see Table 6.25) • Total EF of Naseby accommodation services (indoor space + veranda/balcony) (gha) = 7.012 • Reduction in Naseby EF by use of veranda and balcony (1.2% of 8,043.9 m2) = 0.09 gha = 900 m2 • Reduction in Naseby EF by use of 1m2 veranda and balcony = 8.9 m2
6.1.7. Naseby Tourism Products and Activities (Frequency)
This section investigates the environmental impacts of Naseby visitor activities (as a
part of their social cultural behaviour) through calculation of their EF. The frequency of
activities offered by Naseby accommodation services to visitors is found through offi-
cial websites of the OCRT and 15 websites of 93 Naseby accommodation services. The
offered activities are explained in Appendix 5 (rows 75-90) and they are classified into
indoor and outdoor activities in Appendix 28.
In addition the frequency of the activities offered, shown in Appendix 28 and summa-
rised in Tables 6.31 and 6.32, can be considered as an indicator of the attitude of
Naseby participants and members (in this case accommodation owners) to sustainable
tourism activities. Comparison between EFs of the conducted activities and their fre-
quency also can indicate a social-ecological perspective of the attitude of Tourism par-
ticipants to being sustainable.
6.1.7.1. Local Produce
Table 6.30 indicates that 12.2 % (12) of 98 Naseby accommodation services offer local
products to their visitors. As demonstrated in Table 6.30, of these 10 (83%) offer home
Chapter 6: Second and Third Case Studies: Naseby and Cromwell –OCRT, New Zealand
317 | P a g e
cooked food (local food) and 2 (17%) offer wine to their visitors. The environmental
effects of using home cooked foods have been discussed in section 6.1.5.1.
Table 6.30: Naseby local produce (summary)
Produce F % Local food and beverage 10 83 Wine 2 17 Total 12 100 • Total number of Naseby accommodation services = 98 (see Table 6)
6.1.7.2. Tourism Activities
This section investigates the environmental impacts of Naseby visitor activities (as a
part of their social-cultural behaviour) through calculation of their EF.
a. Tourism Indoor Activities (Frequency)
Table 6.31 summarises the indoor activities offered by Naseby accommodation services
to their visitors as cited in Appendices 5 and 28. These activities are classified into four
types; indoor sport (curling at Naseby), education, music, and cultural/spiritual activities
(Table 6.31).
Table 6.31: Naseby indoor activities offered by accommodation services to visitors
Activities F1 %2
Indoor sports (curling at Naseby). 16 84 Education. 1 5 Music 1 5 Cultural/spiritual activities. 1 5 Total 19 100 1. Frequency 2. Percentages have been rounded
Figure 6.22 and Table 6.31 determine that indoor visitor activities are dominated by
sports (curling) at 16 offerings (84%) followed by other indoor activities with 1 offering
each (5%).
Chapter 6: Second and Third Case Studies: Naseby and Cromwell –OCRT, New Zealand
318 | P a g e
b. Outdoor Activities (Frequency)
This study explores 11 types of outdoor activity offered by Naseby accommodation ser-
vices to visitors in 2011 as shown in Appendix 28. Theses outdoor activities are ex-
plained by their related accommodation service in Appendix 5. This study classifies the
11 types of Naseby outdoor activities into the 8 types of activity shown in Table 6.32.
Table 6.32: Naseby- frequency of outdoor activities offered by accommodation services to visi-tors.
Outdoor activity F %1
Water sports 19 18.6 Walking 15 14.7 Winter sports 14 13.7 Cycling 14 13.7 Motorised sports and activities 13 12.7 Recreational activity 11 10.8 Sports (at playground) 9 8.8 Sports on horseback 7 6.9 Total 102 100 1. Percentages have been rounded
Figure 6.23 and Table 6.32 illustrate that the activity most offered is water sports with
19 mentions (18.6%), followed by walking 15 (14.7%), and winter sports and cycling
14 (13.7%) each. The frequency of offering other Naseby outdoor activities falls in a
range of 7-13 times (Figure 6.23 and Table 6.32).
0%
10%
20%
30%
40%
50%
60%
70%
80%
90%
Indoor sports (curling)
Education Music Cultural activities
Perc
enta
ge o
f fre
quen
cy
Figure 6.22: Naseby - frequency of indoor activities offered by accommodation services to visitors (2011)
Chapter 6: Second and Third Case Studies: Naseby and Cromwell –OCRT, New Zealand
319 | P a g e
c. Frequency of the Subjects to Visit Offered by Accommodation Services
As shown in Appendix 5, this study looks at what is offered by way of places to visit by
Naseby accommodation services in 2011. Appendix 28 contains summarised informa-
tion about Naseby visiting activities and their frequency is shown in Appendix 5.
Naseby subjects to visit are here put into seven categories; Naseby itself, historical sites
and buildings, scenery, museum, gold mining heritage, Naseby town garden, and art,
sculpture, and gardens (Appendix 28). Table 6.33 and Figure 6.24 further classify these
seven categories into five; cities and villages, historical sites and buildings, scenery,
museum, and town garden. As illustrated in Figure 6.24 and Table 6.33, cities and vil-
lages, and historic sites and buildings occur at a similar frequency of 13 mentions
(33.3%). In addition, scenery and museum have the same frequency of 6 (15.4%) and
the town garden is only suggested once (2.6%) (Figure 6.24 and Table 6.33).
Table 6.33: Naseby - frequency of subjects to visit offered by accommodation services to
visitors (2011) Subjects F % Cities and villages (Naseby) 13 33.3 Historic sites and buildings 13 33.3 Scenery 6 15.4 Museum/art gallery 6 15.4 Town garden 1 2.6 Total 39 100
0.00%
2.00%
4.00%
6.00%
8.00%
10.00%
12.00%
14.00%
16.00%
18.00%
20.00%
Perc
enta
ge o
f fre
quen
cy
Figure 6.23: The frequency of outdoor activities offered by Naseby accommodation ser-vices to visitors
Chapter 6: Second and Third Case Studies: Naseby and Cromwell –OCRT, New Zealand
320 | P a g e
c. Activities per Visitor
This thesis calculates the number of Naseby visitors per activity (except curling and
mountain biking at Naseby) through using the percentage split of 160 visitors Table
5.48) and applying this to the 4,645 Naseby visitors in 2011 (Table 6.34). The assump-
tion is that the visitors who come for curling and mountain bike riding will also do other
activities. The numbers of OCRT visitors who play curling and go mountain biking at
Naseby is already known (see Table 4.45). Table 6.34 shows that in comparison with
other Naseby activities, the majority visitor activity is curling (4,350), followed by
(1,421) and visiting old Cromwell town (1,045). The numbers of Naseby visitors who
do other types of activity are between 28 and 758.
0.00%
5.00%
10.00%
15.00%
20.00%
25.00%
30.00%
35.00%
Perc
enta
ge o
f fre
quen
cy
Figure 6.24: Naseby- frequency of subjects to visit offered by accommodation services
Chapter 6: Second and Third Case Studies: Naseby and Cromwell –OCRT, New Zealand
321 | P a g e
Table 6.34: Naseby - activities conducted by 4,6451 visitors (2011) Activities % of 4,645visitors2 Number of Visitor activities Curling (at Naseby) 93.6 4,350 Taieri Gorge Railway 46.3 2,151 Gold mining towns 35 1,626 Sightseeing tours 30.6 1,421 Old Cromwell town 22.5 1,045 Wineries 16.9 785 Visiting friends and relatives 15 697 Hayes engineering 8.1 376 Mountain biking Naseby 6.4 295 fishing 1.9 88 Golf 1.3 60 Swim at Ophir and Alexandra 0.6 28 Clyde dam Tour 0.6 28 Golden Progress mine 0.6 28 Walking 0.6 28 Ophir- high country farm 0.6 28 Biking 0.6 28 Fruit picking along trail 0.6 28 1. See Table 6.1 2. % of 4,645 visitor assumed same as % of 160 visitors cited in Table 5.45 (excluding curling and mountain biking at Naseby). • Reference: CODC, 2011:18
6.1.8. EF of Visitor Activities
6.1.8.1. EF of Indoor Activities (Curling at Naseby)
As indicated in Table 5.56 (see Chapter 5, section 5.7.5.1-d), the total EF of 4,350
OCRT visitors who play curling at Naseby is 0.7 gha which is equivalent to 0.00016
gha/ visitor (Table 6.35).
Table 6.35: Naseby- visitors curling EF (gha) (2011) Total num-ber of Naseby visi-tors
% of Naseby visi-tors who play in-door curling at Naseby Curling Centre1
Total number of Naseby visitors who play curl-ing1
EF of 13,000 visi-tors of Curling cen-tre (gha)
EF of 4,350 Naseby visi-tors (33.5 % of 13,000 Naseby curling visitors) gha2
4,645 93.6 4,350 2.073 0.7 1. See Table 6.34 2. EF of Naseby Curling Centre (indoor curling) per visitor per 3 hours playing/ year = (0.7 gha ÷ 4,350 visitors)
0.00016 (gha) 3. See Table 5.56
Chapter 6: Second and Third Case Studies: Naseby and Cromwell –OCRT, New Zealand
322 | P a g e
6.1.8.2. EF of Outdoor Activities
a. EF of Walking
Tables 6.34 and 6.36 show that 28 Naseby visitors chose walking as a tourist activity.
As shown in Chapter 5 (Table 5.58) the EF of a visitor who walks 3 hours is 0.00005
gha. Thus the EF of 28 Naseby visitors who walk 3 hours is equivalent to: 0.00005
(gha/visitor) ×28 (number of visitors) = 0.0014 (gha) (Table 6.36).
Table 6.36: Ecological footprint of Naseby visitors (walking).
Number of Naseby visitors who walk. 281
EF (gha) of Naseby visitor who walks 3 hours 0.000052
EF of 28 Naseby visitors who walk 3 hours (gha) 0.0014 1. See Table 6.34 2. See Table 5.58
b. The EF of Golf
Tables 6.34 and 6.37 show 60 Naseby visitors played golf in 2011. Tables 5.60 and 6.37
indicate that the EF of a visitor who plays golf is 0.003gha/visitor. Consequently the EF
of 60 Naseby visitors playing golf is 60 × 0.003 gha/visitor = 018 gha (Table 6.37).
Table 6.37: Ecological footprint of Naseby visitors (golf) Number of Naseby visitors who play golf 601
EF (gha) of Naseby visitor who plays golf 0.0032
EF of 60 Naseby visitors who play golf (gha) 0.18 1. See Table 6.34 2. See Table 5.60
c. EF of Mountain Biking
As shown in Table s 6.34 and 6.38, 295 Naseby visitors went mountain biking at
Naseby in 2011. Tables 5.67 and 6.38 indicate that the EF of a visitor who goes moun-
tain biking is 0.0009 gha/visitor. As a result the EF of 295 mountain biking Naseby visi-
tors is 295× 0.0009 gha/visitor = 0.27 gha (Table 6.38).
Table 6.38: Ecological footprint of Naseby visitors (mountain biking)
Number of Naseby visitors who go mountain biking 2951
EF (gha)of Naseby visitor who goes mountain biking 0.00092
EF of 295 Naseby visitors who go mountain biking (gha) 0.27 1. See Table 6.34 2. See Table 5.67
Chapter 6: Second and Third Case Studies: Naseby and Cromwell –OCRT, New Zealand
323 | P a g e
d. EF of Fishing
In 2011, 88 Naseby visitors chose fishing as a leisure activity (Tables 6.34 and 6.39).
Since the EF of a visitor fishing is 0.0009 gha (see Tables 5.68 and 6.39), the EF of 88
Hayes engineering 375 8.1 0.00006 0.02 Mountain biking at Naseby 1
295 6.4 0.0009 0.27
Fishing 88 1.9 0.0009 0.08 Swim at Ophir and Al-exandra
28 0.6 0.0009 0.025
Clyde dam Tour 28 0.6 0.0009 0.025 Golden Progress mine 28 0.6 0.00006 0.0017 Ophir high country farm 28 0.6 0.00006 0.0017 Biking 28 0.6 0.0009 0.025 Fruit picking along trail 28 0.6 0.00006 0.0017
Total 13,088 - - 3.02
0
0.2
0.4
0.6
0.8
1
1.2
1.4
Sigh
tsee
ing
Cur
ing
Mou
ntai
n bi
king
G
olf
visi
ting
frie
nds a
nd re
lativ
es
Taie
ri Fi
shin
g O
ld C
rom
wel
l tow
n W
iner
ess
Cly
d da
m to
ur
Swim
at O
phir
Biki
ng
Hay
es e
ngin
eerin
g G
old
min
ing t
owns
Fr
uit p
icki
ng
Gol
den
prog
ress
min
ing
Wal
king
gha
EF (gha)
Figure 6.25: Naseby- EF of visitor activities (2011)
Chapter 6: Second and Third Case Studies: Naseby and Cromwell –OCRT, New Zealand
328 | P a g e
6.1.8.4. Comparison between the EFs of Indoor and Outdoor Activities
Table 5.54 shows that 4,645 Naseby visitors participate in 13,088 visitor activities. As a
result the average number of activities per visitor is 2.8 activities, so each Naseby visi-
tor engages in 2.8 activities proposed by the OCRT.
As shown in Table 6.54 and Figure 6.26, the EF of 4,350 Naseby visitors (33.2% of
13,088 visitors activities) who participate in indoor activity (curling at Naseby) is 0.7
gha that accounts for 23.12% of the total EF of Naseby activities (indoor and outdoor).
Furthermore, Table 6.54 and Figure 6.26 indicate that the total EF of 8,738 Naseby-
outdoor visitor activities (66.8% of 13,088 Naseby visitor activities) is 2.32 gha, or
76.20 % of the total EF of Naseby visitor activities (3.02gha).
Table 6.54. Comparison between EFs of Naseby- visitors- indoor and outdoor activities
Indoor activity Outdoor activities Numbers of visi-
tors-activities
% of 13,088 Naseby visitors- activities
EF (gha)
% total EF1
EF (gha/visitor)
Numbers of visi-
tors-activities
% of total Naseby visitors
EF (gha)
% total EF1
EF (gha/visit
or)2
4,350 33.2 0.7 13.4 0.00016
8,738 66.8 2.32 86.6 0.00026
1. Percentage of the total 3.02gha EF of 13,088 Naseby visitor activities • Total number of Naseby visitor = 4,645 (see Table 6.2) • Total number of Naseby Visitor activities = 13,088 (see Table 6.51) • Average number of activities per visitor = 13,088 ÷ 4,645 = 2.8
0.00%
10.00%
20.00%
30.00%
40.00%
50.00%
60.00%
70.00%
80.00%
90.00%
Indoor activities Outdoor activities
Perc
enta
ge o
f the
toat
l EF
of O
CRT
-vis
itors
ac
tiviti
es
EF
Figure 6.26: Comparison between EFs of Naseby indoor and outdoor activities
Chapter 6: Second and Third Case Studies: Naseby and Cromwell –OCRT, New Zealand
329 | P a g e
This Thesis selects curling as an indoor activity and golf as an outdoor activity with the
biggest EF/visitor in their categories to be compared with the EF of walking as the out-
door activity with the smallest (Figure 6.27).
Figure 6.28 determines that the majority of 8,650 Naseby visitor activities are within the
‘other activity’ category (excluding golfing, curling and walking) followed by curling
6.1.12. Economic Footprint of Naseby Rail Trail Visitors
In 2011, the total GDP of the OCRT was NZ$6,245,289 (see Table 5.90) and GDP per
visitor was NZ$530 (NZ$6,245,289 ÷ 11,788 OCRT visitors) (Table 6.60). This chapter
uses this visitor GDP figure to calculate the GDP of Naseby visitors in 2011. Table 6.60
determines that the total GDP of Naseby rail trail visitors is NZ$530 (GDP/visitor) ×
4,645 (total number of Naseby visitors) = NZ$2,461,850.
Table 6.60: Naseby GDP (2011) OCRT total GDP ( NZ$)
OCRT number of visitors
OCRT GDP (NZ$/visitor)
Naseby number of visitors
Naseby total GDP (NZ$)3
6,245,2891 11,7882 530 4.645 2,461,850 1. See Table 5.90 2. See Figure 5.2 3. 4,645 × NZ$530/visitor = NZ$2,461,850
Table 6.61 shows that the total overshoot energy of Naseby visitors is 51,095 GJ/year.
Since the cost to generate 1 GJ through using renewable resources is NZ$19.8 (see Ta-
Chapter 6: Second and Third Case Studies: Naseby and Cromwell –OCRT, New Zealand
333 | P a g e
ble 5.94), then the total cost that must be paid to generate 51,095 GJ/year is
NZ$1,011,681 (51,095 × NZ$19.8) (Table 6.61). This means the sustainable portion of
Naseby GDP is NZ$2,461,850 (GDP) – NZ$ 1,011,681 = NZ$1,450,169 = 58.9% of the
total Naseby GDP (Table 6.61 and Figure 6 .30).
On the other hand the GDPs of Naseby as an ecological-economic indicator indicates
that 41.1% (100%-58.9%) of Naseby GDP must be paid to restore its environmental
impacts to being ecologically sustainable. In addition, this GDPs as a social-economic
indicator evaluates the contribution of the Rail Trail to local economic development,
through engagement of local participants and organizations (in this case accommodation
services) in the development process.
Table 6.61: Naseby sustainable portion of GDP (GDPs)
Total Naseby GDP (NZ$) 2,461,8501
Overshoot energy use (GJ/year) 51,0952
Energy cost (NZ$/GJ) wind-solar 19.83
Total cost(NZ$) to generate overshoot portion of Naseby energy by wind-solar systems
1,011,681
GDPs (NZ$)1 1,450,169 1. See Table 6.60 2. See Table 6.58 3. See Table 5.94 • GDPs= Total GDP - total cost to generate the overshoot portion of energy use through renewable resources
(see Chapter 5- section.5.10.2).
0
0.5
1
1.5
2
2.5
3
Naseby-economic impact
Mill
ion
NZ$
GDP
GDPs
Figure 6.30: Naseby- comparison between GDP and GDPs
Chapter 6: Second and Third Case Studies: Naseby and Cromwell –OCRT, New Zealand
334 | P a g e
6.1.13. Naseby Cultural Footprint (CF)
This thesis uses the CF model explained in Chapter 4 to explore the cultural footprint of
the OCRT on Naseby as one of its host destinations. In this case study the CF of the
Rail Trail in Naseby is categorised into the three areas of food, accommodation and
visitor activities and, as previously explained in Chapter 5 (section 5.11), the CF of
transportation is not included in this research.
6.1.13.1. Naseby CF- Food
Table 6.62 contains the summarised results of two proposed scenarios for Naseby food
(sections 6.5.1 and 6.5.2). As shown in Table 6.62, the total conventional eaten out food
in the first scenario is 30,936kg (100% of food consumed) and in the second scenario it
is 30,936kg made up of 27286kg (88.2%) conventional food and 3,650 kg (11.8%)
home prepared (organic food). As a result, the total EF of Naseby food in the first sce-
nario is 167.22gha /year and in the second scenario this reduces to 160.9gha/ year (Ta-
ble 6.62).
Table 6.62 indicates that in the second scenario the overshoot portion of the energy
value of the food consumed is equivalent to 13,029 GJ/year. Since the EF of food in the
first scenario (EF1) is 6.32 gha bigger than that of the second scenario (EF2), the over-
shoot energy value of food consumed in the first scenario is 632 GJ (6.32 gha × 100 –
global average carrying capacity of land). This is bigger than the overshoot portion of
the energy value of food in the second scenario (13,029 GJ/year). Consequently the
overshoot energy value of food in the first scenario is 13,029 GJ + 632 GJ =
13,661GJ/year (Table 6.62).
In this section, the overshoot portions of EF1 of 136.61 gha (see Table 6.62) and EF2 of
130.29 gha (see Table 6.62) are calculated using the method explained in Chapter 5-
section 5.11.1. As the cost to generate 1GJ energy using wind-solar systems is NZ$19.8,
the cost to generate 13,661 GJ/year (overshoot portion of energy value of food in the
first scenario) is 13,661 GJ × NZ$19.8 = NZ$ 270,488 (see Table 6.62). Likewise the
total cost to generate the overshoot energy using wind-solar systems in the second sce-
nario is NZ$19.8× 13,029 GJ/year = NZ$ 257,974 (Table 6.62).
Chapter 6: Second and Third Case Studies: Naseby and Cromwell –OCRT, New Zealand
335 | P a g e
The total GDP of Naseby food is calculated using the GDP/kg food of OCRT multiplied
by total Naseby food consumed (kg). As the total GDP for food related to the OCRT is
NZ$782,795 (see Table 5.91) and total produced/consumed food is 78,508.45 kg, the
GDP of food related to OCRT per kilogram is equal NZ$782,795 ÷78,508.45 kg = 9.97
~ NZ$10/kg.
In Naseby the total amount of food consumed is 30,936 kg (see Table 6.62). As a result
the GDP of Naseby food is equivalent to 30,936 (kg) × NZ$10/kg of food =
NZ$309,360 (Table 6.62).
Table 6.62 shows the GDP associated with food for both scenarios is NZ$309,360. As a
result:
GDPs1= NZ$309,360 (GDP) – NZ$270,488 (renewable energy cost) = NZ$38,872;
The difference between GDPs1 and GDPs2 shows the NZ$12,514 contribution to GDPs
from producing 3,650 kg home prepared (organic) food by Naseby accommodation ser-
vices. In addition, it can be considered that producing 1kg home prepared (organic) food
contributes NZ$3.43 to GDPs (Table 6.62).
Table 6.62: Naseby- local product (Food) contribution to GDPs First scenario (100% conventional food) Second scenario (88.2% conventional food and
11.8% home prepared (organic) food Total conventional eaten out food (kg)
30,9361 Total conventional eaten out food (kg)
27,2861
Total home prepared food (kg)
0.00 Total home prepared food (kg)
3,6501
Total EF of consumed food gha/year – (EF1)
167.221 Total EF of consumed food gha – (EF2)
160.91
Overshoot portion of energy related to food (GJ/year)
13,661 Overshoot portion of energy related to food (GJ/year)
13,0292
Overshoot portion of EF1 (gha/year)
136.61 Overshoot portion of EF2 (gha/year)
130.29
Cost to generate 1GJ energy using wind-solar systems (NZ$)
19.8 Cost to generate 1GJ energy using wind-solar systems (NZ$)
19.8
Total cost to generate over-shoot energy using wind-solar systems (NZ$)
270,488 Total cost to generate over-shoot energy using wind-solar systems (NZ$)
257,974
Total food GDP (NZ$) 309,360 Total food GDP (NZ$) 309,360 Total food GDPs1 38,872 Total food GDPs2 51,386 1. See Table 6.12 2. See Table 6.59 • Increased portion of GDPs influenced by using 3,650 kg home prepared food = NZ$12,514= NZ$3.43/kg
Chapter 6: Second and Third Case Studies: Naseby and Cromwell –OCRT, New Zealand
336 | P a g e
a. Ideal Sustainable Life Model: Food
Table 6.62 shows that the present EF2 of Naseby food (second scenario) is 160.9 gha
and the overshoot portion of EF2 is 130.29 gha. As a result the sustainable EF of
Naseby food can be determined through the following equation:
In the ideal model for Naseby tourist related food, since the overshoot portion of energy
use is zero, the GDPs is equal to the total GDP of Naseby food (NZ$309,360, see Table
6.62).This study uses the ideal model of Naseby food and compares it with the two sce-
narios shown in Table 6.62.
In Figure 6.31, the area of ‘Q1, EF1, and GDPs1’ illustrates ordinary life; this is the
area in which all Naseby visitors consume 100% (30,936 kg) conventional eaten out
food (first scenario). In this area, development of the Rail Trail (OCRT) does not exert
any influence on Naseby (as one of the host destinations) and its visitors to produce and
consume local foods. In Figure 6.31 the EF of using 100% conventional food (EF1) is
167.22 gha / year and this represents the total food EF. In the ordinary life area, GDPs1
is equal to NZ$ 38,872 (see Table 6.62).
Comparison between the first scenario and the ideal model of Naseby food consumption
indicates that in the first scenario the EF1 (167.22 gha) is 81.7 % bigger than the ideal
EF (30.61 gha) (Figure 6.31 and Table 6.62). Moreover, as shown in Figure 6.31, in the
first scenario, GDPs1 is equal to 12.56 % of the total GDP of Naseby food. On the other
hand, 87.44% (100%- 12.56%) of total GDP related to the food must be spent to change
EF1 to the ideal EF through generating the overshoot portion of food energy by using
wind-solar systems.
In Figure 6.31, the area of ‘Q2, EF2, and GDPs2’ determines the CF area of Naseby for
producing and consuming home prepared (organic) foods. As demonstrated in Figure
6.31 total Q2 in the CF for food consumed by Naseby visitors (30,936 kg) is divided
into the two portions of 11.8% (3,650kg) home prepared food (Q3) and 88.2%
(27,286kg) conventional eaten out food (Q 4). The EF in the CF (EF2) contains the EF
of using 11.8% (3,650kg) home cooked and 88.2% (27,286 kg) conventional eaten out
foods. The GDPs2 in the CF is equal to NZ$51,386 which is 4% (NZ$12,514) more
than GDPs1 (NZ$38,872) (Table 6.62).
Chapter 6: Second and Third Case Studies: Naseby and Cromwell –OCRT, New Zealand
337 | P a g e
Figure 6.31 and Table 6.62 indicate that using 11.8% home prepared (organic) food re-
duces total Naseby food EF by 3.8% (shown in Figure 6.31 as R-EF1). Likewise, as
shown in this figure, producing 11.8% local food increases GDPs1 by 4%, shown in the
figure as (I) GDPs1.
Comparison between the ideal model and present pattern of Naseby food consumption
demonstrates that EF2 (160.7gha) is 77.9 % (130.29 gha) more than ideal EF (30.61
gha), and 83.4 % (NZ$257,974) of the GDP (NZ$309,360) of food must be spent to re-
duce this overshoot portion of EF2 to the ideal EF (Table 6.62 and Figure 6.31).
- Q: 100% food in Ideal model - Q1: 100% conventional eaten out food – first scenario - Q2: 88.2% conventional eaten out food + 11.8% home prepared food - second scenario - Q3: 11.8% home prepared food (second scenario) - Q4: 88.2% conventional eaten out food (second scenario) - GDPs1: sustainable portion of GDP – first scenario - GDPs2: sustainable portion of GDP – second scenario - (I) GDPs1: increased portion of GDPs1 - EF1: ecological footprint of consumed food - first scenario - EF2: ecological footprint of consumed food - second scenario - R- EF1: reduced portion of total EF1 of consumed food
6.1.13.2. Naseby CF: Accommodation Services
This thesis explores the CF of 98 Naseby accommodation services through three scenar-
ios based on different quantities and qualities of accommodation services, their EFs and
Figure 6.31: The cultural footprint (CF) of Naseby related to food
Q2
80%
11.8 %
0.00%
60%
40%
100%
Q
Q1
Q3
Ordinary life area-first scenario
Ideal model Food
Second scenario –Present Naseby food
Q 4
GDP-Food (100%)
Food- Ideal EF (17.5%)
R- EF1 (3.8%)
EF1 (100%)
GDPs1 (12.56%)
GDPs2 (16.6%)
EF2 (96.2%)
(I) GDPs1= 4%
Chapter 6: Second and Third Case Studies: Naseby and Cromwell –OCRT, New Zealand
338 | P a g e
related GDPs values. In the first scenario, all buildings used as accommodation services
are assumed to be newly constructed (NB) without open air areas (veranda and bal-
cony). In the second scenario 6.1% (6) of 98 Naseby accommodation buildings with an
area of 2,183m2 area are RB and 93.9% (92) with and area of 5,961m2 are NB. In addi-
tion in the second scenario all areas of buildings including indoor and outdoor (V/B)
spaces are calculated as indoor spaces. In the third scenario 93.9% of 98 buildings are
NB, 6.1% of buildings are RB and 100.1m2 of total building area is outdoor sitting
space (V/B) (Table 6.64).
Table 6.63 shows that in the first scenario the total EF of using 100% NB buildings as
accommodation services is 7.6 gha. In this Chapter, the GDP of Naseby’s accommoda-
tion services is calculated through the following equations:
GDP of OCRT/visitor nights = 2,837,412 (total GDP of OCRT, see Table 5.91) ÷
42,437 (total OCRT visitor nights, see Table 5.9) = NZ$ 66.86 per visitor night
GDP of Naseby accommodation services = NZ$66.86/visitor night × 16,722 (Naseby
visitor nights, see Table 6.9) = NZ$1,118,033 (Table 6.63).
Since the overshoot portion of energy use in the third scenario has already been calcu-
lated as 567 GJ (see Tables 6.63 and 6.59), it is used here as a base to calculate the
overshoot energy of the first and second scenarios through the method which has been
explained in Chapter 5-section-5.11.2. Table 6.64 shows that the overshoot portions of
energy for accommodation services in the first and the second scenarios are 625.8 GJ
and 575.8 GJ respectively.
Table 6.63 contains the total costs to generate the overshoot energy related to each of
the three scenarios. These costs are calculated through using the method explained in
Chapter 5-section.5.11.2. As shown in Table 6.63, the costs to generate the overshoot
energy of the first, second and third scenarios in an environmentally sustainable way are
NZ$12,391, NZ$11,401 and NZ$ 11,227 respectively.
In this section, the GDPs of the three scenarios cited in Table 6.63 are calculated based
on the method used in Chapter 5-section.5.11.2 for the GDPs of OCRT accommodation
Chapter 6: Second and Third Case Studies: Naseby and Cromwell –OCRT, New Zealand
339 | P a g e
services. Table 6.63 determines that the GDPs of the third scenario (GDPs3) is the larg-
est at NZ$1,106,806 followed by NZ$1,106,632 (GDPs2) and NZ$1,105,642 (GDPs1).
First scenario Second scenario Third scenario All Naseby accommodation
buildings are NB 93.9 % of 98 Naseby accommo-dation buildings are NB and 6.1 % are RB (V/B not considered)
93.9% of 98buildings are NB and 6.1% are RB including
100.1m2 V/B Total number of accommodation ser-vices
981 Total number of ac-commodation ser-vices
98 Total number of accommodation services
98
NB accommodation area (m2)
8,1442 NB accommodation area (m2)
5,9612 NB accommoda-tion area (m2)
5,9612
RB accommodation area (m2)
0.00 RB accommodation area (m2)
2,5922 RB accommoda-tion area (m2)
2,5922
Total EF (EF1) (gha) 7.63 Total EF (EF2) (gha) 7.14 Total EF (EF3) (gha)
7.012
GDP (NZ$) 1,118,033 GDP (NZ$) 1,118,033 GDP (NZ$) 1,118,033 Overshoot energy (GJ/year)
625.8 Overshoot energy (GJ/year)
575.8 Overshoot energy (GJ/year)
567
Cost to generate 1 GJ energy using wind-solar systems (NZ$)
19.8 Cost to generate 1 GJ energy using wind-solar systems (NZ$)
19.8 Cost to generate 1 GJ energy using wind-solar systems (NZ$)
19.8
Cost to generate 625.8 GJ energy using wind-solar systems (NZ$)
12,391 Cost to generate 575.8 GJ energy us-ing wind-solar sys-tems (NZ$)
11,401 Cost to generate 567GJ energy using wind-solar systems (NZ$)
11,227
GDPs1 1,105,642 GDPs2 1,106,632 GDPs3 1,106,806 1. See Table 5.15 2. See Table 5.23 3. See Table 5.36 4. See Table 5.37
a. Sustainable living OCRT Accommodation Services (Ideal Model)
This section determines an ideal model for Naseby accommodation services in which its
EF is considered environmentally sustainable and its GDPs is equal to the total GDP of
Naseby accommodation services. This model is then used to compare each of the three
scenarios for Naseby accommodation services (cited in Table 6.63) with an environ-
mentally and economically sustainable pattern of accommodation.
a.1. Sustainable EF
As shown in Table 6.63 the total overshoot energy of Naseby accommodation services
at present is 567 GJ/year. As a result the overshoot portion of its EF is 567/100= 5.67
gha. As indicated in Table 6.63, the present EF of Naseby is 7.012 gha (EF3). Conse-
quently the environmentally sustainable EF can be considered as 7.012 gha – 5.67 =
1.34 gha.
Chapter 6: Second and Third Case Studies: Naseby and Cromwell –OCRT, New Zealand
340 | P a g e
a.2 . Sustainable Living: GDPs
Since for sustainable living the EF of accommodation services is not in overshoot, con-
sequently in this position both the overshoot energy and the cost to generate this
through using wind-solar systems are zero. Consequently the GDPs of the Ideal Model
is equal to the total GDP of Naseby accommodation services (NZ$1,118,033, see Table
6.63).
b. Comparison between the Ideal Model, First and Second Scenarios
Figure 6.32 comprises the quantities, EFs and GDPs(s) of Naseby accommodation ser-
vices arising from the Ideal model, first, second, and third scenarios discussed above.
This figure makes this an opportunity to explore the ecological and economic influences
exerted by using 2,183 m2 (26.8% of the total 8,144 m2, see Table 6.19) of accommoda-
tion area as refurbished (RB) buildings on the host destination.
As shown in Figure 6.32, in the Ideal model of accommodation services, Q is the 100%
Naseby accommodation services area (8,144 m2) with an EF of 1.34 gha and GDPs of
NZ$1,118,033 GDPs. In the ideal model as discussed above, the overshoot portion of
the EF and energy use are equal to zero. In first scenario, Q1 is the total area of Naseby
accommodation services (8,144 m2) where 100% are assumed to be new buildings (NB)
(Figure 6.23). In the second scenario as illustrated in Figure 6.32, Q2 represents the
Naseby accommodation area (8,144m2) divided into two portions of 73.2% (5,961m2,
see Table 6.19) NB and 26.8% (2,183 m2, see Table 6.19) RB buildings.
In Figure 6.32, EF1 is the biggest EF in comparison with the EFs of the other scenarios
and is here considered to be the 100% value. In addition, in this figure, the percentages
of other EFs including EF2 and Ideal- EF are compared with EF1 as the 100% bench-
mark.
As shown in Figure 6.32, in the ideal model of Naseby accommodation services, the
acceptable EF of these services is 17.6% of EF1 (7.6gha, see Table 6.63).On the other
hand, in the first scenario in which all accommodation is assumed to be NB, the EF
(EF1= 7.6gha) is 82.4% (6.26gha) larger than the sustainable EF (1.34gha) (Figure
6.32).
Chapter 6: Second and Third Case Studies: Naseby and Cromwell –OCRT, New Zealand
341 | P a g e
As illustrated in Figure 6.32, the EF of Naseby accommodation services in the second
scenario (EF2 = 7.1 gha, see Table 6.64) is 93.4% of EF1 (7.6gha, see Table 6.63).
Consequently (R) EF1 is equal to 6.6% of EF1= 0.5 gha (Figure 6.23).
GDPs1 (GDPs of the first scenario = NZ$ 1,105,642) is equal to 98.9% of total GDP of
Naseby -accommodation services (NZ$ 1,118,033) (Figure 6.32). On the other hand, in
the first scenario 1.1% (NZ$12,298) of the total GDP of Naseby accommodation ser-
vices must be spent to generate the overshoot portion of accommodation energy use
through wind-solar systems to change EF1 to the ideal EF.
As shown in Figure 6.32, GDPs2 (NZ$1,106,632, the GDPs of the second scenario) is
99% of the total GDP of Naseby accommodation (NZ$1,118,033). On the other hand in
the second scenario 1% (NZ$11,180) of the total GDP of Naseby accommodation ser-
vices must be spent to generate the overshoot portion of associated energy use through
using wind-solar systems to reduce EF2 to the ideal EF. Likewise, as determined in
Figure 6.32, (I) GDPs1 is equal to 0.1% of the total GDP of Naseby accommodation
services. This means using 2,183 m2 RB (26.8% of total Naseby accommodation areas)
contributes to an increase of 0.1% of GDPs1.
c. Comparison between the Ideal Model, Second and Third Scenarios
In third scenario Q3 is total area of Naseby accommodation services in which 73.2%
(5,961m2) is NB and 26.8% (2,183m2) is RB (Figure 6.32 and Table 6.63). Furthermore,
in the third scenario, of total Q3 (8,144 m2) 100.1m2 (1.2%) is V/B and 8,043.9 m2
(98.8%) is indoor spaces (Figure 6.32).
In the third scenario, the total EF of Naseby accommodation services (EF3) is 7.012 gha
(see Table 6.63), which is 92.3% of EF1 (Figure 6.32). In addition, as shown in Figure
6.32, EF3 (92.3 % of EF1) is 1.1% less than EF2 (93.4% of EF1). On the other hand (R)
EF2 is equivalent to (EF2) – (EF3) = 1.1% of EF1 (EF of the first scenario that is used
as a base, representing the 100% EF of Naseby accommodation services). Thus EF3 is
the present EF of Naseby accommodation services, which is 74.94% (92.3%- 17.36%)
bigger than the Ideal EF shown in Figure 6.32.
Figure 6.32 and Table 6.63 show that the GDPs of the third scenario (GDPs3), which is
the present GDPs of Naseby accommodation services, is 0.01% more than GDPs2. Fur-
Chapter 6: Second and Third Case Studies: Naseby and Cromwell –OCRT, New Zealand
342 | P a g e
thermore, GDPs3 is 1.01% (NZ$11,292) less than the total GDP (NZ$1,118,033) of
Naseby accommodation services (Figure 6.32 and Table 6.63). This means (I) GDPs2
which is influenced by using 100.1m2 V/B is 0.01% of the total GDP of Naseby ac-
commodation services. In addition, Figure 6.23 shows that in the third scenario (present
circumstance of Naseby accommodation services), 1.01% (NZ$11,292) of the GDP of
Naseby accommodation services must be spent to generate its overshoot portion of en-
ergy use through using wind-solar systems to reduce its present EF to the ideal EF.
- Q: (100%) area of 98 Naseby accommodation services (8,144m 2) – Ideal model - GDP: GDP of Naseby-accommodation services NZ$1,118,033 (see Table 6.62) - GDPs: Total sustainable portion of Naseby accommodation services – Ideal model - Q1: Total (100%) area of 98 Naseby accommodation services (8,144m2) – all assumed as NB
(first scenario) - EF1: Total EF of Naseby accommodation services (first scenario) - (R) EF1: Reduced portion of Naseby EF1 influenced by using RB buildings as accommodation
services. - GDPs1: Total GDPs of Naseby accommodation services (first scenario) - (I) GDPs1: Increased portion of GDPs1 influenced by using RB as part of Naseby accommoda-
tion services - Q2: Area 98 Naseby accommodation services (8,1446m2) including; 73.2% (5,961m2) NB and
26.8% (2,183m2) RB (second scenario) - Q3: Area of 98 Naseby accommodation services (8,144m2) including; 73.2% (5,961m2) NB and
26.8% (2,183m2) RB. Of total Q3 (8,144m2), 100.1m2 (1.2%) is V/B and 8,043.9 m2 is indoor spaces (third scenario)
V/B.1.2%
Q
Q2
Q1
80%
0.00%
26.8 %
60%
40%
100%
Q3
Figure 6.32: The CF of Naseby accommodation services using RB buildings and V/B as part of accommodation services
GDPs3 (98.99% GDP)
GDPs2 (98.98% GDP)
GDPs1 (98.89% GDP)
GDPs = 100% GDP
(I) GDPs1 (0.5%)
(I) GDPs2 (0.1%)
Ideal- EF (17.36% of EF1)
R- EF2 (1.1%)
EF1 (100%)
EF2 (93.4% of EF1)
EF3 (92.3% of EF1)
R- EF1 (6.6%)
Q5
Q 4
Ideal Model
First scenario
Second scenario
Third scenario
Chapter 6: Second and Third Case Studies: Naseby and Cromwell –OCRT, New Zealand
343 | P a g e
- Q 4 (NB area): 73.2% (5,961m2) of total Naseby accommodation area (8,144m2) (second sce-nario)
- Q5 (RB area): 26.8% (2,183m2) of total Naseby accommodation area (8,144m2) (second sce-nario)
- EF2: EF of 8,144 m2 Naseby accommodation services (Q2) including EFs of Q3 and Q 4 - (R) EF2: Reduced portion of Naseby EF2 influenced by using V/B - GDPs2: Total GDPs of Naseby accommodation services (second scenario) - EF3: EF of Naseby accommodation services (third scenario) (present EF of accommodation ser-
vices)
6.1.13.3. The CF of Naseby Visitor Activities
a. Overshoot EF of Naseby Visitor Activities
As shown in Table 6.64, the category of other activities has the largest portion at 71%
(2.13gha) of the total EF of Naseby visitor activities (3.02 gha), followed by curling
(23%), golf (0.18%) and walking (0.05%).Table 6.64 shows that the total overshoot por-
tion of the EF of Naseby activities is 2.55 gha (see also Table 6.59). The overshoot por-
tions of the EFs of the four activity groups above are calculated as follows:
Overshoot portion of the EF of each activity category = the activity percentage of the
EF × total overshoot EF of Naseby activities (2.55 gha)
For example:
Overshoot EF of golf = 6% × 2.55(gha) = 0.15 gha (see Table 6.64).
In addition the overshoot energy use of each category is calculated as its overshoot EF ×
100 (global average carrying capacity) (Table 6.64).As shown in Table 6.64, the cate-
gory of other activities has the largest overshoot energy of 180 GJ, followed by 59 GJ
curling, 15 golf and 0.1GJ walking.
b. Naseby Activities GDP
This chapter uses the average GDP of OCRT activities per visitor (NZ$56.88) cited in
Chapter 5- Table 5.98 as Naseby GDP per visitor activity (Table 6.64). As shown in
Table 6.64 the GDP of each category is calculated as the number of visitor activities ×
NZ$56.88/visitor activity. Table 6.64 demonstrates that of the NZ$744,446 GDP of
Naseby activities (13,088 visitor activities × NZ$56.88 GDP/visitor activity), the largest
portion of NZ$492,012 is the GDP of other visitor activities, followed by NZ$247,428
(curling), NZ$ 3,413 (golf) an NZ$1,593 walking.
c. Naseby Activities GDPs
As demonstrated in Table 6.64 the overshoot energy use of each category is calculated
as its overshoot EF multiplied by 100 GJ/gha (global average carrying capacity of land).
Chapter 6: Second and Third Case Studies: Naseby and Cromwell –OCRT, New Zealand
344 | P a g e
Also as shown, the category of other activities the largest overshoot of 180 GJ, followed
by curling (59 GJ), golf (15) and walking (0.1GJ).
This chapter calculates the cost to generate the overshoot portion of the energy of each
category of Naseby activities through using the method explained in Chapter 5- section
5.10.2. Table 6.64 contains the total cost that must be paid to generate the overshoot en-
ergy of each type of Naseby activity through using wind-solar systems. As presented in
Table 6.64, the category of other activities has the largest cost of NZ$ 3,510 and walk-
ing the minimum cost ($NZ2 ~ 0.00) to generate the overshoot energy in a sustainable
way. The total cost of Naseby activities overshoot energy as shown in Table 6.64 is
$NZ4, 948.
The GDPs of each category of Naseby visitor activities (GDP – cost of overshoot en-
ergy used) are set out in Table 6.64. As shown, the GDPs of the category of activities
has the largest GDPs of NZ$ 488,502 and other activities including curling, golf and
walking have the GDPs in a range of NZ$1,591 – NZ$246,277. In addition, the total
GDPs of Naseby visitor activities is NZ$739,498, equivalent to 99.33% of its total GDP
($NZ744, 446) (Table 6.64).
Table 6.64: Naseby visitor activities- EF and GDPs
Other 8,650 2.13 71 1.8 180 492,012 3,510 488,502 Total 13,088 3.02 100 2.55 3 255 744,446 4,948 739,498
1. See Figure 6.27 and Table 6.55 2. Numbers are rounded 3. See Table 6.59 4. percentages are rounded • Average GDP of OCRT visitor activity = Total GDP of OCRT activities/visitor activities = 1483,180 ÷ 26,077
= NZ$56.88 (see Chapter 5: Table 5.98).
d. CF: Ideal Model for Sustainable Activities and Three Scenarios
This chapter proposes three scenarios for the CF of Naseby visitor activities (illustrated
in Figure 6.33) and compares the areas generated with each other and the sustainable
area (Ideal model) of these activities (shown as the green area in Figure 6.33).
Chapter 6: Second and Third Case Studies: Naseby and Cromwell –OCRT, New Zealand
345 | P a g e
d.1. Naseby Visitor Activities (Ideal model)
This thesis considered the sustainable area for ecotourism activities to be the area in
which the overshoot portion of the EF of activities is zero and consequently the GDPs
of this area is equal with the total GDP arising from these activities under that con-
straint.
As shown in Table 6.64, the present EF of Naseby visitor activities is 3.02 gha and its
overshoot EF is 2.55 gha. The EF of the Ideal model for Naseby visitors activities (zero
overshoot EF) is 3.02gha – 2.55 gha = 0.47 gha. This means the ecologically sustainable
EF of Naseby visitors activities (0.47 gha) is 15.6 % of its present EF (EF1= 3.02gha).
Moreover, in the sustainable area of Naseby visitors activities, as the cost of overshoot
energy is zero, its GDPs is equal to 100% of the GDP of Naseby visitor activities
($NZ744,446, see Table 6.64).
d.2. Naseby Visitor Activities (First Scenario)
The present CF of Naseby visitor activities is the same as the first scenario shown in
Figure 6.33. In the first scenario the total number of visitor activities (13,088) comprises
8,650 visitors doing other activities, 4,350 visitors curling, 60 visitors playing golf, and
28 visitors walking (see Table 6.65). (Note: the number of activities is greater than the
number of visitors to Naseby, as each visitor is assumed to participate in more than one
activity).
The total EF of Naseby visitors’ activities (EF1) in the first scenario is 3.02 gha (see
Table 6.65) and this is used as the 100% benchmark when comparing this with other
scenarios and the Ideal model (see Figure 6.24). As shown in Figure 6.33 and Table
6.64 in the first scenario GDPs1 (present situation, Table 6.64) is equal to 99.33%
(NZ$739,498) of the total GDP of Naseby visitor activities (NZ$744,446).
d.3. OCRT Visitor Activities (Second Scenario)
The second scenario is proposed based on the assumption that the 60 visitors who play
golf in the first scenario choose walking instead (see Table 6.65). In the second sce-
nario, walking is assumed to have an EF of 0.00006gha/visitor, see Table 5.82).
Chapter 6: Second and Third Case Studies: Naseby and Cromwell –OCRT, New Zealand
346 | P a g e
Table 6.65: The CF of Naseby visitor activities - first and second scenarios First scenario Second scenario
Category NV4 EF/visitor EF1 Category NV EF (gha/visitor)
Other 8,650 0.00025 2.13 Other 8,650 0.00025 2.13 Total 13,088 - 3.02 Total 13,088 - 2.35
1. See Table 5.58 2. See Table 6.35 3. See Table 5.56 4. NV: Number of visitor activities (see Table 6.62)
- Q: 100% of Naseby visitor activities in Ideal model - Q1: 100% of Naseby visitor activities first scenario (present) - Q2: 100% of Naseby visitor activities second scenario (Walking instead golfing) - Q3: 100% of Naseby visitor activities Third scenario (Walking instead golfing and curling) - EF1: The EF of Naseby visitor activities first scenario (present EF) - EF2: The EF of Naseby visitor activities second scenario - EF3: The EF of Naseby visitor activities third scenario - (R) EF1: Reduced portion of EF1 influenced by changing golf for walking - (R) EF2: Reduced portion of EF2 influenced by changing golfing and curling for walking - GDP: The GDP of Naseby visitor activities - GDPs: The GDPs of Ideal model for visitor activities = GDP - GDPs1: The GDPs of Naseby visitor activities first scenario - GDPs2: The GDPs of Naseby visitor activities second scenario - GDPs3: The GDPs of Naseby visitor activities third scenario - (I) GDPs 1: Increased portion of GDPs1 influenced by changing golf for walking - (I) GDPs 2: Increased portion of GDPs2 influenced by changing golf and curling for walking
Figure 6.33: The CF of Naseby visitor activities
100%
0.00%
Q
Q2
Q1
Q3
EF1 (100%)
(R) EF1 = 6.3 % = 0.19 gha
(R) EF2 = 15.9% = 0.48gha gha
Ideal EF (15.56 %)
EF3 (77.8%)
EF2 (93.7%)
Ideal Model
First Scenario- Present CF
Second scenario- Walking instead golf
Third scenario- Walking instead golf and curling
(I) GDPs1= 0.04% = $NZ$276
(I) GDPs2= 0.08 % = $NZ 615
GDPs1 (99.33%)
GDPs2 (99.37%)
GDPs3 (99.45%)
GDPs= GDP (100%)
Chapter 6: Second and Third Case Studies: Naseby and Cromwell –OCRT, New Zealand
349 | P a g e
6.2. Case Study 3: Cromwell
6.2.1. Introduction
This thesis is based on Cromwell as a host destination for OCRT visitors with the inten-
tion of comparing the results of the analysis with those of Naseby. As discussed in
Chapter 3 (section 3.3.2.3) one of the main reasons for choosing Cromwell as a case
study is that new buildings form 100% of accommodation services in this place. Fur-
thermore, due to the existence of environmental attractions and tourism activities in
Cromwell, in 2011 22% of 11,788 OCRT people visited this place. These characteristics
of Cromwell and its differences from Naseby show how the proposed comprehensive
framework can be used to compare the influences exerted by ecotourism and its archi-
tecture on different destinations in terms of being sustainable.
This section aims to investigate the influences exerted by ecotourism on the socio-
cultural behaviours of visitors and host communities that in turn could change their en-
vironmental and economic footprint to being sustainable. The investigation of the influ-
ences of the OCRT and its architecture on Cromwell is conducted through using the
method and holistic framework explained and used in the first and the second case stud-
ies.
6.2.2: Background to Cromwell
Cromwell is a town located at an elevation of 199 m, 45° S and 169° E. The town is
strategically placed as a holiday centre for the whole of Central Otago. On the shores of
Lake Dunstan, Cromwell’s centrality to Wanaka (55km), Queenstown (62km) and the
remainder of Central Otago makes it a great location for easy day trips to all corners of
Central Otago (see Figures 6.34 and 6.35).
Chapter 6: Second and Third Case Studies: Naseby and Cromwell –OCRT, New Zealand
350 | P a g e
Figure 6.34: Cromwell, Central Otago, New Zealand http://www.centralotagonz.com/PicsHotel/CentralOtagoRTO/Images/Discovery/RailTrail/HotspotMap.jpg viewed August 2012
Figure 6.35: A view of Cromwell http://cromwellsports.files.wordpress.com/2010/05/cromwell.jpg viewed August 2012
Chapter 6: Second and Third Case Studies: Naseby and Cromwell –OCRT, New Zealand
354 | P a g e
Cromwell with its historic and environmental heritage and capitals is considered one of
the attractive destinations for a holiday as offered by the OCRT to its visitors. The fol-
lowing section, therefore, explores the environmental, cultural and economic influences
of the development of the OCRT on Cromwell, through using the holistic framework
proposed in Chapter 5 for the development of ecotourism and its architecture.
6.2.3: Visitors to Cromwell
In this chapter Cromwell’s visitors are classified into international and domestic visi-
tors. This section presents information related to each group, including the number of
visitors, visitor nights and their home places.
6.2.3.1: Visitor Numbers
As shown in Table 5.49 (Chapter 5, 5.7.4) of 11,788 total OCRT visitors, 22.5% (2,652)
choose Cromwell as their destination. This chapter therefore uses the 2,652 OCRT visi-
tors to Cromwell as its total number of visitors in 2011, as shown in Table 6.67. Moreo-
ver, as shown in Figure 5.7 (Chapter 5), in 2011 the average stay of OCRT visitors is
3.6 nights. This section calculates total visitor nights at Cromwell based on its 2,652
visitors and 3.6 average visitor nights (2,562 visitors × 3.6 visitor nights) to be 9,547
(Table 6.67).
Table 6.67: Cromwell visitors based on CODC survey (2011) Total numbers of OCRT visitors1
% of OCRT visitors who
visit Cromwell2
Numbers of OCRT visitors who visit
Cromwell2
Average visitor nights3
Total visitor nights
11,788 22.5 2,652 3.6 9,547 1. See Figure 5.2 2. See Table 5.49 3. See Figure 5.3
6.2.3.2: Visitors Home Place
As illustrated in Figure 5.13 (Chapter 5, 5.3.3) 22% of the total 11,788 OCRT visitors
are international and 78% are domestic. This thesis uses these proportions to calculate
the number of visitors in each category to Cromwell as shown in Table 6.68. Table 6.68
determines that the total for domestic visitors to Cromwell is 78% of 2,652 or 2,069
visitors. Likewise, Table 6.68 indicates that 22% (583) of Cromwell’s 2,652 visitors are
international in 2011.
Chapter 6: Second and Third Case Studies: Naseby and Cromwell –OCRT, New Zealand
355 | P a g e
Table 6.68: Cromwell international and domestic visitors (2011) Domestic visitors International visitors
Number of visitors % of total number of visi-tors
Number of visitors % of total number of visi-tors
2,069 78 583 22 • Cromwell total visitors (2011) = 2,652 (see Table 6.68)
a. Cromwell – International Visitors
This thesis uses the percentage break down of OCRT international visitors cited in Ta-
ble 5.1 (Chapter 5, section 5.3.3.1) and the right hand column in Table 6.69 as a base to
calculate from where in 2011 Cromwell international visitors originated. As presented
in Table 6.69, of the 583 Cromwell international visitors, the majority or 249 visitors
came from Europe, followed by 192 (32.9%) Australia, and 73 (12.6%) UK. Other
Cromwell international visitors from North America, Middle East and Africa are in the
range of 8 (1.4%) – 53 (9%) (Table 6.69).
b. Cromwell – Domestic Visitors
This chapter uses the percentage break down of OCRT domestic visitors in Table 5.3
(Chapter 5, section 5.3.3.2) and Table 6.70 (right hand column) to calculate the home
places of Cromwell domestic visitors in 2011. Table 6.70 shows that of 2,069 Cromwell
domestic visitors, the majority or 741 (35.8%) were from upper NI followed by 470
(22.75%) from central SI, 439 (21.2%) upper SI, 308 (14.9%) lower NI, and
111(5.35%) lower SI.
Table 6.69: Cromwell international visitors 2011 Home place NV1 % Europe 249 42.7 Australia 192 32.9 UK 73 12.6 North America 53 9 Middle East 8 1.4 South Africa 8 1.4 Total 583 100 3. NV: Number of Visitors. • Total visitor numbers (2011) = 2,652 (See Table 6.68) • Percentage of international visitors (2011) = 22% (See Table 6.68) • Total number of Cromwell international visitors = 583 (See Table 6.68)
Chapter 6: Second and Third Case Studies: Naseby and Cromwell –OCRT, New Zealand
356 | P a g e
Table 6.70: Cromwell domestic visitors by home place Region/ city Number of visitors % Upper NI 741 35.8 Lower NI 308 14.9 Upper SI 439 21.2 Central SI (Otago) 470 22.75 Lower SI 111 5.35 Total 2,069 100
6.2.4. Transportation
This section explores the types of international and domestic transportation used by
Cromwell’s visitors and calculates their EFs. The total EF of Cromwell visitor transpor-
tation is calculated through integration of the EFs of international and domestic travel.
6.2.4.1. International Transportation
a. Types of International Transportation
As discussed in the Section 6.1.4.1, in this study air travel is the only type of interna-
tional transportation considered.
b. Cromwell – International Tourism-kilometres (T-km)
Table 6.71 shows that 583 Cromwell visitors (22%) are international tourists and the
total distance between their home places and Auckland’s international airport is
7,198,999 T-km.
Table 6.71: Cromwell international Tourism-km
Home place
Assumed city of origin
(central in country of
origin)
Distance between central
cities and Auckland
(km).
Visitors Total In-ternational
T-km
Auckland to Dunedin
(km, return)
Air domestic International visitors T-km
from Auckland to Dunedin (re-
turn)
No %
Australia Sydney and Mel-bourne
2,512 192 32.9 482,304 2,156 413,952
Europe Frankfurt 18,180 249 42.7 4,526,820 2,156 536,844 UK London 18,334 73 12.6 1338309 2,156 157,388
North America
Montana Billings
11,950 53 9 633,350 2,156 114,268
Middle East
Tehran 15,005 8 1.4 120,040 2,156 17,248
South Africa
Pretoria 12,272 8 1.4 98,176 2,156 17,428
Total - 78,253 583 100 7,198,999 - 1,257128
Chapter 6: Second and Third Case Studies: Naseby and Cromwell –OCRT, New Zealand
357 | P a g e
As discussed in Section 6.1.4.1-b, in this case study international travel distances are
calculated as a one way trip. Because international tourists have to travel from Auckland
to Dunedin and back, this part of the journey is a domestic flight and is equivalent to
1,257128 T-km, shown in Table 6.71 as Air domestic international visitors.
6.2.4.2. Types of Domestic Transportation
The types and percentages of transport use for holidays in New Zealand cited in Chapter
5 and shown in Table 5.5 (Matthews, 2009:13) are used as a pattern for transport used
to access Cromwell.
a. Domestic Tourism-Kilometres (T-km)
This chapter uses Auckland as the central city for the upper NI and Wellington as the
equivalent for the lower NI. In the same way, Nelson/Marlborough are used for the up-
per SI), Otago for the central SI, and Southland for the lower SI to calculate the distance
between domestic visitors’ home places and Cromwell (Table 6.72). In addition, to
measure the distance between home places of visitors from the upper SI, the average
distance between Nelson and Cromwell and Marlborough and Cromwell is calculated
and used (Table 6.72).Visitors to Cromwell who come by car/van from the upper NI
(Auckland) and lower NI (Wellington), shown as the grey areas in Table 6.72, need to
use the ferry to cross to the South Island. Distances between these places and Cromwell
are separated into three parts; home to Wellington (except Wellington); Wellington to
Picton by ferry; and Picton to Cromwell (Table 6.72).
Table 6.72: Cromwell domestic T-km Region Central city Distance to Cromwell (km-return) Number
of Visi-tors
Domestic T-km
Upper
NI
Auckland
Auckland to Wel-lington
Wellington to Picton
Picton to Cromwell
Total
741
2,224,482
1,318 204 1,480 3,002 Lower
NI Wellington - 204 1,480 1,684 308 518,672
Upper SI1
Nelson/ Marlborough
1,6861 1,686 439 740,154
Central SI
Otago 1,2522 125 470 58,750
Lower SI
Invercargill, Southland
488 488 111 258,288
Total - - - 2,069 3,800,346 1. Distance between upper SI and Cromwell is calculated as the average of distances between Nelson and Cromwell and Marlborough and Cromwell. 2. Average distance between central Otago cities and OCRT (Cromwell).
Chapter 6: Second and Third Case Studies: Naseby and Cromwell –OCRT, New Zealand
358 | P a g e
According to Matthews (2009:13), in New Zealand 1% of people going on holiday are
pedestrians but in this study these have been ignored as Cromwell is far from the places
of origin of visitors. The remaining 3% of visitors are assumed to be domestic air travel.
In addition, the ferry T-km of 228,021 (Table 6.73) are subtracted from the total car/van
T-km of 3,610,329 to give the road T-km.
Table 6.73: Types of transport used by Cromwell domestic visitors (based on Matthews, 2009:13) Type of Transport Car/van driver/passenger Bus
Car-Ferry
Air domestic
% of total 89 2 6 3 Tourist-km 3,382,308 76,007 228,021 114,010
Total domestic T-km 3,800,346
• Numbers are rounded
6.1.4.3. The Ecological Footprint (EF) of Cromwell Transportation
Table 6.74 shows that total transportation energy of Cromwell visitors (2011) is
26,946,557 MJ (26,946.6 GJ). The land to energy conversion capacity used in this thesis
is the global average of 100 GJ/gha. As demonstrated in Table 6.74 the total EF of
Cromwell transportation is 26,946.6 GJ ÷100 GJ/gha = 269.5 gha.
Table 6.74: EF of Cromwell transportation (2011)
Transport Mode Tourist-km Energy use MJ/passenger-km
Total annual energy use by OCRT visitors
(MJ)
Air International
7,198,999 1.25 (Boeing 747) 8,998,749
Air domestic (International visitors from
Auckland to Dunedin)
1,257,128 3.88 4,877,657
Air domestic 114,010 3.88 442,359 Car/van driver and passen-
ger 3,382,308 3.1 (average) 10,485,155
Bus 76,007 1.01 76,767 Car-ferry 228,021 9.06 2,065,870
Total Reference: Vale & Vale, 2009.
26,946,557
EF for all types of transportation used by Cromwell visitors 269.5 1. Total EF of Cromwell transportation includes: 138.8 gha ( EF of international transportation) + 54.7 gha (EF of domestic transportation)
Table 6.74 gives the total energy use of Cromwell transportation (26,946,557 MJ) made
up of 13,876 GJ for air international and domestic travel by international visitors and
13,070 GJ for domestic visitor transportation. As a result, of total EF of Cromwell
Chapter 6: Second and Third Case Studies: Naseby and Cromwell –OCRT, New Zealand
359 | P a g e
transportation (269.5gha) is 51.5% (138.8 gha) for international travelers and 48.5%
(130.7 gha) for domestic travelers.
6.2.5. Food
As shown in Table 6.67, 2,652 visitors went to Cromwell in 2011 and the mean number
of nights they stayed was 3.6. Thus annual total visitor nights for tourists coming to
Cromwell equal 9,547. Due to the lack of local information, the food consumption data
presented by Collins et al (2005) are used to calculate the EF of food consumption for
Cromwell visitors.
This chapter uses the same two scenarios to calculate the EF of food that were used for
Naseby. In the first scenario, the EF of food is calculated based on the assumption 100%
of food is conventional. In the second scenario, the total amount of food eaten by
Cromwell visitors is separated into the two areas of local (home prepared) food (2.5%
of total food) and conventional food (97.5% of total food).Comparison between the re-
sults of the two scenarios will indicate the influence exerted by the use of home pre-
pared food (as a cultural product) on the EF and the Economic Footprint (ECF) of
Cromwell.
6.2.5.1. The EF of Cromwell Food (First Scenario)
In the first scenario, the total amount of food eaten by Cromwell visitors has been as-
sumed to have a footprint equivalent to that of food consumed outside the home by Car-
diff residents. This totals 67.04 kg per resident/yr (Collins et al, 2005:25) with a foot-
print of 0.429gha/resident (Collins et al, 2005:32). This means 1kg of food eaten out has
an EF of 0.429/67.04 gha/kg = 0.006 gha/kg. The average amount of food eaten by a
Cardiff resident each day is 1.85 kg, and this value has been used for visitors to Crom-
well. The results are shown in Table 6.75. The EF of tourist food is equivalent to
1.85×0.006 = 0.01 gha/visitor night (Table 6.75). The total EF of food consumed by
Cromwell’s visitors is 9,547×0.01= 95.47gha and the EF of this food/visitor is
Chapter 6: Second and Third Case Studies: Naseby and Cromwell –OCRT, New Zealand
360 | P a g e
Table 6.75: EF of food consumed by Cromwell visitors (2011) Item Data Reference
Cromwell visitor numbers (2011) 2,652 (See Table 6.68) Average visitor nights/visitor 3.6 Total visitor nights 9,547 EF of food eaten out gha/cap 0.429 Collins et al , 2005:32 EF of tourist food gha/visitor night
0.01
Total EF of food consumed by Cromwell visitors (gha)
95.47
EF of food consumed by Crom-well visitors/visitor (gha/visitor)
0.036
6.2.5.2. The EF of Cromwell Food (Second Scenario)
In Cromwell local products (such as food, beverage and wine) are offered to visitors by
492 separate accommodation services with 3,170 available bed spaces (Appendix 5-
Rows188-200- Cromwell). The information related to Cromwell products arising from
Appendix 5, are summarised and set out in Table 6.76.
Table 6.76 demonstrates that in 2011, of the 19 (3.8% of the total 492 accommodation
services with 267 bed spaces) that offered local produce, 4 (0.8% of total with 78 bed
spaces) offered home baking and local food and beverages to their visitors and 2 (2% of
total with 189 bed spaces) offered locally produced wine. Since the total visitor nights
for Cromwell are 9,547 and total Cromwell bed spaces are 3,170, the average visitor
nights per bed space is 9,547 ÷ 3,170= 3.01 visitor nights/bed space. Consequently as
shown in Table 6.76, the total visitor nights that Cromwell visitors consume local food
is 78 × 3.01 = 235 visitor nights, equal to 2.5% of total 9,547 Cromwell visitor nights
(Table 6.76).
Table 6.76. Cromwell local produce (summary)
Produce F % % of 492 accommo-dations services
Bed spaces Visitor nights1
Local food and beverage 4 21 0.8 78 2352
Wine 15 79 3 189 569 Total 19 100 3.8 267
1. Average visitor nights/bed space = 9,547 (total visitor nights)/3,170 (total bed spaces) = 3.01 2. 78 (bed spaces) × 3.01 (average visitor nights per bed space) = 235 visitor nights
This chapter uses the EFs of home cooked and conventional foods (per capita, per kg
and per visitor night) as discussed in Chapter 5 (section.5.5.2 and Table s 5.11 and 5.12)
to calculate the EFs of home cooked and conventional foods consumed by Cromwell’s
visitors, as in the following table.
Chapter 6: Second and Third Case Studies: Naseby and Cromwell –OCRT, New Zealand
361 | P a g e
Table 6.77: Ecological footprint of home prepared and conventional foods consumed by Cromwell visitors (2011)
Home prepared and local food EF Conventional food EF EF of local food gha/cap 0.254 EF of 1 kg conventional food eaten out
(gha/cap) 0.429
EF of 1 kg local food gha/kg 0.0037 EF of tourist food (gha/visitor night) 0.01 EF of local food gha/visitor night 0.0068 EF of local food of 235 visitor nights (gha)
1.59 Total EF of conventional food con-sumed by Cromwell visitors/9,3121 visitor nights (gha)
93.12
Total EF of home cooked and conventional foods (gha) 94.71 1. 9,547 (total visitor nights) – 253 (visitor nights that tourists consume local food) = 9,312
Table 6.77 indicates that the EF of local food consumed by Cromwell visitors in 2011 is
235 visitor nights × 0.0068 gha = 1.59 gha. As the total visitor nights are 9,547 (see
Table 6.67) and the number of visitor nights that visitors consume home cooked food is
235, consequently the total visitor nights that visitors to Cromwell consume conven-
tional food is 9,547 – 235= 9,312 visitor nights (see Table 6.77). Likewise the EF of
conventional food consumed by Cromwell’s visitors in 2011 is 9,312 visitor nights ×
0.01 (EF of conventional tourist food, gha/visitor night) = 93.12gha (Table 6.77). The
total EF of consumed food in the second scenario (present circumstance) including the
EFs of conventional and home prepared food is 93.12gha + 1.59 gha = 94.71 gha (Table
6.77).
6.2.5.3. Environmental Effects of using local Food
Comparing the results of the two scenarios shows that producing 2.5% (435kg) of
(17,662 kg) food locally reduces the total EF of food by 0.76 gha (0.8 % of 95.47 gha)
(Table 6.78).
Table 6.78: The effect of consuming home prepared food on the EF of food consumed by Cromwell
visitors (2011)
100% (17,662 kg) con-ventional eaten out food1
97.5 % (17,227 kg) conventional eaten out food and 2.5 % (435 kg) home
cooked (organic) food Cromwell EF of food 95.47 94.71 Reduction in EF of food con-sumed by Cromwell visitors (gha)
0.76
1. 9,547 (Total visitor nights) × 1.85 kg (food/visitor night) = 17,662 kg
Chapter 6: Second and Third Case Studies: Naseby and Cromwell –OCRT, New Zealand
362 | P a g e
6.2.6. Accommodation Services
6.2.6.1. Types of Accommodation Services
This thesis places the 492 Cromwell accommodation services into the four categories of
self-contained (SC), bed and breakfast (B&B), motel, and powered and non-powered
camping sites based on the information collected through using 12 official websites re-
lated to OCRT Cromwell accommodation services (Appendix 5 and 6-rows: 188-200).
Table 6.79 summarises the parts of Appendix 5 that address available bed spaces by
types of accommodation service. As shown in Table 6.79 and Figure 6.41, in 2011, of
the total 492 Cromwell accommodation services, the majority or 95.7% are camping
sites (including 58.5% powered and 37.2% non-powered sites) followed by 2.9% mo-
tels, 1% SC and 0.4% B&B. Looking at available bed spaces, the majority or 89.1% still
occur in camping sites (including 54.5% powered and 34.6% non-powered sites), fol-
lowed by 7.2% in motels, 3.2% in B&Bs and 0.5% SC.
Type Q1 Number % Available bed spaces % SC NB 5 1 15 0.5 B&B NB 2 0.4 100 3.2 Motel NB 14 2.9 229 7.2 Camping ( powered sites) NB 288 58.5 1,728 54.5 Camping ( non-powered sites) NB
183 37.2 1,098 34.6
Total 492 100 3,170 100 1. Quality of buildings and sites used as accommodation services at Cromwell
Figure 6.44: Cromwell SC accommodation services - energy sources, facilities and spaces (2011)
El: Electricity So: Solar system TV (S): Share TV TV (P): Private TV Int: Internet V/B (S): Share veranda/ balcony V/B (P): Private veranda/balcony Outdoor sitting (S): Share outdoor sitting Outdoor sitting (P): Private outdoor sitting
Chapter 6: Second and Third Case Studies: Naseby and Cromwell –OCRT, New Zealand
366 | P a g e
c. Cromwell’s Motel Accommodation Services – Energy Sources, Facilities and
Open Air Spaces (2011)
As illustrated in Figure 6.46 and shown in Appendices.31 and 33, 213 (96%) of Crom-
well’s 229 motel accommodation services use electricity as the main source for heating.
Type of accommodation service % of visitor nights (2005) Visitor nights (2011) SC 21.61 2,062 B&B 22.42 2,139 Motel 323 3,055 Camping 24 2,291 Total 100 9,5474
1. SC % of visitor nights = 8.5% (50% of total Bp and homestead) + 13.1% (% of visitor nights of SC in 2005) (see Table 5.19). 2. B&B % of visitor nights= 8.5% (50% of total Bp and homestead) + 13.9% (% of visitor nights of B&B in 2005) (see Table 5.19). 3. Motel % of visitor nights = 10.9 % + 21.1% (see Table 5.19). 4. See Table 6.67
6.2.6.6. Cromwell Accommodation Services – Area
This section uses the average area per bed of OCRT accommodation services (cited in
Table 5.20) as the average area per bed of Cromwell’s accommodation services to cal-
culate the total area of each type. Table 6.83 indicates that the total area of 492 Crom-
well accommodation services is 25,178 m2, including 443 m2 SC, 4000 m2 B&B, 3,779
m2 motel, and 16,956 m2 camping sites.
As shown in Table 6.83, the occupied area of each type of accommodation service is
calculated as its total area multiplied by its percentage occupancy rate. Table 6.83 dem-
onstrates that the total occupied area of Cromwell accommodation is 6,270 m2, includ-
ing 96 m2 SC, 896 m2 B&B, 1,209 m2 motel and 4,069 m2 camping sites.
Chapter 6: Second and Third Case Studies: Naseby and Cromwell –OCRT, New Zealand
370 | P a g e
Table 6.83: Cromwell Accommodation services - Total area and Occupied area (2011) Type No. C Area per
Total 4,000 160.12 896 268.8 428.9 4.29 1. See Table 5.27 2. B&B area/bed space = 40 m2 (see Table 5.20) 3. See Chapter 5-section 5.6.8.1-c-(c-1) and Table 5.28 4. Occupancy rate of OCRT B&B = 22.4% (see Table 6.82)
a.3. The EF of Cromwell Motel Accommodation Services
Total - 3,870 102 - 816 204 307.1 3.07 1. See Table 5.27 2. Motel area/bed space = 40m2 (see Table 5.20) 3. See Chapter 5-section 5.6.8.1-c-(c-1) and Table 5.28 4. Occupancy rate of OCRT Motels = 32% (see Table 6.82)
a.4. The EF of Cromwell Camping Accommodation Services
The total available bed spaces of camping sites at Cromwell are 2,826 bed spaces in-
cluding 1,728 (61.1%) in powered sites and 1,098 in non-powered sites (Table 6.87).
This section uses these proportions to divide the total 2,291 camping visitor nights into
1,400 (61.1%) that use powered sites in Cromwell and 891 (38.9%) that stay at non-
powered sites (Table 87).
Table 6.87: Cromwell camping sites – available bed spaces and visitor nights
Type No. Available bed spaces1 % Visitor nights Powered sites 288 1,728 61.1 1,400 Non- powered
sites 183 1,098 38.9 891
Total 471 2,826 100 2,2912
1. See Table 6.80 2. See Table 6.83
As explained in Table 6.88 the embodied energy of Cromwell camping sites is not
available and this study considers the operational energy use of this type of accommo-
dation to be the same as its life cycle energy use. Table 6.88 indicates that the total EF
of 288 Cromwell powered sites (see Table 6.87) with 1400 visitor nights and 0.025
GJ/visitor night operational energy use is 0.35 gha/year.
Table 6.88: Cromwell - life cycle energy use of camping (powered sites) accommodation services
(2011) Material Embodied
energy over a 50 year life
cycle (GJ/m2)
Total visitor nights
Embodied energy
(GJ/year)
Operation energy (GJ/
visitor night)2
Operating energy
(GJ/year)
Life-cycle energy use (GJ/year)
EF gha/year
Assumed negligible
N/A 14001 N/A 0.025 35 35 0.35
1. See Table 6.87 2. See Table 5.28
Chapter 6: Second and Third Case Studies: Naseby and Cromwell –OCRT, New Zealand
374 | P a g e
a.5. Total EF of Cromwell Accommodation Services (First Scenario)
The total EF of Cromwell accommodation services in the first scenario in which all as-
sociated areas are assumed to be indoor spaces is 8.11gha /year (Table 6.89). As dem-
onstrated in this table, Cromwell B&B accommodation accounts for the largest share of
the EF at 4.29 gha, followed by motel (3.07gha), SC (0.4gha) and camping sites
(0.35gha).
Table 6.89: Cromwell - EF of accommodation services (2011)
Type of accommodation EF (gha/year) SC 0.4 B&B 4.29 Motel 3.07 Camping 0.35 Total 8.11
b. The EF of Cromwell Accommodation Services (Second Scenario)
This section attempts to determine the influence of using open air spaces including ve-
randas and balconies (V/B) on the EF of Cromwell’s accommodation buildings. In this
scenario, the accommodation services contain both indoor and outdoor spaces and their
EFs comprise the EFs of both types of space. The difference between the results of the
first and second scenario indicates the influence of using open air areas on the EF of
Cromwell accommodation services.
Table 6.90 contains summarised information about the numbers and types of V/Bs and
outdoor sitting areas by type of accommodation, which are explained in Appendix 5
(rows-188-200). Table 6.90 shows that 4 Cromwell SC bed spaces have access to 2 pri-
vate V/Bs. Furthermore, as shown in Table 6.90, 14 Cromwell’s motel bed spaces have
access to 2 shared outdoor sitting areas. Since the outdoor sitting areas are considered to
be part of the landscaping, in this thesis their EF is not included
Table 6.90: Cromwell - outdoor sitting space used as part of accommodation services
Type V1/B2 Outdoor sitting S3 NV4 P5 NV S No6 P No
SC 0 0 4 2 11 2 0 0 B&B 0 0 0 0 0 0 96 46 Motel 0 0 14 2 36 1 14 2 1. V: Veranda 2. B: Balcony 3. S: Number of bedrooms sharing outdoor area 4. NV: Number of verandas/ balconies 5. P: Number of bedrooms using private area 6. No: Number of outdoor sitting spaces
Chapter 6: Second and Third Case Studies: Naseby and Cromwell –OCRT, New Zealand
375 | P a g e
Table 6.91 indicates that the embodied energy intensity of 57.2 m2 of Cromwell V/B is
0.7 GJ/year. Since V/Bs are open areas and do not use operational energy, in particular
for heating, their operational energy is assumed to be zero. As a result, the life cycle en-
ergy use of 57.2 m2 V/B is equal to its embodied energy (0.7 GJ/ year) and its EF is 0.7
(life cycle energy use) ÷ 100 (global average carrying capacity of land) = 0.007 gha
(Table 6.91).
Table 6.91: Cromwell accommodation services, life cycle energy and EF of outdoor sitting spaces
(veranda/balcony) Type Embodied
energy (GJ/m2 per year)
Area (m2)1-
2
Embodied energy
(GJ/year)3
Operating energy
Life-cycle energy
(GJ/year)
EF (gha)
Veranda/balcony 0.012 57.2 0.7 0 0.7 0.007 1. Total numbers of verandas/balconies = 4 (see Table 6.91) 2. Average area (m2) of veranda/balcony = 14.3 (Table 5.40) 3. Embodied energy of veranda/ balcony (GJ/m2/year) = 0.012 (Table 5.42)
In Table 6.29, the total 25,178 m2 of Cromwell accommodation services (see Table
6.92) is separated into the two areas of 25,120.8 m2 indoor spaces and 57.2 m2 V/B. The
EF of indoor spaces is 0.00032 gha /m2 (8.11gha ÷ 25,178m2). Thus the EF of 25,120
m2 indoor spaces is 25,121m2× 0.00032 gha/m2 = 8.039 gha (Table 6.92). Likewise the
EF (gha) of 57.2 m2 V/B is equivalent to 0.007 gha (see Table 6.91). As a result the to-
tal EF of 25,178 m2 accommodation services in Cromwell composed of 25,120.8 m2
indoor spaces and 57.2 m2 V/B is the sum of 8.039 and 0.007gha = 8.046 gha (Table
6.92).
As shown in Table 6.89, in the first scenario in which all Cromwell accommodation
services are assumed to be indoor spaces, the total EF (EF1) is 8.11 gha. In the second
scenario where both indoor and outdoor spaces are considered, the total EF (EF2) is
8.046 gha. Thus the 0.064 gha difference between the two EFs (EF1 and EF2) can be
considered the reduction in Cromwell accommodation EF influenced by the use of 57.2
m2 veranda and balcony (Table 6.92). On the other hand, as 0.064 gha (640 m2) ÷ 57.2
m2 = 11.2 m2, it can be considered that using 1m2 of V/B reduces the EF of Cromwell
accommodation by 11.2 m2.
Chapter 6: Second and Third Case Studies: Naseby and Cromwell –OCRT, New Zealand
376 | P a g e
Table 6.92: Reduced EF of Cromwell accommodation services influenced by the use of ve-randa/balcony
Indoor spaces and camping sites Outdoor sitting (Veranda/balcony) Area (m2) EF (gha/m2) EF (gha) Area (m2) EF (gha/m2) EF (gha) 25,120.8 0.00032 8.039 57.2 0.00012 0.007
• Total area of the Cromwell accommodation services (m2) = 25,178 (see Table 6.83). • Total EF of Cromwell accommodation services (first scenario) gha= 8.11 (see Table 6.89) • Total EF of Cromwell accommodation services (indoor space + veranda/balcony) gha = 8.046 • Reduction in EF of Cromwell accommodation by use of 57.2 m2 veranda/balcony (0.2% of 25,178 m2) =
8.11 – 8.039 = 0.064gha = 640 m2 • Reduction in Cromwell EF by use of 1m2 veranda/balcony = 11.2m2
6.2.7. Tourism Products and Activities (Frequency)
This section investigates the environmental impacts of Cromwell visitor activities (as a
part of their social-cultural behaviours) through calculation of their EF. The first step is
to make assumptions about the frequency of activities offered by Cromwell accommo-
dation services to visitors through using the official websites of the OCRT and 12 web-
sites related to Cromwell accommodation services. The activities offered are explained
in Appendix 5 (rows 188-200) and are classified into the two categorises of indoor and
outdoor activities in Appendix 34.
In addition the frequency of the offered activates as shown in Appendix 34 and summa-
rised in Tables 6.94 and 6.95 can be considered as an indicator of the attitude of Crom-
well OCRT participants (in this case accommodation owners) to types of tourism activ-
ity, and consequently to sustainability. Comparison between the EFs of the activities
and their frequency also can indicate from a social-ecological perspective the attitude of
tourists to being sustainable.
6.2.7.1. Local Produce
The frequency of local products offered by the Cromwell’s accommodation services and
the environmental effects of using home prepared foods have been discussed above in
section 6.2.5.2 and demonstrated in Table 6.76.
6.2.7.2. Tourism Activities
The activities offered by Cromwell accommodation services are explained in Appendix
5 (rows 188-200) and classified into indoor and outdoor activates in Appendix 34. The
Chapter 6: Second and Third Case Studies: Naseby and Cromwell –OCRT, New Zealand
377 | P a g e
following section of this chapter investigates the frequency of these offered activities
and their environmental impacts through calculation of their ecological footprints.
a. Indoor Visitor Activities (Frequency)
Table 6.93 presents the frequencies of reading materials as only indoor activity offered
by Cromwell accommodation services to their visitors (Appendices 5 and 34). The table
shows that only 2 of 12 websites related to 492 Cromwell accommodation services offer
an indoor activity to their visitors.
Table 93: Cromwell – indoor activities
Activity F % Reading materials 2 100
b. Cromwell – Outdoor Visitor Activities (Frequency)
This study found 20 types of outdoor activity offered by Cromwell accommodation ser-
vices to visitors in 2011, as shown in Appendices 5, 34 and 35. These are classified into
the 8 types of activities shown in Table 6.94.
Table 6.94: Cromwell - frequency of outdoor activities offered by accommodation services to
visitors Outdoor activity F %1
Water sports 48 38 Walking 6 4.8 Winter sports 15 11.9 Cycling 15 11.9 Motorised sports and activities 6 4.8 Recreational activity 15 11.9 Sports (at playground) 20 15.9 Sports on horseback 1 0.8 Total 126 100
Figure 6.49 and Table 6.94 illustrate that the largest occurrence of an offered activity is
water sports at 48 (38%), followed by sports at a play ground 20 (15.9%), winter sports,
cycling and recreational activities all at 15 (11.9%). Likewise other outdoor activities
including motorised sports and walking have equal frequencies of occurrence of 6 (4.8)
(Figure 6.49 and Table 6.94).
Chapter 6: Second and Third Case Studies: Naseby and Cromwell –OCRT, New Zealand
378 | P a g e
c. Cromwell –Frequency of the Subjects Offered to Visit
As shown in Appendix 5 this chapter looks at subjects to visit offered by Cromwell ac-
commodation services to visitors in 2011. Appendix 35 contains summarised informa-
tion about Cromwell visiting activities and their frequency. Table 6.95 and Figure 6.50
classify the 10 categories of subjects offered to visit cited in Appendices 5 and 35 into
five types: cities and villages, historical sites and buildings, scenery, museum/art gal-
lery, and gardens.
Table 6.95: Cromwell - frequency of subjects to visit offered by accommodation services to visitors (2011)
Subjects F % Cities and villages 17 32.7 Historic sites and buildings 5 9.6 Scenery 4 7.7 Museum/art gallery 1 2 Gardens 25 48 Total 52 100
As illustrated in Figure 6.50 and Table 6.95, gardens are offered the most at 25 (48%)
mentions, followed by cities and villages 17 (32.7%), historic sites and buildings 5
(9.5%), scenery 4 (7.7%), and museum/art gallery 1 (2%).
0.00% 5.00%
10.00% 15.00% 20.00% 25.00% 30.00% 35.00% 40.00%
Perc
enta
ge o
f fre
quen
cy
Figure 6.49: The frequency of outdoor activities offered by Cromwell accommodation services to its visitors
Chapter 6: Second and Third Case Studies: Naseby and Cromwell –OCRT, New Zealand
379 | P a g e
d. Activities per Visitor
This section calculates the number of Cromwell visitors per activity (except visiting old
Cromwell town) through using the percentage split of 160 visitors (Table 5.48) and ap-
plying this to the 2,652 Cromwell visitors in 2011 (Table 6.96).
Table 6.96: Cromwell activities conducted by 2,6521 visitors (2011) Activity % of 2,652 visitors2 Number of Visitors Curling (at Naseby) 36.9 979 Taieri Gorge Railway 46.3 1,228 Gold mining towns 35 928 Sightseeing tours 30.6 812 Old Cromwell town 100 2,652 Wineries 16.9 448 Visiting friends and relatives 15 398 Hayes engineering 8.1 215 Mountain biking at Naseby 2.5 66 Fishing 1.9 50 Golf 1.3 34 Swim at Ophir and Alexandra 0.6 16 Clyde Dam Tour 0.6 16 Golden Progress mine 0.6 16 Walking 0.6 16 Ophir high country farm 0.6 16 Biking 0.6 16 Fruit picking along trail 0.6 16 Total - 7,922 1. See Table 6.67 2. % of 2,652 visitor assumed same as % of 160 visitors cited in Table 5.45 except for visitors to old
Cromwell town. • Reference: CODC, 2011:18
0.00%
10.00%
20.00%
30.00%
40.00%
50.00%
60.00%
Perc
enta
ge o
f fre
quen
cy
Figure 6.50: The frequency of subjects offered by Cromwell accom-modation services to visit (2011)
Chapter 6: Second and Third Case Studies: Naseby and Cromwell –OCRT, New Zealand
380 | P a g e
The assumption is that the visitors who come to Cromwell will go to the old town but
will also do other activities. The number of OCRT visitors who visit Cromwell is al-
ready known (see Table 4.45). Table 6.96 shows that in comparison with other Crom-
well activities, the majority of visitor activities is visiting old Cromwell town (2,652),
followed by Taieri Gorge Railway (1,228), curling at Naseby (979), visiting gold min-
ing towns (928), and sightseeing tours (812). The numbers of Cromwell visitors who do
other types of activity fall between 16 and 448.
6.2.8. EF of Visitor Activities
6.2.8.1. EF of Indoor Activities (Curling at Naseby)
As indicated in Table 6.97, 979, 7.5% of the total 13,000 visitors who went curling at
Naseby stay at Cromwell. Since the total EF of 13,000 visitors is 2.07gha, the EF of
Table 6.97: Cromwell visitors - curling EF (gha) (2011)
Total num-ber of Cromwell visitors
% of Cromwell visitors who play indoor curling at Naseby 1
Total number of Cromwell visi-tors who play curling at Naseby 1
EF of 13,000 visi-tors of curling cen-tre (gha)
EF of 979 Cromwell visitors (7.5 % of 13,000 indoor curling centre visitors) gha2
2,652 36.9 979 2.073 0.16 1. See Table 6.34 2. EF of Cromwell curling (indoor curling) per visitor per 3 hours playing/ year = (0.15 gha ÷ 979 visitors) 0.00016
(gha) 3. See Table 5.56
6.2.8.2. EF of Outdoor Activities
a. EF of Walking
Tables 6.96 and 6.98 show that 16 Cromwell visitors chose walking as a tourist activity.
As shown in Chapter 5 (Table 5.58) the EF of a visitor who walks 3 hours is 0.00005
gha. Thus the EF of 16 Cromwell visitors who walk 3 hours is equivalent to: 0.00005
(gha/visitor) ×16 (number of visitors) = 0.0008 (gha) (Table 6.98).
Table 6.98: Ecological footprint of Cromwell visitors (walking). Number of Cromwell visitors who walk. 161
EF (gha) of Cromwell visitor who walks 3 hours 0.000052
EF of 16 Cromwell visitors who walk 3 hours (gha) 0.0008 1. See Table 6.96 2. See Table 5.58
Chapter 6: Second and Third Case Studies: Naseby and Cromwell –OCRT, New Zealand
381 | P a g e
b. The EF of Golf
Tables 6.96 and 6.99 show 34 Cromwell visitors played golf 2011. Table s.5.60 and
6.37 indicate that the EF of a visitor who plays golf is 0.003 gha/ visitor. Consequently
the EF of the 34 Cromwell visitors playing golf is 34 × 0.003 gha/visitor = 0.102 gha
(Table 6.99).
Table 6.99: Ecological footprint of Cromwell visitors (golf) Number of Cromwell visitors who play golf 341
EF (gha) of Cromwell visitor who plays golf 0.0032
EF of 34 Cromwell visitors who play golf (gha) 0.1 1. See Table 6.96 2. See Table 5.60
c. EF of Mountain Biking
As shown in Tables 6.96 and 6.100, 66 Cromwell visitors went mountain biking in
2011. Tables 5.67 and 6.100 indicate that the EF of a visitor who goes mountain biking
is 0.0009 gha/visitor. As a result the EF of 66 mountain biking Cromwell visitors is 66
× 0.0009 gha/visitor = 0.06 gha (Table 6.100).
Table 6.100: Ecological footprint of Cromwell visitors (mountain biking)
Number of Cromwell visitors who go mountain biking 661
EF (gha) of Cromwell visitors who goes mountain biking 0.00092
EF of 66 Cromwell visitors who go mountain biking (gha) 0.06 1. See Table 6.96 2. See Table 5.67
d. EF of Fishing
In 2011, 50 Cromwell visitors chose fishing as a leisure activity (Tables 6.96 and
6.101). Since the EF of a visitor fishing is 0.0009 gha (see Tables 5.68 and 6.101), the
EF of 50 Cromwell visitors fishing is 0.0009 (gha/visitor) × 50 (visitors) = 0.045 gha
(Table 6.101).
Table 6.101: Ecological footprint of Cromwell visitors (fishing) Number of Cromwell visitors who fish 501
EF (gha) of Cromwell visitors who fish 0.00092
EF of 50 Cromwell visitors fishing (gha) 0.045 1. See Table 6.96 2. See Table 5.68
Chapter 6: Second and Third Case Studies: Naseby and Cromwell –OCRT, New Zealand
382 | P a g e
e. EF of Swimming at Ophir and Alexandra
Tables 6.96 and 6.102 show 16 Cromwell visitors went swimming at Ophir and Alex-
andra in 2011. Tables 5.69 and 6.102 determine that the EF of a visitor who swims is
0.0009 gha. As a result the EF of 16 Cromwell visitors going swimming is 16 × 0.0009
gha/visitor = 0.014 gha (Table 6.102).
Table 6.102: Ecological footprint of Cromwell visitors (swimming) Number of Cromwell visitors who swim 161
EF (gha) of Cromwell visitors swimming 0.00092
EF of 16 Cromwell visitors swimming (gha) 0.014 1. See Table 6.96 2. See Table 5.69
f. EF of Wineries
Tables 6.96 and 6.103 show that 448 people who came to Cromwell visited wineries.
Table s.5.70 and 6.103 determine that the EF of a visitor going to a winery is 0.00006
gha/ visitor. As a result the EF of 448 Cromwell visitors who go to wineries is 448×
0.00006 gha/visitor = 0.027 gha (Table 6.103).
Table 6.103: Ecological footprint of Cromwell visitors (wineries)
Number of Cromwell visitors who visit wineries 4481
EF (gha) of Cromwell visitor to winery 0.000062
EF of 448 Cromwell visitors to wineries (gha) 0.027 1. See Table 6.96 2. See Table 5.70
g. EF of Sightseeing
Tables 6.96 and 6.104 indicate that 812 visitors chose sightseeing as one of their activi-
ties at Cromwell. As explained in Table 5.71 (Chapter 5) the EF of a visitor sightseeing
is 0.0009 gha. Consequently, the EF of 812 Cromwell visitors is 812 x 0.0009
gha/visitor = 0.73 gha (Table 6.104).
Table 6.104: Ecological footprint of Cromwell visitors (sightseeing)
Number of Cromwell visitors sightseeing 8121
EF (gha) of Cromwell visitor sightseeing 0.00092
EF of 812 Cromwell visitors sightseeing (gha) 0.73 1. See Table 6.96 2. See Table 5.71
h. EF of Hayes Engineering
Hayes Engineering heritage was visited by 215 Cromwell visitors as shown in Tables
6.96 and 6.105. Since the EF of a visitor in this case is 0.00006 gha (see Table 5.72) the
Chapter 6: Second and Third Case Studies: Naseby and Cromwell –OCRT, New Zealand
383 | P a g e
EF of the latter visitors is equivalent to 215 (number of visitors) × 0.00006 gha/visitor =
0.013 gha (Table 6.105).
Table 6.105: Ecological footprint of Cromwell visitors (Hayes Engineering)
Number of Cromwell visitors to Hayes Engineering 2151
EF (gha) of a Cromwell visitor to Hayes Engineering 0.000062
EF of 215 Cromwell visitors to Hayes Engineering (gha) 0.013 1. See Table 6.96 2. See Table 5.72
i. EF of Ophir High Country Farm
The total EF of 16 Cromwell visitors who go to Ophir High Country Farm Tour is cal-
culated as for the examples above. As shown in Table 6.106 it is 0.001gha.
Table 6.106: Ecological footprint of Cromwell visitors (Ophir High Country Farm) Number of Cromwell visitors to Ophir High Country Farm 161
EF (gha) of Cromwell visitor to Ophir High Country Farm 0.000062
EF of 16 Cromwell visitors to Ophir High Country Farm (gha) 0.001 1. See Table 6.96 2. See Table 5.73
j. EF of Visitors to Taieri Gorge Railway
Using the same method as before the total EF of 1,228 Cromwell visitors to the Taieri
Gorge Railway is 0.074 gha (Table 6.107).
Table 6.107: Ecological footprint of Cromwell visitors (Taieri) Number of Cromwell visitors to Taieri GR 1,2281
EF (gha) of Cromwell visitor to Taieri GR 0.000062
EF of 1,228 Cromwell visitors to Taieri GR 0.074 1. See Table 6.96 2. See Table 5.74
k. EF of Visitors to Gold Mining Towns
The total EF of 928 Cromwell visitors who visit gold mining towns is 0.06 gha (Table
Hayes engineering 215 8.1 0.00006 0.013 Mountain biking at Naseby
66 2.5 0.0009 0.06
Fishing 50 1.9 0.0009 0.045 Swim at Ophir and Al-exandra
16 0.6 0.0009 0.014
Clyde Dam Tour 16 0.6 0.0009 0.014 Golden progress mine 16 0.6 0.00006 0.001 Ophir high country farm 16 0.6 0.00006 0.001 Biking 16 0.6 0.0009 0.014 Fruit picking along trail 16 0.6 0.00006 0.001
Total 7,922 - - 1.55
0 0.2 0.4 0.6 0.8
1 1.2 1.4 1.6
Gol
f Si
ghts
eein
g C
urlin
g V
isiti
ng fr
eind
s and
…
Taie
ri M
ount
ain
biki
ng a
t …
Gol
d m
inin
g tow
ns
Fish
ing
Old
Cro
mw
ell t
own
Win
eres
s C
lyd
dam
tour
Sw
im a
t Oph
ir Bi
king
H
ayes
eng
inee
ring
Frui
t pic
king
G
olde
n pr
ogre
ss m
inin
g W
alki
ng
gha
EF (gha)
Figure 6.51: Cromwell - EF of visitor activities (2011)
Chapter 6: Second and Third Case Studies: Naseby and Cromwell –OCRT, New Zealand
387 | P a g e
6.2.8.4. Comparison between the EFs of Indoor and Outdoor Activities
Table 6.115 shows that 2,652 Cromwell visitors participated in 7,922 visitor activities.
As a result the average number of activities per visitor is 2.98, so each Cromwell visitor
engages in 2.98 activities proposed by the OCRT.
As shown in Table 6.116 and Figure 6.52, the EF of 979 Cromwell visitors (12.35% of
7,992 visitors activities) who participate in an indoor activity (curling at Naseby) is 0.16
gha and this accounts for 10.3 % of the total EF of Cromwell activities (indoor and out-
door). Furthermore, Table 6.116 and Figure 6.52 indicate that the total EF of 7,013
Cromwell outdoor visitor activities (87.75% of 7,992 Cromwell visitor activities) is
1.39 gha, or 89.7% of the total EF of Cromwell visitor activities (1.55 gha).
Table 6.116: Comparison between EFs of Cromwell visitors indoor and outdoor activities
Indoor activity Outdoor activities Numbers of visitor activities
% of 7,922 Cromwell
visitor activities
EF (gha)
% total EF1
EF (gha/visi
tor)
Numbers of visitor activities
% of total Cromwell
visitor activities
EF (gha)
% total EF1
EF (gha/visitor)
979 12.35 0.16 5.7 0.00016 7,013 87.75 1.39 89.7 0.0004 1. Percentage of the total 2.81gha EF of 7,992Cromwell visitor activities • Total number of Cromwell visitors = 2,652 (see Table 6.67) • Total number of Cromwell visitor activities = 7,992 (see Table 6.51) • Average number of activities per visitor = 7,992 ÷ 2,652 = 2.98
0.00%
10.00%
20.00%
30.00%
40.00%
50.00%
60.00%
70.00%
80.00%
90.00%
100.00%
Indoor activities Outdoor activities
Perc
enta
ge o
f the
toat
l EF
of C
rom
wel
l-vi
sito
rs a
ctiv
ities
EF
Figure 6.52: Comparison between EFs of Cromwell indoor and outdoor activities
Chapter 6: Second and Third Case Studies: Naseby and Cromwell –OCRT, New Zealand
388 | P a g e
This chapter selects curling as an indoor activity and golf as an outdoor activity with the
biggest EF/visitor in their categories to be compared with walking as the outdoor activ-
ity with the smallest EF (Figure 6.53).
Figure 6.54 determines that the majority of 6,893 Cromwell visitor activities are within
the ‘other activity’ category (excluding golfing, curling and walking) followed by curl-
ing (979), golfing (34) and walking (16).
0
0.2
0.4
0.6
0.8
1
1.2
1.4
Other activities
Curling Golf Walking
gha
EF (gha)
0
1,000
2,000
3,000
4,000
5,000
6,000
7,000
8,000
Num
ber o
f vis
itor/a
ctiv
ities
Number of visitors
Figure 6.53: Cromwell - Comparison between EFs of golf, curling, walking, and other activities excluding these three
Figure 6.54: Cromwell - comparison between number of visitor activities for golf, curling, walking, and other activities
Chapter 6: Second and Third Case Studies: Naseby and Cromwell –OCRT, New Zealand
389 | P a g e
Since this study uses the same EF/visitor activity as explained in Chapter 5, comparison
between the EF/visitor of the four categories in Figure 6.39 can be conducted through
using Figure 5.36 (Chapter 5- section 5.7.5.4) with the same results.
6.2.9. The Total EF of Cromwell (2011)
Table 6.117 demonstrates that in 2011 the total EF of Cromwell visitors was 373.8gha.
As shown in Table 6.117 and Figure 6.55 transportation accounts for the largest share of
the total EF at 269.5gha (72.1%), followed by food at 94.71 gha (25.3%), accommoda-
tion services at 8.05 gha (2.2 %) and visitor activities at 1.55 gha (0.4%). In addition,
the transportation EF that forms 72.1% of the total EF of Cromwell can be divided into
51.5% of international transportation and 49.5% domestic transportation (see Table
6.74).
Table 6.117: Total EF of Cromwell (2011)
Category EF (gha) % Transportation 269.51 72.1 Food (second scenario) 94.712 25.3 Accommodation (second scenario) 8.053 2.2 Activities 1.554 0.4 Total 373.8 100 1. See Table 6.74 2. See Table 6.77 3. See Table 6.92 4. See Table 6.115 • Total number of Cromwell visitors (2011) = 2,652 • EF (gha/visitor) of Cromwell = 373.8 (gha) / 2,652 (visitors) = 0.14
Figure 6.55: Comparison between EFs of Cromwell for transportation, food, ac-commodation services, and visitor activities (2011)
Chapter 6: Second and Third Case Studies: Naseby and Cromwell –OCRT, New Zealand
390 | P a g e
6.2.10. Cromwell Overshoot Portion of EF
Table 6.118 compares the present EF of Cromwell per visitor and the target EF
(0.03gha) investigated in Chapter 5- section 5.9.1. As shown in this table the present EF
of Cromwell at 0.14 gha/ visitor (see Table 6.118) is 0.11 gha/ visitor more than the tar-
get EF for sustainable living. Furthermore, the overshoot portion of the total EF of
2,652 Cromwell visitors as shown in Table 6.118 is (2,652 × 0.11) = 291.72gha.
Table 6.118: Overshoot portion of Cromwell visitors EF (gha/visitor/year) (2011)
Now Goal Overshoot EF (gha/visitor/year) 0.141 0.032 0.11
1. See Table 6.117 2. See Chapter 5-section.5.9.1 and Table s.5.85 - 5.86 • Total overshoot EF (gha) of 2,652 Cromwell visitors = 2,652 × 0.11 = 291.72 gha
6.2.11. Overshoot portion as Energy
6.2.11.1. Overshoot Portion of Energy Use per Visitor
This chapter calculates the overshoot portion of Cromwell visitors through using the
method explained in Chapter 5- section 5.9.2. As shown in Table 6.120 the EF of
Cromwell is 0.14 gha/ visitor and as a result energy use is equivalent to:
6.2.12. Economic Footprint of Cromwell Rail Trail Visitors
In 2011, the total GDP of the OCRT was NZ$6,245,289 (see Table 5.90) and GDP per
visitor was NZ$530 (NZ$6,245,289 ÷ 11,788 OCRT visitors) (Table 6.122). This study
uses this visitor GDP figure to calculate the GDP of Cromwell visitors in 2011. Table
6.122 determines that the total GDP of Cromwell rail trail visitors is NZ$530
(GDP/visitor) × 2,652 (total number of Cromwell visitors) = NZ$1,405,560
Table 6.122: Cromwell GDP (2011) OCRT total GDP ( NZ$)
OCRT number of visitors
OCRT GDP (NZ$/visitor)
Cromwell number of visitors
Cromwell total GDP (NZ$)3
6,245,2891 11,7882 530 2,652 1,405,560 4. See Table 5.90 5. See Figure 5.2 6. 2,652 × NZ$530/visitor = NZ$1,405,560
The following table shows that the total overshoot energy of Cromwell visitors is
29,172 GJ/year. Since the cost to generate 1 GJ through using renewable resources is
NZ$19.8 (see Table 5.94), then the total cost that must be paid to generate 29,172
GJ/year is NZ$577,605.6 (29,172 × NZ$19.8) (Table 6.123). This means the sustainable
Chapter 6: Second and Third Case Studies: Naseby and Cromwell –OCRT, New Zealand
392 | P a g e
portion of Cromwell GDP is NZ$1,405,560 (GDP) – NZ$ 577,605.6 = NZ$827,954.4 =
58.9% of total Cromwell GDP (Table 6.123 and Figure 6.56).
On the other hand the GDPs of Cromwell, as an ecological-economic indicator, shows
that 41.1% (100%-58.9%) of Cromwell GDP must be paid to restore its environmental
impacts to being ecologically sustainable. Furthermore, GDPs as a social-economic in-
dicator evaluates the contribution of the Rail Trail to local economic development,
through engagement of local participants and organizations (in this case accommodation
services) in the development process.
Table 6.123: Cromwell sustainable portion of GDP (GDPs) Total Cromwell GDP (NZ$) 1,405,5601
Overshoot energy use (GJ/year) 29,1722
Energy cost (NZ$/GJ) wind-solar 19.83
Total cost (NZ$) to generate overshoot portion of Cromwell energy by wind-solar systems
577,605.6
GDPs (NZ$)1 827,954.4 1. See Table 6.122 2. See Table 6.121 3. See Table 5.94 • GDPs = Total GDP - Total cost to generate the overshoot portion of energy use through renewable re-
sources (see Chapter 5- section.5.10.2).
0
0.5
1
1.5
2
2.5
3
Cromwell-economic impact
Mill
ion
NZ$
GDP
GDPs
Figure 6.56: Cromwell - comparison between GDP and GDPs
Chapter 6: Second and Third Case Studies: Naseby and Cromwell –OCRT, New Zealand
393 | P a g e
6.2.13. Cromwell Cultural Footprint (CF)
This section uses the CF model explained in Chapter 4 to explore the cultural footprint
of the OCRT on Cromwell as one of its host destinations. In this case study the CF of
the Rail Trail in Cromwell is categorised into the three areas of food, accommodation
and visitor activities and, as explained in Chapter 5, the CF of transportation is not in-
cluded in this research.
6.2.13.1. Cromwell CF –Food
Table 6.124 contains the summarised results of two proposed scenarios for Cromwell
food (sections 6.2.5.1 and 6.2.5.2). As shown in Table 6.124, the total conventional
eaten out food in the first scenario is 17,662kg (100% of food consumed) and in the
second scenario it is 17,662 made up of 17,222kg (97.5%) conventional food and 435
kg (2.5%) home prepared (organic food). As a result, the total EF of Cromwell food in
the first scenario is 95. 47 gha/year and in the second scenario this reduces to 94.71
gha/year (Table 6.124).
Table 6.124 indicates that in the second scenario the overshoot portion of the energy
value of the food consumed is equivalent to 7,380.5 GJ/year. Since the EF of food in the
first scenario (EF1) is 0.76 gha larger than that of the second scenario (EF2), the over-
shoot energy value of food consumed in the first scenario is 76 GJ (0.76 gha × 100 –
global average carrying capacity of land). This is bigger than the overshoot portion of
the energy value of food in the second scenario (7,380.5 GJ/year). Consequently the
overshoot energy value of food in the first scenario is 7,380.5 GJ + 76 GJ = 7,456.5
GJ/year (Table 6.124).
In this section, the overshoot portions of EF1 of 74.56 gha (see Table 6.124) and EF2 of
73.80 gha (see Table 6.124) is calculated using the method explained in Chapter 5- sec-
tion.5.11.1. As the cost to generate 1GJ energy using wind-solar systems is NZ$19.8,
the cost to generate 7,456.5 GJ/year (overshoot portion of energy value of food in the
first scenario) is 7,456.5 GJ × NZ$19.8 = NZ$147,638.7 (see Table 6.124). Likewise
the total cost to generate the overshoot energy using wind-solar systems in the second
scenario is NZ$19.8× 7,380.5 /year = NZ$146,133.9 (Table 6.124).
Chapter 6: Second and Third Case Studies: Naseby and Cromwell –OCRT, New Zealand
394 | P a g e
The total GDP of Cromwell food is calculated using the GDP/kg food of OCRT multi-
plied by total Cromwell food consumed (kg). As the total GDP for food related to the
OCRT is NZ$782,795 (see Table 5.91) and total produced/consumed food is 78,508.45
kg, the GDP of food related to OCRT per kilogram is equal NZ$782,795 ÷78,508.45 kg
= 9.97 ~ NZ$10/kg.
In Cromwell the total amount food consumed is 17,662 kg (see Table 6.125). As a result
the GDP of Cromwell food is equivalent to 17,662 (kg) × NZ$10/kg of food =
NZ$176,620 (Table 6.124). Table 6.124 shows the GDP associated with food for both
The difference between GDPs1 and GDPs2 shows the NZ$1,505contribution to GDPs
from producing 435 kg home prepared (organic) food by Cromwell accommodation ser-
vices. In addition, it can be considered that producing 1kg home prepared (organic) food
contributes NZ$3.46 to GDPs (Table 6.124).
Table 6.124: Cromwell - local product (food) contribution to GDPs
First scenario (100% conventional food) Second scenario (97.5% conventional food and 2.5% home prepared (organic) food
Total conventional eaten out food (kg)
17,6621 Total conventional eaten out food (kg)
17,2221
Total home prepared food (kg)
0.00 Total home prepared food (kg)
4351
Total EF of consumed food gha/year – (EF1)
95.471 Total EF of consumed food gha – (EF2)
94.711
Overshoot portion of energy related to food (GJ/year)
7,456.5 Overshoot portion of energy related to food (GJ/year)
7,380.52
Overshoot portion of EF1 (gha/year)
74.56 Overshoot portion of EF2 (gha/year)
73.80
Cost to generate 1GJ energy using wind-solar systems (NZ$)
19.8 Cost to generate 1GJ energy using wind-solar systems (NZ$)
19.8
Total cost to generate over-shoot energy using wind-solar systems (NZ$)
147,638.7 Total cost to generate over-shoot energy using wind-solar systems (NZ$)
146,133.9
Total food GDP (NZ$) 176,620 Total food GDP (NZ$) 176,620 Total food GDPs1 28,981 Total food GDPs2 30,486 1. See Table 6.78 2. See Table 6.121 • Increased portion of GDPs influenced by using 435 kg home prepared food = NZ$1,505= NZ$3.46/kg
Chapter 6: Second and Third Case Studies: Naseby and Cromwell –OCRT, New Zealand
395 | P a g e
a. Ideal Sustainable Life Model: Food
Table 6.124 shows that the present EF2 of Cromwell food (second scenario) is 94.71
gha and the overshoot portion of EF2 is 73.80 gha. As a result the sustainable EF of
Cromwell food can be determined through the following equation:
In the ideal model for Cromwell tourist related food, since the overshoot portion of en-
ergy use is zero, the GDPs is equal to the total GDP of Cromwell food (NZ$176,620,
see Table 6.124).This section uses the ideal model of Cromwell food and compares it
with the two scenarios shown in Table 6.124.
In Figure 6.57, the area of ‘Q1, EF1, and GDPs1’ illustrates ordinary life; this is the
area in which all Cromwell visitors consume 100% (17,662 kg) conventional eaten out
food (first scenario). In this area, development of the Rail Trail (OCRT) does not exert
any influence on Cromwell (as one of the host destinations) and its visitors to produce
and consume local foods. In Figure 6.57 the EF of using 100% conventional food (EF1)
is 95.47 gha/year and this represents the total food EF. In the ordinary life area, GDPs1
is equal to NZ$ 28,981 (see Table 6.124).
Comparison between the first scenario and the ideal model of Cromwell food consump-
tion indicates that in the first scenario EF1 (95.47 gha) is 78.09 % (74.56 gha) bigger
than the ideal EF (20.91gha) (Figure 6.57 and Table 6.124). As shown in Figure 6.57, in
the first scenario, GDPs1 is equal to 16.4 % of the total GDP of Cromwell food. On the
other hand, 83.6% (100 – 16.4%) of total GDP related to food must be spent to change
EF1 to the ideal EF through generating the overshoot portion of food energy by using
wind-solar systems.
In Figure 6.42, the area of ‘Q2, EF2, and GDPs2’ determines the CF area of Cromwell
for producing and consuming home prepared (organic) foods. As demonstrated in Fig-
ure 6.57 total Q2 in the CF for food consumed by Cromwell visitors (17,662 kg) is di-
vided into the two portions of 2.5% (435kg) home prepared food (Q3) and 97.5%
(17,222kg) conventional eaten out food (Q 4). The EF in the CF (EF2) contains the EF
of using 2.5% (435kg) home cooked and 97.5% (17,222 kg) conventional eaten out
foods. The GDPs2 in the CF is equal to NZ$30,486 which is NZ$1,505 (.085% of the
total GDP) more than GDPs1 (NZ$ 28,981) (Table 6.124).
Chapter 6: Second and Third Case Studies: Naseby and Cromwell –OCRT, New Zealand
396 | P a g e
Figure 6.57 and Table 6.124 indicate that using 2.5% home prepared (organic) food re-
duces total Cromwell food EF by 0.79% (shown in Figure 6.57 as R-EF1). As demon-
strated in this figure, producing 2.5% local food increases GDPs1 by 0.85%, shown in
the figure as (I) GDPs 1.
Comparison between the ideal model and present pattern of Cromwell food consump-
tion demonstrates that EF2 (94.7 gha) is 73.79 gha (77.3 % of EF1 as benchmark) more
than ideal EF (20.91gha), and 83.6 % (NZ$147,638.7) of the GDP (NZ$176,620) of
food must be spent to reduce this overshoot portion of EF2 to the ideal EF (Table 6.124
and Figure 6.57).
- Q: 100% food in Ideal model - Q1: 100% conventional eaten out food – first scenario - Q2: 97.5% conventional eaten out food + 2.5% home prepared food – second scenario - Q3: 2.5% home prepared food (second scenario) - Q.4: 97.5% conventional eaten out food (second scenario) - GDPs1: sustainable portion of GDP – first scenario - GDPs2: sustainable portion of GDP – second scenario - (I) GDPs1: Increased portion of GDPs1 - EF1: ecological footprint of consumed food – first scenario - EF2: ecological footprint of consumed food – second scenario - R- EF1: reduced portion of total EF1 of consumed food
80%
60%
40%
100% Q2
Q
Q1
Q3
0.00% 2.5 %
Figure 6.57: The cultural footprint (CF) of Cromwell visitor food
Ordinary life area - first scenario
Ideal model - Food
Second scenario –Present Cromwell food
Q 4
GDP Food (100%)
Food Ideal EF (20.91%)
R- EF1 (0.8%)
EF1 (100%)
GDPs1 (16.4%)
GDPs2 (17.2%)
(I) GDPs1= 0.8 %
EF2 (99.2%)
Chapter 6: Second and Third Case Studies: Naseby and Cromwell –OCRT, New Zealand
397 | P a g e
6.2.13.2. The CF of Cromwell Accommodation Services
This section explores the CF of 492 Cromwell accommodation services (all NB)
through using two scenarios contain different quantities, EFs and GDPs of the accom-
modation services used. In the first scenario, all buildings are assumed not to have open
air areas (veranda/balcony). In the second scenario 57.2 m2 (0.2%) of a total area of
25178m2 accommodation services area is outdoor sitting space (V/B) (Table 6.91).
Table 6.125 shows that in the first scenario the total EF of using 100% buildings as ac-
commodation services is 8.11 gha. In this Chapter, the GDP of Cromwell’s accommo-
dation services with its total 9,547 visitor nights is calculated using the same method
explained in section 6.1.13.2.
Since the overshoot portion of energy use in the second scenario has already been calcu-
lated as 627.2 GJ (see Tables 6.125 and 6.121), it is used here as a base to calculate the
overshoot energy of the first scenario through the method explained in Chapter 5-
section-5.11.2. Table 6.125 shows that the overshoot portions of energy for accommo-
dation services in the first and the second scenarios are 633.6 GJ and 627.2 GJ respec-
tively.
Table 6.125 contains the total costs to generate the overshoot energy related to each of
the two scenarios. These costs are calculated through using the method explained in
Chapter 5-section.5.11.2. As shown in Table 6.125, the costs to generate the overshoot
energy of the first and second scenarios in an environmentally sustainable way are
NZ$12,545, and NZ$12,418.56 respectively.
In this section, the GDPs of the two scenarios cited in Table 6.125 are calculated based
on the method used in Chapter 5-section.5.11.2 for the GDPs of OCRT accommodation
services. Table 6.125 determines that the GDPs of the second scenario (GDPs2) is the
larger at NZ$1,625,893 compared to NZ$625,893.86 (GDPs1).
Chapter 6: Second and Third Case Studies: Naseby and Cromwell –OCRT, New Zealand
398 | P a g e
Table 6.125: Cromwell accommodation services - CF (2011) First scenario Second scenario
All Cromwell accommodation assumed as indoor area
Accommodation areas contain V/B
Total number of accommodation services
4921 Total number of accommoda-tion services
4921
Accommodation area (indoor spaces) (m2)
25,1781 Accommodation area (indoor spaces)
25,120.81
Accommodation area (V/B) (m2) 0.00 Accommodation area (V/B) 57.2 2
Total EF (EF1) (gha) 8.112 Total EF (EF2) (gha) 8.0463
GDP (NZ$) 638,312.424 GDP (NZ$) 638,312.424
Overshoot energy use (GJ/year) 633.6 Overshoot energy use (GJ/year) 627.25
Cost to generate 1 GJ energy using wind-solar systems (NZ$)
19.86 Cost to generate 1 GJ energy using wind-solar systems (NZ$)
19.86
Cost to generate 625.8 GJ energy using wind-solar systems (NZ$)
12,545.28 Cost to generate 575.8 GJ en-ergy using wind-solar systems (NZ$)
12,418.56
GDPs1 625,767.14 GDPs2 625,893.86 1. See Table 6.83 2. See Table 6.89 3. See Table 6.92 4. See Table 5.37 5. See Table 6.121 6. See Table 5.94
a. Sustainable Living Cromwell Accommodation Services (Ideal Model)
This section determines an ideal model for Cromwell accommodation services in which
its EF is considered environmentally sustainable and its GDPs is equal to the total GDP
of Cromwell accommodation services. This model is then used to compare each of the
two scenarios for Cromwell accommodation services (cited in Table 6.125) with an en-
vironmentally and economically sustainable pattern of accommodation.
a. 1. Sustainable EF
As shown in Table 6.125 the total overshoot energy of Cromwell accommodation ser-
vices at present is 627.2 GJ/year. As a result the overshoot portion of its EF is
627.2/100= 6.27 gha. As indicated in Table 6.125, the present EF of Cromwell is 8.046
gha (EF2). Consequently the environmentally sustainable EF can be considered as 8.046
gha – 6.27 = 1.79 gha.
a. 2. Sustainable Living: GDPs
As explained in section 6.1.13.2, a.2, the GDPs of Cromwell accommodation in sustain-
able living is equal with its total GDP.
Chapter 6: Second and Third Case Studies: Naseby and Cromwell –OCRT, New Zealand
399 | P a g e
b. Comparison between the Ideal Model, First and Second Scenarios
Figure 6.58 comprises the quantities, EFs and GDPs(s) of Cromwell accommodation
services arising from the Ideal model, first, and second scenarios discussed above. This
figure makes this an opportunity to explore the ecological and economic influences ex-
erted by using 57.2 m2 (0.2% of the total 25,178 m2, see Table 6.125) of accommoda-
tion area as open air areas (V/B).
As shown in Figure 6.58, in the Ideal model of accommodation services, Q is the 100%
Cromwell accommodation services area (25,178 m2) with an EF of 1.79 gha and GDPs
of NZ$638,312.42 (equal to total accommodation GDP). In the ideal model as discussed
above, the overshoot portion of the EF and energy use are zero. In first scenario, Q1 is
the total area of Cromwell accommodation services (25,178 m2) where 100% of ac-
commodation buildings are assumed to be indoor spaces (Figure 6.58). In the second
scenario as illustrated in Figure 6.58, Q2 represents the Cromwell accommodation area
(25,178 m2) divided into two portions of 99.8% (25,120.8 m2, see Table 6.126) indoor
spaces and 0.2% (57.2 m2, see Table 6.125) V/B.
In Figure 6.58, EF1 is the biggest EF in comparison with the EFs of the other scenarios
and is here considered to be the 100% benchmark. Likewise, in this figure, EF2 and
Ideal-EF are compared with EF1 as the 100% benchmark.
As shown in Figure 6.58, in the ideal model of Cromwell accommodation services, the
acceptable EF of these services is 22.07% of EF1 (8.11gha, see Table 6.125). On the
other hand, in the first scenario in which all buildings are assumed as indoor space, the
EF (EF1 = 8.11gha) is 77.93% (6.32 gha) larger than the sustainable EF (1.79 gha)
(Figure 6.58).
As illustrated in Figure 6.58, the EF of Cromwell accommodation services in the second
scenario (EF2 = 8.046 gha, see Table 6.126) is 99.2% of EF1 (8.11gha, see Table
6.125). Consequently (R) EF1 is equal to 0.8% of EF1= 0.065 gha (Figure 6.58).
GDPs1 (GDPs of the first scenario = NZ$625,767.14) is equal to 98.03% of total GDP
of Cromwell accommodation services (NZ$638,312.42) (Figure 6.58). On the other
hand, in the first scenario 1.97% (NZ$12,545.28) of the total GDP of Cromwell ac-
Chapter 6: Second and Third Case Studies: Naseby and Cromwell –OCRT, New Zealand
400 | P a g e
commodation services must be spent to generate the overshoot portion of accommoda-
tion energy use through wind-solar systems to change EF1 to the ideal EF.
As shown in Figure 6.58, GDPs 2 (NZ$625,893.86, the GDPs of the second scenario) is
98.05% of the total GDP of Cromwell accommodation (NZ$638,312.42) and 1.95%
(NZ$12,418.56) of the total GDP of Cromwell accommodation services must be spent
to generate the overshoot portion of associated energy use through using wind-solar sys-
tems to reduce EF2 to the ideal EF. Likewise, as determined in Figure 6.43, (I) GDPs1
is equal to 0.02% of the total GDP of Cromwell accommodation services. This means
using V/B (open air areas) as 0.2% of accommodation area contributes to an increase of
0.02% in GDPs1.
Q: (100%) area of 492 Cromwell accommodation services (25,178m2) – Ideal model GDP: GDP of Cromwell accommodation services NZ$1,638,312.42 (see Table 6.126) GDPs: Total sustainable portion of Cromwell accommodation services – Ideal model Q1: Total (100%) area of Cromwell accommodation services (25,178m2) – all buildings area assumed as indoor spaces (first scenario) EF1: Total EF of Cromwell accommodation services (first scenario) (R) EF1: Reduced portion of Cromwell EF1 influenced by using V/B as part of buildings GDPs1: Total GDPs of Cromwell accommodation services (first scenario) (I) GDPs1: Increased portion of GDPs1 influenced by using V/B as part of buildings Q2: Area Cromwell accommodation services (25,178m2) including; 99.08% (25,120.8 m2) indoor spaces and 0.2% (57.1m2) V/B (second scenario) Q3: 99.08% (25,120.8m2) total indoor area of 492 Cromwell accommodation services (second scenario)
20%
40%
60%
V/B 0.00%
0.2 %
Q
Q2
Q1
80%
100%
Figure 6.58: The CF of Cromwell accommodation services with V/B as part of the used spaces
Ideal- EF (22.07% of EF1)
Q 4
Q3
EF1(100%) EF2 (99.2% of EF1)
R- EF1 (0.8%)
Ideal Model
First scenario
Second scenario
GDPs2 (98.05 % GDP)
GDPs1 (98.03% GDP)
GDPs = 100% GDP
(I) GDPs1(0.5%)
Chapter 6: Second and Third Case Studies: Naseby and Cromwell –OCRT, New Zealand
401 | P a g e
Q 4 (V/B area): 0.2% (57.2m2) of total Cromwell accommodation area (second scenario) EF2: EF of 25,178m2 Cromwell accommodation services (Q2) including EFs of Q3 and Q 4 (present EF) (R) EF1: Reduced portion of Cromwell EF1 influenced by using V/B GDPs2: Total GDPs of Cromwell accommodation services (second scenario)
6.2.13.3. The CF of Cromwell Visitor Activities
a. Overshoot EF of Cromwell Visitor Activities
As shown in Table 6.126, the category of other activities accounts for the largest portion
at 83.2 % (1.29 gha) of the total EF of Cromwell visitor activities (1.55 gha) followed
by curling (10.3 %), golf (6.45%) and walking (0.05%). Table 6.126 shows that the
total overshoot portion of the EF of Cromwell activities is 1.167 gha (see also Table
6.121). The overshoot portion of the EFs of the four activity groups above are calcu-
lated through using same method explained in section 6.1.13.3- a. As shown in Table
6.126, in comparison with other categories the category of other activities has the larg-
est overshoot EF of 0.97 GJ, followed by 0.12 GJ curling, golf 0.075 and 0.0006 GJ
walking.
b. Cromwell Activities GDP
The GDP of Cromwell activities are calculated through using the method explained in
section 6.1.13.3- b. Table 6.126 demonstrates that of the NZ$450,603 GDP of Crom-
well activities (7,922 visitor activities × NZ$56.88 GDP/visitor activity), the largest
portion of NZ$392,074 is the GDP of other visitor activities, followed by NZ$55,686
(curling), NZ$ 1,934 (golf) and NZ$910 walking.
c. Cromwell Activities GDPs
Table 6.126 comprises the overshoot EFs of the four categories of curling, golf, walking
and other activities that are calculated though using the equation explained in sec-
tion6.1.13.3- b.
In Table 6.126, the overshoot energy use of each category is calculated as its overshoot
EF multiplied by 100 GJ/gha (global average carrying capacity of land). Also as shown,
other activities has the largest overshoot of 97 GJ, followed by curling (12GJ), golf
(7.5) and walking (0.06GJ ).
This section calculates the cost to generate the overshoot portion of the energy of each
category of Cromwell activities through using the method explained in Chapter 5- sec-
tion 5.10.2.
Chapter 6: Second and Third Case Studies: Naseby and Cromwell –OCRT, New Zealand
402 | P a g e
Table 6.126 contains the total cost that must be paid to generate the overshoot energy of
each type of Cromwell activity through using wind-solar systems. As presented in Table
6.126, other activities (excepted curling, golf and walking) has the largest cost of
NZ$1,921 and walking the minimum cost ($NZ1~ 0.00) to generate the overshoot en-
ergy in a sustainable way. The total cost of Cromwell activities overshoot energy as
shown in Table 6.126 is $NZ 2,309.
The GDPs of each category of Cromwell visitor activities (GDP – cost of overshoot en-
ergy used) are set out in Table 6.126. As determined in Table 6.126 other activities has
the largest GDPs of NZ$390,153 and the GDPs of other categories including curling,
golf and walking are in a range of NZ$909 – NZ$55,448. In addition, the total GDPs of
Cromwell’s visitor activities is NZ$448, 296, equivalent to 99.48 % of its total GDP
($NZ450, 603) (Table 6.126).
Table 6.126: Cromwell visitor activities - EF and GDPs
Other 6,893 1.29 83.2 0.97 97 392,074 1,921 390,153 Total 7,922 1.55 100 1.167 3 116.7 450,603 2,309 448,296
1. See Figure 5.34 and Table 5.82 2. Total overshoot energy use of activities = 116.7 GJ/year (see Table 6.121) • Average GDP of OCRT visitor activity = Total GDP of OCRT activities/visitor activity = 1483,180 ÷ 26,077 =
NZ$56.88 (see Chapter 5: Table 5.98)
d. CF: Ideal Model for Sustainable Activities and the Three Scenarios
This chapter proposes three scenarios for the CF of Cromwell visitor activities (illus-
trated in Figure 6.59) and compares the areas generated with each other and the sustain-
able area (Ideal model) of these activities (shown as the green area in Figure 6.59).
d.1. Cromwell Visitor Activities (Ideal model)
As shown in Table 6.126, the present EF of Cromwell visitor activities is 1.55 gha and
its overshoot EF is 1.167 gha. The EF of the Ideal model for Cromwell visitors activities
(zero overshoot EF) is 1.55gha – 1.167 gha = 0.38gha. This means the ecologically sus-
tainable EF of Cromwell visitors activities (0.38 gha) is 24.5% of its present EF (EF1=
1.55gha).
Chapter 6: Second and Third Case Studies: Naseby and Cromwell –OCRT, New Zealand
403 | P a g e
In addition, in the sustainable area of Cromwell visitors’ activities, as the cost of over-
shoot energy is zero, its GDPs is equal to 100% of the GDP of Cromwell visitor activi-
ties ($NZ450,603, see Table 6.126).
d.2. Cromwell Visitor Activities (First Scenario)
The present CF of Cromwell visitor activities is the same as the first scenario shown in
Figure 6.59. In the first scenario the total number of visitor activities (7,922) comprises
6,893 visitors doing other activities, 979 visitors curling, 34 visitors playing golf, and 16
visitors walking (see Table 6.127).
The total EF of Cromwell visitors activities (EF1) in the first scenario is 1.55 gha (see
Table 6.126) and this is used as the 100% benchmark when comparing this with the
second scenario and the Ideal model (see Figure 6.59). As shown in Figure 6.59 and
Table 6.126 in the first scenario GDPs1 (present situation, Table 6.126) is equal to
99.48 % (NZ$448,296) of the total GDP of Cromwell visitor activities (NZ$ 450,603).
Other 6,893 0.00025 1.29 Other 6,893 0.00025 1.29 Total 7,922 - 1.55 Total 7,922 - 1.34
1. See Table 5.58 2. See Table 6.35 3. See Table 5.56 4. NV: Number of visitor activities (see Table 6.96)
Chapter 6: Second and Third Case Studies: Naseby and Cromwell –OCRT, New Zealand
406 | P a g e
- Q: 100% of Cromwell visitor activities in Ideal model - Q1: 100% of Cromwell visitor activities first scenario (present) - Q2: 100% of Cromwell visitor activities second scenario (walking instead golfing) - Q3: 100% of Cromwell visitor activities third scenario (walking instead golfing and curling) - EF1: The EF of Cromwell visitor activities first scenario (present EF) - EF2: The EF of Cromwell visitor activities second scenario - EF3: The EF of Cromwell visitor activities third scenario - (R) EF1: Reduced portion of EF1 influenced by changing golf for walking - (R) EF2: Reduced portion of EF2 influenced by changing golfing and curling for walking - GDP: The GDP of Cromwell visitor activities - GDPs: The GDPs of Ideal model for visitor activities = GDP - GDPs1: The GDPs of Cromwell visitor activities first scenario - GDPs2: The GDPs of Cromwell visitor activities second scenario - GDPs3: The GDPs of Cromwell visitor activities third scenario - GDPs2: Increased portion of GDPs2 (compared with GDPs1) influenced by walking instead
golfing - GDPs3: Increased portion of GDPs3 (compared with GDPs2) influenced by walking instead
golfing and curling.
6.2.14. Comparison between the CFs of Naseby and Cromwell
6.2.14.1. Food
Figure 6.60 compares the CFs of food consumed in Naseby and Cromwell by their visi-
tors. In this figure the quantities of food consumed in Naseby (30,936kg) in both Ideal
(Q) and present (Q1) models are used as the 100% benchmark of food to compare the
Ideal and present model of Cromwell with Naseby (see Figure 6.60).
100%
0.00%
Figure 6.59: The CF of Cromwell visitor activities
Chapter 6: Second and Third Case Studies: Naseby and Cromwell –OCRT, New Zealand
407 | P a g e
In Figure 6.60, the present ecological footprint of food in Naseby (160.9gha) shown in
the figure as EF-Na is used as the 100% benchmark for comparison between the present
EFs of food in Naseby and Cromwell. In addition in Figure 6.60 the Ideal EFs of
Cromwell and Naseby are compared with EF-Na as the 100% benchmark.
In Figure 6.60, the total GDP of Naseby (NZ$309,360) is used as the 100% benchmark
for comparison of the economic footprints of food in Naseby and Cromwell. In 2011, in
Naseby 30,936kg (100%) and in Cromwell 17,662kg (57.09% compared with Naseby)
of food was consumed by visitors. Figure 6.60 indicates that 11.8% (3,650kg) of food in
Naseby and 1.4% (435kg) of the total 17,662kg (57.09% compared with Q1) in Crom-
well were home prepared food.
Figure 6.60 demonstrates that the total EF of food consumed by Cromwell visitors
(94.71gha) is 58.86% of the EF of food consumed by Naseby visitors (160.9gha as
100%). On the other hand the EF of food consumed by Cromwell visitors (94.71gha) is
66.19gha (160.9 – 94.71gha) smaller than the EF of Naseby food (160.9gha).
Furthermore as shown in Figure 6.60 the ideal EF of 30,936kg food consumed by
Naseby visitors (30.61 gha) is 9.7gha (30.61– 20.91 gha) bigger than the ideal EF of
17,662 kg food consumed by Cromwell visitors (20.91 gha). In Figure 6.60, the over
shoot portion of the EF of food in Naseby is 160.9gha (EF of Naseby) – 30.61 gha
(Ideal EF of Naseby) = 130.29gha. In addition, the overshoot portion of the consumed
food in Cromwell is 73.8gha (94.71 – 20.91gha). Consequently, the overshoot portion
of the EF of food consumed in Naseby is 56.49 gha (130.29 – 73.8gha) bigger than the
overshoot portion of the EF of food consumed in Cromwell.
The total GDP of Naseby related to consumed food (NZ$309,360) as shown in Figure
6.60 is 42.91% (309,360 – 176,620 = NZ$132,740) more than total GDP of Cromwell’s
visitor food. Furthermore the GDPs of the visitor food in Naseby (16.6% of its GDP-
See Figure 6.60) is NZ$20,900 (51,386 – 30,486) more than the GDPs of the food con-
sumed in Cromwell.
As a conclusion for this section, it can be determined that if in Naseby the overshoot
portion of its EF related to food is to be changed to its ideal EF through using a portion
of its GDP, it has more GDPs than Cromwell. In addition, since Naseby takes the op-
Chapter 6: Second and Third Case Studies: Naseby and Cromwell –OCRT, New Zealand
408 | P a g e
portunity for those engaged in OCRT accommodation services to produce 10.4%
(3,215kg) more home prepared food as a part of their cultural products, it can be said
the CF of Naseby related to food is bigger than the CF of food in Cromwell. Likewise
as shown in Table s 6.12 and 6.78, in both Naseby and Cromwell case studies, produc-
ing home prepared food that in this thesis is considered as a cultural indicator, contrib-
utes to reducing the EF of consumed food by 0.0017gha/kg. This means producing
home prepared food is not only culturally appropriate but is also more environmentally
sustainable than providing conventional food.
As explored in both case studies consuming home prepared food contributes to reducing
the EF of food, consequently it contributes to increasing the sustainable portion of GDP.
This means producing home prepared food is also more economically viable than pro-
viding conventional foods.
- Q: 100% (30,936kg) food in Naseby - Ideal model - Q1: 100% (30,936kg) food in Naseby including 98.2% (27,286 kg) conventional food + 11.8%
(3650kg) home prepared (organic) food (used as benchmark) - Q2: 100% (17,662kg) food in Cromwell - Ideal model that is equal to 57.9% of Q (30,936kg) - Q3: 100% (17,662kg) food in Cromwell that is equal to 57.9% of Q1 (30,936kg) including 1.4%
(435kg) home prepared food and 56.5% (17,227kg) conventional food - Q 4: 11.8% (3,650kg) home prepared food in Naseby - Q5: 1.4% (435kg) home prepared food in Cromwell (compared with Q1) - GDP (Na): 100% of GDP related to food in Naseby (Used as benchmark)
Figure 6.60: The CF of Naseby and Cromwell related to Food
0.00%
100%
Q Q1
EF- Na (100%)
GDPs2 (Na) = 16.8% = NZ$52,079
Ideal EF (Cr) = 13.08 % = 21.05gha gha
GDPs2 (Cr) = (9.94%) = 30,775.18
GDP (Cr) =57.09% = NZ$ 176,620
GDP (Na) = (100%) = 309,360
Ideal EF (Na) = (19.2%) = 30.96gha
EF2 (Cr) = (58.86%) = 94.71gha
Q 4 (11.8%) – (Naseby)
Q5 (1.4%) – (Cromwell)
Ideal Model -Naseby
Ideal Model-Cromwell
Present CF Area- Naseby
Present CF Area- Cromwell
Q2 (57.09%) - Cromwell
Q3 (57.09%) - Cromwell
Chapter 6: Second and Third Case Studies: Naseby and Cromwell –OCRT, New Zealand
409 | P a g e
- GDP (Cr): 100% of GDP related to food in Cromwell that is equal to 57.09% of GDP (Na) - GDPs2 (Na): GDPs Naseby related to food that is equal with 16.8% (NZ$52,079) of GDP(Na) - GDPs2 (Cr): GDPs of Cromwell related to food that is equal to 9.94% (NZ$30,775.18) of GDP (Na) - EF-Na: Present EF of Naseby related to food (160.9gha) that is used as 100% EF benchmark - EF2 (Cr): 100% (94.71gha) EF of consumed food in Cromwell that is equal to 58.86% of E-Na
(160.9gha) - Ideal EF (Na): Ideal EF of consumed food in Naseby that is equal to 19.2% (30.96gha) of EF-Na - Ideal EF (Cr): Ideal EF of consumed food in Cromwell that is equal to 13.08% (30.96gha) of EF-Na
6.2.14.2. Accommodation Services
Figure 6.61 compares the CFs of accommodation services used in Naseby and Crom-
well in terms of the quantities, qualities, EFs and economic impacts of each. In Figure
6.61 100% (25,178 m2) of the area of Cromwell’s accommodation services is used as a
benchmark to compare the areas of Naseby and Cromwell accommodation services with
each other.
Figure 6.61 shows that total area of Cromwell accommodation services is 25,178 m2
shown in the figure as Q1. In addition in Figure 6.61, Q is the total area of Cromwell
accommodation services (25,178 m2) in its Ideal model that quantitatively is equal to
100% of Q1.
As illustrated in Figure 6.61, the total area of Naseby’s accommodation services in both
its ideal model (Q2) and present (Q3) is 8,144 m2 and this is 32.3% of the total area of
Cromwell accommodation services (Q1= 25,178 m2). Figure 6.61 shows that of the
8,144 m2 of Naseby accommodation, 2,592 m2 (Q 4) is refurbished (RB) buildings, and
this is equal to 10.33% of Q1 (the total area of Cromwell accommodation). As dis-
cussed in section.6.2.13.2, all Cromwell accommodation buildings are new (NB).
Figure 6.61 determines that 0.2% (57.2 m2) of the total (25,178 m2) area of Cromwell
accommodation services (Q6) is open air spaces (V/B) and 100.1m2 (0.4% of Q1) V/B
are used as part of Naseby’s accommodation area. In comparison with Cromwell ac-
In Figure 6.61, 100% of the present EF of Cromwell accommodation services (8.046
gha) is used as a benchmark for comparisons between the EFs of the two case studies.
This benchmark is shown as EF (Cr) in Figure 6.61. The figure shows that the total EF
of 8,144 m2 of Naseby accommodation services (7.012 gha) is equal to 87.1% of the
Chapter 6: Second and Third Case Studies: Naseby and Cromwell –OCRT, New Zealand
410 | P a g e
total EF (8.046 gha) of the 25,178 m2 that make up Cromwell’s accommodation build-
ings.
As shown in Figure 6.61, Ideal-EF (Cr) (the ideal EF of Cromwell accommodation ser-
vices) is 22.24% (1.79gha) of its present EF (8.046gha). On the other hand the over-
shoot portion of EF (Cr) is 6.25 gha (8.046 – 1.79gha). Figure 6.61 indicates that the
Ideal EF of Naseby accommodation services (1.34gha) is 16.65% of EF (Cr). Conse-
quently, the Ideal EF (Na) is 5.75% (22.24% – 16.25%) smaller than Ideal EF (Cr). In-
deed, Ideal EF (Cr) is (1.79 gha – 1.34gha) 0.45gha bigger that ideal EF (Na) (Figure
6.61).
Since the GDP of Naseby related to its accommodation services (NZ$1,118,033) is
more than the GDP of the Cromwell accommodation (NZ$ 638,312.42), as shown in
Figure 6.61, this study uses 100% of the GDP of Naseby (NZ$1,118,033) as a bench-
mark to make a comparison between the economic footprints of accommodation ser-
vices in the two case studies. As shown in Figure 6.61, the total GDP of Cromwell re-
lated to accommodation services (NZ$638,312.42) that is shown in the figure as GDP
(Cr) is 57.1% of GDP (Na). In fact, GDP (Na) is (NZ$1,118,033 – NZ$638,312.42)
NZ$479,720 more than GDP (Cr). Using GDP (Na) as an economic benchmark, the
GDPs of Naseby accommodation services (NZ$1,106,806) is 98.99% of
(NZ$1,118,033) GDP (Na), and the GDPs of Cromwell accommodation services
(NZ$625,893) is 55.98% of this benchmark (NZ$1,118,033). On the other hand, the dif-
ference between GDPs (Na) and GDPs (Cr) is equivalent to 98.99% of GDP (Na) –
55.98% of GDP (Na) = 43.01% of (NZ$1,118,033) GDP (Na) = NZ$480,913. Like-
wise, the GDPs of Naseby accommodation services (NZ$1,106,806) shown as GDPs
(Na) is NZ$480,913 (NZ$1,106,806 – NZ$625,893) more than the GDPs of Cromwell
accommodation services.
Figure 6.61 gives the result that Naseby accommodation services use less area, have a
smaller EF and a larger economic footprint than Cromwell accommodation services. In
comparison with Cromwell, Naseby’s accommodation buildings use more open air
spaces (V/B) and have conserved more old buildings than Cromwell. As a result,
Naseby accommodation services as shown in Figure 6.61 have a larger CF area than
Cromwell accommodation. Likewise, the CF of the OCRT in Naseby in terms of the
accommodation services is larger than its equivalent in Cromwell.
Chapter 6: Second and Third Case Studies: Naseby and Cromwell –OCRT, New Zealand
411 | P a g e
- Cr: Cromwell - Na: Naseby - Q: 100% (25,178m2) of the area of Cromwell accommodation services in ideal model - Q1: 100% (25,178m2) of the area of Cromwell accommodation services (present) used as
benchmark - Q2: 100% (8,144m2) of the area of Naseby accommodation services in ideal model that is equal
to 32.3% of Q1 (benchmark) - Q3: 100% (8,144m2) of the area of Naseby accommodation services (present) that is equal to
32.3% of Q1 (benchmark) - Q 4: 31.8% (2,592m2) of Naseby buildings (RB) that is equal to 10.33% of Q1 (benchmark) - Q5: 6.1% (100.1m2) of Naseby buildings used as V/B that is equal to 0.4% of Q1 (benchmark) - Q6: 0.2% (57.2m2) of Cromwell accommodation services (Q1 = 25,178m2) used as V/B - EF (Cr): 100% (8.046gha) of the present EF of Cromwell accommodation services used as
benchmark - E (Na): 100% present EF of Naseby accommodation services (7.012gha) that is equal to 87.1%
of EF (Cr) - Ideal- EF (Cr): The Ideal EF of Cromwell accommodation services (1.79gha) that is equal to
22.24% of the EF (Cr) - Ideal EF (Na): The Ideal EF of Naseby accommodation services (1.34gha) that is equal to
16.65% of the EF (Cr) - GDP (Na): 100% of Naseby GDP related to accommodation services (NZ$1,118,033) that is
used as benchmark - GDPs (Na): GDPs of Naseby accommodation services (NZ$1,106,806) that is equal to 98.99%
of GDP (Na) - GDP (Cr): 100% of the Cromwell GDP (NZ$638,312) related to accommodation services that is
equal to 57.1% of GDP (Na) - GDPs (Cr): 100% of GDPs of Cromwell (NZ$ 625,893.86) that is equal to 55.98% of GDP (Na)
0.00%
100%
Q 6: (Cr) V/B = 0.2% of Q
Q3: (Na) area = 32.3% of Q1
Ideal- EF (Na) = 16.65% EF (Cr)
100% EF (Cr)
EF (Na) = 87.1% EF (Cr)
Q5: (Na) V/B = 0.4% of Q
Ideal- EF (Cr) = 22.24%) EF (Cr)
Q 4: (Na) RB = 10.33 % of Q
Q2: (Na) area = 32.3% of Q
Figure 6.61: The CFs of Naseby and Cromwell related to accommodation services
Q: 100% of (Cr) accommodation area
(Ideal model)
GDPs (Na) = 98.99% GDP (Na)
100% GDP (Na)
GDPs (Cr) = 55.98% GDP (Na)
GDP (Cr) = 57.1% GDP (Na)
Ideal Model- Cromwell
Present CF - Cromwell
Ideal Model- Naseby
Present CF- Naseby
Q1: 100% of (Cr) accommodation area
(present)
Chapter 6: Second and Third Case Studies: Naseby and Cromwell –OCRT, New Zealand
412 | P a g e
6.2.14.3. Visitor Activities
Figure 6.62 compares the CF areas of Naseby and Cromwell related to their visitor ac-
tivities. In Figure 6.62, Q1 represents 100% of total Naseby visitor activities (13,088 –
see Table 6.53) and this is used as a benchmark and compared with Cromwell visitor
activities. As shown in Figure 6.62, the total number of Cromwell visitor activities
(7,922 – see Table 6.115) is 60.53% of Q1 (13,088 visitor activities). As shown in Fig-
ure 6.62, in both case studies the number of visitors activities at present and in the ideal
model are equal (Q1 = Q and Q2 = Q3).
In Figure 6.62, 100% of the EF and 100% of the GDP of Naseby are used as respective
benchmarks for comparing both case studies with each other. Figure 6.62 illustrates that
100% of the EF of Cromwell related to its visitor activities (1.55gha – see Table 6.115)
is equal to 51.3 % of the total EF of Naseby visitor activities (3.02 gha- see Table 6.53).
As shown in Figure 6.62, the Ideal EFs of Naseby and Cromwell related to their visitor
activities are equal to 15.6 % (0.47gha) and 11.6 % (0.38 gha) of EF (Na) respectively.
As demonstrated in Figure 6.62, the GDP of Cromwell related to its visitor activities
(NZ$450,603 – see Table 6.125) is 60.33% of (NZ$744,446 – see Table 6.64) GDP
(Na). In addition as shown in Figure 6.62, GDPs (Na) and GDPs (Cr) are equal to
99.33% (NZ$739,498 – see Table 6.65) and 60.2 % (NZ$448,296) of GDP (Na) respec-
tively.
Figure 6.62 shows that the visitor numbers, EF, GDP and GDPs related to visitor activi-
ties in Naseby are more than in Cromwell. If the EFs of Naseby and Cromwell related to
visitors activities are to be changed to their ideal EF through using part of their GDP to
generate their overshoot portion of energy used in a sustainable way, then the visitor
activities in both case studies can be considered to be environmentally sustainable ac-
tivities.
However it should be remembered that in both case studies golfing represents the big-
gest EF/ visitor (0.003 gha). Although at present just few people choose golfing as one
of their outdoor activities, its total EF is one of the four top EFs. This indicates that
more development of golfing as a social activity can exert negative environmental im-
pacts on the host destinations and it needs to be ignored in future policy for sustainable
development of OCRT.
Chapter 6: Second and Third Case Studies: Naseby and Cromwell –OCRT, New Zealand
413 | P a g e
As discussed above, curling at Naseby is considered one of the main social-cultural ac-
tivities that has been developed at the regional, national and international scales in this
town, and that attracts many OCRT visitors to it. This makes an opportunity for local
and indigenous people who are engaged with the OCRT to present other social-cultural
products to visitors that in turn can contribute to conservation of their cultural heritage.
However, reducing the EF of indoor curling can be achieved, for example by using
more seasonal outdoor curling and spending a part of GDP to generate curling’s over-
shoot portion of energy use in a sustainable way.
In this chapter Cromwell is introduced as one the main destinations offered by the
OCRT to its visitors. On the other hand like curling in Naseby, visiting old Cromwell
town could be considered as an activity with local potential that could be developed at
regional, national and international scales. Like Naseby, through reducing the EF of
visitor activities at Cromwell it can become a more environmentally friendly host for its
visitors with a rich social cultural heritage and sustainable economic gross domestic
product.
- Q: 100% Naseby visitor activities (Ideal Model) - Q1: 100% Naseby visitor activities (present) used as benchmark - Q2: 100% Cromwell visitor activities (Ideal model) that is equal to 60.53% of Q1 (benchmark) - Q3: 100% Cromwell visitor activities (present) that is equal to 60.53% of Q1 (benchmark) - EF (Na): 100% of the EF of Naseby visitor activities used as benchmark - EF (Cr): 100% of the EF of Cromwell visitor’s activities that is equal to 53.62% of EF (Na)
100%
0.00%
Q2
Q3
100% EF (Na)
GDPs (Cr) = 60.2 % GDP (Na)
GDP (Cr) = 60.33% GDP (Na)
Ideal EF (Cr) = 12.8% EF (Na)
GDPs (Na) = 99.33% GDP (Na)
100% GDP (Na)
Ideal EF (Na) = 15.6 % EF (Na)
EF (Cr) = 51.3% EF (Na)
Ideal Model of Naseby
Present CF area of Naseby
Ideal Model of Cromwell
Present CF area of Cromwell
Figure 6.47: The CFs of Naseby and Cromwell related to visitor activities
Q Q1
Chapter 6: Second and Third Case Studies: Naseby and Cromwell –OCRT, New Zealand
414 | P a g e
- Ideal EF (Na): Ideal EF of Naseby visitor activities that is equal to 19.84% of EF (Na) - Ideal EF (Cr): Ideal EF of Cromwell visitor activities that is equal to 11.8% of EF (Na) - GDP (Na): 100% of the GDP of Naseby related to its visitor activities used as benchmark - GDP (Cr): 100% of the GDP of Cromwell related to its visitor activities that is equal to 60.33%
of GDP (Na) - GDPs (Na): GDPs of Naseby related to its visitor activities that is equal to 99.88% of GDP (Na) - GDPs (Cr): 100% of the GDPs of Cromwell related to its visitor activities that is equal to
59.95% of GDP (Na)
Chapter 6: Summary
Naseby and Cromwell form two case studies with different environmental, cultural and
economic characteristics (see section 3.3.2). Using these case studies allows the thesis
to determine how the ecological, cultural and economic influences of ecotourism and its
architecture on given host destinations can differ from one destination to another. Also
in this chapter the main reasons for these differences are clarified. For example as (see
Figure 6.47) the EF of visitor activities at Cromwell is 51.3% of the EF of visitor activi-
ties at Naseby. One of the main reasons for this difference are the curling clubs at
Naseby (in particular indoor curling) accessed by 4,350 visitors in 2011.
As complementary answers to the research questions answers in Chapter 5, comparison
between the different cultural footprints of the OCRT in these two case studies indicates
that the environmental, social and economic influences of OCRT have different causes.
Therefore sustainable development of the OCRT requires different strategies to reduce
the impacts on its various destinations. On the other hand the framework and model
demonstrate that even though achieving sustainability through ecotourism and its prod-
ucts has global goals, these rely on local and regional strategies for sustainable devel-
opment. For instance the main environmental outcomes for the sustainable development
of ecotourism is conservation of environmental resources, but, in the case of Naseby
reducing the EF of indoor curling and in Cromwell reducing the EF of other tourism
activities are two different priorities needed to achieve the environmental goal of sus-
tainable development.
In response to questions 3.3.1.2 and 3.3.1.2 it can be stated that a strategy for the sus-
tainable development of ecotourism and its architecture should determine the main envi-
ronmental, cultural, and economic outcomes for the sustainable development of ecotour-
ism and its architecture. Likewise a strategy should indicate the priorities that contribute
Chapter 6: Second and Third Case Studies: Naseby and Cromwell –OCRT, New Zealand
415 | P a g e
to achieving these outcomes. But, as shown in this chapter, at the site scale, these priori-
ties change from one destination to another. This means all such priorities should be
proposed in relation to the environmental, social and economic characteristics of the
destinations. For instance in the case of Cromwell development of visiting historical
sites and in Naseby development of outdoor curling can be considered as priorities for
the sustainable development of the OCRT in these destinations.
Chapter 7: Conclusion
417 | P a g e
Chapter 7: Conclusion
This thesis contributes to knowledge by setting the environmental, cultural and eco-
nomic characteristics of ecotourism and its related architecture into a holistic model to
explore the linkage between these profiles and their sustainability. To achieve this goal
the thesis develops a quantitative methodology that comprises the comprehensive
framework for the sustainable development of ecotourism and its architecture. This ho-
listic cultural footprint model (CF-model) summarises a comprehensive framework pro-
posed for sustainable development of ecotourism and its products including the archi-
tecture used as accommodation services. The CF- model contains an area that is intro-
duced as the cultural footprint area and which is determined by the quantity of the so-
cial- cultural products and activities offered by the host destination of ecotourism and
consumed/conducted by eco-tourists at one apex, and the ecological and economic foot-
prints of these social-cultural behaviours on the two other apexes.
As sustainability is a multi-dimensional phenomenon that covers all human activities
and products, this thesis uses its principles and strategies to determine a sustainable liv-
ing area for those engaged in ecotourism development. Then the present cultural foot-
print of ecotourism, its products and activities can be quantitatively compared with the
proposed sustainable living area. This quantitative comparison between the cultural
footprints of ecotourism and its products and activities can show how far ecotourism is
environmentally, culturally and economically from the sustainable model and what
could be done to change the present cultural footprint to sustainable living circum-
stances.
Since environmental conservation is considered as the main environmental outcome for
sustainable development of ecotourism and its related products and activities then their
ecological impacts must be at a point of ecologically sustainable life. This study uses
the ecological footprint (EF) of products and activities related to ecotourism as the main
ecological indicator for evaluation of ecotourism and architecture as being sustainable.
Comparison between the present EFs of ecotourism and its architecture with the EF of
sustainable life related to these categories indicate how far is its environmental charac-
teristic from the sustainable EF.
Chapter 7: Conclusion
418 | P a g e
Awareness of the members of a society about their cultural capitals and heritage are in-
troduced as one of the main anticipated cultural outcomes for sustainable development
of ecotourism. The main productive activity that contributes to achieving the mentioned
outcomes is conservation of the cultural heritage in the host society. In addition making
this opportunity for local and endogenous participants to present their cultural capitals
and products is viewed as a social-economic strategy for culturally sustainable devel-
opment of ecotourism. This thesis uses the quantity of the cultural heritage that is pre-
served and cultural products that are produced through ecotourism as the cultural indica-
tors to be used as tools to evaluate it and its products (including architecture) as being
culturally sustainable.
This thesis uses a social- ecological lens to view the ecological and social impacts of
economic development on the host society of ecotourism. Since the use of the current
economic indicators such as GDP and GNP ignores the cost of environmental decline
caused through the development process, for the first time, this study introduces GDPs
(sustainable portion of GDP) as a social- economic indicator that is environmentally
sensitive in relation to the development of ecotourism and its environmental impacts.
The difference between the GDPs and the total GDP of ecotourism indicates the cost
that must be spent to change the present EF of an ecotourism project to its sustainable
EF.
The GDPs is not just a conventional economic indicator. As producing local products
and development of local activities are considered as cultural indicators for sustainable
development, the GDPs that determines the gross domestic products created through an
activity as ecotourism also can be viewed as a social indicator. Since the cost of envi-
ronmental conservation is subtracted from the total GDP to create GDPs, it can be in-
troduced as an economic indicator that is environmentally sensitive.
In this thesis, the three cultural, environmental and economic indicators determine the
three apexes of the cultural footprint area of ecotourism, its products and activities in
the CF-model. Indeed the CF can be introduced as a holistic and multi dimensional in-
dicator that contains all other ecological, cultural and economic indicators. For the first
time this thesis proposes the CF model in which ecological, socio-cultural and economic
aspects of a phenomenon such as ecotourism are linked together. Using the CF model
can contribute to its users being able to measure and understand how their behaviours
change their surrounding environment and their economic system. Likewise, using the
Chapter 7: Conclusion
419 | P a g e
CF-model can contribute to making decisions about future development. It can indicate
which parts of the current social-cultural behaviours should be developed, justified or
must be completely ignored in strategies for future sustainable development.
The above-mentioned comprehensive framework that is summarised as the CF-model is
tested through using three case studies of the Otago Central Rail Trail (OCRT), Naseby
and Cromwell located along the rail trail.
This thesis investigates the cultural, environmental and economic impacts of the OCRT
at the regional scale on its host destinations. The thesis finds that many historical sites
and buildings have been refurbished through development of this project. This using of
historical sites and buildings as OCRT attractions contributes to awareness of the en-
gaged communities and components about their cultural identity. In addition the com-
munities and their components are engaged in conservation of their cultural heritage
through development of OCRT as an ecotourism project. On the other hand develop-
ment of OCRT changes the attitude of people engaged in this project to their cultural
heritage.
In terms of architecture used as accommodation services in the OCRT, using 78 refur-
bished buildings as accommodation services can be considered as one of the positive
influences of OCRT on its host destination that contributes to preservation of their cul-
tural identity.
Furthermore, the OCRT make the opportunity for local people to present their cultural
products such as food, artefacts, crafts, activities and historic architecture to their visi-
tors. The OCRT should not be considered as a merely recreational project, but also is an
educational project that contributes to its visitors being able to know more about the
cultural and environmental heritage and capitals of their hosts.
This thesis indicates that about 78.2% of the total EF of OCRT (1,617gha) is its current
overshoot portion of the EF. As shown in Chapter 5 about 71.1 % of the total EF is
caused by transportation. Moreover, this 71.1% of the total EF of OCRT is made up of
38.1% which is the EF of international transportation and 33.8% which is the EF of do-
mestic transportation. It should be remembered at the same time that international visi-
tors comprise just 22 % of the total numbers of OCRT visitors, although their transport
forms 38.1% of the OCRT’s total EF.
Chapter 7: Conclusion
420 | P a g e
Through the use of the GDPs as an economic indicator it has been determined that be-
cause of the high overshoot portion of the EF of OCRT, 43.6% of its total GDP must be
spent to change its present EF to the sustainable living EF with zero overshoot portion
of ecological footprint.
This thesis determines that producing local products instead of using conventional
products contributes to reducing the total EF of OCRT. As investigated in Chapter 5, in
2011, producing locally 17% of the total 65165.05 kg of food consumed by OCRT visi-
tors, can reduce by 1.5% (23.2gha) its total EF (1,617 gha).Looked at in another way,,
producing 1kg of home cooked food instead of conventional food can reduce the total
EF of OCRT by143 m2. In addition, as determined in Chapter 5 producing home
cooked food (as a cultural product) contributes to increasing income by NZ$ 3.80 / kg
of home cooked food. This thesis has made it possible to demonstrate clearly that using
local products in ecotourism development not only is culturally appropriate, but also is
environmentally friendly and economically viable.
In 2011 the OCRT visitors were involved with 18 types of activities that are categorised
into the two categories of indoor (curling at Naseby) and outdoor activities. The curling
at Naseby can be viewed as one of the important attractions of OCRT that attracts its
visitors at the regional, National and international scales. This activity is considered as
one of the distinctive potentials of OCRT for development of tourism. However its EF
is one of the three top EFs of OCRT activities. The EF of indoor curling at Naseby can
be reduced through making it a seasonal activity that is conducted during winter. Since
the curling at Naseby attracts 4,350 of 11,788 OCRT visitors, this would make an op-
portunity for other OCRT components to develop their other cultural products.
If the EF of curling will be changed to the sustainable EF related to this activity
through spending a portion of OCRT GDP to generate its overshoot portion of energy
use, curling at Naseby can be considered as one of the culturally appropriate activities.
Most of the outdoor activities such as sightseeing, visiting historic sites and buildings,
wineries, art galleries offered by OCRT and conducted by its visitors make the opportu-
nity for its visitors to educate themselves about the environmental and cultural heritage
of their host destination. Also the host people have the opportunity to present their cul-
tural products to their visitors as a cultural economic activity. As demonstrated in Chap-
ter 5 the total EF of OCRT activities covers 0.4 % (6.57 gha) of the total EF of OCRT
Chapter 7: Conclusion
421 | P a g e
(1,617gha). In comparison with the EF of other categories including transportation
(72.2%), food (24.8%) and accommodation services (2.6%) this is a small area of EF.
However in comparison with other categories of activities, golfing has the highest EF/
visitor (0.003 gha) and the smallest EF (0.00006 gha /visitors) belongs to activities such
as walking , fruit picking and visiting heritage (e.g. Old Cromwell town).
This thesis determines that if an OCRT visitor changes his or her preferred activity from
golfing to outdoor activities with small EF (e.g. walking) it can reduce his/her EF re-
lated to the activities by 0.00294 gha /visitor (29 m2/ visitor). As shown in Chapter 5
just a few visitors (153) of total 11,788 OCRT visitors choose golfing as one of their
activities but the EF of them related to golfing is one of the three top EFs related to
OCRT activities. The number of visitors that play golf indicates that golfing is not a
significant cultural activity because just a few people are interested to do that. Likewise
in comparison with other activities its EF/visitor is the highest EF area. Consequently its
GDPs /visitor is the lowest amount of GDPs/ visitor. This thesis suggested that the de-
velopment of activities such as golf with high EF and low GDPs and small number of
participants should be completely ignored in the future strategy for development of the
OCRT.
Using renovated historic buildings for 78 of 226 OCRT accommodation buildings
shows the changing of the attitudes of OCRT components to their cultural heritage
caused by OCRT development. This indicates that the architecture used in OCRT is cul-
turally sensitive and contributes to the visitors being able to know more about the cul-
tural background of their host destination. In addition as determined in this study using
refurbished buildings as accommodation services not only is culturally sustainable but
also can decrease the total EF of OCRT and increase its GDPs. The thesis demonstrates
that using refurbished buildings to provide 21,378 m2 of the total of OCRT accommoda-
tion services (80,356m2) can reduce by 0.8 gha its total EF. However it should be re-
membered that both types of refurbished (RB) and new (NB) buildings used as accom-
modation services use electricity as the main source of energy.
Using renewable sources of energy can be considered as one necessity that should be
applied in OCRT accommodation services to make this sector more environmentally
sustainable.
Chapter 7: Conclusion
422 | P a g e
The thesis shows that using open air spaces as parts of the buildings is advertised by
most of the accommodation owners as a positive potential of their services. This means
using open air spaces can be viewed as one of the appropriate cultural behaviours in
OCRT.
Furthermore as has been indicated in Chapter 5, using 378 m2 of the total 80,356 m2 ac-
commodation area as veranda and balcony contributes to reducing 0.8 gha of the total
EF of OCRT accommodation services. This means using 1 m2 of veranda/ balcony can
reduce the EF of accommodation services by 21.1m2. In turn it can contribute to devel-
opment of the GDPs. Consequently using verandas and balconies in OCRT accommo-
dation services is a culturally appropriate policy for development of architecture which
also is an environmentally friendly and economically sustainable strategy.
Using the comprehensive framework and its conceptualised model (CF-model) to inves-
tigate the cultural footprint of OCRT on Naseby and Cromwell indicates that using local
products has the same ecological and economic outcomes in both case studies as in the
OCRT as a whole.
This thesis determines that in Naseby local products (home prepared food) are used
more than in Cromwell. In addition the GDPs of Naseby related to the local products is
more than for Cromwell. If the overshoot portions of the EF of both Naseby and Crom-
well will be changed to the Ideal sustainable EF, as Naseby has more economic out-
come and more quantity of the local products than Cromwell, its cultural footprint is
more positive than Cromwell in terms of the local products.
Since the accommodation services in Naseby contain refurbished buildings, use less in-
door areas, comprise more area of veranda and balcony, have more GDPs and smaller
EF than Cromwell’s accommodation services, Naseby also has more sustainable cul-
tural footprint than Cromwell in terms of accommodation services.
Chapter 6 shows that Naseby activities have more potential than Cromwell to attract
OCRT visitors. Also Naseby has more GDPs than Cromwell, and the same EF/visitor
activity. If the overshoot portions of the EFs of both case studies will be changed to the
Ideal EF of sustainable activities, then Naseby’s activities will have more positive CF
than Cromwell visitors’ activities.
Chapter 7: Conclusion
423 | P a g e
This thesis concludes that the proposed comprehensive framework and the CF-model
can be used as an holistic tool to make the link between ecological, cultural and eco-
nomic characteristics of ecotourism and its related architecture as being sustainable.
This thesis results in the finding that the main characteristics of an architecture that will
contribute to sustainable development through ecotourism can be conceptualised as one
characteristic of its cultural footprint. As the main finding of the thesis, in response to
the key question it is concluded that the main characteristic of an architecture that
will contribute to sustainable development through ecotourism is having a sustain-
able cultural footprint on the host destination.
The proposed methodology and methodological framework have advantages that can be
conceptualised as:
- Using a holistic approach to the development of ecotourism and its architecture
through sustainability and its principles.
- Using an existing information system for research that contributes to testing the sys-
tem as being appropriate for the sustainable development of ecotourism.
Conversely, the main shortcoming of the methodology and the methodological form-
work is the lack of an efficient information system for creation and management of the
necessary data.
Arising from the above limitation, the accuracy of the results is another potential short-
coming of the thesis. However, using a comparative method to evaluate ecotourism and
architecture helps to ameliorate these limitations. Furthermore, the thesis shows the ne-
cessity of having an efficient information system as a fundamental for the sustainable
development of ecotourism and its architecture.
Goals for future research in terms of the CF-model are using it to determine the differ-
ent cultural footprints of ecotourism and its architecture at different times in the same
place. This would contribute to clarifying how tourism and its architecture exert influ-
ence on a society through the evolution of other factors such as technology, facilities,
materials, and social behaviours at different times in the same place. The results could
be used in the sustainable restoration of a part of the cultural identity of a given society
previously impacted by the unsustainable development of tourism and its architecture
arising from modernism and capitalism.
Chapter 7: Conclusion
424 | P a g e
Moreover using the CF-model could contribute to defining a new structure of urban
spaces for use as host destinations for soft ecotourism, based on introducing social cul-
tural boundaries for each category of urban component related to soft ecotourism. The
CF boundaries could be used to determine the way in which the interactions between
different urban spaces with each other and their surrounding environment can be as-
sessed as being more or less sustainable.
Bibliography
425 | P a g e
Bibliography Ancient Briton Hotel. (2011). “Naseby”. www.ancientbriton.co.nz. Viewed July
2010 Appleby, P. (2011). Integrated sustainable design of buildings, Published by Earth
Scan , London ; Washington, DC. Ashley, C & Garland, E. (1994). “Promoting community-based tourism develop-
ment why, what and how?” Directorate of Environmental Affairs Ministry of En-vironment and Tourism, Private Bag 13306 Windhoek, Namibia.
Australia’s guide to environmentally sustainable homes.
www.yourhome.gov.au/technical/fs52.html. Viewed February 2010 Becken ,S ., Frampton, C ., Simmons, D.( 2001). “Energy consumption pattern in
the accommodation sector-the New Zealand case”. Ecological Economics, No.39:371-386.
Bernard, F., Groot, R.S.D. and Campos, J.J. (2009). “Valuation of tropical forest
services and mechanism to finance their conservation and sustainable use: A case study of Tapanti National park, Costa Rica”, Forest policy and Economics, No.11: 174-183.
Blangy, S. and Mehta, H. (2006). “Ecotourism and ecological restoration”, Journal
for Nature Conservation, No.14: 233-236. Breis, G.C (1992). Towards A Framework of Socio-Cultural Indicators for the De-
velopment Process, Published by UNESCO, Paris. Browning, R. C., Baker, E.A., Herron, J.A and Kram, R. (2005). “Effects of obesity
and sex on the energetic cost and preferred speed of walking”. J Appl Physiol No.100 : 390- 398.
Buckley, R. (2009). Ecotourism, principles & practices, Wallingford, UK; Cam-
bridge, MA: CABI. Burns, G. & Corbet, R. (2007). “New Zealand Tourism Strategy 2015”. New Zea-
land Ministry of Tourism. http://www.nztourismstrategy.com Catley, A. (1999). Methods On The Move, International Institute for Environment
and Development, London Central Otago District Council (CODC). (2011). “OCRT user survey gross results”.
CODC, Otago, New Zealand. Central Otago District Council. (2009). “Otago Central Rail Trail”.
Fennell, D.(1999). Ecotourism: An introduction, Published by Routledge, London. Gerring, J., Barresi, P.A.(2003).”Putting Ordinary Language to Work”. Journal of
Theoretical Politics No. 15(2): 201-232. Getz, D. (1986).”Models in Tourism Planning; Towards integration of Research on
Practices”, Tourism Management No.17: 21-32 GlOBE 90. (1990). An Action Strategy for Sustainable Development. Tourism
Stream , Action Strategy Committee, Glob 90. Vancouver, British Colombia. Gössling, S. (1999). “Ecotourism: a means to safeguard biodiversity and ecosystem
ment: looking for new strategies”, Ecological Economics, No.16:205- 216. Graham, O. J. (2009). “The Otago Central Rail Trail: Preservation of Heritage Sites
Through development for Visitor Use”. 3rd Australasian Engineering Heritage Conference. http://www.ipenz.org.nz
Herdeg, K.(1990) . Formal Structure in Islamic Architecture of Iran and Turkistan,
Published by Rizzoli International Publications, INC. New York, USA.
Horn, R.V ( 1983). “Cultural Statistics and Indicators”. Journal of Cultural Eco-
nomics, USA No.7 (2): 25-40. Hueting, R. and Reijnders, L. (2004). “Broad sustainability contra sustainability: the
proper construction of sustainability indicators”. Ecological Economics, No.50, 249-260. WWW.elsevier.com/locate/ecolecon
International Federation of Arts Councils and Culture Agencies (IFACCA).(2005) .
Statistical Indicators for Art Policy. IFACCA, Sydney. www.ifacca.org/ifacca2/en/orgnisation/page09_ BrowseDart.asp.
Jafari, J., Ritchie, J.R.B (1981). “Toward a Framework for Tourism Education,
Problems and Prospects”. Annals of Tourism Research. No.3 (1): 13-34. Jellum, C & Reis, A. (2008). “Otago Central Rail Trail economic impact survey”.
Otago Central Rail Trail Trust. http://www.otagocentralrailtrail.co.nz. Kazimee, B.A.(2008). “Learning from Vernacular Architecture; Sustainability and
Cultural Conformity” published in the conference proceedings of the second In-ternational Conference on Eco-Architecture .
Kermani, A.A and Luiten, E.(2010).” Preservation and Transformation of Historic
Urban Cores in Iran, the Case of Kerman”. Journal of WSEAS Transactions on Environment and Development, : 53-62.
Khan, M. (2003). “Ecoserve Eco-tourists’ Quality Expectations, Annals of Tourism
Research, No. 30(1):109-124 Kim, J.J and Rigdon, B. (1998). Introduction to Sustainable Design, Published by
National Pollution Centre for Higher Education, Michigan, USA, 1998. Kohlmann, B., Mitsch, W.J. and Hansen, D.O. (2008). “Ecological management and
sustainable development in the humid tropics of Costa Rica”, Ecological Engi-neering No.34, 254-266.
Lawrence, R.J.(2003). “Human ecology and its application”. Journal of Landscape
and Urban Planning:31-40. Madden, C. (2005). Indicators for Arts and Cultural policy”. Journal of Cultural
Trends:217-248. Madden , C.(2005). Statistical Indicators for Arts Policy, Published by International
Federation of Arts Councils and Culture Agencies, www. ifacca.org. Mahravan, A. and Vale, B. ( 2010), “ Community- Based Tourism Development as a
Strategy Towards Sustainable Tourism Planning and Development”, Published by 4th International Conference on Built Environment in Developing Countries- Penang, Malaysia: 1382-1394.
Marcouiller, D.W.( 2004), “ Natural Amenities, Tourism and Income Distribution”,
Annals of Tourism Research No.31 (4): 1031-1050. Matthews, M. (2009).”How New Zealanders Travel”. New Zealand Ministry of
Transprot.www.transport.govt.nz/research/travelsutvey/ Matvienko, O. (2010). “Bottled Water, know the facts”. Iowa State University: 1-4 May, V. (1991). “Tourism, environment and development”, Tourism Management
No.12 (2): 112-118. McDonald, G & Patterson, M.(2003). “Ecological Footprints of New Zealand and its
Regions”. Ministry for Environment. http://www.mfe.govt.nz McKercher, B., Ho, P.S.Y., Cros, H. d. (2005). “Relationship between tourism and
cultural heritage management: evidence from Hong Kong”. Tourism Manage-ment No.26: 539-548.
MDF-Training & Consultancy (2005). “Indicators”. www.mdf.nl Minnaert, L., Maitland, R., Miller, G .(2009). Tourism and Social Policy: The Val-
ue of Social Tourism. Annals of Tourism Research, No.36 (2): 316-334. Ministry of Culture, Madrid, Spain. (1985).”Cultural Indicators Project”. Presented
in Division of statistics on culture and communication office of statistics UNESCO, Paris.
Mithraratne, N & Vale, R. (2007). “Rain Tanks Or Reticulated Water Supply?”.
Landcare Research, Private Bag 92170, Auckland, New Zealand. Mog, J.M. (2004). “Struggling with Sustainability- A Comparative Framework for
Evaluating Sustainable Development Programs”. World Development No. 12, 2139- 2160.
Munda, G. (2006). “Social multi- criteria evaluation for sustainability policies”.
Land Use Policy No.23: 86-94. WWW.elsevier.com/locate/landusepol Murphy, P.E. (1983), “Tourism as a community industry”, Tourism Management
No. 4(3): 180-193. Sorrel, p. (1999). “Naseby”.The Cyclopaedia of Otago and Southland No 1.
http://www.nasebyvision.org.nz/2000/12/naseby.html Naseby community. (2010). Naseby community plan.
Ness, B., Piirsalu, E. U., Anderberg, S. and Olsson, L. (2007). “Categorising tools for sustainability assessment”. Ecological Economics No.60, 498-508.
New Zealand Wind Energy Association. (2011). www. windenergy.org.nz/wind-
energy/costs. New Zealand Council of Trade Unions (NZCTU) . (2010). http://union.org.nz Niemi, G.J and MacDonald, M.E. (2004). “Application of Ecological Indicators”.
Annual Review of Ecology, Evolution, and Systematics, No.35:89-11. O’ Connor, H.D. (2010). “New Zealand Tourism Strategy 2015”. Published by New
Zealand Minister of Tourism. http://nztourismstrategy.com/download.html Odum, E.P. (1975). Ecology, the link between the natural and the social science,
Holt, Rinehart and Winston , New York. O’Mahony, C., Ferreira, M., Fernandez- Palacios, Y., Cummins, V., Haroun, R
(2009). “Data availability and accessibility for sustainable tourism: An assess-ment involving different European coastal tourism destination”. Journal of Coastal Research, SI 56 (Proceedings of the 10th
International Coastal Symposi-um): 1134-1139.
Omer, A. M. (2008). “Energy, environment and sustainable development”. Renew-
able and Sustainable Energy Review, No.12: 2265-2300. WWW.elsevier.com/locate/resre
Organisation For Economic Development and Co-operation. (2008). Key Environ-
mental Indicators. OECD Environmental Director, Paris, France. Otago Central Rail Trail Trust. (2005).”The Otago Central Rail Trail Means Busi-
ness”. http://www.otagocentralrailtrail.co.nz Pattanaik, P. (1997). “Cultural Indicators of Well-being: Some Conceptualised Is-
sues”. Published by UNESCO and UNIRSD. Pereira, J. (1994). Islamic Sacred Architecture a Stylistic History, New Delhi Pigram, J.J. (1980). “Environmental Implications of Tourism Development”, Annals
of Tourism Research No.4: 554-583. Pipithvanichtham, P. (1997). “Issues and challenges of ecotourism in the National
parks of Thailand”, Proceedings of international Conference on advances in Ecotourism for Conservation and Community Development, Bangkok, Thailand, January.
Poria, Y., Butler, R., Airey, D.( 2003). “The Core of Heritage Tourism”. Annals of
Rapoport, A. (1969). House, Form and Culture, Published by Prentice-Hall, Inc. Englewood Cliffs, N.J. USA.
Reid, D.G., Mair, H., George, W. (2004). “Community Tourism Planning: A Self-
Assessment Instrument”. Annals of Tourism Research No.31(3): 623-639. Reis, A., Jellum, C. and Lovelock, B. (2010). “Linking the Taieri Gorge Railway
and the Otago Central Rail Trail: A survey of user demands”. Center for Recrea-tion, School of Business, University of Otago, Otago, New Zealand.
Renewable Energy Magazine.(2000). “Geothermal Ice Plant Efficiently Replaced
Again Ammonia System – Oliver Club, Oliver, B.C.”. Renewable Energy Mag-azine, British Columbia, Canada, No. 1, Issue 3. www.publications.gc.ca/collections/Collection/M143-4-1-3E.pdf
Robin, C.P.Y. and Poon, C .S.(2009). “Cultural shift towards sustainability in the
construction industry of Hong Kong”. Journal of Environmental Management No.90, 3616- 3628. WWW.elsvier.com/locate/jenvman
Schianetz, K., Kavanagh, L., Lockington, D (2007). “The learning Tourism Destina-
tion: The potential of a Learning Organisation approach for improving the sus-tainability of tourism destinations”. Tourism Management No.28: 1485-1496.
Secretariat of the Pacific Community (2010). “Culture Statistics and Indicators”.
Twenty-third Meeting of the Council of Pacific Arts, Noumea, New Caledonia : 1-4 .
Simpson, M. C. (2008). “Community Benefit Tourism Initiative-A conceptual oxy-
moron?” Tourism Management No. 29: 1-18. Statistics New Zealand and Ministry for culture and heritage (2006). “Cultural Indi-
cators for New Zealand”. Published by Statistics New Zealand and Ministry for culture and heritage. Wellington, New Zealand: Catalogue Number: 16.001
Statistics New Zealand (SNZ). (2006). “Cultural Indicators for New Zealand. Min-
istry for Culture and Heritage, Wellington, New Zealand. Statistics New Zealand (SNZ). (2009). “Cultural Indicators for New Zealand”. Min-
istry for Culture and Heritage, Wellington, New Zealand. Steele, J. (2005). Ecological architecture: a critical history, Thames & Hudson,
The institute for Statistics of the United Nations Education Scientific and Cultural Organization (UIS) (2010). “The 2009 UNESCO Framework for Cultural Statis-tics (FCS)”. Statistical Commission Forty-first session: 23-26.
The International Federation of Arts Councils and Culture Agencies (IFACCA).
(2005). “Cultural Trends”. Published by Routledge, Vol. 20 Torres, S and Sakamoto. (2004). “Subjective factors in sustainable building”. Pub-
lished in the conference proceedings of the 21th conference on Passive and Low Energy Architecture. Eindhoven, the Netherlands:19-22.
Tourism Satellite Account. (2009). Published in October 2009 by Statistics New
Zealand, Wellington, New Zealand. Travis, S (1982). “Managing the environmental and cultural impacts of tourism and
leisure development”. Tourism Management: 256-262. Tsaur, S. H., Lin, Y.C. and Lin, J.H. (2006). “Evaluation ecotourism sustainability
from the integrated perspective of resource, community and tourism”. Tourism management, No.27, 640-653.
Twyman, C. (2000). “Participatory Conservation? Community based natural re-
source management in Botswana”. The Geographical Journal No.166: 323-335. UNEP. (2011). “Towards a Green Economy”. 100 Watt, France.
UNESCO (2003). “Convention for the safeguarding of the Cultural Heritage”. Pub-
lished in by UNESCO Conference, 32nd session, Paris, France. US Department of Energy (2011) 2010 “Solar Technologies Market Report D
DOE/GO-102011-3318 NREL November p60)”.
Vale, B & Vale, R. (2009). Time to eat the dog? Thames & Hudson Ltd, London. Veron, R. (2001).” The New Kerala Model: Lesson for Sustainable Development”.
World Development No.4:601-617. WWW.elsevier.com/locate/worlddev Wall, G. (1997). “Is Ecotourism sustainable?”, Environmental Management No.21,
483-491. Wang, J. P. (2004). “Community- based Ecotourism development in Northern Thai-
land”, Available online at: http://www.asianscholarship.org/asf/ejourn/articles/jianping_w.pdf.
Wearing, S. and Neil, J. (2009). Ecotourism, Impacts, Potentials and possibility, Ox-
Weaver, D.B and Lawton, L .J. (2007). “Twenty years on: The state of contempo-
rary ecotourism research”, Tourism Management No.28, 1168- 1179. Weaver, D. and Lawton, L. (1999). “Sustainable Tourism: A critical Analysis”, Co-
operative Research Center for Sustainable Tourism, Research report series. Weaver, D.B. (1999).” Magnitude of Ecotourism in Costa Rica and Kenya”, Annals
of tourism research.No.4: 792-816. Wester, L. and Youngvanit, S. (2005).” Farmers, foresters and forest temples: Con-
servation in the Dong Mun uplands, Northeast Thailand” Geo forum No.36: 735-749.
Williams, D.E. (2007). Sustainable Design, Published by John Wiley & Sons, Inc.,
Hoboken, New Jersey. Wolf, A.T. (2011). “Sustainability Trends and Innovation in Glass and Glazing”.
Apendix1: NZST 2015- forecasted activity need to do to achieve anticipated priorities (cited in Table 2.2). Priority
No. Action needs to do to achieve priorities
1
Invest in strengthening New Zealand’s global marketing campaign with more funding for Tourism New Zealand Develop marketing initiatives that focus on changing consumer attitudes and expectations in China and other new markets Coordinate the investment in overseas marketing (public and private) to improve the conversion of preference to travel to actual travel. Make sure that the unique elements of Maori culture are reflected in the way New Zealand’s brand is positioned internationally, and in national and regional product development
2
Monitor how and where international and domestic visitors make their bookings, so that we invest in the most effective distribution channels, and educate tourism operators about how to get the most out of those channels Make sure that tourism operators invest in the technology they need to best manage their bookings and inventory Make sure that quality Maori tourism products and services are better integrated throughout the full range of wholesale and retail distribution channels
3
Build on the common business and information systems in the i–SITE network to make sure that i–SITEs across the country offer a consistent experience Carry out research into ways in which the I–Site network could be used to help improve visitor experiences. This would build on previous research into the information needs of I-Site users
4
Broaden Qualmark’s coverage by adding new categories into the existing range of gradings and endorsements, and increasing the uptake of Qualmark by tourism operators Make sure that Qualmark’s assessment systems are consistently applied, and are recognised and supported by the tourism sector Help domestic and international consumers get a better understanding of the Qualmark grading system, so that they feel more confident about selecting Qualmark–endorsed products, and they know what these services will deliver
5
Enhance the quality of the accuracy of the International Visitor Survey and Domestic Tourism Survey Integrate all the research about visitor satisfaction into one common platform or database Extend the Regional Visitor Monitor (RVM) into more regions, and expand the focus of both the RVM and the Domestic Tourism Survey to provide information about buying behaviour and what drives travel trends
6
Make sure that there is enough investment in the infrastructure needed to meet growing visitor demand. This includes roads, the availability of broadband, especially in more rural and remote areas, water supplies, managing waste water, public toilets, signage, and car parks Make sure that airport authorities and border control agencies have the information they need to plan for tourism growth so that they have the staff and resources they need to cope
Appendix
435 | P a g e
Apendix2: NZST 2015- forecasted activity need to do to achieve the anticipated priorities (cited in Table 2. 3). Priority NO. Action needs to do to achieve priorities
1
Improve resource efficiencies, workforce management, and profitability opportunities for all businesses through more clustering, joint ventures, and other industry cooperation initiatives. Encourage the hotel industry, inbound tour operators, and airlines to work together on things such as pricing, seasonal campaigns, and the way products are packaged to increase occupancy rates and profitability. Streamline and improve the focus of existing business–assistance programmes to help operators increase their return on investment and develop quality products. Build management capability by identifying and developing staff to undertake effective management training programmes. Make sure that tourism operators and destinations get better access to broadband services when the New Zealand Digital Strategy is being implemented.
2
Target those markets that are likely to spend more than average. Develop existing products and services so that they increase the value of the visitor experience and encourage higher levels of spending. Provide better service delivery and interpretation, including on–site interpretation at visitor attractions. Ensure businesses have access to research and other market intelligence to assist them in their product development.
3
Implement the Tourism and Hospitality Workforce Strategy by: Making sure the tourism sector has a strong voice with labour, education and
training policy makers. Identifying and promoting opportunities for the sector to increase its productivity.
Get more benefits from education and training through an active partnership with the education and training sector. This should be underpinned by closer links between businesses, providers of training, and industry–training organisations. The industry also needs to coordinate its input to the Tertiary Education Commission reviews. Identify opportunities to make the best use of people, including: • investing in technology that improves business efficiency and means that employees are engaged in the most productive activities. • developing visitor experiences that are less labour–intensive but do not compromise quality.
at peak times Investigate the case for developing national facilities such as a national convention centre and cruise–ship facilities
7
Establish a domestic tourism working group to develop a domestic tourism plan Encourage and support Regional Tourism Organisations to communicate with stakeholders the importance of regional campaigns in driving the domestic market and creating opportunities to increase domestic travel
8
Keep building business capability through the Maori Business Facilitation Service Increase the number of Maori tourism businesses involved in quality accreditation schemes such as Qualmark and Toi Iho Help tourism businesses to incorporate a Maori dimension into the products and services they provide Increase the range of Maori products and services being offered to the international and domestic markets Strengthen relationships between Regional Tourism Organisations and Maori Regional Tourism Organisations to maximise the development of a Maori tourism product that reinforces regional differentiation and meets visitor demand
Appendix
436 | P a g e
Seek targeted immigration to fill critical skill gaps and provide workers during the peak period. This will require coordination within the industry, and cooperation with the Department of Labour. Develop ways for tourism businesses to monitor labour productivity and improve the contribution that their people make to the performance of their business.
4
Bid for, and secure, major international events, which will help reduce seasonality. Coordinate existing conference and incentive marketing activities to increase the performance in this market. Invest in marketing initiatives that target those domestic and international visitors who are more likely to travel in the shoulder and off–peak seasons. Identify and develop products that are likely to increase travel during the shoulder and off– peak seasons. Examples include Matariki and the Pacifica Festival. Products with all–weather options are another possibility.
5
Develop and fund an industry–government partnership model to advance sector research, including determining priority research and then directing, funding, and managing the delivery of this research. Establish quality measures for the Core Tourism Data Set and develop and implement ways of achieving the agreed quality standards. Make more sectoral and regional data available to the sector through: • further analysis of existing data sources • collecting additional data through industry partnerships. Establish a set of measures to track performance in the sector, including financial performance, managing seasonality, and increasing visitor satisfaction.
Apendix3: NZST 2015- forecasted activity need to do to achieve anticipated priorities (cited in Table 2.4).
Priority
NO.
Action needs to do to achieve priorities
1
Seek the completion of a national environmental management plan to clearly articulate priorities for all of New Zealand by December 2008. Understand and use the value of kaitiakitanga (guardianship) as the basis for the tourism sector’s actions to enhance the environment. Participate in and influence global forums and agreements on environmental issues that affect New Zealand tourism, and implement their requirements. Both advocate for and actively support stronger environmental policies, standards and regulations throughout New Zealand. Develop indicators for the sector (at both a national and operator level) to measure, manage, and monitor environmental impacts, and use these to evaluate performance over time.
2
Understand the environmental aspirations of our current and future international visitors, and how they view New Zealand’s environmental management. Use this information in marketing and to develop tourism products, targeting visitors who support New Zealand’s environmental values and whose ethics, behaviour, and impacts align with those values. Help consumers to make informed product choices that align with their environmental values by using environmental ratings and labelling, and making consumers aware of environmental accreditation schemes.
3
Make sure that tourism vehicle, aircraft, and boat fleets are New Zealand’s most fuel–efficient and produce the lowest emissions possible by, for example: • using transport fuels that contain the highest available proportion of bio-fuels, and encouraging visitors to do the same • buying vehicles for commercial and rental fleets that are the most fuel–efficient for their intended use, such as diesel or hybrid vehicles • buying Euro IV standard engines for diesel transport fleets, and Euro V standard engines once compatible fuel is introduced on 1 January 2009. Improve the fuel efficiency of operators and visitors by, for example: • adopting best–practice standards for fuel–efficient fleet management. This includes engine maintenance, tyre pressure, and reducing visible smoke emissions
Appendix
437 | P a g e
• recommending the most fuel–efficient transport to visitors to meet their travel needs • educating operators and visitors about driving to improve fuel efficiency. Work with Air New Zealand and other airlines to develop options that allow tourists to reduce and/or offset the carbon emissions they generate by flying to New Zealand. Support government initiatives to adopt and enforce emissions testing and minimum emissions standards for importing vehicles into New Zealand. Promote the use of public transport, rail, coaches, cycling, and walking as environmentally friendly modes of transport. Advocate for and support the development of the services and infrastructure needed to make these forms of transport possible.
4
Work with organisations such as the Energy Efficiency and Conservation Authority on initiatives to improve environmental management in tourism and to implement the goals of the New Zealand Energy Efficiency and Conservation Strategy. Make sure new buildings and retrofits use the highest possible energy–efficient building standards, and that eco–verified procurement criteria are used when buying products and appliances. Adopt energy–management practices and new technologies to reduce overall energy consumption. This includes using timers, thermostats, occupancy sensors, and renewable and local sources of energy wherever possible.
5
Tourism operators must regularly audit the amount of waste they produce, take steps to reduce, reuse, and recycle waste, and provide facilities that encourage visitors to do the same. Work with local government to develop appropriate facilities, standards, and planning for waste management. Examples include public recycling in all main centres, developing policies on freedom camping, and preparing regional waste strategies.
6
Encourage tourism operators to use the environmental elements in Qualmark to lift their environmental performance, and look at ways of increasing the uptake of these elements across the sector. Work with Qualmark or other service providers to build operator capability in delivering environmentally sustainable products and services.
7
Take an early interest in the development of national park management plans, conservation management strategies, reserve management plans, marine plans, and other related processes, to make sure that they are developed in a collaborative, proactive style and address the interests and needs of operators, visitors, and local communities. Make sure that all DOC1 visitor monitoring and evaluation is carried out in a consistent manner, and that the data is used to establish appropriate management objectives and shared with the relevant tourism agencies. Look at developing visitor services and facilities, such as walking and mountain biking tracks and interpretation centres, in places where they can provide social, cultural, economic, and conservation benefits. Investigate potential funding mechanisms for visitors to contribute towards adding value to the visitor experience and the provision of facilities and services on lands and waters managed for the benefit of the public. Manage issues at key sites where important values (environmental, social, or cultural) are perceived to be under pressure environmentally and/or socially.
8
Develop products that make it possible for visitors to reduce their environmental footprint and leave New Zealand ‘better than they found it’. Possibilities include conservation projects that encourage visitor interaction, such as ecological restoration, pest eradication, or investment in renewable energy. Make sure all visitors and tourism operators have the opportunity to participate in verified carbon offsetting programmes for any remaining emissions. Develop national guidelines for running major events within New Zealand that incorporate environmental requirements into any government–funded events.
1. DOC: Department Of Conservation
Appendix
438 | P a g e
Apendix4: NZST 2015- forecasted activity need to do to achieve anticipated priorities (cited in
Table5). Priority
NO. Action needs to do to achieve priorities
1
Engage with communities at a strategic level through increased engagement at the governance level — for example, through community boards and councils. Contribute to local government processes by providing coordinated comments and submissions on, for example: • district plans • long–term council community plans • annual business plans • regional tourism • destination–management or economic development strategies • Resource Management Act processes.
Use the best available advice and information, such as Have Your Say, published by the Tourism Industry Association, to participate in local government processes.
Work with local authorities to increase the value that tourism brings to their communities and to manage and mitigate any undesirable effects.
2
Refine and promote the tools and statistical resources that now exist to help local authorities to plan for, invest in, and manage tourism. Prepare tourism strategies or destination–management plans that establish what strategic directions, management, infrastructure, and product development are needed and what the community outcomes of tourism will be. Review ‘Postcards From Home’, the Local Government New Zealand Tourism Strategy.
Take part in national decision–making on tourism issues, such as strategy development, policy, and funding. Keep strengthening the governance, management, and operations of Regional Tourism Organisations through wider uptake of the Roles and Guidelines for Tourism Organisations advice produced as a result of the New Zealand Tourism Strategy 2010. Provide certainty of funding to Regional Tourism Organisations and i–SITEs through a more proactive use of the range of funding tools currently available.
3
Make sure that high–quality research is available to local communities to inform decision–making by local government and the tourism sector, including information on the social, economic, environmental, and cultural benefits of tourism to communities. Research affordability issues for domestic tourism, including expectations, price sensitivities, and pricing mitigation options, to inform business positioning, product differentiation, and market segmentation decisions. Research the perceptions and experiences of crowding at times of peak capacity from a community perspective. This includes assessment of impacts on communities and visitor satisfaction, case studies, management options, and tools for local authorities to use. This should sit alongside work previously undertaken by DOC in relation to capacity issues on the conservation estate.
4
Strengthen existing events and set up new events and products that promote regional identity and differentiation. Build the capability of the i–SITE network to promote local culture, and build connections with the local tangata whenua and with the iconic landscape of each region. Communicate and promote the concept of manaakitanga and its importance in hosting both domestic and international visitors.
5 Assess core needs, and investigate and consider funding models to improve the standard and provision of appropriate infrastructure.
Page
439
App
endi
x Appendix.5: OCRT-Accommodation Facilities, Area and the Used Materials (2011) 1. RB= Restored and Historic 2. SC= Self-Contained 3. Bp= Backpacker 4. B&B= Bed and breakfast 5. N/A information not available
NU Location Accommodation Type Quality Facility
Products and activities Area Materials Common area Bedrooms
1 Middlemarch Annandale 1×B&B New
Writing area, guest living room, TV, a Victorian fireplace, a heat pump, log burner and HRV ventilation on cooler days.
All bedrooms with bathroom with shower and bath, tea and coffee making facilities, heaters, electric blankets and lighting.
Breakfast, homemade preserves and jams, OCRT, Middlemarch city, views of the Rock and Pillar Range, productive garden, reading materials.
Timber
2 Middlemarch Blind Billy’s Holiday Camp (3motel units) 3×Motel New
Each of 3 units has full equipped kitchen, bathroom and toilet, tea and coffee making facilities.
All bedrooms with heating and lighting.
OCRT, Middlemarch city and its products and attractions, Sutton Salt Lake, a tour of the nearby Oceania Gold open-cast mine at Macraes, walks up the Rock & Pillar Range, landscape views, historical sites and buildings, bike hire, 18 cultural events listed in table 1, golf course, horse riding, fishing, curling at Naseby, gold mining.
Timber
3 Middlemarch Blind Billy’s Holiday Camp (2 studio units) 2×SC New
Each of 3 units has full equipped kitchen, bathroom and toilet, tea and coffee making facilities.
Fully equipped rail carriage kitchen, sun deck dining, children’s playground, free gas BBQ, free laundry facilities (staff use only), toilet block and shower facilities.
Caravans with [heating] and lighting. -
7 Middlemarch
Blind Billy’s Holiday Camp( Caravan, campervan points and tent site)
Fully equipped rail carriage kitchen, sun deck dining, children’s playground, free gas BBQ, free laundry facilities (staff use only), toilet block and shower facilities.
Caravans with [heating] and lighting. -
8 Middlemarch Cottesbrook 2×SC-cottages RB
Each of 3 bedrooms cottage has its own gas-heated, shower and toilet, full equipped kitchen, lounge, laundry facility, verandah and log burner. One cottage has a shared TV.
All bedrooms with lighting.
Continental breakfast, surrounding private farm, mature gardens, OCRT, Taieri river, walkway up to the nearby Rock and Pillar range and walk to Sutton Salt lake, wildlife watching, fishing, canoeing, swimming, golf course, farm tracks, local shuttle service.
Timber
9 Middlemarch Gladbrook 1×B&B RB 2 shared bathrooms, sitting room, dining room, verandah and open fire.
All 5 bedrooms have electric blankets, hairdryer and lighting.
Breakfast, OCRT, Middlemarch city, historic area, garden, walk up the Rock and Pillar range and the Sutton Salt lake, sheep mustering activity,
Timber
Page
441
App
endi
x vistas of Strath Taieri, reading materials, tennis, croquet.
10 Middlemarch Gladbrook (cottage) 1×SC- RB
Both cottage and hut have bathroom comprising toilet and shower, equipped kitchen including fridge/freezer, separate freezer, stove and oven, tea and coffee supplied, toaster, TV, radio, laundry tub, washing machine, ironing equipment, BBQ and fireplace.
Each room has electric blankets (in cottage), hot water bottle (in hut), heater and lighting.
Food (free range eggs from owners’ hens, bread and butter and milk), continental breakfast, OCRT, Middlemarch city, historic area, garden, walk up the Rock and Pillar range and the Sutton Salt lake, sheep mustering activity, vistas of Strath Taieri, books/library, small conferences, wedding and Christmas party.
Timber
11 Middlemarch Gladbrook (hut) 1×SC- RB Timber
12 Middlemarch Jack’s Stone Cottage 1×SC New
Bathroom and toilet, fully equipped kitchen, lounge, TV, DVD player, laundry facilities, log burner, on cooler nights.
Both bedrooms with electric blankets and lighting.
Continental breakfast, OCRT, Middlemarch city, planted garden, fishing rods and golf clubs (left and right handed).
All 3 rooms have electric blankets, wireless internet, and lighting.
Home baking, continental breakfast, wine, OCRT, Middlemarch city, views of the Rock and Pillar Range, surrounding private garden (1.2 acre).
Timber, stone and concrete
14 Middlemarch Pukenangi Country Retreat 1×SC RB Kitchen, parlour,
fireplace.
Each room has bathroom, TV, hair dryer, under floor heating, wall heater, electric blankets, and heated towel rail.
Packaged foods, cooked or continental breakfast, wine and beer, OCRT, Middlemarch city, tour 6000 hectare Bare
Stone- timber
Page
442
App
endi
x Wood Station, watch farming demonstration appropriate to the season, visit Sutton Salt lake, local transport service along the OCRT way, booking services including shuttles, bike hire, accommodation, bag transfer, Taieri Gorge Railway.
15 Middlemarch Rose Cottage B&B 1×B&B New
A shared bathroom with gas heated shower, outdoor seating, TV, BBQ facilities, a fridge with chilled rainwater, tea and coffee making facilities.
An individual bathroom with gas heated shower, a private verandah, hair dryer, heating, electric blankets, lighting.
Food and beverages, OCRT, Middlemarch city, Middlemarch museum, visit historical heritage, rural garden, books and magazine, in conjunction with Mt Ida adventure tour, tennis racquets and balls, petanque, golf clubs and mountain bikes, fishing, walking, , visiting wild life watching, landscape painting and photography, cafe culture, local transportation and bag transfers between accommodation places.
Timber
16 Middlemarch Strathmore B&B 1×B&B RB A shared bathroom with under floor heating, BBQ, outdoor sitting, in ground
TV, coffee tea making facilities, heating and lighting.
Country style cooked breakfast, OCRT, Middlemarch city,
Stone
Page
443
App
endi
x swimming pool. visit historical heritage, local transportation along the OCRT.
Each room has tea making facilities, heater and lighting.
Food and beverages, OCRT, Middlemarch city, historic sites, landscape views.
Schist stone
18 Middlemarch The Farm Homestay 1×Homestay RB
Guest lounge with fire place, shared bathroom, shower, disabled access, washing machine, dryer, spa pool, VCR, Sky TV, DVD player, internet.
2 bedrooms with lighting and [heating].
Breakfast, OCRT, Middlemarch city, farm sheep, cattle and horse, landscape views, historic sites and buildings, local transportation.
Stone
19 Middlemarch The Lodge 1× B&B RB
A shared bathroom ( used by 2 bedrooms),fully equipped kitchen with micro-wave oven, dishwasher, toaster, coffee percolator, fridge/freezer, dining room, lounge, TV,DVD player, stereo, laundry facilities, 2 recreational area with gas BBQs.
2 bedrooms with ensuites (one with disabled access), heating, lighting.
Continental breakfast, OCRT, Middlemarch city, historic sites, landscape views, books and magazines.
Timber
20 Middlemarch The Rocks luxury Accommodation / Longford Retreat
Food and beverages, continental breakfast, wine, OCRT, Middlemarch city, historic sites, Sutton Salt lake, Taieri Gorge Train, landscape views, 7000acre Fine Wool Merino Station, farm tour, fishing, walk up to the Rock
Timber
Page
444
App
endi
x and Pillar range, Smooth Cone hill, riding mountain bikes, photography.
21 Middlemarch The Rocks luxury Accommodation / Braeside Cottage
1×B&B New Shared bathroom, kitchen, fireplace, TV, self-catering setup.
All bedrooms have heating and lighting.
Food and beverages, continental breakfast, wine, OCRT, Middlemarch city, historic sites, Sutton Salt lake, Taieri Gorge Train, landscape views, 7000acre Fine Wool Merino Station, farm tour, fishing, walking up to the Rock and Pillar range, Smooth Cone hill, riding mountain bikes, photography.
Schist stone
22 Middlemarch Trails End 2×SC New
Kitchenette, ensuite bathroom, BBQ facilities, a lounge with TV, spa pool.
Each bedroom has TV, tea and coffee making, heater and lighting.
Food and beverages, OCRT, Middlemarch, city, historic heritage, fishing, Macraes goldmine tour, Sutton Salt lake, Taieri Gorge Train.
Timber
23 Ngapuna Off The Trax 1×SC RB
Bathroom and toilet, kitchen with gas cooking, microwave and fridge, outdoor sitting area, BBQ area, sitting room with TV, fire place, washing machine and dryer.
Small kitchen, dining table wash room, (all with solar powered lighting), tank water, outside toilet (no artificial heating in the hub) , tennis table.
No individual services, lighting through the use of solar system. Big hut can be subzero in winter.
OCRT, the Rock and Pillar conservation area, recreational activities- tramping, mountain biking, rock climbing, landscape photography, cross-country skiing.
Timber, corrugated iron
25 Macraes Flat Stanley’s Hotel 1×Hotel RB
Shared bathroom and toilets, kitchen (used by hotel to prepare food for visitors), dining with fire place and TV.
All rooms have heating and lighting, one unit with own bathroom.
Fresh food, beverages, wine and beer, continental breakfast, OCRT, hotel’s garden, visit Macraes Flat gold mining heritage tour, visit historic village, scenery, walking, photography, local transportation.
Schist stone
26 Hyde Otago Central Hotel B&B & Hyde café (B&B)
1×B&B RB
4 bedrooms with shared bathrooms and toilets, lounge room, TV, camping area with shared shower.
4 double rooms with ensuites,3 bedrooms with disabled access. 2 bedrooms have coffee and tea making facilities, all rooms with heating and lighting.
Food and refreshments OCRT, the historic Macraes Flat gold mining town, the old Golden Point mine in Deepdell Creek.
Timber
27 Hyde Otago Central Hotel B&B & Hyde café (camping)
1×Camping
28 Hyde Emerald Hills Country (guesthouse) 1×B&B New
3 bedrooms with shared bathrooms and separate toilet, kitchen with oven, microwave, fridge freezer, living room, washing machine, BBQ and TV.
All rooms have heater, electric blanket, hairdryer and toiletries and lighting,
Food-wine and beer, continental breakfast, oven fresh baking, OCRT,4 acres private country garden, magazines, farm tours,
Stone and timber
Page
446
App
endi
x
29 Hyde Emerald Hills Country (cottage) 1×B&B New
Kitchens with oven, microwave, fridge freezer, living room, washing machine, BBQ and TV.
2 bedrooms with ensuite, 1 bedroom with private bathroom and toilet, all rooms have heater, electric blanket, hairdryer and toiletries and lighting.
Kitchen with oven, microwave, fridge and freezer, claw foot bath, living room, log burner with wood supplied, BBQ, laundry with washing machine.
3 furnished bedrooms with heating and lighting.
Food and beverages, beer and wine, OCRT, surrounding farm tours, verandah, garden, visiting historic sites and photography, fishing and swimming, tours of goldmine, walking, local transportation.
OCRT, visiting historic buildings and sites, tunnels and bridges, landscape views, walking and picnic.
Restored buildings and infrastructures made from local materials
32 Kokonga Kokonga Lodge 1×B&B New
Dining room, full laundry facilities, tea, coffee making area, TV, internet access.
All rooms with bathroom, hairdryer, toiletries, heater and lighting.
Local food, wine, beer, non-alcoholic drinks, OCRT, rural art deco town of Ranfurly, gold mining heritage exploring, rural and garden views, biking, fishing, 4WD tour, painting and photography, curling and winter sports in Naseby.
Timber
33 Kokonga Kokonga Cottage 1×SC New
Fully equipped kitchen, two bedrooms share a bathroom with bath and shower, laundry, dining
Two bed rooms with heating and lighting.
Local food, wine, beer, non-alcoholic drinks, OCRT, rural art deco town of
Timber
Page
447
App
endi
x room, TV. Ranfurly, gold mining heritage exploring, rural and garden views, biking, fishing, 4WD tour, painting and photography, curling and winter sports at Naseby.
34 Kokonga 2Wheel Backpackers 1×Bp New
Full kitchen facilities, shared bathroom and toilet facilities, dining room, lounge, outdoor furniture, TV, BBQ.
Bunkroom (4× single bed) and 1 private room with heating and lighting.
Continental breakfast, OCRT, rural art deco town of Ranfurly, gold mining heritage exploring, Taieri river, landscape views, fishing, waking, painting and photography quiet and peaceful place.
Timber
35 Pareau/Styx Styx Hotel Privet holiday-home RB NA NA
Open for public visit, New Zealand’s only example of a scroll plain wetland, a common system in Australia, known there as billabongs. Privet holiday-home does not function as OCRT accommodation service.
Stone and timber
36 Patearoa Patearoa Hotel + 7 Chalets 1×Hotel RB
Shared bathrooms and toilets, dining room, 7 historic chalets.
1 bedroom has en-suite bathroom, all 4 rooms with lighting and [heating].
Food and breakfast, OCRT, exploring historic sites and buildings, walking.
Red brick and timber
37 Waipiata Historic Waipiata Country Hotel 1×Hotel RB
Restaurant, country style bar, guests lounge, disabled facilities, BBQ,
All rooms with either en-suites or private bathrooms, heating and lighting.
Food and beverages, wine and beer, OCRT, Mud brick
walls and
Page
448
App
endi
x TV. newspapers and magazines, chat with locals, discover local sights which include the historic Hamilton’s goldfields cemetery
timber
38 Waipiata Komako Peonies & Cottage Garden (the station building)
1×B&B New Fully equipped kitchen, laundry facilities, BBQ.
All bedrooms with separate shower, private toilet, electric blankets, heating and lighting.
Food, continental breakfast, OCRT, historic Hamilton’s goldfield and cemetery, the old Waipiata sanatorium, garden views, curling at Naseby, fishing and hiking.
Timber
39 Waipiata Komako Peonies & Cottage Garden (the bank)
1×B&B New Fully equipped kitchen, laundry facilities, BBQ.
All bedrooms with separate shower, private toilet, electric blankets, heating and lighting.
Food, continental breakfast, OCRT, historic Hamilton’s goldfield and cemetery, the old Waipiata sanatorium, garden views, curling at Naseby, fishing and hiking.
Concrete
40 Waipiata Komako Peonies & Cottage Garden (the tool shed)
1×B&B New Fully equipped kitchen, laundry facilities, BBQ.
All bedrooms with separate shower, private toilet, electric blankets, heating and lighting.
Food, continental breakfast, OCRT, historic Hamilton’s goldfield and cemetery, the old Waipiata sanatorium, garden views, curling at Naseby, fishing and hiking.
Timber
41 Waipiata Peter’s Farm Lodge – the homestead 1×Homestead RB
Full kitchen facilities, 2 outdoor bathrooms and toilets, laundry, washing
All bed rooms with heater and lighting.
Food, continental breakfast, OCRT, Rock (from
local quarry-
Page
449
App
endi
x machine and dryer, BBQ. exploring historical areas, free kayaks, gold pans, fishing rod, exploring historical area.
mud brick- limited milled timber
42 Waipiata Peter’s Farm lodge – cabins 1×Homestead New
Country size-kitchen, [shared bathroom and toilet], dining room, metro log fire, guests lounge, TV, BBQ and picnic area outside or under the sheltered verandah.
All bedrooms with electric blankets, heaters, and lighting.
OCRT, the Waipiata township, the Taieri river, surrounding sheep and beef farm, farm tour, gold panning, kayaking, fishing local transportation along the rail trail.
Mud brick and schist stone
44 Waipiata Waipiata Cottage 1×B&B RB Equipped kitchen, bathroom and toilet, lounge, fire place.
All bedrooms have heating and lighting.
Wine, OCRT, the Waipiata township, the Taieri river, scenery, walking.
Timber
45 Waipiata Waipiata Motel 1×Motel New -
All bedrooms have private bathroom with heater and hair dryer, wall heater and lighting, small kitchenette with microwave and coffee and tea making, TV.
Continental breakfast, wine and beer, OCRT, scenery, visiting historic places, walking and photography.
Timber and glass
46 Ranfurly Plains Retreat, Ranfurly Hospital 1×Hotel RB Two bathrooms, living
room. All bedrooms have heater and lighting.
Continental breakfast, wine and beer, OCRT, surrounding garden, art deco town of
Red brick
Page
450
App
endi
x Ranfurly, historic villages such as Wedderburn, Naseby, St Bathans, tour to visit historical places and landscape, viewing scenery, local transportation along the OCRT.
1 ensuite and 1 private bathroom, all bedrooms have heater and lighting.
Continental breakfast, wine and beer, OCRT, surrounding garden, art deco town of Ranfurly, historic villages such as Wedderburn, Naseby, St Bathans, tour to visit historical places and landscape, viewing scenery, local transportation along the OCRT.
Timber
48 Ranfurly Annerly House 1×B&B New
Kitchenette with refrigerator, coffee and tea making, guest bathroom, children’s playground, laundry with washing machine, courtyard garden, guest lounge with balcony, verandah, CD player, TV and video cassette player.
All bedrooms with heating and lighting.
Food and continental breakfast, home baking, OCRT, art deco town of Ranfurly, historic villages such as Wedderburn, Naseby, St Bathans, landscape views, books and magazines, walking, ideal stop for horse trekkers.
Timber
49 Ranfurly Hawkdun Lodge 1×Motel style New Equipped kitchen, gas fire, outdoor BBQ for dining and socializing
Each suite has bathroom and toilet, cooling, coffee and tea making, microwave, TV,
OCRT, Ranfurly, historic villages such Assumed
concrete,
Page
451
App
endi
x with other guests, indoor spa room with a large (8person) spa pool, laundry with a tub, two washing machine, two dryers, internet access, heat pump for air conditioning for summer and heating for winter, 45” TV (used for conference).
lighting. as Wedderburn, Naseby, St Bathans conference facilities ,tour around the historic gold mining sites and lunch in one of historic pubs, garden tour (Clachanburn country garden), high country experience (full day and half day) ,4 wheel drive excursion.
wood
50 Ranfurly Moyola Art Deco Guest House 1×SC RB
Equipped kitchen, coffee machine, 1 spa bathroom with shower and 1 standard bathroom, gas fire, laundry with washing machine and dryer, covered outdoor spa pool (up to 8 persons), outdoor BBQ area, guest computer, a communal large plasma TV.
All rooms with private sky TV, heating and lighting.
Food and beverages, continental breakfast, OCRT, art deco town of Ranfurly, art deco museum, art deco weekend, guided art deco walks, historic tour in the art deco car ( 1949 Chevy), 4wd high country tours, garden tour horse treks, mustering experiences, golf, fishing, mountain biking, curling and ice sport (at Naseby), railway station museum, early settlers museum.
Red brick
51 Ranfurly Old Post Office (B&B) 1×B&B RB
Full kitchen facilities for self catering, showers, log fire, laundry/ launderette on site, tea and coffee
All rooms are on a shared facilities basis, heated by communal log fire, lighting.
OCRT, art deco town of Ranfurly, Naseby (curling, ice luge and
Red brick and concrete
Page
452
App
endi
x making facilities, BBQ. ice skating in winter), DVD hire, books and games, exploring the Oteake conservation park, exploring the painters and photographers’ paradise.
52 Ranfurly Old Post Office (backpackers) 1×Bp RB
Full kitchen facilities for self catering, showers, log fire, laundry/ launderette on site, tea and coffee making facilities, BBQ.
All rooms are on a shared facilities basis, heated by communal log fire, lighting.
OCRT, art deco town of Ranfurly, Naseby (curling, ice luge and ice skating in winter), DVD hire, books and games, exploring the Oteake conservation park, exploring the painters and photographers’ paradise.
Red brick and concrete
53 Ranfurly Ranfurly Holiday Park – motel double studio
1×Motel New
kitchen with cooking facilities, fridge, microwave, gas cook top, electric oven, bathroom with shower, toilet and hand basin , laundry with gas hot water, tea and coffee making facilities, BBQ, wireless internet and TV.
All bed rooms with heating and lighting.
Continental breakfast, OCRT, local events (February – A & P show, art deco festival, rail trail Duathlon, goldfields Cavalcade, March – Waipiata Ute Muster, April – Ranfurly Easter markets, Bards Ballads & Bulldust, May – duck shooting season opens, June – Brass Monkey motorbike rally, July – Naseby ice
Timber
54 Ranfurly Holiday Park – motel studio (sleeps 4)
1×Motel New
Kitchen with cooking facilities, fridge, microwave, gas cook top, electric oven, bathroom with shower, toilet and hand basin, laundry with gas hot water, tea and
All bed rooms with heating and lighting. Timber
Page
453
App
endi
x coffee making facilities, BBQ, wireless internet and TV.
festival, Highland Ball August – 100% pure winter games, October – labour weekend markets, vintage car swap meet) , Hayes engineering works, rail trail adventure tours, Taieri Gorge railway, Otago fish & game, Otago goldfields, bike-car and coach hire.
55 Ranfurly Ranfurly Holiday Park – motel studio (sleeps 5)
1×Motel New
Kitchen with cooking facilities, fridge, microwave, gas cook top, electric oven, bathroom with shower, toilet and hand basin, laundry with gas hot water, tea and coffee making facilities, BBQ, wireless internet and TV.
All bed rooms with heating and lighting. Timber
56 Ranfurly Ranfurly Holiday Park – one bedroom motel unit
1×Motel New
A kitchen with cooking facilities, fridge, microwave, bathroom with shower, toilet and hand basin, TV.
All bed rooms with heating and lighting. Timber
57 Ranfurly Ranfurly Holiday Park – double cabin 1×SC New
Communal kitchen and bathroom with gas hot water, wireless internet.
All bed rooms with heating and lighting. Timber
58 Ranfurly Ranfurly Holiday Park – cabin (sleeps 4)
1×SC New Communal kitchen and bathroom with gas hot water, wireless internet.
All bed rooms with heating and lighting. Timber
59 Ranfurly Ranfurly Holiday Park – cabin (sleeps 5)
1×SC New Communal kitchen and bathroom with gas hot water, wireless internet.
All bed rooms with heating and lighting. Timber
60 Ranfurly Ranfurly Holiday Park – two bedroom cabin(sleeps 8)
1×SC New Communal kitchen and bathroom with gas hot water, wireless internet.
All bed rooms with heating and lighting. Timber
61 Ranfurly Ranfurly Holiday Park – powered sites (8 person)
1×Camping -
Sites are sheltered, with level ground and heaps of room to spread out, use of the communal cooking, bathing and laundry facilities.
- - -
62 Ranfurly Ranfurly Holiday 1×Camping - Sites are well sheltered, - - -
Page
454
App
endi
x Park –non- powered sites (8 person)
with level ground and heaps of room to spread out, use of communal cooking, bathing and laundry facilities.
63 Ranfurly Ranfurly Motel 1×Motel New Fully equipped guest laundry, vanity, wireless internet, gas BBQ, 21"TV.
All six unites have kitchen with cook top / full stove, microwave, ensuite with shower and toilet. All bedrooms with electric blanket, heating, lighting and Sky TV.
Food and beverages, breakfast , OCRT, motel is one of Ranfurly’s art deco history and cultural themes, Ranfurly swimming pool, Naseby curling, Ranfurly bike hire, Ranfurly’s own art deco gallery, high country 4WD tour, visiting goldfields, tour fishing, walking and mountain biking.
Assumed timber
64 Ranfurly Ranfurly Lion Hotel 1×Hotel RB
Shared facilities (showers and toilets for 8 rooms), self service TAB & gaming, coin-operated washing machine and dryer, wireless internet, sports bar with 60-inch TV.
Ensuite for 7 rooms (shower and toilets), all rooms with heating and lighting.
Food and breakfast, wine and liquers, OCRT, cultural events (the Ranfurly art deco weekend held each year), visiting landscapes and scenery, TONI’s TIKI tours.
Fully equipped country kitchen, shower and toilet, and outdoor spa pool, laundry with washing machine, paddocks, log burner, TV and DVD player.
All bedrooms with heating and lighting.
Continental breakfast, OCRT, 8000 hectare high country sheep station, library of movies including kid’s favorites, farm tour.
Timber
68 Wedderburn Wedderburn Lodge and Cottages (lodge) 1×SC RB
Fully equipped kitchen with stove, microwave, fridge, toaster, shared bathroom and toilet, BBQ, heat pump, hot water bottles, TV.
All bedrooms with heating and lighting.
Continental breakfast, OCRT, historic sites and buildings, farm tours, 9 hole golf course, fishing, off trail tours, history (DVD) available in the Red Barn.
Red brick and timber
69 Wedderburn
Wedderburn Lodge and Cottages (1 large cottage and 2 small cottages)
3×SC New
All cottages have their own kitchenette with toaster, jug, microwave, bathroom and toilet, verandah, (one cottage has wheelchair access), tea and coffee making facilities, TV.
All bedrooms with heating and lighting.
Continental breakfast, OCRT, landscape view, farm tour, off trail tours, golf and fishing.
Timber
70 Wedderburn Wedderburn Tavern 1×B&B RB Sitting room, log burner, [bathroom and toilet], BBQ, TV, DVD player.
Bedrooms with lighting. (N/A heating system).
Food and beverages, fruit, beer and wine, OCRT, basketball, 9-
Mud brick- sun-dried mud brick
Page
456
App
endi
x 71 Wedderburn Wedderburn Tavern 1×Camping(Tent) - Tent sleeps 6 guests. - hole golf (clubs for hire), historic sites and outstanding landscapes, DVDs.
x and tennis, Art, Sculpture & Gardens (studio gallery), Ballarat cottage (art museum), Naseby town garden, local café, fishing and hunting, Otago tour fishing, gold panning, golf, 4WD & horse trekking.
76 Naseby Larchview Holiday Park (tourist flat) 1×SC New
Adventure playground, adjacent swimming dam, coin operated shower, coin operated washing machine and dryer, dump point for van waste, caravan storage, bike hire, toboggan hire, wheat bag hire, hot water heated by solar energy, BBQ, wireless and kiosk internet access, free view TV in the main amenity block.
Fully equipped kitchen, shower and toilet, heated by log burner.
77 Naseby Larchview Holiday Park (miners cottage)1
2×SC RB Fully equipped kitchen, modern shower and toilet, log burner, heater and lighting.
Timber
78 Naseby Larchview Holiday Park (10 chalets) 10×SC New Each chalet has heater, jug,
toaster, crockery lighting. Assumed timber
79
Naseby
Larchview Holiday Park (3 cabins)
1×B&B New
Heaters, occupants supply crockery, utensils.
-
80 Naseby
Larchview Holiday Park (48 powered sites)
48×camping - These sites include 4 caravans. -
81 Naseby Larchview Holiday Park (24 non-powered sites)
24×Camping - 24 available -
82 Naseby Mountain View (cottage) 1×SC New
Equipped kitchen, living area with log fire, laundry facilities.
Each bedroom has ensuite bathroom, electric blanket, heater and lighting.
Continental breakfast, OCRT, Naseby, historical sites and buildings, indoor curling all year, outdoor curling and luge from June to September, mountain
Timber
83 Naseby Mountain View (2 ensuite units) 1×B&B New
Each unit with tea and coffee making, microwave, fridge, BBQ and TV.
Ensuite bathroom, each bedroom with electric blanket, heater and lighting.
Timber
84 Naseby Mountain View (tourist flat) 1×B&B New Limited cooking
facilities. , Ensuite bathroom, each bedroom with hairdryer heater Timber
Page
458
App
endi
x and lighting. biking, hiking, forest walks.
85 Naseby Mountain View (the house with 3 bed rooms)
1×SC New Fully equipped kitchen, laundry, verandah, heat pump.
Ensuite bathroom, separate toilet equipped with disabled facilities, each bedroom with hairdryer, heater and lighting.
Timber
86 Naseby Naseby Trail Lodge (6 one bedroom units)
1×SC New
Each one unit has private timber deck verandah, Italian leather sofa, European style kitchen, central heating, iron and ironing board, internet access, microwave, toaster, heated towel rail, TV, telephone
6 ensuite bathrooms with under floor heating, wheelchair access bathroom (unit 1), each bedroom has reading lamps, radio alarm clock, and hair dryer and lighting.
Continental and/or cooked breakfast, OCRT, Naseby, year-round, curling, winter lugeing, winter ice skating, year round mountain biking, golf, river and lake fishing, 4WD adventures, horse treks.
Timber- aluminum façade, wooden joinery
87 Naseby Naseby Trail Lodge (2 two bedroom units)
1×SC New
Each units has kitchen with microwave, cooking hob, dishwasher, toaster, kettle, fridge , central heating, iron and ironing board, separate lounge with sofa (coverts to innersprung double bed), TV, internet access.
Each unit has separate bathroom with under floor heating, wet-area shower, heated towel rail, hair dryer, toiletries. Each bedroom has reading lamps, telephone, radio alarm clock and lighting
Continental and/or cooked breakfast, OCRT, Naseby, year-round, curling, winter lugging, winter ice skating, year round mountain biking, golf, river and lake fishing, 4WD adventures, horse treks.
Locally made mud-brick
88 Naseby Old Doctor’s Residence 1×B&B RB
Guest lounge with tea and coffee making facilities, TV, DVD, broadband access.
Food ,special breakfast, homemade baking, wine, OCRT, the gold fields , magazines, a library, music and games, curling,4WD tour, mountain biking, fishing, golf, day walks in the Manitoto,
Clay brick, timber
Page
459
App
endi
x wildflower walks, horse riding.
89 Naseby Royal Hotel (hotel) 1×Hotel RB
Bar and cafe, large open fire, Sky TV, outdoor patio, banquet room (used for meetings and conferences).
Each bedroom has bathroom and toilet (one suitable for disabled), heating and lighting.
1×Bp New Kitchen, toilet, bathroom, outdoor cooking and eating area.
Each bedroom heating and lighting.
Food and beverages, OCRT, curling on the Ida Dam, Hayes Engineering, the Brass Monkey motorcycle rally, farm tours, gold fields heritage, hunting and fishing, garden tours.
Timber
92 Oturehua Crowsnest Accommodation (2 cabins)
2×SC New Both cabins have small kitchen, toilet and bathroom.
Bothe cabins with heating and lighting. Timber
93 Oturehua Crowsnest Accommodation (the Bach).
1×SC New Shared shower with the lodge.
The Bach has a private kitchen, toilet, heating and lighting. Timber
94 Oturehua
Crowsnest Accommodation (tent sites and powered sites)
1×Camping -
Guest toilet, bathroom, laundry facilities, outdoor bath, hot tub (does not use electricity have a pump or need chemicals), BBQ area.
- -
95 Oturehua Hawk Rock Cottage 1×B&B New
Full equipped kitchen with freezer, fridge, dishwasher, microwave and toaster, fireplace, shower, fire wood supply, washing machine, iron, BBQ, TV& DVD player, cell phone coverage.
3 bedrooms have hair dryers, heating and lighting.
Continental breakfast, OCRT, natural views and landscape, (children welcome), fishing, Oturehua local village, historic buildings, historic
Stone
Page
460
App
endi
x Hayes Engineering, Golden progress mine (heritage), 4WD tour.
96 Oturehua Hill Creek Hideaway 1×B&B New Shared bathroom with separate shower.
Bedrooms with lighting and heating.
Continental breakfast, food, OCRT, Oturehua local village, historic sites and buildings, views of Hawkdun and Rough Ridges ranges, local transportation.
Assumed concrete
97 Oturehua Inver Lair lodge 1×B&B New
Full kitchen, wheelchair friendly facilities, outdoor spa pool, fire place, BBQ, TV and DVD player.
6 stylish ensuite rooms with bathroom, toilet, heating and lighting.
BBQ packed lunch (meats, bread & salad), OCRT, book and DVDs, curling, ice luge, 4WD tour, hunting and fishing, golf.
1×B&B New Indoor heated pool, spa, sunroom/ reading room, games room. Each cottage has kitchen, fire place and TV.
Each cottage with private bathroom and toilet, heating, lighting.
OCRT, side trips to Naseby and St Bathans, access to nearby places, activities and attractions books and magazines, touring, trekking, fishing, hunting.
1×SC New Each cottage with private bathroom and toilet, heating, lighting.
Timber
100 Oturehua Oturehua Lodge & Cottage (2 × studio cottage)
1×SC New Each cottage with private bathroom and toilet, heating, lighting.
Timber
101 Oturehua Oturehua Tavern and Self Contained 1×SC
RB (tavern) New SC
Kitchen sink and crockery, shower, BBQ. Heating and lighting
Home cooked meals, continental breakfast, vegetable, beverages (alcoholic and non-alcoholic), beer garden, OCRT, Hayes engineering, curling, fishing, historic gold mine site.
Container- cottage
Page
461
App
endi
x
102 Oturehua The Mill B&B 1×B&B RB Separate lounge with Sky TV, twin room with shared facilities.
Two bedrooms with claw foot bath and a shower, all bedrooms with heating and lighting.
Full country breakfast, OCRT, [using Oturehua attractions].
Quarried stone
103 Oturehua The Old Shop B&B 1×B&B RB Full bathroom, sitting room with tea and coffee making facilities.
Bedrooms with heating and lighting.
OCRT sheltered garden, central Otago’s summer skies, Hayes Engineering works, gold mine sites.
Assumed timber
104 St Bathans Cambrian Station 1×SC RB
Fully equipped kitchen including fridge/freezer, microwave, stove/oven, fully facility bathroom, heaters and hair dryer, TV, radio, stereo, washing machine, BBQ, (firewood provided), separate laundry area with extra toilets and showers.
Bedrooms with heating and lighting.
OCRT, Otago gold fields, St Bathans historic mining township, Blue lake, games and books.
Continental breakfast, meals are available at Vulcan hotel, OCRT, explore the township and its buildings, the remnants of 19 century gold mining, Oteake conservation park, neighbouring historic towns, ice skating and curling at Naseby or Alexandra, art deco architecture at Ranfurly, visit Ophir and Daniel O’Connell memorial bridge, Blue lake.
Timber
106 St Bathans Constable Cottage & Gaol (gaol) 1×SC RB Small kitchen, TV. Heating and lighting. Timber
Page
462
App
endi
x
107 St Bathans Lombardy Cottage 1×SC RB
Kitchen- sitting room , two bathrooms, under floor heating, an open fire, coal range and oil-fired heater, a laundry facilities, gas BBQ, an outdoor hot tub, stocked woodshed, high speed internet.
Bedrooms with heating and lighting.
OCRT, wine and beer, an in-season vegetable garden, a book-lined study, scenery, historic sites and buildings, kayaking, mountain biking.
Stone
108 St Bathans Lombardy Cottage (caravan) 1×SC New -
4.5m , 1977 Zephyr caravan which sleeps four (two singles and a double berth), with an additional queen bed
Using shared products and attractions which are available at the cottage.
- -
109 St Bathans St Bathans B&B 1×B&B New Sitting room with lounge, wood burner.
All bedrooms have bathroom, toiletries, tea/coffee making facilities, free DVDs, heating and lighting. 2 rooms have private balcony.
Food and full cooked breakfast, OCRT, the village of St Bathans, Otago goldfields’ park, historic precinct with the original buildings, seasonal vistas, art works for sale, kayaking, horse riding, boating, fishing, rabbit shooting, swimming, Triathlon track, photography, ice skating, falls dam.
Timber
110 St Bathans Vulcan Hotel 1×Hotel RB
Self-catering kitchen, shared bathroom facilities, a deep bath, and veranda, TV / CD player.
All bedrooms with heating and lighting.
Food and breakfast, OCRT, Blue lake, lunar landscape, historical buildings and sites, walking, photography share, using products and attraction which are available at adjacent towns and
Mud brick
Page
463
App
endi
x villages.
111 Ida Valley Parkside Farm Stay 1×B&B New Shared bathroom facility, sleep-out with a double and single bed.
All bedrooms with heating and lighting.
Farm meals, OCRT, historic site and buildings, country garden, scenery, Ida valley, 816 ha farm, farming activities, farm tour, walking , fishing curling (at Naseby), mountain bike, golf, photography.
Assumed timber
112 Auripo Poolburn Hotel 1×Hotel RB
Dining room, shared garden bar, 3 shared bathrooms, outdoor sitting with BBQ area.
Bedrooms with lighting. (Heating information N/A).
Food, wine and beer, OCRT, Poolburn Gorge, historic sites and buildings, photography, landscape view, using products and activities at adjacent towns and villages such as Omakau and Ophir and Naseby.
Ensuite (one room), private shower and toilet, heating and lighting.
Continental breakfast, home cooked dinner, OCRT, fishing, curling, skating, tour Hayes historic engineering works, visit gold mine, historic store and museum (Oturehua) Naseby and Ophir.
Mud brick
Page
464
App
endi
x
114 Becks White Horse Hotel 1×Hotel RB
7 rooms with shared facilities including bathrooms and toilets, 2 sitting rooms, dining room.
All bedrooms with heating and lighting.
Food, continental breakfast, wines, OCRT, visiting historical sites and buildings, adjacent villages and town, fishing, curling, horse riding, ice skating, scenery and photography, local transportation along the OCRT.
A mixture of timber and stacked stone schist slabs with corrugated iron roof.
115 Lauder Big Sky Cottage 1×SC RB
Equipped kitchen (electric cooker and oven, fridge freezer, microwave), bathroom with shower, heated towel rail and heater, hair dryer, log burner, washing machine and ironing facility, veranda, sheltered sun-trap garden, TV, DVD player, CD/radio, tape player.
All bedrooms with electric blanket, oil filled electric heater and lighting.
Continental breakfast, OCRT, wine, books, maps and local information, selection of CDs, DVDs and tapes, historical bridges, historic sites and buildings, walking, fishing, ice skating and curling at Naseby, landscape view and photography.
Mud brick
116 Lauder
Lauder Rail Trail School and Milmor Cottage (3 school ensuite rooms)
1×B&B RB
Kitchen, spa pool and school garden (share with other Lauder Rail Trail School and Milmor accommodation options), TV and wireless internet.
Each of 3 ensuite rooms with bathroom and toilet, hairdryer, electric blankets, heating and lighting.
Continental breakfast, home baking, wine and beer, OCRT, library , art room, historic bridges and tunnels, historic adjacent sites, garden tour, villages and towns, horse riding, goldfield mining, fishing, golf, curling
Timber
117 Lauder
Lauder Rail Trail School and Milmor Cottage (studio cottages)
1×SC New
Kitchen, spa pool and school garden (shared with other Lauder Rail Trail School and Milmor accommodation options), TV and wireless internet.
All cottages with private bathroom and toilet, all bedrooms with heater, electric blankets, hair dryer and lighting.
Timber
Page
465
App
endi
x
118 Lauder
Lauder Rail Trail School and Milmor Cottage (standard rooms)
1×SC New
Kitchen, spa pool and school garden (share with other Lauder Rail Trail School and Milmor accommodation options), TV and wireless internet.
The cottage with private bathroom and toilet, all bedrooms with heater, electric blankets, hair dryer and lighting.
and ice skating at Naseby, landscape views and photography , local transportation along the OCRT.
Timber
119 Lauder Lauder Rail Trail School and Milmor Cottage (cabin)
1×SC New
Small kitchen, use shared bathroom and toilet, using shared facilities with other Lauder Rail Trail School and Milmor accommodation options, TV and wireless internet.
The cabin with heater, electric blankets, and lighting. Timber
120 Lauder
Lauder Rail Trail School and Milmor Cottage (Milmor cottage)
1×SC New
Equipped kitchen, shared bathroom, complimented with a second toilet, hairdryers, TV and wireless internet.
3 bedrooms with heating, electric blankets and lighting. Timber
121 Lauder Lauder Store B&B (the old store) 1×SC RB
A kitchen, a shared fully equipped bathroom, guest lounge, outdoor entertaining area with BBQ, multi fuel log burner, electric heater (used for guest lounge), disabled facilities, play ground for children, laundry facilities.
All bedrooms have electric blankets, bedside lights, electric wall heater and lighting.
Food and beverages, OCRT, tours to various historical gold mining sites including Matakanui, Cambrian, St Bathans Naseby and Falls Dam, historic bridges and tunnels, horse riding, fishing, golf course, hiking, mountain biking, winter sports and curling at Naseby, scenery a photography, 4WD tour.
Mix stone and timber
122 Lauder Lauder Store B&B (Storekeeper house) 1×SC New
A kitchen, a shared fully equipped bathroom, guest lounge, outdoor entertaining area with BBQ, multi fuel log burner, electric heater (used for guest lounge), disabled facilities, play ground for children, laundry facilities.
All bedrooms have electric blankets, bedside lights, electric wall heater and lighting.
Timber
Page
466
App
endi
x
123 Lauder Lauder Store B&B (Arkwrights Snug ) 1×SC New
A kitchen, a shared fully equipped bathroom, guest lounge, outdoor entertaining area with BBQ, multi fuel log burner, electric heater (used for guest lounge), disabled facilities, play ground for children, laundry facilities.
All bedrooms have electric blankets, bedside lights, electric wall heater and lighting.
Timber
124 Lauder Lauder Hotel 1×Hotel RB Shared bathroom and separate toilet facilities.
All bedrooms with heating and lighting.
Food and beverages, continental breakfast, OCRT, historical gold mining sites , historic bridges and tunnels, horse riding, fishing, golf course, hiking, mountain biking, winter sports and curling at Naseby, scenery and photography.
Timber with concrete plaster
125 Lauder Lauder Burn House B&B 1×B&B RB
Breakfast room, guest lounge with fireplace, 1 shared bathroom and toilet.
2ensuite rooms with bathroom and toilet and 1 bedroom with 2 single beds with access to the veranda and private lounge. All bedrooms with electric blankets and lighting.
Continental breakfast, food and beverages (available from adjacent hotels),OCRT, small library, private garden, 6 acre surrounding farm, farm tour, visiting historic sites and buildings, restored bridges and tunnels, landscape views, fishing, curling and ice
Brick
Page
467
App
endi
x skating at Naseby.
126 Lauder Lauderdale Estate (cottages) 1×B&B RB
4 double with shared bathrooms, 1 twin with shared bathroom, living room, commercial kitchen used for events.
2 double en suite, 1 twin en suite with bathroom and toilet. All bedrooms with heating and lighting.
OCRT, food and beverages, wine, beer, surrounded by farmland , separate 20 acres of park used as sitting area, farm tour, exploring historic sites and buildings, fishing, mountain biking, curling and winter sports at Naseby , landscape views and photography, a centre for wedding celebration and parties.
Stone and mud brick (original buildings)- 100 year old wooden chalets moved from Pleasant valley
127 Lauder Muddy Creek 1×SC RB
5 bed rooms, full kitchen with gas stove, electric wok, microwave and fridge ,several resting/ lounging spaces, two shared toilets /bathroom with under floor heating, 5-person sauna, an open fire and a garden room, a piano, TV and landline phone.
All bed rooms with heating and lighting.
Farm made food and vegetables, OCRT, farm tour, exploring historic sites and buildings, fishing, mountain biking, curling and winter sports at Naseby, walking, landscape views and photography.
Mud brick
128 Lauder Pedal Inn 1×SC RB
Two cottages each has kitchenette that has microwave, fridge and sink, coffee and tea making facilities.
Two cottages each has ensuite bathroom, one with disabled access. All bed rooms with heating and lighting.
Continental breakfast and/or farm fresh eggs, OCRT, 485 ha farm, farm tour, exploring historic sites and buildings, fishing,
Assumed timber
Page
468
App
endi
x mountain biking, curling and winter sports at Naseby , landscape views and photography.
129 Moa Creek Bonspiel Station & Old Moa Creek hotel 1×Hotel New
4 rooms plus sleep out, Spa and sauna, two bathrooms, a lounge and a separate bar area are all fully furnished, using 2 open fire places for warming the rooms.
Sleeping bags required.
OCRT, heritage exploring, walking, mountain biking, riding the Dunstan Trail, gold panning, river swimming, canoeing, fishing, hunting, 4WD driving. Chinese miner’s hut (as accommodation without electricity and running water).
Stone
130 Poolburn Poolburn Hotel 1×Hotel RB Three shared bathrooms, dining room, garden bar, BBQ.
8 rooms with heating and lighting.
Food, wine and beer, OCRT, exploring historic sites and buildings, visiting Poolburn dam (film site of Rohan), mountain biking, road biking, kayaking, fishing, curling and ice skating at Naseby.
Timber
131 Poolburn Solandra Lodge country style B&B 1×B&B New
Self contained kitchen with microwave, oven, full size fridge freezer, dishwasher, 1 shared bathroom and a separate toilet with under floor heating, 1 kitchenette, two lounges, 2 heat pumps, TV/ DVD, projector,
All bedrooms with under floor heating and lighting.
Food, wine and beer, OCRT, exploring historic sites and buildings, visiting Poolburn dam (film site of Rohan) , mountain biking, road biking, kayaking,
120sqm Timber
Page
469
App
endi
x surround sound. fishing, curling and ice skating at Naseby, bike hire.
132 Ophir Blacks Hotel 1×Hotel RB Bar, 100 square metre deck, dining room.
All 10 rooms with ensuite (bathroom and toilet), heating, lighting, two rooms have disabled facilities.
Food and bar meals, wine, beer, OCRT, beer garden, Naseby, Ranfurly and St. Bathans, visit the Daniel O'Connell bridge, Manuherikia river, fish for trout, Ophir walk, 4WD tracks, golf and tennis, local transportation along the OCRT.
Timber
133 Ophir Flannery Lodge 1×B&B New
Full kitchen, shared bathroom and toilet (for bunkrooms), BBQ, wireless internet, laundry, TV.
Double rooms, both with ensuites, bunkrooms, four or five to a room, backpacker style, all rooms with heating, lighting.
Food, vegetables, wine and beer, OCRT, books, Naseby, Ranfurly and St. Bathans, visit the Daniel O'Connell bridge, Manuherikia river, fish for trout, Ophir walk, golf and tennis, local painting, photography workshop, tour (The Best Bits tour), fishing.
Food, vegetables, wine and beer , OCRT, books, Naseby, Ranfurly and St. Bathans, visit the Daniel O'Connell bridge, Manuherikia
- -
Page
470
App
endi
x river, fish for trout, Ophir walk, golf and tennis, local painting, photography workshop, tour (The Best Bits tour), fishing.
135 Ophir Millfield Cottage 1×SC New
Fully furnished kitchen, fridge/freezer, dishwasher, shower, toilet facilities, laundry, a log burner, lounge and dining area, BBQ on the deck outside, Sky TV, DVD player.
All bedrooms with heating and lighting.
Continental breakfast, OCRT, rural views, 20 minutes from Alexandra, and walking distance from historic Ophir and Omakau township with shops, pub, swimming pool and a golf course, fishing and swimming in Manuherikia river.
Timber
136 Ophir Ophir Bridge B&B 1×B&B New
A shared bathroom with under floor heating, complimentary Nellie Tier toiletries, hairdryer.
2 bedrooms each with access to its own outdoor area,, heating and lighting.
Continental breakfast with homemade products (yoghurt, fresh fruits, muesli etc), beverages, OCRT, Ophir Village walk, Matakanui and Drybread, St Bathans and Cambrian, golf at Omakau, Poolburn dam, Thompsons Gorge, Clyde, Alexandra Basin Vineyards, Hayes Engineering, 4WD trips, word class gardens, curling and
Assumed concrete
Page
471
App
endi
x luge at Naseby, historic sites and landscape.
137 Ophir The Old Bakery ( Stables building) 1×B&B RB
Full kitchen, bathroom facilities, washing machine, log burner, BBQ, outdoors area ,TV, a selection of DVDs.
All bedrooms with heating and lighting.
Homemade breakfast, farm fruits and eggs, OCRT, walking, historic Ophir, visiting historic buildings and sites, landscape views and photography, fishing, swimming, golf course.
Schist stone
138 Ophir The Old Bakery (Bakery) 1×B&B RB
Shared outside-bathroom and toilet, using shared facilities with stables building.
2bedrooms with lighting and [heating]. Schist stone
139 Omakau Church Hill B&B 1×B&B RB
Twin room with shared facilities (bathroom and toilet), lounge and dining area, open fire, tea and coffee making facilities, outdoor areas, grazing for horse trekkers, TV, DVD player, stereo.
Queen room with ensuite, bathroom and toilet, all bedrooms with heating, lighting.
Breakfast, food (from other restaurants and hotels), wine, OCRT, historic Ophir, adjacent historic Omakau Catholic Church.
Red brick
140 Omakau Hawksview B&B 1×B&B RB
Fully equipped kitchen, bathroom, washing and drying facilities, outdoor spa pool, garden sitting, BBQ, lounge with TV, free email access.
All bedrooms with electric heaters electric blankets and lighting.
Continental breakfast, OCRT, historical sites and heritage, landscape views, photography, Omakau, books, (swimming pool, golf course and astro tennis courts available from other nearby places and accommodation services).
Red brick, timber
141 Omakau Killarney Cottage 1×SC RB Kitchen, two bedrooms 1 bedroom with ensuite. All OCRT, historical sites Timber,
Page
472
App
endi
x with a separate toilet and shared bathroom and shower, dining area, laundry with machine washing, sheltered veranda.
bedrooms with heating and lighting.
and heritage, landscape views, photography, Omakau, books, (swimming pool, golf course and astro tennis courts available from other nearby places and accommodation services).
stucco finish walls
142 Omakau
Omakau Accommodation Cottage & Ensuite Studio Units (units)
1×SC New laundry block
5 Studio units each has: ensuite, heating and lighting, a private courtyard that includes outdoor dining and bike stand, TV , each bedroom has radio alarm clock and electric blanket and hair dryer. 1 unit with disabled facilities.
Continental breakfast, wine, OCRT, view of the Dunstan Ranges, Manuherikia river, landscape garden, sports equipments, tennis, golf course, swimming, fishing, walking, local transportation along the OCRT.
Timber
143 Omakau
Omakau Accommodation Cottage & Ensuite Studio Units (cottage)
1×SC New
Full kitchen facilities with fridge, oven, microwave, dishwasher, one bathroom and toilet, open plan dining and living area with TV and stereo, landscape garden area.
All bedrooms with heating and lighting.
Continental breakfast, wine, OCRT, view of the Dunstan Ranges, Manuherikia river, landscape garden, sports equipment, tennis, golf course, swimming, fishing, walking, local transportation along the OCRT.
Timber
144 Omakau Omaka bed post (Post Master’s House & Post Office), (Post
1×B&B New 2 bathrooms, 3 toilets, separate lounge with log burner, separate living
All bedrooms with heating and lighting.
Continental breakfast, wine and beer, OCRT, Red brick
Page
473
App
endi
x Master’s House) room. historical sites and buildings, wine and beer, garden, landscape views, walking, photography.
145 Omakau
Omaka Bed Post (Post Master’s House & post office), (post office)
1×B&B RB A fully equipped kitchen, lounge, log burner, bathroom and toilet.
All bedrooms with heating and lighting
Continental breakfast, wine and beer, OCRT, historical sites and buildings, wine and beer, garden, landscape views, walking, photography.
Triple brick walls
146 Omakau Omakau Commercial Hotel 1×Hotel RB
5 shared facilities rooms, bar and cafe with Sky TV, fire place, tea and coffee facilities, laundry services, irons and ironing boards, disabled access facilities in cafe, guests TV lounge, internet and wireless broadband.
4 ensuite rooms each with bathroom and toilet, 2 bedroom cabin and bunkroom with adjacent private ensuite. All bedrooms with hairdryer, electric blankets, heaters, lighting and alarm clock.
Food, breakfast, wine , OCRT, garden area, visiting historical sites and buildings, landscape views, conference and function facilities, golf, tennis, swimming, playground, historic Ophir, guided tours.
Schist stone
147 Omakau Peddl’n Away B&B 1×B&B New
Fridge and freezer, dining room, dishwasher, cafe/restaurant, guest lounge, laundry facilities, clothes dryer, iron/ironing board, lounge area with fire place, BBQ, TV room, DVD player, internet access.
All beds have electric blanket, shower facilities, toilet facilities.
151 Chatto Creek The Magdelans B&B 1×B&B New Lounge with Sky TV, selections of DVDs, swimming pool.
Two bedrooms with private bathrooms, heating and lighting.
Continental breakfast and full Irish breakfast, OCRT, beverage, wine and beer, landscape views, guided walks, local transportation along the OCRT.
Assumed timber
152 Chatto Creek Rockdale B&B 1×B&B RB
Country style kitchen, wood panelled lounge, two modern bathrooms with claw foot bath.
2 double rooms and 1 bunk room with heating and lighting, one bedroom with fire place.
Food, continental breakfast, OCRT, scenery and landscape views, local transportation to dine at adjacent hotels and restaurant.
Timber
153 Alexander Avenue Motel 1×Motel New Fully equipped kitchen with microwave, guest laundry, BBQ.
All 13 spacious units with bathroom and toilet, heating and lighting, internet access, Sky TV. 3 units with spa baths.
Continental breakfast, OCRT, golf, wine, historic heritage and sites, scenery.
Concrete
154 Alexander Alexander’s Riverview B&B 1×B&B New
2 bedrooms with shared tiled bathroom, lounge, TV, patio with natural views.
All bedrooms with heating and lighting, 1 bedroom with tiled ensuite.
Continental breakfast, OCRT, historical sites and heritage at Alexandra, iconic steel lattice bridge, the
Assumed timber
Page
475
App
endi
x historic Doctors Point Gold Diggings Clutha River, Alexandra walkway, fishing.
155 Alexander Alexandra Garden Court Motel 1×Motel New
Swimming pool, BBQ area, children’s playground.
6 self contained units all with electric blankets, dual-heating, oven, microwave, TV, lighting, bathroom and toilet.
Food and beverages, breakfast, OCRT, landscape gardens, 4WD tours, golf, boating, mountain biking, fishing, kayaking, walking tracks, walk to the clock on the hill, ice skating, curling, gun club, bowling greens, new swimming complex, blossom festival, thyme festival, wine tours, vineyard tours.
Timber
156 Alexander Alexandra Heights Motel 1×Motel New BBQ area.
6 spacious studio apartment and 4 spacious 2 bedrooms units, three of studios have spa bath, one of 2 bedroom units has disabled facilities and access. All units with fully equipped kitchen, free wireless internet, Sky TV.
Continental breakfast, OCRT, fishing, boating, golf, cycling, vineyard tour, river cruises, aquatic centre and BMX track.
Concrete and red brick
157 Alexandra All Seasons Tourists Flats 1×SC New Laundry facilities,
All flats with private bathroom, separate lounge with TV and DVD, self catering kitchen with small oven, microwave, fridge, heating and lighting.
OCRT, wine industry, historic and natural heritage, mountain view, close to the historic Shaky Bridge, Alexandra festivals and events (listed in table 2), skiing, fishing
Timber
Page
476
App
endi
x (famous for salmon and trout fishing),golf, swimming, tramping, mountain biking.
158 Alexander Alexandra Almond Court Motel 1×Motel New Swimming pool, guest
laundry.
8 units all with kitchen, bathroom and toilet (three of the units have spa bath ), one of two bedrooms units has disabled facilities, central heating, lighting, glare reducing tinted glass, thermal drapes, TV, radio, phone, DVD player, wireless internet.
Cooked or continental breakfast, OCRT, daily paper delivered, 33 annual cultural events and activities (listed in table 2), skiing, fishing (famous for salmon and trout fishing), golf, swimming, tramping, mountain biking.
Timber
159 Alexander Central Court Motor Inn 1×Motel New
Restaurant, house bar, BBQ for hire, conference centre.
33 units all with ensuite or private bathroom, kitchen or kitchenette with fridge and coffee making facilities, wireless internet, Sky TV, heater, electric blankets and lighting.
Kiwi dishes, continental breakfast, OCRT, local wines, scenery, gold mining heritage, 33 annual cultural events and activities (listed in table 2), conferences and seminars.
Timber, concrete, red brick (used for the conference center building)
160 Alexandra Criterion Club Hotel (Bp) 1×Bp New
All 7bedrooms with shared bathroom facilities, beer garden, restaurant.
All bedrooms with heating and lighting.
Food, breakfast, beer, wine, OCRT, 33 annual cultural events and activities (listed in table 2).
Assumed timber and brick
161 Alexandra Criterion Club Hotel (Bp) 1×Bp New
A fully equipped kitchen, dishwasher, lounge, beer garden, restaurant.
Ensuite bathrooms, TV (some of rooms), lighting and heating.
Food, breakfast, beer, wine, OCRT, 33 annual cultural events and activities (listed in table 2).
Assumed timber and brick
162 Alexandra Hawkdun Rise 1×B&B New Dining room. 3 bedrooms with 3 separate Breakfast, local fresh Timber
Page
477
App
endi
x Vineyard Homestay ensuite bathrooms and verandas, heating and lighting.
fruits, food, Hawkdun Rise wine, OCRT, vineyard, using local grown produce, 33 annual cultural events and activities (listed in table 2), skiing, fishing ,golf, swimming, tramping, mountain biking.
163 Alexandra Hillview Park B&B 1×SC New
Fully equipped and disabled accessible kitchen, a shared bathroom, BBQ, lounge /dining, large trampoline for children wireless internet.
All bedrooms with heating and lighting.
Continental breakfast, food, off - road motorcycle or 4 Wheel drive tour, OCRT, 33 annual cultural events and activities (listed in table 2).
Timber
164 Alexandra Log House Retreat 1×B&B New
Dining room, 1shared bathroom, guest reading lounge, outdoor living area.
3 bedrooms with electric blankets, hairdryer, clock radio, stereo/CD player, tea & coffee making facilities. A queen size suite with ensuite and private lounge.
Breakfast, wine, Pinot Noirs and wine tours, OCRT, guest reading lounge, wedding services, historical countryside, stone fruit, hydro electric dam (related recreational activities), 33 annual cultural events and activities (listed in table 2) .
Timber (log)
165 Alexandra Marj’s Place (Home stay) 1×SC New
Kitchen, lounge with Sky TV , central heating, 3 person sauna, double spa bath, internet.
x services, historical countryside, stone fruit, hydro electric dam (related recreational activities), 33 annual cultural events and activities (listed in table 2).
166 Alexandra Marj’s Place (Backpacker) 1×Bp New
4 showers, 3 kitchens, 5 toilets, 2 lounges, central heating, TVs, BBQs, internet in reception.
All beds with lighting.
Food, wine, Pinot Noirs and wine tours, OCRT, guest reading lounge, garden, wedding services, historical countryside, stone fruit, hydro electric dam (related recreational activities), 33 annual cultural events and activities (listed in table 2).
Timber
167 Alexandra Quail rock B&B 1×B&B New
Coffee and tea making facilities, reading selection, outdoor seating and tables (for breakfasts),laundry , night storage heating.
All rooms with room heating tiled ensuite bathroom with under floor heating, clock-radio, TV, bedside lamps with touch anywhere on-off, coffee and tea making.
Food, breakfast, OCRT, reading selection, Central Stories Museum & Art Gallery, Alexandra/Clyde wineries and vineyards, central Otago gold heritage, historic gold mines, mountain bike tours.
All 3 units with ensuite bathrooms, tea/coffee facilities, TV/DVD player, electric blankets & heater. A disabled access unit is equipped with appropriate bathroom facilities.
Food, breakfast, OCRT, mountain and river views, wine and wine tours, central Otago gold fields, mountain biking, wild flower walks.
Stone
169 Clyde Absolutely Amazing Workshops B&B 1×B&B New
Packed food, continental breakfast, OCRT, Clutha River adventures.
Timber and brick
170 Clyde Antique Lodge Motel 1×Motel New
Children’s playground, guest laundry with dryer, BBQ, TV and stereo, wireless internet.
7 units each has a fully equipped kitchen with microwave, bathroom and toilet, electric blankets, telephone, radio, furnished lounge with Sky TV, heating and lighting, hair dryer.
Continental breakfast, OCRT, Clutha River adventures.
Timber
171 Clyde Argyll on Clyde bed & Breakfast 1×B&B New
Lounge, spa, 3 bedrooms with a shared bathroom, BBQ.
1 queen bedroom with ensuite (bath and shower), all bedrooms with heating and lighting.
Breakfast, OCRT, golf and fishing, 4WD tour, historic gold mining heritage, landscape and scenery.
Timber
172 Clyde Bed and Breakfast @Clyde 1×B& B New
2 bedrooms with shared bathroom and toilet, internet wireless access.
1ensuite bedroom with bathroom and toilet, private sitting room, tea and coffee making facilities. All bedrooms with heating and lighting.
Continental breakfast, OCRT, historic village of Clyde, Clutha River, close to the golf course and hospital.
Timber
173 Clyde Clyde Holiday & Sporting Complex 1×SC New
Campground toilets and showers, communal kitchens with stoves, children’s play ground at next door Clyde primary
Each cabin has microwave, lighting and TV.
Community-owned campground is the social and sporting centre of Clyde over summer months,
Timber
Page
480
App
endi
x school. indoor and lawn bowls touch rugby, soccer, golf, fishing and boating on Lake Dunstan, adjacent towns and places and their attractions such as Manitoto Plains, St Bathans, Ranfurly, Alexandra, 9 hole Dunstan golf course, ice sports and curling at Naseby, Clyde dam, gold mining, the Clyde museum, the Herb museum and the Station museum, Cromwell Gorge.
174 Clyde Clyde Motel 1×Motel New Guest laundry equipped with washer and dryer, outdoor BBQ, Sky TV.
9 units all have bathroom with shower, vanity, hair dryer, fully equipped kitchen with oven, microwave and fridge, Telephone, broadband internet, heating and lighting.
Food, wine, OCRT, adjacent towns and places and their attractions such as Manitoto Plains, St Bathans, Ranfurly, Alexandra, 9 hole Dunstan golf course, garden and its views, historic sites and buildings, ice sports and curling at Naseby, Clyde dam, gold mining, the Clyde museum, the Herb museum and the Station museum,
Assumed timber
Page
481
App
endi
x Cromwell Gorge.
175 Clyde Clyde's Plum Tree Cottage 1×SC RB
Fully equipped kitchen, bathroom and toilet, lounge with stove, veranda views of the garden, heat pump, BBQ, TV and stereo.
Both bedrooms with electric blanket and lighting, private courtyard with open air dining area.
Continental breakfast, OCRT, library, plum tree garden, adjacent towns and places and their attractions such as Manitoto Plains, St Bathans, Ranfurly, Alexandra, 9 hole Dunstan golf course, garden and its views, historic sites and buildings, ice sports and curling at Naseby, Clyde dam, gold mining, the Clyde museum, the Herb museum and the Station museum, Cromwell Gorge.
Timber
176 Clyde Cottage Wheatsheaf 1×B&B RB
A fully equipped kitchen, dining room, lounge, bathroom and a fully fenced private courtyard, wood burner.
Two bedrooms with electric blankets, heating and lighting.
OCRT, surrounding orchards and vineyard, Clutha Bridge, adjacent towns and places and their attractions such as Manitoto Plains, St Bathans, Ranfurly, Alexandra, 9 hole Dunstan golf course, garden and its views, historic sites and buildings, ice sports and curling at Naseby, Clyde dam, gold
Schist and concrete, and timber
Page
482
App
endi
x mining, the Clyde museum, the Herb museum and the Station museum, Cromwell Gorge.
177 Clyde Dunstan Hotel 1×Hotel RB
10 rooms of which 9 have shared bathroom facilities, shared TV lounge with tea and coffee facilities, restaurant, lounge bar, public bar, TAB, gaming machines, pool tables
All bedrooms with heating and lighting.
Food and beverages, breakfast, wine and beer, OCRT, adjacent towns and places and their attractions such as Manitoto Plains, St Bathans, Ranfurly, Alexandra, 9 hole Dunstan golf course, garden and its views, historic sites and buildings, ice sports and curling at Naseby, Clyde dam, gold mining, the Clyde museum, the Herb museum and the Station museum, Cromwell Gorge.
Schist stone
178 Clyde Dunstan House 1×Hotel RB
6 rooms have shared bathroom, laundry facilities, a separate TV lounge, colonial veranda, central heating, internet facilities – broadband and WiFi.
13 guest rooms, 6 rooms have own ensuite bathroom facilities, tea and coffee making, toaster, fridge and microwave, private courtyard and hill view, one room has self contained kitchen / sitting room, shower and separate toilet.
Packed lunches , OCRT, walking to visit historical and natural heritage, golf, tennis, bowls, vineyards, fishing, kayaking, 4WD, skiing, curling and ice skating (in Alexandra or Naseby).
x and natural heritage and activities, adjacent towns and places and their attractions such as Manitoto Plains, St Bathans, Ranfurly, Alexandra, 9 hole Dunstan golf course, garden and its views, historic sites and buildings, ice sports and curling at Naseby, Clyde dam, gold mining, the Clyde museum, the Herb museum and the Station museum, Cromwell Gorge.
internet access. 3 rooms each has bathroom, heating and lighting.
Continental breakfast, including our own preserved fresh fruits and jam, hot and cold beverages, wine, OCRT, library, top quality New Zealand made beds, historic city of Clyde, Clutha River, walking,
Mud brick
181 Clyde Hill view Park B & B and SC 1×B&B/ 1×SC New Spa, BBQ, internet
broadband.
2 bedrooms with bathroom and toilet with disabled access, heating, lighting.
Full kitchen and dining facilities, lounge, log burner, bathroom and separate toilet.
Two bedrooms with lighting.
Food, local wine, OCRT, Clyde city and its attractions, production of electricity via solar panels and batteries,water supply is from a spring running from high in the mountains behind, garden, reading room, fishing, hunting, 4x4 trips, mountain biking, river trips, skiing in the winter, vineyard tours, water skiing and sightseeing.
Stone and timber
183 Clyde Lavender Drive Bed and Breakfast 1×B&B New
2 bedrooms with shared bathroom, spa, laundry facilities.
One bedroom with ensuite, all bedrooms with heating and lighting.
Continental breakfast, local and homemade fruits and jams, OCRT, views of Dunstan Mountains, historic heritage of Clyde city, play house and sandpit for children, vineyard, Clyde dam, walks, golf course.
Schist stone and timber
184 Clyde Mirabell Chalets 1×SC New BBQ area, swimming pool, hot tub heated by gas.
3 chalets with ensuite facilities including fully equipped kitchen, bathroom, toilet, laundry facilities and private lounge, heating and lighting.
Continental breakfast, and fresh local eggs, OCRT, historic heritage of Clyde city, four hectares fenced ground for play,
Timber
Page
485
App
endi
x feeding hens, adjacent towns and places and their attractions such as Manitoto Plains, St Bathans, Ranfurly, Alexandra, 9 hole Dunstan golf course, garden and its views, ice sports and curling at Naseby, Clyde dam, gold mining, the Clyde museum, the Herb museum and the Station museum, Cromwell Gorge.
185 Clyde Olivers of Clyde ( lodge and stable) 1×Motel RB Dining room, courtyard.
6 of 11 double bedrooms all have en suites with claw-foot baths, 5 of 11 bedrooms have private en suite bathrooms, all bedrooms with heating and lighting.
Breakfast, OCRT, the Clutha river cruises, heritage tour, wine tours, adjacent towns and places and their attractions such as Manitoto Plains , St Bathans, Ranfurly, Alexandra, 9 hole Dunstan golf course, ice sports and curling at Naseby, Clyde dam, gold mining, the Clyde museum, the Herb museum and the Station museum, Cromwell Gorge.
Schist stone
186 Clyde Picnic Creek Bed & Breakfast 1×B&B New Communal lounge,
outdoor courtyard.
All three bedrooms have private ensuite, TV, tea and coffee making facilities, individually controlled central heating.
Continental breakfast, OCRT, historic heritage of Clyde city,
Timber
Page
486
App
endi
x Clyde dam, landscape and scenery.
187 Clyde Postmaster’s House 1×B&B New
2 bedrooms with shared bathroom and toilet, sitting room, cooking facilities.
1 bedroom with ensuite , private lounge, all bedrooms with lighting, heating.
Continental breakfast, OCRT, Clutha river cruises, scenery of the Roxburgh Gorge, historical gold mining towns.
Stone and timber
188 Cromwell Anderson Park Motels 1×Motel New
Spa pool, children’s playground, guest laundry, hot tub, outdoor living, BBQ.
All 11 ground floor units with ensuite bathroom, equipped kitchen, Sky TV, DVD, broadband, heating and lighting.
Breakfast, OCRT, sports equipment and bikes, Clyde city and its attractions , historic Cromwell Anderson park, Lake Dunstan and Bannockburn for water sports, vineyards and wineries, mountain bike, walking, horse and car racing, skiing.
Timber
189 Cromwell Carrick Lodge Motel 1×Motel New Outdoor sitting.
Four studios all with en-suite bathroom, heated towel rail, hair dryer, Sky TV, kitchen (cooking facilities), broadband and wireless internet, air conditioning and lighting.
OCRT, wineries and vineyards, golf course, biking, goldfield jet thrill, historic heritage and buildings of Cromwell city, policies for being sustainable such as replacing electric bulbs and appliances with low energy environment-friendly bulbs whilst recognizing the need of guests to be able to
Assumed timber
Page
487
App
endi
x read under strong light, replacement of shower heads with adjustable jets to provide stronger concentrated flow whilst conserving water, changing shampoo and conditioner bottles to reflect less packaging and far fewer disposals of plastic containers, limitation of irrigation of grounds in the summer by a timer to deliver useful amounts of moisture to grass and gardens without wastage, monitoring of gas and electricity usage to encourage efficiencies in heating, lighting and laundry operations.
190 Cromwell Central Gold Motel 1×Motel New Fax facilities, BBQ.
All 11 units have kitchen facilities including microwave, jug and toaster, bathroom, hairdryer, electric blankets, heated tile floors, air-conditioning heat pump, telephone, internet, iron and ironing board, lighting. Two units have private outdoor
Breakfast, OCRT, fishing, water-skiing, swimming, boating of all kinds, windsurfing and picnicking, boating, guided fishing trips, Goldfields Jet, wineries and
Stone and timber
Page
488
App
endi
x sitting. vineyards, gold mining heritage, walks, 4WD trips.
191 Cromwell Colonial Manor Motel 1×Motel New
Selection of DVD movies, gas BBQ, recycling collection area.
All units have wireless internet, room heaters and electric blankets, double glazing, bathroom and toilet, equipped kitchen, two units have TV, one unit has DVD player, two upstairs units have own balcony. Each ground floor unit has private outdoor seating area.
OCRT, daily newspaper, vineyards and wineries, golf course, trout and salmon fishing, scenic walks, nature, historic goldfield, sites and trails, water sports on Lakes Dunstan, Hawea, Wanaka and Whakatipu, winter ski fields.
Timber
192 Cromwell Cromwell Motel 1×Motel New Children’s playground, outdoor swimming pool, BBQ area.
11 family units with kitchen, bathroom, wireless internet, heating and lighting.
Continental breakfast, OCRT, vineyards and wineries, wine, private gardens, bike hire, walks, Cromwell town, Lake Dunstan, museum.
Timber
193 Cromwell
Cromwell Top 10 Holiday Park(Park Motel 2 rooms and Park Motel 1 room)
2×Motel New
Laundry room, play ground for kids, internet kiosk with wireless available, BBQ area.
Both park motels have fully equipped kitchen, TV, private bathroom, lounge, heating and lighting.
Food and beverages, wine and beer, OCRT, fishing, swimming, boating, motorcycle hire, skiing and scenic flights, cycling, kayaking, golf, vineyards and wineries, wine, Cromwell town, and its attractions.
Timber
194 Cromwell
Cromwell Top 10 Holiday Park ( Self Contained Unit 1 and 2)
2×SC New
Laundry room, play ground for kids, internet kiosk with wireless available, BBQ area.
Both self contained units have fully equipped kitchen, shower and toilet, lounge, TV, heating and lighting.
Timber
195 Cromwell
Cromwell Top 10 Holiday Park(ensuite units, deluxe units, standard units)
1×SC New
Communal kitchen, shared bathroom and toilet (communal services for deluxe and standard units), play ground for kids, laundry room,
All units have TV, jug and toaster, heating and lighting. Ensuite units have their own shower and toilet.
Timber
Page
489
App
endi
x internet kiosk with wireless available, outdoor BBQ.
196 Cromwell
Cromwell Top 10 Holiday Park(powered and non-powered sites)
288× powered sites and 183 non-powered sites.
-
Carwash facilities, using communal kitchen and laundry facilities of the close self contained units, play ground for kids, internet kiosk with wireless available, BBQ area.
- -
197 Cromwell Golden Gate Lodge 1×B&B New
Fully equipped guest laundry, gym, restaurant, cafe and bar, fitness centre, wholesale liquor outlet.
All 47 studio units have their own courtyard, coffee and tea making facilities, Sky TV, mini bar, fridge, bathroom and toilet (some units with spa bath), hairdryer, ironing facilities, broadband internet (wireless), telephone, electric blanket, heating and lighting.
Food and beverage, wine and beer, OCRT, equipped conference centre with its own courtyard (used for weddings as well), 42 annual cultural events ( listed in table 3), historic Cromwell city, vineyard, wineries, gold field mining centre, golf, jet ski, landscape view, gardens.
Timber and schist rock
198 Cromwell Dunstan Motel 1×Motel New Guest laundry, children’s playground, gas BBQ.
All units have fully equipped kitchen, bathroom and toilet, telephone, electric blankets, Sky TV, DVD player, wireless internet.
Continental breakfast, food and beverages, OCRT, DVD library, scenery, tour activities booking service Lake Dunstan, vineyards, orchards, gold mining trails, 4WD, five ski fields, golf course, bowling, squash, swimming, tennis,
Timber
Page
490
App
endi
x netball, mountain biking, walking tracks and trail, arts and crafts, Cromwell heated swimming pool, 42 annual cultural events (listed in table3).
199 Cromwell Orchard House 1×SC New Dining room, laundry facilities, BBQ.
Both suites have ensuite bathroom, balcony, TV and DVD player, heated towel rail, hairdryer, wireless internet, private guest area with coffee and tea making facilities.
Continental breakfast, eggs from the house hens, fresh fruits, wine, OCRT, garden walking tracks, water skiing, Kawarau river jet boating, skiing, fishing, heritage sites, orchard tours, golf tours.
Brick and timber
200 Cromwell River Rock Estate Vineyard Accommodation
1×B&B New Bar, BBQ, heat pump/ air conditioning.
Both units have ensuite bathroom, toilet, tea and coffee making facilities, microwave and fridge, TV, DVD player, wireless internet, hair dryer, lighting.
Breakfast, OCRT, historic Cromwell city, scenery and landscape views, golf course, swimming pool, vineyards, 42 cultural events (listed in table3), wine. This accommodation is not suitable for children under 14 years.
Timber, walls and roof are covered by corrugated iron
201 Queenstown Four Seasons Motel 1×Motel New
An outdoor swimming pool, heated spa pool, play area, drying room for skis, a guest computer kiosk, central heating, guest laundry room, BBQ.
All 15 units are equipped with kitchen facilities, bathroom, electric blanket, hair dryer, iron and ironing board, DVD, stereo and Sky TV, WiFi internet.
Continental breakfast, OCRT, DVD Library, Queenstown Bay, skiing, scenery, surrounding national parks.
Concrete
Page
491
App
endi
x
Appendix.6: OCRT- Types of Accommodation services (2011)
Nu Location Accommodation Service C Facilities Cost Single-double/night
24 Ngapuna Big Hut (Restored lodge-ski building) 25
Two bunkrooms, a large common room with table tennis table, dining tables and seating, a relatively small kitchen, a gear room and a wash room/entry lobby. There is a tank water supply and an outside toilet, solar lighting is being installed. There is no artificial heating in the hut - it can be subzero in winter.
$10 per person per night, or $5 if 12 years or under.
35 Pareau/Styx Styx Hotel The jail, Styx Hotel – now is a holiday home – and hotel stables are privately owned but the public is welcome to look around.
36 Patearoa Patearoa Hotel + 7 Chalets 36 4 twin bed room, up to 22 guests +14 (chalets).
Hotel $35 per person (ensuite twin bedroom $37.50 pp), chalet $25 pp.
Hotel 1
Fax: 03 444 7865 Phone: 03 444 7865
37 Waipiata Waipiata Country Hotel (built in 1899) N/A N/A
From $70 pppn (includes a hearty continental breakfast).
x Garden (the bank) including hearty barbecue or roast dinner and continental breakfast. $50 per person per night including continental breakfast $85 per night including hearty barbecue or roast dinner and continental breakfast.
B&B 1
40 Waipiata Komako Peonies & Cottage Garden (the tool shed) 2 Twin bed accommodation.
44 Waipiata Waipiata Cottage 5 2 king and 2 single bedrooms. $75 per person B&B 1 [email protected]
45 Waipiata Waipiata Motel 12 6 units $140 per unit for up to 2 guests. Motel 1 [email protected]
46 Ranfurly Plains Retreat, Ranfurly Hospital 8 3 double bedrooms and one twin.
3-day tour: $1190 per adult, $895 per child under 12yrs, 4-day tour: $1275 per adult, $955 per child under 12yrs5-day tour: $1560+ per adult, dependent on itinerary.
2 studio units (one with a queen, the other a super king), ensuite, up to 4 guests, 4family or group units with 2 bedrooms (3 with two singles in each bedroom and queen in the lounge, the 4th has a queen in the bedroom and two singles.
Studio 1-2 people - $100, 2 bedroom units 2 people - $115.
Queen studio (two people) $110,queen studio (single occupancy)-$60, king studio (two people)$110 , king studio, extra adult $40, king studio family rate (2 adults, 2 children double sofa) $165.
Historical 16 rooms hotel 3 double bedroom with ensuite, 4 double & one single bedroom with ensuite ,1twin bedroom with bunk set and ensuite ,2triple single bedroom with ensuite), 1single bedroom [not ensuite),1 bunk room [not ensuite] connects to family room ,1 studio unit with twin beds and ensuite, some cooking facilities ,1 family unit with double bed, single bed, and ensuite, day bed in living area and cooking facilities .
178 Clyde Dunstan House ( built in 1900) 29 13 bedrooms. $120- $220 Hotel 1 [email protected] 179 Clyde Hartly Arms Backpackers / B&B 8 1 double room and two bedrooms NZ$40 per night B&B- 1 [email protected]
Appendix.7: OCRT Cultural Products and Activities (2011) Local produce
No. F No. F No. F No. F 1 Continental Breakfast. 80 5 Home baking and local food. 20 9 Beer. 30 13 Crafts. 1 2 Country style cooked breakfast. 6 6 Local vegetables. 8 10 Non-alcoholic drinks. 5 - - - 3 Irish breakfast. 1 7 Fruit. 9 11 Grazing for those doing OCRT
on horseback. 8 - - -
4 Homemade preserves and jams. 3 8 Wine. 62 12 Art works for sale. 1 - - -
x General produce 1 Food and beverages 72 2 Packed food. 3 3 BBQ packed lunch. 1 4 New Zealand made beds. 1
Services 1 Tour activities booking centre. 1 4 Car and coach hire. 1 7 Golf clubs (hire/sale). 3 10 Fishing rods (hire/sale). 2 2 Local transportation. 20 5 Motorcycles hire. 1 8 Kayak (free/hire). 2 11 Tennis racquets and balls. 1 3 CD, DVD, type, movies
(free/hire). 9 6 Bike hire. 8 9 Sport equipment (undefined-
hire/sale). 3 12 Gold pan (hire/sale). 2
Visits 1 Middlemarch. 15 22 Dunstan Lake 4 43 Roxburgh Gore scenery. 1 64 Gold progress mine (heritage). 1 2 Kakanui. 1 23 Bannockburn Lake 1 44 Taieri Gorge Railway. 5 65 Chinese miner’s hut. 1 3 Hawkdun. 2 24 Manuherikia river 6 45 Tour of the nearby Oceania
Gold-Open-Cast mine at Macraes.
3 66 The historic Doctor point Gold Digging s Clutha river.
1
4 Ida valley. 1 25 Taieri river 4 46 Tour of Bare Wood Station. 1 67 Historic artefacts 1 5 Omakau. 5 26 Daniel O’Connell bridge. 4 47 Rural Art Deco tour of
Ranfurly. 1 68 Aquatic centre. 1
6 Ophir. 7 27 Iconic steal lattice bridge. 1 48 TONI’s TIKI tour. 1 69 Smooth Cone Hill 2 7 Ranfurly ( rural Art Deco town) 23 28 Clutha bridge. 1 49 The Best Bits tour. 2 70 Drybread 1 8 Matakanui (town to gold mining
10 Alexandra. 11 31 Art Deco museum. 1 52 Beer garden. 3 73 Gold mining heritage 25 11 Clyde. 9 32 Railway station museum. 9 53 World class garden. 1 74 Dunstan Range. 2 12 Naseby. 16 33 Ballarat Cottage art museum. 1 54 Naseby town garden. 1 75 Rough Ridge Ranges 1 13 Waipiata 2 34 The Clyde museum. 8 55 Queenstown National park 1 76 Rock and Pillar Range 9 14 Macraes Flat gold mining town 2 35 Central stories museum and art
12 Swimming. 18 23 Walking. 48 35 Sheep mustering activities. 4 47 Recreational activities 2 No = Number of cultural products and activities types. F= Frequency(number of accommodation services offering the facilities and activities .
Page
511
App
endi
x
Appentix.8: OCRT- accommodation services- Used materials by types of accommodation (2011) Used material(S) Total
bed spaces
% Types of accommodation services SC B&B Bp Motel Homestead Hotel
N C N C N C N C N C N C Timber 1032 48.5 71 368 33 242 3 36 20 332 - - 4 54 Concrete 99 4.6 - - 4 20 - - 2 79 - - - - 1stone 172 8 4 20 7 43 1 4 1 22 1 4 6 79 2brick 47 2.2 1 6 5 33 - - - - - - 1 8 Mud brick 47 2.2 4 27 1 6 - - - - 1 6 1 8 Container ( iron) 4 0.2 1 4 - - - - - - - - - - Cabins (N/A material) 12 0.5 - - 3 12 - - - - - - - - Mixed timber and corrugated iron
29 1.3 - - 1 4 1 25 - - - - - -
Mixed red brick or brick and timber
174 8.1 2 13 3 26 2 29 - - - - 3 106
Mixed stone and timber 248 11.7 4 24 5 120 - - 1 57 - - 2 47 Mixed mud brick and timber
1. No: Number of accommodation services. 2. Q: Type of building used as accommodation service. 3. C: Capacity (number of bed spaces). 4. El: Electricity. 5. So: Solar system. 6. S: Shared facilities. 7. P: Private facilities. 8. Int: Internet. 9. V/B: Veranda/balcony. 10. Gas including central heating and under floor heating systems. 11. Solar systems used for hot water and lighting (PVs).
Appendix.10: OCRT-B&B accommodation services, energy sources and facilities No.1 Q2 C3 Heating So5&11 TV Int8 V/B9 S/P Outdoor
1. No: Number of accommodation services. 2. Q: Type of building used as accommodation services. 3. C: Capacity (number of bed spaces). 4. El: Electricity. 5. So: Solar system. 6. S: Shared facilities. 7. P: Private facilities. 8. Int: Internet. 9. V/B: Veranda/balcony. 10. Gas including central heating and under floor heating systems. 11. Solar systems used for hot water and lighting (PVs).
Appendix.11: OCRT- Bp accommodation services, energy sources and facilities No.1 Q2 C3 Heating So5&11 TV Int8 V/B9 S/P Outdoor
1. No: Number of accommodation services. 2. Q: Type of building used as accommodation services. 3. C: Capacity (number of bed spaces). 4. El: Electricity. 5. So: Solar system. 6. S: Shared facilities. 7. P: Private facilities. 8. Int: Internet. 9. V/B: Veranda/balcony. 10. Gas including central heating and under floor heating systems. 11. Solar systems used for hot water and lighting (PVs).
Appendix
516 | P a g e
Appendix.12: OCRT - Motel accommodation services, energy sources and facilities. No.1 Q2 C3 Heating So5 TV Int8 V/B9 S/P Outdoor
1 RB 22 • – – – – – – – – 1 S 1 NB 36 • – – – – 11 • – – 1 S 1 NB 16 – – • – – 4 • – – 1 S 1 NB 57 • – • – – – • – – 2 P 1 NB 14 • – – – – 2 • 2 P 2 P 1 NB 42 • – – – – – • – – – – 8 NB 36 • – – – – 1 • – – 1 S 1 NB 28 • – – – – 15 • – – – – 1 NB 53 – – • – – 15 • – – – –
1. No: Number of accommodation services. 2. Q: Type of building used as accommodation services. 3. C: Capacity (number of bed spaces). 4. El: Electricity. 5. So: Solar system. 6. S: Shared facilities. 7. P: Private facilities. 8. Int: Internet. 9. V/B: Veranda/balcony. 10. Solar systems used for hot water and lighting (PVs).
Appendix.13: OCRT- Homestead accommodation services, energy sources and facilities No.1 Q2 C3 Heating So5 TV Int8 V/B
1. No: Number of accommodation services. 2. Q: Type of building used as accommodation services. 3. C: Capacity (number of bed spaces). 4. El: Electricity. 5. So: Solar system. 6. S: Shared facilities. 7. P: Private facilities. 8. Int: Internet. 9. V/B: Veranda/balcony. 10. Gas including central heating and under floor heating systems. 11. Solar systems used for hot water and lighting (PVs).
Appendix
517 | P a g e
Appendix.14: OCRT- Hotel accommodation services, energy sources and facilities No.1 Q2 C3 Heating So5 TV Int8 V/B9 S/P Outdoor
1. No: Number of accommodation services. 2. Q: Type of building used as accommodation services. 3. C: Capacity (number of bed spaces). 4. El: Electricity. 5. So: Solar system. 6. S: Shared facilities. 7. P: Private facilities. 8. Int: Internet. 9. V/B: Veranda/balcony. 10. Gas including central heating and under floor heating systems. 11. Solar systems used for hot water and lighting (PVs).
Page
518
App
endi
x
Appendix.15: OCRT- Camping accommodation services, energy sources and facilities No.1 Q2 C3 Heating So5 TV Int8 V/B9 S/P Outdoor
183 NB 1098 – – – – – – • – – – – 1. No: Number of accommodation services. 2. Q: Type of building used as accommodation services. 3. C: Capacity (number of bed spaces). 4. El: Electricity. 5. So: Solar system. 6. S: Shared facilities. 7. P: Private facilities. 8. Int: Internet. 9. V/B: Veranda/balcony. 10. Gas including central heating and under floor heating systems. 11. Solar systems used for hot water and lighting (PVs).
Page
519
App
endi
x
Appendix.16: OCRT- All types of accommodation service- energy sources and facilities Type Q Heating So TV Int V/B Outdoor sitting
Middlemarch The Rocks Luxury Accommodation/ Longford Retreat
SC RB 178 5 37
Ranfurly Moyola Art Deco Guest House SC RB 200 6 33 Naseby Royal Hotel (SC) SC RB 88 4 22
Oturehua Crowsnest Accommodation (2 cabins) SC NB 22 4 5.5
Lauder Big Shy Cottage SC RB 233 4 58 Lauder Pedal Inn SC RB 142 6 24 Omakau Hawksview B&B SC RB 190 6 32 Alexandra Marj’s Place (Homestead) SC NB 79 5 16 B&B Middlemarch Annandale B&B NB 244 6 41 Middlemarch Middlemarch B&B B&B NB 260 7 37 Middlemarch Rose cottage B&B NB 142 6 24 Middlemarch Strathmore B&B B&B RB 287 5 56 Middlemarch The Lodge B&B RB 282 10 28 Middlemarch The Rocks Luxury B&B NB 408 5 82
Page
521
App
endi
x Accommodation/ Braeside Cottage
Ranfurly Annerly House B&B NB 338 9 37.5 Wedderburn Wedderburn Tavern B&B RB 309 14 22 Naseby Old Doctor’s Residence B&B RB 254 5 51
Poolburn Solandra Lodge Country style B&B B&B NB 120 8 15
Omakau Church Hill B&B B&B RB 224 6 37
Alexandra Hawkdun Rise Vineyard Homestead B&B NB 433 6 72
Alexandra Log House retreat B&B NB 135 6 22.5 Motel
Waipiata Waipiata Motel Motel NB 137 12 11.5 Ranfurly Ranfurly Motel Motel NB 195 16 12.2 Alexandra Alexandra Almond Court Motel Motel NB 411 48 8.6 Alexandra Central Court Motel Inn Motel NB 1530 66 23 Clyde Antique Lodge Motel Motel NB 539 24 22.5
Bp Kokonga 2 Wheel Backpacker Bp NB 144 6 24
Oturehua Crowsnest Accommodation (Bunkrooms/lodge) Bp NB 60 12 5
Alexandra Criterion Club Hotel (BP) Bp NB 378 22 17 Alexandra Marj’s Place (Bp) Bp NB 115 18 6
Hotel Middlemarch Strath Taieri Hotel Hotel RB 473 12 39.4 Macraes Flat Stanley’s Hotel Hotel RB 466 16 29.1 Ranfurly Ranfurly Lion Hotel Hotel RB 1698 30 56.6 Naseby Ancient Briton Hotel Hotel RB 360 40 9 Naseby Royal Hotel(hotel) Hotel RB 421 18 23.4 Becks White House Hotel Hotel RB 478 18 26.5 Omakau Omaka Commercial Hotel Hotel RB 642 22 29.2
Homestead
Waipiata Peter’s Farm Lodge- the homestead Homestead NB 253 6 42
Auripo Taradale Homestead Homestead RB 100 6 16.6
Appendix
522 | P a g e
Appendix.19: OCRT accommodation services - Average area of outdoor sitting spaces Location No. Accommodation Type Area (m2) Type
Veranda/ Balcony Middlemarch 1 Cottesbrook SC 14 Veranda Middlemarch 2 Gladbrook B&B 30 Veranda Middlemarch 3 Gladbrook SC 30 Veranda Hyde 4 Pine Grove SC 18 Veranda Hyde 5 Pine Grove SC 18 Veranda Kokonga 6 2 Wheel Backpackers Bp 5 Veranda
Waipiata 7 Peter’s farm Lodge Homestead 12 Part of
veranda used as sitting
Lauder 8 Big Sky Cottage SC 15 Veranda Lauder 9 Lauder Burn House B&B 18 Veranda Lauder 10 Lauder Burn House B&B 6 Balcony Cromwell 11 Colonial Manor Motel Motel 3 Balcony Cromwell 12 Golden Gate lodge B&B 3 Balcony Total - - - 172 -
Average area (m2) per veranda/ balcony = 14.3 Outdoor sitting
No: Number of accommodation services. Q: Type of building used as accommodation service. C: Capacity (number of bed spaces). El: Electricity. So: Solar system. S: Shared facilities. P: Private facilities. Int: Internet. V/B: Veranda/balcony. Gas including central heating and under floor heating systems. Solar systems used for hot water and lighting (PVs).
Appendix
527 | P a g e
Appendix.24: Naseby: B&B accommodation services, energy sources and facilities
1. No: Number of accommodation services. 2. Q: Type of building used as accommodation services. 3. C: Capacity (number of bed spaces). 4. El: Electricity. 5. So: Solar system. 6. S: Shared facilities. 7. P: Private facilities. 8. Int: Internet. 9. V/B: Veranda/balcony. 10. Gas including central heating and under floor heating systems. 11. Solar systems used for hot water and lighting (PVs).
Appendix.25: Naseby: Hotel accommodation services, energy sources and facilities
1. No: Number of accommodation services. 2. Q: Type of building used as accommodation services. 3. C: Capacity (number of bed spaces). 4. El: Electricity. 5. So: Solar system. 6. S: Shared facilities. 7. P: Private facilities. 8. Int: Internet. 9. V/B: Veranda/balcony. 10. Gas including central heating and under floor heating systems.
Appendix.26:Naseby: Camping accommodation services, energy sources and facilities
No.1 Q2 C3 Heating So5 TV Int8 V/B9 S/P Outdoor sitting S/P El4 Log Gas S6 P7
1. No: Number of accommodation services. 2. Q: Type of building used as accommodation services. 3. C: Capacity (number of bed spaces). 4. El: Electricity. 5. So: Solar system. 6. S: Shared facilities. 7. P: Private facilities. 8. Int: Internet. 9. V/B: Veranda/balcony. 10. Gas including central heating and under floor heating systems. 11. Solar systems used for hot water and lighting (PVs).
Appendix.27: Naseby: All accommodation services by type - energy sources and facilities
Q Heating So % TV Int % Outdoor sitting1
El % Log % Gas % S % P % S % P % NB 359 58.7 17 2.8 26 4.3 61 10 47 7.7 0 0 369 60.4 6 0.9 12 2