Ch.1-7 Course Notes from "Principles of Microeconomics" - Mankiw
33
Ch. 1: Ten Principles of Economics – Economy: Greek word for “one who manages a household.” • Households and economies – both face many decisions – Who will work? – What goods and how many of them should be produced? – What resources should be used in production? – At what price should the goods be sold? • Scarcity: Society has limited resources - cannot produce all the goods and services people wish to have. • Although there are lots of resources, but relative to the needs of society, it is limited • Wants and desires are unlimited Economics • Study of how society manages its scarce resources. • Study of decision making • Behaviour of the economy reflects the behaviour of the population. 10 Principles 1. People face tradeoffs. - You win some, you lose some 2. The cost of something is what you give up to get it. In accounting, cost is explicit (money transfer), but in economics, cost is implicit: ie. Opportunity cost…what you have to give up to get something else. 3. Rational people think at the margin. – Make small changes. 4. People respond to incentives. (in this case, price) 5. Trade can make everyone better off. (if voluntary) 6. Markets are usually a good way to organize economic activity. (Markets are efficient, but they don’t eliminate scarcity or poverty.) 7. Governments can sometimes improve economic outcomes. (Macroeconomics) 8. The standard of living depends on a country’s production. (ie. GDP/capita) 9. Prices rise when the government prints too much money. 10. Society faces a short-run tradeoff between inflation and unemployment. (As inflation increases, unemployment rate decreases – because losing ur job is far more of a crisis than increased prices.) Principle #1: People Face Tradeoffs To get something, we usually have to give up something else. – Leisure time v. work – Efficiency v. equality
Transcript
Ch. 1: Ten Principles of Economics
– Economy: Greek word for “one who manages a household.”• Households and economies – both face many decisions
– Who will work?– What goods and how many of them should be produced?– What resources should be used in production?– At what price should the goods be sold?• Scarcity: Society has limited resources - cannot produce all the goods and services people wish to have.
• Although there are lots of resources, but relative to the needs of society, it is limited• Wants and desires are unlimited
Economics• Study of how society manages its scarce resources. • Study of decision making• Behaviour of the economy reflects the behaviour of the population.
10 Principles1. People face tradeoffs. - You win some, you lose some2. The cost of something is what you give up to get it. In accounting, cost is explicit (money transfer), but in
economics, cost is implicit: ie. Opportunity cost…what you have to give up to get something else.3. Rational people think at the margin. – Make small changes.4. People respond to incentives. (in this case, price)5. Trade can make everyone better off. (if voluntary)6. Markets are usually a good way to organize economic activity. (Markets are efficient, but they don’t eliminate
scarcity or poverty.)7. Governments can sometimes improve economic outcomes. (Macroeconomics)8. The standard of living depends on a country’s production. (ie. GDP/capita)9. Prices rise when the government prints too much money.10. Society faces a short-run tradeoff between inflation and unemployment. (As inflation increases, unemployment
rate decreases – because losing ur job is far more of a crisis than increased prices.)
Principle #1: People Face TradeoffsTo get something, we usually have to give up something else.
– Leisure time v. work– Efficiency v. equality– For an economy to be efficient, it must use the resources it has, to satisfy all the wants and needs of society:
*PPF
Efficiency: Society getting the most that it can from its scarce resources. “Greatest bang for my buck”Equity: The benefits of those resources (economic prosperity) are distributed uniformly among the members of society.
Principle #2: The Cost of Something Is What You Give Up to Get It.• Decisions require comparing costs and benefits of alternatives.– College or work? Study or movie?– Opportunity cost of an item: what you give up to obtain that item.
• The value of the “next best choice”
Principle #3: Rational People Think at the Margin– Rational people carefully do the best they can to achieve their objectives, given the available opportunities.– Marginal change: small, incremental adjustment to an existing plan of action.– People make decisions by comparing costs and benefits at the margin
Principle #4: People Respond to Incentives.• Incentive: Something that induces a person to act• Could be positive (reward) or negative (punishment)• Cost is a huge incentive – even marginal changes • When alternative’s benefits > costs = decision! • Many policies change the costs or benefits that people face change in behaviour
o E.g. tax on gasoline: encourages people to drive smaller, fuel-efficient cars (Europe has high gas taxes vs. US where low gas taxes and huge cars)
Principle #5: Trade Can Make Everyone Better Off.• Competition allows for people to gain from their ability to trade with one another.• Trade allows you to specialize in what you do best.• Trade: Think of the cost of producing it here, vs producing it somewhere else.• By trading with others, people can buy a greater variety of goods and services at a lower cost.
Principle #6: Markets Are Usually a Good Way to Organize Economic Activity.– Market economy: An economy that allocates resources through the decentralized decisions of many firms and
households • Households decide what to buy and who to work for.• Firms decide who to hire and what to produce.
• Adam Smith: Households and firms act by an “invisible hand.”– Because households and firms look at prices when deciding what to buy and sell, they unknowingly
take into account the social costs of their actions.• As a result, prices guide decision makers to reach outcomes that tend to maximize the welfare of society as a
whole.
Principle #7: Governments Can Sometimes Improve Market Outcomes.– Gov. must maintain institutions and enforce rules to enable “Invisible hand”– Property rights: The ability of an ind. to own and exercise control over scarce resources.– 2 reasons why the gov. would intervene in the economy
• Promote efficiency• Promote equity
– Market failure: A situation where the market on its own fails to produce an efficient allocation of resources.• May be caused by an externality - impact of one person or firm’s actions on the well-being of a bystander.
Economic activity is driven by self-interest of individuals in the market
• Market power - ability of a single person or firm to influence market prices. • When the market fails (breaks down) government can intervene to promote efficiency and equity.• You usually have 2 parties in a market transaction – buyer and seller. But you also have stakeholders or
bystanders…a third party that gets affected negatively or positively…externality– E.g. Pollution is an example of an externality…innocent bystanders are affected
• Another possible cause: market power: the ability of a single person/group to have a substantial influence on market prices.
Principle #8: The Standard of Living Depends on a Country’s Production.
• The total market value of a nation’s production• Living standards usually vary by countries’ productivities.• Productivity – the amount of goods and services produced from
each unit of labour input.
Principle #9: Prices Rise When the Government Prints Too Much Money.
• Inflation - increase in the overall level of prices in the economy.o Cause: the growth in the quantity of money.
• When the government creates large quantities of money, the value of the money falls.
Principle #10: Society Faces a Short-run Tradeoff Between Inflation and Unemployment.Increasing the amount of money in the economy stimulates the overall level
• of spending and thus the demand for goods and services.Higher demand over time may cause firms to raise their prices, but in themeantime, it also encourages them to hire more workers and produce a
• larger quantity of goods and services.• More hiring means lower unemployment.• The Phillips Curve: Greater the Inflation, lower the Unemployment
Summary1. When individuals make decisions, they face tradeoffs among alternative goals.
2. The cost of any action is measured in terms of foregone opportunities.3. Rational people make decisions by comparing marginal costs and marginal benefits. 4. People change their behavior in response to the incentives they face.5. Trade can be mutually beneficial.6. Markets are usually a good way of coordinating trade among people.7. Government can potentially improve market outcomes if there is some market failure or if the market outcome
is inequitable.8. Productivity is the ultimate source of living standards.9. Money growth is the ultimate source of inflation. 10. Society faces a short-run tradeoff between inflation and unemployment.
Ch. 2 – Thinking like an Economist
Economists as Scientists1. Make positive statements - claims that describe the world as it is – can be confirmed by evidence– describe the world as it is– these statements can be confirmed or refuted. 2. Employ the scientific method to develop and test of theories about how the world works.
The Economist as Policy Advisor Make normative statements - claims that attempt to prescribe how the world should be – cannot be provedo Governments employ many economists for policy advice, to improve economic output Finance Canada to help design tax policy HRDC to help formulate labour-market policies Environment Canada to help design environmental regulations.
Why Economists Disagree– Economists may disagree about the validity of alternative positive theories about how the world works. – have different values different normative views about what policy should try to accomplish• Income distribution, minimum wages, income tax rates … • Yet, there are many propositions about which most economists agree. – but politics stand in the way ie. tariffs
Assumptions and Models– Assumptions simplify the complex world to make it easier to understand.
• Allows us to focus our thinking on the essence of the problem. • Example: when studying international trade, we might assume the world consists of two countries and two
goods. • A model is a simplified representation of a more complicated reality. Economists use models to study economic
issues.
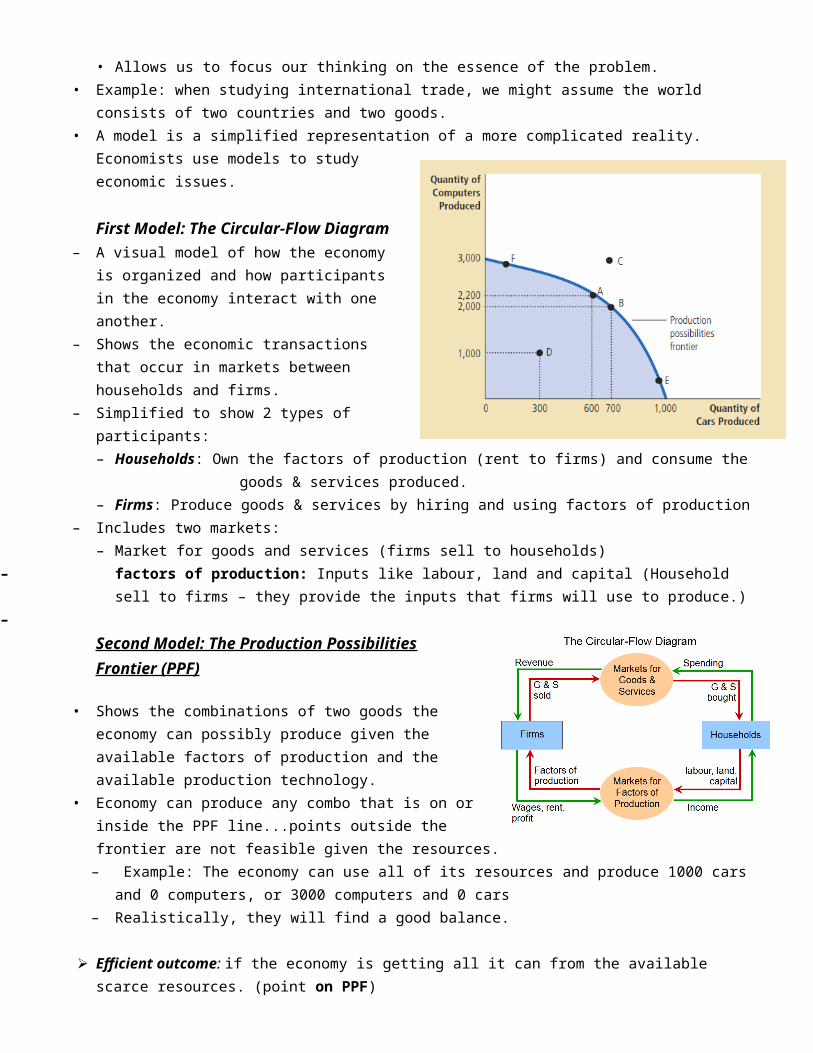
First Model: The Circular-Flow Diagram – A visual model of how the economy is organized and how
participants in the economy interact with one another.– Shows the economic transactions that occur in markets between
households and firms. – Simplified to show 2 types of participants:
– Households: Own the factors of production (rent to firms) and consume the goods & services produced.
– Firms: Produce goods & services by hiring and using factors of production – Includes two markets:
– Market for goods and services (firms sell to households)– factors of production: Inputs like labour, land and capital (Household sell to firms – they provide the inputs
that firms will use to produce.)–
Second Model: The Production Possibilities Frontier (PPF)
• Shows the combinations of two goods the economy can possibly produce given the available factors of production and the available production technology.
• Economy can produce any combo that is on or inside the PPF line...points outside the frontier are not feasible given the resources.– Example: The economy can use all of its
resources and produce 1000 cars and 0 computers, or 3000 computers and 0 cars
– Realistically, they will find a good balance.
Efficient outcome: if the economy is getting all it can from the available scarce resources. (point on PPF)
Inefficient outcome: Economy is producing less than it could from the resources it has (caused by unemployment, underutilized workers) – under PPF
Trade-off: Once we reach one of the efficient points, the only way of producing more of one good is to produce less of the other.
Negative slope: since the resources are fixed, producing more of one good will result in a cut-back of the other.OC: At A, the OC of 100 cars is 200 comps
*The OC = slope of PPF Steeper the slope, greater the OC– The OC is not constant in this case…keeps decreasing (thus a
negative curve)– Moving along a PPF involves shifting resources (ie. labour) form
one to the other
Shape of PPF : Straight or curved – depends on the OC as the economy shifts resources from one industry to the other.o When the OC is constant, the PPF is linearo IF the OC of a good rises as you produce more of it, then the PPF is curved/bow-shapedo PPF is curved when workers have different skills (ie. beer brewers vs. bike-makers)
* Economic growth occurs when the PPF moves horizontally (phase shift to the right)
Ch. 3 – Interdependence and the Gains from Trade
Trade allows each player to specialize in what they do best – mutual benefits Two countries can gain from trade when each specializes in the good it produces at lowest cost.
Specialization & Trade
Specialisation: Scarce production resources are allocated to the most efficient producers Export products for which production is efficient and import products for which production is inefficient
Economies of scale: Decreasing average production costs
o Improved production techniqueso Better management, inventory control o Division of labour; better financial terms
Shortcomings of Specialization: Can create a dependency for developing countries Markets don’t always distribute the gains equally
Absolute Advantage: The ability to produce a good at a lower cost in terms of the inputs/resources req’d to produce it The ability to produce a good using fewer inputs than another producer; more goods with the same # of inputs Used when comparing the productivity of one player to that of another
o Ex: If time as the only input, then compare the time taken to produce a unit of either good. If each of the 2 countries has an absolute adv. in one good, and specializes in that good, then both countries can
gain from trade
Opportunity Cost & Comparative Advantage: OC of an item is what we must give up to obtain that item Measures the trade-off btwn the 2 goods
o Time spent producing potatoes takes away time that could have been used to produce meat Comparative adv: Ability to produce a good at a lower OC than another producer
o Whoever has to give up less of other goods to produce Good X has a smaller OC has comparative adv
Possible for one player to have an absolute adv in both goods Impossible for one player to have a comparative adv in both goods (OC of one good is the inverse of the OC of
the other – if you have a low OC for one good, then it will be high for the other)
Comparative Advantage & Trade Gains from trade are based on comparative adv. When each player specializes based on their CA’s respectively, total production in the economy rises. Since players usually have diff OCs, they can both benefit:
o Each gets the good for a lower price than their OC of that good
Price of the Trade What determines the price of the trade? How are the gains of trade shared btwn partners?
o For both parties to gain from trade, the price at which they trade must lie btwn the 2 OCs
Applications of Comparative Advantage Explains interdependence and gains from trade Ex: Should Beyonce mow her lawn?
o Suppose Bey can mow her lawn faster than anyone else, but in the same 2 hrs, she could film a tv commercial for $20,000
o Meanwhile, Beibs can mow Bey’s lawn in 4 hrs, but in those 4 hrs, Biebs could work at McD’s for $40o Absolute adv. in mowing goes to Bey (she can accomplish the work in lower input of time)o Comparative adv. goes to Biebs, b/c his OC is only $40 compared to Bey’s $20,000
Exports, Imports, Net Exports Imports: Goods produced abroad and sold domestically Exports: Goods produced domestically and sold abroad Net Exports (NX) = (value of a nation’s exports) – (value of nation’s imports)
o Also called Trade Balance Trade Deficit: Net exports are negative
o Imports > exports Trade Surplus: Net exports are positive
o Exports > Imports Balanced Trade: Net exports =0
o Exports = imports
Factors that Affect NX1. The tastes of consumers for domestic and foreign goods.2. The prices of goods at home and abroad.3. The exchange rates at which people can use domestic currency to buy foreign currencies.4. The incomes of consumers at home and abroad.5. The costs of transporting goods from country to country.6. The policies of the government toward international trade.
Terms of Trade Explains interdependence and gains
ie. 1B < 1w < 4Bo Since trade transactions do not simply occur btwn 2 people in the real world, but btwn billions of people,
free societies must allocate resources through the market forces of supply and demand.
Summary We consume goods and services produced both domestically and globally. Interdependence and trade are desirable b/c
they allow everyone to enjoy a greater quantity and variety of stuff. 2 ways to compare the ability of 2 producers for a good: The person who can produce the good with the smaller quantity of
inputs has an absolute advantage in producing the good. The person who has thesmaller opportunity cost of producing the good has a comparative advantage. The gains from trade are based on comparative advantage, not absolute advantage.
Ch. 4 – Market Forces of Supply & Demand
S & D determine the quantity of each good produced and the price at which is it sold.
Two countries can gain from trade when each specializes in the good it produces at lowest cost.
Markets & Competition
Market: A group of buyers and sellers of a particular good or service. The buyers collectively decide on the demand, and the sellers decide the
supply
Competition: Competitive Market: A market where there are so many buyers & sellers that each has a negligible (insignificant) impact
on the market priceo Ex. ice cream market –A seller has little reason to charge more or less than the going price, because buyers can easily
buy elsewhere The buyers collectively decide on the demand, and the sellers decide the supply For a market to be perfectly competitive...
1. The goods for sale are exactly all the same2. The buyers and sellers are so plentiful that no single B or S has an influence over the market price.
Monopoly: If a market only has 1 seller, then the seller sets the price (local cable provider may have a monopoly over the community)
Demand
Demand Curve (Price vs. Quantity Demanded): Quantity Demanded (QD): The amount of a good that buyers are willing and able to purchase. Law of Demand: In an equal environment, as the price of a good increases, the QD decreases Demand Schedule: A table showing the QD of a good, at each price. Demand Curve: Graphs the relationship above. (Price on y-axis and QD on x-axis)
o Usually, negative slope, because as P, QD
Price of Cone ($)
QD of Cones
0.00 120.50 101.00 81.50 62.00 42.50 23.00 0
Market Demand vs. Individual Demand
Market demand is the sum of all individual demands for a particular good (at each price)Price ($) P1 QD P2 QD Market QD
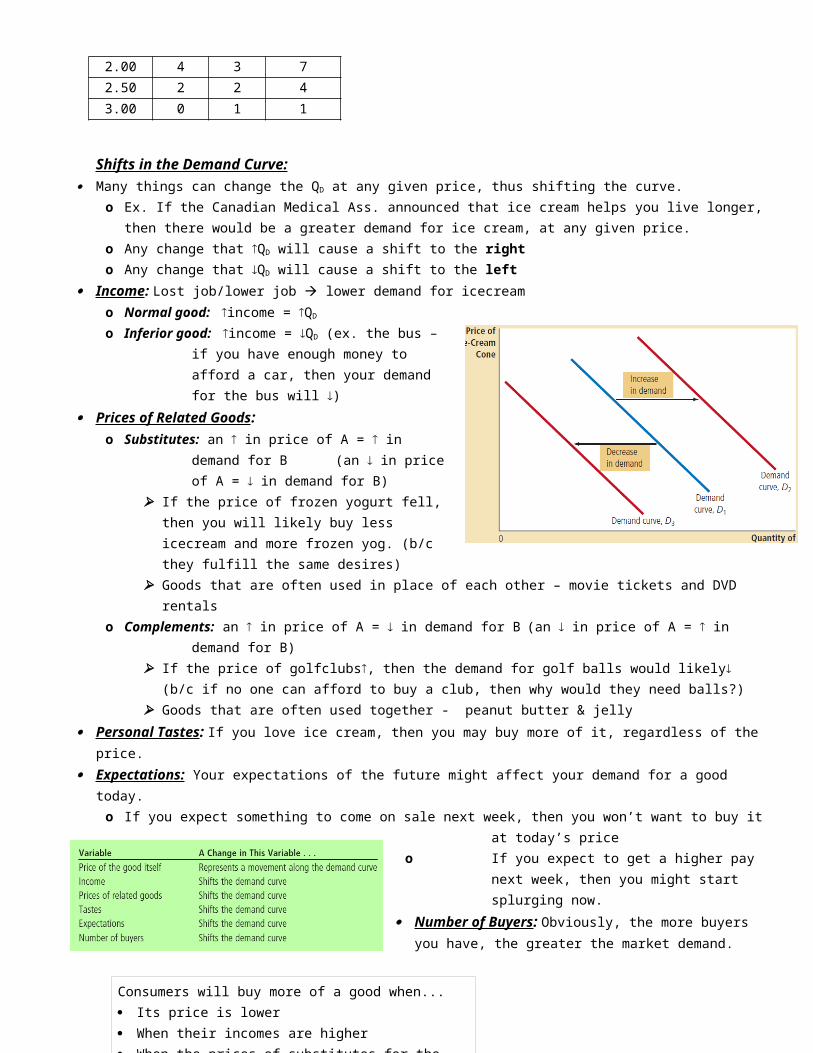
Shifts in the Demand Curve: Many things can change the QD at any given price, thus shifting the curve.
o Ex. If the Canadian Medical Ass. announced that ice cream helps you live longer, then there would be a greater demand for ice cream, at any given price.
o Any change that QD will cause a shift to the righto Any change that QD will cause a shift to the left
Income : Lost job/lower job lower demand for icecreamo Normal good: income = QD
o Inferior good: income = QD (ex. the bus –if you have enough money to afford a car, then your demand for the bus will )
Prices of Related Goods : o Substitutes: an in price of A = in demand for B (an
in price of A = in demand for B) If the price of frozen yogurt fell, then you will likely
buy less icecream and more frozen yog. (b/c they fulfill the same desires) Goods that are often used in place of each other – movie tickets and DVD rentals
o Complements: an in price of A = in demand for B (an in price of A = in demand for B) If the price of golfclubs, then the demand for golf balls would likely (b/c if no one can afford to buy a club,
then why would they need balls?) Goods that are often used together - peanut butter & jelly
Personal Tastes : If you love ice cream, then you may buy more of it, regardless of the price. Expectations: Your expectations of the future might affect your demand for a good today.
o If you expect something to come on sale next week, then you won’t want to buy it at today’s priceo If you expect to get a higher pay next week, then you might start splurging now.
Number of Buyers : Obviously, the more buyers you have, the greater the market demand.
Supply
Supply Curve (Price vs. Quantity Demanded): Quantity Supplied (QS): The amount of a good that sellers are willing and able to sell.
Consumers will buy more of a good when... Its price is lower When their incomes are higher When the prices of substitutes for the good are higher When the prices of complements of the good are lower.
Law of Supply: In an equal environment, as the price of a good increases, so too does the QS
Supply Schedule: A table showing the QS of a good, at each price.
Supply Curve: Graphs the relationship above. (Price on y-axis and QS on x-axis)
o Usually, positive slope, because as P, QSPrice of Cone ($)
QS of Cones
0.00 00.50 01.00 11.50 22.00 32.50 43.00 5
Market Supply vs. Individual Supply Market supply is the sum of all supplies of all sellers (at each price).
Shifts in the Supply Curve: Market supply is the sum of all supplies of all sellers (at each price).
o Any change that QS at every price will cause a shift to the right (increase in supply)
o Any change that QS at every price will cause a shift to the left (decrease in supply)
Input Prices : When the price of input(s) , the good is less profitable and firms supply less.o For icecream: cream, sugar, machines, sauces, price of milk, cooks o If these inputs become more expensive, then DQ cannot afford to
produce that much icecream Technology : Technology often saves sellers money, thus their QS
o Mechanized ice cream machines save time, work and money, allowing DQ to supply more ice cream Expectations: The amount of a good a firm supplies may depend on its expectations of the future.
o If DQ expects the price of icecream to rise in the future, it might put some of its current production into storage, and supply less to the market today.
Number of Sellers : Obviously, the more sellers you have, the greater the market supply.
Supply & Demand Together
Equilibrium: When the market price has reached a level at which QS = QD
o Price at this intersection is the equilibrium price (aka market-clearing price) and quantity is equilibrium quantity (# of demands and supplied)
At the eq. price, the # of goods that buyers want to buy = # of goods sellers can sell. a) Surplus(excess supply): QS > QD
o Market price is above eq. price, so sellers cannot get rid of surplus they must lower priceso Cutting the price means more demand, but less supplyo Moving along the curves: price continues to fall until market reaches equilibrium.
b) Shortage(excess demand): QD > QS o Market price is below eq. price, too many buyers are chasing too few goods sellers can higher priceso Raising the price means less demand, and more supplyo Moving along the curves: prices continues to rise until market reaches equilibrium
Law of Supply & Demand: The price of any good adjusts itself to bring the QS and the QD into balance.
3 Steps to Analyze Changes in Equilibrium: When a factor shifts one or both the curves, the equilibrium in the market changes, resulting in a new price and new
quantity exchanged btwn buyer and seller.1. Decide whether the event shift the supply curve, the demand curve, or both.2. Decide if the curve(s) shift to the right or left.3. Use graph to compare original and new equilibrium, and how the shift affected the eq. price & quantity.
Shifting vs. Moving along Curves:o A shift in the supply curve is called a “change in supply”o A shift in the demand curve is called a “change in demand”o A movement along the supply curve is called a “change in the quantity supplied”o A movement along the demand curve is called a “change in the quantity demanded”
Ch. 5 – Elasticity & Its Applications
Elasticity: A measure of how buyers and sellers respond to changes in market conditions.
A measure of the responsiveness of quantity demanded or quantity supplied to a change in one of its determinants.
Elasticity of Demand
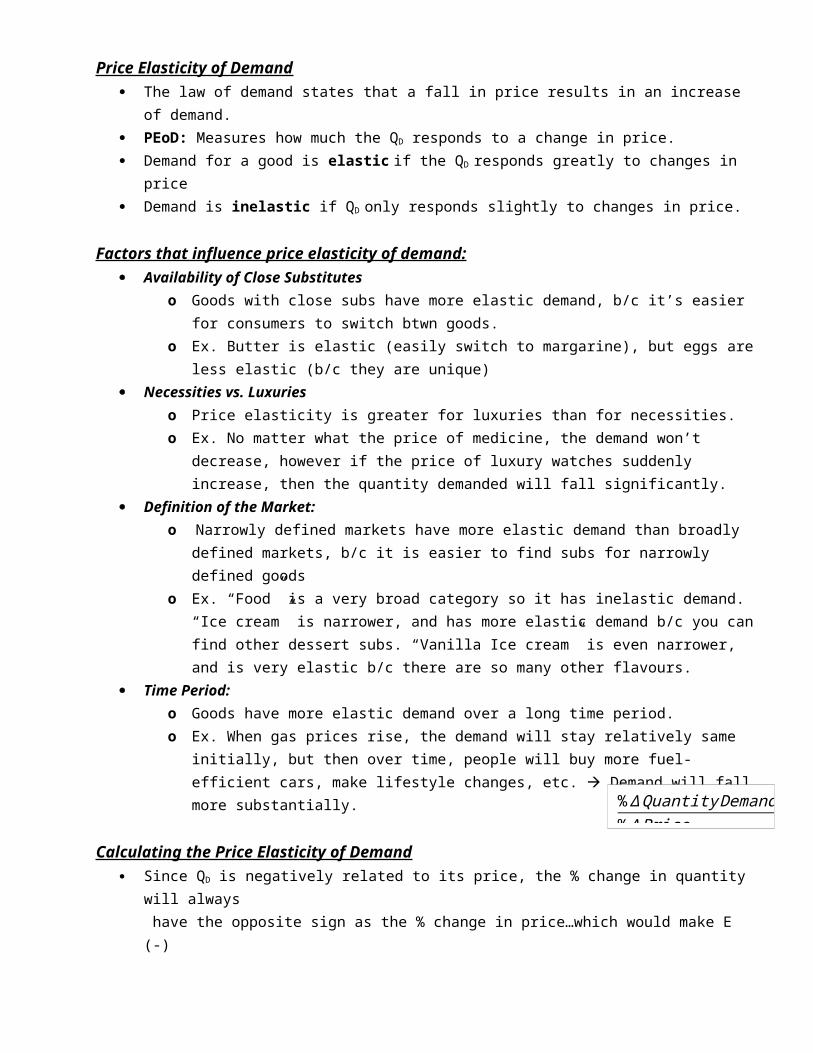
Price Elasticity of Demand The law of demand states that a fall in price results in an increase of demand. PEoD: Measures how much the QD responds to a change in price. Demand for a good is elastic if the QD responds greatly to changes in price Demand is inelastic if QD only responds slightly to changes in price.
Factors that influence price elasticity of demand: Availability of Close Substitutes
o Goods with close subs have more elastic demand, b/c it’s easier for consumers to switch btwn goods.
o Ex. Butter is elastic (easily switch to margarine), but eggs are less elastic (b/c they are unique) Necessities vs. Luxuries
o Price elasticity is greater for luxuries than for necessities.o Ex. No matter what the price of medicine, the demand won’t decrease, however if the price of
luxury watches suddenly increase, then the quantity demanded will fall significantly. Definition of the Market:
o Narrowly defined markets have more elastic demand than broadly defined markets, b/c it is easier to find subs for narrowly defined goods
o Ex. “Food” is a very broad category so it has inelastic demand. “Ice cream” is narrower, and has more elastic demand b/c you can find other dessert subs. “Vanilla Ice cream” is even narrower, and is very elastic b/c there are so many other flavours.
Time Period: o Goods have more elastic demand over a long time period.o Ex. When gas prices rise, the demand will stay relatively same initially, but then over time,
people will buy more fuel-efficient cars, make lifestyle changes, etc. Demand will fall more substantially.
Calculating the Price Elasticity of Demand Since QD is negatively related to its price, the % change in quantity will always
have the opposite sign as the % change in price…which would make E (-) Ex. Suppose a 10% rise in the price of candy caused the demand to fall by 20%,
then E = -20% / 10% = -2o Means that the change in the QD is proportionally twice as large as the change in price.o Note: in this course, we will drop the negative sign, and use absolute valueo So, a larger price elasticity means a greater responsiveness of quantity demanded to changes in
price.
Calculating % Change: Standard way:
% ΔQuantity Demanded% ΔPrice
end value –
start value
start
value
x 100%
% ΔQuantity Demanded% ΔVariable
AB Point A Point BPrice ($) 200 250Quantity 12 8
% Price = = 22.2%
% Quantity = = 40%
o The problem with using this method is that the elasticity form AB will not be equal to from BA
Midpoint Method:o The midpoint is the number halfway between the start & end values.o Doesn’t matter whether we go from AB or BA…we will get the same answer!
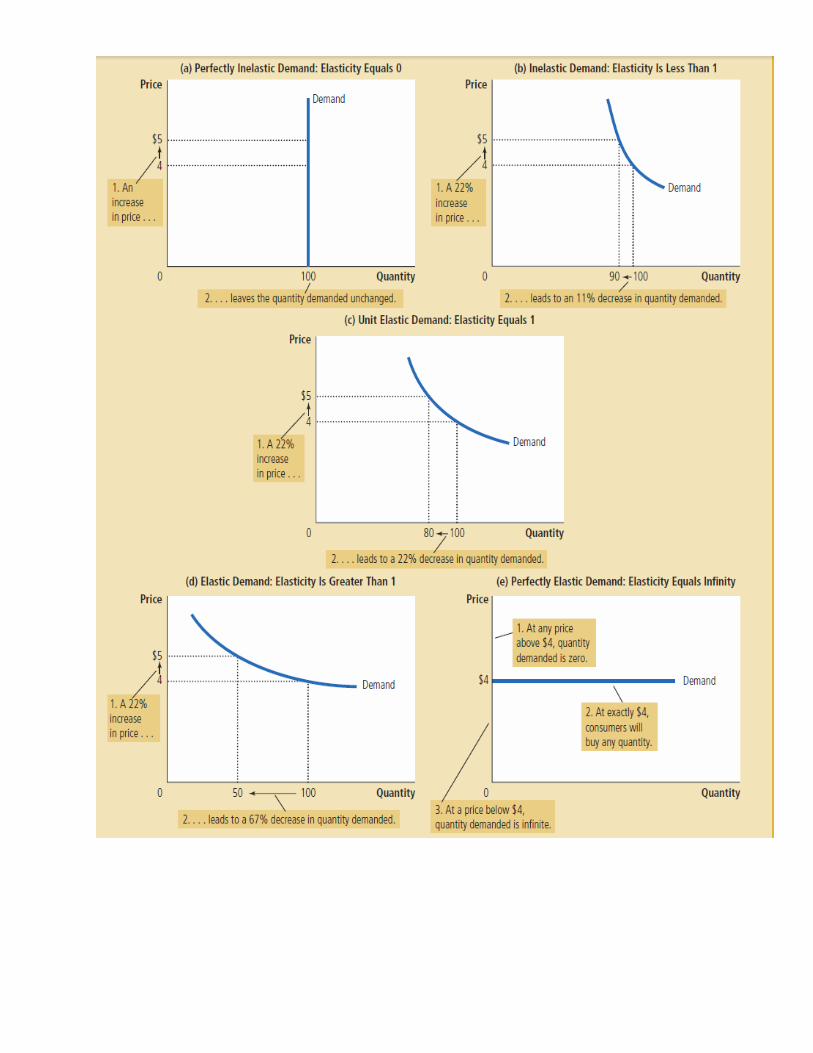
Variety of Demand Curves Economists classify demand curves according to their
elasticity. The price elasticity of demand is closely related to the slope of
the demand curve. o The flatter the curve, the greater the elasticity. o The steeper the curve, the smaller the elasticity.
1. Perfectly Inelastic Demand: E = 0 o Extremeo D-curve is vertical o QD stays the same regardless of price changes.
2. Inelastic Demand: 0 < E < 1o D-curve is relatively steepo QD doesn’t change much.o Low consumer price sensitivity
3. Unit Elastic Demand: E = 1 o D-curve is intermediateo QD changes in equal proportion to price change.o % change in price = % change in demand.
4. Elastic Demand: E > 1o D-curve is relatively flat o QD changes a loto High consumer price sensitivity
5. Perfectly Elastic Demand: E = ∞o Extremeo D-curve is horizontalo Very small changes in price can lead to huge changes in QD
end value –
start value
midpoint
x 100%
E = 40%22.2%
=
Elasticity of a Linear Demand Curves The slope of a linear demand curve is constant, but its elasticity is not. When E>1, demand is elastic When 0<E<1, demand is inelastic When E=1, demand has unti elasticity
Total Revenue and Price Elasticity TR: The total amount paid by buyers and received by the sellers of a good
o TR = P x Qo TR is represented by the area under the curve.
A price increase has 2 effects on TR:o Higher P means more revenue on each unit soldo But Law of Demand states that you will sell fewer units.
So, the impact of a price increased on TR depends on the elasticity of demand.
o When demand is inelastic, TR b/c the extra rev. from selling at a higher price overpowers the losses from selling fewer units. – Also means that no matter what the price, the quantity won’t change.
o When demand is elastic, TR b/c the drastic fall in QD overpowers the rev. form increasing the price. – Also means that since demand is sensitive, a price rise will drop sales, so lower revenue.
Inelastic Elastic Unit ElasticP & TR move in same direction P & TR move in opposite direction TR remains constant as price changes.
Other Demand Elasticities Income EoD: Measures how the QD changes as consumer incomes change.
o In calcs, price should remain constant!!
o Normal goods: Higher income raises QD Since QD and income move in the same direction, normal goods have E > 0.
Necessities have smaller income elasticities (both rich and poor need milk, eggs) Luxuries have larger income elasticities (poor people don’t buy caviar)
o Inferior goods: Higher income lowers QD Since QD and income move in opposite directions, inferior goods have E < 0
Cross-Price Elasticity: Measures how the QD of one good responds to a change in price of another good. (think substitutes and complements)
o *** Remember to keep negative signs in calcs!o Substitutes: Cross-price elasticity > 0
If the price of butter , then the QD of margarine will o Complements: Cross-price elasticity < 0
If the price of golfballs , then the QD of golfclubs will
% ΔQuantity Demanded% Δ Income
% ΔQuantity Demanded of Good A% ΔPrice of Good B
Elasticity of Supply
Price Elasticity of Supply Measures how much the Quantity Supplied of a good responds to a change in price of that good. Supply for a good is elastic if the QS responds greatly to changes in price (E>1) Supply is inelastic if QS only responds slightly to changes in price. (E<1)
Factors that influence price elasticity of supply: Flexibility of Seller
o PEoS depends on if the seller can change the amount of good they produce.o Ex. Beachfront property has an inelastic supply, b/c they can’t produce more of it.o Manufacturable goods such as books, TVs have elastic supplies.
Time Period: o Supply is usually more elastic in the long-run than in the short-run.o In the short-term, firms can’t make immediate changes in the size or # of their factories, so
supply is not very responsive to price in the short-run.
Calculating the Price Elasticity of SupplyRefer to Midpoint method.
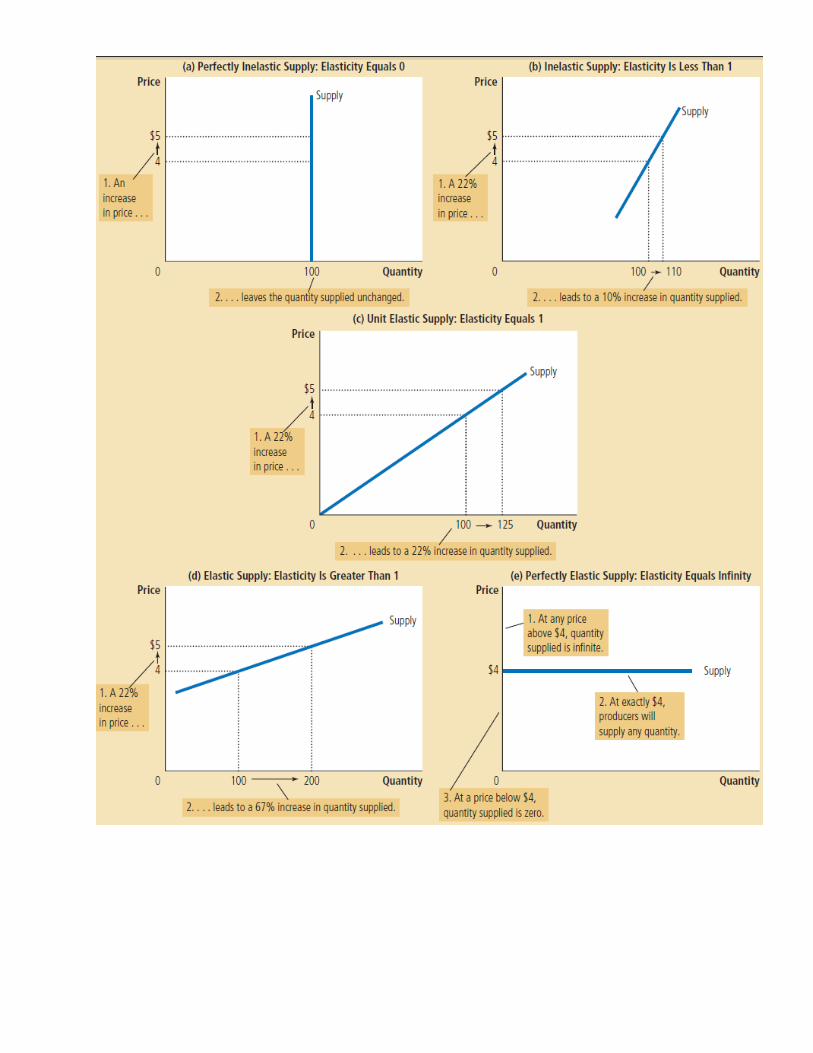
Variety of Supply Curves Economists classify supply curves according to their elasticity. The flatter the curve, the greater the elasticity. The steeper the curve, the smaller the elasticity. 1. Perfectly Inelastic Supply: E = 0
o Extreme caseo S-curve is verticalo QS does not change regardless to price.o 0 seller price sensitivity
2. Inelastic Supply: 0 < E < 1o S-curve is relatively steepo QS doesn’t change much compared to price.o Low seller price sensitivity
3. Unit Elastic Supply: E = 1 o S-curve is intermediateo QS changes in equal proportion to price change.o % change in price = % change in demand.
4. Elastic Supply: E > 1o S-curve is relatively flat o QS changes a lot compared to priceo High seller price sensitivity
5. Perfectly Elastic Supply: E = ∞o Extreme caseo S-curve is horizontalo Price does not change, but QS changes by any %
% ΔQuantity Supplied% ΔPrice
Elasticity and Changes in EquilibriumEx. Suppose demand for both beach-front properties and new cars doubled…
When supply is inelastic, demand has a greater impact on price. When supply is elastic, demand has a greater impact on quantity.
Thus, the beachfront property will shoot up in price, while the # of cars supplied will increase.
Varying Elasticity Supply often becomes less elastic as quantity rises, due to limited
capacity. At lower prices, quantity supplied is also low, but a small increase in
price will yield a large increase in Q. (therefore, elastic.) At higher prices, quantity supplied is also high, so increasing the price even more will not increase the Q
by much (because of limited capacity), therefore, inelastic.
Ch. 6 – Supply, Demand and Government Policies
Controls on Price Buyers of any good always want a lower price, while sellers want a higher price.
Price ceiling A legal maximum possible price a good can be sold at. Not binding: Eq. price is below ceiling price, so no effect Binding constraint: Eq. price is above price ceiling (so market price become ceiling price)
o Result: When the gov. imposes a binding price ceiling on a competitive market, a shortage of the good results, and sellers must ration off the scarce goods among the large number of buyers.
Ex. Rent control – max. price that landlords can charge making housing more affordable for the pooro But short-run supply and demand for housing is relatively inelastic, so only small shortageo Long-run is elastic, so larger shortage.o Downfall: Lowering rent control means that even rent will be low, it also discourages landlords
from maintaining their buildings and makes housing hard to find.
Price Floor A legal minimum price, under which a good cannot be sold. Not binding: When eq. price is above floor price, no effect. Binding constraint: When eq. price is under floor price, then market price increases to floor price =
surplus Ex. Minimum wage: Lowest price for labour/hr. that any employer must pay.
o When there is a binding minimum wage, the surplus results in unemploymento Min. wage is most binding for teenagers than any other members of the workforce.o Increasing minimum wage increases unemployment as well.
Taxes Governments use taxes to raise revenues for public projects (ie. infrastructure, schools, nat. defense) When taxes are increased, who pays? buyers or sellers, or how should it be shared? Tax incidence: How the burden of a tax is distributed among the various people who make up the
economy.Taxes on Sellers
1. Does it affect supply or demand?o Supply
2. Which way does the curve shift?o Tax on sellers raises the cost of supplying ice cream, so curve shifts to the left (upwards)
3. How does the shift affect the equilibrium price and quantity.o Buyers buy less and sellers sell less, so the tax reduces the size of the ice cream market.
Implications: Tax incidence: Although sellers send the entire tax to the gov., buyers and sellers share the burden Without tax, buyers pay $3, sellers get $3. With tax, buyers pay $3.30 and sellers get to keep $2.80
o So both parties lose out. Therefore, taxes discourage market activity. When a good is taxed, the less goods are sold at the new eq
Taxes on Buyers1. Does it affect supply or demand?
o Demand2. Which way does the curve shift?
o Tax on buyers raises the price of good, so curve shifts to the left (downwards)3. How does the shift affect the equilibrium price and quantity.
o Buyers buy less and sellers sell less, so the tax reduces the size of the ice cream market.Implications:
Tax incidence: Although sellers send the entire tax to the gov., buyers and sellers share the burden
Ch.7 – Consumers, Producers and Market Efficiency
Welfare economics: Study of how the allocation of resources affects economic well-being Allocation of resources: How much of each good is produced, which producers produce it, which
consumers consume it.
Consumer Surplus
Willingness to Pay: The maximum amount that a buyer is willing to pay for a good.
WTP measures how much a buyer values the good. If the price is less than your WTP, then you’re eager to buy, but
will refuse if it is higher. Ex. If your WTP is $100, but you end up paying only $80, then your consumer surplus is $20 Consumer surplus: The amount a buyer is willing to pay for a good minus the actual price you got it for.
Demand Curve Relationship btwn height and the buyer’s WTP:
o At any quantity, the price (height of d-curve) shows the WTP by the marginal buyer: the buyer who would leave first if the price was any higher.
Staircase shape: One buyer per step Consumer surplus is the area under the demand curve and
above the horizontal price line.
In a market with many buyers, the steps would be so tiny, that it would just look like a smooth curve.
A lower price = increased consumer surplus:o Either existing customers paying an even lower price.o New customers joining market.
What does CS measure? CS measures the benefit that buyers receive from a good as
the buyers themselves perceive it.
o Good measure of economic well-being if policymakers want to respect the buyer’s choices.o Assuming that buyers are rational when making decisions
Producer Surplus
Cost: The value of everything a seller must give up to produce a good. (opportunity cost) Includes cost of all inputs (ie. resources, money, time) A seller will only produce and sell the good if the price exceeds their cost (profitable) Cost is a measure of Willingness to Sell Often, the job goes to the seller who can do the work for the lowest cost.
Producer surplus is the amount a seller is paid minus the cost of production (ie. their profit)
o PS measures the benefit sellers receive from participating in a market.
Supply Curve At any quantity, the price shows the cost of the marginal seller (who would leave first if the price were
any lower) Producer surplus is the area below the horizontal price line and above
the supply curve. (the total are is the sum of all individual sellers’ surpluses)
Lots of sellers = smooth curve An increase in price = more producer surplus
o Existing producers get to sell at a higher price (more profit)o New sellers enter market at a higher price.
Market Efficiency
CS and PS are what economists use to study the welfare of buyers and sellers in a market.
Measuring Society’s Well being CS = Value to buyers – amount paid (Measures
benefit buyers receive from participating in the market)
PS = Price sold for – seller’s cost (Measures the benefit sellers receive from participating in the market)
Total (social) surplus = CS + PS (Measures total gains from trade in a market)
o TS = (Value to buyers) – (Cost to sellers)
Efficiency: Allocation of resources that maximizes total surplus
o The goods are being produced by the sellers with lowest costo The goods are being consumed by the buyers who value them most highly (Highest WTP)
Equality: Distributing economic well-being fairly among members of society.
Evaluating Market Equilibrium AE: Buyers who value the good more than price buy the good. CE: Sellers whose costs are lower than the eq. price will choose to produce and sell the good.
3 Insights about free market outcomes: Free markets allocate the supply of goods to buyers who value them highest (WTP) Free markets allocate the demand for goods to sellers who can produce them at the lowest cost. Free markets produce the quantity of goods that maximizes the sum of consumer and producer surplus.
The market equilibrium is efficient b/c the value to buyers exceeds the cost to sellers.Economic well-being cannot be increased by changing the allocation of consumption among buyers or the allocation of production among sellersThe government cannot improve on the market outcome. Laissez faire: The government should not interfere with the market
Market failures: When unregulated markets fail to allocate resources efficiently
o Market power: A single buyer or seller can influence the market prices (ie. monopoly)o Externalities: Side effects of transactions (ie. pollution)o When markets fail, public policy may remedy the problem and increase efficiencyo Invisible hand remains very important


![PRINCIPLES OF MICROECONOMICS NOTES [For Class Test 1]michaelcornish.org/wp-content/uploads/2016/02/Principles-of... · PRINCIPLES OF MICROECONOMICS, UPNG, SEMESTER 1, 2016 Property](https://static.documents.pub/doc/80x56/5b05c6c17f8b9ac33f8bd8b5/principles-of-microeconomics-notes-for-class-test-1-of-microeconomics-upng-semester.jpg)


