Ecohydrology of a seasonal cloud forest in Dhofar: 1. Field experiment Anke Hildebrandt, 1,2 Mohammed Al Aufi, 3 Mansoor Amerjeed, 4 Mahaad Shammas, 4 and Elfatih A. B. Eltahir 1 Received 19 June 2006; revised 21 February 2007; accepted 12 June 2007; published 9 October 2007. [1] We describe the ecohydrology of a unique semiarid broadleaf deciduous forest in Dhofar (Oman). The forest is surrounded by desert and is confined to a coastal area, where the summer wet season is characterized by a persistent dense cloud immersion. Using field observations, we show how clouds render the ecosystem particularly water conserving and therefore create a niche for a moist forest biome in a semiarid area in three ways. First, horizontal precipitation (collection of cloud droplets on tree canopies) added valuable water, such that about two times as much water was received below the canopy (net precipitation) compared to above (rainfall). Second, high stemflow, of about 30% to net precipitation, led to concentrated water input around the stems. Third, transpiration was suppressed during the cloudy summer season, which allowed for storage of the received water. It was only used after the end of the wet season and lasted for the following 3 months, which roughly doubled the length of the growing season. Our results demonstrate that cloud immersion may shape ecosystem hydrology in significant ways, particularly in semiarid environments. Citation: Hildebrandt, A., M. Al Aufi, M. Amerjeed, M. Shammas, and E. A. B. Eltahir (2007), Ecohydrology of a seasonal cloud forest in Dhofar: 1. Field experiment, Water Resour. Res., 43, W10411, doi:10.1029/2006WR005261. 1. Introduction [2] The vastness of the Arabian Desert is striking, even when seen from space. Less noticeable is a small area at its southern border on the Indian Ocean. Unexpectedly, a narrow band of lush vegetation spreads along the coastal mountains from western Oman further into Yemen. These are the Dhofar Cloud Oases, a remnant of a former moist vegetation belt of paleo-African origin [Kurschner et al., 2004; Meister et al., 2005]. When the climate on the Arabian Peninsula turned dry, most of the previously moist vegetation gave way to the desert. Under the present arid climate, forests occur only at the southern coast of the Arabian Peninsula, where the desert climate gets interrupted in summer by a foggy moist season that immerses the coastal mountains in clouds. [3] Today, the cloud oases are among the most diverse ecosystems of the Arabian Peninsula [Fisher et al., 1998] and the lush vegetation gives the impression of a relatively moist climate. However, despite a moist season in summer, the climate is overall only semiarid (120 –250 mm annual rainfall at 21°C average annual temperature) and rather characteristic for a semidesert biome, not forest. In fact, most climate-vegetation charts indicate that in a climate with annual temperature of 21° –26°C, and a short 3 month long moist season, forest vegetation would only be expected at annual precipitation of the order of 1000 mm (e.g., charts by Bonan [2002] and Huggert [1995]), roughly four times the rainfall reported from climate stations in Dhofar. It appears that the fog during the moist season does more than add water to this region. [4] Ecosystems that depend on persistent seasonal or annual fog are called cloud forests [Bubb et al., 2004]. Cloud forests have received increased attention in recent years because of their high biodiversity, exceptional hydrol- ogy and their sensitivity to environmental change that makes them particularly vulnerable [Bruijnzeel and Hamilton, 2000; Ray et al., 2006; Still et al., 1999]. They are usually described as dense evergreen ecosystems, receiving abun- dant precipitation. However, investigations indicate that their hydrology is favorable for low water use, as incoming radiation and transpiration rates are suppressed [Bruijnzeel and Veneklaas, 1998]. Moreover, during fog, trees gain additional water from intercepting cloud droplets with their canopies, a phenomenon known as horizontal precipitation. Most of the cloud forests, where hydrologic investigations have already been carried out, are located in the moist tropics, where annual rainfall is high, i.e., greater than 2000 mm [Bruijnzeel, 2001]. In these environments, the low transpiration and additional water from horizontal precipitation does not influence water availability for plants significantly. In moist cloud forests, the cloud immersion impacts tree morphology (i.e., stunted trees; see reviews by Bruijnzeel and Hamilton [2000] and Foster [2001]), abun- dance of epiphytes [Sugden and Robins, 1979] and leads possibly to enhanced recharge of underlying aquifer and 1 Department for Civil and Environmental Engineering, Massachusetts Institute of Technology, Cambridge, Massachusetts, USA. 2 Now at UFZ Helmholtz Centre for Environmental Research, Leipzig, Germany. 3 Ministry of Regional Municipalities, Environment and Water Resources, Muscat, Oman. 4 Ministry of Regional Municipalities, Environment and Water Resources, Salalah, Oman. Copyright 2007 by the American Geophysical Union. 0043-1397/07/2006WR005261$09.00 W10411 WATER RESOURCES RESEARCH, VOL. 43, W10411, doi:10.1029/2006WR005261, 2007 Click Here for Full Article 1 of 13
Transcript
Ecohydrology of a seasonal cloud forest in Dhofar:
1. Field experiment
Anke Hildebrandt,1,2 Mohammed Al Aufi,3 Mansoor Amerjeed,4 Mahaad Shammas,4
and Elfatih A. B. Eltahir1
Received 19 June 2006; revised 21 February 2007; accepted 12 June 2007; published 9 October 2007.
[1] We describe the ecohydrology of a unique semiarid broadleaf deciduous forest inDhofar (Oman). The forest is surrounded by desert and is confined to a coastal area, wherethe summer wet season is characterized by a persistent dense cloud immersion. Usingfield observations, we show how clouds render the ecosystem particularly waterconserving and therefore create a niche for a moist forest biome in a semiarid area in threeways. First, horizontal precipitation (collection of cloud droplets on tree canopies) addedvaluable water, such that about two times as much water was received below thecanopy (net precipitation) compared to above (rainfall). Second, high stemflow, of about30% to net precipitation, led to concentrated water input around the stems. Third,transpiration was suppressed during the cloudy summer season, which allowed for storageof the received water. It was only used after the end of the wet season and lasted forthe following 3 months, which roughly doubled the length of the growing season. Ourresults demonstrate that cloud immersion may shape ecosystem hydrology in significantways, particularly in semiarid environments.
Citation: Hildebrandt, A., M. Al Aufi, M. Amerjeed, M. Shammas, and E. A. B. Eltahir (2007), Ecohydrology of a seasonal cloud
forest in Dhofar: 1. Field experiment, Water Resour. Res., 43, W10411, doi:10.1029/2006WR005261.
1. Introduction
[2] The vastness of the Arabian Desert is striking, evenwhen seen from space. Less noticeable is a small area at itssouthern border on the Indian Ocean. Unexpectedly, anarrow band of lush vegetation spreads along the coastalmountains from western Oman further into Yemen. Theseare the Dhofar Cloud Oases, a remnant of a former moistvegetation belt of paleo-African origin [Kurschner et al.,2004; Meister et al., 2005]. When the climate on theArabian Peninsula turned dry, most of the previously moistvegetation gave way to the desert. Under the present aridclimate, forests occur only at the southern coast of theArabian Peninsula, where the desert climate gets interruptedin summer by a foggy moist season that immerses thecoastal mountains in clouds.[3] Today, the cloud oases are among the most diverse
ecosystems of the Arabian Peninsula [Fisher et al., 1998]and the lush vegetation gives the impression of a relativelymoist climate. However, despite a moist season in summer,the climate is overall only semiarid (120–250 mm annualrainfall at 21�C average annual temperature) and rathercharacteristic for a semidesert biome, not forest. In fact,
most climate-vegetation charts indicate that in a climatewith annual temperature of 21�–26�C, and a short 3 monthlong moist season, forest vegetation would only be expectedat annual precipitation of the order of 1000 mm (e.g., chartsby Bonan [2002] and Huggert [1995]), roughly four timesthe rainfall reported from climate stations in Dhofar. Itappears that the fog during the moist season does morethan add water to this region.[4] Ecosystems that depend on persistent seasonal or
annual fog are called cloud forests [Bubb et al., 2004].Cloud forests have received increased attention in recentyears because of their high biodiversity, exceptional hydrol-ogy and their sensitivity to environmental change that makesthem particularly vulnerable [Bruijnzeel and Hamilton,2000; Ray et al., 2006; Still et al., 1999]. They are usuallydescribed as dense evergreen ecosystems, receiving abun-dant precipitation. However, investigations indicate thattheir hydrology is favorable for low water use, as incomingradiation and transpiration rates are suppressed [Bruijnzeeland Veneklaas, 1998]. Moreover, during fog, trees gainadditional water from intercepting cloud droplets with theircanopies, a phenomenon known as horizontal precipitation.Most of the cloud forests, where hydrologic investigationshave already been carried out, are located in the moisttropics, where annual rainfall is high, i.e., greater than2000 mm [Bruijnzeel, 2001]. In these environments, thelow transpiration and additional water from horizontalprecipitation does not influence water availability for plantssignificantly. In moist cloud forests, the cloud immersionimpacts tree morphology (i.e., stunted trees; see reviews byBruijnzeel and Hamilton [2000] and Foster [2001]), abun-dance of epiphytes [Sugden and Robins, 1979] and leadspossibly to enhanced recharge of underlying aquifer and
1Department for Civil and Environmental Engineering, MassachusettsInstitute of Technology, Cambridge, Massachusetts, USA.
2Now at UFZ Helmholtz Centre for Environmental Research, Leipzig,Germany.
3Ministry of Regional Municipalities, Environment and Water Resources,Muscat, Oman.
4Ministry of Regional Municipalities, Environment and Water Resources,Salalah, Oman.
Copyright 2007 by the American Geophysical Union.0043-1397/07/2006WR005261$09.00
W10411
WATER RESOURCES RESEARCH, VOL. 43, W10411, doi:10.1029/2006WR005261, 2007ClickHere
for
FullArticle
1 of 13
river flow [Zadroga, 1981]. In a semiarid environment, onthe other hand, where water is the primary limiting factor tovegetation growth, horizontal precipitation and low transpi-ration demand might have a significant impact on plantavailable water, and thus shape the vegetation more signif-icantly. While still only a limited number of studies oncloud forest hydrology have been conducted, those locatedin water-limited environments are particularly rare. Knownexamples include rain forests in Australia [Hutley et al.,1997], forests in Africa [Hursh and Pereira, 1953], Hawaii[Juvik and Nullet, 1995] and Chile [i.e., del-Val et al.,2006]. In these studies, researchers pointed out the impor-tant role of cloud cover for maintaining vegetation that wascharacteristic for moister conditions.[5] In Dhofar, the zone of influence of the seasonal cloud
cover and fog limits the extension of the forests [Miller and
Morris, 1988]. However, up to now, no scientific investi-gation has been carried out on the role of clouds formaintaining plants. Also, no information exists about theamount of water that is actually available for the vegetation.Following an increase in the local livestock population theextent of the forest has progressively diminished. Efforts forprotection and reforestation are under way, but for those tobe efficient, first the question has to be answered how theforest maintains itself. A government study during the1980s, conducted using artificial collectors, suggested thathorizontal precipitation adds two to four times as muchwater as rainfall to a typical site. This number has sincebeen referred to as the expected amount of horizontalprecipitation gained from vegetation [i.e., Miller, 1994]. Inthe following we use field observations to draw a picture ofthe annual cycle of water fluxes, and water storage to shedlight on the question of how lush vegetation and treessurvive in this comparatively dry environment.[6] This paper is the first in a series of two papers
investigating the role of cloud cover for forest survival overDhofar (Oman). Both papers attempt to improve under-standing of the mechanistic interactions and the hydrolog-ical processes by which cloud cover enables and favorsgrowth of trees under semiarid climate conditions. Thispaper presents the results of a field experiment, while thesecond paper [Hildebrandt and Eltahir, 2007], uses anumerical model to study the same processes. An indepen-dent follow-up paper (A. Hildebrandt and E. A. B. Eltahir,A feedback process between atmospheric cloud depositionand vegetation height, manuscript in preparation, 2007) willdeal with a feedback between horizontal precipitation andvegetation height, which highlights the fragility of water-limited cloud forests. A summary of these results hasalready been published [Hildebrandt and Eltahir, 2006].Our research helps to explain how the environment in thisregion presents an ecological niche for tree cover, althoughthe low rainfall and high annual temperature suggest that thevegetation should be thinner and more xeric.
2. Geography of the Area
[7] The area of interest are the forests on the seawardpointing slopes of a coastal mountain range in the southwestof the Sultanate of Oman, extending west toward Yemen. Itis about 200 km long and at the maximum 20 km wide, thehighest elevation of the mountain range is about 1500 m.This ecosystem is surrounded by desert. Figure 1a shows asatellite image of the Arabian Peninsula, the area of interestis marked with a red circle. During the moist season insummer, locally called the khareef, moist air from the oceanpushes against the mountains, resulting in orographic cloudformation and drizzle along the mountain range. Thevertical extent of the cloud cover is limited by an overlayinginversion (Figure 1b). The areal extent of the summer cloudcover also defines the lush vegetation belt in the coastalmountain range and the coastal plain [Miller and Morris,1988]. With some annual variation the khareef seasonusually lasts from mid-June to mid-September (3 months),and is the most reliable source of precipitation. Additionally,rainfall from strong cyclones occurs, but those events arerare (one in three to four years [Brook and Shen, 2000]).Recorded annual rainfall is about 100 and 250 mm, mea-sured at climate stations at the coast and mountain crest,
Figure 1. Geography of the area of interest. (a) Satelliteimage of the Arabian Peninsula. The region of interest iscircled in red; note the half-moon shape of the coastalmountain range. Picture provided by the SeaWiFS Project,NASA Goddard Space Flight Center, and ORBIMAGE,http://visibleearth.nasa.gov. (b) Meteorological situation inDhofar during the khareef.
2 of 13
W10411 HILDEBRANDT ET AL.: SEASONAL CLOUD FOREST, 1 W10411
respectively. Most of the annual rainfall is provided duringthe khareef (55 and 220 mm, respectively).
3. Study Site
[8] The field experiment was set up in the Jabel al Qara,in a forest patch at about 17.12�N, 54.6�E approximately450 m above sea level and 20 km away from the coast.Figure 2 shows a picture of the site. The patch stretchesalong the hillslope for some 100 m, and also includes largeropenings. Since the site is located near the village calledGogub, it will be referred to in the rest of this work by thisname. The site is sloped between 0�–10� southward (170�from magnetic north), which is also the prevailing winddirection during the monsoon season. The tree cover con-sists of one species (Anogeissus dhofarica), a perennialbroadleaf drought deciduous tree, which is endemic in thisregion [Miller and Morris, 1988]. The growing season ofAnogeissus dhofarica starts with the first rains (usually inmid-June) and the last leaves are shed in December,3 months after the last rainfall. The site was set up underclosed canopy, adjacent to a small opening in the West (leeside). The experimental plot has an area of 86 m2, andsupports 24 trees. A second vegetation layer below the treesis composed of annual herbs and grasses. The height of theupper canopy is about 6.5 m. The conditions at the site are
representative of those up to 60 m downslope (south), 30 mupslope (north), and 20 m to the East.
4. Methods
4.1. Meteorological Data
[9] Temperature and relative humidity (HMP45C, Vaisala,Inc., Woburn (MA), USA), incoming shortwave radiation(LI200x, Li-Cor, Inc, Lincoln (NE), USA), wind directionand wind speed (03001-5 Wind Sentry Set, R.M. YoungCompany, Traverse City (Mi), USA) were measured every30 s and averaged over 15 min periods. Rainfall wasmeasured using a horizontal tipping bucket rain gauge(TE525, Texas Electronics Inc., Dallas (TX) USA) andaggregated over 15 min periods. The sensors for themeteorological measurements were mounted at 2.5 m (windspeed/direction, incoming shortwave radiation, rain) and 2 m(relative humidity/temperature) above the canopy top (at 8.5and 9 m above ground respectively).
4.2. Rainfall Correction
[10] The rainfall measurement was corrected for wind-induced loss and for slope and aspect. A rain gauge acts asan obstacle in the wind field, thus causing turbulencearound it. This turbulence might lead to deviation of someraindroplets away from the rain gauge orifice. This windinduced loss leads to underestimation of rainfall. FollowingFørland et al. [1996], we corrected the rainfall measurementfor wind induced loss by multiplying with a correctionfactor fw:
RO ¼ fw � R; ð1Þ
where RO (mm/h) and R (mm/h) represent the corrected andgauge-measured rainfall intensity respectively. The factor fwis calculated from R and wind speed u (m/s) as follows,
fw ¼ expð�0:001 � ln R� �� 0:0122 � u � ln R
� �þ 0:034 � uþ 0:0077Þ: ð2Þ
Furthermore, the rainfall received on an inclined surfacediffers from the rainfall received by the projected horizontalarea. Therefore rainfall measurements using a horizontalrain gauge do not reflect the amount of water received bythe sloping ground. The difference depends on the slope, theaspect of the slope and the inclination of the incidentprecipitation. Measurements from a conventional horizontalrain gauge can be corrected to represent the amountreceived at the sloping ground using a trigonometricalmodel as shown by Sharon [1980]:
R ¼ RO � fS ð3Þ
fS ¼ 1þ tan að Þ tan tð Þ cos za � zbð Þ; ð4Þ
where fS is the slope correction factor, a refers to the slopeof the hill (10�), t (degrees) is the inclination of the rainfallvector, za is the direction of the slope (170�), and zb(degrees) is the prevailing wind direction during theinterval. We calculated t from its two components:
Figure 2. Picture of the field site Gogub. The deciduousAnogeissus dhofarica trees surround the tower withmounted meteorological sensors at 9 m height.
W10411 HILDEBRANDT ET AL.: SEASONAL CLOUD FOREST, 1
3 of 13
W10411
horizontal wind speed u and terminal fall velocity of theraindrop vg (m/s)
tan bð Þ ¼ u
vg: ð5Þ
Terminal fall velocity was approximated from dropletdiameter D (mm) using a fitted curve on the experimentaldata obtained by Gunn and Kinzer [1949]:
vg Dð Þ ¼ 3:464 � ln Dð Þ þ 4:142; ð6Þ
which gives an excellent fit (r2 = 0.997) for the droplet sizerange of interest (D = 0.5 to 4.0 mm). The droplet diameterwas calculated from the wind-corrected rainfall intensity RO
using the relationship from Laws and Parsons [1943]
D ¼ 2:23 0:03937 � ROð Þ0:102: ð7Þ
The correction was applied to one hour cumulated timeseries, using the average wind speed and prevailing winddirection during the same interval.
4.3. Throughfall
[11] Throughfall was measured using two techniques:(1) throughfall from four fixed tipping bucket rain gauges(same as rainfall and connected to a SDM-SW8A SwitchClosure Module, Campbell Scientific, Logan (UT), USA),which were installed at random points below the canopy,and (2) for a limited time (7 days, 1 September to 7 September2003) throughfall measured using an inclined plastic sheet(1.8 � 2.4 m), which was spanned below the canopy, suchthat the received water was collected by a tipping bucketrain gauge. In both cases the measurements were summedover 15 min periods.
4.4. Spatial Variability of Throughfall
[12] Bootstrap analysis was used to determine variabilityof throughfall. For each period of interest, we created sets offour throughfall measurements, by sampling with replace-ment from the original measurements of the four buckets.We calculated the mean of each of those sets of four. Byrepeating this procedure 10.000 times we created an empir-ical probability density function (edf) of the throughfallaverage. We indicate the 0.05 and 0.95 percentiles as theconfidence interval.[13] In addition, we tested whether the bucket average
captured spatial variability at the level of the size of thesheet. Because the sheet covered a large enough area toaverage out some of the spatial variability of throughfall, itwas used as a reference of the ‘‘true spatial averagethroughfall.’’ We tested two null hypotheses: (1) the meanof the two throughfall time series, i.e., measured using thesheet and the average of a given combination of throughfallgauges, are the same; (2) the ratio of variances of the twotime series is not different from 1. We performed a bootstrapanalysis to estimate the edf of the bucket data. We sampledwith replacement from the bucket measurements at eachtime step of a three hour aggregated time series thencalculated the mean and variance of the new time series.The procedure was repeated 10.000 times, thus creating anedf of means and variances of the time series. We rejectedthe null hypothesis if the control value fell outside the 0.05
or 0.95 percentile (double sided test). If either or both nullhypotheses were rejected we concluded that the measure-ment of the sheet and the throughfall buckets were different.We performed the analysis on different combinations ofthroughfall gauges: on all possible combinations of pairs(6 pairs), on all possible combinations of triplets (4 triplets),and on all four gauges.
4.5. Estimation of Throughfall for 2004
[14] After December 2003 only one (TF5) of the fourthroughfall gauges was operational as a result of brokensignal cables, so for summer 2004 only measurements ofone throughfall gauge were available. The spatial averagethroughfall measured with four fixed throughfall bucketsand the throughfall from the single bucket TF5 correlatewell (r2 = 0.88), and the regression line has a slope of 1.26.Thus, at its location, TF5 underestimates the spatial averagethroughfall in a consistent fashion, and we therefore use therelation TF = 1.26 * TF5 to estimate actual throughfall afterDecember 2003 (see also section 6).
4.6. Stemflow
[15] Stemflow was measured using collar type flanges(PVC) slung around 6 stems of various sizes. A PVC tubeleads from the collar to the collection container, which had avolume of 6 L until 26 June 2004, and 22 L thereafter. Thecollected amount was measured at every field visit (aboutonce per week in 2003 and every 2–5 days in 2004).Collected stemflow volume was independent of tree sizeclass (data not shown). Therefore the equivalent precipita-tion height contributed by stemflow was calculated from thevolume average collected from the six sampled stems,which was then multiplied by the tree density (number ofstems per square meter) in Gogub, 0.28 per m2.
4.7. Estimation of Stemflow Variability
[16] We estimated the variability of stemflow around thecalculated mean similarly as for throughfall, from an edfcreated using bootstrap analysis. We indicate the values atthe 0.05 and 0.95 percentiles respectively as the upper andlower limits of the confidence interval.
4.8. Soil Water Status
[17] Soil water status was measured using capacitanceprobes (C probes) manufactured by Sentek Pty Ltd(Australia) at four locations around the tower. One profilewas sampled automatically every two hours using anenviroSMART probe (Sentek Pty Ltd, Stepney, Australia,connected to the data logger) with six individual capacitancesensors stacked inside a plastic access tube at depths of 5 cmto 65 cm and spaced 10 cm. The other three locations weresampled manually during field visits (about once per week)using a mobile capacitance sensor (Diviner, Sentek Pty Ltd,Stepney, Australia), which was moved up and down inpreinstalled plastic access tubes. The maximum measure-ment depth of the three access tubes was 40, 50 and 60 cm,respectively. The depth increment between measurementswas 10 cm.[18] Calibration of the sensor would usually yield an
equation by which the volumetric soil water content canbe calculated from the capacitance measurement. However,loose stones created gaps of varying size between accesstube and soil during installation, thus making a gravimetriccalibration impossible. We therefore defined an alternative
4 of 13
W10411 HILDEBRANDT ET AL.: SEASONAL CLOUD FOREST, 1 W10411
value (SM*) that references the measured signal over theobserved range and allows for qualitative assessment of thechange of soil water storage:
SM* ¼ Fn � Fmin
Fmax � Fmin
; ð8Þ
where SM* is defined here as a referenced soil saturation ata given tube and soil depth, Fn is the observed (raw) signalat time n, Fmax and Fmin are respectively the maximum andminimum signal reading observed during the wholemeasurement campaign at a certain point. SM* rangesbetween 0 and 1 encompassing the lowest and highestobserved water content respectively. If the two knownreadings were ‘‘completely dry’’ and ‘‘completely satu-rated,’’ SM* would be a good proxy for the actual soilsaturation. An SM* value of 0 is associated with very lowsoil saturation. Prior to the onset of the monsoon in 2003 atest hole was augured, to a depth of 170 cm. Despite astrong monsoon in 2002, from visual inspection the soilappeared as dry at all depths. Our spring measurementsreflect these dry conditions. On the other hand, we have noindication about what water content SM* = 1 correspondsto. It is thus important to note that because SM* = 1 reflectsdifferent volumetric soil water contents at differentmeasurement points, SM* is strictly specific to a singlelocation (defined both by access tube and measurementdepth). Nevertheless, SM* allows tracking of soil moistureat a certain place as a function of time and is a reliableindicator for the arrival of wetting fronts and the emptyingof soil water storage.
4.9. Sap Velocity
[19] Sap velocity was measured using the heat dissipationmethod first proposed by Granier [1987]. Installation wasdone during foggy weather. Pairs of 3 cm long needles wereinserted into predrilled holes in a trunk one above the other,approximately 10 cm apart. During drilling the color of thedrilled wood was checked to ensure that the dark coloredheartwood was not reached. Both needles were equippedwith a Copper-Constantan thermocouple, which returned avoltage signal to the data logger. The upper needle washeated by supplying a heater coil with 0.17 W, using aconstant voltage supply. Heating was discontinuous with a20 min long heating cycle and 20 min pause between eachheating period. Observation of the raw signal indicated thatthe sap flow head reached equilibrium after about 16 min.The voltage difference was recorded every two minutes. Weused altogether three sap flow sensors installed at aboutbreast height on two different trees, with 7.5 cm (onesensor) and 21 cm diameter (two sensors) diameter at breastheight respectively. The sensor in the smaller tree wasintroduced only to 1.5 cm, in the thicker tree to 3 cm. Allsensors point toward a similar direction. The sensor endswere sealed with silicone to prevent cooling from waterrunning down the stem, and were covered with reflectingsheets and plastic to prevent wetting and differential heatingof the stem. The sap velocity Ju (m
3 m�2 s�1) was derivedfrom the calibration of Granier [1987],
Ju ¼ 119 � 10�6 � DTo �DT
DT
� �1:231
; ð9Þ
where DT (�C) refers to the temperature difference betweenthe upper and the lower needle after 20 min heating, andDTo (�C) to the (maximum) temperature difference betweenupper and lower needle, i.e., at zero sap flow. We chose themaximum temperature difference during a 1 month periodto reflect zero sap flow and therefore DTo.
4.10. Cloudiness
[20] Using daily values of measured incoming shortwaveradiation S (in W/m2) and theoretical incident shortwaveradiation on top of the atmosphere Sa (W/m2), we calculatedcloudiness, b, according to Henderson-Sellers et al. [1987]:
b ¼ Sclear � S
Sclearð10Þ
Sclear ¼ ta � Sa; ð11Þ
where ta is the transmissivity of the atmosphere under clearconditions. We assumed a constant ta = 0.75 and found thatthe resulting Sclear fit well with the maxima of measureddaily incoming shortwave radiation throughout the mea-surement period.
4.11. Potential Evaporation
[21] Potential evaporation was calculated from the mete-orological data using the Penmann-Monteith equation for acompletely wet canopy (i.e., stomatal resistance is zero):
lE ¼RnDþ racP
raesat T a
� �� e� �
Dþ g; ð12Þ
where Rn (W/m2) is net radiation, D (Pa/K) is the slope ofthe saturation vapor pressure versus temperature curve, cp(J/kgK) the specific heat of air, ra (kg/m3) is the density ofair, esat (Pa) and e (Pa) are the saturated and ambient vaporpressure at measured ambient temperature T a (K), g (Pa/K)is the psychometric constant, and ra (s/m) is the aero-dynamic resistance. We estimated Rn according to thecomponent approach as described by Burman and Pochop[1994]:
Rn ¼ S 1� að Þ þ Ccloud Ld;clear � Lu� �
; ð13Þ
where Ccloud (�) is a parameter depending on cloudiness,Ld,clear (W/m2) the estimated clear sky downward longwaveradiation, Lu (W/m2) the estimated upward longwaveradiation. The albedo a (�) depends on vegetation type.Values for deciduous broadleaf forest range around a = 0.2(i.e., 0.15–0.25 [Brutsaert, 1982] and 0.18–0.22, [Bras,1990]. The cloudiness factor Ccloud in equation (13) iscalculated as (Weiss [1982], cited by Burman and Pochop[1994]):
Ccloud ¼ 0:4þ 0:6Sclear
S
� �: ð14Þ
W10411 HILDEBRANDT ET AL.: SEASONAL CLOUD FOREST, 1
5 of 13
W10411
The upward surface longwave radiation is calculated asradiation from a grey body
Lu ¼ TSð Þ4� es � s; ð15Þ
where Ts (K) is equivalent to the surface or canopytemperature. Because the canopy temperature was notmeasured, we make the assumption that the temperaturemeasured two meters above the canopy is a good estimatefor canopy temperature; thus Ts � T a. The surfaceemissivity es is assumed with es = 0.97 for vegetatedsurfaces [Brutsaert, 1982]. The clear sky downward long-wave radiation Ld,clear was similarly estimated as
Ld;clear ¼ T a
� �4� ea � s; ð16Þ
where ea stands for the atmospheric emissivity, and ea isestimated as [Brutsaert, 1982]
ea ¼ 1:24 � 0:01 � eTa
� �1=7
: ð17Þ
5. Results
[22] The collected data cover almost two growing sea-sons, which were different in character. While the khareef in2004 was usual, the monsoon in 2003 was very short anddry. The median of khareef rainfall is 154 mm near themountain crest (Quairoon Hairitti, from 13 years of data)and 54 mm near the coast (Salalah, from 20 years of data).During the short monsoon in 2003 the khareef rainfall wasonly 69 mm at the mountain crest and 29mm at the coastrespectively, which compares to 130 mm and 43 mm duringthe somewhat drier than normal monsoon in 2004.
5.1. Seasonality of Cloud Cover
[23] The incoming shortwave radiation (Figure 3) gives agood picture of the annual pattern of cloudiness (plotted in
Figure 4), which is roughly bimodal: cloudiness is close to0% outside the monsoon season (the sky is almost alwaysclear), while cloudiness is 80–90% during the monsoon.Daily maxima of incoming shortwave radiation were muchlower during monsoon (median 328 W/m2) than outside ofthe monsoon (median 900 W/m2) and most frequentlyoccurred in the hours around noon time (data from 2004,not shown) throughout the year. According to personalobservation during many years, cloudiness occurs usuallyas fog and immerses vegetation during the monsoon. Fogwas also frequently observed during field visits. For exam-ple, during the khareef of 2004, light or dense fog wereobserved (visual observation) during most of the field visits(20 of 26) between the first (23 June) and last recordedthroughfall (16 September).[24] Figure 5 shows the impact of the annual cloudiness
pattern on the temperature at the field site. Plotted are dailymean, maximum and minimum temperature as measured inGogub from mid-October 2003 to mid-October 2004.Outside the monsoon the mean temperature followed theseasonal cycle of solar insolation on top of the atmosphere(Figure 3) and temperature differences between day andnight are large (up to 15�C). With the start of the cloudymonsoon season the mean daily temperature dropped (froman average of 28�C during the first half of June to anaverage 24�C second half of June) and kept decreasingthroughout the monsoon. Toward the end of the monsoondaily averages reached values comparable to the winter,although insolation on top of the atmosphere was at itsannual maximum. Also during this time, daily temperaturevariation was suppressed, usually varying by less than 3�Cbetween day and night.
5.2. Rainfall
[25] Rainfall during the khareef 2003 was frequent, but oflow intensity. Between the beginning of the measurementcampaign (3 August 2003) and the last rain of the monsoon(13 September 2003) rainfall was detected on 33 of 42 days.
Figure 3. Daily mean incoming shortwave radiation for19 October 2003 to 19 October 2004 measured at theclimate station in Gogub (solid line) and theoretical on topof the atmosphere (dash-dotted line).
Figure 4. Cloudiness parameter b (as defined in equation(10)) for 19 October 2003 to 19 October 2004, based ondaily averages of incoming radiation; the black bars on thex axis denote periods of missing data, and the gray barshows the period of the monsoon season.
6 of 13
W10411 HILDEBRANDT ET AL.: SEASONAL CLOUD FOREST, 1 W10411
However, intensities were low, with 21 of 33 days receivingless than 1 mm rainfall per day. Maximum daily rainfallduring the cloudy period was 6.2 mm. The measurementcampaign started shortly after the late monsoon onset andduring the following August and September 2003 cumulatedrainfall was only 37 mm. Between the end of the monsoonand the end of the calendar year rainfall occurred on twomoredays (27 September and 3October 2003), yielding cumulatedrainfall 4.1 mm and 1.4 mm, respectively.
5.3. Throughfall
[26] Throughfall received between 3 August and 13 Sep-tember 2003 was 50 mm. Maximum daily throughfall was9.7 mm. Throughfall occurred on 35 of 42 days, on 4 daysthroughfall was registered in the absence of rainfall, and on2 days no throughfall occurred although rainfall wasdetected. During the moister khareef of 2004 (24 June to16 September 2004) accumulated throughfall was 145 mm(n = 71) with 14 days of missing data. On 61 of 71 daysthroughfall was detected. Maximum daily throughfall in2004 was 9.6 mm similar as in 2003, but days with elevatedthroughfall were more common in 2004 then 2003. Forexample, of all days during khareef when throughfall wasdetected at all, it was greater than 1 mm on 74% of days in2004, and only on 42% of days in 2003. Throughfall duringthe rain events outside the khareef was 2.4 mm and less than0.1 mm for the rain events on 27 September and 3 October2003. Additionally, on 30 September 2004, a cyclonecontributed 64 mm of throughfall in one night.[27] Spatial variability of throughfall was apparent from
the difference of the throughfall measurements from indi-vidual gauges. Accumulated over the entire khareef 2003the minimum and maximum measurement differ by 15 mm(thus by 30% of the mean). In order to test whether spatialvariability was captured by the average of the buckets, weapplied a bootstrap analysis for comparing the bucket to the
sheet measurement. Daily throughfall during a 7-day com-parison period ranged between 0.8 and 2.8 mm, represen-tative of 35% of the throughfall days in khareef 2003. Sheetdata showed that events lasted between 12 hours and almost2 days. The analysis showed that the 3-hour cumulated timeseries of the sheet measurement was not different at the 15%level from the equivalent time series of throughfall estimatedfrom the average of the four tipping buckets. This applies toboth the mean and the ratio of the variances. The differencebetween the measurement methods (using a sheet comparedto the average from a limited number of buckets) onlybecomes apparent when buckets are removed from ouroriginal sample size of four. When averages of only threebuckets were used for the bootstrap analysis, one (out offour possible) combination(s) was different from the sheetmeasurement at the 5% level. When using only two buckets,four (out of six possible) combinations were different fromthe sheet measurement.
5.4. Stemflow
[28] In Table 1 stemflow (mean and confidence interval)is listed together with the cumulated throughfall collectedduring the same period. Stemflow is indicated as a fractionof net precipitation (total amount of water received on theground). This is because the influence of horizontal precip-itation makes net precipitation a better reference value forincident precipitation than rainfall (which is usually used).In order to give an impression of the considerable contri-bution of stemflow, Table 1 also includes periods wherestemflow collectors overflowed. However, for computationof stemflow contribution these periods were omitted. Con-tribution of stemflow to the overall water received belowthe canopy (net precipitation) was on the average 34% (26–40%) in 2004. Contribution of stemflow was variable intime (±7%), but independent of absolute values of rain,throughfall or stemflow.
5.5. Above and Below Canopy Precipitation
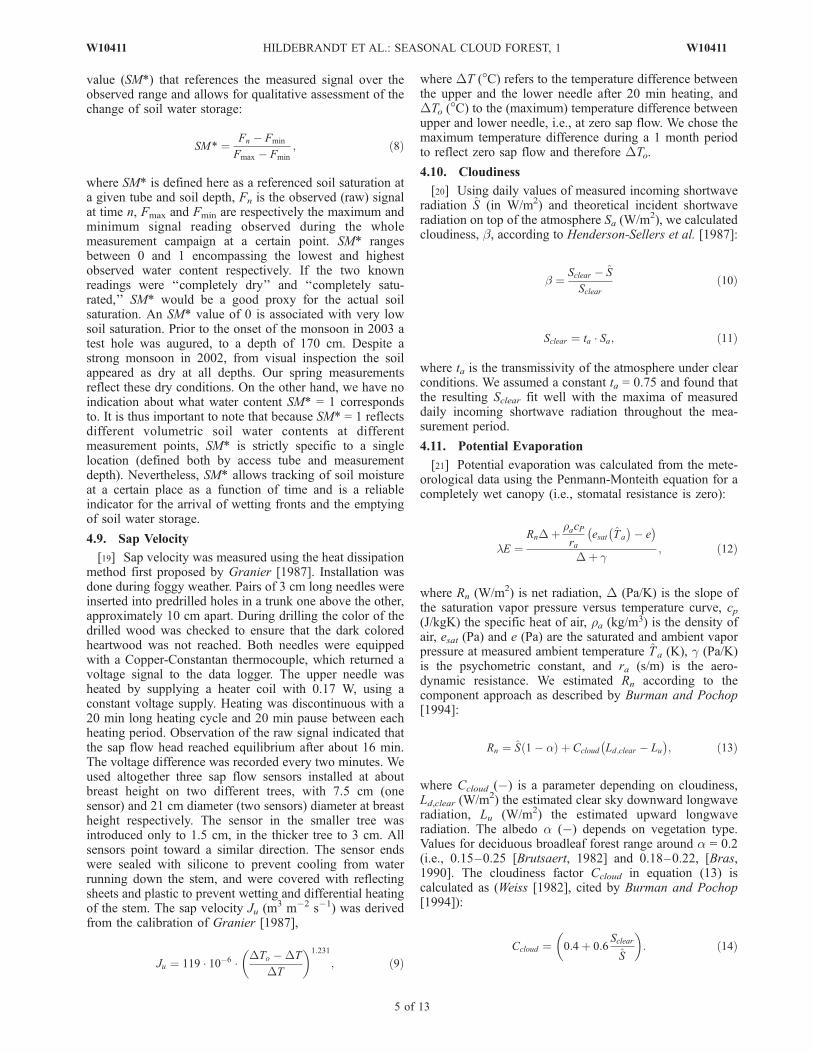
[29] Figure 6 shows daily rainfall, throughfall and thedifference, as measured during the khareef 2003. Totalabove canopy precipitation (rainfall) was 37 mm, whilethroughfall was 50 mm, thus higher than rainfall. Generally,on days with low rainfall, throughfall tended to be smallerthan rainfall. Of the days with rainfall less than 1mm,throughfall was greater than rainfall only 43% of the time,while on days with more than 1 mm of rainfall, throughfallwas greater than rainfall 83% of the time.[30] Throughfall does not account for all water received
below the canopy; stemflow also needs to be considered.Stemflow measurements were unreliable in 2003, whenboth rainfall and throughfall were measured. Measurementsfrom 2004 indicated that stemflow accounted for about 50%of throughfall (34% of net precipitation) for most periods ofthe khareef. We can only roughly estimate net precipitationin 2003 by presuming the same stemflow fraction applies asin 2004. Under this assumption, total net precipitation forthe 2003 khareef would have been somewhat less than twicethe rainfall (67 mm and 37 mm, respectively). For the timeseries of rainfall and net precipitation similar fractionsapply. For example, at the daily level, estimated net precip-itation was on the average 203% of rainfall, and for the8 hour time series the average contribution was 195%. Inboth cases, in about 75% of the considered intervals (24 hour
Figure 5. Temperatures at the climate station in Gogub for19 October 2003 to 19 October 2004 showing daily mean(black line), daily maximum (red circles), and dailyminimum (blue circles). The black bars on the x axisdenote periods of missing data, and the gray bar shows theperiod of the monsoon season.
W10411 HILDEBRANDT ET AL.: SEASONAL CLOUD FOREST, 1
7 of 13
W10411
and 8 hour intervals), estimated net precipitation was largerthan rainfall, in 52%, and 37% of the intervals (24 hour sand8 hours, respectively) estimated net precipitation was morethan twice, and in 22% of the intervals (both 24 hours and8 hours) more than 3 times higher than rainfall.[31] During the 2004 khareef, estimated daily net precip-
itation was about 3 mm. The total net precipitation receivedduring khareef can be estimated to be 246 to 295 mm whenreplacing missing periods (14 days) with the seasonalaverage (3 mm per day) and measurements from the directlypreceding period, respectively. The latter better reflects themoister conditions at the beginning of the monsoon, whenthe data loss occurred.
5.6. Annual Dynamics of Water Demand, WaterStorage, and Transpiration
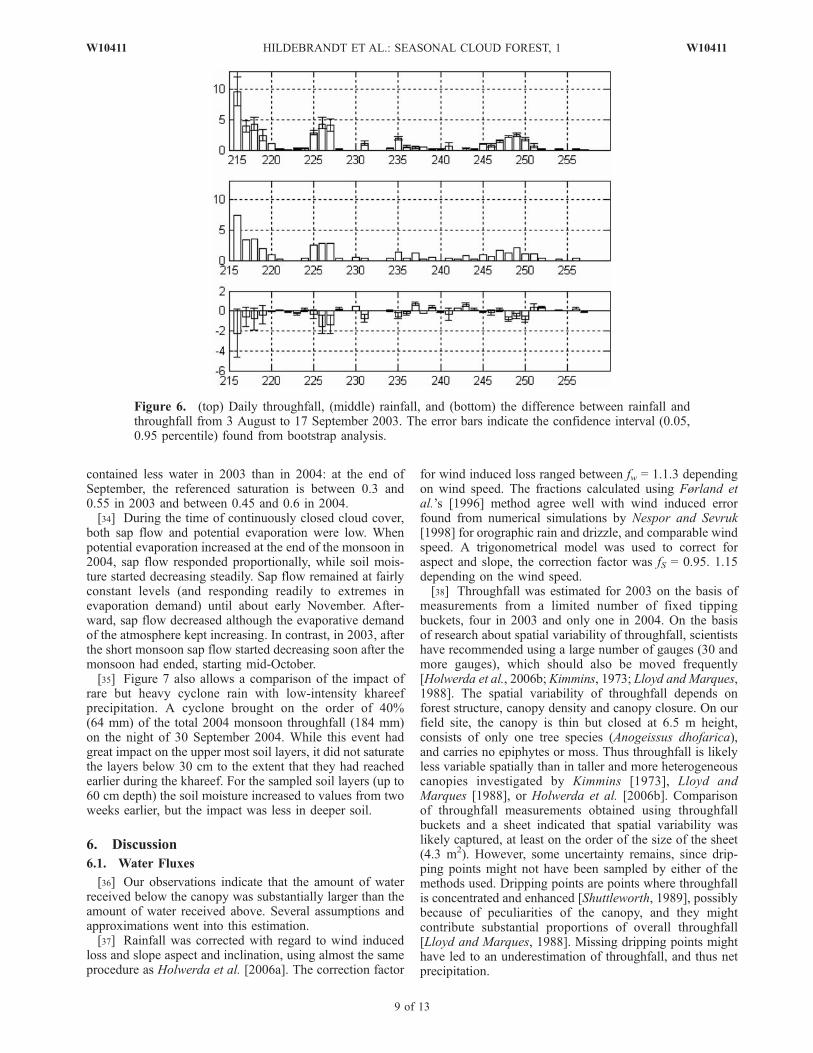
[32] We used a number of proxies to draw a picture of theseasonal dynamics in the ecohydrology of this cloud forest:cloud cover (b), atmospheric water demand (ETP), wateravailability (net precipitation), and change in soil waterstorage (SM*). Figure 7 summarizes the data. Figures 7cand 7h illustrate the continuous and small precipitationduring the khareef (mid-June to mid-September), coincidentwith the period of high cloudiness (Figures 7a and 7f). At
the same time potential evapotranspiration (Figures 7b and7g) is low during the khareef (about 1.5–2 mm per day)compared to the following period (15–20 mm per day), andlater in the year (30–40 mm per day). The extremes ofpotential evaporation are associated with strong northerlywinds, bringing hot and extremely dry air (relative humidityof 10% and less) to the site (data not shown).[33] Owed to the small precipitation intensities, soil
moisture (Figures 7d and 7i) penetrated the soil slowly atthe beginning of the monsoon. In 2004 it took as long as14 days from the first rain until the wetting front passed thelowest sampled layer at 60 cm, but afterward the highmoisture was maintained. Only at the end of the monsoon,when throughfall ceased and cloudiness decreased, soilmoisture decreased. Comparison of soil moisture betweenthe years 2003 and 2004 shows the impact of the weakmonsoon in 2003 on soil moisture. Although the measure-ment began only in August, long after the usual beginningof the khareef, which is expected in mid-June, progressionof the wetting front was still in an early stage; the lowestlayer had not been reached yet. The wetting front reachedthe lowest layer on 3 August in 2003, as compared to 10 Julyin 2004. Consequently, at the end of the monsoon the soil
Table 1. Listing of 2003 and 2004 Measured Throughfall, Stemflow Mean (X ), and Confidence Interval for the Mean (0.05 Percentile
(X0.05) and 0.95 Percentile (X0.95)) and Corresponding Stemflow Fraction of Net Precipitationa
Date YearNumberof Days
Number ofOverflownBuckets
BucketSize, L
Throughfall,mm
Stemflow, mm
Stemflow asFraction of NetPrecipitation, %
X X0.05 X0.95 X X0.05 X0.95
9 Aug to 16 Aug 2003 7 4/6 6 11.9 1.33 Aug to 9 Aug 2003 7 4/6 6 21.3 1.22 Sep to 6 Sep 2003 4 4/6 6 6.9 1.230 Aug to 2 Sep 2003 3 2/6 6 1.3 0.716 Aug to 23 Aug 2003 7 2/6 6 3.4 0.76 Sep to 9 Sep 2003 3 - 6 2.6 0.4 0.1 0.7 13 4 2123 Aug to 27 Aug 2003 4 - 6 1.7 0.2 0.0 0.5 9 0 2327 Aug to 30 Aug 2003 3 - 6 0.7 0.0 0.0 0.1 6 0 13
Total from notoverflowing periods
2003 5.0 0.6 0.1 1.3 9 1 19
8 Jul to 10 Jul 2004 2 5/6 22 13.1 5.710 Jul to 12 Jul 2004 2 4/6 22 15.7 5.331 Jul to 2 Aug 2004 2 4/6 22 13.1 5.130 Jun to 5 Jul 2004 5 3/6 22 11.2 4.75 Jul to 8 Jul 2004 3 2/6 22 6.1 4.59 Aug to 11 Aug 2004 2 - 22 7.7 4.2 3.2 5.3 35 29 4121 Aug to 28 Aug 2004 7 - 22 6.7 3.9 3.1 4.6 37 32 4118 Aug to 21 Aug 2004 3 - 22 5.8 3.6 2.8 4.4 38 33 4311 Aug to 15 Aug 2004 4 - 22 9.3 3.5 2.9 4.2 27 24 3112 Jul to 14 Jul 2004 2 - 22 5.8 2.9 2.0 3.8 33 26 407 Aug to 9 Aug 2004 2 - 22 5.4 2.7 2.1 3.4 33 28 383 Aug to 7 Aug 2004 4 - 22 6.1 2.5 1.8 3.2 29 23 3428 Jul to 31 Jul 2004 3 - 22 4.2 2.1 1.4 2.7 34 25 392 Aug to 3 Aug 2004 1 - 22 3.8 2.1 1.6 2.5 35 29 3923 Jun to 26 Jun 2004 3 6/6 6 14.715 Aug to 18 Aug 2004 3 - 22 2.6 1.2 0.8 1.6 32 24 3814 Jul to 18 Jul 2004 4 - 22 1.9 1.0 0.6 1.9 34 24 5019 Jun to 23 Jun 2004 4 - 6 1.2 0.6 0.3 1.1 33 20 48
Total from notoverflowing periods
2004 60.4 30.3 22.6 38.7 34 26 40
1 Sep to 15 Sep 2004 15 - 22 10.2 0
aMarked in bold are periods with overflowing stemflow collectors. Net precipitation used in the last three columns is the sum of stemflow and throughfallfor a given period. For the totals, periods with overflowing collectors were omitted.
8 of 13
W10411 HILDEBRANDT ET AL.: SEASONAL CLOUD FOREST, 1 W10411
contained less water in 2003 than in 2004: at the end ofSeptember, the referenced saturation is between 0.3 and0.55 in 2003 and between 0.45 and 0.6 in 2004.[34] During the time of continuously closed cloud cover,
both sap flow and potential evaporation were low. Whenpotential evaporation increased at the end of the monsoon in2004, sap flow responded proportionally, while soil mois-ture started decreasing steadily. Sap flow remained at fairlyconstant levels (and responding readily to extremes inevaporation demand) until about early November. After-ward, sap flow decreased although the evaporative demandof the atmosphere kept increasing. In contrast, in 2003, afterthe short monsoon sap flow started decreasing soon after themonsoon had ended, starting mid-October.[35] Figure 7 also allows a comparison of the impact of
rare but heavy cyclone rain with low-intensity khareefprecipitation. A cyclone brought on the order of 40%(64 mm) of the total 2004 monsoon throughfall (184 mm)on the night of 30 September 2004. While this event hadgreat impact on the upper most soil layers, it did not saturatethe layers below 30 cm to the extent that they had reachedearlier during the khareef. For the sampled soil layers (up to60 cm depth) the soil moisture increased to values from twoweeks earlier, but the impact was less in deeper soil.
6. Discussion
6.1. Water Fluxes
[36] Our observations indicate that the amount of waterreceived below the canopy was substantially larger than theamount of water received above. Several assumptions andapproximations went into this estimation.[37] Rainfall was corrected with regard to wind induced
loss and slope aspect and inclination, using almost the sameprocedure as Holwerda et al. [2006a]. The correction factor
for wind induced loss ranged between fw = 1.1.3 dependingon wind speed. The fractions calculated using Førland etal.’s [1996] method agree well with wind induced errorfound from numerical simulations by Nespor and Sevruk[1998] for orographic rain and drizzle, and comparable windspeed. A trigonometrical model was used to correct foraspect and slope, the correction factor was fS = 0.95. 1.15depending on the wind speed.[38] Throughfall was estimated for 2003 on the basis of
measurements from a limited number of fixed tippingbuckets, four in 2003 and only one in 2004. On the basisof research about spatial variability of throughfall, scientistshave recommended using a large number of gauges (30 andmore gauges), which should also be moved frequently[Holwerda et al., 2006b; Kimmins, 1973; Lloyd and Marques,1988]. The spatial variability of throughfall depends onforest structure, canopy density and canopy closure. On ourfield site, the canopy is thin but closed at 6.5 m height,consists of only one tree species (Anogeissus dhofarica),and carries no epiphytes or moss. Thus throughfall is likelyless variable spatially than in taller and more heterogeneouscanopies investigated by Kimmins [1973], Lloyd andMarques [1988], or Holwerda et al. [2006b]. Comparisonof throughfall measurements obtained using throughfallbuckets and a sheet indicated that spatial variability waslikely captured, at least on the order of the size of the sheet(4.3 m2). However, some uncertainty remains, since drip-ping points might not have been sampled by either of themethods used. Dripping points are points where throughfallis concentrated and enhanced [Shuttleworth, 1989], possiblybecause of peculiarities of the canopy, and they mightcontribute substantial proportions of overall throughfall[Lloyd and Marques, 1988]. Missing dripping points mighthave led to an underestimation of throughfall, and thus netprecipitation.
Figure 6. (top) Daily throughfall, (middle) rainfall, and (bottom) the difference between rainfall andthroughfall from 3 August to 17 September 2003. The error bars indicate the confidence interval (0.05,0.95 percentile) found from bootstrap analysis.
W10411 HILDEBRANDT ET AL.: SEASONAL CLOUD FOREST, 1
9 of 13
W10411
[39] After December 2003, only one single throughfallgauge (TF5) was operational, and we therefore chose toestimate average throughfall from the regression of TF5with average of the four tipping buckets. The regression lineexplains a great deal of variance (88%) of the averagethroughfall in 2003 and the gauge was not moved. Byapplying this procedure we imply that spatial variability isconstant in time, an assumption made by previous research-ers [e.g., Lloyd and Marques, 1988]. Given the compara-tively homogenous and thin canopy, the estimate based onTF5 likely captures the order of throughfall in 2004, butdistributed measurements are necessary to confirm theresults.[40] On average, throughfall exceeded rainfall by 0.3 mm/d
during the khareef in 2003. This compares well with datafound in the literature for cloud forests elsewhere that weresimilarly deduced from rain and throughfall measurements,and which found water gains of 0.3–1.33 mm/d obtainedfrom annual averages (review by Bruijnzeel [2001]). How-ever, this difference is not equivalent to horizontal precip-itation because (1) dripping points might not have beencaptured (see above) and (2) stemflow and interception lossare not considered. Regarding the latter, stemflow fraction
was substantial, on the order of 30% (on the basis ofmeasurements in 2004).[41] Stemflow was estimated from sampling six trunks.
Given that this is a quarter of the total number of trunks (24)on the site, the sampled number seems adequate. However,whatever uncertainty is contained in the estimation ofthroughfall for 2004, is also reflected in the estimate ofcontribution of stemflow to net precipitation. Nevertheless,even if throughfall was substantially underestimated (say,by an unlikely factor of two), the contribution of stemflowto net precipitation would still be comparatively large, onthe order of 20% [e.g., Levia and Frost, 2003]. The highstemflow proportion might be explained by several factors.The fog during khareef leads to moist canopy and stems.Wet stems can provide for a preferential flow path along thestem [Levia and Frost, 2003], thus increasing stemflow. Inaddition, stemflow proportion usually increases with de-creasing rainfall intensity and small droplet size, bothcharacteristic for drizzle. However, investigations in cloudforests elsewhere found relatively smaller contributions ofstemflow [Bruijnzeel, 2001; Bruijnzeel and Proctor, 1995],although conditions there should be equally conducive forstemflow. One exception is a cloud affected ecosystem in
Figure 7. Selected climate variables as measured during the field campaign. Daily values for the year2003 of (a) cloudiness; (b) potential evaporation; (c) throughfall; (d) referenced soil saturation at 10 cmdepth (dashed, blue) and 60 cm depth (solid, black); and (e) sap velocity from sensor 1 (circles, red) andsensor 2 (diamonds, black). Daily values for the year 2004 of (f) cloudiness; (g) potential evaporation; (h)throughfall; (i) referenced soil saturation at 10 cm depth (dashed, blue) and 60 cm depth (solid, black);and (j) sap velocity from sensor 1 (circles, red), sensor 2 (diamonds, black), and sensor 3 (crosses blue).The black bar on the time axis signifies times when data logger file got lost or before the measurementcampaign started; data loss from broken signal cables is indicated with a green bar in Figure 7h, while inFigures 7e and 7k, broken signal cables are reflected through gaps in the record and are not explicitlyindicated. The gray bars give a rough indication of the monsoon time, with a mark at the last measuredrain during fog. Note that the beginning of the monsoon in 2003 was shortly before the start of themeasurement campaign and is therefore not explicitly marked.
10 of 13
W10411 HILDEBRANDT ET AL.: SEASONAL CLOUD FOREST, 1 W10411
Jamaica where stemflow was estimated as 13 and 18% ofrainfall (3060 mm/yr). The authors attributed the highvalues to tree stature [Bruijnzeel, 2001; Hafkenscheid etal., 2002]. The general disagreement remains, but maymainly be related to the fact that stemflow is typicallyreported as a percentage of incident precipitation. Whileobservations of absolute values of stemflow may be similar,the indicated percentage value can vary greatly. As men-tioned above, most cloud forest studies have been con-ducted in moister regions. Furthermore, on an event basisstemflow increases with increasing rainfall intensities until acertain point and then remains constant; this is most likelythe point when canopy storage is filled up. Therefore, whenprecipitation is high, it is natural that the stemflow fractiondecreases, and vice versa. Finally, stemflow depends on theanatomy of the plants. It has been observed that desertshrubs have an anatomy that helps to channel rainfall waterquickly to the ground [Levia and Frost, 2003; Mauchampand Janeau, 1993]. The trees at our field site (Annogeissusdhofarica) have steep branch angles, which might havecontributed to increasing stemflow.[42] Because stemflow represents a concentrated water
input around the stem, large stemflow fractions may lead toconsiderable heterogeneity of infiltration and soil moisture[Pressland, 1976]. At our field site, the arrival of themoisture front at different locations also suggests heteroge-neity of infiltration, related to the distance to the next trunk,and thus the potential importance of stemflow. At thebeginning of both the 2003 and 2004 khareef seasons, thewetting front arrived earlier at a given depth in those soilmoisture measurement tubes that were located near treetrunks. For example, in 2003, at tubes close to the nextstanding tree (1.0 m and 1.2 m away) the wetting front hadalready reached 40 cm depth on 2 August, while furtheraway (1.7 m and 3.5 m), it was only detected during thenext field visit on 9 August. In 2004, the pattern wassimilar. Thus high stemflow might have lead to heteroge-neity of infiltration, by channeling water closer to the trees.[43] For some purposes it is desirable to have a rule of
thumb indicating how much water to expect below thecanopy (net precipitation) compared to above (rain). Ourinvestigations suggest roughly a factor of two larger for thetime average; in other words, the contribution of rainfall andhorizontal precipitation to plant available water are aboutthe same. While it seems safe to conclude that horizontalprecipitation adds a substantial amount of water to thisecosystem, the exact number should be used carefully. Welikely underestimated both rainfall and throughfall with oursetup, and used average stemflow fractions from 2004 in thewater budget of 2003. Also, the monsoon in 2003, for whichthe fractions were calculated, was drier than usual. Netprecipitation tended to be higher than rainfall on days withoverall high net precipitation, and those days were lessfrequent in the unusual monsoon of 2003 than in the morenormal monsoon of 2004. Therefore net precipitation mightoverall tend to be somewhat higher than double the rainfall.
6.2. Annual Dynamics of Water Demand, WaterStorage, and Transpiration
[44] We used a number of proxies to draw a qualitativepicture of the annual cycle of water fluxes and waterstorage, and relate them to the time of cloud cover. In doingso, we used sap velocity to assess changes of transpiration
over time. Sap velocity was purposefully not used tocalculate water use of the entire tree, since the number ofsensors is too small to allow for a reliable estimation. Sapflow can change along the radius and circumference of thetree. In particular, when water becomes limiting the profilesmay change in an unpredictable manner [Lu et al., 2000].On the other hand, researchers have observed that in theabsence of water stress sap flux at different depths in thestem is correlated over time [Lu et al., 2000], such that alimited number of sensors is appropriate for deducing thechange of overall transpiration over time. However, duringtimes of water stress, the measurement from few sensors isless reliable because of unpredictable changes in sap flowprofiles, and a point measurement of sap flow no longercorrelates with overall transpiration. Nevertheless, sapvelocity in Gogub shows an overall decreasing trend, whensoil moisture arrives at lower levels. The seasonal change oftranspiration, particularly the change between low sapvelocity during khareef and the increase during the monthsafterward (time of unstressed transpiration), should bereliably reflected even by our limited number of sapvelocity measurements.[45] The decrease of sap flow under foggy conditions is
in agreement with data collected by Santiago et al. [2000],and cloud forests are generally thought of as ecosystemswith low water use [Bruijnzeel, 2001]. Other researchershave pointed out that the decrease in atmospheric waterdemand might contribute to alleviating water stress duringdry periods [Burgess and Dawson, 2004; Hutley et al.,1997], and providing for a biome, which is only marginallysuited for the dry climate [Hutley et al., 1997]. At the site inDhofar the situation seems to differ in one aspect: clouds arepresent during the moist season, which not only alleviateswater stress, but also allows for filling of the soil storage. Itappears that plants benefit from the low atmospheric waterdemand during fog mainly because the cloud cover allowsfor effective storage of water, thus making it available foruse in the later part of the growing season.[46] In this system the growing season seems to be
partitioned into three periods. During the first period (thekhareef), incoming radiation is low, relative humidity ishigh and both potential evaporation and transpiration aresmall. The soil storage is filled, while only little water isremoved. The growing season continues after the end of themonsoon with a second period, where relative humidity islow and both incoming radiation and evaporation demandare high. Transpiration readily follows the evaporationdemand, while soil moisture does not appear to be limiting.The following third period is marked by stressed transpira-tion: sap velocity shows a clear decreasing trend, and doesnot anymore follow the evaporative demand as in thesecond period. The end of the third period is reached whenall leaves are shed.
7. Summary and Conclusion
[47] Our field study is the first comprehensive hydrolog-ical investigation within forest in Dhofar. It expands theunderstanding of the hydrology of the deciduous forestecosystem in Dhofar. This system is marked by surprisinglylow water availability. We estimated net precipitation inGogub during the relatively normal khareef of 2004 to only246–295 mm. This includes stemflow estimates and com-
W10411 HILDEBRANDT ET AL.: SEASONAL CLOUD FOREST, 1
11 of 13
W10411
pensation for the days of missing data by the daily averageand the corresponding preceding periods of precipitation,respectively. The khareef of 2004 can be considered arelatively normal monsoon on the basis of the rainfall datarecorded at nearby climate stations, therefore the amount ofwater received can be considered as representative. Whilemany assumptions went into the estimation of total avail-able water in 2004, the final number is much smaller thanthe expected water demand of forest, according to commonclimate-vegetation charts that are based on annual averagesof climate variables [e.g., Bonan, 2002; Lieth and Whittaker,1975].[48] Judging from the observations made in Gogub,
several factors facilitate tree growth in spite of exceptionallysmall amounts of available water:[49] 1. Given the small precipitation amounts, horizontal
precipitation is a substantial additional source of water. Netprecipitation was estimated to be about twice the rainfall inGogub.[50] 2. Water losses are minimized during the presence of
clouds (low evaporative demand and moist canopies coin-ciding with the moist season), which allows for effectivefilling of soil storage. The soil storage facilitates prolongingthe growing season far beyond the end of the wet season.[51] 3. Stemflow contributed about 30% of total incident
precipitation to thewater budget on theGogub field site duringthe monsoon. Soil moisture measurements suggest that stem-flow enhanced infiltration around the stem. The length of thegrowing season seems to be limited by soil storage, thereforeincreased soil storage around the stems clearly would prolongthe growing season. As will be shown in more detail in thecompanion paper [Hildebrandt and Eltahir, 2006], infiltrationdepth plays a crucial role for the performance of trees inDhofar. Therefore the relatively high amounts of stemflowmay be an essential factor for tree survival.[52] 4. Precipitation intensities are low, implying that
little water is lost to surface runoff during the khareef.[53] Our results suggest that the contribution of horizontal
precipitation might have been overestimated in the past[Miller, 1994] on the basis of previous observation usingartificial devices, and possibly judging from the abundantlush vegetation. However, the more realistic measurementsunder the natural forest canopy showed that the contributionof horizontal precipitation was smaller than expected andtherefore other factors, like low evaporative demand duringkhareef, need to be considered when explaining the lushvegetation. Our observation and analysis show that theforests in Dhofar gain additional water from horizontalprecipitation, but more importantly the water requirementseems to be low.[54] The forests of Dhofar thrive in a well-defined niche
that is strictly linked to cloud presence. Therefore, althoughit is water limited, and deciduous rather than evergreen, itcompletely fulfills the definition of a cloud forest as statedin the UNEP Cloud Forest Agenda [Bubb et al., 2004]. Webelieve the forests of Dhofar add a new ecosystem to theglobal map of cloud forests: a seasonal semiarid cloud forestwith deciduous phenology.
[55] Acknowledgments. We thank Amilcare Porporato, AndrewGuswa, and three anonymous reviewers for their detailed and constructivecomments, which improved the manuscript. Financial support for thisresearch was provided by a grant from the Ministry of Regional Munici-
palities, Environment and Water Resources of the Sultanate of Oman and bya fellowship from the Martin Society of Fellows for Sustainability.
ReferencesBonan, G. B. (2002), Ecological Climatology, Cambridge Univ. Press,Cambridge, U. K.
Bras, R. (1990), Hydrology: An Introduction to Hydrological Science,Addison-Wesley, Reading, Mass.
Brook, G. A., and S.-W. Shen (2000), Rainfall in Oman and the UnitedArab Emirates: Cyclicity, influence of the Southern Oscillation and whatthe future may hold, Arab World Geogr., 3, 78–96.
Bruijnzeel, L. A. (2001), Hydrology of tropical montane cloud forests:A reassessment, Land Use Water Resour. Res., 1, 8–18.
Bruijnzeel, L. A., and L. S. Hamilton (2000), Decision time for cloudforests, IHP Humid Tropics Programme Ser. 13, Div. of Water Sci.,U.N. Educ., Sci., and Cult. Organ., Paris.
Bruijnzeel, L. A., and J. Proctor (1995), Hydrology and biogeochemistry oftropical montane cloud forests: What do we really know?, Trop. MontaneCloud Forests, 110, 38–78.
Bruijnzeel, L. A., and E. J. Veneklaas (1998), Climatic conditions andtropical, montane forest productivity: The fog has not lifted yet, Ecology,79, 3–9.
Brutsaert, W. H. (1982), Evaporation in the Atmosphere, D. Reidel, Boston,Mass.
Bubb, P., I. May, L. Miles, and J. Sayer (2004), Cloud forest agenda,UNEP-WCMC Biodiversity Ser. 20, World Conserv. Monit. Cent., U.N.Environ. Programme, Cambridge, U. K.
Burgess, S. S. O., and T. E. Dawson (2004), The contribution of fog to thewater relations of Sequoia sempervirens (D. Don): Foliar uptake andprevention of dehydration, Plant Cell Environ., 27, 1023–1034.
Burman, R., and L. O. Pochop (1994), Evaporation, Evapotranspirationand Climatic Data, Elsevier Sci., Amsterdam.
del-Val, E., et al. (2006), Rain forest islands in the Chilean semiarid region:Fog-dependency, ecosystem persistence and tree regeneration, Ecosys-tems, 9, 598–608.
Fisher, M., S. A. Ghazanfar, S. A. Chaudhary, P. J. Seddon, E. F. Robertson,S. Omar, J. A. Abbas, and B. Boer (1998), Diversity and conservation, inVegetation of the Arabian Peninsula, edited by S. A. Ghazanfar andM. Fisher, pp. 265–302, Kluwer, Dordrecht, Netherlands.
Førland, E. J., P. Allerup, B. Dahlstrom, E. Elomaa, J. Jonsson, H. Madsen,J. Perala, P. Rissanan, H. Vedin, and F. Vejen (1996), Manual for opera-tional correction of Nordic precipitation data, 66 pp., Norw. Meteorol.Inst., Oslo, Norway.
Foster, P. (2001), The potential negative impacts of global climate changeon tropical montane cloud forests, Earth Sci. Rev., 55, 73–106.
Granier, A. (1987), Mesure the flux de seve brute dans le tronc du Douglaspar une nouvelle methode thermique, Ann. Sci. For., 44, 1–14.
Gunn, R., and G. D. Kinzer (1949), The terminal velocity of fall for waterdroplets in stagnant air, J. Meterol., 6, 243–248.
Hafkenscheid, R. L. L. J., L. A. Bruijnzeel, R. A. M. de Jeu, and N. J. Blink(2002), Water budgets of two upper montane rain forests of contrastingstature in the Blue Mountains, Jamaica, in Hydrology and WaterManagement in the Humid Tropics. Proceedings to the Second Interna-tional Colloquium, Panama. 22–26March 1999, edited by J. S. Gladwell,pp. 399–423, Int. Hydrol. Programme, U.N. Educ., Sci., and Cult. Or-gan., Paris.
Henderson-Sellers, A., F. Drake, K. McGuffe, K. Fattori, A. P. Marques,A. d. O. Loyed, and C. R. Shuttleworth (1987), Observation of day timecloudiness over the Amazon forest using an all-sky camera, Weather, 42,209–218.
Hildebrandt, A., and E. A. B. Eltahir (2006), Forest on the edge: Seasonalcloud forest in Oman creates its own ecological niche, Geophys. Res.Lett., 33, L11401, doi:10.1029/2006GL026022.
Hildebrandt, A., and E. A. B. Eltahir (2007), Ecohydrology of a seasonalcloud forest: 2. Role of clouds, soil type, and rooting depth in tree-grasscompetition, Water Resour. Res., doi:10.1029/2006WR005262, in press.
Holwerda, F., R. Burkard, W. Eugster, F. N. Scatena, A. Meesters, and L. A.Bruijnzeel (2006a), Estimating fog deposition at a Puerto Rican elfincloud forest site: Comparison of the water budget and eddy covariancemethods, Hydrol. Processes, 20, 2669–2692.
Holwerda, F., F. N. Scatena, and L. A. Bruijnzeel (2006b), Throughfall in aPuerto Rican lower montane rain forest: A comparison of samplingstrategies, J. Hydrol., 327, 592–602.
Huggert, R. J. (1995), Geoecology: An Evolutionary Approach, Routledge,New York.
12 of 13
W10411 HILDEBRANDT ET AL.: SEASONAL CLOUD FOREST, 1 W10411
Hursh, C. R., and H. C. Pereira (1953), Field moisture balance in theShimba Hills, Kenya, East Afr. Agric. J., 18, 139–148.
Hutley, L. B., D. Doley, D. J. Yates, and A. Boonsaner (1997), Waterbalance of an Australian subtropical rainforest at altitude: The ecologicaland physiological significance of intercepted cloud and fog, Aust. J. Bot.,45, 311–329.
Juvik, J. O., and D. Nullet (1995), Relationship between rainfall, cloud-interception, and canopy throughfall in a Hawaiian montane forest, inTropical Montane Cloud Forests, edited by L. S. Hamilton et al., pp. 165–182, Springer, New York.
Kimmins, J. P. (1973), Some statistical aspects of sampling throughfallprecipitation in nutrient cycling studies In British Columbian coastalforests, Ecology, 54, 1008–1019.
Kurschner, H., P. Hein, N. Kilian, and M. A. Hubaishan (2004), TheHybantho durae-Anogeissetum dhofaricae ass. Nova—Phytosociology,structure and ecology of an endemic South Arabian forest community,Phytocoenologia, 34, 569–612.
Laws, J. O., and D. O. Parsons (1943), The relation of raindrop-size tointensity, Eos Trans. AGU, 26, 452.
Levia, D. F., and E. E. Frost (2003), A review and evaluation of stemflowliterature in the hydrologic and biogeochemical cycles of forested andagricultural ecosystems, J. Hydrol., 274, 1–29.
Lieth, H., and R. H. Whittaker (1975), Primary Productivity of the Bio-sphere, Springer, New York.
Lloyd, C. R., and A. D. Marques (1988), Spatial variability of throughfalland stemflow measurements in Amazonian rainforest, Agric. For.Meteorol., 42, 63–73.
Lu, P., L. Urban, and P. Zhao (2000), Spatial variation in xylem sap fluxdensity in the trunk of orchard-grown, mature mango trees under chan-ging soil water conditions, Tree Physiol., 20, 683–692.
Mauchamp, A., and J. L. Janeau (1993), Water funneling by the crown ofFlourensia cerunua a Chihuahuan Desert shrub, J. Arid Environ., 25,299–306.
Meister, J., M. A. Hubaishan, N. Kilian, and C. Oberprieler (2005), Chlor-oplast DNA variation in the shrub Justicia areysiana (Acanthaceae) en-demic to the monsoon affected coastal mountains of the southern ArabianPeninsula, Bot. J. Linnean Soc., 148, 437–444.
Miller, G. M. (1994), CPD site SWA 1. Dhofar fog oasis. Oman andYemen, in Centres of Plant Diversity: A Guide and Strategy for TheirConservation, vol. 1, Europe, Africa, South West Asia and the MiddleEast, edited by V. H. Heywood and S. D. Davis, pp. 309–311, WorldConserv. Union, Cambridge, U. K.
Miller, G. M., and M. Morris (1988), Plants of Dhofar The Southern Regionof Oman Traditional, Economic and Medical Uses, Off. of the Advis. forConserv. of the Environ., Diwan of the R. Court, Muscat.
Nespor, V., and B. Sevruk (1998), Estimation of wind induced error andrainfall gauge measurement using a numerical simulation, J. Atmos.Oceanic Technol., 16, 450–464.
Pressland, A. J. (1976), Soil moisture redistribution as affected by through-fall and stemflow in an arid zone shrub community, Aust. J. Bot., 24,614–649.
Ray, D. K., U. S. Nair, R. O. Lawton, R. M. Welch, and R. A. Pielke Sr.(2006), Impact of land use on Costa Rican tropical montane cloud for-ests: Sensitivity of orographic cloud formation to deforestation in theplains, J. Geophys. Res., 111, D02108, doi:10.1029/2005JD006096.
Santiago, L. S., G. Goldstein, F. C. Meinzer, J. H. Fownes, and D. Mueller-Dombois (2000), Transpiration and forest structure in relation to soilwaterlogging in a Hawaiian montane cloud forest, Tree Physiol., 20,673–681.
Sharon, D. (1980), Distribution of hydrologically effective rainfall incidenton sloping ground, J. Hydrol., 46, 165–188.
Shuttleworth, W. J. (1989), Micrometeorology of temperate and tropicalforest, Philos. Trans. R. Soc. London, Ser. B, 324, 299–334.
Still, C. J., P. N. Foster, and S. H. Schneider (1999), Simulating the effectsof climate change on tropical montane cloud forests, Nature, 398, 608–610.
Sugden, A. M., and R. J. Robins (1979), Aspects of the ecology of vascularepiphytes in Colombian cloud forests. 1. Distribution of the epiphyticflora, Biotropica, 11, 173–188.
Weiss, A. (1982), An experimental study of net radiation, its componentsand prediction, Agron. J., 74, 871–874.
Zadroga, F. (1981), The hydrological importance of a montane cloud forestarea of Costa Rica, in Tropical Agricultural Hydrology, edited by R. Laland E. W. Russell, pp. 59–73, John Wiley, New York.
����������������������������M. Al Aufi, Ministry of Regional Municipalities, Environment and
Water Resources, P.O. Box 461, Muscat, 112, Oman.M. Amerjeed and M. Shammas, Ministry of Regional Municipalities,
Environment and Water Resources, Governorate of Dhofar, P.O. Box 1509,Salalah, 211, Oman.
E. A. B. Eltahir, Department for Civil and Environmental Engineering,Massachusetts Institute of Technology, Cambridge, MA 02139, USA.
A. Hildebrandt, UFZ Helmholtz Centre for Environmental Research,Permosestr. 15, Leipzig D-04318, Germany. ([email protected])
W10411 HILDEBRANDT ET AL.: SEASONAL CLOUD FOREST, 1