It is forbidden to reproduce, save or share the content of this document either in whole or in parts. The reader
who wishes to print or save this document on any media must first get the permission of the author.
BOARD OF EXAMINERS (THESIS PH.D)
THIS THESIS HAS BEEN EVALUATED
BY THE FOLLOWING BOARD OF EXAMINERS M. Amar Ramudhin, Thesis Supervisor Département de génie de la production automatisée à l’École de technologie supérieure M. Marc Paquet, Thesis Co-supervisor Département de génie de la production automatisée à l’École de technologie supérieure M. Jean-Pierre Kenné, President of the Board of Examiners Département de génie mécanique à l’École de technologie supérieure M. Ali Gharbi, Member of the Board of Examiners Département de génie de la production automatisée à l’École de technologie supérieure Mme. Sophie d’Amours, External Member of the Board of Examiners Département de génie mécanique à l’Université Laval
THIS THESIS WAS PRESENTED AND DEFENDED
BEFORE A BOARD OF EXAMINERS AND PUBLIC
SEPETEMBER 9, 2010
AT ÉCOLE DE TECHNOLOGIE SUPÉRIEURE
ACKNOWLEDGMENTS
The work presented in this thesis was performed at the Laboratoire de Recherche sur les
Chaînes d’approvisionnement (LRCA) in the Department of Automated Production
Engineering at the École de technologie supérieure (ETS).
This thesis would have been impossible without the unstinting guidance, motivation, and
help provided my advisors and dissertation committee Profs. Amar Ramudhin and Marc
Paquet. I am also grateful to my dissertation committee members Profs. Sophie D’Amours,
Ali Gharbi, and Jean-Pierre Kenné for their valuable comments that have honed and enriched
my work.
Words cannot say how indebted I am to my father Khalifa and mother Mounira for taking an
unbelievable amount of interest in PhD studies and providing me with the love, energy, and
support that has seen my PhD culminate successfully.
I am indeed grateful to my fiancée Ghofrane, my brother Walid, my sisters Lobna and Hanen
for being so unselfishly carrying and loving, and for often putting up with my scarcity during
the course of my PhD studies. A very special thanks to my aunt Henda and her husband Rezk
for their continuous support during the different phases of the program.
Lastly, I am thankful to all my friends and colleagues at LRCA and ETS, who gave me their
support in a work environment full of peace and good humour.
MULTI-CRITERIA METHODS FOR DESIGNING AND EVALUATING SUSTAINABLE SUPPLY CHAINS
Amin CHAABANE
ABSTRACT
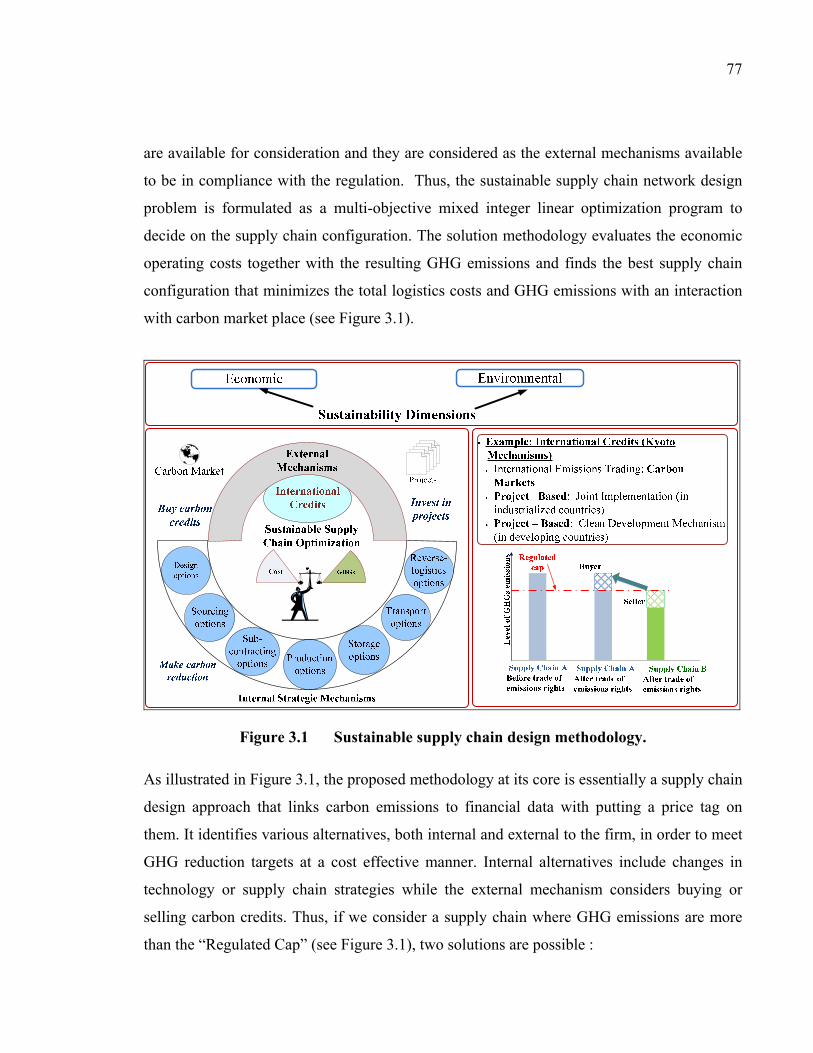
Sustainable supply chain management covers interactions between the economic dimension, the environment, and society. My dissertation, titled multi-criteria methods for designing and evaluating sustainable supply chains, studies supply chain decisions-making and trade-offs at the interface between supply chain’ operations and the environment. My dissertation comprises four research papers that develop novel approaches that enhance the literature of supply chain management. The first article, titled “A two-phase multi-criteria decision support system for supply chain management ”, focused on the economic dimension, considered for a long time as the only performance that guarantee supply chain design and planning efficiencies. The proposed approach introduces a two-phase hierarchical approach to solve a multi-criteria SCM problem integrating both strategic and tactical decisions. The first phase evaluates different potential configurations of supply chains using Analytic Hierarchy Process (AHP). The second phase solves the network for the optimal safety stock placement using dynamic programming. Although the environmental and social criteria are not considered, they can be added at the first phase as additional criteria to ensure the selection of sustainable supply chain. However, it is better to include these criteria at the design phase to consider the most important strategic decisions that influence the economic, environmental and social performance of the supply chain. Thus, the second article, titled “Designing and evaluating sustainable supply chains”, introduces a multi-objective linear programming model for sustainable supply chain design that takes into account the economic and the environmental objectives at the design time. This article addresses the design of supply chains that are also sensitive to the carbon market. The proposed methodology provides decision makers with the ability to evaluate the trade-offs between total logistics costs and carbon offsetting under different supply chain operating strategies, environmental regulatory constraints and carbon market price evolution. Validation using an illustrative example derived from the steel industry, where legislation imposes caps on greenhouse gases emissions, shows the advantages of such novel approach. This paper shows also that under the dynamic of the carbon market place, it is important to consider a multi-period model for the strategic planning of sustainable supply chains.
VI
The third article, titled “Design of sustainable supply chain under the emission trading scheme”, focus on the long-term, strategic planning of sustainable and closed-loop supply chains. The design task is formulated as a multi-objective optimization linear program that accounts for the minimization of total logistics costs (economic performance) and greenhouse gases (GHG) emissions (environmental impact). From an economic perspective, the link with “Environmental Economics Solutions” is made through the Emission Trading Scheme. On the other hand, the environmental performance evaluation is based on the Life Cycle Assessment (LCA) methodology that quantifies the burdens and impact along the life cycle stages. Thus, the material and energy balances are considered in the supply chain network design problem as well as many critical outputs. Capabilities of the proposed model are illustrated through a numerical study. Keyword : Supply chain design, sustainable supply chain, environment, recycling, carbon market, mixed integer programming, multi-criteria decision making, multi-objective optimization.
MÉTHODES DE CONCEPTION ET D’ÉVALUATION MULTICRITÈRES DES CHAÎNES D’APPRROVISIONNEMENT DURABLES
Amin CHAABANE
RÉSUMÉ La gestion des chaînes d’approvisionnement durables étudie l’interaction entre les trois dimensions économique, environnementale et sociale. La thèse de doctorat a porté sur le développement de nouvelles méthodes d’aide à la décision pour la conception et l’évaluation multicritères des chaînes d’approvisionnement durables. Cette thèse a permis de contribuer à l’avancement de la recherche par 4 articles de revue avec comité de lectures (publiés, acceptés et soumis). Le premier article de cette thèse (i.e., chapitre 2) se focalise sur la dimension économique. On a cherché à apporter une contribution à la gestion de la chaîne d’approvisionnement qui considère plus qu’un objectif pour assurer la durabilité économique. Une approche hiérarchique à deux phases incluant les niveaux de décision stratégique et tactique est introduite. L’évaluation qualitative de la chaîne est faite selon le modèle de référence «Supply Chain Operations Reference » (SCOR). Dans la première phase, l’évaluation de plusieurs configurations de chaînes potentielles est réalisée et le choix est obtenu avec la méthode d'analyse selon le processus hiérarchique (AHP). La deuxième phase résout le problème de positionnement de stocks de sécurité dans le réseau. Les dimensions environnementales et sociales n’ont pas été intégrées, mais celles-ci sont de plus en plus important à considérer pour la gestion des chaînes d’approvisionnement durables et pourraient être prises en compte par exemple au niveau de l’analyse AHP en ajoutant d’autres critères de performance qui enrichissent le modèle SCOR. Cependant, l’intégration de ces aspects au niveau de la génération des configurations de chaînes pourrait anticiper à l’avance certains choix stratégiques les plus influents sur la performance économique, environnementale et sociale de la chaîne d’approvisionnement. De ce fait, dans le deuxième article (i.e., chapitre 3), on propose un modèle mathématique de programmation linéaire avec une seule période pour la conception des chaînes d’approvisionnement qui prend en compte en plus des considérations économiques et environnementales, l’interaction avec le marché de carbone, un des mécanismes que plusieurs pays utilisent pour atteindre les objectifs de développement durable. L’objectif est de voir l’impact d’une telle interaction sur la configuration de la chaîne et pouvoir évaluer la meilleure stratégie à suivre pour respecter les réglementations en vigueur. Cet article a montré aussi que face à la dynamique du marché du carbone, l’utilisation d’un modèle multi-
VIII
période est primordiale pour la planification stratégique des chaînes d’approvisionnement durables. Le troisième article (i.e., chapitre 4) se consacre au développement d’un modèle mathématique générique multi-période pour la planification des chaînes d’approvisionnement durables. Il se base sur la méthode de l’analyse de cycle de vie pour supporter les décisions au niveau de l’opération de la chaîne d’approvisionnement dans un environnement qui impose à la fois des objectifs en termes de réduction de gazes à effet de serre et des réglementations sur la gestion de retour des produits à la fin de leur cycle de vie. Mots clés : conception des chaînes d’approvisionnement, chaîne d’approvisionnement durable, environnement, recyclage, marché de carbone, programmation en nombre entiers, analyse multicritères, optimisation multi-objective.
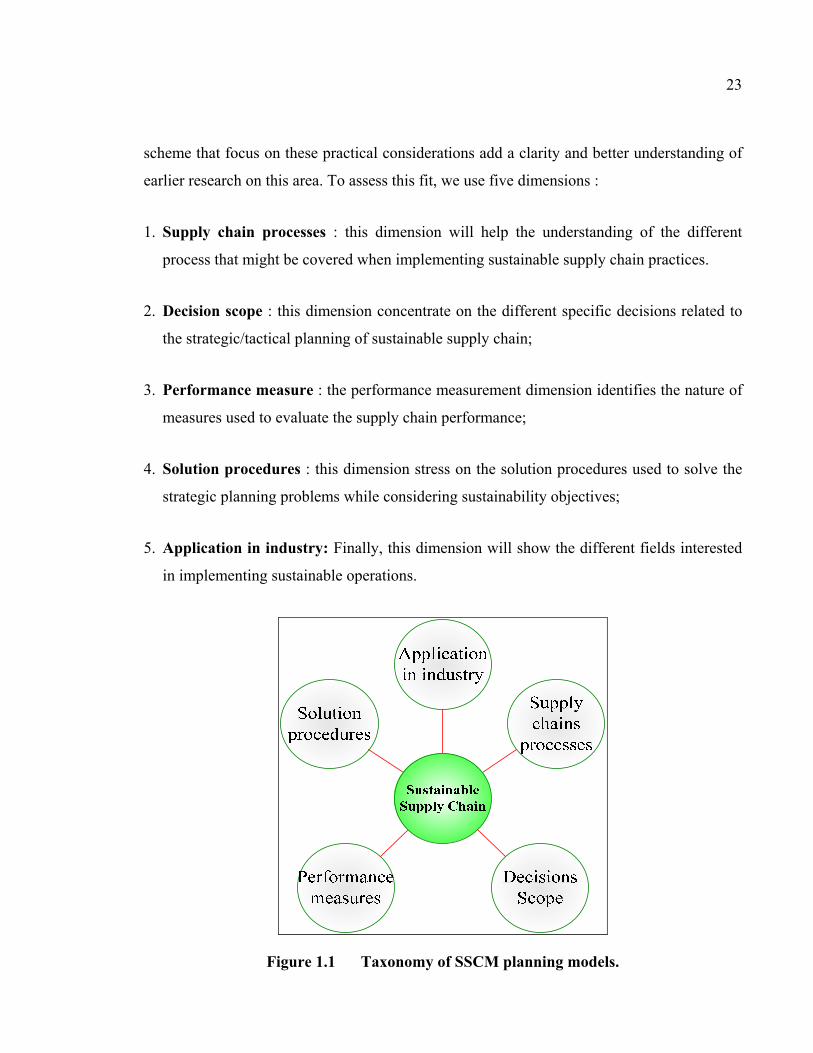
1.1.1 Past supply chain management models ..........................................................18 1.1.2 Literature review plan and methodology .......................................................22
SUPPORT SYSTEM FOR SUPPLY CHAIN MANAGEMENT» ........42 2.1 Introduction ..................................................................................................................43 2.2 Literature review ..........................................................................................................45 2.3 Problem statement and proposed approach ..................................................................47
2.3.1 Problem statement ..........................................................................................47 2.3.2 The proposed approach ..................................................................................48
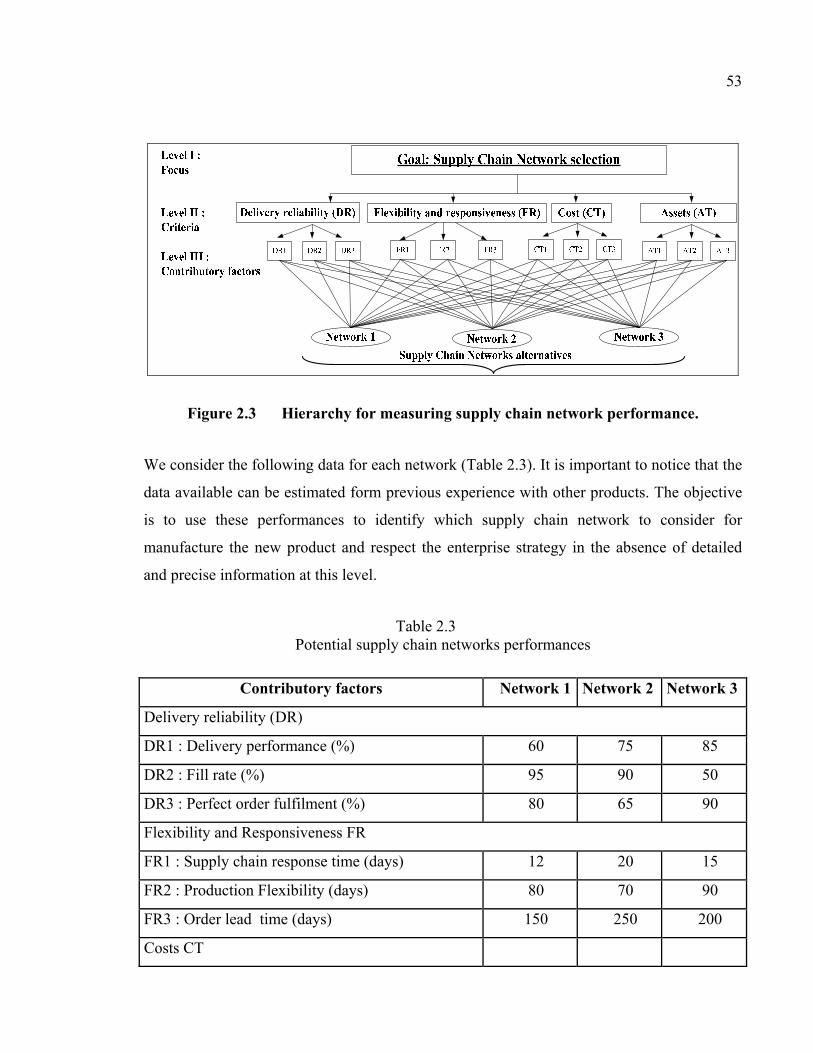
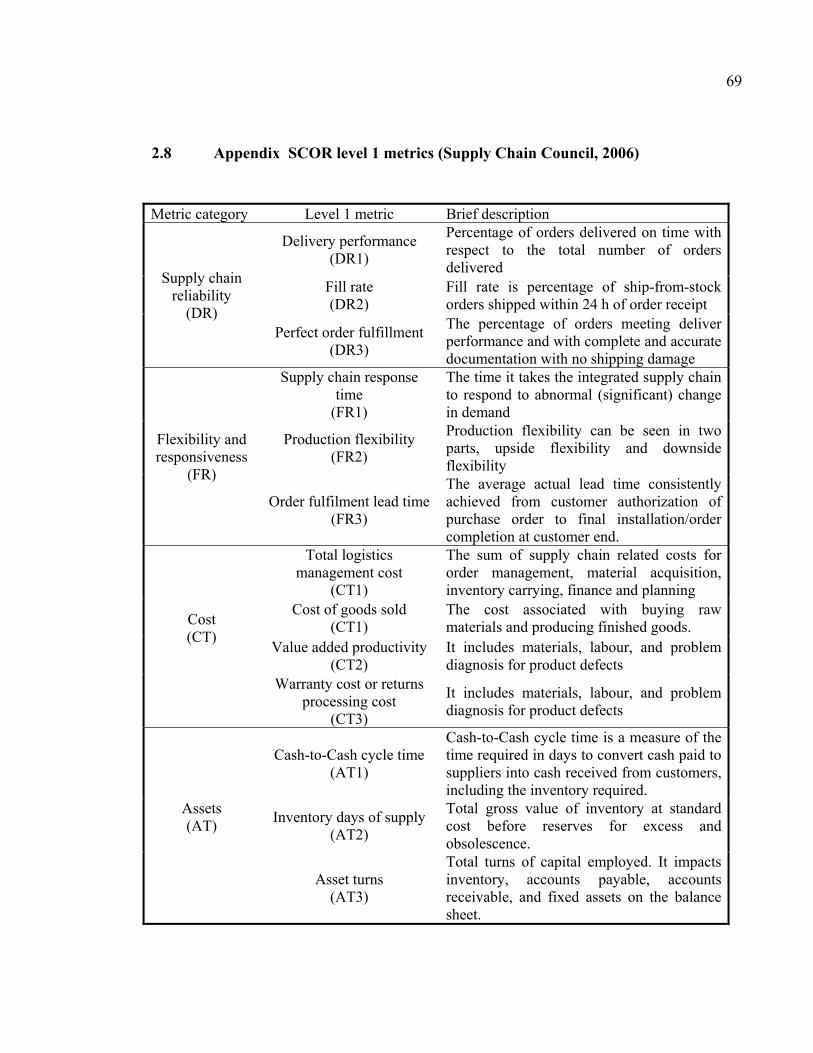
2.4 Supply chain network selection phase using AHP ......................................................49 2.4.1 The Analytic Hierarchy Process (AHP) .........................................................49 2.4.2 SCOR Level 1 metrics ...................................................................................51 2.4.3 Supply chain selection based on AHP ...........................................................52
2.5 Safety stock optimization phase ...................................................................................57 2.5.1 Basic assumptions and notations ...................................................................57 2.5.2 Model formulation : safety stock cost optimization ......................................60 2.5.3 Dynamic programming formulation ..............................................................61 2.5.4 A numerical example .....................................................................................62
2.6 Conclusion and future research ....................................................................................64 2.7 References ....................................................................................................................65 2.8 Appendix SCOR level 1 metrics (Supply Chain Council, 2006) ................................69
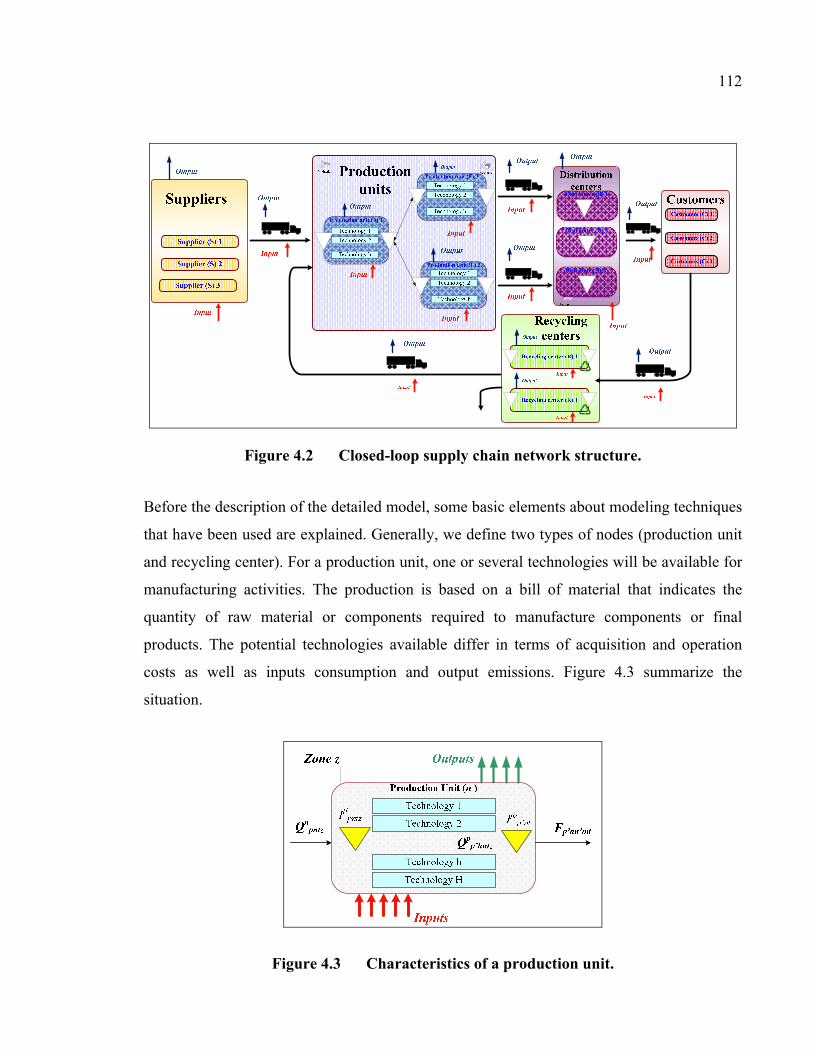
UNDER THE EMISSION TRADING SCHEME» ..............................104 4.1 Introduction ................................................................................................................105 4.2 Literature review ........................................................................................................106 4.3 Problem statement and methodology .........................................................................108 4.4 Model development ...................................................................................................110
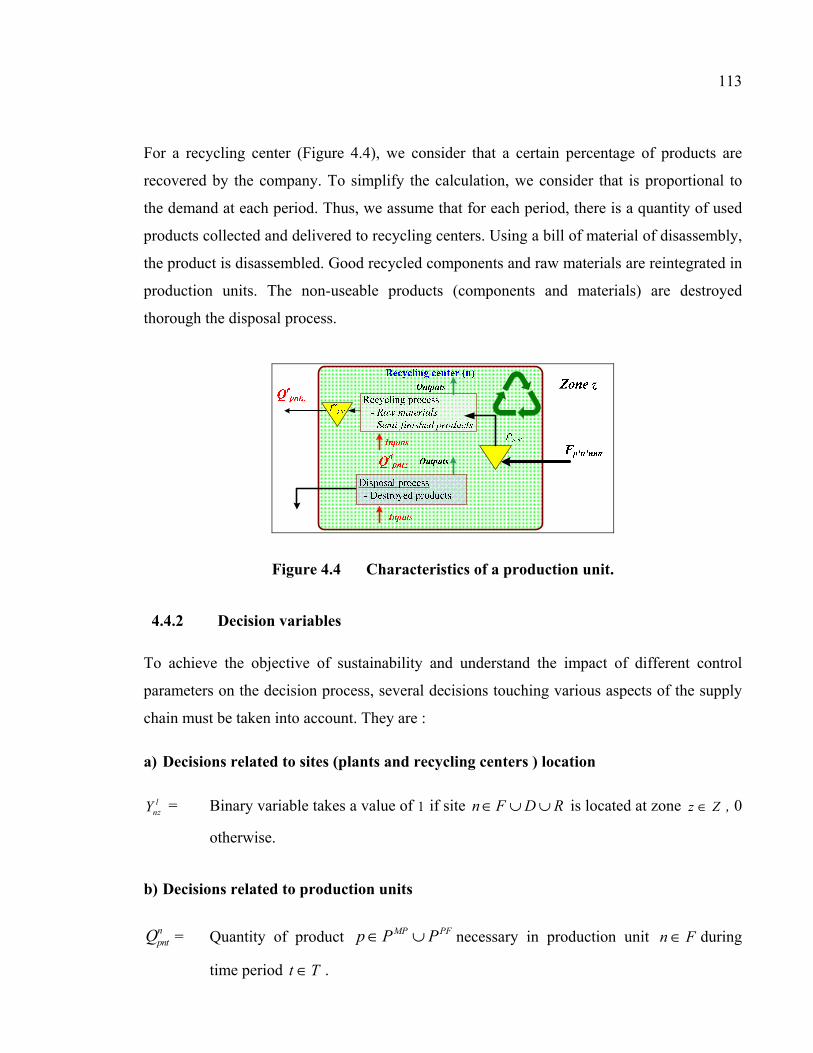
Figure 4.3 Characteristics of a production unit. ..............................................................112
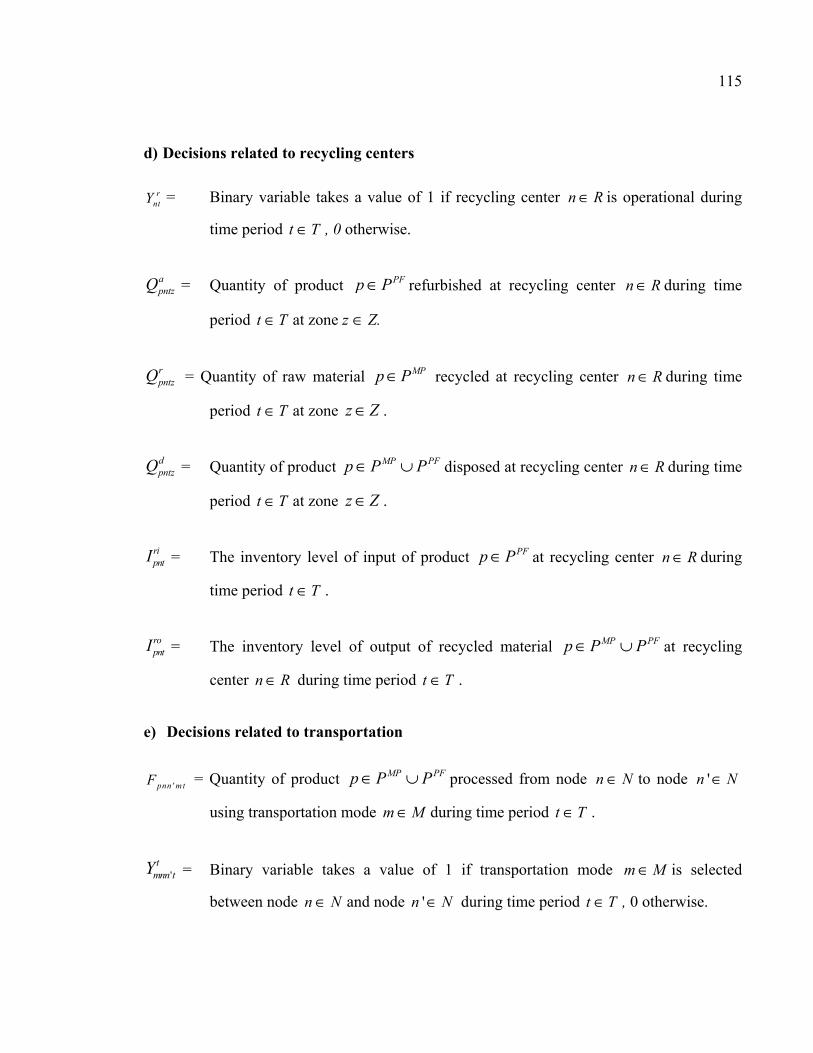
Figure 4.4 Characteristics of a production unit. ..............................................................113
Figure 4.5 Case study supply chain network. ..................................................................131
Figure 4.6 Carbon prices variation for scenario 2. ..........................................................133
Figure 4.7 Cost distribution for scenario 2. .....................................................................134
Figure 4.8 Recycled product under policy stringency. ....................................................136
Figure 4.9 Carbon management under policy stringency. ...............................................136
ABREVIATIONS ACV Analyse de Cycle de Vie AHP Analytic Hierarchy Process APS Advanced Planning System BOM Bill of Material DSS Decision Support System DEA Data Envelopment Analysis CSR Corporate Social Responsibility EPSC Electronics Product Stewardship Canada EPA Environmental Protection Agency ELV End of Life Vehicle ETS Emission Trading Scheme GES Gaz à effet de serre GHG Greenhouse gases LCA Life Cycle Assessment LCM Life cycle management MCeX Montreal Climate Exchange in Canada MADM Multi-Attribute Decision Making MODM Multi-Objective Decision Making MOO Multi-Objective Optimisation MOC Mise en œuvre conjointe
XVI
MDP Mécanismes de développement propre PLM Product life cycle management RL Reverse Logistic SCM Supply Chain Management SSCM Sustainable Supply Chain Management SCOR Supply Chain Operations Reference WEEE Waste Electronic and Electrical Equipment
INTRODUCTION
The field of supply chain management has received an increased interest in recent years both
in academia and industrial sectors. This is due not only to trade globalization through the
outsourcing of logistics activities, but also to the increased competition that requires a global
presence. Today, every enterprise operates in a supply chain which is much more complex
than it was before. Also, increased demand for fast and reliable deliveries has imposed new
challenges for companies and pushed managers to improve the management of supply chains
(Mentzer, 2001).
In the same vein, emerging issues such as rising energy prices, the limits of available
resources (not renewable), climate change, objectives in terms of reducing emissions (liquid,
solid, and gaseous), and concerns for improving the quality of life have attracted the attention
of managers to develop a strategy based on corporate social responsibility and migrate
towards the era of sustainable supply chains (Carter, 2008; Nagurney et al., 2007; Paul R.
Kleindorfer et al., 2005). The integration of sustainability practices in supply chain
management is relatively new, but growing continuously (Seuring et al., 2008).
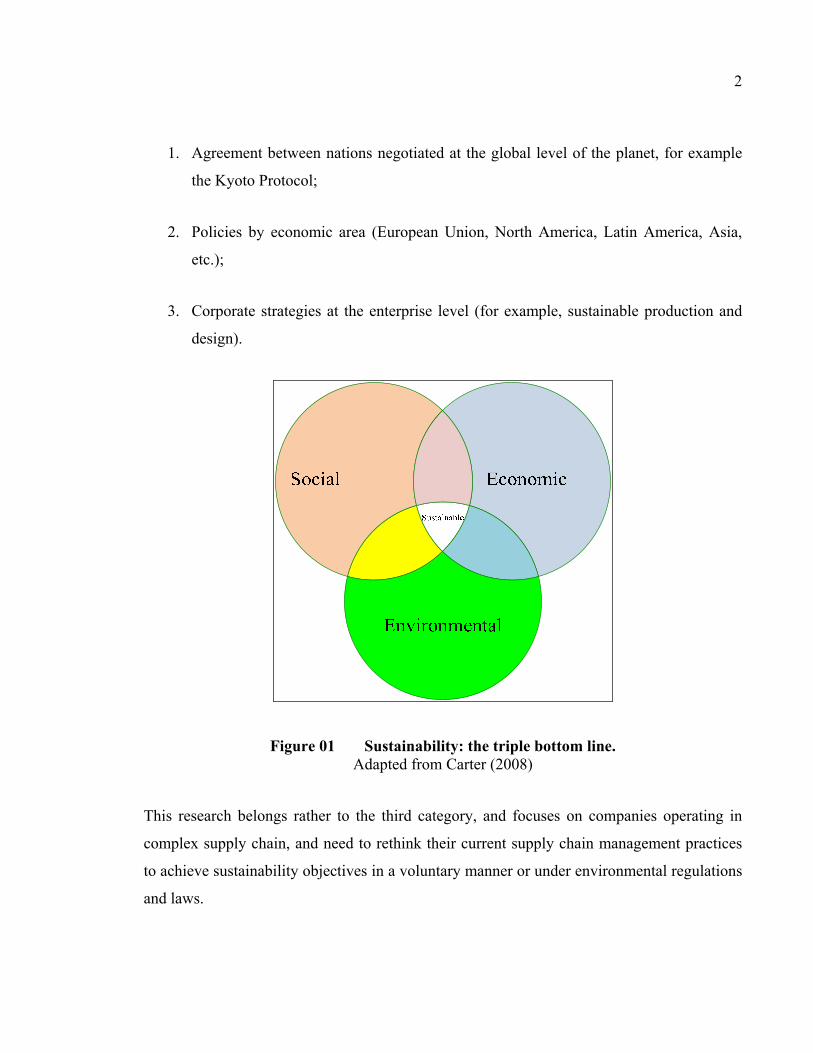
This new trend requires a shift in paradigms by focusing on the three pillars of sustainable
development (Figure 01): economic prosperity, ecology (environment protection) and the
social dimension (Elkington, 1998).
The goal of sustainable development is to find a coherent balance (compromise solution)
between these three objectives. Several actions and decisions at different levels can
contribute and can be divided into three categories:
2
1. Agreement between nations negotiated at the global level of the planet, for example
the Kyoto Protocol;
2. Policies by economic area (European Union, North America, Latin America, Asia,
etc.);
3. Corporate strategies at the enterprise level (for example, sustainable production and
design).
Figure 01 Sustainability: the triple bottom line. Adapted from Carter (2008)
This research belongs rather to the third category, and focuses on companies operating in
complex supply chain, and need to rethink their current supply chain management practices
to achieve sustainability objectives in a voluntary manner or under environmental regulations
and laws.
3
Through the various contributions presented in the document, this research will try to bring
solutions to the problems of modeling and managing supply chains for future practices in the
management of sustainable enterprises. Also, this work must define guidance in the
development of new generations of advanced planning systems. More specifically, decision
making models based on mathematical programming are presented to assist mangers to find
the best decisions while respecting sustainability objectives.
Background
The issue of supply chains is present in the entire company. This concept itself rise to
somewhat to different interpretations (Cooper, 1997). In this section, our goal is not to
propose a state of the art in the field of supply chain management, several authors propose a
detailed review (Croom et al. (2000), Karpak et al. (2001) et Burgess (2006)), but rather to
expose the evolution of supply chain management practices.
Lee and Billington (1993) proposed an operationel view of the supply chain and cosidered
that is “a netwrok of facilities that performs functions related to the suuply of raw materials,
transformation of these raw materials into components then to finished products, and
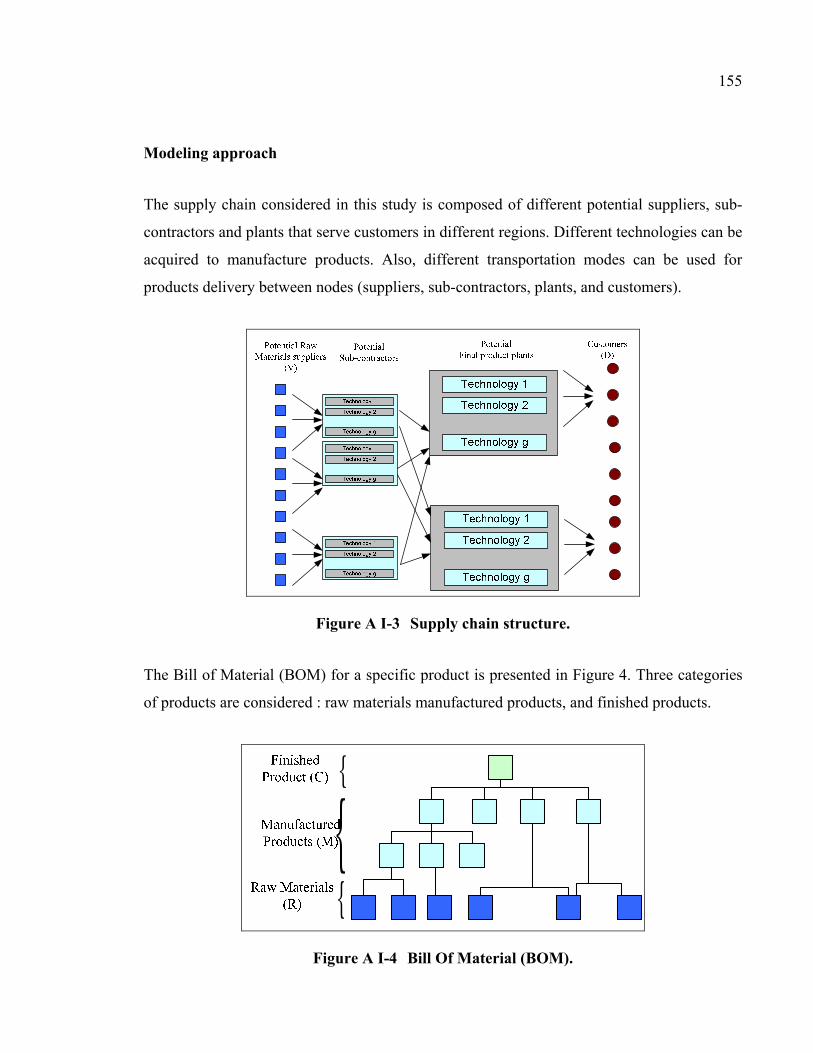
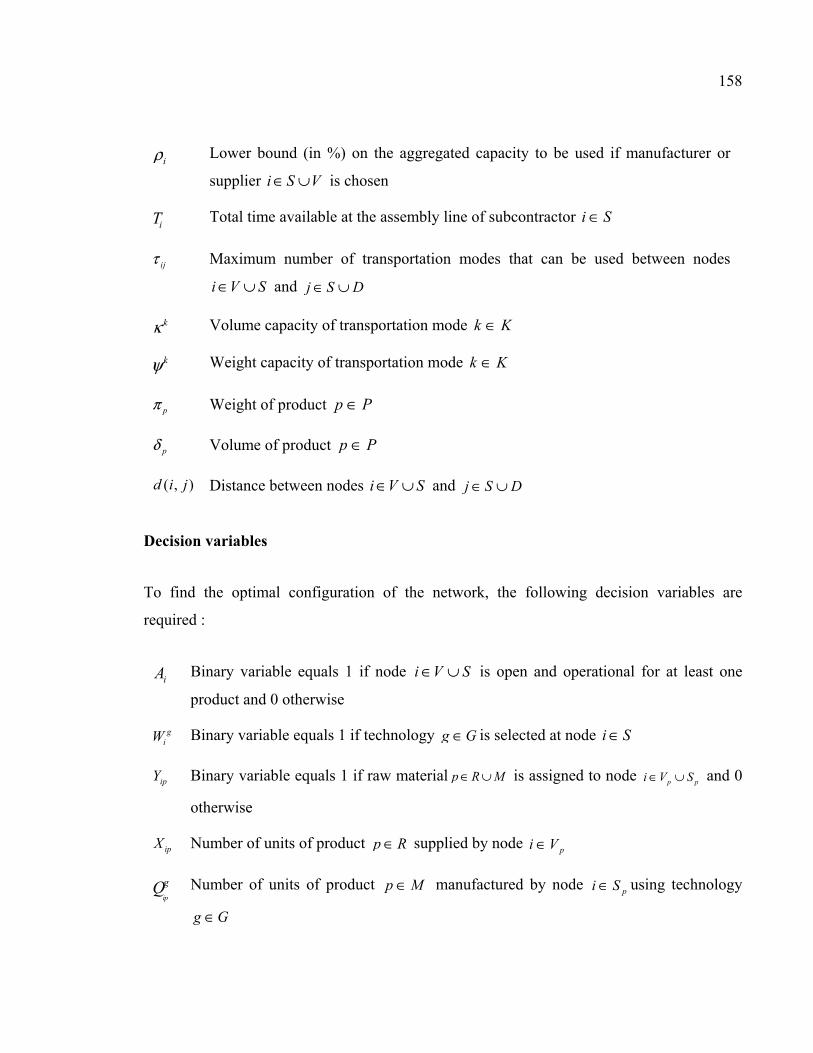
distribution of finished products to the client”. Figure 02 shows the function of supply
(relationship between supplier and producer), processing (production of goods) and
distribution (transportation of final products to clients).
Figure 02 Supply chain representation.
4
New et al. (1995) proposed to represent the supply chain by activities and companies
involved in the supply chain that begins with the extraction of raw materials until the
distribution of products to customer and through production facilities, wholesalers and
retailers. However, the most common definition of supply chain is a system of sub-
contractors, producers, distributors, retailers and customers who exchange materials flow
from suppliers to customers and information flow in both directions (Tayur et al., 1999).
There is also another type of definition that focuses more on the company. For example,
Poirier and Reiter (2001) give the following definition : ” a supply chain is the system where
companies bring their products and services to their customers”. In this context, several
models have been proposed, and the Supply Chain Operations Reference (SCOR) model is
one example that illustrates this type of definion (Supply Chain Council, 2006).
Figure 03 SCOR model - Level 1. Adapted from Supply Chain Council (2006)
Supply chain management can be defined as decisions that optimize the
performance of the network. More specifically, Metzer et al. (2001) propose the following
definition: “supply chain management can be defined as the systemic and strategic
coordination of conventional operational functions and their respective tactics within the
same enterprise and among partners within the supply chain in order to improve long-term
performance of each member company and the entire supply chain”. So, we should
consider an enterprise often belongs to several supply chains for different products (or
product families).
5
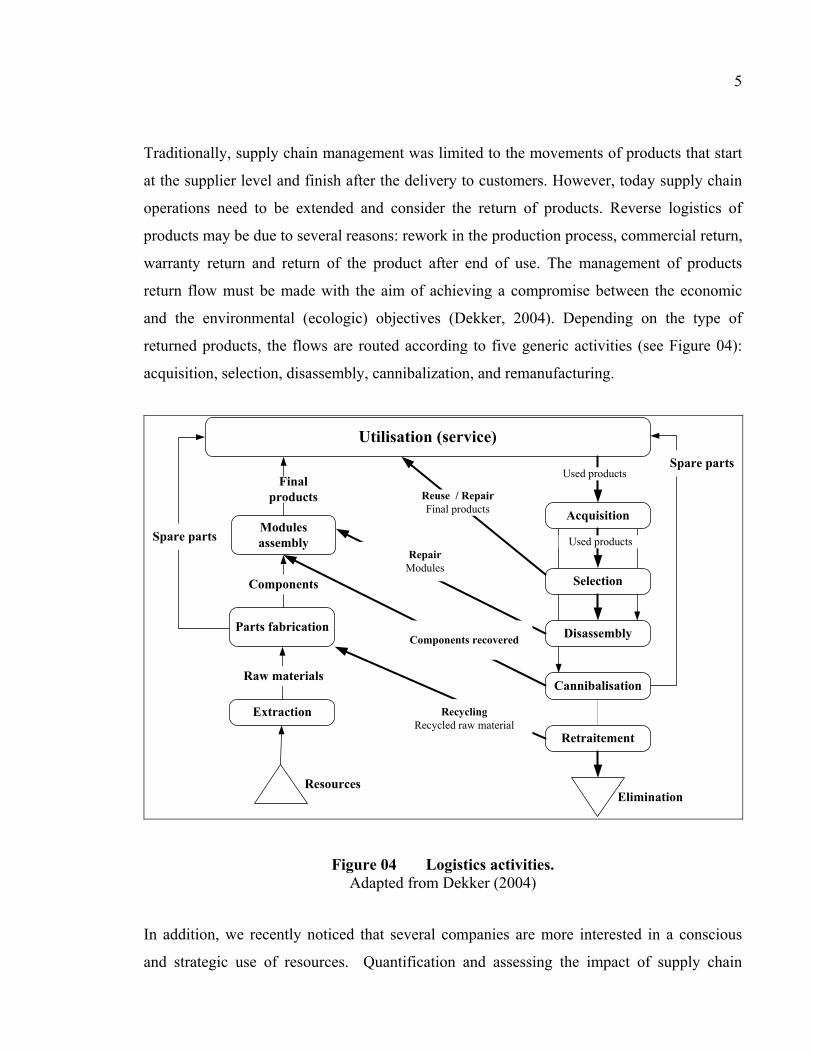
Traditionally, supply chain management was limited to the movements of products that start
at the supplier level and finish after the delivery to customers. However, today supply chain
operations need to be extended and consider the return of products. Reverse logistics of
products may be due to several reasons: rework in the production process, commercial return,
warranty return and return of the product after end of use. The management of products
return flow must be made with the aim of achieving a compromise between the economic
and the environmental (ecologic) objectives (Dekker, 2004). Depending on the type of
returned products, the flows are routed according to five generic activities (see Figure 04):
acquisition, selection, disassembly, cannibalization, and remanufacturing.
Resources
Extraction
Parts fabrication
Modules assembly
Utilisation (service)
Components
Final products
Acquisition
Used products
Raw materials
Selection
Disassembly
Cannibalisation
Spare parts
Reuse / RepairFinal products
Used productsRepair
Modules
Retraitement
Elimination
Recycling Recycled raw material
Components recovered
Spare parts
Figure 04 Logistics activities. Adapted from Dekker (2004)
In addition, we recently noticed that several companies are more interested in a conscious
and strategic use of resources. Quantification and assessing the impact of supply chain
6
operations in terms of emissions generated (liquid, solid and gazes) are gaining importance in
several industries (Srivastava, 2008).
In this case, the approach of Life Cycle Analysis (LCA) becomes more popular to support
the strategic decision making process related to the planning of supply chain activities (De
Benedetto et Klemes, 2009). It is based on the concept of sustainable development by
providing a systemic and efficient tool to evaluate environmental impacts of products,
services and processes. The main goal behind the use of a life cycle analysis approach is to
reduce resources consumption and the damage that can cause industrial activities on the
environment throughout its entire life cycle from the extraction of raw materials until the end
of life of products (return, incineration, recycling, etc.). This concept is also known as the
“cradle-to-grave analysis”.
It is clear that sustainable development recognize the interdependence between the three
pillars of sustainability which are the economic, the environmental and the social objectives.
Until now, sustainable supply chain management stress more on the economic and the
environmental (ecologic) performance (Seuring et Muller, 2008b), the social criteria remains
without a lot of interest. Recently, Hutchins et Sutherland (2008) have explored the subject
and studied how to assess sustainablility at the social level and its application throughout the
decision making process for supply chains. They conclude that a similar approach to the
LCA, which have been applied successfilly to control the environmental dimension, could be
adopted with some minor modifications to evaluate supply chain operations in terms of
safety, qaulity of life and public life.
From the previous sections, we saw that the evolution of the concept of supply chain
management have given rise to the concept of sustaianble supply chain management. Indeed,
many organization are realizing that sustainable development is a critical factor to achieve
competitivity and profitablity. Seuring and Muller (2008) define sustainable supply chain
management as “the management of material, information and capital flows as well as
cooperation among companies along the supply chain while taking goals from all three
dimensions of sustainable development, i.e., economic, environmental and social, into
7
account which are derived from customer and stakeholder requirements”. To achieve
sustainability objectives of the supply chain efficiently, we need to consider several decisions
at different planning levels and pahses of the product life cycle. In addition, it is important to
be able to assess the impact at the same time of economic, environmental and social
decisions under various rules dictated by the business environment.
The economic criteria (cost or profit) was often dominant (Martel, 2005), but the integration
of other metrics such as flexibility, delivery reliability and supply chain responsiveness are
increasingly introduced as key performance indicator to assess the supply chain (Pokharel,
2008; Sabri et Beamon, 2000). For example, Beamon (1999) proposed a framework for
measuring the supply chain performance based on three pillars: resources, outputs and
flexibility. On the other hand, when supply chain managers becomes more aware about the
damage that causes supply chain operations on the environment (pollution, global warming),
other performance indicators are added to evaluate the environmental performance and
control harmful emissions (liquid, solid, and gases). In this perspective, some performance
indicators have been introduced such as “Eco-Indicator 99” which offers a way to measure
various environmental impacts and shows a final result in a single score to three categories:
the impact on human health, the impact on the ecosystem quality and the impact on resources
(Spriensma (2001) et Luo et al. (2001a)).
Fact 1: Based on the preliminary analysis, it is clear that the assessment of
sustainable supply chains should be based on several criteria to ensure that
decision support systems (DSS) are efficiently used in different industrial
contexts and sensitive to the supply chain environment.
The environmental criterion is increasingly considered as an important dimension to integrate
in managing several industrial sectors. Different forces pushed decision makers to this
direction and are related to environmental legislations (for example, environmental
legislation for manufacturers of chemicals products). Moreover, customers are more
responsible about the use of non pollutant products with minimum energy consumption (for
example, the automotive industry) and produced using clean technologies and even
8
going to ensure that production takes place in an appropriate social climate (textile
industry). Thus, priorities change from one industry to another, but the goal is the
same: guarantee the three pillars of sustainable development of the supply chains.
Initially, efforts towards reducing the environmental impact were based on voluntary actions
to improve the image of products "green products". Subsequently, regulations were
introduced nationally in several countries and involve many industrial activities. For
example, for electronic and electrical products, several countries have imposed regulations
on toxic wastes generated by its products. The laws are much stricter in Europe than in
Canada and the United States. The Waste Electronic and Electrical Equipment (WEEE)
regulation on waste of electrical and electronic equipments has become a European law in
February 2003. It imposes targets on levels of collection, recycling and recovery of products
at the end of life cycle (Waste Electronic Equipment and electrical, 2009). In Canada, since
2003, a non profit organization was founded and is implementing a program to collect
electronic products at the end of life cycle for possible reuse (Electronics Product
Stewardship Canada (EPSC), 2009). In the United States, laws vary from state to
another. The Environmental Protection Agency (EPA) has developed a regulatory framework
to encourage sustainable management of electronics and also for other sectors (U.S.
Environmental Protection Agency, 2009).
Finally, this effort towards reducing the environmental impact has taken a global
dimension. The Kyoto Protocol is considered the most important alternative at the global
level and which aims is to combat climate change. Specifically, all countries are
obliged to publish their inventories in terms of greenhouse gases (GHG) emissions. In
addition, they must implement national programs to mitigate climate change. Thus,
countries that ratified the protocol have introduced regulatory frameworks for GHG
emissions such as those existing in Europe, Canada, England and Australia.
Therefore, due to the obligation of controlling the environmental performance in some
sectors, different companies must evaluate their GHG emissions in order to comply with the
new regulations. In addition, they must engage in a sustainable development process in order
9
to avoid penalties that may be costly for those involved in the supply chain. To help
achieving these objectives, the Kyoto Protocol provides countries with the possibility to use
flexibility mechanisms in addition to national policies and measures that they will implement
(Faure et al., 2003). The flexibility mechanisms are: international emission trading (Peace
and Juliani, 2009), Joint Implementation (JI) (Woerdman, 2000) and Clean Development
Mechanisms (CDM) (Michaelowa andJotzo, 2005). Finally, whatever the mechanisms used
by companies to comply with various regulations , it is clear that environmental and social
considerations may impose additional constraints and costs if managers fail to master the
impact of such laws.
Fact 2: Based on the previous analysis, it is clear that the new trends of
sustainable supply chain management combined with several environmental
and social regulations (collection, recycling of product after their use,
greenhouse gases emissions, safety, etc.), companies should identify the
impact of such actions on the economic, environmental and social levels in
order to adopt a sustainable strategy that supports future decisions.
Problem statement
Supply chains are becoming more and more complex. Taking into account the important
elements to make the decision process more sustainable and close to the business
environment is a major challenge for researches in the field of supply chain management.
These elements can be summarized as following:
• the complexity of supply chain activities (large structure and interdependent decisions);
• the existence of several metrics for measuring and evaluating supply chain performances
(objective of sustainable development);
• the dynamic environment of the supply chain (customers / markets, stakeholders,
regulations, laws, etc.).
10
Supply chain design and performance evaluation integrates different criteria and objectives
during the decision making process in addition to the uncertainty that may appears in this
environment. In many situations, decisions makers have to take decisions at different time
span (long, medium or short terms), at different levels (supply, production, storage,
transportation, recycling, incineration, etc.) and based on the available dynamic information
(market, legislations, cost, etc.) while ensuring the sustainable development objectives
(economic, ecological and social). We refer to such problems: multi-criteria design and
evaluation of sustainable supply chains.
In one hand, in some cases, objectives in terms of sustainability are limited to the economic
prosperity which is predominant factor. In this situation, strategic decisions are particularly
important and require a detailed analysis to avoid the risk of errors. There are several tools
and techniques such as mathematical programming, a well established area for the design of
supply chains that can support efficiently the decision process. Mathematical modelling can
solve problems with different levels of complexity. Moreover, multi-criteria methods (multi-
attribute and multi-objective models) can be used in case of the presence of intangible factors
to obtain more realistic solutions. Although this may add another level of complexity in
modelling and solutions development, its offers a realistic decision process close the
industrial context. On the other hand, and under environmental regulatory frameworks, an
effective adaptation of the decision making process and performance evaluation for
sustainable supply chain is a new realty for supply chain managers. Thus there is a real need
for the development of decision making models that take into account the industrial reality
which is more and more complex.
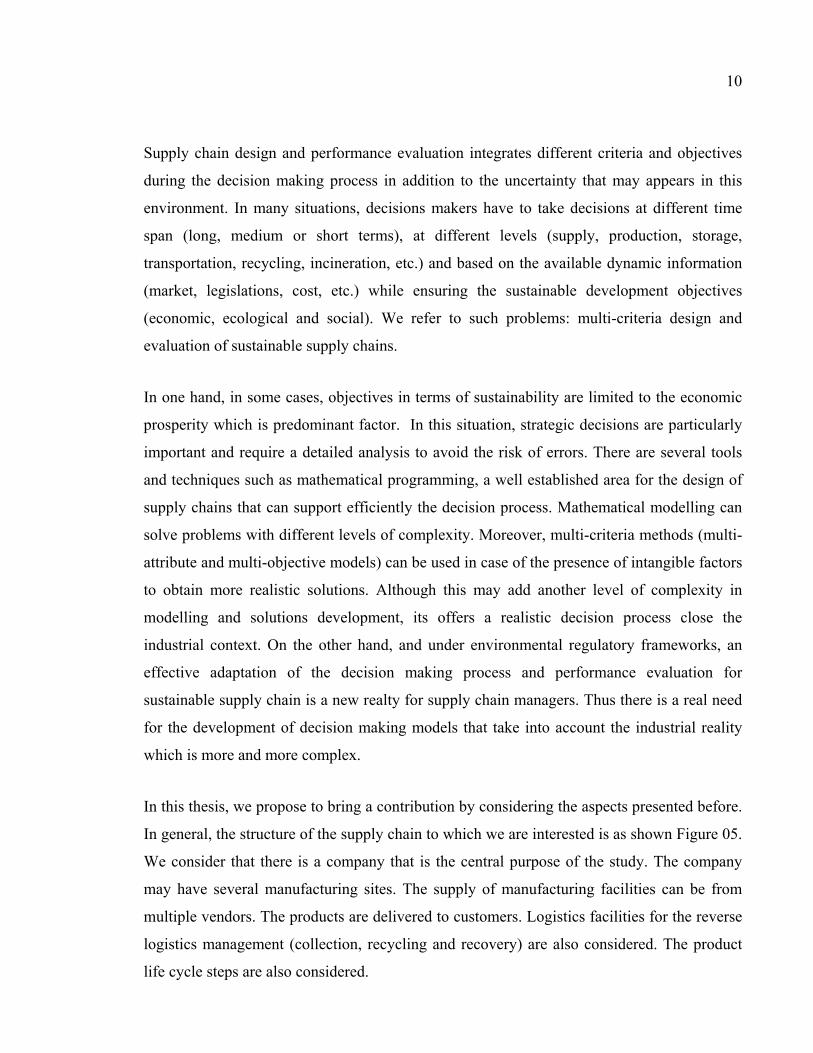
In this thesis, we propose to bring a contribution by considering the aspects presented before.
In general, the structure of the supply chain to which we are interested is as shown Figure 05.
We consider that there is a company that is the central purpose of the study. The company
may have several manufacturing sites. The supply of manufacturing facilities can be from
multiple vendors. The products are delivered to customers. Logistics facilities for the reverse
logistics management (collection, recycling and recovery) are also considered. The product
life cycle steps are also considered.
11
Figure 05 Structure of the supply chain in this study. Adapted from Badurdeen et al. (2008)
In addition, we assume that the company has the opportunity to make benefit from the
various mechanisms that will enable the achievement of sustainable development objectives.
We can distinguish between two types of mechanisms that help achieve these goals:
• Internal mechanisms: the internal mechanisms represent all that policy makers may
consider internally at the company in order to achieve sustainability. Generally, we will
identify the list of potential feasible options at each phase of the product life cycle and we
will select the best option to ensure to establish sustainable supply chains.
• External mechanisms: external mechanisms are options offered by external agencies
(governmental or private) and may be in the form of incentives and opportunities to
develop sustainable supply chains.
12
Thesis objectives
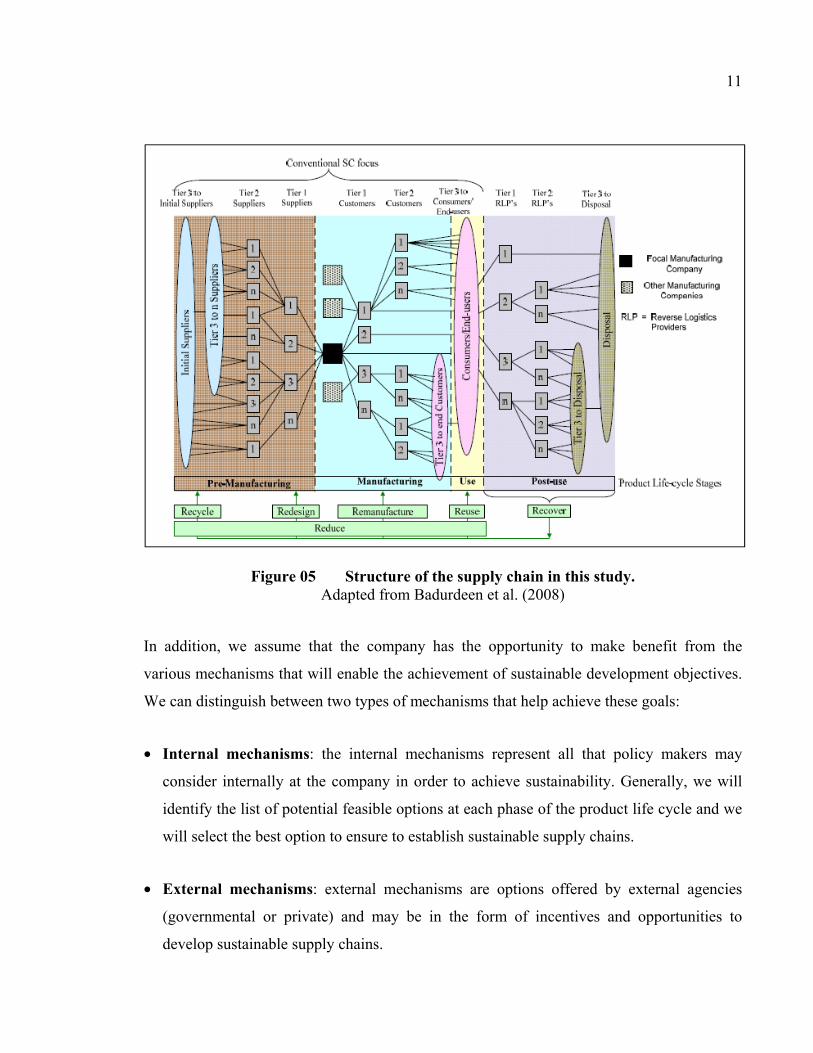
The main objective of the thesis is to provide supply chain managers with a set of decision
support tools for designing and evaluating sustainable supply chains. The following figure
(Figure 06) summarizes the objectives of this research which is to consider internal and
external mechanisms to develop a decision-making process based on different criteria. The
supply chain environment includes suppliers, subcontractors, investors, governments,
markets, etc. In general, decisions to be taken consist of supply chain configuration, flow
planning, management of product returns, emissions management and establishment of a
carbon management strategy, to ensure economic prosperity (reduce costs, improve service
to customers, increase profit, more efficient use of resources, etc), being green and therefore
improve the social impact.
Research questions
As a result, to solve the problem of multi-criteria design and evaluation of sustainable supply
chains, this research aims to answer two important research questions (Q1 and Q2):
• Q1: How to get an efficient supply chain design, integrating the relevant performance
measures and taking into account at the same time strategic decisions (for example: supply
chain design and reconfiguration) and tactical decision (for example safety stock
placement) under a dynamic environment (for example: demand uncertainty) while
avoiding the complexity that can arise in mathematical models dealing with these different
elements?
• Q2: What to use the different mechanisms of sustainable development available by supply
managers at the planning phase where the company is subject to environmental
regulations (for example: cap on greenhouse gases emission)? And how can we get to
sustainable supply chain design under different governmental regulations?
13
Figure 06 Thesis objectives.
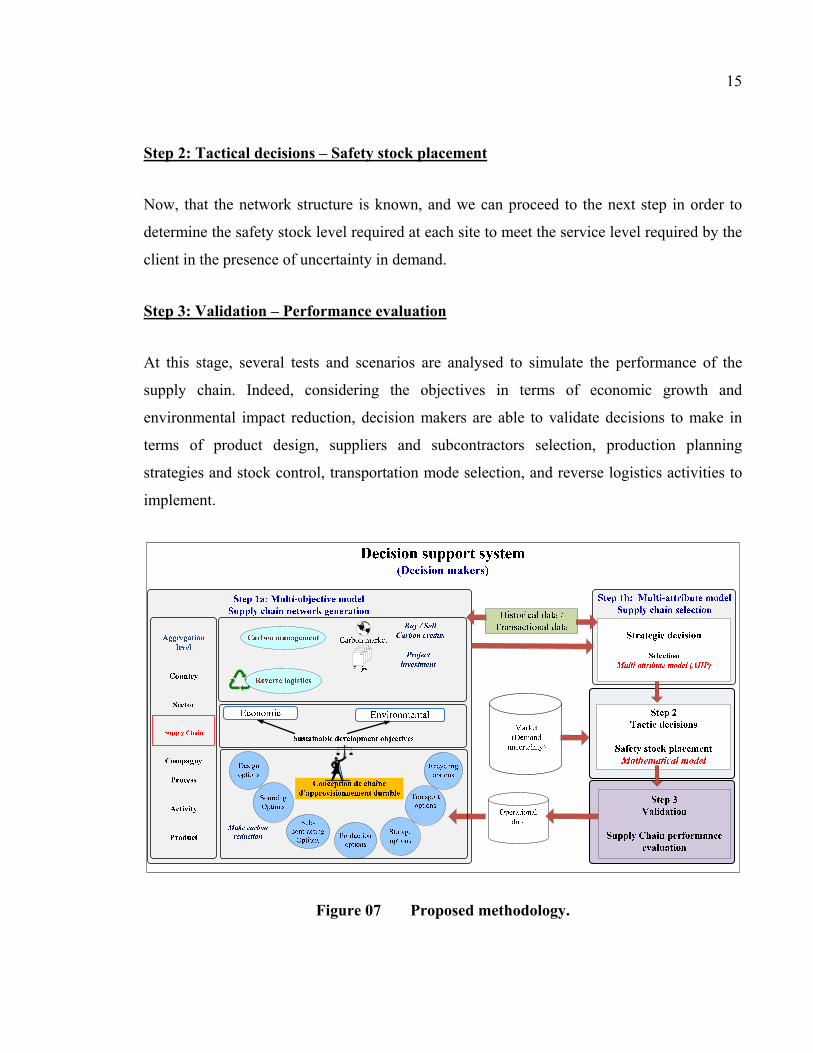
Methodology
To tackle the problem and meet the research objectives introduced previously, the proposed
methodology is based on the development of decision support tools in the form of
mathematical optimization models. To consider the first observation previously introduced,
14
the need for integration of multiple performance measures (quantitative and qualitative)
simultaneously, the use of multi-criteria analysis is advocated (Yoon and Hwang, 1995)
(multi-attribute decision (MADM) and multi-objective (MODM)).
Despite the consistency of the use of a planning approach that integrates simultaneous
different levels of decision making (strategic, tactical and operational), it is not adequate for
real applications of decision making given the complexity of problem and data availability.
Decision models based on hierarchical planning are more realistic (Lebreton, 2007). Indeed,
work initiated by Hax and Meal (1975) on hierarchical production planning and subsequently
adapted to the planning of the supply chain is used in many real cases (Miller, 2001). Also,
many providers of advanced planning systems (APS) are based on hierarchical planning
principles in their development (Meyr et al., 2005) which proves the relevance of such
approaches at the application level. Thus, the proposed methodology also fits into a
hierarchical planning process (see Figure 07). In the following, we briefly explain the various
dissociation between the supply chain design phase and safety stock optimization. To extend
this approach and obtain a global optimization, a multi-objective optimization model for
supply chain network design problem while incorporating safety stock placement decisions
might gives better interaction between both strategic and tactical decisions, and this will be
subject to future research.
Moreover, given the importance of green/ sustainable aspects of the supply chain, it is
necessary to take into account of some additional environmental and social criteria at the
selection phase using AHP. Also, it is better to include these criteria at the design phase to
consider the most important strategic decisions that influence the economic, environmental
and social performance of the supply chain.
2.7 References
Altiparmak, F., Gen, M., Lin, L. and Paksoy, T. (2006) A genetic algorithm approach for multi-objective optimization of supply chain networks. Computational Intelligence and Information Technology : Applications to Industrial Engineering, Computers and Industrial Engineering, 51, 196-215.
Arntzen, B. C., Brown, G. G., Harrison, T. P. and Trafton, L. L. (1995) Global supply chain management at Digital Equipment Corporation. Interfaces, 25, 69-93.
Beynon, M. J. (2008) Constellation graphs and the role of rank position criteria value frontiers in PROMETHEE analysis. International Journal of Operational Research, 3, 201-218.
Bilgen, B. and Ozkarahan, I. (2004) Strategic tactical and operational production-distribution models : a review. International Journal of Technology Management, 28, 151-71.
Chen, C.-L. and Lee, W.-C. (2004) Multi-objective optimization of multi-echelon supply chain networks with uncertain product demands and prices. Computers and Chemical Engineering, 28, 1131-1144.
Chen, C.-L., Wang, B.-W. and Lee, W.-C. (2003) Multiobjective optimization for a multienterprise supply chain network. Industrial and Engineering Chemistry Research, 42, 1879-1889.
66
Chopra, S. and Meindl, P. (2004) Supply chain management : strategy, planning, and operation, Upper Saddle River, N.J., Prentice Hall.
Craig, S. and Hannes, G. (2006) Measuring supply chain performance : current research and future directions. International Journal of Productivity and Performance Management, 55, 242-258.
Dogan, K. and Goetschalckx, M. (1999) Primal decomposition method for the integrated design of multi-period production-distribution systems. IIE Transactions (Institute of Industrial Engineers), 31, 1027-1036.
Dotoli, M., Fanti, M. P., Meloni, C. and Zhou, M. C. (2005) A multi-level approach for network design of integrated supply chains. International Journal of Production Research, 43, 4267-4287.
Dotoli, M., Fanti, M. P., Meloni, C. and Zhou, M. C. (2006) Design and optimization of integrated e-supply chain for agile and environmentally conscious manufacturing. IEEE Transactions on Systems, Man, and Cybernetics Part A :Systems and Humans, 36, 62-75.
Graves, S. C. and Willems, S. P. (2000) Optimizing Strategic Safety Stock Placement in Supply Chains. Manufacturing and Service Operations Management, 2, 68-83.
Hugo, A. and Pistikopoulos, E. N. (2005) Environmentally conscious long-range planning and design of supply chain networks. Journal of Cleaner Production Recent advances in industrial process optimisation, 13, 1471-1491.
Humair, S. and Willems, S. P. (2006) Optimizing strategic safety stock placement in supply chains with clusters of commonality. Operations Research, 54, 725-742.
Inderfurth, K. and Minner, S. (1998) Safety stocks in multi-stage inventory systems under different service measures. European Journal of Operational Research, 106, 57-73.
Jang, Y.-J., Jang, S.-Y., Chang, B.-M. and Park, J. (2002) A combined model of network design and production/distribution planning for a supply network. Computers and Industrial Engineering, 43, 263-281.
Keeney, R. L. and Raiffa, H. (1976) Decisions with multiple objectives preferences and value tradeoffs, New York, J. Wiley.
67
Li, D, et O'Brien, C. 1999. ‘Integrated decision modelling of supply chain efficiency’. International Journal of Production Economics, vol. 59, no 1-3, p. 147-157.
Luo, Y., Zhou, M. and Caudill, R. J. (2001) An integrated E-supply chain model for agile and environmentally conscious manufacturing. IEEE/ASME Transactions on Mechatronics, 6, 377-386.
Magnanti, T. L., Shen, Z.-J. M., Shu, J., Simchi-Levi, D. and Teo, C.-P. (2006) Inventory placement in acyclic supply chain networks. Operations Research Letters, 34, 228-238.
Min, H. and Melachrinoudis, E. (1999) The relocation of a hybrid manufacturing/distribution facility from supply chain perspectives : a case study. Omega, 27, 75-85.
Minner, S. (1997) Dynamic programming algorithms for multi-stage safety stock optimization. OR Spektrum, 19, 261-72.
Pokharel, S. (2008) A two objective model for decision making in a supply chain. International Journal of Production Economics Special Section on Sustainable Supply Chain, 111, 378-388.
Ramanathan, R. (2003) An introduction to data envelopment analysis : a tool for performance measurement, New Delhi, Sage Publications.
Saaty, T. L. (2001) Decision making for leaders : the analytic hierarchy process for decisions in a complex world, Pittsburgh, PA, RWS Publications.
Sabri, E. H. and Beamon, B. M. (2000) A multi-objective approach to simultaneous strategic and operational planning in supply chain design. Omega, 28, 581-98.
Sarmah, S. P. (2008) Supply chain coordination with target profit. International Journal of Operational Research, 3, 140 - 153.
Schärlig, A. (1996) Pratiquer Electre et Prométhée : un complément à Décider sur plusieurs critères, Lausanne, Suisse, Presses polytechniques et universitaires romandes.
Simchi-Levi, D. and Zhao, Y. (2005) Safety stock positioning in supply chains with stochastic lead times. Manufacturing and Service Operations Management, 7, 295-318.
Srikanta, R. and Prasad, S. (2007) Inventory planning for a multi-echelon supply chain. International Journal of Operational Research, 2, 269-283.
Steuer, R. E. (1986) Multiple criteria optimization theory, computation, and application, New York ; Toronto, J. Wiley.
Supply Chain Council (2006) SCOR Model Overview ,Version 8.0. Supply Chain Council Inc.
Vidal, C. J. and Goetschalckx, M. (1997) Strategic production-distribution models : a critical review with emphasis on global supply chain models. European Journal of Operational Research, 98, 1-18.
Vila, D., Martel, A. and Beauregard, R. (2007) Taking market forces into account in the design of production-distribution networks : A positioning by anticipation approach. Journal of Industrial and Management Optimization, 3, 29–50.
Percentage of orders delivered on time with respect to the total number of orders delivered
Fill rate (DR2)
Fill rate is percentage of ship-from-stock orders shipped within 24 h of order receipt
Perfect order fulfillment (DR3)
The percentage of orders meeting deliver performance and with complete and accurate documentation with no shipping damage
Flexibility and responsiveness
(FR)
Supply chain response time
(FR1)
The time it takes the integrated supply chain to respond to abnormal (significant) change in demand
Production flexibility (FR2)
Production flexibility can be seen in two parts, upside flexibility and downside flexibility
Order fulfilment lead time (FR3)
The average actual lead time consistently achieved from customer authorization of purchase order to final installation/order completion at customer end.
Cost (CT)
Total logistics management cost
(CT1)
The sum of supply chain related costs for order management, material acquisition, inventory carrying, finance and planning
Cost of goods sold (CT1)
The cost associated with buying raw materials and producing finished goods.
Value added productivity (CT2)
It includes materials, labour, and problem diagnosis for product defects
Warranty cost or returns processing cost
(CT3)
It includes materials, labour, and problem diagnosis for product defects
Assets (AT)
Cash-to-Cash cycle time (AT1)
Cash-to-Cash cycle time is a measure of the time required in days to convert cash paid to suppliers into cash received from customers, including the inventory required.
Inventory days of supply (AT2)
Total gross value of inventory at standard cost before reserves for excess and obsolescence.
Asset turns (AT3)
Total turns of capital employed. It impacts inventory, accounts payable, accounts receivable, and fixed assets on the balance sheet.
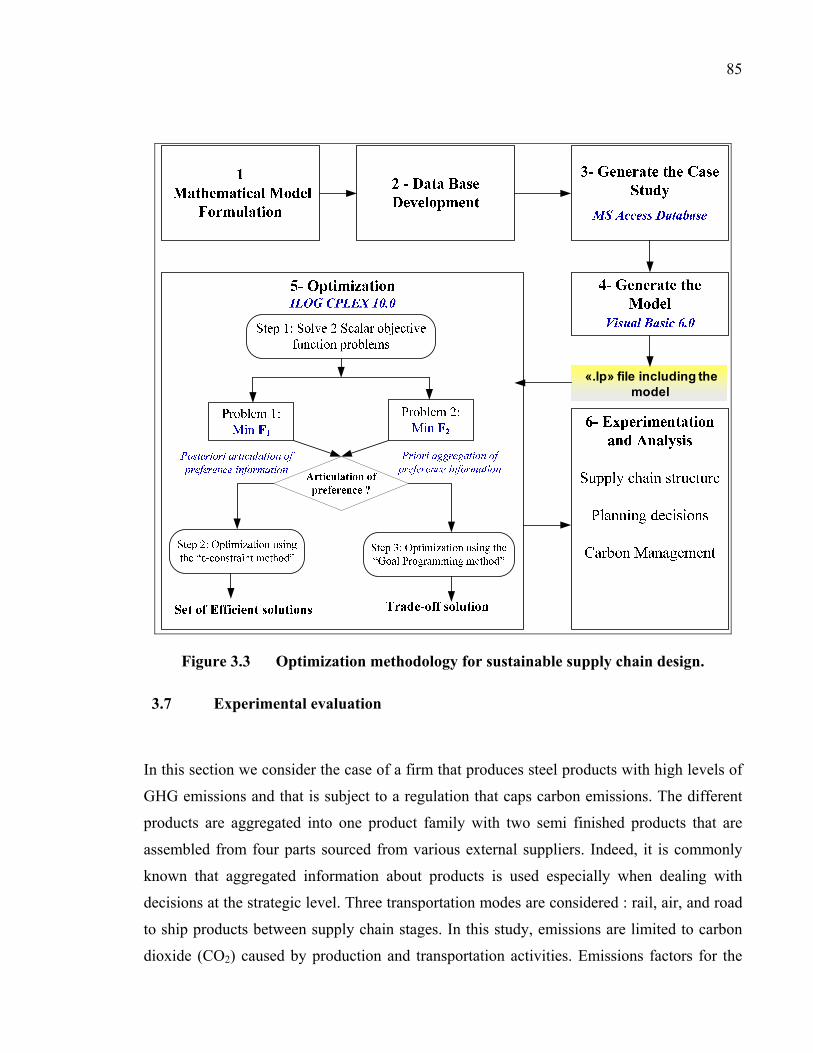
CHAPTER 3
ARTICLE #2 «DESIGNING AND EVALUATING SUSTAINABLE SUPPLY CHAINS»
Amin Chaabane, Amar Ramudhin, Marc Paquet
Département de génie de la production automatisée, École de Technologie Supérieure,
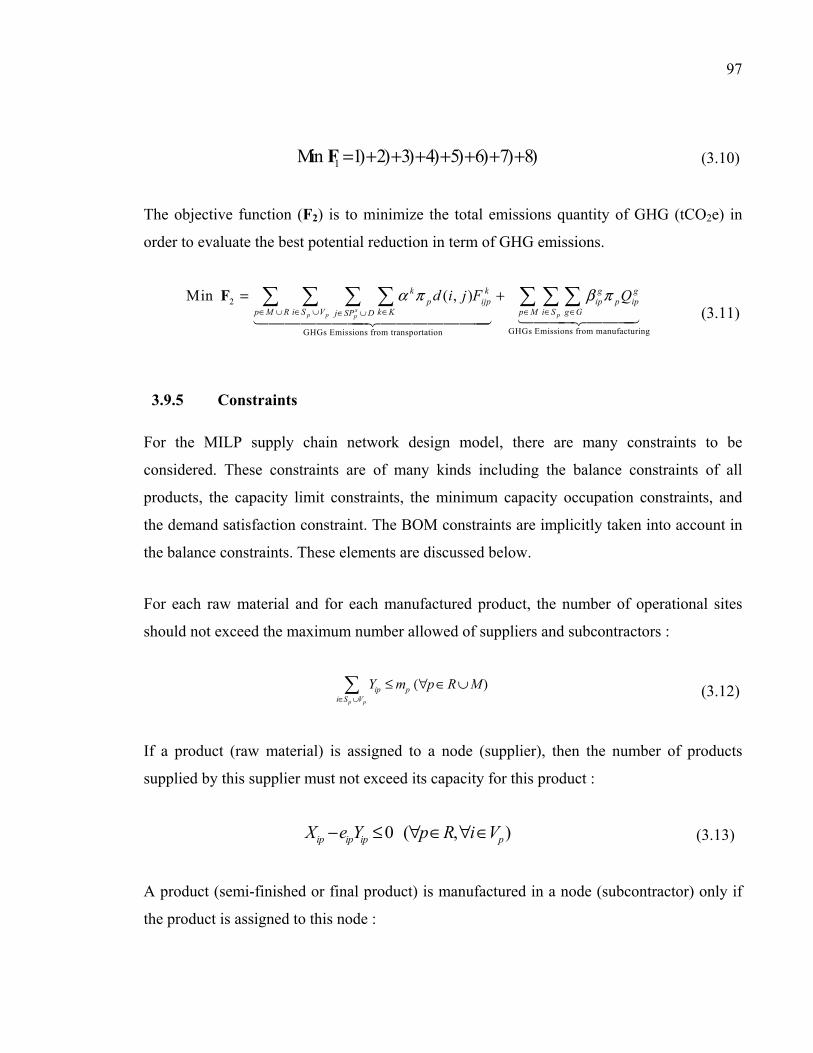
The objective function (F2) is to minimize the total emissions quantity of GHG (tCO2e) in
order to evaluate the best potential reduction in term of GHG emissions.
2
GHGs Emissions from manufacturingGHGs Emissions from transportation
Min ( , )s
p p pp
k k g gp ijp ip p ip
p M R i S V k K p M i S g Gj SP D
d i j F Qα π β π∈ ∪ ∈ ∪ ∈ ∈ ∈ ∈∈ ∪
= + F
(3.11)
3.9.5 Constraints
For the MILP supply chain network design model, there are many constraints to be
considered. These constraints are of many kinds including the balance constraints of all
products, the capacity limit constraints, the minimum capacity occupation constraints, and
the demand satisfaction constraint. The BOM constraints are implicitly taken into account in
the balance constraints. These elements are discussed below.
For each raw material and for each manufactured product, the number of operational sites
should not exceed the maximum number allowed of suppliers and subcontractors :
)p p
ip pi S V
Y m p R M∈ ∪
≤ (∀ ∈ ∪ (3.12)
If a product (raw material) is assigned to a node (supplier), then the number of products
supplied by this supplier must not exceed its capacity for this product :
0 ( , )ip ip ip pX e Y p R i V− ≤ ∀ ∈ ∀ ∈ (3.13)
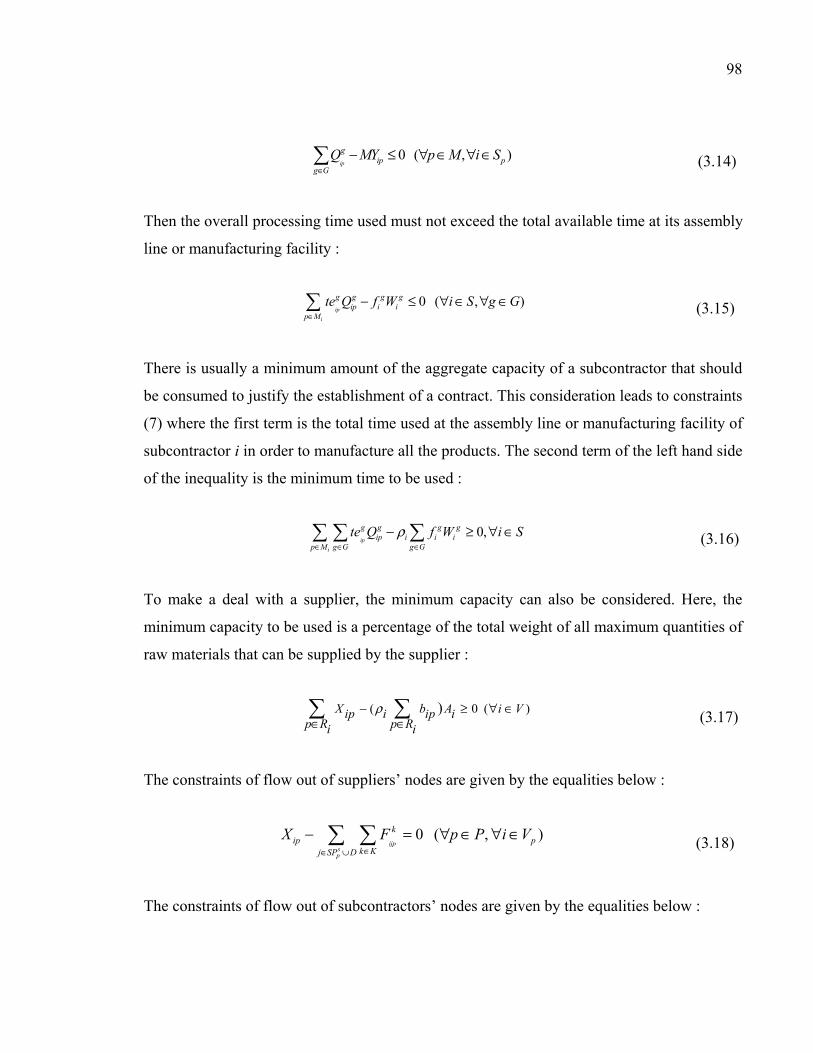
A product (semi-finished or final product) is manufactured in a node (subcontractor) only if
the product is assigned to this node :
98
0 ( , )ip
gip p
g G
Q MY p M i S∈
− ≤ ∀ ∈ ∀ ∈ (3.14)
Then the overall processing time used must not exceed the total available time at its assembly
line or manufacturing facility :
0 ( , )ip
i
g g g gip i i
p M
te Q f W i S g G∈
− ≤ ∀ ∈ ∀ ∈ (3.15)
There is usually a minimum amount of the aggregate capacity of a subcontractor that should
be consumed to justify the establishment of a contract. This consideration leads to constraints
(7) where the first term is the total time used at the assembly line or manufacturing facility of
subcontractor i in order to manufacture all the products. The second term of the left hand side
of the inequality is the minimum time to be used :
0,ip
i
g g g gip i i i
p M g G g G
te Q f W i Sρ∈ ∈ ∈
− ≥ ∀ ∈ (3.16)
To make a deal with a supplier, the minimum capacity can also be considered. Here, the
minimum capacity to be used is a percentage of the total weight of all maximum quantities of
raw materials that can be supplied by the supplier :
( 0 ( ))X b A i Vip i ip ip R p Ri i
ρ− ≥ ∀ ∈∈ ∈
(3.17)
The constraints of flow out of suppliers’ nodes are given by the equalities below :
0 ( , )ijp
sp
kip p
k Kj SP D
X F p P i V∈∈ ∪
− = ∀ ∈ ∀ ∈ (3.18)
The constraints of flow out of subcontractors’ nodes are given by the equalities below :
99
0 ( , )ijp
sp
g kip p
g G k Kj SP D
Q F p P i S∈ ∈∈ ∪
− = ∀ ∈ ∀ ∈ (3.19)
For each product, the quantity that arrives to a node must equal the quantity needed to
manufacture next higher assemblies :
' ''
0 ( , )jip
sp p
k g spp ip p
j S k K g Gp P
F Q p M i SPθ∈ ∈ ∈∈
− = ∀ ∈ ∀ ∈ (3.20)
The quantity of finished products shipped from all its subcontractors to the demand node
must equal the demand of that product :
( , )idp
p
kpd
i S k K
F d p C d D∈ ∈
= ∀ ∈ ∀ ∈ (3.21)
For each couple of nodes, there is a maximum number of transportation modes that can be
used :
( , )k K
kZ i V S j S Dij ijτ∈
≤ ∀ ∈ ∪ ∀ ∈ ∪ (3.22)
The quantity of products shipped between two nodes is limited by the capacity of
transportation mode and the number of shipments. While the first set of constraints (3.23)
expresses the volume capacity and the second set (3.24) expresses the weight capacity :
0 ( , , )i i
k k kp ijp ij
p R M
F U i V S j S D k Kδ κ∈ ∪
− ≤ ∀ ∈ ∪ ∀ ∈ ∪ ∀ ∈ (3.23)
0 ( , , )k k kF U i V S j S D k Kp ijp ijp R Mi i
π ψ− ≤ ∀ ∈ ∪ ∀ ∈ ∪ ∀ ∈∈ ∪
(3.24)
100
The following are logical constraints. The number of shipments between two nodes for a
given transportation mode is not nil only if the transportation mode is actually used. This
yields to the following constraints :
0 ( , , )k kij ijU MZ i V S j S D k K− ≤ ∀ ∈ ∪ ∀ ∈ ∪ ∀ ∈ , where M is a big number (3.25)
A site is selected if it is open for one product at least :
0 ( , )ip i i iY A i S V p M R− ≤ ∀ ∈ ∪ ∀ ∈ ∪ (3.26)
The following are constraints on decision variables. The transport variables, the quantities
supplied and manufactured by sites are non negative :
0 ( , , , )ijp
k sp p pF p R M i V S j SP D k K≥ ∀ ∈ ∪ ∀ ∈ ∪ ∀ ∈ ∪ ∀ ∈ (3.27)
0 ( ( , ) )ip p pX p i R V M S≥ ∀ ∈ × ∪ × (3.28)
0 ( )gip pQ p M i S g G≥ ∀ ∈ ∀ ∈ ∀ ∈ (3.29)
Binary variables :
{ }0,1 , ( , )ip p pY p i R V M S∈ ∀ ∈ × ∪ × (3.30)
{ }0,1 ,iA i S V∈ ∀ ∈ ∪ (3.31)
{ }0,1 ,ipY p R M i S V∈ ∀ ∈ ∪ ∀ ∈ ∪ (3.32)
{ }0,1 ,giW i S g G∈ ∀ ∈ ∀ ∈ (3.33)
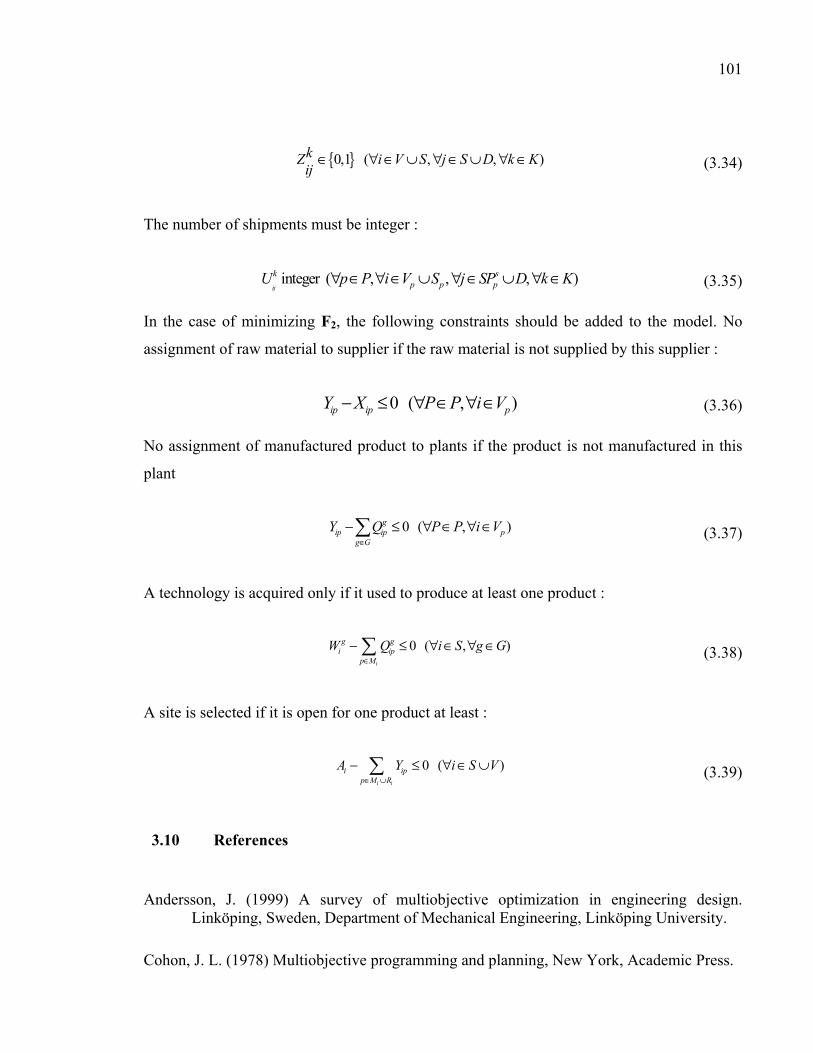
101
{ }0,1 ( , , )kZ i V S j S D k Kij
∈ ∀ ∈ ∪ ∀ ∈ ∪ ∀ ∈ (3.34)
The number of shipments must be integer :
integer ( , , , )ij
k sp p pU p P i V S j SP D k K ∀ ∈ ∀ ∈ ∪ ∀ ∈ ∪ ∀ ∈ (3.35)
In the case of minimizing F2, the following constraints should be added to the model. No
assignment of raw material to supplier if the raw material is not supplied by this supplier :
0 ( , )ip ip pY X P P i V− ≤ ∀ ∈ ∀ ∈ (3.36)
No assignment of manufactured product to plants if the product is not manufactured in this
plant
0 ( , )gip ip p
g G
Y Q P P i V∈
− ≤ ∀ ∈ ∀ ∈ (3.37)
A technology is acquired only if it used to produce at least one product :
0 ( , )i
g gi ip
p M
W Q i S g G∈
− ≤ ∀ ∈ ∀ ∈ (3.38)
A site is selected if it is open for one product at least :
0 ( )i i
i ipp M R
A Y i S V∈ ∪
− ≤ ∀ ∈ ∪ (3.39)
3.10 References
Andersson, J. (1999) A survey of multiobjective optimization in engineering design. Linköping, Sweden, Department of Mechanical Engineering, Linköping University.
Cohon, J. L. (1978) Multiobjective programming and planning, New York, Academic Press.
102
Dotoli, M., Fanti, M. P., Meloni, C. and Zhou, M. C. (2005) A multi-level approach for network design of integrated supply chains. International Journal of Production Research, 43, 4267-4287.
Facanha, C. and Horvath, A. (2007) Evaluation of Life-Cycle Air Emission Factors of Freight Transportation. Environmental Science & Technology, 41, 7138-7144.
Ferretti, I., Zanoni, S., Zavanella, L. and Diana, A. (2007) Greening the aluminium supply chain. International Journal of Production Economics, 108, 236-245.
Frota Neto, J. Q., Bloemhof-Ruwaard, J. M., van Nunen, J. A. E. E. and van Heck, E. (2008) Designing and evaluating sustainable logistics networks. International Journal of Production Economics, 111, 195-208.
Government of Canada (2008) Turning the Corner : Regulatory Framework for Industrial Greenhouse Gas Emissions.
Guillen-Gosalbez, G. and Grossmann, I. E. (2009) Optimal design and planning of sustainable chemical supply chains under uncertainty. AIChE Journal, 55, 99-121.
Jayaraman, V., Guide, V. D. R. and Srivastava, R. (1999) A closed-loop logistics model for remanufacturing. Journal of the Operational Research Society, 50, 497-508.
Johnson, E. and Heinen, R. (2004) Carbon trading : time for industry involvement. Environment International, 30, 279-288.
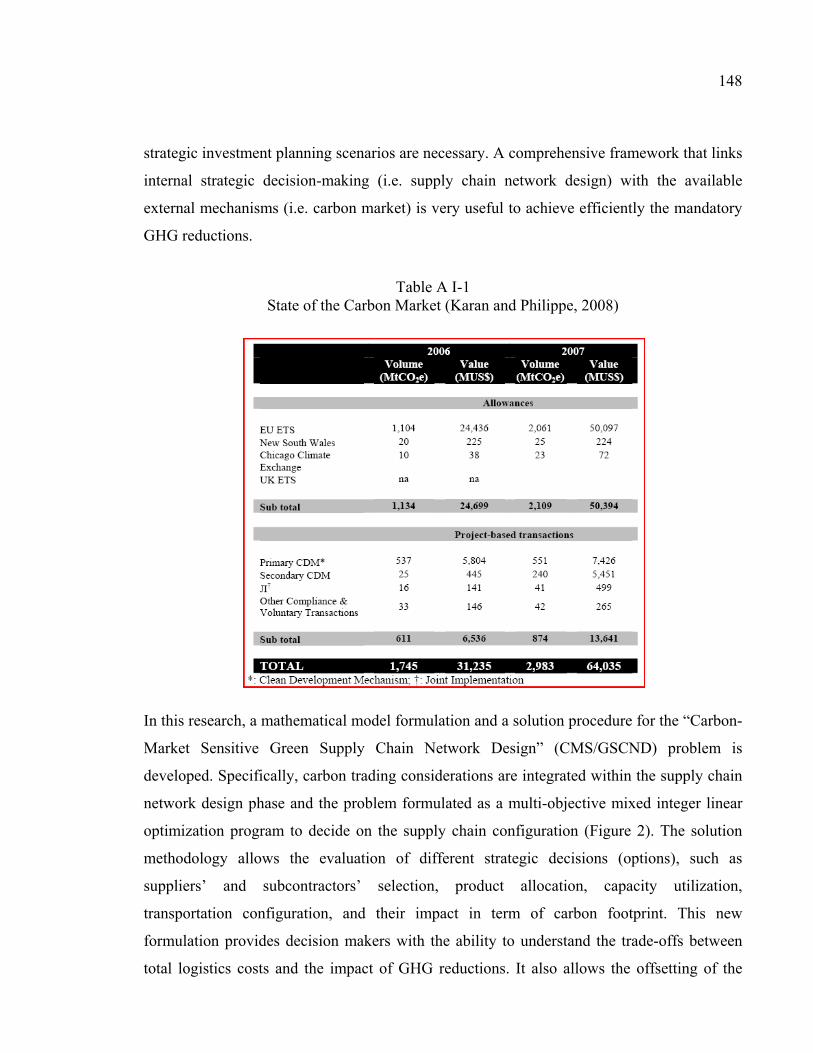
Karan, C. and Philippe, A. (2008) State and trends of the carbon market 2008. Washington, D.C., The World Bank.
Kettani, O., Aouni, B. and Martel, J.-M. (2004) The double role of the weight factor in the goal programming model. Computers & Operations Research, 31, 1833-1845.
Labatt, S. and White, R. R. (2007) Carbon finance : the financial implications of climate change, Hoboken, N.J., John Wiley & Sons.
Luo, Y., Zhou, M. and Caudill, R. J. (2001) An integrated E-supply chain model for agile and environmentally conscious manufacturing. IEEE/ASME Transactions on Mechatronics, 6, 377-386.
Nari, V., Jhana, S. and Robert, S. (2008) Supply Chain Network Design : Architecting A Green Future. Boston, Aberdeen Group.
103
Peace, J. and Juliani, T. (2009) The coming carbon market and its impact on the American economy. Policy and Society, 27, 305-316.
Pistikopoulos, E. N. and Hugo, A. (2005) Environmentally conscious long-range planning and design of supply chain networks. Journal of Cleaner Production, 13, 1428-48.
Ramudhin, A., Chaabane, A., Kharoune, M. and Paquet, M. (2008) Carbon Market Sensitive Green Supply Chain Network Design. IEEE International Conference on Industrial Engineering and Engineering Management, 2008. IEEM 2008.
Seuring, S. and Muller, M. (2008) From a literature review to a conceptual framework for sustainable supply chain management. Journal of Cleaner Production, 16, 1699-1710.
Sheu, J.-B., Chou, Y.-H. and Hu, C.-C. (2005) An integrated logistics operational model for green-supply chain management. Transportation Research Part E : Logistics and Transportation Review, 41, 287-313.
Srivastava, S. K. (2007) Green supply-chain management : A state-of-the-art literature review. International Journal of Management Reviews, 9, 53-80.
CHAPTER 4
ARTICLE #3 «DESIGN OF SUSTAINABLE SUPPLY CHAINS UNDER THE EMISSION TRADING SCHEME»
Amin Chaabane, Amar Ramudhin, Marc Paquet
Département de génie de la production automatisée, École de Technologie Supérieure,
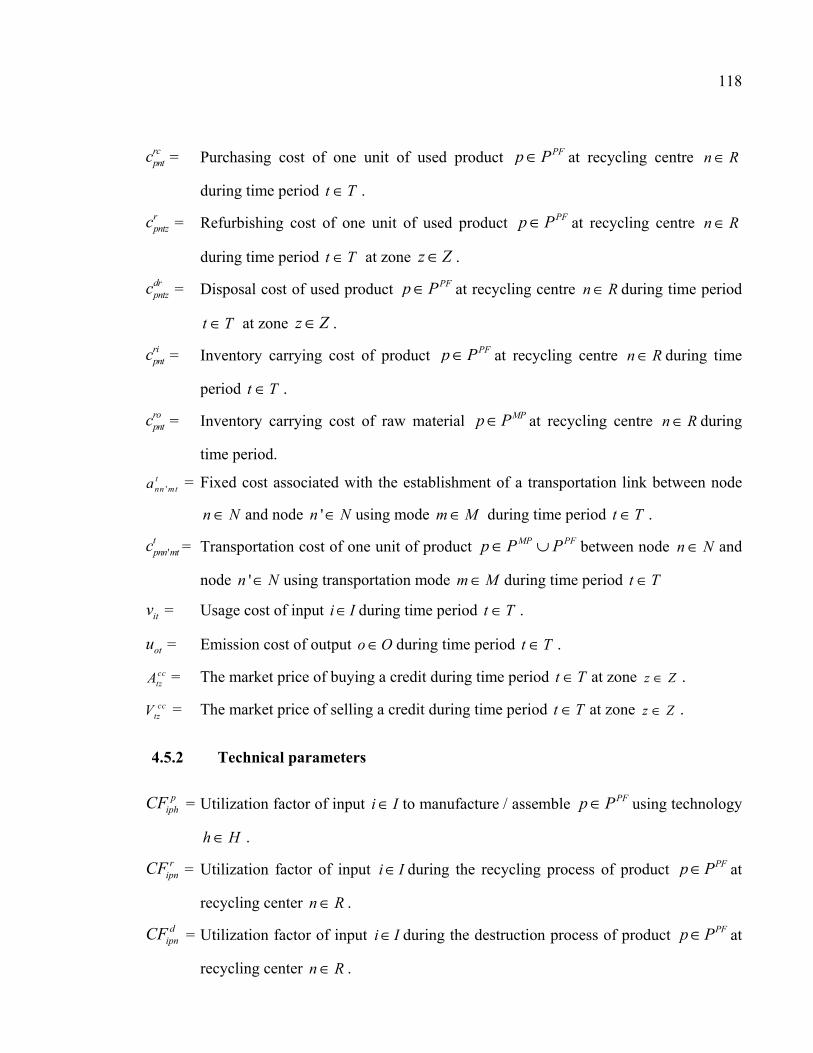
, ,fo fo PFpnt pntI i p P n F t T≤ ∀ ∈ ∀ ∈ ∀ ∈ (4.19)
If a production unit is operational, it will stay for the whole planning horizon:
( 1) ,f fnt n tY Y n F t T−≥ ∀ ∈ ∀ ∈ (4.20)
If a technology is acquired, it is used for the whole horizon
( 1) , ,h hhnt hn tY Y h H n F t T−≥ ∀ ∈ ∀ ∈ ∀ ∈ (4.21)
Logic constraint for operating production units
,f lnt nz
z Z
Y Y n F t T∈
<= ∀ ∈ ∀ ∈ (4.22)
Limited number of production units per zone
1 lnz
z Z
Y n F∈
<= ∀ ∈ (4.23)
Distribution centers (DCs)
Inventory constraints at distribution centers
( 1) ' '' '
, ,d d PFpn t pn nmt pnt pnn mt
n F m M n C m M
I F I F p P n D t T−∈ ∈ ∈ ∈
+ = + ∀ ∈ ∀ ∈ ∀ ∈ (4.24)
Initial inventory levels for final products
0 0 ,d PFpntI p P n D= ∀ ∈ ∀ ∈ (4.25)
Inventory capacity constraints for final products at DCs
127
, ,d d PFpnt pntI i p P n D t T≤ ∀ ∈ ∀ ∈ ∀ ∈ (4.26)
Distribution center capacity
' '' '
, ,d PFpn nmt pnn mt nt nt
n F m M n C m M
F F Y p P n D t Tχ∈ ∈ ∈ ∈
+ ≤ ∀ ∈ ∀ ∈ ∀ ∈ (4.27)
If the production center is selected, it will stay operational for the whole planning horizon:
( 1) ,d dnt n tY Y n D t T−≥ ∀ ∈ ∀ ∈ (4.28)
If the distribution center is not located in a specific region then it is not operational
,d lnt nz
z Z
Y Y n D t T∈
≤ ∀ ∈ ∀ ∈ (4.29)
Limited number of distribution centers per zone
1 lnz
z Z
Y n D∈
<= ∀ ∈ (4.30)
Customers
Demand constraint
''
, ,PFpn nmt pnt
n D m M
F d p P n C t T∈ ∈
= ∀ ∈ ∀ ∈ ∀ ∈ (4.31)
Recycling centers
Location recycling centers at zones
( ) , , , big numberPF
r d a lpntz pntz pntz nt
z Zp P
Q Q Q M Y n R t T M∈∈
+ + ≤ ∀ ∈ ∀ ∈ (4.32)
Recovery of used products
''
,PFpnn mt pt pnt
n C n R m M n N
F d p P t Tδ∈ ∈ ∈ ∈
= ∀ ∈ ∀ ∈ (4.33)
Initial inventory of products recovered at recycling centers:
0 0 ,ri PFpnI p P n R= ∀ ∈ ∀ ∈ (4.34)
Inventory of used products at recycling centers
( 1) ''
, ,ri ri a PFpn t pnn mt pnt pntz
n C m M z Z
I F I Q p P n R t T−∈ ∈ ∈
+ = + ∀ ∈ ∀ ∈ ∀ ∈ (4.35)
Inventory capacity of used products of recycling centers
, ,ri ri PFpnt pntI i p P n R t T≤ ∀ ∈ ∀ ∈ ∀ ∈ (4.36)
Disposal of non valuable products (sorting process)
128
, , ,d a PFpntz pntz pntzQ Q p P n R t T z Zθ= ∀ ∈ ∀ ∈ ∀ ∈ ∀ ∈ (4.37)
Reprocessing of good products
' ' ''
(1 ) , , ,PF
r a MP PFpntz pp p ntz p ntz
p P
Q Q p P P n R t T z Zφ θ∈
= − ∀ ∈ ∪ ∀ ∈ ∀ ∈ ∀ ∈ (4.38)
Inventory of output products (raw material, components) from recycling centers
( 1) ''
, ,ro r ro MP PFpn t pntz pnt pnn mt
z Z n F m M
I Q I F p P P n R t T−∈ ∈ ∈
+ = + ∀ ∈ ∪ ∀ ∈ ∀ ∈ (4.39)
Initial inventory level of output products (raw material and components) from recycling
centers
0 0 ,ro MP PFpnI p P P n R= ∀ ∈ ∪ ∀ ∈ (4.40)
Inventory capacity of output products (raw material and components) at recycling centers
, ,ro ro MP PFpnt pntI i p P P n R t T≤ ∀ ∈ ∪ ∀ ∈ ∀ ∈ (4.41)
Recycling process capacity
, ,a r r PFpntz pnt nt
z Z
Q q Y p P n R t T∈
≤ ∀ ∈ ∀ ∈ ∀ ∈ (4.42)
If a node is operational, it is used for the planning horizon
( 1) ,r rnt n tY Y n D t T−≥ ∀ ∈ ∀ ∈ (4.43)
Transportation
Transportation capacity
' ' ' , ' , ,MP PF
tpnn mt mnn t mnn t
p P P
F c Y n N n N m M t T∈ ∪
≤ ∀ ∈ ∀ ∈ ∀ ∈ ∀ ∈ (4.44)
If the recycling center is not located in a specific region then it is not operational
,R lnt nz
z Z
Y Y n R t T∈
≤ ∀ ∈ ∀ ∈ (4.45)
Limited number of distribution centers per zone
1 lnz
z Z
Y n D∈
<= ∀ ∈ (4.46)
Carbon management
At each period t T∀ ∈ and zone z Z∀ ∈ , the company must be in compliance with the
limitation of carbon emissions (CO2e), thus
129
)
PF PF PF
PF PF PF
out p p r r d do oph phntz opn pntz opn pntz
o O h H n F n R n Rp P p P p P
in p p r r d di iph phntz ipn pntz ipn pntz
i I h H n F n R n Rp P p P p P
CO EF Q EF Q EF Q
CO CF Q CF Q CF Q
∈ ∈ ∈ ∈ ∈∈ ∈ ∈
∈ ∈ ∈ ∈ ∈∈ ∈ ∈
+ + +
+ + +
2 CO e
tz tz tzCC CC L t T z Z+ −− ≤ ∀ ∈ ∀ ∈
(4.47)
Limit on the number of credits to purchase
COPtz tzCC L t T z Z− ≤ ∀ ∈ ∀ ∈ (4.48)
Limit on the number of credits that can be sold
COStz tzCC L t T z Z+ ≤ ∀ ∈ ∀ ∈ (4.49)
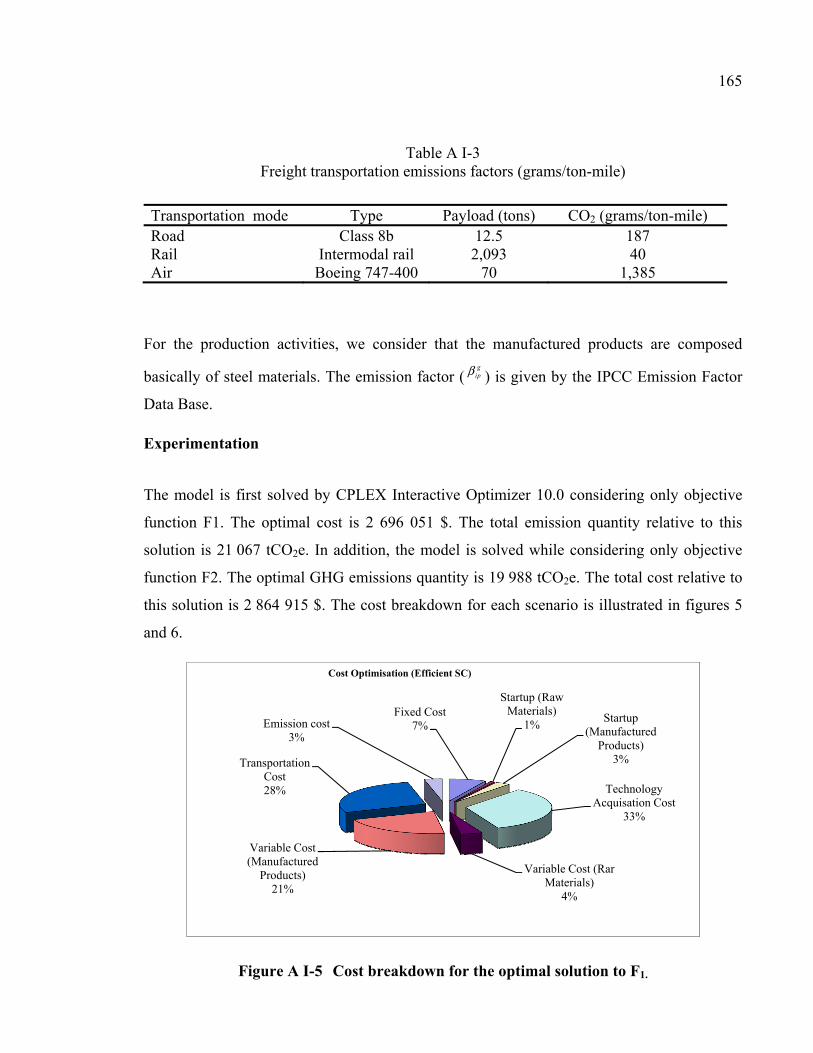
4.6 Experimental evaluation
4.6.1 Data
The mathematical model has been developed, validated and was used in a preliminary study
of a supply chain from the aluminum industry to illustrate the potential application as a
decision making tool for sustainable supply chain planning under different environmental
regulations that impose mandatory limits on carbon emissions as well as the obligation of
product recovery and recycling at the end of life.
In this research, we consider the aluminum production as an example to study some
important research questions and find some managerial decisions under environmental
regulations. In the aluminum industry, there are typically two sources of raw materials,
namely, bauxite which is the primary raw material from which aluminum is made, and
secondary aluminum which is obtained by recycling aluminum products. Since aluminum is
100% recyclable without any loss of its natural qualities, recovery of the metal via recycling
has become an important facet of the industry. Products under consideration can be made
either made from primary or secondary aluminum using either one of two potential
technologies which have different operating costs and different GHG emissions. Critical
inputs and outputs including liquid, solid, energy, and gaseous wastes are considered.
130
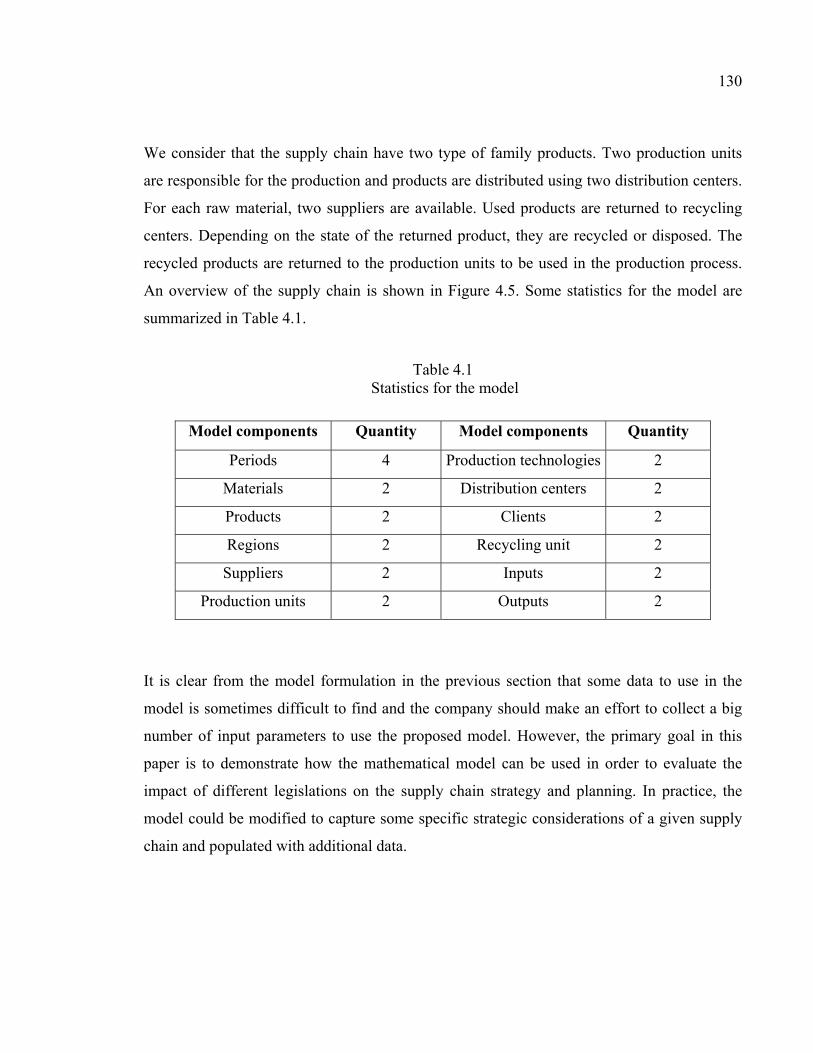
We consider that the supply chain have two type of family products. Two production units
are responsible for the production and products are distributed using two distribution centers.
For each raw material, two suppliers are available. Used products are returned to recycling
centers. Depending on the state of the returned product, they are recycled or disposed. The
recycled products are returned to the production units to be used in the production process.
An overview of the supply chain is shown in Figure 4.5. Some statistics for the model are
summarized in Table 4.1.
Table 4.1 Statistics for the model
Model components Quantity Model components Quantity
Periods 4 Production technologies 2
Materials 2 Distribution centers 2
Products 2 Clients 2
Regions 2 Recycling unit 2
Suppliers 2 Inputs 2
Production units 2 Outputs 2
It is clear from the model formulation in the previous section that some data to use in the
model is sometimes difficult to find and the company should make an effort to collect a big
number of input parameters to use the proposed model. However, the primary goal in this
paper is to demonstrate how the mathematical model can be used in order to evaluate the
impact of different legislations on the supply chain strategy and planning. In practice, the
model could be modified to capture some specific strategic considerations of a given supply
chain and populated with additional data.
131
Productionplant
MP2Carbon Anode
MP1Beauxite
Second generation aluminium
PF1AluminiumSupplier 1
Recyclingplant
Customers
PF1Aluminium
Production system CustomersRaw material
suppliers
Reverse logistic
Supplier 2
Distributor
Distribution
PF1Aluminium
Deleted products
Technology 1
Technology 2
Output 1
Output 3
Output 2
Input 1
Input 2
Output 1
Output 2
Input 1
Input 2
Figure 4.5 Case study supply chain network.
For the aim of the study, some parameters are estimated, the others ones are collected from
the available information on the web. For example, the model developed in this paper
highlights the importance of LCA data in order to help and inform managerial decision
making. Numeric estimates of air emissions, solid waste generation, material consumption,
are valuable in estimating model's parameters, thus enabling the bridging of operational and
environmental decisions. The Intergovernmental Panel on Climate Change (IPCC), is an
important source of data and was used to estimate emission factors (http://www.ipcc-
nggip.iges.or.jp/EFDB/main.php).
132
4.6.2 Solution method
Different commercially-available optimization software exists today to solve MIP
optimization problems. As discussed in previous section, it is currently impossible to use real
data to populate the model. However, to demonstrate the practical solvability of the model,
we randomly generate some numerical scenarios of parameters and constraints (see Table
4.2), and solve the model using the LINGO version of LINDO systems Inc on an AMD 2 493
Mhz PC running Windows XP.
Table 4.2 Characteristics of the MIP model
Number of
variables
Binary
variables
Continuous
variables
Number of
constraints
Case study 1136 292 844 809
The mean and median run times per numerical scenario with the default LINGO solver
settings, were 600 seconds and 500 seconds, respectively, which is a very practical amount of
time. Although this example is with limited number of products and sites (suppliers,
production units, and recycling centers), more sophisticated global optimization approaches
for large scale optimization problem could be used to solve large scale supply chain network.
4.6.3 Research questions
In this section, we will present briefly the research questions that we attempt to answer by
populating the model with data and solving it. To be in compliance with the environmental
regulations, the company has different options. The first one is to re-locate production units
and recycling centers at other regions. Carbon prices vary from one region to another. The
company can invest on new production technologies to reduce carbon emissions and energy
use. Thus the first research question is: Given the regulation on carbon emissions, what is the
nature of compliance of the supply chain given the cost of the various compliance options
133
(the cost of green technologies versus carbon emission trading)? The second research
question is: Given the regulation based on take back legislation that impose collection,
recovery and recycling targets for products at the end of their life, what is the nature of
managerial decisions related to the supply chain?
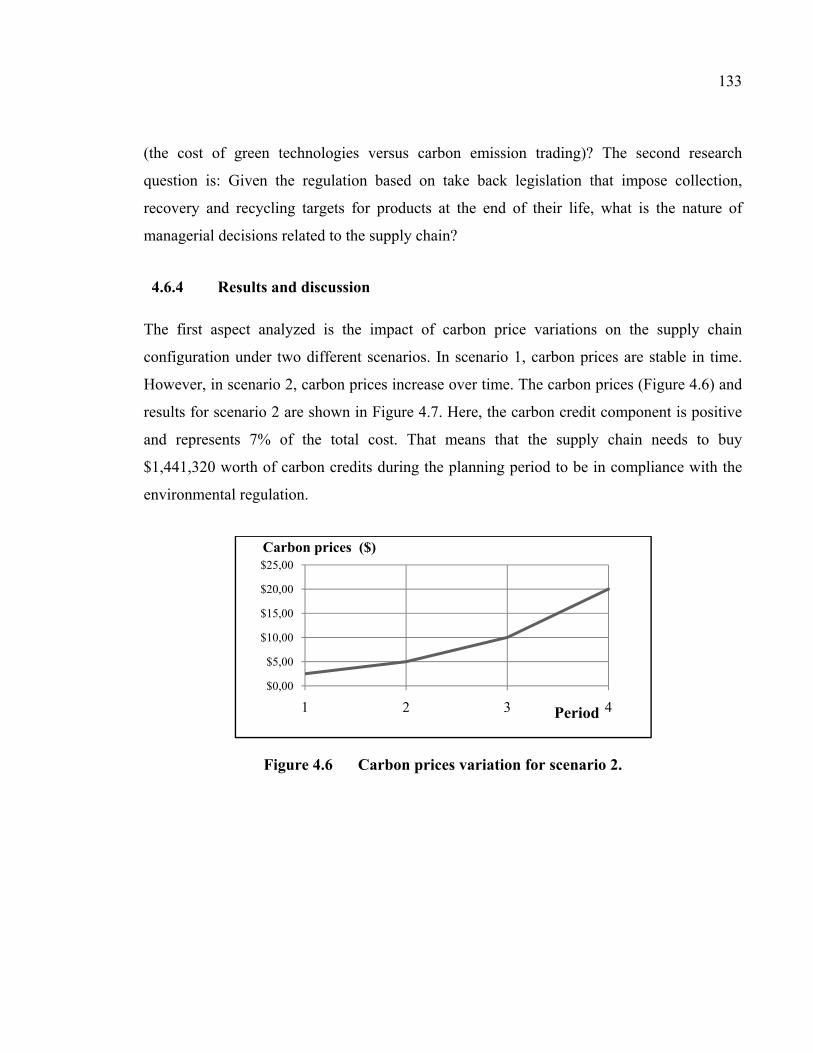
4.6.4 Results and discussion
The first aspect analyzed is the impact of carbon price variations on the supply chain
configuration under two different scenarios. In scenario 1, carbon prices are stable in time.
However, in scenario 2, carbon prices increase over time. The carbon prices (Figure 4.6) and
results for scenario 2 are shown in Figure 4.7. Here, the carbon credit component is positive
and represents 7% of the total cost. That means that the supply chain needs to buy
$1,441,320 worth of carbon credits during the planning period to be in compliance with the
environmental regulation.
Figure 4.6 Carbon prices variation for scenario 2.
$0,00
$5,00
$10,00
$15,00
$20,00
$25,00
1 2 3 4Period
Carbon prices ($)
134
Figure 4.7 Cost distribution for scenario 2.
Table 4.3 compares the results obtained for the two scenarios. First, we observe that the
emission cost for scenario 2 is higher but that the total logistic cost remains the same for both
scenarios. This is because the supply chain configuration (combination of sites, technology
used, distribution channels, etc.) is the same in both scenarios. Here carbon prices only
resulted in an increase in total cost with no consequence on the supply chain configuration
because the marginal cost for reducing one unit of GHG emissions is greater than the carbon
price from the market. Hence, the best decision is to buy credits form the carbon market to be
in compliance with the regulation limits on carbon emissions.
Table 4.3 Comparison of the two scenarios
Scenario 1 Scenario 2
Stable Increase
Total Logistics Cost $18 131 000 $18 131 000
Cost of Carbon credit $1 216 320 $1 441 320
Total Cost $19 347 300 $19 572 300
$18 131 000; 93%
$1 441 320; 7%
135
The second aspect analyzed is the impact of recycling strategies on supply chain planning
decisions. Here we assume that legislation forces the company to accept all recycled products
first. The supply chain is solved for different return rates (δ) of aluminum products. For the
first scenario, we consider that only 80% of products available in the market are recycled
(δ=80%). In the second scenario, secondary aluminum may come from other sources
including the direct customers and hence a return rate of 120% (δ =120%). Table 4.4
summarizes the results obtained in this case. It shows that an increase in recycling of the
products increases the total cost by 8.2% which translates into a 5.9% increase in logistics
cost and a 41.1% increase in carbon credit cost. In this case, the legislation on recycling has
a negative impact on carbon costs as it forces the supply chain to use technologies that have
higher GHG emissions.
Table 4.4 Cost for the different scenarios (Return rate variation)
The final aspect studied is the impact of limit on emissions (LCO2). We analyze two
scenarios where regulations in terms of carbon emissions becomes more stringent (LCO2 =
25 000 tCO2e versus LCO2 = 5 000 tCO2e). In this case, we suppose that carbon prices will
increase (Figure 4.6). Figure 4.8 shows that the quantity of recycled product increases as the
limit of emissions is more stringent because carbon emissions are reduced due to the use of
recycled product. When recycling is cheaper and with less GHG emissions, product recycling
mostly increases and the cost is minimized.
Scenario 1
(δ = 80%)
Scenario 2
(δ = 120%)
Total Cost $19 347 300 $20 929 800
Total Logistics Cost $18 131 000 $19 214 100
Carbon credit $1 216 320 $1 715 700
136
Figure 4.8 Recycled product under policy stringency.
However, in the last period, the quantity of recycled product decreases. Indeed, due to the
strategy of carbon management (Figure 4.9) that consists of buying carbon credits when
carbon prices are not expensive helps the company to reduce the cost of compliance to the
regulation. Moreover, recycled products are less. This is means that an environmental
regulation that impose limits on GHG emission might lead to decrease recycling activities if
recycling costs are not optimized.
Figure 4.9 Carbon management under policy stringency.
0
5000
10000
15000
20000
25000
30000
35000
1 2 3 4
Recycled products
Period
LCO2 = 25 000 tCO2eLCO2 = 5 000 tCO2e
$0
$50 000
$100 000
$150 000
$200 000
$250 000
$300 000
$350 000
$400 000
1 2 3 4
Carbon credits
Period
LCO2 = 25 000 tCO2e
LCO2 = 5 000 tCO2e
137
4.7 Conclusion
In this article, we present a generic mathematical model to assist decision makers in
designing sustainable supply chains over their entire life cycle. First, the model has the
potential to be a tool that facilitates the understanding of optimal supply chain strategies
under different environmental policies: recycling and GHG emissions reduction. The model
shows that the various environmental legislations must be strengthened and harmonized at a
global level in order to drive a meaningful long-term environmental strategy.
The explicit consideration of environmental costs within supply chain design is critical under
the emergence of emission trading schemes. The integration of Life Cycle Analysis
principles at the supply chain design phase maximizes the long-term sustainability. While
some specific values of model’s parameters would depend upon the application, the
methodology presented here is general enough and may be applied to other supply chain
studies to evaluate their performance in term of cost and carbon emissions.
Finally, although only the economic and environmental dimensions of sustainability are
considered in the mathematical model, the methodology can integrate the social dimension as
soon as measures of social sustainability are identified.
4.8 References
Barker, T. J. and Zabinsky, Z. B. (2008) Reverse logistics network design : a conceptual framework for decision making. International Journal of Sustainable Engineering, 1, 250-260.
Bayon, R., Hawn, A. and Hamilton, K. (2007) Voluntary carbon markets : an international business guide to what they are and how they work, London ; Sterling, Va., Earthscan.
De Benedetto, L. and Klemes, J. (2009) The Environmental Performance Strategy Map : an integrated LCA approach to support the strategic decision-making process. Journal of Cleaner Production, 17, 900-906.
138
Ferretti, I., Zanoni, S., Zavanella, L. and Diana, A. (2007) Greening the aluminium supply chain. International Journal of Production Economics, 108, 236-245.
Frota Neto, J. Q., Bloemhof-Ruwaard, J. M., van Nunen, J. A. E. E. and van Heck, E. (2008) Designing and evaluating sustainable logistics networks. International Journal of Production Economics, 111, 195-208.
Goetschalcks, M. and Fleischmann, B. (2008) Strategic Network Design. Supply Chain Management and Advanced Planning.
Hugo, A. and Pistikopoulos, E. N. (2005) Environmentally conscious long-range planning and design of supply chain networks. Journal of Cleaner Production : Recent advances in industrial process optimisation, 13, 1471-1491.
Jayaraman, V. (2006) Production planning for closed-loop supply chains with product recovery and reuse : An analytical approach. International Journal of Production Research, 44, 981-998.
Jayaraman, V., Guide, V. D. R., Jr. and Srivastava, R. (1999) Closed-loop logistics model for remanufacturing. Journal of the Operational Research Society, 50, 497-508.
Johnson, E. and Heinen, R. (2004) Carbon trading : time for industry involvement. Environment International, 30, 279-288.
Labatt, S. and White, R. R. (2007) Carbon finance : the financial implications of climate change, Hoboken, N.J., John Wiley & Sons.
Lieckens, K. and Vandaele, N. (2007) Reverse logistics network design with stochastic lead times. Computers and Operations Research, 34, 395-416.
Luo, Y., Zhou, M. and Caudill, R. J. (2001) An integrated E-supply chain model for agile and environmentally conscious manufacturing. IEEE/ASME Transactions on Mechatronics, 6, 377-386.
Nagurney, A., Liu, Z. and Woolley, T. (2006) Optimal endogenous carbon taxes for electric power supply chains with power plants. Mathematical and Computer Modelling, 44, 899-916.
Peace, J. and Juliani, T. (2009) The coming carbon market and its impact on the American economy. Policy and Society, 27, 305-316.
139
Pochampally, K. K., Nukala, S. and Gupta, S. M. (2009) Strategic planning models for reverse and closed-loop supply chains. Boca Raton, CRC Press.
Ramudhin, A., Chaabane, A., Kharoune, M. and Paquet, M. (2008) Carbon Market Sensitive Green Supply Chain Network Design. IEEE International Conference on Industrial Engineering and Engineering Management, 2008. IEEM 2008.
Ramudhin, A., Chaabane, A., Kharoune, M. and Paquet, M. (2010) Carbon market sensitive sustainable supply chain network design. International Journal of Management Science and Engineering Management 5 (1): 30-38.
Rice, G., Clift, R. and Burns, R. (1997) Comparison of currently available european LCA software. The International Journal of Life Cycle Assessment, 2, 53-59.
Sabri, E. H. and Beamon, B. M. (2000) A multi-objective approach to simultaneous strategic and operational planning in supply chain design. Omega, 28, 581-98.
Seuring, S. and Muller, M. (2008) Core issues in sustainable supply chain management - a Delphi study. Business Strategy and the Environment, 17, 455-466.
Sheu, J.-B. (2008) Green supply chain management, reverse logistics and nuclear power generation. Transportation Research Part E : Logistics and Transportation Review, 44, 19-46.
Sheu, J.-B., Chou, Y.-H. and Hu, C.-C. (2005) An integrated logistics operational model for green-supply chain management. Transportation Research Part E : Logistics and Transportation Review, 41, 287-313.
Srivastava, S. K. (2008) Network design for reverse logistics. Omega, 36, 535-548.
Subramanian, R., Talbot, F. B. and Gupta, S. (2008) An Approach to Integrating Environmental Considerations within Managerial Decision-Making. SSRN eLibrary http ://ssrn.com/paper=1004339.
CONCLUSION
The design of sustainable supply chains is very complex problem. The compliance with the
different objectives of sustainable development requires a radical change in the paradigm of
supply chain management that focuses not only on economic prosperity (minimize costs, or
maximize profits), but also includes the environmental and social dimensions. Although
strategic decision support systems and models for designing logistics networks are already
difficult to treat, environmental regulations and corporate social responsibilities require that
policymakers manage various compromises and identify the best decisions to achieve
sustainability in an effective manner. This context leads researchers and practitioners to
review these decision support models for the current design and reengineering of their supply
chains.
This research has proposed new and more realistic approaches to design and evaluate
sustainable supply chains with the establishment of an interaction with the fields of
environmental management and carbon finance. It is clear that an integrated approach that
considers a systemic view of the supply chain is more efficient for the decision making
process. It allows the integration of the different interactions between system entities and as
well as exchanges with the external environment which is often dynamic. This makes
managing sustainable supply chain extremely complex and the use of a hierarchical planning
approach seems to be more appropriate. At this level, strategic, tactical and operational
activities are executed independently. For example, after obtaining the configuration of the
supply chain, we can go in determining procurement, inventory, production, and distribution
management policies. Although this approach requires several stages of validation, it is better
than simultaneous planning approach that requires an amount of data often difficult to find
and adds a level of complexity to develop a solution.
141
In the first paper (Chapter 1), we presented a multi-criteria approach with two-phases for
managing supply chains. For the first stage, strategic decisions are treated and we decide on
the supply chain configuration to choose according to the criteria defined in advance by
decision makers. The analysis showed that depending on the company's corporate strategy,
the network to consider could change. Using the AHP method, the decision maker could
succeed in selecting the appropriate logistics network that supports strategic business
objectives. In a second phase, we move to a tactical level. The choice was directed towards
the identification of the inventory management policies, particularly the problem of safety
stock positioning of in the logistics network, a problem raised by the company of Pratt &
Whitney Canada. We proposed a mathematical model that takes into account demand
variability as well as supply, production and transportation delay. The analysis showed that
under demand uncertainty, the supply chain should invest in the establishment of safety
stocks in strategic locations that will minimize inventory costs and guarantee the expected
service level for customers. The environmental and social criteria are not included in the
selection process, but could easily be introduced through the AHP analysis. In addition, at the
first phase, it was assumed that some potential supply chain networks alternatives are
available, however the question is: how to get these networks?
To generate potential networks to be analyzed by the AHP method, we have proposed in the
second and the third articles (Step 1a of the proposed approach) different mathematical
models for the design and evaluation of sustainable supply chains. In addition to the
traditional economic function which is often considered in the design phase, the
environmental function has been introduced in an optimization problem with multiple
objectives. In order to guarantee a systemic approach for modelling the supply chain
management process, we considered two types of mechanisms available to achieve
sustainability objectives. The first category contains internal mechanisms including sourcing
and sub-contracting options, technological choices, production strategies, storage options,
transportation options, and reverse logistics activities. The second category includes the
different incentives and legislations constraints available to achieve the goals of
142
sustainability such as the greenhouse gases emissions mechanisms (carbon market) and the
take back legislation.
In the second article (CHAPTER 2), we were able to adequately model the design problem of
supply chains that are subject to constraints and environmental laws that impose price on
carbon emissions and where GHG emissions reduction is mandatory. We have shown that the
interaction with the carbon market, supply chains can meet the environmental constraints
more efficiently. The study shows that the proposed approach is very practical and provides a
decision support tool for managers seeking to identify the best strategic decisions to be
implemented to achieve sustainability objectives. The proposed model has some limitations
because it is assumed that Carbon prices are unchanging in time and reverse logistics
activities are not included.
To overcome the limitations of the second article, we have proposed in the third article
(CHAPTER 4) a generic mathematical modeling framework for the sustainable supply chain
network design problem. A multi-period multi-product mathematical programming model
with multiple objectives has been introduced. To ensure a more realistic representation of the
supply chain considered in this research, we applied the product life cycle assessment (LCA)
concept to calculate the inventory in terms of GHG emissions and the use of critical
resources for the company. To answer some research questions, realistic data and
environmental regulatory constraints were used. The analysis presented in this work show
that the model can be used as a decision tool to predict the impact of regulations that impose
limits on GHG emissions as well as constraints for product recovery at the end-of-life.
In conclusion, the overall contribution lies in the explicit integration of environmental factors
and more especially mechanisms available such as carbon market in the decision support tool
for supply chain management. In addition, different approaches of operational research
including multi-objective optimization methods (epsilon constraint, goal programming),
multi-attribute analysis (analytic hierarchy process), and dynamic programming have been
applied to provide a comprehensive design and evaluation of sustainable supply chains
solutions.
143
Previous research did not give justice to such an analysis, especially to properly consider the
interface between operations management and the environment. Regulations on emissions
(liquids, solids, gases) are increasing. The results obtained show that there is compromise
between economic and ecological criteria. But on the other hand, there are benefits at the
social level that are sometimes difficult to quantify and that can afford sustainable
development of the supply chain. This opens the debate about the integration of the social
dimension in the decision making of supply chain design.
The theoretical framework introduced in this research for mathematical modeling and design
problem of sustainable supply chains could be subject to several extensions. Indeed, it is
clear that in order to achieve sustainability goals (economic, environmental, and social), data
accuracy is paramount. In addition, the development of efficient solution approaches to solve
large multi-objective optimization problems is necessary. Finally, and from an application
perspective, it is important to explore several industrial sectors in order to be sure that the
proposed theoretical framework provides valuable insights to supply chains subject to or
anticipating environmental legislation.
APPENDIX I
TRADE-OFF MODEL FOR CARBON MARKET SENSITIVE SUSTAINABLE SUPPLY CHAIN NETWORK DESIGN
Amin Chaabane, Amar Ramudhin, Mourad Kharoune, Marc Paquet
Département de génie de la production automatisée, École de Technologie Supérieure,
For the MILP supply chain network design model, there are many constraints to be
considered. These constraints are of many kinds including the balance constraints of all
products, the capacity limit constraints, the minimum capacity occupation constraints, and
161
the demand satisfaction constraint. The BOM constraints are implicitly taken into account in
the balance constraints. These elements are discussed below.
For each raw material and for each manufactured product, the number of operational sites
should not exceed the maximum number allowed of suppliers and subcontractors :
)p p
ip pi S V
Y m p R M∈ ∪
≤ (∀ ∈ ∪ (A-2)
If a product (raw material) is assigned to a node (supplier), then the number of products
supplied by this supplier must not exceed its capacity for this product :
0 ( , )ip ip ip pX e Y p R i V− ≤ ∀ ∈ ∀ ∈ (A-3)
A product (semi-finished or final product) is manufactured in a node (subcontractor) only if
the product is assigned to this node :
0 ( , )ip
gip p
g G
Q MY p M i S∈
− ≤ ∀ ∈ ∀ ∈
(A-4)
Then the overall processing time used must not exceed the total available time at its assembly
line or manufacturing facility :
0 ( , )ip
i
g g g gip i i
p M
te Q f W i S g G∈
− ≤ ∀ ∈ ∀ ∈
(A-5)
There is usually a minimum amount of the aggregate capacity of a subcontractor that should
be consumed to justify the establishment of a contract. This consideration leads to constraints
(6) where the first term is the total time used at the assembly line or manufacturing facility of
subcontractor i in order to manufacture all the products. The second term of the left hand side
of the inequality is the minimum time to be used if subcontractor i is chosen :
0,ip
i p
g g g gip i i i
p M g G g G
te Q f W i Sρ∈ ∈ ∈
− ≥ ∀ ∈
(A-6)
To make a deal with a supplier, the minimum capacity can also be considered. Here, the
minimum capacity to be used is a percentage of the total weight of all maximum quantities of
raw materials that can be supplied by the supplier :
162
0 ( )i i
ip i ip ip R p R
X b A i Vρ∈ ∈
− ≥ ∀ ∈
(A-7)
The constraints of flow out of suppliers’ nodes are given by the equalities below :
0 ( , )ijp
sp
kip p
k Kj SP D
X F p P i V∈∈ ∪
− = ∀ ∈ ∀ ∈
(A-8)
The constraints of flow out of subcontractors’ nodes are given by the equalities below :
0 ( , )ijp
sp p
g kip p
g G k Kj SP D
Q F p P i S∈ ∈∈ ∪
− = ∀ ∈ ∀ ∈
(A-9)
For each product, the quantity that arrives to a node must equal the quantity needed to
manufacture next higher assemblies :
'
' ''
0 ( , )jip
sp pp
k g spp ip p
j S k K g Gp P
F Q p M i SPθ∈ ∈ ∈∈
− = ∀ ∈ ∀ ∈
(A-10)
The quantity of finished products shipped from all its subcontractors to the demand node
must equal the demand of that product :
( , )idp
p
kpd
i S k K
F d p C d D∈ ∈
= ∀ ∈ ∀ ∈
(A-11)
For each couple of nodes, there is a maximum number of transportation modes that can be
used.
( , )kij ij
k K
Z i V S j S Dτ∈
≤ ∀ ∈ ∪ ∀ ∈ ∪
(A-12)
The quantity of products shipped between two nodes is limited by the capacity of
transportation mode and the number of shipments. While the first set of constraints (A-13)
expresses the volume capacity and the second set (A-14) expresses the weight capacity :
0 ( , , )i i
k k kp ijp ij
p R M
F U i V S j S D k Kδ κ∈ ∪
− ≤ ∀ ∈ ∪ ∀ ∈ ∪ ∀ ∈
(A-13)
0 ( , , )i i
k k kp ijp ij
p R M
F U i V S j S D k Kπ ψ∈ ∪
− ≤ ∀ ∈ ∪ ∀ ∈ ∪ ∀ ∈
(A-14)
The following are logical constraints.
163
The number of shipments between two nodes for a given transportation mode is not nil only
if the transportation mode is actually used. This yields to the following constraints :
0 ( , , )k kij ijU MZ i V S j S D k K− ≤ ∀ ∈ ∪ ∀ ∈ ∪ ∀ ∈
, M is a big number (A-15)
A site is selected if it is open for one product at least :
0 ( , )ip i i iY A i S V p M R− ≤ ∀ ∈ ∪ ∀ ∈ ∪ (A-16)
The following are constraints on decision variables.
The transport variables, the quantities supplied and manufactured by sites are non negative :
0 ( , , , )ijp
k sp p pF p R M i V S j SP D k K≥ ∀ ∈ ∪ ∀ ∈ ∪ ∀ ∈ ∪ ∀ ∈
(A-17)
0 ( ( , ) )ip p pX p i R V M S≥ ∀ ∈ × ∪ × (A-18)
0 ( )gip pQ p M i S g G≥ ∀ ∈ ∀ ∈ ∀ ∈ (A-19)
Binary variables :
{ }0,1 , ( , )ip p pY p i R V M S∈ ∀ ∈ × ∪ × (A-20)
{ }0,1 ,iA i S V∈ ∀ ∈ ∪
(A-21)
{ }0,1 ,ipY p R M i S V∈ ∀ ∈ ∪ ∀ ∈ ∪
(A-22)
{ }0,1 ,giW i S g G∈ ∀ ∈ ∀ ∈
(A-23)
{ }0,1 ( , , )ij
kZ i V S j S D k K∈ ∀ ∈ ∪ ∀ ∈ ∪ ∀ ∈
(A-24)
The number of shipments must be integer :
integer ( , , , )ij
k sp p pU p P i V S j SP D k K ∀ ∈ ∀ ∈ ∪ ∀ ∈ ∪ ∀ ∈
(A-25)
An alternative objective function (F2) that can be considered is to minimize the total
emissions quantity of GHG (tCO2e) in order to evaluate the best potential reduction in term
of GHG emissions. A solution obtained with function F2 will have a higher total logistics
cost than if the cost is minimized (function F1).
164
2
GHGs Emissions from processGHGs Emissions from transportation
Min ( , )s
p p p pp
k k g gp ijp ip p ip
p M R i S V k K p M i S g Gj SP D
d i j F Qα π β π∈ ∪ ∈ ∪ ∈ ∈ ∈ ∈∈ ∪
= + F
(A-26)
In the case of minimizing F2, the following constraints should be added to the model.
No assignment of raw material to supplier if the raw material is not supplied by this supplier :
0 ( , )ip ip pY X P P i V− ≤ ∀ ∈ ∀ ∈ (A-27)
No assignment of manufactured product to plants if the product is not manufactured in this
plant
0 ( , )gip ip p
g G
Y Q p P i V∈
− ≤ ∀ ∈ ∀ ∈
(A-28)
A technology is acquired only if it used to produce at least one product :
0 ( , )i
g gi ip
p M
W Q i S g G∈
− ≤ ∀ ∈ ∀ ∈
(A-29)
A site is selected if it is open for one product at least :
0 ( )i i
i ipp M R
A Y i S V∈ ∪
− ≤ ∀ ∈ ∪
(A-30)
Illustrative example
We consider the case of a steel product manufacturer with high level of GHG emissions to
illustrate the model. Three freight transportation modes are considered : rail, air, and road.
The product has a multi-level BOM with two semi finished products that are manufactured
from four parts sourced from various external suppliers. At least two suppliers are competing
to supply each part. In this example, GHG emissions are limited to CO2 caused by production
and transportation activities. Emissions factors for the three freight transportation modes
considered in this example and detailed in Table 2. The Emissions factors (kα ) considered in
this example are based on the recent study published by Facanha and Horvath (2007).
165
Table A I-3 Freight transportation emissions factors (grams/ton-mile)
Transportation mode Type Payload (tons) CO2 (grams/ton-mile) Road Class 8b 12.5 187 Rail Intermodal rail 2,093 40 Air Boeing 747-400 70 1,385
For the production activities, we consider that the manufactured products are composed
basically of steel materials. The emission factor (g
ipβ ) is given by the IPCC Emission Factor
Data Base.
Experimentation
The model is first solved by CPLEX Interactive Optimizer 10.0 considering only objective
function F1. The optimal cost is 2 696 051 $. The total emission quantity relative to this
solution is 21 067 tCO2e. In addition, the model is solved while considering only objective
function F2. The optimal GHG emissions quantity is 19 988 tCO2e. The total cost relative to
this solution is 2 864 915 $. The cost breakdown for each scenario is illustrated in figures 5
and 6.
Figure A I-5 Cost breakdown for the optimal solution to F1.
Fixed Cost7%
Startup (Raw Materials)
1%Startup
(Manufactured Products)
3%
Technology Acquisation Cost
33%
Variable Cost (Rar Materials)
4%
Variable Cost (Manufactured
Products)21%
Transportation Cost28%
Emission cost3%
Cost Optimisation (Efficient SC)
166
Figure A I-6 Cost breakdown for the optimal solution to F2.
To observe the sensitivity of the total logistics cost to GHG emissions, constraint 31 is added
to the model and solved for different values of Emission
UB . This represents an upper bound on
tCO2e.
( ( ))
GHGs Emissions from transportation GHGs Emissions from process
( , )Emission
p p p p
k k g gp ijp ip p ip
p M R i S V j S Suc P D k K p M i S g G
d i j F Q UBα π β π∈ ∪ ∈ ∪ ∈ ∪ ∈ ∈ ∈ ∈
+ ≤
(A-31)
Figure 7 shows that the total logistics cost decreases with each increase in the upper bound of
CO2e emissions ( EmissionUB
) as the model seeks less costly solution alternatives which have
higher emission rates. It stabilizes after a while. The selection of low cost technologies is
observed (figure 5 and 6). From a managerial perspective, this means that those companies
might have to look for new sourcing, production or transportation alternatives and invest in
environmentally friendly technologies in order to reduce GHG emissions. In this example,
GHG emissions are more than the cap for the green and the efficient scenarios, and there is a
need to buy carbon credits form the market (emissions cost).
Fixed Cost7%
Startup (Raw Materials)
1%Startup
(Manufactured Products)
2%
Technology Acquisation Cost
38%Variable Cost
(Rar Materials)3%
Variable Cost (Manufactured
Products)16%
Transportation Cost30%
Emission cost3%
GHGs Optimisation (Green SC)
167
Figure A I-7 The Total Logistics Cost vs. CO2 Curve.
Figure also shows that the total logistics cost (F1) and carbon emissions (F2) are two
conflicting objectives. Thus, the application of a multi-objective optimization procedure
could help to determine the best trade-offs.
Goal programming solution
Background on Multi-objective optimization
A general MOO problem can formulated as follows :
[ ][ ]
1 2
1 2
Find : , ,....,
to minimize: F( )= ( ), ( ),...., ( )
subject to :
( ) 0; 1, 2,....,
( ) 0; 1,2,....,
k
j
l
Tx x xn
TF F F
g j m
h l e
=
≤ ∀ =
= ∀ =
x
x x x x
x
x
(A-32)
2 680 000 $
2 700 000 $
2 720 000 $
2 740 000 $
2 760 000 $
2 780 000 $
2 800 000 $
2 820 000 $
2 840 000 $
2 860 000 $
2 880 000 $
19800 20000 20200 20400 20600 20800 21000 21200
Tot
al O
per
atio
nal
Cos
t ($
)
GHGs Emissions limit (UB emission)
The total cost vs. GHGs emissions curve
168
Where n is the number of design variables, k is the number of objective functions, m is the
number of inequality constraints. nR∈x is a vector of scalar design variables (also called
decision variables) ix . kF( ) R∈x is a vector of scalar objective functions niF ( ): R R→x
which are also called objectives, criteria, value functions, payoff functions, or cost functions.
*ix is the point that minimizes the scalar objective iF ( )x , and therefore, *
iF ( )ix is the
minimum value of the objective function iF ( )x . The feasible design space (often called the
constraint set) X is defined as the
set { }| ( ) 0; 1,2,...., and ( ) 0; 1,2,....,j lg j m h l e≤ ∀ = = ∀ =x x x . The feasible criterion space Z
(also called the feasible cost space or the attainable set) is defined as the set { }F( )| ∈x x X .
Whereas the design space is defined in terms of the design variables, the criterion space is
defined in terms of the objective functions (the criteria). Each ∈x X may be represented in kR by a point with coordinates 1 2( ), ( ),...., ( )kF F Fx x x . Thus, the set of points defined by Z is
the image of X in the criterion space. Feasible objective vectors, { }F( ) |X S∈X are denoted
by Y, so F : X Z, X is mapped by F onto Z. kZ R∈ is usually referred to as the attribute
space, where Z is the boundary of Z. * * *1 2, , ...., kF F F will be used to denote the individual
minima of each respective objective function, and the utopian solution is defined as
( )* * * *1 2, ,....,
T
kF F F F= . As F* simultaneously minimizes all objectives, it is an ideal solution
that is rarely feasible.
*1F
*2F
Z∂
Figure A I-8 Ideal solution and non-dominated solution in a MOO.
169
The goal programming (GP) is the most common multi-objective optimization method. This
probably is a consequence of the age of the method and of the intuitive nature of the
fundamental formulation. GP is a vector optimization approach. Each objective function is
treated independently. The goals jb are specified for each objective function jF ( )x . Then, a
function of the total deviation 1
k
jjd
= is minimized, where jd is the deviation from the goal
jb for the jth objective. To model the absolute values, jd is split into positive and negative
parts such that j jjd d d+ −= − with 0
jd + ≥ , 0
jd − ≥ , and 0
j jd d+ − = . Consequently,
j jjd d d+ −= − .
jd+ and
jd− represent underachievement and overachievement, respectively, where
achievement implies that a goal has been reached. A common, general formulation is given
as follows (Cohon, 1978) :
[ ]1 2
1k
+ - p
j=1
+ -
+ -
+ -
Find : , ,...., ,
to minimize: ( + ) ; 1
subject to :
( ) - ; 1,2,...,
; 0; 1, 2,...,
0; 1,2,...,
( ) 0; 1,2,...,
( ) 0; 1,2,....,
j j
j j
j j
j j
n
p
j j
j
l
Tx x x
d d p
F d d b j k
d d j k
d d j k
g j m
h l e
=
≥
+ = ∀ =
≥ ∀ =
= ∀ =
≤ ∀ =
= ∀ =
+ -x d ,d
x
x
x
(A-33)
p is often equal to one. And in the absence of any other information, we can consider that*; 1,2,...,j jb F j k= ∀ = .
Goal programming based optimization
The goal programming (GP) was used for the previous example in order to find the trade-offs
between the total logistics cost and GHG emissions. Table 3 summarizes the various
solutions.
170
Table A I-4 Goal Programming solution
Optimization scenarios Total Operational Cost tCO2e
[1](Arntzen et al., 1995), [2] (Li and O'Brien, 1996), [3] (Giannikos, 1998), [4] (Min and Melachrinoudis, 1999), [5] (Sabri and Beamon, 2000), [6] (Luo et al., 2001), [7] (Nozick and Turnquist, 2001), [8] (Chen and Lee, 2004; Chen et al., 2003), [9] (G Guillen, 2005; G. Guillen et al., 2005)[10] (Sheu et al., 2005).
Minimize transport pollution (CO, CO2, Nox, VOCs) * * *
Promotion of recycling / Waste elimination * *
Conservation of energy *
Minimize impact on environment from the entire SC * * *
Multi-objective techniques and methods
Method 1 : no preference articulation * *
Method 2 : priori articulation of preference
Method 3 : progressive articulation of preference *
Method 4 : posteriori articulation of preference * * *
173
References
Altiparmak, F., Gen, M., Lin, L., & Paksoy, T. (2006). A genetic algorithm approach for multi-objective optimization of supply chain networks. Computational Intelligence and Information Technology : Applications to Industrial Engineering, Computers and Industrial Engineering, 51(1), 196-215.
Arntzen, B. C., Brown, G. G., Harrison, T. P., & Trafton, L. L. (1995). Global supply chain management at Digital Equipment Corporation. Interfaces, 25(1), 69-93.
Chen, C.-L., & Lee, W.-C. (2004). Multi-objective optimization of multi-echelon supply chain networks with uncertain product demands and prices. Computers and Chemical Engineering, 28(6-7), 1131-1144.
Chen, C.-L., Wang, B.-W., & Lee, W.-C. (2003). Multiobjective optimization for a multienterprise supply chain network. Industrial and Engineering Chemistry Research, 42(9), 1879-1889.
Cohon, J. L. (1978). Multiobjective programming and planning. New York : Academic Press.
Dotoli, M., Fanti, M. P., Meloni, C., & Zhou, M. C. (2005). A multi-level approach for network design of integrated supply chains. International Journal of Production Research, 43(20), 4267-4287.
Dotoli, M., Fanti, M. P., Meloni, C., & Zhou, M. C. (2006). Design and optimization of integrated e-supply chain for agile and environmentally conscious manufacturing. IEEE Transactions on Systems, Man, and Cybernetics Part A :Systems and Humans, 36(1), 62-75.
Facanha, C., & Horvath, A. (2007). Evaluation of Life-Cycle Air Emission Factors of Freight Transportation. Environmental Science & Technology, 41(20), 7138-7144.
Ferretti, I., Zanoni, S., Zavanella, L., & Diana, A. (2007). Greening the aluminium supply chain. International Journal of Production Economics, 108(1-2), 236-245.
Frota Neto, J. Q., Bloemhof-Ruwaard, J. M., van Nunen, J. A. E. E., & van Heck, E. (2008). Designing and evaluating sustainable logistics networks. International Journal of Production Economics, 111(2), 195-208.
Giannikos, I. (1998). A multiobjective programming model for locating treatment sites and routing hazardous wastes, Puerto de La Cruz, Spain.
174
Guillen, G. (2005a). Optimal offer proposal policy in an integrated supply chain management environment. Industrial & engineering chemistry research, 44(19), 7405-7419.
Guillen, G., Mele, F. D., Bagajewicz, M. J., Espuna, A., & Puigjaner, L. (2005b). Multiobjective supply chain design under uncertainty. Chemical Engineering Science, 60(6), 1535-1553.
Hugo, A., & Pistikopoulos, E. N. (2005). Environmentally conscious long-range planning and design of supply chain networks. Journal of Cleaner Production : Recent advances in industrial process optimisation, 13(15), 1471-1491.
Jayaraman, V., Guide, V. D. R., Jr., & Srivastava, R. (1999). Closed-loop logistics model for remanufacturing. Journal of the Operational Research Society, 50(5), 497-508.
Karan, C., & Philippe, A. (2008). State and trends of the carbon market 2008. Washington, D.C. : The World Banko. Document Number)
Labatt, S., & White, R. R. (2007). Carbon finance : the financial implications of climate change. Hoboken, N.J. : John Wiley & Sons.
Li, D., & O'Brien, C. (1996). Integrated decision modelling of supply chain efficiency. In Proceedings of the 1996 10th International Symposium on Inventory, Aug 1. Budapest, Hungary.
Lu, L. Y. Y., Wu, C. H., & Kuo, T.-C. (2007). Environmental principles applicable to green supplier evaluation by using multi-objective decision analysis. Sustainable Design and Manufacture, International Journal of Production Research, 45(18-19), 4317-4331.
Luo, Y., Zhou, M., & Caudill, R. J. (2001). An integrated E-supply chain model for agile and environmentally conscious manufacturing. IEEE/ASME Transactions on Mechatronics, 6(4), 377-386.
Min, H., & Melachrinoudis, E. (1999). The relocation of a hybrid manufacturing/distribution facility from supply chain perspectives : a case study. Omega, 27(1), 75-85.
Nozick, L. K., & Turnquist, M. A. (2001). Inventory, transportation, service quality and the location of distribution centers. European Journal of Operational Research, 129(2), 362-371.
Pokharel, S. (2008). A two objective model for decision making in a supply chain. International Journal of Production Economics, 111(2), 378-388.
175
Sabri, E. H., & Beamon, B. M. (2000). A multi-objective approach to simultaneous strategic and operational planning in supply chain design. Omega, 28(5), 581-598.
Seuring, S., & Muller, M. (2008). From a literature review to a conceptual framework for sustainable supply chain management. Journal of Cleaner Production, 16(15), 1699-1710.
Shen, Z.-J. M., & Daskin, M. S. (2005). Trade-offs between customer service and cost in integrated supply chain design. Manufacturing and Service Operations Management, 7(3), 188-207.
Sheu, J.-B., Chou, Y.-H., & Hu, C.-C. (2005). An integrated logistics operational model for green-supply chain management. Transportation Research Part E : Logistics and Transportation Review, 41(4), 287-313.
Srivastava, S. K. (2007). Green supply-chain management : A state-of-the-art literature review. International Journal of Management Reviews, 9(1), 53-80.
BIBLIOGRAPHY
Albino, Vito, et Silvana Kühtz. 2004. « Enterprise input-output model for local sustainable development--the case of a tiles manufacturer in Italy ». Resources, Conservation and Recycling, vol. 41, no 3, p. 165-176.
Andersen, Mette, et Tage Skjoett-Larsen. 2009. « Corporate social responsibility in global
supply chains ». Supply Chain Management : An International Journal, vol. 14, p. 75-86.
Atalay Atasu, Luk N. Van Wassenhove et Miklos Sarvary. 2009. « Efficient Take-Back
Legislation ». Production and Operations Management, vol. 18, no 3, p. 243-258. Atasu, Atalay, Miklos Sarvary et Luk N. Van Wassenhove. 2008. « Remanufacturing as a
Marketing Strategy ». Management Science, vol. 54, no 10 (October 1, 2008), p. 1731-1746.
Badurdeen, F., Iyengar, D., Goldsby, T.J., Jawahir, I.S., Metta, H., and Gupta, S., 2008, A
6R-based Approach to Next Generation Sustainable Supply Chain Management (submitted) to European Journal of Operational research, November, 2008.
Baranzini, Andrea, José Goldemberg et Stefan Speck. 2000. « A future for carbon taxes ».
Ecological Economics, vol. 32, no 3, p. 395-412. Barker, Theresa J., et Zelda B. Zabinsky. 2008. « Reverse logistics network design : a
conceptual framework for decision making ». International Journal of Sustainable Engineering, vol. 1, no 4, p. 250-260.
Bayon, Ricardo, Amanda Hawn et Katherine Hamilton. 2007. Voluntary carbon markets :
an international business guide to what they are and how they work. London ; Sterling, Va. : Earthscan, xx, 164 p. p. <http ://www.loc.gov/catdir/toc/ecip0620/2006029027.html>.
Beamon, B. M. 1999. « Measuring supply chain performance ». International Journal of
Operations & Production Management, vol. 19, p. 275. Beamon, B. M., et C. Fernandes. 2004. « Supply-chain network configuration for product
recovery ». Production Planning and Control, vol. 15, no 3, p. 270-81.
177
Beynon, Malcolm J. 2008. « Constellation graphs and the role of rank position criteria value frontiers in PROMETHEE analysis ». International Journal of Operational Research, vol. 3, no 1/2, p. 201-218.
Blackhurst, Jennifer, Tong Wu et Peter O'Grady. 2005. « PCDM : a decision support
modeling methodology for supply chain, product and process design decisions ». Journal of Operations Management, vol. 23, no 3-4, p. 325-343.
Brentrup, F., J. Küsters, H. Kuhlmann et J. Lammel. 2001. « Application of the Life Cycle
Assessment methodology to agricultural production : an example of sugar beet production with different forms of nitrogen fertilisers ». European Journal of Agronomy, vol. 14, no 3, p. 221-233.
Burgess, K. 2006. « Supply chain management : a structured literature review and
implications for future research ». International Journal of Operations & Production Management, vol. 26, no 7, p. 703.
Capar, Ismail, Fusun Ulengin et Arnold Reisman. 2004. A Taxonomy for Supply Chain
Management Literature. SSRN. <http ://ssrn.com/paper=531902>. Carter, C. R. 2008. « A framework of sustainable supply chain management : moving toward
new theory ». International Journal of Physical Distribution & Logistics Management, vol. 38, no 5, p. 360.
Chen, Cheng-Liang, et Wen-Cheng Lee. 2004. « Multi-objective optimization of multi-
echelon supply chain networks with uncertain product demands and prices ». Computers and Chemical Engineering, vol. 28, no 6-7, p. 1131-1144.
Chen, Cheng-Liang, Bin-Wei Wang et Wen-Cheng Lee. 2003. « Multiobjective optimization
for a multienterprise supply chain network ». Industrial and Engineering Chemistry Research, vol. 42, no 9, p. 1879-1889.
Chopra, Sunil, et Peter Meindl. 2004. Supply chain management : strategy, planning, and
operation, 2nd. Upper Saddle River, N.J. : Prentice Hall, xvii, 567 p. <http ://www.loc.gov/catdir/toc/fy041/2003004867.html>.
Cohon, Jared L. 1978. Multiobjective programming and planning. Coll. « Mathematics in
science and engineering v. 140 ». New York : Academic Press, xiv, 333 p. Conrad, Klaus, et Robert E. Kohn. 1996. « The US market for SO2 permits : Policy
implications of the low price and trading volume ». Energy Policy, vol. 24, no 12, p. 1051-1059.
178
Contreras, Ana M., Elena Rosa, Maylier Pérez, Herman Van Langenhove et Jo Dewulf. 2009. « Comparative Life Cycle Assessment of four alternatives for using by-products of cane sugar production ». Journal of Cleaner Production, vol. 17, no 8, p. 772-779.
Cooper, M. C. 1997. « Supply chain management : more than a new name for logistics ».
International Journal of Logistics Management, vol. 8, p. 1. Craig, Shepherd. , et Günter. Hannes. 2006. « Measuring supply chain performance : current
research and future directions ». International Journal of Productivity and Performance Management, vol. 55, no 3, p. 242-258.
Croom, Simon, Pietro Romano et Mihalis Giannakis. 2000. « Supply chain management : an
analytical framework for critical literature review ». European Journal of Purchasing & Supply Management, vol. 6, no 1 (2000/3), p. 67-83.
De Benedetto, Luca, et Jirí Klemes. 2009. « The Environmental Performance Strategy Map :
an integrated LCA approach to support the strategic decision-making process ». Journal of Cleaner Production, vol. 17, no 10, p. 900-906.
De Brito, Marisa P., et Rommert Dekker. 2003. A Framework for Reverse Logistics. SSRN.
chains. Berlin ; New York : Springer, viii, 436 p. p. Dotoli, M. 2005. « A multi-level approach for network design of integrated supply chains ».
International journal of production research, vol. 43, no 20, p. 4267-4287. Dotoli, M., M. P. Fanti, C. Meloni et M. C. Zhou. 2005. « A multi-level approach for
network design of integrated supply chains ». International Journal of Production Research, vol. 43, no 20 (Oct 15), p. 4267-4287.
Dotoli, M., M.P. Fanti, C. Meloni et M.C. Zhou. 2006. « Design and optimization of
integrated e-supply chain for agile and environmentally conscious manufacturing ». IEEE Transactions on Systems, Man, and Cybernetics Part A :Systems and Humans, vol. 36, no 1 (2006///), p. 62-75.
Electronics Product Stewardship Canada (EPSC). 2009. « http ://www.epsc.ca/ ». Elkington, John. 1998. Cannibals with forks : the triple bottom line of 21st century business.
Gabriola Island, BC ; Stony Creek, CT : New Society Publishers, xvi, 407 p. p. Expert Choice Inc. 2000. Expert Choice Software 2000. http ://www.expertchoice.com/.
<http ://www.expertchoice.com/>.
179
Facanha, C., et A. Horvath. 2007. « Evaluation of Life-Cycle Air Emission Factors of Freight
Transportation ». Environmental Science & Technology, vol. 41, no 20, p. 7138-7144. Faure, Michael, Joyeeta Gupta et A. Nentjes. 2003. Climate change and the Kyoto protocol :
the role of institutions and instruments to control global change. Cheltenham, UK ; Northampton, MA : Edward Elgar Pub., xi, 361 p. p.
Ferretti, I., S. Zanoni, L. Zavanella et A. Diana. 2007. « Greening the aluminium supply
chain ». International Journal of Production Economics, vol. 108, no 1-2 (2007/7), p. 236-245.
Fleischmann, Bernhard, Herbert Meyr, A. G. de Kok et S. C. Graves. 2003. « Planning
Hierarchy, Modeling and Advanced Planning Systems ». In Handbooks in Operations Research and Management Science. Vol. Volume 11, p. 455-523. Elsevier. <http ://www.sciencedirect.com/science/article/B7P6G-4FPHYXC-B/2/1ca0554dfa22d2f6697c90464888b608>.
Fleischmann, M. 2000. « A characterisation of logistics networks for product recovery ».
Omega : The International Journal of Management Science, vol. 28, no 6, p. 653. Fleischmann, Moritz, Jacqueline M. Bloemhof-Ruwaard, Rommert Dekker, Erwin van der
Laan, Jo A. E. E. van Nunen et Luk N. Van Wassenhove. 1997. « Quantitative models for reverse logistics : A review ». European Journal of Operational Research, vol. 103, no 1, p. 1-17.
Fleischmann, Mortiz, Hans Ronald Krikke, Rommert Dekker et Simme Douwe P. Flapper.
2000. « A characterisation of logistics networks for product recovery ». Omega, vol. 28, no 6, p. 653-666.
Foran, Barney, Manfred Lenzen, Christopher Dey et Marcela Bilek. 2005. « Integrating
sustainable chain management with triple bottom line accounting ». Ecological Economics, vol. 52, no 2, p. 143-157.
Frota Neto, J. Quariguasi, J. M. Bloemhof-Ruwaard, J. A. E. E. van Nunen et E. van Heck.
2008. « Designing and evaluating sustainable logistics networks ». International Journal of Production Economics, vol. 111, no 2, p. 195-208.
Giannikos, I. 1998. « A multiobjective programming model for locating treatment sites and
routing hazardous wastes ». In, 2. Vol. 104, p. 333-42. Coll. « Eur. J. Oper. Res. (Netherlands) ». Puerto de La Cruz, Spain : Elsevier. <http ://dx.doi.org/10.1016/S0377-2217(97)00188-4>.
180
Goetschalcks, Marc, et Bernhard Fleischmann. 2008. « Strategic Network Design ». In Supply Chain Management and Advanced Planning. p. 117-132. <http ://dx.doi.org/10.1007/978-3-540-74512-9_7>.
Graves, Stephen C, et Sean P Willems. 2000. « Optimizing Strategic Safety Stock Placement
in Supply Chains ». Manufacturing and Service Operations Management, vol. 2, no 1, p. 68-83.
Guide, V. Daniel R., Jr. 2000. « Production planning and control for remanufacturing :
Industry practice and research needs ». Journal of Operations Management, vol. 18, no 4, p. 467-483.
Guide, V. Daniel R., Jr., et Luk N. Van Wassenhove. 2009. « OR FORUM--The Evolution of
Closed-Loop Supply Chain Research ». OPERATIONS RESEARCH, vol. 57, no 1 (January 1, 2009), p. 10-18.
Guillen-Gosalbez, Gonzalo, et Ignacio E. Grossmann. 2009. « Optimal design and planning
of sustainable chemical supply chains under uncertainty ». AIChE Journal, vol. 55, no 1, p. 99-121.
Guillen, G., F.D. Mele, M.J. Bagajewicz, A. Espuna et L. Puigjaner. 2005. « Multiobjective
supply chain design under uncertainty ». Chemical Engineering Science, vol. 60, no 6, p. 1535-1553.
Gunasekaran, A., C. Patel et Ronald E. McGaughey. 2004. « A framework for supply chain
performance measurement ». International Journal of Production Economics, vol. 87, no 3, p. 333-347.
Gungor, Askiner, et Surendra M. Gupta. 1999. « Issues in environmentally conscious
manufacturing and product recovery : a survey ». Computers & Industrial Engineering, vol. 36, no 4, p. 811-853.
Hagelaar, Geoffrey J. L. F., et Jack G. A. J. van der Vorst. 2001. « Environmental supply
chain management : using life cycle assessment to structure supply chains ». The International Food and Agribusiness Management Review, vol. 4, no 4, p. 399-412.
Hokey Min, et William P. Galle. 1997. « Green Purchasing Strategies : Trends and
Implications ». The Journal of Supply Chain Management, vol. 33, no 3, p. 10-17. Hugo, A., et E.N. Pistikopoulos. 2005. « Environmentally conscious long-range planning and
design of supply chain networks ». Journal of Cleaner Production : Recent advances in industrial process optimisation, vol. 13, no 15, p. 1471-1491.
181
Hugo, Andre, Paul Rutter, Stratos Pistikopoulos, Angelo Amorelli et Giorgio Zoia. 2005. « Hydrogen infrastructure strategic planning using multi-objective optimization ». International Journal of Hydrogen Energy, vol. 30, no 15, p. 1523-1534.
Humair, Salal, et Sean P. Willems. 2006. « Optimizing strategic safety stock placement in
supply chains with clusters of commonality ». Operations Research, vol. 54, no 4, p. 725-742.
Humphreys, P. K., Y. K. Wong et F. T. S. Chan. 2003. « Integrating environmental criteria
into the supplier selection process ». Journal of Materials Processing Technology, vol. 138, no 1-3, p. 349-356.
Hutchins, et M. J. Hutchins. 2008. « An exploration of measures of social sustainability and
their application to supply chain decisions ». Journal of Cleaner Production, vol. 16, no 15, p. 1688.
Hutchins, Margot J., et John W. Sutherland. 2008. « An exploration of measures of social
sustainability and their application to supply chain decisions ». Journal of Cleaner Production, vol. 16, no 15, p. 1688-1698.
Inderfurth, Karl, et Stefan Minner. 1998. « Safety stocks in multi-stage inventory systems
under different service measures ». European Journal of Operational Research, vol. 106, no 1, p. 57-73.
Intergovernmental Panel on Climate Change. 2007. Fourth Assessment Report, Climate
Change 2007, Synthesis Report ISO, Environmental management – life cycle assessment – principles and framework. 1997.
Geneva, Switzerland [ISO 14040] : International Organisation for Standardisation,. Jayaraman, V., V. D. R. Guide, Jr. et R. Srivastava. 1999a. « Closed-loop logistics model for
remanufacturing ». Journal of the Operational Research Society, vol. 50, no 5, p. 497-508.
Jayaraman, V., V. D. R. Guide et R. Srivastava. 1999b. « A closed-loop logistics model for
remanufacturing ». J Oper Res Soc, vol. 50, no 5, p. 497-508. Jayaraman, V., et H. Pirkul. 2001. « Planning and coordination of production and distribution
facilities for multiple commodities ». European Journal of Operational Research, vol. 133, no 2 (1 Sept. 2001), p. 394-408.
Jayaraman, V., et A. Ross. 2003. « A simulated annealing methodology to distribution
network design and management ». European Journal of Operational Research, vol. 144, no 3 (2003/02/01), p. 629-45.
182
Jayaraman, Vaidyanathan. 2006. « Production planning for closed-loop supply chains with product recovery and reuse : An analytical approach ». International Journal of Production Research, vol. 44, no 5, p. 981-998.
Johnson, Eric, et Russell Heinen. 2004. « Carbon trading : time for industry involvement ».
Environment International, vol. 30, no 2, p. 279-288. Karan, Capoor, et Ambrosi Philippe. 2008. State and trends of the carbon market 2008.
Washington, D.C. : The World Bank. Karpak, Birsen, Erdogan Kumcu et Rammohan R. Kasuganti. 2001. « Purchasing materials
in the supply chain : managing a multi-objective task ». European Journal of Purchasing & Supply Management, vol. 7, no 3 (2001/9), p. 209-216.
Keeney, Ralph L., et Howard Raiffa. 1976. Decisions with multiple objectives preferences
and value tradeoffs. Coll. « Wiley series in probability and mathematical statistics ». New York : J. Wiley, 569 pages p.
Krikke, H., J. Bloemhof-Ruwaard et L. N. Van Wassenhove. 2003. « Concurrent product and
closed-loop supply chain design with an application to refrigerators ». International Journal of Production Research, vol. 41, no 16, p. 3689 - 3719.
Labatt, Sonia, et Rodney R. White. 2007. Carbon finance : the financial implications of
climate change. Coll. « Wiley finance series. ». Hoboken, N.J. : John Wiley & Sons, xx, 268 p. p. <http ://www.loc.gov/catdir/toc/ecip072/2006033468.html>.
Lam, Hon Loong, Petar Varbanov et Jirí Klemes. 2009 « Minimising carbon footprint of
regional biomass supply chains ». Resources, Conservation and Recycling, vol. In Press, Corrected Proof.
Notes in Economics and Mathematical Systems, », 586. Berlin, Heidelberg : Springer-Verlag Berlin Heidelberg.
Lee, Hau L., et Corey Billington. 1993. « Material management in decentralized supply
chains ». Operations Research, vol. 41, no 5, p. 835-847. Lieckens, K., et N. Vandaele. 2007a. « Reverse logistics network design with stochastic lead
times ». Computers & Operations Research, vol. 34, no 2, p. 395-416. Lieckens, Kris, et Nico Vandaele. 2007b. « Reverse logistics network design with stochastic
lead times ». Computers and Operations Research, vol. 34, no 2, p. 395-416. Lippmann, S. 1999. « Supply Chain Environmental Management : Elements for Success ».
Corporate Environmental Strategy, vol. 6, p. 175-182.
183
Louwers, Dirk, Bert J. Kip, Edo Peters, Frans Souren et Simme Douwe P. Flapper. 1999. « A
facility location allocation model for reusing carpet materials ». Computers & Industrial Engineering, vol. 36, no 4, p. 855-869.
Lu, Louis Y.Y., C.H. Wu et T.-C. Kuo. 2007. « Environmental principles applicable to green
supplier evaluation by using multi-objective decision analysis ». Sustainable Design and Manufacture, International Journal of Production Research, vol. 45, no 18-19, p. 4317-4331.
Luo, Y., P. Wirojanagud et R.J. Caudill. 2001a. « Comparison of major environmental
performance metrics and their application to typical electronic products ». In 2001 IEEE International Symposium on Electronics and the Environment, May 7-9 2001. p. 94-99. Coll. « IEEE International Symposium on Electronics and the Environment ». Denver, CA : Institute of Electrical and Electronics Engineers Inc.
Luo, Yanchun, MengChu Zhou et Reggie J. Caudill. 2001b. « An integrated E-supply chain
model for agile and environmentally conscious manufacturing ». IEEE/ASME Transactions on Mechatronics, vol. 6, no 4, p. 377-386.
MacLean, Heather L., et Lester B. Lave. 2003. « Evaluating automobile fuel/propulsion
system technologies ». Progress in Energy and Combustion Science, vol. 29, no 1, p. 1-69.
Magnanti, Thomas L., Zuo-Jun Max Shen, Jia Shu, David Simchi-Levi et Chung-Piaw Teo.
2006. « Inventory placement in acyclic supply chain networks ». Operations Research Letters, vol. 34, no 2, p. 228-238.
Maloni, Michael, et Michael Brown. 2006. « Corporate Social Responsibility in the Supply
Chain : An Application in the Food Industry ». Journal of Business Ethics, vol. 68, no 1, p. 35-52.
Martel, Alain. 2005. « The design of production-distribution networks : A mathematical
programming approach ». In Supply Chain Optimization, J. Geunes and P.M. Pardalos. Kluwer Academic Publishers,.
Maxwell, D., et R. van der Vorst. 2003. « Developing sustainable products and services ».
Journal of Cleaner Production, vol. 11, no 8, p. 883-895. Meixell, Mary J., et Vidyaranya B. Gargeya. 2005. « Global supply chain design : A
literature review and critique ». Transportation Research Part E : Logistics and Transportation Review, vol. 41, no 6, p. 531-550.
Mellor, Warren, Elizabeth Wright, Roland Clift, Adisa Azapagic et Gary Stevens. 2002. « A
mathematical model and decision-support framework for material recovery, recycling
184
and cascaded use ». Chemical Engineering Science, vol. 57, no 22-23 (2002/12//), p. 4697-4713.
Mentzer, J. T. 2001. « Defining supply chain management ». Journal of Business Logistics,
vol. 22, no 2, p. 1. Metzer, John T., W. Dewitt, Keebler J.S., Min S., Nix N.W., Smith C.D. et Zacharia Z.G.
2001. « Defining Supply Chain Management ». Journal of Business Logistics, vol. 22, no 2, p. 1-25.
Meyr, Herbert, Michael Wagner et Jens Rohde. 2005. « Structure of Advanced Planning
Systems ». In Supply Chain Management and Advanced Planning. p. 109-115. <http ://dx.doi.org/10.1007/3-540-24814-5_6>.
Michaelowa, Axel, et Frank Jotzo. 2005. « Transaction costs, institutional rigidities and the
size of the clean development mechanism ». Energy Policy, vol. 33, no 4, p. 511-523. Miller, Tan C. 2001. Hierarchical operations and supply chain planning. London ; New
York : Springer, xi, 262 p. p. Min, Hokey, et Emanuel Melachrinoudis. 1999. « The relocation of a hybrid
manufacturing/distribution facility from supply chain perspectives : a case study ». Omega, vol. 27, no 1 (1999/2), p. 75-85.
Minner, S. 1997. « Dynamic programming algorithms for multi-stage safety stock
optimization ». OR Spektrum, vol. 19, no 4 (1997//), p. 261-72. Nagurney, Anna. 2000. Sustainable transportation networks. Cheltenham, UK ;
Northampton, MA : Edward Elgar, xvi, 286 p. p. Nagurney, Anna, Zugang Liu et Trisha Woolley. 2006. « Optimal endogenous carbon taxes
for electric power supply chains with power plants ». Mathematical and Computer Modelling, vol. 44, no 9-10, p. 899-916.
Nagurney, Anna, Zugang Liu et Trisha Woolley. 2007. « Sustainable Supply Chain and
Transportation Networks ». International Journal of Sustainable Transportation, vol. 1, no 1, p. 29 - 51.
New S.J, et P. Payne. 1995. « Research framework in logistics : three models,seven dinners
and a survey ». International Journal of Physical Distribution and logistics management, vol. 25, no 10.
Ottman, Jacquelyn A., et NetLibrary Inc. 1998. Green marketing [ressource électronique] :
opportunity for innovation, 2nd. Lincolnwood, Ill. : NTC Business Books, xviii, 270
185
p. p. <http ://www.netLibrary.com/urlapi.asp?action=summary&v=1&bookid=13312>.
Ozdamar, Linet, et Tulin Yazgac. 1999. « Hierarchical planning approach for a production-
distribution system ». International Journal of Production Research, vol. 37, no 16, p. 3759-3772.
decisions in manufacturing network design models». International Journal of Computer Integrated Manufacturing, vol 17. no 2, p. 117-125.
Paul R. Kleindorfer, Kalyan Singhal et Luk N. Wassenhove. 2005. « Sustainable Operations
Management ». Production and Operations Management, vol. 14, no 4, p. 482-492. Peace, Janet, et Timothy Juliani. 2009. « The coming carbon market and its impact on the
American economy ». Policy and Society, vol. 27, no 4, p. 305-316. Pistikopoulos, E.N., et A. Hugo. 2005. « Environmentally conscious long-range planning and
design of supply chain networks ». Journal of Cleaner Production, vol. 13, no 15 (2005/12/), p. 1428-48.
Pochampally, Kishore K., Satish Nukala et Surendra M. Gupta. 2009. Strategic planning
models for reverse and closed-loop supply chains. Boca Raton : CRC Press, xvii, 273 p. p. <http ://www.library.gatech.edu :2048/login?url=http ://www.engnetbase.com/ejournals/books/book%5Fsummary/summary.asp?id=7170>.
Poirier, C, et S.E. Reiter. 2001. La supply chain. Dunod, 2001. Pokharel, Shaligram. 2008. « A two objective model for decision making in a supply chain ».
International Journal of Production Economics, vol. 111, no 2 (2008/2), p. 378-388. Ramanathan, Ramu. 2003. An introduction to data envelopment analysis : a tool for
performance measurement. New Delhi : Sage Publications, 201 p. Ramudhin, A., A. Chaabane, M. Kharoune et M. Paquet. 2008. « Carbon Market Sensitive
Green Supply Chain Network Design ». In IEEE International Conference on Industrial Engineering and Engineering Management, 2008. IEEM 2008. p. 1093-1097.
Ravi Subramanian, Sudheer Gupta et Brian Talbot. 2009. « Product Design and Supply
Chain Coordination Under Extended Producer Responsibility ». Production and Operations Management, vol. 18, no 3, p. 259-277.
186
Rice, Gareth, Roland Clift et Richard Burns. 1997. « Comparison of currently available european LCA software ». The International Journal of Life Cycle Assessment, vol. 2, no 1, p. 53-59.
Robert Handfield, Robert Sroufe et Steven Walton. 2005. « Integrating environmental
management and supply chain strategies ». Business Strategy and the Environment, vol. 14, no 1, p. 1-19.
Rohde, Jens. 2004. « Hierarchical supply chain planning using artificial neural networks to
anticipate base-level outcomes ». OR Spectrum, vol. 26, no 4, p. 471-492. Roy, Robin. 2000. « Sustainable product-service systems ». Futures, vol. 32, no 3-4, p. 289-
299. Rubio, Sergio, Antonio Chamorro et Francisco J. Miranda. 2008. « Characteristics of the
research on reverse logistics (1995;2005) ». International Journal of Production Research, vol. 46, no 4, p. 1099 - 1120.
Saaty, Thomas L. 2001. Decision making for leaders : the analytic hierarchy process for
decisions in a complex world, 3rd. Coll. « Analytic hierarchy process series vol. 2 ». Pittsburgh, PA : RWS Publications, xii, 315 p.
Sabri, E.H., et B.M. Beamon. 2000. « A multi-objective approach to simultaneous strategic
and operational planning in supply chain design ». Omega, vol. 28, no 5 (2000/10/), p. 581-98.
Sarkis, J. 2003. « A strategic decision framework for green supply chain management ».
Journal of Cleaner Production, vol. 11, no 4, p. 397. Sarmah, S.P. 2008. « Supply chain coordination with target profit ». International Journal of
Operational Research, vol. 3, no 1/2, p. 140 - 153. Savaskan, R. Canan, Shantanu Bhattacharya et Luk N. Van Wassenhove. 2004. « Closed-
Loop Supply Chain Models with Product Remanufacturing ». MANAGEMENT SCIENCE, vol. 50, no 2 (February 1, 2004), p. 239-252.
Schärlig, Alain. 1996. Pratiquer Electre et Prométhée : un complément à Décider sur
plusieurs critères. Coll. « Collection Diriger l'entreprise ; 11 ». Lausanne, Suisse : Presses polytechniques et universitaires romandes, 173 p.
Schultmann, Frank, Bernd Engels et Otto Rentz. 2004. « Flowsheeting-based simulation of
recycling concepts in the metal industry ». Journal of Cleaner Production, vol. 12, no 7, p. 737-751.
187
Schultmann, Frank, Moritz Zumkeller et Otto Rentz. 2006. « Modeling reverse logistic tasks within closed-loop supply chains : An example from the automotive industry ». European Journal of Operational Research, vol. 171, no 3, p. 1033-1050.
Seuring, Stefan, et Martin Muller. 2008a. « Core issues in sustainable supply chain
management - a Delphi study ». Business Strategy and the Environment, vol. 17, no 8, p. 455-466.
Seuring, Stefan, et Martin Muller. 2008b. « From a literature review to a conceptual
framework for sustainable supply chain management ». Journal of Cleaner Production, vol. 16, no 15, p. 1699-1710.
Seuring, Stefan, Joseph Sarkis, Martin Muller et Purba Rao. 2008. « Sustainability and
supply chain management - An introduction to the special issue ». Journal of Cleaner Production, vol. 16, no 15, p. 1545-1551.
Sheu, Jiuh-Biing. 2008. « Green supply chain management, reverse logistics and nuclear
power generation ». Transportation Research Part E : Logistics and Transportation Review, vol. 44, no 1 (2008/1), p. 19-46.
Sheu, Jiuh-Biing, Yi-Hwa Chou et Chun-Chia Hu. 2005. « An integrated logistics operational
model for green-supply chain management ». Transportation Research Part E : Logistics and Transportation Review, vol. 41, no 4, p. 287-313.
Simchi-Levi, David, et Yao Zhao. 2005. « Safety stock positioning in supply chains with
stochastic lead times ». Manufacturing and Service Operations Management, vol. 7, no 4, p. 295-318.
Simpson, Jr., K.F. 1958. « In-process inventories ». Operations Research, vol. 6, no 6, p.
863-873. Spriensma R. 2001. The Eco-indicator 99 : a damage oriented method for life cycle impact
assessment : methodology report. Netherlands : PRé Consultants Srikanta, Routroy., et Sanisetty. Prasad. 2007. « Inventory planning for a multi-echelon
supply chain ». International Journal of Operational Research, vol. 2, no 3, p. 269-283.
Srivastava, Samir K. 2007. « Green supply-chain management : A state-of-the-art literature
review ». International Journal of Management Reviews, vol. 9, no 1, p. 53-80. Srivastava, Samir K. 2008. « Network design for reverse logistics ». Omega, vol. 36, no 4, p.
535-548.
188
Stadtler, Hartmut, et Christoph Kilger. 2000. Supply chain management and advanced planning : concepts, models, software, and case studies. Berlin ; New York : Springer, xiii, 371 p. p.
Steuer, Ralph E. 1986. Multiple criteria optimization theory, computation, and application.
Coll. « Wiley series in probability and mathematical statistics ». New York ; Toronto : J. Wiley, xx, 546 p.
Steve V. Walton, Robert B. Handfield et Steven A. Melnyk. 1998. « The Green Supply
Chain : Integrating Suppliers into Environmental Management Processes ». The Journal of Supply Chain Management, vol. 34, no 2, p. 2-11.
Subramanian, Ravi, F. Brian Talbot et Sudheer Gupta. 2008. An Approach to Integrating
Environmental Considerations within Managerial Decision-Making. SSRN eLibrary http ://ssrn.com/paper=1004339.
Supply Chain Council. 2006. « SCOR Model Overview ,Version 8.0. Supply Chain Council
Inc. ». Syam, S.S. 2002. « A model and methodologies for the location problem with logistical
components ». Computers & Operations Research, vol. 29, no 9 (2002/08/), p. 1173-93.
Tayur, Sridhar, Ram Ganeshan et Michael Magazine. 1999. Quantitative models for supply
chain management. Coll. « International series in operations research & management science ; 17 ». Boston : Kluwer Academic Publishers, vii, 885 p. <http ://lcweb.loc.gov/catdir/toc/98037476.html>.
Tol, Richard S. J. 2005. « The marginal damage costs of carbon dioxide emissions : an
assessment of the uncertainties ». Energy Policy, vol. 33, no 16, p. 2064-2074. US Environnemental Protection Agency. 2009. « http
://www.epa.gov/lawsregs/bizsector/index.html ». Wadhwa, S., J. Madaan et F. T. S. Chan. 2009. « Flexible decision modeling of reverse
logistics system : a value adding MCDM approach for alternative selection ». Robotics and Computer-Integrated Manufacturing, vol. 25, no 2, p. 460-9.
Wara, Michael. 2007. « Is the global carbon market working? ». Nature, vol. 445, no 7128, p.
595-596. Waste Electronic and Elctrical Equipment. 2009. « http
White, Charles David, Eric Masanet, Christine Meisner Rosen et Sara L. Beckman. 2003. « Product recovery with some byte : an overview of management challenges and environmental consequences in reverse manufacturing for the computer industry ». Journal of Cleaner Production, vol. 11, no 4, p. 445-458.
Woerdman, Edwin. 2000. « Implementing the Kyoto protocol : why JI and CDM show more
promise than international emissions trading ». Energy Policy, vol. 28, no 1, p. 29-38. Xanthopoulos, A., et E. Iakovou. 2009. « On the optimal design of the disassembly and
recovery processes ». Waste Management, vol. 29, no 5, p. 1702-1711. Yoon, Kwangsun, et C. L. Hwang. 1995. Multiple attribute decision making : an
introduction. Coll. « Sage university papers series. Quantitative applications in the social sciences ; no. 07-104 ». Thousand Oaks, CA : Sage Publications, viii, 75 p.
Young, A., et A. Kielkiewicz-Young. 2001. « Sustainable Supply Network Management ».
Corporate Environmental Strategy, vol. 8, p. 260-268. Zhou, Zhangyu, Siwei Cheng et Ben Hua. 2000. « Supply chain optimization of continuous
process industries with sustainability considerations ». In 7th International Symposium on Process Systems Engineering, 16-21 July 2000 (2000//). Vol. 24, p. 1151-8. Coll. « Comput. Chem. Eng. (UK) ». Keystone, CO, USA : Elsevier.
Zhou, Zhangyu, Min'gang Zeng, Siwei Zeng, Ben Hua et Qinghua Yin. 2003. « Supply chain
long range planning and investment decision making system in chemical industry ». Huagong Xuebao/Journal of Chemical Industry and Engineering (China), vol. 54, no 5, p. 659-664.