Ecological Applications, 24(6), 2014, pp. 1405–1420 Ó 2014 by the Ecological Society of America Ecological site-based assessments of wind and water erosion: informing accelerated soil erosion management in rangelands NICHOLAS P. WEBB, 1,3 JEFFREY E. HERRICK, 1 AND MICHAEL C. DUNIWAY 2 1 USDA-ARS Jornada Experimental Range, MSC 3 JER, NMSU, Box 30003, Las Cruces, New Mexico 88003-8003 USA 2 U.S. Geological Survey, Southwest Biological Science Center, Moab, Utah 84532 USA Abstract. Accelerated soil erosion occurs when anthropogenic processes modify soil, vegetation, or climatic conditions causing erosion rates at a location to exceed their natural variability. Identifying where and when accelerated erosion occurs is a critical first step toward its effective management. Here we explored how erosion assessments structured in the context of ecological sites (a land classification based on soils, landscape setting, and ecological potential) and their vegetation states ( plant assemblages that may change due to management) can inform systems for reducing accelerated soil erosion in rangelands. We evaluated aeolian horizontal sediment flux and fluvial sediment erosion rates for five ecological sites in southern New Mexico, USA, using monitoring data and rangeland-specific wind and water erosion models. Across the ecological sites, plots in shrub-encroached and shrub-dominated vegetation states were consistently susceptible to aeolian sediment flux and fluvial sediment erosion. Both processes were found to be highly variable for grassland and grass–succulent states across the ecological sites at the plot scale (0.25 ha). We identified vegetation thresholds that define cover levels below which rapid (exponential) increases in aeolian sediment flux and fluvial sediment erosion occur across the ecological sites and vegetation states. Aeolian sediment flux and fluvial erosion in the study area could be effectively controlled when bare ground cover was ,20% of a site or the cover of canopy interspaces .100 cm in length was less than ;35%. Land use and management activities that alter cover levels such that they cross thresholds, and/or drive vegetation state changes, may increase the susceptibility of areas to erosion. Land use impacts that are constrained within the range of natural variability should not result in accelerated soil erosion. Evaluating land condition against the erosion thresholds identified here will enable identification of areas susceptible to accelerated soil erosion and the development of practical management solutions. Key words: accelerated soil erosion; aeolian; agriculture; anthropogenic dust; dryland; land use change; state-and-transition models; sustainability; threshold. INTRODUCTION Land use change and intensification have resulted in accelerated rates of soil erosion and land degradation in many areas of the world’s rangelands (Lal 1990, Ravi et al. 2010). Natural (potential) erosion rates vary across rangelands as a function of climate, topography, vegetation composition and structure, and the status of dynamic soil properties of crusting and aggregation (Gillette 1999). These factors operate by determining landscape susceptibility to erosion, and landscape resilience following soil loss (Lal 2001). Accelerated soil erosion, defined here as erosion greater than the natural potential erosion rate at a site, may occur when the controlling factors are modified by anthropogenic processes in excess of their natural variability (Neff et al. 2008, Ginoux et al. 2012). Increasing our under- standing of the relative sensitivities of land types to climate and land use pressures by evaluating their rates of wind and water erosion under a range of conditions will enhance our capacity to identify practical manage- ment solutions (Neff et al. 2005). Conducting such analyses in the context of ecological models of landscape change may facilitate management to improve the resilience of rangeland systems so that they are sustainable and productive under different land uses, increasing development pressures, and future climate change (van de Koppel et al. 1997, Okin et al. 2009). There is a growing body of work applying predictive models to assess rates of aeolian sediment flux and water erosion in rangelands. The focus of water erosion research has been to quantify soil loss (fluvial sediment erosion) at the hillslope and catchment scales to determine the impacts of management activities. This has included assessments of the types and intensities of impacts that rangelands can support, such as livestock grazing and military training activities (Vachta and Hutchinson 1990, Grantham et al. 2001, Bartley et al. 2010a, b). Adaptations of the Universal Soil Loss Equation (USLE; Weltz et al. 1998, Wang et al. 2007), Manuscript received 25 July 2013; revised 30 January 2014; accepted 12 February 2014. Corresponding Editor: D. D. Breshears. 3 E-mail: [email protected]1405
Transcript
Ecological Applications, 24(6), 2014, pp. 1405–1420� 2014 by the Ecological Society of America
Ecological site-based assessments of wind and water erosion:informing accelerated soil erosion management in rangelands
NICHOLAS P. WEBB,1,3 JEFFREY E. HERRICK,1 AND MICHAEL C. DUNIWAY2
1USDA-ARS Jornada Experimental Range, MSC 3 JER, NMSU, Box 30003, Las Cruces, New Mexico 88003-8003 USA2U.S. Geological Survey, Southwest Biological Science Center, Moab, Utah 84532 USA
Abstract. Accelerated soil erosion occurs when anthropogenic processes modify soil,vegetation, or climatic conditions causing erosion rates at a location to exceed their naturalvariability. Identifying where and when accelerated erosion occurs is a critical first step towardits effective management. Here we explored how erosion assessments structured in the contextof ecological sites (a land classification based on soils, landscape setting, and ecologicalpotential) and their vegetation states (plant assemblages that may change due to management)can inform systems for reducing accelerated soil erosion in rangelands. We evaluated aeolianhorizontal sediment flux and fluvial sediment erosion rates for five ecological sites in southernNew Mexico, USA, using monitoring data and rangeland-specific wind and water erosionmodels. Across the ecological sites, plots in shrub-encroached and shrub-dominatedvegetation states were consistently susceptible to aeolian sediment flux and fluvial sedimenterosion. Both processes were found to be highly variable for grassland and grass–succulentstates across the ecological sites at the plot scale (0.25 ha). We identified vegetation thresholdsthat define cover levels below which rapid (exponential) increases in aeolian sediment flux andfluvial sediment erosion occur across the ecological sites and vegetation states. Aeoliansediment flux and fluvial erosion in the study area could be effectively controlled when bareground cover was ,20% of a site or the cover of canopy interspaces .100 cm in length wasless than ;35%. Land use and management activities that alter cover levels such that theycross thresholds, and/or drive vegetation state changes, may increase the susceptibility of areasto erosion. Land use impacts that are constrained within the range of natural variabilityshould not result in accelerated soil erosion. Evaluating land condition against the erosionthresholds identified here will enable identification of areas susceptible to accelerated soilerosion and the development of practical management solutions.
Key words: accelerated soil erosion; aeolian; agriculture; anthropogenic dust; dryland; land use change;state-and-transition models; sustainability; threshold.
INTRODUCTION
Land use change and intensification have resulted in
accelerated rates of soil erosion and land degradation in
many areas of the world’s rangelands (Lal 1990, Ravi et
al. 2010). Natural (potential) erosion rates vary across
rangelands as a function of climate, topography,
vegetation composition and structure, and the status
of dynamic soil properties of crusting and aggregation
(Gillette 1999). These factors operate by determining
landscape susceptibility to erosion, and landscape
resilience following soil loss (Lal 2001). Accelerated soil
erosion, defined here as erosion greater than the natural
potential erosion rate at a site, may occur when the
controlling factors are modified by anthropogenic
processes in excess of their natural variability (Neff et
al. 2008, Ginoux et al. 2012). Increasing our under-
standing of the relative sensitivities of land types to
climate and land use pressures by evaluating their rates
of wind and water erosion under a range of conditions
will enhance our capacity to identify practical manage-
ment solutions (Neff et al. 2005). Conducting such
analyses in the context of ecological models of landscape
change may facilitate management to improve the
resilience of rangeland systems so that they are
sustainable and productive under different land uses,
increasing development pressures, and future climate
change (van de Koppel et al. 1997, Okin et al. 2009).
There is a growing body of work applying predictive
models to assess rates of aeolian sediment flux and water
erosion in rangelands. The focus of water erosion
research has been to quantify soil loss (fluvial sediment
erosion) at the hillslope and catchment scales to
determine the impacts of management activities. This
has included assessments of the types and intensities of
impacts that rangelands can support, such as livestock
grazing and military training activities (Vachta and
Hutchinson 1990, Grantham et al. 2001, Bartley et al.
2010a, b). Adaptations of the Universal Soil Loss
Equation (USLE; Weltz et al. 1998, Wang et al. 2007),
Manuscript received 25 July 2013; revised 30 January 2014;accepted 12 February 2014. Corresponding Editor: D. D.Breshears.
Revised-USLE (Fernandez et al. 2003, Spaeth et al.
2003), Water Erosion Prediction Project (Simanton et al.
1991), and SedNet models (Bartley et al. 2007) were
developed in these studies for rangeland applications.
However, few field studies or model applications have
concurrently, or independently, assessed management
impacts on rangeland wind erosion (Breshears et al.
2003, Van Donk et al. 2003, Visser et al. 2004, Field et
al. 2011a). Land management–wind erosion interactions
have not been evaluated extensively outside of cultivated
systems (Hu et al. 1997).
Consequently, most available wind erosion models
have been parameterized to represent processes that are
typical of cropping systems (Webb and McGowan
2009). While dust emission models (e.g., Marticorena
and Bergametti 1995, Shao et al. 1996) use more
generalized process representations, they do not ade-
quately represent the effects of management (Raupach
and Lu 2004). Assessments of management impacts on
rangeland soil erosion depend on reliable representation
of soil and vegetation conditions and the effects of
disturbance due to different land uses on soil detach-
ment and sediment transport (Ludwig et al. 2007, Al-
Hamdan et al. 2012). For wind erosion, this requires
representing different vegetation horizontal and vertical
structures and distributions and dynamic soil surface
conditions (Webb and Strong 2011). For water erosion,
there is a need for models that can represent splash and
thin-sheet flow processes that dominate sediment trans-
port at the plot and hillslope scales in some rangelands
(Nearing et al. 2011).
Data on the nature of management impacts on soil
erosion in rangelands are becoming increasingly avail-
able through field studies (e.g., Leys and Eldridge 1998,
Belnap et al. 2007, Belnap et al. 2009, Baddock et al.
2011, Field et al. 2011b). This has only recently been
transferred to a modeling capability for both wind and
water erosion assessment. For example, the wind erosion
model (WEMO) of Okin (2008) represents vegetation
distribution effects on aeolian horizontal sediment flux,
and the Rangeland Hydrology and Erosion Model
(RHEM) represents erodibility as a function of range-
land-specific vegetation life forms (Nearing et al. 2011).
However, these models are yet to be applied broadly or
in a structured way across diverse land units to evaluate
the relative impacts of different land uses and distur-
bance on soil erosion.
One of the challenges associated with modeling
rangeland soil erosion is the high diversity of soils and
types of vegetation occurring within and among
landscapes. Ecological sites provide a system for
organizing landscapes at management-relevant scales
based on properties that are understood to control both
wind and water erosion including climate, topography,
vegetation, and soil properties (Bestelmeyer et al. 2009).
Because ecological sites are correlated with National
Cooperative Soil Survey soil map unit components (in
the USA), which are the individual soils that occur
within a delineated soil map polygon, they can be
predicted spatially using soils maps (Duniway et al.
2010). Ecological sites therefore provide a potential
conceptual and spatially explicit structure for assessing
erosion and for managing and restoring eroding
landscapes.
Ecological sites can be used to organize information
about vegetation cover, composition and structure, and
dynamic soil properties in state-and-transition models
(Westoby et al. 1989). Vegetation communities in
ecological sites that are subject to land use change or
intensification may undergo transitions to alternative
states, defined by alterations in ecological processes and
feedbacks from which recovery may be difficult on
management-relevant time scales (Bestelmeyer et al.
2009). Such state changes that result from land
degradation often include increases in soil erosion
(Ash et al. 1994, Bestelmeyer et al. 2009). Varying
degrees of accelerated erosion may, therefore, occur
within and among ecological sites and their states
depending on the land degradation status and the
intensity of land use and climate stressors (Chartier
and Rostagno 2006, Ravi et al. 2010, Miller at al. 2011).
Management systems (Fig. 1) that structure assessments
of soil erosion in the context of ecological sites have the
potential to enhance our capacity to better manage
accelerated wind and water erosion.
In the United States, the National Resources Inven-
tory (NRI) has included ecological site information for
the ;2000 plots measured each year on nonfederal lands
since 2003. This number has doubled since 2011 with the
inclusion of Bureau of Land Management (BLM) lands.
These extensive data, which include vegetation compo-
sition, cover, and structure, have the potential for
driving assessments of soil erosion (e.g., Hernandez et
al. 2013) and provide opportunities to evaluate erosion
rates among ecological sites and states, test site
sensitivities to climate and management pressures, and
identify vegetation cover levels for controlling erosion
(herein thresholds) that transcend the diverse soil types
and plant communities found across rangelands.
The objectives of this research were to (1) explore how
aeolian sediment flux and fluvial sediment erosion
assessments structured across ecological sites can inform
systems for managing accelerated soil erosion in
rangelands (Fig. 1), and (2) determine how soil erosion
models could be improved to take advantage of the
information associated with ecological sites and states.
We conducted an assessment by applying recently
acquired monitoring data on soil and vegetation
attributes to drive models of aeolian horizontal sediment
transport and fluvial sediment erosion across five
ecological sites in southern New Mexico, USA. We
evaluated the transport and erosion assessments in the
presence and absence of an anthropogenic disturbance
(graded roadways) to identify underpinning patterns in
sediment transport and erosion controls across ecolog-
ical sites and among their states, and how the findings
NICHOLAS P. WEBB ET AL.1406 Ecological ApplicationsVol. 24, No. 6
can be used to improve systems of accelerated erosion
management in rangelands.
METHODS
Study area description
The study area is located in the semiarid rangelands of
southern New Mexico, USA (centered on 10585206.000
W, 3282908.600 N; Fig. 2). The area covers a variety of
landforms and associated soils including limestone hills,
alluvial fans, valley bottoms, alluvial plains, and aeolian
sands. The elevation ranges from 1440 to 2160 m above
sea level. Plant community composition in the study
area varies with soils, elevation, and landscape position.
The historic plant communities in the study area are
warm-season (C4) grasslands or mixed communities of
warm-season grasses, shrubs, and half-shrubs (McClar-
an and Van Devender 1997). Currently, dominant
species include mesquite (Prosopus glandulosa Torr.)
and black grama (Bouteloua eriopoda Tor.) on sandy
sites, creosote (Larrea tridentata DC.) and black grama
on gravelly sites, and tarbush (Flourensia cernua DC.)
and tobosa (Pleuraphis mutica Buckley) on loamy sites.
The mean annual precipitation (1960–2012) for the
study area within the Tularosa Basin is 260 mm (range
124–468 mm), and on Otero Mesa is 305 mm (range
165–578 mm) with 50% falling in the summer months,
from June through September. The study area includes
three BLM grazing allotments in areas jointly managed
by the Fort Bliss Army Base. Both cattle grazing and
military training activities occur in the study area.
Field data collection
Soil and vegetation attributes were sampled at 120
plots as part of a broader study to evaluate the
sensitivity of a standard rangeland assessment protocol
to road impacts (Duniway and Herrick 2013). The plots
were stratified across five types of ecological site with
similar potential vegetation composition and vegetation
production (Table 1; Appendix: Table A1). Stratifica-
tion with soil maps was used, and at each plot, the
ecological site soil texture was verified in the field using
either soil pits or auger holes. The plots were located
through a geographic information system (GIS) analysis
of digitized soils maps (USDA Natural Resources
Conservation Service [NRCS], available online)4 and
FIG. 1. Illustration of a generalized schema for assessing and managing accelerated soil erosion. Line styles and arrows helpseparate process in the framework. The dashed box signifies the starting point of the analysis. Solid lines and boxes represent thesoil erosion evaluation process. The oval represents the management or land use change that will be evaluated in the framework.Bold boxes and dashed arrows represent management responses to outcomes of the soil erosion evaluation. The dotted box andarrow signifies an additional step that may be required if erosion rates are found to be significantly large, even after managementchange.
etation Index (NDVI) data to capture the range of plant
community structures and productivity across the
ecological sites. Sixty plots, 12 in each ecological site,
were sampled in September and October 2008, and the
remaining plots were sampled between August and
October 2009. The plots were then further stratified so
that in each year, half (30 plots) were located in areas
without graded roadways, and the remaining 30 plots
were located adjacent to graded roads. The presence of
roads was expected to affect the plot vegetation cover
and distribution, which influence sediment transport and
erosion rates. This stratification enabled us to test the
effects of an important disturbance mechanism on the
condition of the ecological sites and their potential
erosion rates.
Quantitative estimates of plant canopy gap-size
distribution, vegetation height, and ground cover
(including vegetation, litter, rock, and lichen crusts)
were calculated from data collected along three 25-m
transects at each plot (following Herrick et al. 2005).
Transects were placed in a hub-and-spoke pattern
originating 5 m from the center of the plot and spaced
at 1208 intervals. The orientation of the transect pattern
was randomized for each plot to avoid systematic error
at plots where roads were aligned with the cardinal
directions. Vegetation cover and species composition
were estimated using line–point intercept (LPI) sampling
with a point spacing of 50 cm. Canopy height and gap
size were measured along the same transects following
Herrick et al. (2005). In addition to the soil sampling in
pits/auger holes to verify the ecological sites, top soil (1
cm and 5 cm depth) samples were collected from each
plot for texture analysis using the hydrometer method
(Klute 1986).
Modeling approach
We applied models to assess aeolian horizontal
sediment flux and fluvial sediment erosion across the
study ecological sites. Here we define aeolian horizontal
sediment flux as the horizontal mass transport of
sediment by wind over the land surface, expressed with
the units grams per centimeter per day. We define fluvial
sediment erosion as the sediment loss per unit area (Mg/
ha) along a hillslope via splash and thin-sheet flow
processes. While sediment transport (for example,
aeolian horizontal sediment flux) does not equate to
sediment erosion (soil loss), we note that the limited data
on the two processes suggest that they are correlated
(Breshears et al. 2003).
Wind-driven sediment transport.—Assessments of ae-
olian horizontal sediment flux (g�cm�1�d�1) were made
using the wind erosion model (WEMO) of Okin (2008).
The WEMO core components include representation of
vegetation roughness effects and a sand flux equation.
Model inputs include an estimate of the soil threshold
friction velocity (u*t) for mobilization by wind, a wind
speed probability distribution, and measures of the
vegetation canopy gap distribution and average canopy
height for the study area of interest. The model
representation of surface roughness effects differs from
other models (e.g., Raupach et al. 1993) in that it
accounts for the distribution of vegetation and assumes
that roughness elements affect the wind erosivity
incident on the land surface, rather than the bulk
erodibility of the surface itself (Okin 2008). The input
canopy gap distribution, scaled by the average canopy
height, is used with the input wind speed distribution to
calculate a probability distribution of wind friction
velocity (u*) at the soil surface. The model then applies a
sand flux equation (Gillette and Passi 1988) to calculate
horizontal sediment flux for the distribution of shear
stress that is in excess of the independent soil threshold
friction velocity (u*t). Li et al. (2013) describe the model
calibration, validation, and performance relative to
other wind erosion models.
Scaled canopy gap distributions as input to WEMO
were generated from the canopy gap and height data
measured at each plot. A wind speed probability
distribution was generated from 5-min average wind
speed data measured in 2009 at the nearby Holloman
Air Force Base automatic weather station (located:
10680405300 W, 32850014.7100 N).
A constant soil threshold friction velocity (u*t) of 25
cm/s was used for the WEMO simulations in the absence
of estimates for the individual study plots. The value of
the nominal u*t is consistent with that of an erodible fine
sand (Gillette et al. 1980). Our use of a constant u*t was
due to the fact that WEMO does not provide a way to
estimate the threshold from soil data. Estimation of u*tis further limited by the fact that it also depends on the
level of soil surface disturbance, for which there is
currently no standard measurement method. This
limitation is critical for explaining the results.
Keeping both the wind speed and soil threshold
constant enabled an assessment of how the vegetation
characteristics of the plots may influence sediment
transport rates, without the confounding influences of
changing wind erosivity and soil erodibility. To demon-
strate the effect of the soil threshold friction velocity on
aeolian sediment flux we conducted a model sensitivity
test in which we incrementally increased u*t from 25 cm/
s to 40 cm/s and 70 cm/s. The test enabled us
demonstrate the effect of a change in soil crusting or
surface disturbance on aeolian sediment flux, indepen-
dent of disturbance impacts on vegetation. WEMO was
run to estimate aeolian horizontal sediment flux for each
of the plots across the five ecological sites sampled in
2008 and 2009.
Water erosion.—Fluvial sediment erosion assessments
were made using the Rangeland Hydrology and Erosion
Model (RHEM). RHEM is an empirical, process-based
model that simulates soil loss (Mg/ha) along a hillslope
via splash and thin-sheet flow erosion (Nearing et al.
2011). Concentrated flow is calculated as a function of
the erosivity of overland flow, the sediment transport
NICHOLAS P. WEBB ET AL.1408 Ecological ApplicationsVol. 24, No. 6
capacity, and the existing sediment load in the flow
(Nearing et al. 2011). The RHEM model structure,
validation, and application are described in Nearing et
al. (2011) and Hernandez et al. (2013).
RHEM requires inputs describing rainfall volume,
duration, and intensity, which were obtained as prede-
fined inputs from the model’s application website
(available online).5 The data were produced from nearby
Orogrande (located at 106805030.2700 W, 32822037.7900 N)
precipitation records using the Cligen V5.101 stochastic
weather generator (Nicks et al. 1995). Unfortunately,
rainfall and wind speed data were not available from the
same station for consistency between the RHEM and
WEMO simulations. This was a limitation of our study,
as annual precipitation is likely to vary among the
locations. However, the approach enabled us to conduct
the model assessments and serves to highlight the need
for local measurements of weather variables to improve
the accuracy of model applications.
The model slope gradient input was obtained via
inclinometer at each of the study plots. In the absence of
data on slope length, we kept the parameter constant at
250 m for all simulations. As slope length can be a
source of variability in erosion rates, it will be important
to include this parameter in future ecological-site
descriptions. Fractional cover estimates obtained from
the LPI measurements of total ground, plant canopy,
litter, plant basal, lichen and surface rock cover, and
measures of the site soil clay contents from the texture
analyses, were used to calculate the RHEM friction
factors for runoff and erosion and the splash and sheet
erosion coefficients following Nearing et al. (2011).
RHEM was run to simulate a synthetic 300-year time
series of fluvial sediment erosion events at each plot
sampled across the five ecological sites in 2008 and 2009.
The long series was used to ensure stabilization of the
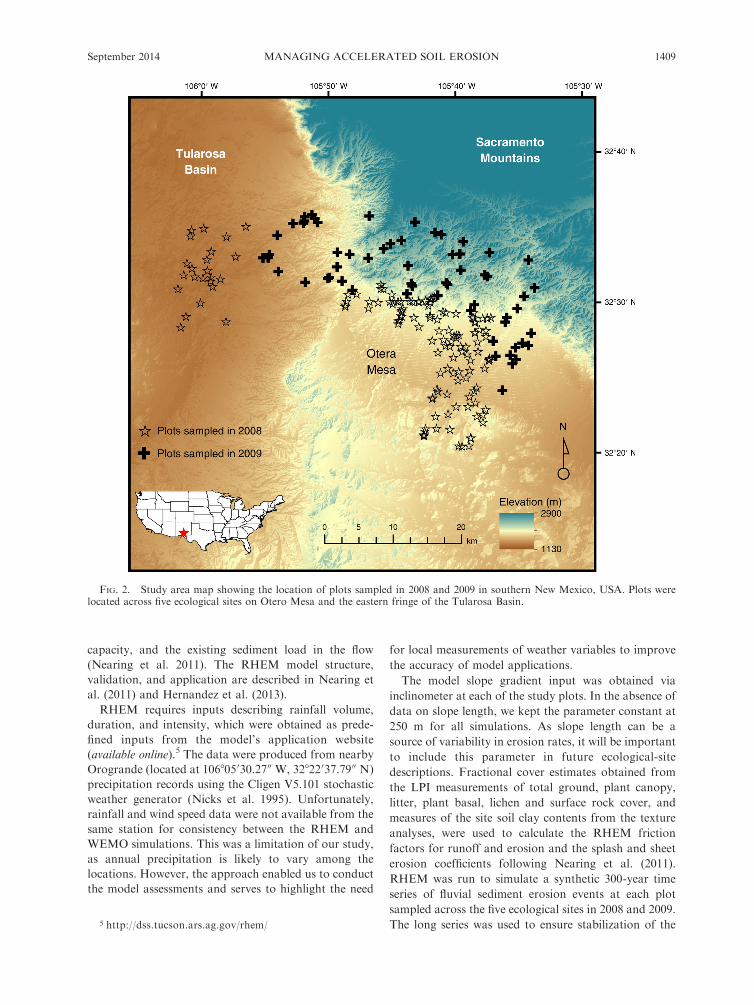
FIG. 2. Study area map showing the location of plots sampled in 2008 and 2009 in southern New Mexico, USA. Plots werelocated across five ecological sites on Otero Mesa and the eastern fringe of the Tularosa Basin.
5 http://dss.tucson.ars.ag.gov/rhem/
September 2014 1409MANAGING ACCELERATED SOIL EROSION
average annual soil loss, which was computed for eachof the 120 plots (following Hernandez et al. 2013).
Data analysis
The simulated aeolian horizontal sediment flux and
soil loss due to fluvial sediment erosion were initiallyevaluated by visually comparing their magnitudes across
the ecological sites. For all analyses, we combined data
from plots sampled in 2008 and 2009 on the basis that
their geomorphic and local climate characteristics were
highly variable and more influential than differences in
precipitation between the two years. We could not makequantitative comparisons between wind and water
erosion, or their rates among the ecological sites,
because of the significant differences in how the models
represent soil erodibility effects on erosion and because
WEMO simulates aeolian sediment flux (g�cm�1�d�1),while RHEM simulates soil loss (Mg/ha). This was
unavoidable, as no wind erosion model has been
developed to estimate soil loss in rangelands and which
also accurately represents the spatial distribution and
structure of vegetation in the study area. While the soil
erodibility representations and outputs of WEMO andRHEM are not comparable, the models provide the
most reliable process representations of wind and water
erosion processes available for the study area.
The large variability in simulated aeolian sediment
flux and fluvial sediment erosion within ecological sites
led us to hypothesize that (1) the vegetation communitystates (that is, the vegetation life forms and their
distributions) within ecological sites have a significant
effect on the erosion processes, and, (2) by reducing
vegetation cover, the presence of graded roadways will
result in a significant change (increase) in sediment
transport and erosion. To test the hypothesis thatvegetation state is important for aeolian sediment flux
and fluvial sediment erosion, we classified the 120 plots
(60 adjacent to roads) into six vegetation groups based
on their dominant plant community life forms and their
horizontal and vertical structures in the landscape.These were determined from species composition data
and photographic records that were collected during the
field sampling. The groups included grasslands, natural
grass–shrub mix, grass and juniper mix, grass and
succulent mix, shrub-encroached, and shrub-dominated
plots. The vegetation structures within these generalized
groups are typical of the dominant ecological states that
occur in the region (USDA NRCS; available online).6
We used mixed-model analysis of variance (ANOVA)
to test for differences in simulated aeolian sediment flux
and fluvial sediment erosion rates between the vegeta-
tion groups (herein states) and between sites without and
with adjacent roadways. All statistical analyses were
conducted using SAS version 9.3 software (SAS Institute
2009). We assessed all variables for normality and
homogeneity of variance prior to the analysis. As
expected, the simulated aeolian horizontal sediment flux
and fluvial sediment erosion displayed skewed distribu-
tions. This was due to the nonlinear response of erosion
(and the models) to differences in ground cover among
the plots. We therefore conducted a log-transformation
of the simulated data for input to the ANOVA, which
was run separately for the aeolian sediment flux and
fluvial sediment erosion. We calculated post hoc
pairwise comparisons of the vegetation community
states using Fisher’s least significant difference (LSD)
tests. More rigorous significance tests were not applied
given the uncertainty in the simulated flux and erosion
assessments.
Finally, we evaluated patterns in the aeolian sediment
flux and fluvial sediment erosion responses to the site
vegetation characteristics through an analysis of the
relationships between the model outputs and the
measured ground cover and canopy gap size data. While
this analysis was circular in nature, and assumes that the
models reflect reality, it facilitated the identification of
general responses and vegetation thresholds that tran-
scend the ecological sites and that could be used to make
practical management recommendations.
RESULTS
Ground cover attributes of the ecological sites
Measured vegetation cover and the area of erodible
bare ground were highly variable within and among the
five ecological sites at the 0.25-ha plot scale (Fig. 3). The
limestone hills sites had the largest total ground cover at
plots without and with adjacent roads. The loamy and
sandy sites had the smallest total ground cover at sites
without roads, while total ground cover was similar at
TABLE 1. Ecological sites in southern New Mexico, USA, that were evaluated in this study andsummary of their physical characteristics.
Ecological site group Clay content (%) ESD slope range (%)� Number of plots
aeolian sediment flux, were significantly smaller thanfor shrub-dominated (P¼ 0.036) and shrub-encroached
plots (P ¼ 0.0179).
The effect of vegetation cover and spatial patterns on soil
erosion processes
Aeolian horizontal sediment flux and fluvial sediment
erosion display threshold-type responses to changes in
ground cover and the proportion of exposed and
potentially erodible soil surface (Fig. 5). These thresh-
olds describe the vegetation cover levels at which rapid
FIG. 3. Summary of ground cover characteristics (2008 and2009 combined) for the five ecological sites. Data were collectedalong transects using the line–point intercept (LPI) method (seeMethods section). Ground cover characteristics include: totalground cover (TGC, including foliar and basal cover, litter,cyanobacteria and rock cover), foliar cover (FC, of plantcanopies), plant basal cover (BC), total litter cover (TL),cyanobacteria crust cover (Cy), rock cover (Rk), and bareground cover (BG, including that beneath overhanging plantcanopies).
September 2014 1411MANAGING ACCELERATED SOIL EROSION
FIG. 4. Simulated aeolian horizontal sediment flux (top) and soil loss due to fluvial sediment erosion (bottom), averaged acrossplots within the ecological sites without (left) and with (right) adjacent roadways. Data show means 6 SE.
TABLE 2. ANOVA results showing the presence/absence of significant differences in simulatedaeolian horizontal sediment flux between plant community structural groups (states), and forplots with and without adjacent roads.
Notes: Groups include: grasslands (GRASS), natural grass–shrub mix (GRSHM), shrub-encroached (SHEN), shrub-dominated (SHDO), grass-succulent mix (GRSU), and grasslandcontaining oneseed juniper (Juniperus monosperma (Engelm.) Sarg.; GRJU). The number ofsamples (n) in each group is: GRASS (20), GRSHM (21), SHEN (28), SHDO (38), GRJU (8), andGRSU (5). Mean1 and Mean2 refer to the first and second, respectively, ecological state listed in thefirst column of the table. ANOVA results for comparison of simulated aeolian horizontal sedimentflux (g�cm�1�d�1); df ¼ 112.
* Indicates a significant difference (P , 0.05) between groups.
NICHOLAS P. WEBB ET AL.1412 Ecological ApplicationsVol. 24, No. 6
(exponential) increases in sediment flux and soil loss
begin to occur. The thresholds lie at ;20% bare ground
and ;50% total ground cover for aeolian sediment flux,
and ;20% bare ground and ;70% total ground cover
for fluvial sediment erosion. Beyond the thresholds,
aeolian horizontal sediment flux and fluvial sediment
erosion increase exponentially with declining ground
cover and an increasing proportion of bare ground. The
form of the relationship was consistent between plots
with and without road disturbances (Fig. 5). Impor-
TABLE 3. ANOVA results showing the presence/absence of significant differences in simulated soilloss due to fluvial sediment erosion between plant community structural groups (states), and forplots with and without adjacent roads.
Note: See Table 2 for abbreviations and sample numbers. ANOVA results for comparison ofsimulated fluvial sediment erosion (Mg/ha); df ¼ 113.
* Indicates a significant difference (P , 0.05) between groups.
FIG. 5. Graphs showing the relationship between simulated aeolian horizontal sediment flux (top), soil loss due to fluvialsediment erosion (bottom), and the fractional cover of bare ground and total ground cover. Data are shown from all ecologicalsites, at plots without and with adjacent roadways in 2008 and 2009. Dashed lines indicate proposed thresholds for horizontalsediment flux and soil erosion.
September 2014 1413MANAGING ACCELERATED SOIL EROSION
tantly, the relationship is present in the data across the
five ecological sites, with the position of individual plots
within the graph varying largely along the axis of
vegetative cover and independently of the vegetation
community states. The effect of hillslope on the
simulated fluvial sediment erosion is evident for the
limestone hills ecological site and outweighs the effect of
vegetation cover and area of exposed bare ground (Fig.
5). Fluvial sediment erosion at plots in the limestone
hills site was indicated to occur at lower levels of
exposed bare ground (,20%) that for the other
ecological sites.
The size distribution of vegetation canopy gaps also
has an effect on the magnitude of the simulated aeolian
horizontal sediment flux and fluvial sediment erosion.
Aeolian horizontal sediment flux displays a clear
threshold-type response to the size distribution of
canopy gaps, and this threshold appears to be consistent
across the ecological sites and vegetation states (Fig. 6).
Our modeling results show that the aeolian sediment
flux increases exponentially above 0.5 g�cm�1�d�1 when
the cover of canopy gaps .50 cm reaches ;50%, when
the cover of canopy gaps .100 cm reaches ;30%, or
when the cover of canopy gaps .150 cm reaches ;20%.
The results indicate that plots that were patchy and had
many large canopy gaps would be likely to experience
more aeolian sediment transport than sites with many
small or few large canopy gaps.
The simulated fluvial sediment erosion response to
increasing canopy gap size was not as strong as for
FIG. 6. Selected graphs showing the relationship between simulated aeolian horizontal sediment flux, soil loss due to fluvialsediment erosion, and the percent cover of canopy gaps larger than 50 cm, 100 cm, and 150 cm. Data are shown for all fiveecological sites, at plots without adjacent roadways sampled in 2008 and 2009. Dashed lines indicate proposed thresholds forhorizontal sediment flux and soil erosion.
NICHOLAS P. WEBB ET AL.1414 Ecological ApplicationsVol. 24, No. 6
aeolian sediment flux. We found considerably more
variability in the relationship (Fig. 6). This variability
results from between-site differences in hillslope, which
have a strong effect on the erosivity of runoff and sheet
flow in RHEM (Nearing et al. 2011). The effect of
hillslope is again particularly evident for limestone hills
plots (Fig. 6). Our results indicate that this slope effect
can be moderated by the ground cover characteristics of
the plots, which appear to have a stronger and more
consistent impact on the simulated fluvial sediment
erosion. When not confounded by hillslope influences,
fluvial sediment erosion had an apparent threshold-type
response; increasing exponentially when sites had .70%cover of canopy gaps . 50 cm, .40% cover of canopy
gaps . 100 cm, and .30% cover of canopy gaps . 150
cm. However, the simulations indicate that fluvial
sediment erosion may occur at a lower cover of these
canopy gap sizes in any of the ecological sites, with or
without roadway disturbances (Fig. 6).
The effect of soil surface disturbance on aeolian
sediment flux
The disturbance of rangeland soils, for example, by
livestock trampling, disrupts surface crusts and increases
the susceptibility of exposed soil surfaces to wind
erosion. This increase in erodibility manifests as a
decline in the soil threshold friction velocity (u*t) for
mobilization by wind (Gillette et al. 1980). Fig. 7 reports
sensitivity test results, which show the aeolian horizontal
sediment flux response to a reduction in u*t relative to
the fraction of bare ground at the study plots. At around
the threshold of 20% bare ground simulated horizontal
sediment flux increases exponentially and by an order of
magnitude with a reduction in u*t from 70 cm/s to 25
cm/s. The effect of the soil threshold change is consistent
across the ecological sites and treatments. An increase in
the soil threshold above 70 cm/s would apparently
reduce aeolian horizontal sediment flux in the study area
to a very low level (,0.1 g�cm�1�d�1).
DISCUSSION
Structuring soil erosion assessments within an eco-
logical site framework has potential to improve the
utility of assessments for monitoring and managing
accelerated soil erosion in rangelands. The approach
enabled us to resolve the effects of vegetation commu-
nity life form and spatial structure on erosion rates,
indicative of the effects of an ecological state change,
identify the potential impacts of a site disturbance
(graded roadways) on erosion, and elucidate underpin-
ning patterns and thresholds in erosion responses and
how they manifest across ecological sites and their
respective states. The assessment also demonstrates that
accounting for spatial variability within ecological sites
is important for erosion monitoring and management
strategies.
Spatial patterns of measured erosion controls and
simulated aeolian horizontal sediment flux and fluvial
sediment erosion were highly variable at the plot scale
(0.25 ha) within and among the five ecological sites. This
finding reflects differences in biophysical characteristics
of the study plots sampled in 2008 and 2009 which, given
their scale of variability (,1 ha), is feasibly assessable
for management. Our inability to identify a robust
pattern in aeolian horizontal sediment flux between the
ecological sites does not suggest that the site stratifica-
tion by ecological site is unimportant for wind and water
erosion studies. Rather, it reflects the absence of
information in our model assessments defining the soil
threshold friction velocity (u*t) characteristics of the
ecological sites (see Methods). Differences in u*t between
ecological sites will result in significant differences in
actual and relative sediment transport rates (Gillette
1999). Including u*t information in model assessments is
likely to produce more consistent patterns and a large
segregation of the susceptibility of ecological sites to
erosion over time. For example, the sandy ecological site
will typically have u*t ’25 cm/s while the loamy site may
have u*t ’200 cm/s, potentially dropping to ;25 cm/s
under heavy disturbance (Gillette et al. 1980). These
differences in soil threshold friction velocity would
strongly modify the apparent patterns in simulated
aeolian sediment flux among the ecological sites due to
vegetation cover and distribution. Differences in soil
properties among ecological sites will also influence their
relative sensitivities to land use and disturbance, which
differentially affect rates of aeolian sediment flux and
FIG. 7. Simulated effects of the threshold friction velocity(u*t) on aeolian horizontal sediment flux relative to the percentcover of bare ground at plots from all five ecological sitessampled without and with adjacent roadways in 2008 and 2009.
September 2014 1415MANAGING ACCELERATED SOIL EROSION
fluvial sediment erosion (Ravi et al. 2010, Field et al.
2011b). Developing reliable estimates of the threshold
friction velocity of soils will be critical for framing model
assessments of aeolian sediment flux in the context of
ecological sites and their states.
While patterns in erosion rates among ecological sites
could not be established with confidence, our results
demonstrate the potential effects of ecological state
change. Locations that were shrub encroached or shrub
dominated were consistently susceptible to both aeolian
sediment flux and fluvial sediment erosion. This result
supports previous observations that the degradation of
grasslands and their transition to shrub-dominated
states can increase their susceptibility to erosion (Ash
et al. 1994, Tongway and Ludwig 1996, Breshears et al.
2003, Chartier and Rostagno 2006, Okin et al. 2009).
Increases in aeolian sediment flux and fluvial sediment
erosion in degraded landscapes arise largely as a
consequence of changes in their functional and struc-
tural connectivity (Field et al. 2009). For example, an
increase in shrub density in rangelands is typically
associated with a reduction in grass cover, which creates
gaps between plants that are more susceptible to
wind- and water-driven sediment transport (Ravi et al.
2010). Feedbacks between the ecologically induced
vegetation change (e.g., management) and geomorphic
to compare aeolian sediment flux between ecological
sites, and is critical for such analyses. The development
of models to predict u*t should arguably be supported by
the development of reliable data on land use and
management intensities (e.g., stocking rates), which arerequired to quantify the magnitude of management
impacts on erosion. Land use itself is not always a goodindicator of disturbance impact in rangelands as it doesnot capture spatiotemporal variations in management
intensity or landscape responses to management ormanagement change. Finally, linking ecological site-
based assessments of soil erosion directly to state-and-transition models of ecological change may provide
additional opportunities to evaluate land use andclimate change impacts in rangelands and identify
options for their sustainable management.
ACKNOWLEDGMENTS
We are grateful to the Jornada field crew for their assistancein data collection and especially to Ericha Courtright and JustinVan Zee for coordination. We thank Greg Okin and MarkNearing for providing the soil erosion models WEMO andRHEM and advice on model application, and Darren James forassistance with the statistical analysis. This research was fundedby the Bureau of Land Management with support from theConservation Effects Assessment Project (Agricultural Re-search Service and Natural Resources Conservation Service).Any use of trade, product, or firm names is for descriptivepurposes only and does not imply endorsement by the U.S.Government.
LITERATURE CITED
Al-Hamdan, O., F. B. Pierson, M. A. Nearing, J. J. Stone, C. J.Williams, C. A. Moffet, P. R. Kormos, J. Boll, and M. A.Weltz. 2012. Characteristics of concentrated flow hydraulicsfor rangeland ecosystems: implications for hydrologic mod-eling. Earth Surface Processes and Landforms 37:157–168.
Ash, A. J., J. A. Bellamy, and T. G. H. Stockwell. 1994. Stateand transition models for rangelands. 4. Application of stateand transition models to rangelands in northern Australia.Tropical Grasslands 28:223–228.
Baddock, M. C., T. M. Zobeck, R. S. Van Pelt, and E. L.Fredrickson. 2011. Dust emissions from undisturbed anddisturbed, crusted playa surfaces: Cattle trampling effects.Aeolian Research 3:31–41.
Bartley, R., J. P. Corfield, B. N. Abbott, A. A. Hawdon, S. N.Wilkinson, and B. Nelson. 2010a. Impacts of improvedgrazing land management on sediment yields, Part 1:Hillslope processes. Journal of Hydrology 389:237–248.
Bartley, R., A. Hawdon, D. A. Post, and C. H. Roth. 2007. Asediment budget for a grazed semi-arid catchment in theBurdekin Basin, Australia. Geomorphology 87:302–321.
Bartley, R., S. N. Wilkinson, A. A. Hawdon, B. N. Abbott, andD. A. Post. 2010b. Impacts of improved grazing landmanagement on sediment yields. Part 2: Catchment response.Journal of Hydrology 389:249–259.
Belnap, J., S. L. Phillips, J. E. Herrick, and J. R. Johansen.2007. Wind erodibility of soils at Fort Irwin, California(Mojave Desert), USA, before and after trampling distur-bance: implications for land management. Earth SurfaceProcesses and Landforms 32:75–84.
Belnap, J., R. L. Reynolds, M. C. Reheis, S. L. Phillips, F. E.Urban, and H. L. Goldstein. 2009. Sediment losses and gainsacross a gradient of livestock grazing and plant invasion incool, semi-arid grassland, Colorado Plateau, USA. AeolianResearch 1:27–43.
Bestelmeyer, B. T., A. J. Tugel, G. L. Peacock, D. G. Robinett,P. L. Shaver, J. R. Brown, J. E. Herrick, H. Sanchez, andK. M. Havstad. 2009. State-and-transition models forheterogeneous landscapes: A strategy for development andapplication. Rangeland Ecology and Management 62:1–15.
NICHOLAS P. WEBB ET AL.1418 Ecological ApplicationsVol. 24, No. 6
Breshears, D. D., J. J. Whicker, M. P. Johansen, and J. E. PinerIII. 2003. Wind and water erosion and transport in semi-aridshrubland, grassland and forest ecosystems: quantifyingdominance of horizontal wind-driven transport. EarthSurface Processes and Landforms 28:1189–1209.
Chartier, M. P., and C. M. Rostagno. 2006. Soil erosionthresholds and alternative states in northeastern Patagonianrangelands. Rangeland Ecology and Management 59:616–624.
Duniway, M. C., B. T. Bestelmeyer, and A. Tugel. 2010. Soilprocesses and properties that distinguish ecological sites andstates. Rangelands 32:9–15.
Duniway, M. C., and J. E. Herrick. 2011. Disentangling roadnetwork impacts: the need for a holistic approach. Journal ofSoil and Water Conservation 66:31A–36A.
Duniway, M. C., and J. E. Herrick. 2013. Assessing impacts ofroads: application of a standard assessment protocol.Rangeland Ecology and Management 66:364–375.
Fernandez, C., J. Q. Wu, D. K. McCool, and C. O. Stockle.2003. Estimating water erosion and sediment yield with GIS,RUSLE, and SEDD. Journal of Soil and Water Conserva-tion 58:128–136.
Field, J. P., D. D. Breshears, and J. J. Whicker. 2009. Toward amore holistic perspective of soil erosion: Why aeolianresearch needs to explicitly consider fluvial processes andinteractions. Aeolian Research 1:9–17.
Field, J. P., D. D. Breshears, J. J. Whicker, and C. B. Zou.2011a. On the ratio of wind- to water-driven sedimenttransport: Conserving soil under global-change-type extremeevents. Journal of Soil and Water Conservation 66:51A–56A.
Field, J. P., D. D. Breshears, J. J. Whicker, and C. B. Zou.2011b. Interactive effects of grazing and burning onwind- and water-driven sediment fluxes: rangeland manage-ment implications. Ecological Applications 21:22–32.
Gillette, D. A. 1999. A qualitative geophysical explanation for‘‘Hot Spot’’ dust emitting source regions. Contributions toAtmospheric Physics 72:67–77.
Gillette, D. A., J. Adams, A. Endo, D. Smith, and R. Kihl.1980. Threshold velocities for input of soil particles into theair by desert soils. Journal of Geophysical Research 85:5621–5630.
Gillette, D. A., J. Adams, D. Muhs, and R. Kihl. 1982.Threshold friction velocities and rupture moduli for crusteddesert soils for the input of soil particles into the air. Journalof Geophysical Research 87:9003–9015.
Gillette, D. A., and R. Passi. 1988. Modeling dust emissioncaused by wind erosion. Journal of Geophysical Research 93(D11):14233–14242.
Ginoux, P., J. M. Prospero, T. E. Gill, N. C. Hsu, and M.Zhao. 2012. Global scale attribution of anthropogenic andnatural dust sources and their emission rates based onMODIS Deep Blue aerosol products. Journal of GeophysicalResearch 50:RG3005.
Goossens, D., and B. J. Buck. 2009. Dust dynamics in off-roadvehicle trails: Measurements on 16 arid soil types, Nevada,USA. Journal of Environmental Management 90:3458–3469.
Grantham, W. P., E. F. Redente, C. F. Bagley, and M. W.Paschke. 2001. Tracked vehicle impacts to vegetationstructure and soil erodibility. Journal of Range Management54:711–716.
Hernandez, M., M. A. Nearing, J. Stone, F. Pearson, H. Wei,K. Spaeth, P. Heilman, M. Weltz, and D. Goodrich. 2013.Application of a rangeland soil erosion model using NRIdata in southeastern Arizona. Journal of Soil and WaterConservation 68:512–525.
Herrick, J. E., J. W. Van Zee, K. M. Havstad, L. M. Burkett,and W. G. Whitford. 2005. Monitoring manual for grassland,shrubland and savanna ecosystems. Volume I. Quick start.USDA-ARS Jornada Experimental Range, Las Cruces, NewMexico, USA.
Hu, D., R. Ready, and A. Pagoulatos. 1997. Dynamic optimalmanagement of wind-erosive rangelands. American Journalof Agricultural Economics 79:327–340.
Klute, A., editor. 1986. Methods of soil analysis. Part 1.Physical and mineralogical methods. SSSA Book Series 5.American Society of Agronomy and Soil Science Society ofAmerica, Madison, Wisconsin, USA.
Lal, R. 1990. Soil erosion and land degradation: the globalrisks. Advances in Soil Science 11:129–172.
Lal, R. 2001. Soil degradation by erosion. Land Degradationand Rehabilitation 12:519–539.
Leys, J. F., and D. J. Eldridge. 1998. Influence of cryptogamiccrust disturbance to wind erosion on sand and loamrangeland soils. Earth Surface Processes and Landforms23:963–974.
Li, J., G. S. Okin, L. Alvarez, and H. Epstein. 2007.Quantitative effects of vegetation cover on wind erosionand soil nutrient loss in a desert grassland of southern NewMexico, USA. Biogeochemistry 85:317–332.
Li, J., G. S. Okin, J. E. Herrick, J. Belnap, M. E. Miller, K.Vest, and A. E. Draut. 2013. Evaluation of a new model ofaeolian transport in the presence of vegetation. Journal ofGeophysical Research: Earth Surface 118:1–19.
Ludwig, J. A., G. N. Bastin, V. H. Chewings, R. W. Eager, andA. C. Liedloff. 2007. Leakiness: a new index for monitoringthe health of arid and semiarid landscapes using remotelysensed vegetation cover and elevation data. EcologicalIndicators 7:442–454.
Marticorena, B., and G. Bergametti. 1995. Modeling theatmospheric dust cycle: 1. Design of a soil-derived dustemission scheme. Journal of Geophysical Research100:16415–16430.
McClaran, M. P., and T. R. Van Devender. 1997. The desertgrassland. University of Arizona Press, Tucson, Arizona,USA.
Miller, M. E., R. T. Belote, M. A. Bowker, and S. L. Garman.2011. Alternative states of a semiarid grassland ecosystem:implications for ecosystem services. Ecosphere 2:55.
Munson, S. M., J. Belnap, and G. S. Okin. 2011. Responses ofwind erosion to climate-induced vegetation changes on theColorado Plateau. Proceedings of the National Academy ofSciences USA 108:3854–3859.
Nearing, M. A., H. Wei, J. J. Stone, F. B. Pierson, K. E.Spaeth, M. A. Weltz, D. C. Flanagan, and M. Hernandez.2011. A rangeland hydrology and erosion model. Transac-tions of the ASABE 54:1–8.
Neff, J. C., A. P. Ballantyne, G. L. Farmer, N. M. Mahowald,J. L. Conroy, C. C. Landry, J. T. Overpeck, T. H. Painter,C. R. Lawrence, and R. L. Reynolds. 2008. Increasing eoliandust deposition in the western United States linked to humanactivity. Nature Geoscience 1:189–195.
Neff, J. C., R. L. Reynolds, J. Belnap, and P. Lamothe. 2005.Multi-decadal impacts of grazing on soil physical andbiogeochemical properties in southeast Utah. EcologicalApplications 15:87–95.
Nicks, A. D., L. J. Land, and G. A. Gander. 1995. Weathergenerator. Pages 2.1–2.22 in D. C. Flanagan and M. A.Nearing, editors. Water erosion prediction project: hillslopeprofile and watershed model documentation. NSERL ReportNumber 10. USDA-ARS National Soil Erosion ResearchLaboratory, West Lafayette, Indiana, USA.
Ogle, K., and J. F. Reynolds. 2004. Plant responses toprecipitation in desert ecosystems: integrating functionaltypes, pulses, thresholds, and delays. Oecologia 141:282–294.
Okin, G. S. 2008. A new model of wind erosion in the presenceof vegetation. Journal of Geophysical Research 113:F02S10.
Okin, G. S., D. A. Gillette, and J. E. Herrick. 2006. Multi-scalecontrols on and consequences of aeolian processes inlandscape change in arid and semi-arid environments.Journal of Arid Environments 65:253–275.
September 2014 1419MANAGING ACCELERATED SOIL EROSION
Okin, G. S., A. J. Parsons, J. Wainwright, J. E. Herrick, B. T.Bestelmeter, D. C. Peters, and E. L. Fredrickson. 2009. Dochanges in connectivity explain desertification? BioScience59:237–244.
Pennington, D. D., and S. L. Collins. 2007. Response of anaridland ecosystem to interannual climate variability andprolonged drought. Landscape Ecology 22:897–910.
Raupach, M. R., D. A. Gillette, and J. F. Leys. 1993. The effectof roughness elements on wind erosion threshold. Journal ofGeophysical Research 98:3023–3029.
Raupach, M. R., and H. Lu. 2004. Representation of land-surface processes in aeolian transport models. EnvironmentalModelling and Software 19:93–112.
Ravi, S., D. D. Breshears, T. E. Huxman, and P. D’Odorico.2010. Land degradation in drylands: Interactions amonghydrologic-aeolian erosion and vegetation dynamics. Geo-morphology 116:236–245.
SAS Institute. 2009. SAS software version 9.3. SAS Institute,Cary, North Carolina, USA.
Scanlon, T. M., K. K. Caylor, S. Manfreda, S. A. Levin, and I.Rodriguez-Iturbe. 2005. Dynamic response of grass cover torainfall variability: implications for the function and persis-tence of savanna ecosystems. Advances in Water Resources28:291–302.
Shao, Y., M. R. Raupach, and J. F. Leys. 1996. A model forpredicting aeolian sand drift and dust entrainment on scalesfrom paddock to region. Australian Journal of Soil Research34:309–342.
Simanton, J. R., M. A. Weltz, and H. D. Larsen. 1991.Rangeland experiments to parameterize the water erosionprediction project model: vegetation canopy cover effects.Journal of Range Management 44:276–282.
Spaeth, K. E., F. B. Pierson, M. A. Weltz, and W. H.Blackburn. 2003. Evaluation of USLE and RUSLE estimat-ed soil loss on rangeland. Journal of Range Management56:234–246.
Throop, H. L., L. G. Reichmann, O. E. Sala, and S. R. Archer.2012. Response of dominant grass and shrub species to watermanipulation: an ecophysiological basis for shrub invasion ina Chihuahuan Desert grassland. Oecologia 169:373–383.
Toevs, G. R., J. K. Karl, J. J. Taylor, C. S. Spurrier, M. Karl,M. R. Bobo, and J. E. Herrick. 2011. Consistent indicators
and methods and a scalable sampling design to meetassessment, inventory, and monitoring information needsacross scales. Rangelands 33:6–13.
Tongway, D. J., and J. A. Ludwig. 1996. Rehabilitation ofsemiarid landscapes in Australia. II. Restoring productivesoil patches. Restoration Ecology 4:388–397.
Vachta, E. G., and J. Hutchinson. 1990. Pilot and expandedfield testing of the erosion control management plan (ECMP)for the Army training lands: lessons learned. USACERLTechnical Report N-91/04. U.S. Army Corps of Engineers,Champaign, Illinois, USA.
van de Koppel, J., M. Rietkerk, and F. J. Weissing. 1997.Catastrophic vegetation shifts and soil degradation interrestrial grazing systems. Trends in Ecology and Evolution12:352–356.
van Donk, S. J., X. Huang, E. L. Skidmore, A. B. Anderson,D. L. Gebhart, V. E. Prehoda, and E. M. Kellogg. 2003.Wind erosion from military training lands in the MojaveDesert, California, USA. Journal of Arid Environments54:687–703.
Visser, S. M., G. Sterk, and O. Ribolzi. 2004. Techniques forsimultaneous quantification of wind and water erosion insemi-arid regions. Journal of Arid Environments 59:699–717.
Wang, G., G. Gertner, A. B. Anderson, H. Howard, D.Gebhart, D. Althoff, T. Davis, and P. Woodford. 2007.Spatial variability and temporal dynamics analysis of soilerosion due to military land use activities: uncertainty andimplications for land management. Land Degradation andDevelopment 18:519–542.
Webb, N. P., and H. A. McGowan. 2009. Approaches tomodelling land erodibility by wind. Progress in PhysicalGeography 33:587–613.
Webb, N. P., and C. L. Strong. 2011. Soil erodibility dynamicsand its representation in wind erosion and dust emissionmodels. Aeolian Research 3:165–180.
Weltz, M. A., M. R. Kidwell, and H. D. Fox. 1998. Influence ofabiotic and biotic factors in measuring and modeling soilerosion on rangelands: state of knowledge. Journal of RangeManagement 51:482–495.
Westoby, M., B. Walker, and I. Noy-Meir. 1989. Opportunisticmanagement for rangelands not at equilibrium. Journal ofRange Management 42:266–274.
SUPPLEMENTAL MATERIAL
Appendix
Ecological site types used for stratification of the study area plots, listing the ecological site names and numbers associated witheach group (Ecological Archives A024-084-A1).
NICHOLAS P. WEBB ET AL.1420 Ecological ApplicationsVol. 24, No. 6