Page 1
ECOLOGY AND CONSERVATION OF NEOTROPICAL-NEARCTIC MIGRATORY
BIRDS AND MIXED-SPECIES FLOCKS IN THE ANDES
DISSERTATION
Presented in Partial Fulfillment of the Requirements for the
Degree Doctor of Philosophy in the Graduate
School of The Ohio State University
By
Gabriel J. Colorado, M.S.
Environmental and Natural Resources Graduate Program
The Ohio State University
2011
Dissertation Committee:
Professor Amanda D. Rodewald, Adviser
Professor Elizabeth Marschall
Professor Paul Rodewald
Page 2
Copyright by
Gabriel J. Colorado
2011
Page 3
ii
ABSTRACT
The tropical Andes are widely recognized as one of the world´s great centers of
biodiversity. High levels of both species richness and endemism coupled with one of the
greatest rates of deforestation among tropical forests have made the Andes a major focal
point of international conservation concern. In the face of current and projected rates of
deforestation and habitat degradation of Andean forests, persistent large gaps in our
understanding of ecological responses to anthropogenic disturbances limit our ability to
effectively conserve biodiversity in the region. My dissertation focused on ecology and
conservation of two poorly known components of Andean forest bird communities,
mixed-species flocks and overwintering Neotropical-Nearctic migratory birds.
Specifically, I (1) examined assembly patterns of mixed-species avian flocks, (2)
evaluated the sensitivity of mixed-species flocks and Neotropical-Nearctic migratory
birds to deforestation and structural changes in habitat, and (3) identified potential
physiological consequences of both using shade coffee and flocking to wintering
Neotropical-Neartic migratory birds.
To achieve this, I evaluated richness and abundance patterns of the community of
wintering Neotropical-Nearctic migratory birds and resident mixed-species flocks across
a broad geographical area (approximately 200,000 km2) of Northern and Central Andes,
ranging from northwestern Venezuela in the Mérida Cordillera (± 10 o S, 70 o W) to
northern Peru’s Cóndor Cordillera (± 5 o S, 78 o W), and including the Eastern, Central
Page 4
iii
and Western Colombian Cordilleras. From October-March 2007-2010, I surveyed bird
communities and measured habitat characteristics within 84 study sites representing a
range of altitudes, from tropical lowlands at 400 m to low-montane tropical forest at
2,600 m. I examined patterns of non-randomness in Andean mixed-species flocks using
three assembly models: (a) co-occurrence patterns (b) guild proportionality and (c)
constant body-size ratios applied to data on 221 species of resident and Neotropical
migrant birds participating in 311 mixed-species flocks in Venezuela, Colombia,
Ecuador, and Peru. By applying null model analysis to regional presence-absence
matrices of flocking species, I found evidence of assembly patterns for mixed-species
flocks in the Andes suggesting that competitive interactions at both interspecific and
inter-guild levels played important roles in structuring flock social systems in the Andes.
Flock structure seemed less related to morphological (i.e., body size ratios) than to
behavioral attributes, such as foraging behavior, as evidenced by the fact that foraging
guilds (i.e., insectivore, omnivore, nectivore, frugivore) remained relatively proportional
across flocks.
To examine sensitivity of montane forest birds to environmental heterogeneity, I
used an information-theoretic approach to study the association of landscape-scale (i.e.
percentage of forest cover in 1-km2 pixels) and micro-habitat level (i.e. habitat
complexity) on richness and abundance patterns of Neotropical migrants and mixed-
species flocks. I conducted systematic avian surveys within five broadly-defined habitat
types (shade coffee, pastures with isolated trees, successional, secondary forest and
mature forest) at 84 sites distributed from Colombia to Peru based on a stratified-random
design. Distance-based line transect surveys (n = 3 per site) were used to quantify
Page 5
iv
patterns of species richness and abundance of Neotropical migrants and mixed-species
flocks. I found that patterns in flock and migrant attributes were well explained by
environmental heterogeneity at multiple spatial scales, though habitat-specific
associations depended upon landscape context. The strength of the association between
regional forest cover and Neotropical migrants was habitat-dependent, and forest cover
was most strongly positively related to flocks within shade coffee. Increasing levels of
habitat complexity had mixed relationships with flock attributes. Whereas complexity
was positively associated with abundance and diversity in successional and silvopastoral
habitats, the opposite pattern was true in shade coffee and secondary forests. Overall, this
research showed that (a) Neotropical migrants and mixed-species flocks were influenced
by environmental factors operating across multiple spatial scales, (b) the importance of
particular environmental attributes changed with landscape context and habitat type, and
(c) intensively managed habitats with overstory trees contributed to avian conservation
by supporting both Neotropical migratory birds and mixed-species flocks.
In my final chapter, I explored the suitability of shaded monocultures for
overwintering Neotropical-Nearctic migratory birds by examining body condition
changes. Because Neotropical-Nearctic migrants frequently join mixed-species flocks
during the nonbreeding season, I also evaluated the extent to which body condition
changed with flocking behavior. I mist-netted 8 species of Neotropical-Nearctic migrants
in shade coffee farms in the Colombian Andes in October-April 2008-2009 and 2009-
2010 and identified individuals as either solitary foragers or flock members. Several
common migratory species, including Cerulean Warbler, Blackburnian Warbler and
Tennessee Warbler, improved their body condition over the course of each day and
Page 6
v
throughout the nonbreeding season. However, neither body condition nor seasonal
change in body condition differed between flocking and solitary individuals for most of
the migratory species evaluated. Cerulean and Blackburnian Warblers showed stronger
improvements in condition when foraging solitary than in flocks. Because birds improved
condition in shade coffee, results also provided additional evidence that agroforestry
systems can provide suitable overwinter habitat to several common Neotropical migrants,
including species of conservation concern such as Cerulean Warbler.
Overall, my dissertation demonstrates that mixed-species flocks and Neotropical
migratory birds are widespread and common components of montane forest avifauna
throughout the tropical Andes. Patterns of community assembly suggest that flocks are
not random associations of species, but rather are structured at least partly in response to
competitive pressures. However, the demonstrated sensitivity of flocks and migratory
birds to landscape and local habitat changes suggests that continued patterns and rates of
land cover change might disrupt the unique social system of mixed-species flocks as well
as suitability of Andean forests for overwintering migratory birds. Fortunately, my
research provides evidence that certain management systems, such as shade coffee and
silvopasture, have the potential to support abundant and diverse migrants and flocks.
Regional conservation efforts should further explore how agroforestry systems can be
used to meet both ecological and social needs in human-dominated landscapes of the
Andes.
Page 7
vi
DEDICATION
A Luciana. Eres el ser más hermoso que he visto en mi vida. Tu existencia cambió la mía,
y llena mi corazón.
A Yira. Pudiste haber llegado antes o pudiste haber llegado después, pero llegaste en el
momento indicado.
A Robinson. Lo siento mucho por mi incapacidad de haber hecho lo correcto. Estás
siempre ahí.
A Alberto. He pasado mucho tiempo tratando de encontrarte. Lo curioso, siempre estás
ahí, en mi personalidad, en mis acciones y en mi forma de pensar.
A Gloria. El tiempo no nos ayudó, pero te recuerdo tan fuerte como puedo.
A Carlos. Me alegra que estés de regreso. Te extrañé mucho.
A Eugenia. Todas mis acciones tienen una parte de ti, y soy la continuación de tus
pensamientos y deseos. Tu amor por la naturaleza está inevitablemente en mí.
Page 8
vii
ACKNOWLEDGMENTS
I would like to express my gratitude to my advisor, Amanda D. Rodewald, for her
continued support and orientation during the process of this research. We had really
productive and enlightening conversations, here in the United States and in many other
places. I appreciate her optimism and enthusiasm as well as her interest for ecology and
conservation. Thanks for being so patient with me, in particular with my writing in a
foreign language. I would like to thank Professors Elizabeth Marschall and Paul
Rodewald for serving as members of my committee and for their invaluable suggestions
and comments throughout my study. I also would like to thank my colleagues from the
Terrestrial Wildlife Ecology Lab for advice, support and, particularly, enjoyable “happy”
hours. My study would not have been a reality without the funding support by USDA
Forest Service International Programs, National Council for Air and Stream
Improvement, National Fish and Wildlife Foundation, The Nature Conservancy, The
Corporación Autónoma Regional del Centro de Antioquia and The School of
Environment and Natural Resources from The Ohio State University. Special
acknowledgment to incredible field crews, who constantly demonstrated that the
impossible was possible and that we could beat the maldición cerulea: in Venezuela, I am
grateful with J. Miranda, D. muñoz, C. Tosta and C. Valeris; in Colombia, I am grateful
to E. Agudelo, C. Alcázar, H. Arias, F. Ayerbe, J. Botero, G. Buitrago, S. David, J. Díaz,
C. Estrada, A. Fernandez, P. Florez, S. Galeano, C. Gomez, A. Gonzalez, L. Gomez, A.
Page 9
viii
Henao, E. Lara, C. Londoño, L. Londoño, J. López, L. Rubio, M. Martínez, C. Mazo, E.
Munera, J. Muñoz, D. Ocampo, A. Pizarro, P. Pulgarín, Y. Sanabria, Y. Sepulveda, G.
Suarez, and M. Sepulveda; in Ecuador, to Esteban Guevara and his crew from Aves &
Conservacion; in Peru, to Wily Palomino from ECOAN, Gerardo Medina from the
Rainforest Alliance, the Santos brothers and to Pablo Bazan-Jempekit; finally, from
United States, Ian Ausprey, Jay Carlisle and Felicity Newell. Thank you all for the hard
work, and for being part of such a challenging project. Without your effort and positive
attitude, this could not have been done. I also would like to thank Paul Hamel, D.
Mehlman and Carol Lively. Thank you for inviting me to be part of El Grupo Ceruleo,
and for trusting me to carry out this unforgettable adventure. I enjoyed our long
conversations and your sincere interest in conservation. I would like to thank my family,
Eugenia, Carlos and Luciana. Thanks for their love and for being so supportive and for
staying there, no matter what. Thanks for accepting me the way I am, and for accepting
that I was not there to be a good son, a good brother and a good uncle. I finally want to
thank Yira Sepulveda for understanding me and being there for me with her
unconditional affection.
Page 10
ix
VITA
2008–present……………Graduate Associate, School of Environment and Natural
Resources, The Ohio State University
2003-present…………….Field Coordinator, Cerulean Warbler Research in wintering
grounds.
2006……………………..M.S. Forests and Environmental Conservation, Universidad Nacional de Colombia, Medellín, Colombia.
2003……………………. B.S. Forestry Engineering, Universidad Nacional de Colombia,
Medellín, Colombia.
2003……………………..Biological Technician, Idaho Bird Observatory, ID.
1999……………………..Intern, Hawk Mountain Sanctuary, PA.
PUBLICATIONS
Colorado G. 2010. Fall migration of Empidonax Flycatchers in Northwestern Colombia. Journal of Field Ornithology 81(3):259–266.
Colorado G., Hamel P., Rodewald A. and W. Thogmartin. 2008. El grupo cerúleo: collaboration to assess nonbreeding range of cerulean warbler in south America. Ornitologia Neotropical (suppl.) 19: 521-529.
Barker, S., Benítez, S., Baldy, J., Cisneros Heredia, D., Colorado Zuluaga, G., Cuesta, F., Davidson, I., Díaz, D., Ganzenmueller, A., García, S., Girvan, M. K., Guevara, E., Hamel, P., Hennessey, A. B., Hernández, O. L., Herzog, S., Mehlman, D., Moreno, M. I., Ozdenerol, E., Ramoni-Perazzi, P., Romero, M., Romo, D., Salaman, P., Santander, T., Tovar, C., Welton, M., Will, T., Pedraza, C., Galindo, G. 2007. Modeling the South American Range of Cerulean Warbler. ESRI conference paper. http://gis.esri.com/library/userconf/proc06/papers/pap_1656.pdf
Sierra C.A., del Valle J.I., Orrego S.A., Moreno F.H., Harmon M.E., Zapata M., Colorado G.J., Herrera M.A., Lara W., Restrepo D.E., Berrouet L.M., Loaiza L.M. and Benjumea J.F.2007. Total carbon stocks in a tropical forest landscape of the Porce region, Colombia. Forest Ecology and Management, 243 (2-3):299-309.
Page 11
x
FIELDS OF STUDY
Major Field: Natural Resources
Page 12
xi
TABLE OF CONTENTS
ABSTRACT……………………………………………………………………………....ii
DEDICATION…………………………………………………………………................vi
ACKNOWLEDGMENTS……………………………………………………………….vii
VITA………………………………………………………………...................................ix
LIST OF TABLES………………………………………………………………….......xiii
LIST OF FIGURES……………………………………………………………………xviii
1 INTRODUCTION…………………………………………………………………......1
Objectives and Chapter Overview………………………………………………... 4
2 ASSEMBLY PATTERNS OF MIXED-SPECIES AVIAN FLOCKS IN THE ANDES ……………………………………………………………………................................6
Introduction………………………………………………………………….......... 7
Study area and methods…………………………………………………………. 11
Results…………………………………………………………………................ 17
Discussion………………………………………………………………….......... 20
Literature Cited………………………………………………………………….. 24
3 MULTISCALE INFLUENCE OF DEFORESTATION AND HABITAT ALTERATION ON NEOTROPICAL-NEARCTIC MIGRATORY BIRDS AND MIXED-SPECIES FLOCKS IN THE ANDES…………………………………………. 45
Introduction…………………………………………………………………........ 46
Study area and methods…………………………………………………………. 49
Results…………………………………………………………………................ 57
Discussion………………………………………………………………….......... 62
Literature cited…………………………………………………………………... 71
4 PATTERNS OF MASS CHANGE IN WINTERING NEOTROPICAL-NEARCTIC MIGRATORY BIRDS IN SHADED MONOCULTURES IN THE ANDES………… 115
Introduction…………………………………………………………………...... 116
Study area and methods………………………………………………………... 118
Results………………………………………………………………….............. 123
Page 13
xii
Discussion…………………………………………………………………........ 125
Literature cited…………………………………………………………………. 131
5 BIBLIOGRAPHY………………………………………………………...………... 156
APPENDICES…………………………………………………………………............. 189
Appendix A. Field design for Neotropical-Nearctic migratory birds and mixed-species flocks surveys in the Northern and Central Andes…………………….. 189
Appendix B. Presence-absence matrix built from the species pool of flocking species in the locality of Aguachica, Eastern Andes, Colombia………………..191
Appendix C. Percentage of species per guild in 311 mixed-species bird flocks recorded in 13 regions in the Andes. 2007-2010………………………………. 194
Appendix D. Bird species and families recorded in 311 mixed-species flocks in the Andes, 2007-2010………………………………………………………….. 207
Appendix E. Characteristics of 84 1-km2 pixels surveyed in 11 different regions in the Andes in Colombia, Ecuador and Peru. Wintering seasons 2007-2010….... 218
Appendix F. Neotropical-Nearctic migratory birds and mixed-species flocks attributes recorded in 1-km2 pixels (84 and 39 pixels, respectively) in 11 different regions in the Andes in Colombia, Ecuador and Peru. Wintering seasons 2007-2010……………………………………………………………………………..225
Appendix G. Coefficients of top-ranked regression models relating flock richness and abundance attributes and environmental variables in the Andes. Statistics include model estimates, the standard errors (SE) and t-statistic. Analysis based on 39 1-km2 pixels……………………………………………………………... 232
Appendix H. Coefficients of top-ranked regression models (ΔAICc < 2) relating Neotropical migrant attributes and environmental variables in the Andes. Statistics include model estimates, the standard errors (SE), t for estimate and P value……………………………………………………………………………. 238
Appendix I. Occurrence of Neotropical-Nearctic migrant land birds in 84 1-km2 pixels surveyed in 11 different regions in the Andes in Colombia, Ecuador and Peru. Wintering seasons 2007-2010………………………………………….... 240
Appendix J. Relationship of body condition and sex, age, body molt and season for Neotropical-Nearctic migratory bird species in shaded monocultures in Southwestern Antioquia department, Colombia, 2008-2010. *P < 0.05 and **P < 0.01……………………………………………………………………………...246
Page 14
xiii
LIST OF TABLES
Table 2.1. Site characteristics for 12 different regions on the Colombian, Ecuadorian and
Peruvian Andes where mixed-species flocks were recorded,October-March, 2007-2010.
Values are mean ± SD. ...................................................................................................... 34
Table 2.2. Mean number of species and individuals recorded in 311 flocks in 12 regions
in the Northern and Central Andes, October-March, 2007-2010. Values are mean ± SD.
........................................................................................................................................... 35
Table 2.3. Number of bird species per family found in 311 mixed-species flocks recorded
in the Northern and Central Andes, October-March, 2007-2010. .................................... 36
Table 2.3 (continued) ........................................................................................................ 37
Table 2.4. Percentage of most common bird species assisting mixed-species flocks in the
Northern and Central Andes. Species present in 10% or more of flocks are listed. Mean
abundance calculated for those flocks with the species present. Asterisk denotes
Neotropical-Nearctic migratory birds. .............................................................................. 38
Table 2.4 (continued) ........................................................................................................ 39
Table 2.5. Result of three co-occurrence indices, C-score, number of species
combinations and checkerboard pairs, and the null model analysis for 11 sites in the
Andes. Expected score generated using the Knight’s Tour Algorithm. Fixed-fixed null
Page 15
xiv
model (SIM9 in Gotelli 2000). P < 0.05*, P < 0.01**. Two localities, Chicamocha and
Tolima, were excluded due to small sample size (< 3 flocks). ......................................... 40
Table 2.6. Number of flocks that showed significant differences (P < 0.05) in the
minimum size ratios and the variance of size ratios when compared with randomly
generated flocks. After conducting the binomial test for greater minimum size ratios and
less variance of size ratios, no significant differences were found. Two localities,
Chicamocha and Tolima, were excluded due to small sample size (< 3 flocks). ............. 41
Table 3.1. Site characteristics for 11 different landscapes on the Colombian, Ecuadorian
and Peruvian Andes. Values presented are mean ± SD. ................................................... 84
Table 3.2. Pearson’s correlations for 6 structural variables derived from 487 vegetation
plots in 11 regions in the Andes. *P < 0.05; **P < 0.01. .................................................. 85
Table 3.3. Set of candidate models to test for relationships between flocks and migrants
attributes and environmental effects. K represents number of parameters to be estimated.
........................................................................................................................................... 86
Table 3.4.Correlation of habitat variables with derived Principal Components Analysis
scores, eigenvalue and cumulative variance explained in 11 regions in the Northern and
Central Andes. *P < 0.05; **P < 0.01. ............................................................................. 87
Table 3.5. Fifteen most common bird species in 186 mixed-species flocks in the Andes.
The metric represents the percentage of flocks that included the listed species. .............. 88
Table 3.6. Summary statistics for MRPP results of comparisons of average within-group
distance of mixed-species flocks across five different habitats in the Andes. T represents
the test statistic describing the separation between habitats (the more negative, the
Page 16
xv
stronger the separation); P represents the probability of the expected delta (the weighted
mean within-group distance) calculated for all possible partitions of the data being as
small or smaller than the observed delta; and A represents the chance-corrected within
group agreement describing the within-group homogeneity as compared to random
expectation (e.g. A = 0 when heterogeneity within groups equals expectation by chance;
MacCune and Grace 2002). .............................................................................................. 89
Table 3.7. Regression models to relate flock attributes and environmental variables.
Model selection was based on biased-adjusted Akaike’s Information Criterion (AICc).
Statistics include the number of estimated parameters (K), the second-order Akaike
Information Criterion (AICc), AIC differences (ΔAICc), and Akaike weights (wi).
Models are listed in descending order of wi. Models with ΔAICc < 2 are listed.............. 90
Table 3.8. Regression models relating environmental variables and richness and
abundance of Neotropical migrants detected on transects. Model selection was based on
biased-adjusted Akaike’s Information Criterion (AICc). Statistics include the number of
estimated parameters (K), the second-order Akaike information Criterion (AICc), AIC
differences (ΔAICc), and Akaike weights (wi). Models are listed in descending order of
wi. Only models with ΔAICc < 2 are listed. ..................................................................... 91
Table 3.9. Summary of main relationships of forest cover and habitat complexity on
flocks and Neotropical migrant attributes in different habitat types. ................................ 92
Table 4.1. First captured individuals and mean weight of 8 Neotropical migratory species
in shaded monocultures over two winter seasons in southwestern Antioquia, Colombia,
2008-2010. Values are mean ± standard deviation. ........................................................ 143
Page 17
xvi
Table 4.2. Body condition for Neotropical-Neartic migratory birds captured in flocks and
solitary in shaded monocultures in southwestern Antioquia Department, Colombia, 2008-
2010. Values are mean ± SE. Values in parenthesis are sample sizes. ........................... 144
Table 4.3. Result of ANOVA test for differences in body frame (PC1) between
Neotropical-Nearctic migratory birds captured in flocks and solitary in shaded
monocultures in southwestern Antioquia department, Colombia, 2008-2010. Values are
mean ± SE. Values in parenthesis are sample sizes. ....................................................... 145
Table 4.4. Regression models to relate body condition and (1) time of day and (2) day of
season for Neotropical-Neartic migratory bird species in shaded monocultures in
southwestern Antioquia department, Colombia, 2008-2010. ......................................... 146
Table 4.5. Coefficients (± SE) of regression models to evaluate the relationship between
daily changes in body condition and flocking behavior in Neotropical-Neartic migratory
birds in shaded monocultures in Southwestern Antioquia department, Colombia. 2008-
2010. Interaction term represents status x Time of day. P < 0.01*, P < 0.05**, 0.05 < P <
0.1***.............................................................................................................................. 147
Table 4.6. Mean body condition for eight Neotropical-Nearctic migratory bird species in
relation to their social status, segregated by sex, age and season in shaded monocultures
in southwestern Antioquia department, Colombia, 2008-2010. Values are mean ± SD.
Sample size in parenthesis. * P < 0.05. .......................................................................... 148
Table 4.7. Coefficients (± SE) of regression models to evaluate the relationship between
seasonal changes in body condition and flocking behavior in Neotropical-Neartic
migratory birds in shaded monocultures in Southwestern Antioquia department,
Page 18
xvii
Colombia. Interaction term represents status x Day of season. P < 0.01*, P < 0.05**, 0.05
< P < 0.1***. ***. Empidonax Flycatchers were excluded from this analysis for lack of
individuals caught in flocks later in the season. ............................................................. 149
Table 4.8.F-test for comparison of standard deviations of body condition between flock
and solitary individuals for Neotropical-Nearctic migratory birds in shaded monocultures
in Southwestern Antioquia department, Colombia. ........................................................ 150
Page 19
xviii
LIST OF FIGURES
Figure 2.1.Relative proportion of flocking species in Andean flocks represented by each
foraging guild. Lines were constructed by regressing relative abundance vs. log flock size
(following Feeley 2003; for an example, see Appendix C). a. Carache; b. Aguachica; c.
San Jose de la Montana; d. Yariguies. .............................................................................. 42
Figure 2.1.(Continued). e. Abejorral; f. Paya; g. Cauca; h. Sangay National Park. ......... 43
Figure 2.1.(Continued). i. Cajamarca; j. Pacora; k. Southwestern Antioquia; l. All
localities together. ............................................................................................................. 44
Figure 3.1. Five habitat types identified during surveys in the Andes. From the top left to
the bottom, clockwise: mature forest, secondary forest, shade coffee, pastures with
isolated trees and successional. ......................................................................................... 93
Figure 3.2. Eleven surveyed locations in the Northern and Central Andes. Numbers
represent 1-km2 pixel sites visited within each region. From north to south: Aguachica,
San José de la Montaña, Yariguies, Chicamocha, Abejorral, Paya, Ibague, Rosas, Patia,
Sangay National Park and Chingozales. ........................................................................... 94
Figure 3.3. Example of field sampling design for allocating 100 m line transects within 1-
km2 pixels to survey bird fauna and to locate temporary vegetation plots in the Andes. . 95
Figure 3.4. Ordination of habitat features for 11 regions in the Northern and Central
Andes based on habitat factors. Data labels refer to percentage of forest cover per region.
Page 20
xix
PC1 reflected increasing habitat complexity (e.g., density of woody plants, canopy height
and cover, basal area, ground cover), and PC2 was positively correlated with percentage
of ground cover. ................................................................................................................ 96
Figure 3.5. Percent forest cover within 1-km2 pixels differed among five habitat types in
the Andes, 2007-2010. Different letters indicate significant differences among habitats
using α = 0.05. ................................................................................................................. 97
Figure 3.6. Relationship between structural complexity of the habitat and percentage of
forest cover obtained for 84 1-km2 pixels in the Andes. ................................................... 98
Figure 3.7. Species richness of Neotropical-Nearctic migrants increased with flock
richness and flock encounter rate (i.e. Number of flocks encountered per hour of survey).
Lineal models were constructed accounting for flock size. .............................................. 99
Figure 3.8. Geographic distribution of Neotropical-Nearctic migrants in the Andes along
elevation and latitude gradients. ..................................................................................... 100
Figure 3.9. Sample-based smoothed accumulation curves of species in mixed-species
flocks among five habitats. Arrow indicates maximum rarefaction point in the number of
individuals achieved for all the habitats. ......................................................................... 102
Figure 3.10. Sample-based smoothed accumulation curves of Neotropical-Nearctic
migrant species assisting mixed-species flocks among five habitats. Arrow indicates
maximum rarefaction point in the number of individuals achieved for all the habitats. 103
Figure 3.11. NMS ordination joint plot of sample scores (i.e. mixed-species flocks) in
species space on the first and third NMS axes for the two most contrasting habitats, shade
coffee (open circles) and mature forest (crosses). .......................................................... 104
Page 21
xx
Figure 3.12. Relationship between flock species richness and increasing percentage of
forest cover within 1-km2 pixels in the Andes, 2007-2010. Graphs constructed using top-
ranked models simulating a gradient of forest cover. Dotted lines along major line
represent standard errors for the predictions. .................................................................. 105
Figure 3.13. Relationship between flock size and increasing percentage of forest cover
within 1-km2 pixels in the Andes, 2007-2010. Graphs constructed using top-ranked
models simulating a gradient of forest cover. Dotted lines along major line represent
standard errors for the predictions. ................................................................................. 106
Figure 3.14. Relationship between flock encounter rate per hour and increasing
percentage of forest cover within 1-km2 pixels in the Andes, 2007-2010. Graphs
constructed using top-ranked models simulating a gradient of forest cover. Dotted lines
along major line represent standard errors for the predictions. ...................................... 107
Figure 3.15. Relationship between richness of flocks and habitat structure in the Andes,
2007-2010. Graphs constructed using top-ranked models simulating a gradient of habitat
complexity. Dotted lines along major line represent SE for the predictions. Gray line:
high regional forest cover (61.9%). Blue line: low regional forest cover (19.6%). ........ 108
Figure 3.16. Relationship between flock size and habitat structure in the Andes, 2007-
2010. Graphs constructed using top-ranked models simulating a gradient of habitat
complexity. Dotted lines along major line represent SE for the predictions. Gray line:
high regional forest cover (61.9%). Blue line: low regional forest cover (19.6%). ........ 109
Figure 3.17. Relationship between flock encounter rate per hour and habitat structure in
the Andes, 2007-2010. Graphs constructed using top-ranked models simulating a gradient
Page 22
xxi
of habitat complexity. Dotted lines along major line represent standard errors for the
predictions. Dotted lines along major line represent SE for the predictions. Gray line:
high regional forest cover (61.9%). Blue line: low regional forest cover (19.6%). ........ 110
Figure 3.18. Association between richness of Neotropical migrant birds recorded on
distance-based line transects and percentage of forest cover within 1-km2 pixels in the
Andes. Graphs constructed using top-ranked models simulating a gradient of forest cover.
Dotted lines along major line represent standard errors for the predictions. .................. 111
Figure 3.19. Association between abundance of Neotropical migrant birds recorded on
distance-based line transects and percentage of forest cover within 1-km2 pixels in the
Andes. Graphs constructed using top-ranked models simulating a gradient of forest cover.
Dotted lines along major line represent standard errors for the predictions ................... 112
Figure 3.20. Association between richness of Neotropical migrant birds and local habitat
structure in the Andes. Graphs constructed using top-ranked models simulating a gradient
of habitat structure. Dotted lines along major line represent standard errors for the
predictions. Dotted lines along major line represent SE for the predictions. Gray line:
high regional forest cover (63.8%). Blue line: low regional forest cover (17.8%). ........ 113
Figure 3.21. Association between abundance of Neotropical migrant birds and local
habitat structure in the Andes. Graphs constructed using top-ranked models simulating a
gradient of habitat structure. Dotted lines along major line represent standard errors for
the predictions. Dotted lines along major line represent SE for the predictions. . Gray
line: high regional forest cover (63.8%). Blue line: low regional forest cover (17.8%). 114
Page 23
xxii
Figure 4.1.Banding stations in Southwestern Antioquia department, Colombia. 1.
Gualanday farm, Fredonia Municipality, 2. Cultivares farm, Jerico Municipality and 3. La
Cumbre farm, Tamesis Municipality. Source: msn Encarta. .......................................... 151
Figure 4.2.Relationship between daily body condition and social status in Neotropical
migratory bird species in shaded monocultures in Antioquia department, Colombia. Open
circle with solid line: birds in flocks. Closed circle with dotted line: solitary birds. ...... 152
Figure 4.3.Relationship between seasonal body condition and social status in Neotropical
migratory bird species in shaded monocultures in Antioquia department, Colombia. Open
circle with solid line: birds in flocks. Closed circle with dotted line: solitary birds. ...... 154
Page 24
1
1 INTRODUCTION
Spanning nearly 9000 km of land over tremendous altitudinal and climatic diversity
(Jørgensen 2009), the Andes Mountains are considered one of the most diverse places in
the world with impressively high levels of endemism (Gentry 1986, Henderson et al.
1991, Jørgensen 2009). Unfortunately, deforestation and the accompanying loss of
biodiversity are rampant in the Andes (Skole & Tucker 1993, Bierregaard & Stouffer
1997, Orejuela 2000). Over 90% of the Northern Andes, for example, have been
deforested or highly altered by human activity (Henderson et al. 1991). Major causes of
deforestation include establishment of agriculture and silvopastoral systems, urbanization
and selective logging, among others (Henderson et al. 1991). Collectively, these
anthropogenic changes have made Andean forests among the most endangered
ecosystems in the world (Cavelier 1997).
The negative effects of forest loss and degradation are not only experienced by the
resident biota, but also by a wide range of transient populations of species that rely on
tropical montane forests during the nonbreeding season. Neotropical-Nearctic migratory
birds are one such example of a group that depends upon Andean habitats. Of the
approximately 650 Nearctic-Neotropical migratory birds, more than 200 species occur in
the Northern and Central Andes (Rappole 1995). In contrast to our knowledge of factors
limiting Neotropical migrants on breeding grounds (e.g. increased predation, parasitism,
shortage of suitable breeding habitat; Brittingham & Temple 1983, Wilcove 1985,
Page 25
2
Robbins et al. 1989), remarkably little is known of their ecology, distribution, and habitat
needs in the wintering grounds (e.g. Petit et al. 1995, Rotenberry et al. 1995, Marra et al.
1998, Marra & Holmes 2001, Newton 2004, Norris et al. 2004). This lack of knowledge
is particularly surprising given that most Neotropical-Nearctic migrants spend one-half to
two-thirds of their life cycle in Neotropical ecosystems. The rapid human-induced
changes in habitat throughout much of the Neotropics are widely believed to contribute to
population declines of numerous Neotropical migratory birds (Robbins et al. 1989,
Terborgh 1989, Rappole 1995), typically associated with conversion from high to low
quality habitats (Wunderle & Latta 1996, Marra & Holmes 2001, Brown et al. 2002,
Carlo et al. 2004, Johnson et al. 2006) and food availability (Strong & Sherry 2000,
Johnson & Sherry 2001). In contrast, others have reported greater abundance of
Neotropical migrants in early successional and edge habitats, and underrepresentation in
undisturbed moist forests (Orejuela et al. 1980, Pearson 1980, Robinson et al. 1988, Petit
et al. 1995). Moreover, while several studies have documented that resident bird species
are affected by both the amount of forest available within a landscape (e.g. Saab 1999,
Drapeau et al. 2000, Lee et al. 2002) and the nature of the landscape matrix (e.g.
Saunders et al. 1991, Sisk et al. 1997, Fahrig 2001, Renjifo 2001, Ricketts 2001,
Hersperger & Forman 2003, Dunford 2004), little is known about how Neotropical
migrants respond to local- and landscape-scale environmental variation in their wintering
grounds. Studies of the relative effects of deforestation and associated fragmentation on
migratory birds are still urgently needed (Petit et al. 1993).
Matching the paucity of information on wintering ecology of Neotropical migrants in
the Andes is our limited understanding of the response of social systems of birds (i.e.
Page 26
3
mixed-species flocks) to deforestation and habitat alteration. Several studies have
indicated that mixed-species flocks are negatively affected by fragmentation and habitat
disturbance (e.g. Harper 1989, Stouffer & Bierregaard 1995, Maldonado-Coelho &
Marini 2004, Sodhi et al. 2004, Kumar & O’Donnell 2007). These alterations alter habitat
structure and microclimate in ways that can reduce food availability and predictability
(Bierregaard & Lovejoy 1989, Stratford & Stouffer 1999, Maldonado-Coelho & Marini
2000, 2004, Tellería et al. 2001), and ultimately affect the occurrence and abundance of
flocking species, as well as their propensity to flock (Stouffer & Bierregaard 1995,
Thiollay 1999, Maldonado-Coehlo & Marini 2000, Van Houtan et al. 2006). Despite
consistency with which negative responses of flocks to forest fragmentation and
degradation have been documented (Stouffer & Bierregaard 1995, Maldonado-Coehlo &
Marini 2000, Lee et al. 2005), flocks also have displayed some level of habitat flexibility
(e.g. Murcia 1995, Dale et al. 2000, Renjifo 2001). For example, in experimentally-
created fragments in Manaus (Brazil), mixed-species flocking species that used forest
edges and secondary forests survived, meanwhile those species restricted to the forest
interior locally disappeared (Stouffer & Bierregaard 1995). Moreover, the variation of
mixed-species flock attributes within disturbed and undisturbed habitats is apparently still
unclear. One illustration is the apparent absence of mixed species flocks in shade coffee
in Hispaniola, despite being common in forests on the island (Latta & Wunderle 1996). In
contrast, mixed-species flocks were more common in shaded coffee than in natural forest
in Panama (Pomara et al. 2003), though such patterns can arise from mechanisms acting
at different scales (e.g. Cleary et al. 2005). Knowledge of the relative importance of
different landscape elements on mixed-species flocks is crucial given that many bird
Page 27
4
species, including Neotropical migrants, spend a large proportion of time with flocks
(Munn & Terborgh 1979, Latta & Wunderle 1996, Maldonado-Coelho & Marini 2004,
Lee et al. 2005, Sridhar & Sankar 2008).
Objectives and Chapter Overview
The objectives of my dissertation were to (1) examine assembly patterns of mixed-
species avian flocks, (2) evaluate the sensitivity of mixed-species flocks and Neotropical-
Neartic migratory birds to deforestation and habitat structural changes, and (3) identify
potential physiological consequences of using shade coffee and flocking to wintering
Neotropical-Neartic migratory birds.. To do this, I studied Neotropical-Nearctic
migratory birds and mixed-species flocks in montane forest habitats across the Northern
and Central Andes in Venezuela, Colombia, Ecuador and Peru between 2007-2010.
In chapter 2, I assessed patterns of non-randomness in Andean mixed-species flocks
using three complementary assembly models framed on the community assembly theory.
I demonstrated that Andean mixed-species flocks displayed structuring patterns at both
interspecific and inter-guild levels associated with deterministic competitive processes. In
contrast, I found weak evidence for a morphological segregation of avian species within
flocks, and some groups of birds may actually show aggregation in sizes.
In chapter 3, I evaluated the association of landscape-scale (i.e. percentage of forest
cover) and micro-habitat level (i.e. habitat complexity) changes with richness and
abundance patterns of Neotropical migrants and mixed-species flocks within five
broadly-defined habitat types. I found that patterns in flock and migrant attributes were
well explained by environmental heterogeneity at multiple spatial scales, though habitat-
Page 28
5
specific associations depended upon the landscape context. I also provided empirical
evidence that changes in landscape forest cover (e.g. deforestation) contributed to the
spatial variation in Andean bird communities.
In chapter 4, I assessed diurnal and seasonal changes in body condition of
Neotropical-Nearctic migratory birds wintering in shaded monocultures and evaluated if
the patterns were related to flocking behavior. Neither body condition nor seasonal
change in body condition differed between flocking and solitary individuals for most of
the migratory species evaluated. However, Cerulean and Blackburnian Warblers showed
stronger improvements in condition when foraging solitary than in flocks. My results also
provided evidence that several common Neotropical migrants, including species of
conservation concern such as Cerulean Warbler, improved their body condition in shade
coffee farms, highlighting the relevance of this agroforestry system.
Overall, my research shows that mixed-species flocks and Neotropical migratory birds
are widespread and common components of montane forest avifauna throughout the
tropical Andes. Because these avian communities have complex structure (i.e., they are
not random assemblages) and are sensitive to landscape and local habitat changes, my
work cautions that continued land cover change has the potential to disrupt the unique
social system of mixed-species flocks as well as suitability of Andean forests for
overwintering migratory birds. Fortunately, certain management systems, such as shade
coffee and silvopasture, can support abundant and diverse migrants and flocks. Thus,
conservation efforts should explore how agroforestry systems can be used to meet both
ecological and social needs in human-dominated landscapes of the Andes.
Page 29
6
2 ASSEMBLY PATTERNS OF MIXED-SPECIES AVIAN FLOCKS IN THE
ANDES
Abstract. Whether biotic communities are structured by deterministic or stochastic
processes is a central issue in community ecology. Several studies have shown patterns of
species segregation that are consistent with the hypothesis that competition and niche-
partitioning structure species assemblages in animal communities. However, the
theoretical framework has been seldom applied to social aggregations of species within
communities. I assessed patterns of non-randomness in Andean mixed-species flocks
using three assembly models: (a) co-occurrence patterns (b) guild proportionality; and (c)
constant body-size ratios using data from 221 species of resident and Neotropical migrant
birds participating in 311 mixed-species flocks at 12 sites distributed in Venezuela,
Colombia, Ecuador, and Peru. Significant assembly patterns for mixed-species flocks
based on co-occurrence models and guild proportionality models suggest that competitive
interactions at both interspecific and inter-guild levels play an important role in
structuring this social system in the Andes. The proportion of species among foraging
guilds (i.e., insectivore, frugivore, omnivore, nectivore) remained constant but with some
noise across flocks in different regions throughout the study area. In contrast, I found
little evidence that structuring of mixed-species flocks in the Andes was mediated by
constant body-size ratios. Rather, I found greater variance of body-size ratios within
flocks, suggesting that, in general, evidence for a morphological segregation of avian
Page 30
7
species within flocks was weak and some groups of birds may show aggregation in sizes
within flocks. Overall, my findings indicate that bird flocks assemblages across the
Andes are shaped by negative interspecific interactions indicative of competitive effects.
Key words: mixed-species bird flocks, Andes, community, competition, assembly
rules, co-occurrence, guild proportionality, body-size ratio, null models.
Introduction
Few subjects in community ecology have generated as much attention or evoked as
much debate as the assembly of biotic communities and the role of deterministic and
stochastic processes in structuring local and regional assemblages of species (Clements
1916, MacArthur & Wilson 1967, Strong et al. 1984, Weiher & Keddy 1999, Hubbell
2001, Lortie et al. 2004). Community assembly provides a conceptual framework for
understanding these processes (Chase 2003), and two main tradeoff-based theories of
interspecific competition (niche-assembly theory; Tilman 1988, Algar et al. 2005) and
neutrality (dispersal- or neutral-assembly theory; Bell 2000, Hubbell 2001, Algar et al.
2005, McGill et al. 2006) have been promoted as potential explanations for the assembly,
dynamics and structure of ecological communities (Tilman 2004). The point of deviation
between these two theories is the extent to which species co-occurrence is determined by
stochastic versus deterministic factors (e.g. Hubbell 1979, Hubbell & Foster 1986,
Robinson & Terborgh 1995, Terborgh et al. 1996). Consequently, the two theories make
markedly different predictions about community assembly processes (Reshi et al. 2008).
While the niche tradeoff models predict that species will most strongly inhibit
establishment of species similar to them, neutral models assume that all species are
Page 31
8
competitively identical and that distribution of species are determined by random forces
driven by demographic stochasticity (Hubbell 2001). Ecologists increasingly recognize
that both deterministic (e.g., competition) and stochastic or neutral (e.g., dispersal
limitation) processes contribute to community assembly (Ricklefs 1987, Svenning et al.
2004, John et al. 2007). The idea that species assemblages are governed more by the
outcome of deterministic competitive processes than by autoecological characteristics has
generated controversy (Connor & Simberloff, 1979, Diamond & Gilpin 1982, Gilpin &
Diamond 1984), but recent studies show patterns of species segregation that are
consistent with the hypothesis that competition and niche-partitioning structure species
assemblages in several living communities (Gotelli & MacCabe 2002).
While co-occurrence patterns and assembly rules (i.e. filters imposed on a regional
species pool that act to determine the local community structure and composition; Keddy
1992) have been studied across a wide range of taxa (e.g. plants: Holdaway & Sparrow
2006, Burns 2007; insects: Cole 1983; reptiles: Pianka 1986; birds: Diamond 1975;
fishes: Bellwood et al. 2002; mammals: Fox 1989, Fox & Kirkland 1992, Fox & Brown
1993, Meyer & Kalko 2008), the theoretical framework has been seldom applied to social
aggregations of species within communities. Structuring patterns of assemblages such as
mixed-species flocks have been almost entirely overlooked, and to my knowledge only
one published study has addressed this subject (Graves & Gotelli 1993). Mixed-species
flocks represent a prevalent and important component of most tropical forests, and
competition is generally thought to be the predominant underlying structuring mechanism
(Graves & Gotelli 1993). Although mixed-species flocks are relatively well studied in
terms of their composition, internal structure and social relationships among flock
Page 32
9
participants (e.g. Hutto 1994, Develey & Peres 2000, Greenberg 2000, Lee et al. 2005,
Sridhar & Sankar 2008, Sridhar et al. 2009), the assemblage patterns and underlying
processes that drive their structure and organization are poorly understood (Goodale &
Kotagama 2005), particularly within tropical communities that harbor high species
diversity and large number of rare species. Understanding the processes that guide flock
assembly is especially important today, as natural habitats have been extensively
deforested and fragmented.
Mixed-species flocks present a unique opportunity for testing the strength of
deterministic vs. stochastic factors structuring flocks because the ecological similarity of
most participating species makes strong competition likely (Graves & Gotelli 1993). To
my knowledge, the only published research evaluating co-occurrence patterns and the
structure of mixed-species flocks was conducted by Graves and Gotelli (1993), who
studied permanent mixed-species flocks within a local Amazonian avifauna. In this
system, potentially competing pairs of congeneric species with similar ecologies co-
occurred in flocks less often than expected by chance, resulting in perfect checkerboard
distributions. The authors suggested that flocks may be considered analogs to islands (or
fragments) that are colonized by different subsets of species from the local avifauna and
the spatial scale may allow that any individual bird of the species pool could potentially
“colonize” any flock.
I examined patterns of non-randomness assembly in mixed-species flocks of resident
and Neotropical-Nearctic migrant birds in the northern Andes. I examined two specific
questions: (1) Does the presence of a particular flocking species influence the occurrence
of other flocking species? and (2) Do species sharing particular traits (i.e., members of
Page 33
10
the same foraging guild and similar body size) have inhibitory effects on each other? The
coexistence and structuring of species within communities under the ecological niche
theory is primarily based on two assumptions, (1) species with strong overlap in resource
use cannot coexist (Hardin 1960, Simberloff & Connor 1981) and (2) species that coexist
differ in functional morphology or body size allowing them to exploit different resources
(Hutchinson 1959, Simberloff & Boecklen 1981). Thus, to study non-random patterns in
mixed-species flocks following these assumptions, I used species- and trait-based
approaches. I first evaluated three co-occurrence metrics (C-score, number of species
combinations and the variance ratio; Gotelli 2000) to test for assembly patterns in mixed-
species flocks at the species level. To determine if flock composition and species co-
occurrence deviated from that expected for randomly-generated flocks, I used a null
model approach to exclude the biological effects (e.g. competition, mutualism) on the
occurrence of species in flocks, as suggested by Gotelli (2000) and Gotelli & McCabe
(2002). First promoted by Connor & Simberloff (1979), null models (i.e. models that
eliminate the effects of deterministic processes by randomization of observed data; Burns
2007) have been widely used to test hypothesis of assembly rules, especially to compare
random arrangements of species constructed from regional species pools to observed
patterns in species distributions (Zobel et al. 1993, Weiher & Clarke 1998, Anderson et
al. 2000, Gotelli 2000, Peres-Neto et al. 2001).
To evaluate the role of competition in structuring flocks at a higher level of
organization of functional groups (i.e. trait-based approach), I used two models of
assembly patterns, the guild proportionality model (Wilson 1989) and the constant body-
size ratio model (Case et al. 1983, Dayan & Simberloff 1994). Because competitive
Page 34
11
exclusion is expected to occur primarily within rather than between guilds (Wilson &
Gitay 1995), the number of species representing each guild should be limited, thereby
resulting in relatively similar distribution of species across guilds (Fox 1989, Wilson
1989, Wilson & Roxburgh 1994, Wilson & Whittaker 1995). However, competition can
also structure communities by constraining the degree of “similarity” that is allowed
between co-occurring species (Case et al. 1983). Therefore, species that co-occur within
assemblages should differ in body size or morphology to reduce overlap in resource use
and allow for species coexistence (MacArthur & Levins 1967, Wiens 1982, Dayan &
Simberloff 2005).
If deterministic processes mediated by competition are responsible for structuring
mixed-species flocks, then I predict that (1) composition of observed flocks would differ
from flocks randomly generated from the regional species pool of flocking species, (2)
proportion of species within foraging guilds (i.e. frugivore, nectivore, insectivore, and
omnivore) would be similar across flocks in different regions (derived from Wilson 1989)
and (3) body sizes of species should show minimum overlap (Case et al. 1983).
Study area and methods
Study area
I sampled mixed-species flocks in the Northern and Central Andes, from Northern
Venezuela (± 10 o N, 61o W) to Southern Peru (± 13 o S, 78 o W), including Colombia and
Ecuador. Fieldwork was conducted in October-March 2007-2010, a period that typically
spans the wet (Oct-Nov) and dry (Jan-Feb) seasons in the Andes. Sites were located on
the Pacific and Amazon slopes of the Andes, as well as along the Magdalena and Cauca
Page 35
12
interAndean Valleys in Colombia and on the Merida Cordillera in Venezuela. Study sites
represented a range of altitudinal diversity, from tropical lowlands at 400 m to low-
montane tropical forest at 2,600 m. Surveyed sites included evergreen tropical,
premontane and lower montane moist forest, evergreen tropical wet forest and
premontane dry forest (Holdridge 1967).
Flock sampling
Data on richness and size of mixed-species flocks were recorded in 20 geographically
separated clusters (hereafter termed “regions”) of 10-1 km2 pixels (i.e. 200-1 km2 pixels)
distributed across the Northern and Central Andes following a stratified random design
(Colorado et al. 2008; see Appendix A for methodology). Of the 20 regions initially
selected, 10 regions encompassing 43-1km2 pixels were visited and surveyed for flocks in
Venezuela (1 region, 4 pixels), Colombia (7, 34), Ecuador (1, 4) and Peru (1, 3; Table
2.1). For the purpose of my study, I grouped information for all pixels within each region,
thus focusing my analysis at the regional level. In addition, I included 2 additional
regions in Colombia (namely “SW Antioquia” and “Pacora”) that were frequently
searched and surveyed for flocks using the same methodology of non-systematic
observations (see below).
I recorded flock information using two techniques – systematic observations along line
transects and non-systematic observations. Within each pixel, three 100-m line transects
separated at least by 250 m were randomly placed to survey birds entirely within
dominant and relatively homogeneous habitats. Each transect was placed following the
same contour line, and the three transects were allocated across the pixel in order to
sample the range of elevations. Each of the three transects per pixel was surveyed at least
Page 36
13
5 times for a minimum of 15 surveys per pixel typically within a 2-days period. Flocks
were recorded by one trained observer while walking transects at constant rate (ca. 30
min for the 100-m length). Surveys were conducted during peak activity, between the
first half hour after sunrise and 11:00 h and in the afternoon between 14:30 h and 17:00 h,
except during inclement weather. In addition, non-systematic observations of flocks were
conducted by walking and searching for flocks within and around the pixels, generally
within the same region or cluster. A mixed-species flock was defined as at least two
different species foraging and moving in a similar direction, with flock members less than
10 m apart (Morse 1970). For each flock, I recorded the species identity, number of
species and individuals participating in flocks. Observations of a flock seldom exceeded
15 min, as most members were detected within this period. Finally, I constructed a
regional species pool of flocking species for each one of the surveyed regions by
grouping together the species recorded in different mixed-species flocks in each region.
Statistical analysis
I used null model analyses (Gotelli & Graves 1996) and species- and trait-based
approaches to examine co-occurrence patterns in mixed-species bird flocks. I constructed
presence-absence matrices using the species pool of flocking species per region (i.e. 12
regions in total). A flocking species was defined as any bird that was found in at least one
flock in the region. The presence-absence matrix was constructed by assigning the flocks
to columns (analog to islands; Graves & Gotelli 1993) with rows representing flocking
species (see example in Appendix B). I first checked for similarity of pools of flocking
Page 37
14
species by region, and found that regions shared only ∼ 38% of the flocking species
(range 35%-53%). Therefore, each region was treated independently.
Indices of co-occurrence. I applied null model analyses to two indices of co-
occurrence (i.e. statistical indices), namely the C-score (Stone & Roberts 1990) and the
number of species combinations (Pielou & Pielou 1968). Each of these indices is
represented by a single number that summarizes co-occurrence patterns in a presence-
absence matrix (Gotelli 2000). Co-occurrence indices have long been used to test
assembly patterns in communities and their validity has been tested elsewhere (e.g.
Gotelli & McCabe 2002, Feeley 2003).
The C-score index quantifies the average number of “checkerboard units” between all
possible unique pairs of species in the assemblage. As the C-score is an index that is
negatively correlated with species co-occurrence, assemblages structured by competition
should have significantly more species pairs forming checkerboard units than expected
by chance (i.e., the C-score should be significantly larger than expected by chance;
Gotelli & McCabe 2002, Sanders et al. 2007, Krüger et al. 2010). This index supports the
fifth assembly rule by Diamond (1975), “5. Some pairs of species never coexist, either by
themselves or as part of a larger combination”.
The number of species combinations (Pielou & Pielou 1968) is another index of
community structure which states that in a competitively structured community (e.g. set
of islands or sites; Gotelli & McCabe 2002) there should be significantly fewer species
combinations than expected by chance because competition leads to combinations that
are unlikely to occur (Diamond 1975, Gotelli & McCabe 2002, Reshi et al. 2008). This
index is related to the first and second assembly rules by Diamond (1975), “1. If one
Page 38
15
considers all the combinations that can be formed from a group of related species, only
certain ones of these combinations exist in nature. 2. These permissible combinations
resist invaders that would transform them into a forbidden combination”.
Observed indices were compared with randomly generated indices (i.e. simulated
indices), obtained from the null model analysis (Manly 1995). To achieve this, the
original matrices were permuted 1000 times using Monte Carlo randomizations (Gotelli
2000, Feeley 2003, Sanders et al. 2007, Wallen et al. 2010). To create the null matrices
(i.e. randomly constructed assemblages without the influence of interspecific
competition), I used the Random Knight’s Tour algorithm (Gotelli & Entsminger 2005)
and row and column sums of the original matrix were held constant in all interations (i.e.
“fixed-fixed”sensu Gotelli 2000). The Knight’s tour is an algorithm that allows randomly
filling cells of an empty matrix until the imposed constraint (i.e. fixed row and column
totals) is violated. When a constraint is violated, the algorithm removes a filled cell and
begins the fill process again (Sanderson et al. 1998, Gotelli & Entsminger 2005). Null
models constructed using the Knight’s tour algorithm are unbiased and have been shown
to have good statistical properties, including good type I properties (low chance of falsely
rejecting the null hypothesis when it is true) and good power for detecting non-random
patterns in noisy data sets (Gotelli 2000, Gotelli & Entsminger 2005).
Guild proportionality. I also analyzed non-random patterns of flock assembly among
different foraging guilds (i.e. collection of species using the similar resources in similar
ways; Root 1967) by assessing whether the proportion of species within the selected
foraging guilds remained constant across flocks (Wilson 1989, Feeley 2003). I assigned
each of the bird species recorded to one of four foraging guilds (insectivores, frugivores,
Page 39
16
nectarivores and granivores) determined by personal observations or following literature
(e.g. Terborgh 1990). I transformed the presence-absence matrix into a contingency table
such that each column represented a flock and each row represented a guild, following
Feeley (2003). Each cell of the new matrix represented the number of species of the
respective guild that occurred in a particular flock (Appendix C). I then analyzed this
contingency table using the log-likelihood ratio test (LLR) for homogeneity of repeated
samples (Sokal & Rohlf 1995), which determines if proportionality of guilds differs
significantly among flocks (i.e. P < 0.05), remains constant but with noise
(0.05<P<0.95), or remained fixed (P>0.95; sensu Feeley 2003). According to this model,
if competition is important at the guild level, the relative proportion of species within
each guild is expected to remain stable among islands (i.e. flocks) of varying species
diversity and composition (Wilson 1989, Mikkelson 1993, Wilson & Whittaker 1995).
Body-size overlap. I analyzed the non-randomness of flock assembly by analyzing
patterns of body size overlapping among species recorded in a flock. In this case, a flock
structured by competition should present species with differences in size with a minimum
overlap (Krüger et al. 2010), resulting as a mechanism allowing coexistence of apparently
similar species (Dayan & Simberloff 1994). Two metrics, the minimum size ratio and the
variance of size ratio were calculated between the body lengths (i.e. entire length
measured from the tip of the bill to the end of the tail feathers) of co-occurring bird
species separately for each flock. The observed indices were then compared to the
distribution of simulated indices generated from 5000 permutations, following Feeley
(2003). A competitively-structured community should contain species that generate an
unusually (1) large minimum size ratio and (2) small variance in the body size ratios
Page 40
17
when compared to the null model. I used the uniform null model to generate flocks with
random body size distributions. In this model, the endpoints of the distribution are fixed
by the largest and the smallest species in the assemblage and the remaining species are
selected from a log uniform distribution within these limits (Gotelli & Ellison 2002,
Krüger et al. 2010). I used a binomial test to calculate the probability of finding the
observed number of flocks per site with minimum size ratios significantly greater than
expected by change as well as to estimate the probability of finding the observed number
of flocks per site with significantly less variance of size ratios than expected by chance
(Case et al. 1983, Feeley 2003). While the co-occurrence and the guild analyses account
for non-random patterns in both species distributions and functional differences in the
guild proportions, respectively, the body size ratio is complementary in incorporating
morphological differences among individuals within flocks. For example, if co-
occurrence or guild structure patterns are not different from the null hypothesis in either
ecological or taxonomic groups, mechanisms leading to co-existence are not expected to
be related to constant body size ratios (Hutchinson 1959).
For all statistical tests, an alpha of 0.05 was used to indicate statistical significance.
Mean values are reported with SD. Analyses were performed using EcoSim 7.0 (Gotelli
& Entsminger 2005), STATGRAPHICS Centurion XV (Statpoint 2005) and R version
2.11 (R Development Core Team 2009).
Results
I recorded 221 species participating in 311 flocks recorded in Venezuela (34 flocks),
Colombia (252), Ecuador (8) and Peru (17). Mean richness per flock was 8.24 ± 3.95
Page 41
18
species (range 2-27), and average flock size (i.e., number of individuals) was 15.3 ± 9.3
(range 3-60; Table 2.2). Avian families most commonly detected in flocks were Tanagers
(Thraupidae: 48 species), Flycatchers (Tyrannidae: 36), and Ovenbirds (Furnariidae: 24,
Table 2.3 & Appendix D). Neotropical- Nearctic migrants comprised 10% of the species
recorded in flocks. Fifty-four species (24.4%) were only detected in a single flock among
the 311 flocks observed, whereas Blackburnian Warbler (Dendroica fusca) and Blue-gray
Tanager (Thraupis episcopus) represented the most abundant migrant and resident
species detected in flocks (62% and 31%, respectively; Table 2.4). Of the 221 flocking
species, the majority were insectivores (47%) and frugivores (45%). The remaining few
species were classified as either omnivores (5%) or nectarivores (3%).
The observed C-scores for the presence-absence matrices of mixed-species flocks for
the 12 regions across the Andes were significantly higher than expected by chance (i.e.,
significantly more checkerboard units between all possible pairs of species), suggesting a
negative pattern of species co-occurrence (Table 2.5). The index of number of species
combinations (Pielou & Pielou 1968) was less than expected by chance only for two
regions, Paya (observed No. of species combinations = 14, expected No. of species
combinations = 15, P < 0.01) and SW Antioquia (observed No. of species combinations =
82, expected No. of species combinations = 100, P < 0.01, Table 2.5).
The proportion of species within the selected four major foraging guilds remained
significantly stable among flocks in five regions (LLR Carache = 70.84, df = 99, P >
0.95; LLR Paya = 25.94, df = 42, P > 0.95; LLR Abejorral = 82.18, df = 105, P > 0.95;
LLR Pacora = 21.85, df = 42, P > 0.95 and LLR SW Antioquia = 187.54, df = 297, P >
0.95) as well as throughout all regions (Log-likelihood ratio = 809.98, df = 882, P > 0.95;
Page 42
19
Fig. 2.1). The proportion of species within each flock remained stable but with noise for
the rest of the regions (LLR Aguachica = 23.86, df = 22, P = 0.36; LLR San Jose de la
Montana = 77.68, df = 75, P = 0.39; LLR Yariguies = 13.58, df = 12, P = 0.33; LLR
Cauca = 81.99, df = 84, P = 0.54; LLR Sangay National Park = 24.85, df = 21, P = 0.25;
LLR Cajamarca = 47.15, df = 48, P = 0.51; LLR Chicamocha = 0.67, df = 2, P = 0.72
and LLR Tolima = 0.26, df = 1, P = 0.61 Fig. 2.1).
There was no evidence for morphological segregation of bird species within flocks
based on the body-size ratio model. Only five of 305 flocks had minimum body-size ratio
significantly greater than expected by chance (P < 0.05) distributed in four regions:
Carache in the Merida Cordillera of Venezuela (2 flocks out of 34), San José de la
Montaña in the Central Colombian Andes (1 out of 26), Abejorral in the Central
Colombia Andes (1 out of 36) and Pácora, Central Colombian Andes (1 out of 22).
Neither proportion represented a significantly greater number of flocks according to the
binomial test (P > 0.1; Table 2.6). Similarly, variance of body-size ratios was lower than
expected by chance for only 3 of 305 flocks (2 out of 34 in Carache and 1 out of 36 in
Abejorral), which was not a significant proportion of the flocks (P > 0.01, Table 2.6).
Conversely, the variance in body-size ratios was larger than expected by chance in 44 out
of 305 flocks, distributed across all the regions. However, the proportion of flocks with
larger variances was only significant in Carache (11 out of 34 flocks, Binomial test, P <
0.05).
Page 43
20
Discussion
Despite the controversy associated with the deterministic view of community
assembly (Strong et al. 1984, Weiher & Keddy 1999, Hubbell 2001), a wide variety of
local to regional-scale studies have provided evidence that competitive interactions
among species can be a major driver of the assembly of plant and animal communities
(e.g. Gotelli & McCabe 2002, Krüger et al. 2010). Comparatively little work has been
conducted in social systems such as mixed-species flocks, which are known to be
strongly influenced by interspecific interactions (Graves & Gotelli 1993). My study
provides evidence of assembly patterns for mixed-species flocks in the Andes and further
suggests that competitive interactions at both interspecific and inter-guild levels play an
important role in structuring this social system in the Andes.
My findings of species co-occurrence are consistent with Diamond’s fifth assembly
rule (1975) that “some pairs of species never coexist, either by themselves or as part of a
larger combination”. Specifically, I found greater numbers of “checkerboard units”
between all possible pairs of species derived from the regional dataset of flocking species
than random flock assemblages. This pattern implies that certain flocking species are
consistently excluded from joining the same flock (e.g. Cerulean Warbler vs. bay-
breasted Warbler, Dendroica castanea, and Yellow-throated Bush-Tanager,
Chlorospingus flavigularis, vs. Common Bush-Tanager, C. ophthalmicus), and thus
provides some support for the hypothesis that interspecific competition structures flocks
(Graves & Gotelli 1993). Several studies have documented non-random patterns in
species co-occurrences in animal and plant communities (Cole 1983, Graves & Gotelli
1993, Gotelli & Ellison 2002, Sanders et al. 2003, Burns 2007, Reshi et al. 2008). In their
Page 44
21
meta-analysis of co-occurrence patterns, Gotelli & MacCabe (2002) showed fewer co-
occurring species than expected by chance for a variety of taxonomic groups (e.g. birds,
bats, invertebrates, reptiles, amphibians and plants) and across spatial scales ranging
from small quadrats (0.25 m2) to large islands in oceanic archipelagos (2.3 x 10¹⁰ m2).
Specifically for flocks, Graves & Gotelli (1993) reported co-occurrence patterns of
species in permanent mixed-species flocks of Amazonian bids based on null model
analysis of 22 color-marked flocks. Since their work, no other study, to my knowledge,
has further explored co-occurrence patterns in tropical mixed-species flocks. My
contribution extends their findings on co-occurrence patterns to mixed-species flocks in
the Andes.
My data from flocks in the Andes do not provide strong support for the first and
second assembly rules by Diamond (1975), which predict fewer species combinations
than expected by chance and a limited number of permissible combinations. Although I
detected several flocking species that apparently never co-occurred in the same flock (e.g.
Yellow-throated Bush-Tanager, Chlorospingus flavigularis, vs. Common Bush-Tanager,
C. ophthalmicus), I did not find that closely-related species co-occurred less than
expected. I also detected fewer species combinations than expected by chance in two
regions out of 12, namely Paya and Southwestern Antioquia. Therefore, whereas Andean
flocks showed that some pairs of species do not co-occur in the same flock more often
than expected by chance, there were, to some extent, few apparent “forbidden
combinations” and flocks regularly supported related species.
Patterns of flock composition were consistent with the guild proportionality
hypothesis, thereby implying that assembly patterns in mixed-species flocks are at least
Page 45
22
partially deterministic, guild-structured entities (Wilson 1999, Fargione et al. 2003).
However, the amount of noise varies among flocks across the study area, to the extent
that in some regions, such as Sangay National Park, some guilds tended to be
overrepresented in larger flocks (e.g. Frugivores tended to become dominant in larger
flocks). Empirical evidence for guild proportionality include studies on Alpha and Beta
guilds in plant communities along successional riverbed to grassland succesion sequences
in river terraces in New Zealand (Holdaway & Sparrow 2006), plant species in salt-
marshes under rabbit and wildfowl grazing in north Wales (Wilson & Whittaker 1995),
vegetation of dune slacks in west Wales (Wilson & Gitay 1995) and guilds stratification
in natural forests (Wilson 1989). The consistent proportion of species among different
foraging guilds provides indirect evidence that flocks are shaped by competitive forces
that align with the general principle of “limiting similarity” (Wilson & Roxburgh 1994,
Wilson et al. 2000, Fargione et al. 2003), in which species most strongly inhibit or limit
heterospecifics with similar patterns of resource use, usually from their own guild. Strong
within-guild competition should result in pattern of community assembly that tends
toward specific relative abundances of functional guilds (i.e. guild proportionality; Pacala
& Tilman 1994, Fargione et al. 2003). Particularly for birds, flocking species may
exclude other attendants with intra- or inter-specific antagonistic behaviors (Morse 1970,
Rappole & Warner 1980, Gaddis 1983, Ewert & Askins 1991, Latta & Wunderle 1996).
Such exclusion of species from flocks due to antagonistic behaviors are well-documented
in permanent Neotropical flocks containing territorial species, where flock participation
by any one species is limited to a single individual, mated pair, or family group (Munn &
Terborgh 1979, Powell 1979). Although I did not quantify behaviors in the field, I
Page 46
23
commonly observed antagonistic interactions within and among species in my flocks,
especially among insectivorous birds, such as the Neotropical migratory parulids that
encompassed 47% of the migratory species participating in Andean mixed-species flocks.
Thus, antagonistic interactions might represent an important mechanism explaining the
patterns observed in guild proportionality. In addition, while insectivores are especially
likely to share similar broad preferences for feeding resources (i.e. insects) and
morphological characteristics (e.g. Johnson et al. 2005), interspecific competition may be
reduced by using specific foraging behaviors, substrates and preys (Curson et al. 1994,
Strong 2000).
Contrary to the co-occurrence and guild proportionality patterns in my data, structure
of my Andean flocks does not appear to be mediated by constant body-size ratios. There
was no evidence for a morphological segregation of avian species within flocks based on
the body-size ratio model (i.e. variance of body-size ratios was almost never found to be
significantly less than expected by change). Rather, greater variances of body-size ratios
were commonly detected in mixed-species flocks (∼ 15 % of flocks analyzed). Patterns of
greater variances suggest that, in general, Andean mixed-species flocks contained
aggregations of relatively small or large species (Krüger et al. 2010). Thus, some groups
of birds may show aggregation in sizes within flocks, instead of more constant body-size
ratio spacing. For example, tanagers and parulids, respectively, could be dominating the
distribution of body sizes in flocks in my study, allowing aggregated pattern.
Most community assembly studies, regardless of scale, have assumed that
communities are in an equilibrium state, and there has been little consideration of
whether co-occurrence patterns are stable in time or vary in space (Sanders et al. 2007).
Page 47
24
Although I found non-random assembly patterns based on co-occurrence and guild
proportionality models in flocks joined by Neotropical migrants during the nonbreeding
season, I did not evaluate the potential association between interhabitat and temporal
variation and assembly patterns. Besides competition, available habitat and habitat
requirements of species are other important factors affecting the assembly of avian
communities (James 1971, James et al. 1984) that can profoundly influence flock
structure. Future work should therefore be directed to evaluate the stability of co-
occurrence patterns across gradients of anthropogenic disturbance and habitat
heterogeneity.
Literature Cited
Algar, A. C., Sleep, D. J., & Nudds, T. D. (2005). Niches, null models, and forest birds:
Testing competing community assembly hypotheses in disturbed and undisturbed
hardwood forest. Ecoscience , 12 (4), 574-580.
Anderson, D. R., Burnham, K. P., & Thompson, W. L. (2000). Null hypothesis testing:
problems, prevalence, and an alternative. Journal of Wildlife Management , 64
(4), 912-923.
Bell, G. (2000). The distribution of abundance in neutral communities. American
Naturalist , 155, 606-617.
Bellwood, D. R., Wainwright, P. C., Fulton, C. J., & Hoey, A. (2002). Assembly rules
and functional groups at global biogeographical scales. Functional Ecology , 16,
557-562.
Page 48
25
Burns, K. C. (2007). Patterns in the assembly of an island plant community. Journal of
Biogeography , 34, 760-768.
Case, T. J., Faaborg, J., & Sidell, R. (1983). The role of body size in the assembly of
West Indian bird communities. Evolution , 37, 1062-1074.
Chase, J. M. (2003). Community assembly: when should history matter. Oecologia , 136,
489-498.
Clements, F. E. (1916). Plant Succession: An Analysis of the Development of Vegetation.
Washington: Carnegie Institution of Washington.
Cole, B. (1983). Assembly of mangrove ant communities: colonization abilities. Journal
of Animal Ecology , 52, 349-355.
Colorado, G., Hamel, P., Rodewald, A., & Thogmartin, W. (2008). El grupo cerúleo:
colaboration to assess nonbreeding range of Cerulean Warbler in South America.
Ornitología Neotropical , 19 (Suppl.), 521-529.
Connor, E. F., & Simberloff, D. (1979). The assembly of species communities: chance or
competition? Ecology , 60, 1132-1140.
Curson, J., Quinn, D., & Beadle, D. (1994). Warblers of the Americas. Boston: Houghton
Mifflin.
Dayan, T., & Simberloff, D. (2005). Ecological and community-wide character
displacement: the next generation. Ecology Letters , 8, 875-894.
Dayan, T., & Simberloff, D. (1994). Morphological relationships among coexisting
heteromyids: an incisive dental character. American Naturalist , 143, 462-477.
Page 49
26
Develey, P. F., & Peres, C. A. (2000). Resource seasonality and the structure of mixed
species bird flock in a coastal Atlantic forest of south-eastern Brazil. Journal of
Tropical Ecology , 16, 33-53.
Diamond, J. M. (1975). Assembly of species communities. In M. L. Cody, & J. M.
Diamond, Ecology and evolution of communities (pp. 342-444). Cambridge,
Massachusetts, US: Harvard University Press.
Diamond, J. M., & Gilpin, M. E. (1982). Examination of the "null" model of Connor and
Simberloff for species co-occurrences on islands. Oecologia , 52, 64-74.
Ewert, N. D., & Askins, R. A. (1991). Flocking behavior of migratory warblers in winter
in the Virgin Islands. Condor , 93, 864-868.
Fargione, J., Brown, C. S., & Tilman, D. (2003). Community assembly and invasion: an
experimental test of neutral versus niche processes. Proceedings of the National
Academy of Sciences of the USA , 100, 8916-8920.
Feeley, K. (2003). Analysis of avian communities in Lake Guri, Venezuela, using
multiple assembly rule models. Oecologia , 137, 104-113.
Fox, B. J. (1989). Small-mammal community pattern in Australian heathland: a
taxonomically based rule for species assembly. In D. W. Morris, Z. Abramsky, B.
J. Fox, & M. R. Willig (Eds.), The Structure of Mammalian Communities (pp. 91-
103). Lubbock: Texas Technical University.
Fox, B. J., & Brown, J. H. (1993). Assembly rules for functional groups in North
American desert rodent communities. Oikos , 67, 358-370.
Page 50
27
Fox, B. J., & Kitkland, G. L. (1992). North American soricid communities follow
Australian small mammal assembly rule. Journal of Mammology , 73, 491-503.
Gaddis, P. K. (1983). Composition and behavior of mixed-species flocks of forest birds
in North-central Florida. Florida Field Naturalist , 11, 25-44.
Gilpin, M. E., & Diamond, J. M. (1984). Are species co-occurrences on islands non-
random, and are null hypotheses useful in communitiy ecology? In Ecological
communities: conceptual issues and the evidence (pp. 297-315). Princeton, NJ:
Princeton University Press.
Goodale, E., & Kotagama, S. W. (2005). Testing the roles of species in mixed-species
birds flocks of a Sri Lankan rain forest. Journal of Tropical Ecology , 21, 669-
676.
Gotelli, H. J., & Ellison, A. M. (2002). Assembly rules for New England ant
assemblages. Oikos , 99, 591-599.
Gotelli, N. J. (2000). Null model analysis of species co-occurrence patterns. Ecology , 81,
2606-2621.
Gotelli, N. J., & Entsminger, G. L. (2005). EcoSim: Null models sofware for ecology.
Version 7. Acquired Intelligence Inc. & Kesey-Bear, Jericho, VT.
http://garyentsminger.com/ecosim.htm.7.0 edn.
Gotelli, N. J., & Graves, G. R. (1996). Null models in ecology. Washington, D.C.:
Smithsonian Institution Press.
Gotelli, N. J., & McCabe, D. J. (2002). Species co-occurrence: a meta-analysis of J.M.
Diamond's assembly rules model. Ecology , 83 (8), 2091-2096.
Page 51
28
Graves, G. R., & Gotelli, N. j. (1993). Assambly of avian mixed-spicies flocks in
Amazonian. Proceeding of the National Academy of Sciences , 90, 1388-1391.
Greenberg, R. (2000). Birds of many feathers: the formation and structure of mixed-
species flocks of forest birds. In S. Boinski, & P. A. Garber (Eds.), On the move
(pp. 521-558). Chicago: University of Chicago Press.
Hardin, G. (1960). The competitive exclusion principle. Science , 131 (3409), 1292-1297.
Holdaway, R. J., & Sparrow, A. D. (2006). Assembly rules operating along a primary
riverbed-grassland successional sequence. Journal of Ecology , 94, 1092-1102.
Holdridge, L. R. (1967). Life zone ecology. San Jose, Costa Rica: Tropical Science
Center.
Hubbell, S. P. (2001). The Unified Neutral Theory of Biodiversity and Biogeography.
New Jersey, US: Princeton University Pres.
Hubbell, S. P. (1979). Tree dispersion, abundance, and diversity in a tropical dry forest.
Science , 203 (4387), 1299-1309.
Hubbell, S. P., & Foster, R. B. (1986). Commonness and rarity in a neotropical forest:
implications for tropical tree conservation. In M. E. Soulé (Ed.). Sunderland, MA,
US: Sinauer Associates.
Hutchinson, G. E. (1959). Homage to Santa Rosalia, or why are there so many kinds of
animals? American Naturalist , 93, 145-159.
Hutto, R. L. (1994). The composition andsocial-organization of mixe-species flocks in a
tropical deciduous forest in Western Mexico. Condor , 96, 105-118.
Page 52
29
James, F. C. (1971). Ordinations of habitat relationships among breeding birds. Wilson
Bulletin , 83, 215-236.
James, F. C., Johnston, R. F., Wamer, N. O., Niemi, G. J., & Boecklen, W. J. (1984). The
Grinellian niche of the wood thrush. American Naturalist , 124, 17-47.
John, R., Dalling, J. W., Harms, K. E., Yaitt, J. B., Stallard, R. F., Mirabello, M., et al.
(2007). Soil nutrients influence spatial distribution of tropical tree species.
Proceedings of the National Academy of Sciences. USA , 104, 864-869.
Johnson, M. D., Sherry, T. W., Strong, A. M., & Medori, A. (2005). Migrants in
Neotropical bird communities: an assessment of the breeding currency hypothesis.
Journal of Animal Ecology , 74 (2), 333-341.
Keddy, P. A. (1992). Assembly and response rules: two goals for predictive community
ecology. Journal of Vegetation Science , 3, 157-164.
Kruger, R. F., De Carvalho, C. J., & Ribeiro, P. B. (2010). Assembly rules in muscid fly
assemblages in the grasslands biome of southern Brazil. Neotropical Entomology ,
39 (3), 345-353.
Latta, S. C., & Wunderle, J. M. (1996). The composition and foraging ecology of mixed-
species flocks in pine forest of Hspaniola. Condor , 98, 595-607.
Lee, T. M., Soh, M. C., Sodhi, N., Koh, L. P., & Lim, S. L. (2005). Effcts of habitat
disturbance on mixed species bird flocks in a tropical sub-montane rainforest.
Biological conservation , 122, 193-204.
Lortie, C. J., Brooker, R. W., Choler, P., Kikvidze, Z., Michalet, R., Pugnaire, F. I., et al.
(2004). Rethinking plant community theory. Oikos , 107 (2), 433-438.
Page 53
30
MacArthur, R. H., & Levins, R. (1967). The limiting similarity, convergence and
divergence of coexisting species. The American Naturalist , 101, 377-385.
MacArthur, R. H., & Wilson, E. O. (1967). The Theory of Island Biogeography.
Princeton, NJ: Princeton University Press.
Manly, B. F. (1995). A note on the analysis of species co-occurrences. Ecology , 76,
1109-1115.
McGill, B. J., Maurer, B. A., & Weiser, M. D. (2006). Empirical evaluation of neutral
theory. Ecology , 87, 1411-1423.
Meyer, C. F., & Kalko, E. K. (2008). Bat assemblages on Neotropical land-bridge
islands: nestes subsets and null model analyses of species co-occurrence patterns.
Diversity and Distributions , 14, 644-654.
Mikkelson, G. M. (1993). How do food webs fall apart? A study of changes in trophic
structure during relaxation on habitat fragments. Oikos , 67, 539-547.
Morse, D. H. (1970). Ecological aspects of some mixed-species foraging flocks of birds.
Ecological Monographs , 40, 119-168.
Munn, C. A., & Terborgh, J. (1979). Multi-species territoriality in neotropical forraging
flocks. Condor , 81, 338-347.
Pacala, S. W., & Tilman, D. (1994). Limiting similarity in mechanistic and spatial models
of plant competition in heterogeneous environments. American Naturalist , 143,
222-257.
Page 54
31
Peres-Neto, P. R., Olden, J. D., & Jackson, D. A. (2001). Environmentally constrained
null models: site suitability as occupancy criterion. Oikos , 93, 110-120.
Pianka, E. R. (1986). Ecology and natural history od desert lizards. Princeton: Princeton
University Press.
Pielou, D. P., & Pielou, E. C. (1968). Association among species of infrequent
occurrence: the insect and spider fauna of Polyporus betulinus (Bulliard) Fries.
Journal of Theoretical Biology , 21, 202-216.
Powell, G. V. (1979). Structure and dynamics of interspecific flocks in a neotropical mid-
elevation forest. Auk , 96, 375-390.
Rappole, J. H., & Warner, D. W. (1980). Ecological aspects of migrant bird behavior in
Veracruz, Mexico. In A. Keast, & E. S. Morton (Eds.), Migrant birds in the
neotropics: ecology, distribution, and conservation (pp. 253-393). Washington:
Smithsonian Institution Press.
R-Development Core Team. (2009). R: A language and environment for statistical
computing. Retrieved from R Foundation for Statistical Computing: www.R-
project.org
Reshi, Z., Rashid, I., Khuroo, A. A., & Wafai, B. A. (2008). Effect of invasion by
Centaurea iberica on community assembly of a mountain grassland of Kashmir
Himalaya, India. Tropical Ecology , 49 (2), 147-156.
Ricklefs, R. E. (1987). Community diversity: relative roles of local and regional
processes. Science , 235, 167-171.
Page 55
32
Robinson, S. K., & Terborgh, J. (1995). Interspecific aggression and habitat selection by
Amazonian birds. Journal of Animal Ecology , 64, 1-11.
Robson, D. S. (1972). Appendix: statistical tests of significance. Journal of Theoretical
Biology , 34, 350-352.
Root, R. B. (1967). the niche exploitation pattern of the blue-gray gnatcatcher. Ecological
Monographs , 37, 317-350.
Sanders, N. J., Gotelli, N. J., Heller, N., & Gordon, D. M. (2003). Community
disassembly by an invasive species. Proceedings of the National Academy of
Sciences , 100, 2474-2477.
Sanders, N. J., Gotelli, N. J., Wittman, S. E., Ratchford, J. S., Ellison, A. M., & Jules, E.
S. (2007). Assembly rules of ground-foraging ant assemblages are contingent on
disturbance, habitat and spatial scale. Journal of Biogeography , 34, 1632-1641.
Sanderson, J. G., Moulton, M. P., & Selfridge, R. G. (1998). Null matrices and the
analysis of species co-occurrences. Oecologia , 116, 275-283.
Schluter, D. (1984). A variance test for detecting species asociation, with some examples
applications. Ecology , 65, 998-1005.
Simberloff, D., & Boecklen, W. (1981). Santa Rosalia reconsidered: size ratios and
competition. Evolution , 35, 1206-1228.
Simberloff, D., & Connor, E. F. (1981). Missing species combinations. American
naturalist , 118, 215-239.
Page 56
33
Sokal, R. R., & Rohlf, F. F. (1995). Biometry: the principles and practice of statistics in
biological research. New York: W.H. Freeman & Co.
Sridhar, H., & Sankar, K. (2008). Effects of habitat degradation on mixed-species bird
flocks in Indian rain forests. Journal of Tropical Ecology , 24, 135-147.
Sridhar, H., Beauchamp, G., & Shanker, K. (2009). Why do birds participate in mixed-
species foraging flocks? A large-scale synthesis. Animal Behaviour , 78, 337-347.
STATPOINT. (2005). Statgraphics Centurion XV. Herndon, VA, US: StatPoint.
Stone, L., & Roberts, A. (1990). The checkerboard score and species distributions.
Oecologia , 85, 74-79.
Strong, A. M. (2000). Divergent foraging strategies of two Neotropical migrant Warblers:
implications for winter habitat use. The Auk , 117 (2), 381-392.
Strong, D. R., Simberloff, D., Abele, L., & Thistle, A. B. (1984). Ecological
communities: conceptual issues and the evidence. Princeton, NJ: Princeton
University Press.
Svenning, J. C., Kinner, D. A., Stallard, R. F., Engelbrecht, B. M., & Wright, S. J. (2004).
Ecological determinism in plant community structure across a tropical forest
landscape. Ecology , 94, 1003-1010.
Terborgh, J. (1990). Mixed flock and polyspecific associations: Costs and benefits of
mixed groups to birds and monkeys. American Journal of Primatology , 21, 87-
100.
Page 57
34
Terborgh, J., Foster, R. B., & Nunez, P. (1996). Tropical tree communities: A test of the
nonequilibrium hipothesis. Ecology , 77 (2), 561-567.
Tilman, D. (2004). Niche tradeoffs, neutrality, and community structure: a stochastic
theory of resource competition, invasion, and community assembly. The National
Academy of Sciences , 101, 10854-10861.
Tilman, D. (1988). Plant Strategies and the Dynamics and Structure of Plant
Communities. Monographs in Population Biology. Princeton: Princeton
University Press.
Wallem, P. K., Anderson, C. B., Martinez-pastur, G., & Lencinas, M. V. (2010). Using
assembly rules to measure the resilience of riparian plant communities to beaver
invasion in subantarctic forest. Biological invasions , 12, 325-335.
Weiher, E., & Keddy, P. A. (1999). Ecological Assembly Rules: Perspectives, Advances,
Retreats. Cambridge, United Kingdom: Cambridge University Press.
Wiens, J. A. (1982). On size ratios and sequences in ecological communities - are there
no rules. Annales Zoologici Feninici , 19 (4), 297-308.
Wilson, J. B. (1989). A null model of guild proportionality, applied to stratification of a
New Zealand temperate rain forest. Oecologia , 80, 263-267.
Wilson, J. B. (1999). Assembly rules in plant communities . In Ecological Assembly
Rules: Perspectives, advances, retreats (pp. 130-164). Cambridge: Cambridge
University Press.
Page 58
35
Wilson, J. B., & Gitay, H. (1995). Community structure and assembly rules in a dune
slack: Variance in richness, guild proportionality, biomass constancy and
dominance/diversity relations. Vegetatio , 116, 93-106.
Wilson, J. B., & Roxburgh, S. H. (1994). A demonstration of guild-based assembly rules
for a plant community, and determination of intrinsic guilds. Oikos , 69, 267-276.
Wilson, J. B., & Whittaker, R. J. (1995). Assembly rules demonstrated in a saltmarsh
community. Journal of Ecology , 83, 801-807.
Wilson, J. B., Steel, J. E., & King, W. M. (2000). Quantitative aspects of community
tructure examined in a semi-arid grassland. Jurnal of Ecology , 88, 749-756.
Zobel, K., Zobel, M., & Peet, R. K. (1993). Change in pattern diversity during secondary
succession in estonian forests. Jurnal of Vegetation Science , 4 (4), 489-498.
Page 59
34
Table 2.1. Site characteristics for 12 different regions on the Colombian, Ecuadorian and
Peruvian Andes where mixed-species flocks were recorded,October-March, 2007-2010.
Values are mean ± SD.
Locality Abejorral Pacora Tolima
South
Western
Antioquia
Rosas
Sangay
National
Park
Cajamarca
Country Colombia Colombia Colombia Colombia Colombia Ecuador Perú
Latitude 5.7125 5.4968 4.5042 5.8177 2.2292 -1.6625 -4.8125
Longitude -75.5208 -75.5895 -75.0125 -75.7961 -76.7375 -78.1875 -78.7291
Elevation
(m)
1188 ± 96 1338.2 ±
104.3
674.17 ±
185.2
1387.6 ±
52.1
1715.7 ±
361.9
1082.7 ±
115
1336.7 ±
250.3
Life zone Premontane
forest
Premontane
forest
Tropical
lowland
forest
Premontane
forest
Premontane
forest
Tropical
lowland
forest
Tropical
lowland
forest
Geographic
position
Central
Cordillera
Central
Cordillera
Central
Cordillera
Western
Cordillera
Western
Cordillera
Amazon-
Eastern
Ecuadorian
Andes
Amazon-
Eastern
Peruvian
Andes
Page 60
35
Table 2.2. Mean number of species and individuals recorded in 311 flocks in 12 regions
in the Northern and Central Andes, October-March, 2007-2010. Values are mean ± SD.
Locality Country Mean No. of species Mean No. of individuals
Carache Venezuela 6.68 ± 3.91 12.47 ± 8.49
Aguachica Colombia 7.25 ± 2.9 13.67 ± 8
San Jose de la Montana Colombia 7.38 ± 2.45 14.31 ± 5.75
Yariguies Colombia 12.29 ± 3.99 30.29 ± 18.64
Chicamocha Colombia 4.33 ± 2.31 7.67 ± 5.51
Abejorral Colombia 9 ± 5.66 19.11 ± 12.95
Pacora Colombia 6.59 ± 2.4 12 ± 4.09
Paya Colombia 6.53 ± 1.68 12.4 ± 4.31
Tolima Colombia 6.5 ± 4.95 6.5 ± 4.95
Rosas Colombia 9.17 ± 3.95 15.21 ± 7.47
Sangay National Park Ecuador 5.88 ± 1.89 13.5 ± 4.14
Cajamarca Perú 7 ± 3.03 11.9 ± 6.93
Southwestern Antioquia Colombia 9.26 ± 3.71 16.11 ± 8.92
Total 8.24 ± 3.95 15.33 ± 9.3
Page 61
36
Table 2.3. Number of bird species per family found in 311 mixed-species flocks recorded
in the Northern and Central Andes, October-March, 2007-2010.
Family No. of bird species
Capitonidae 1
Cardinalidae 10
Corvidae 1
Cotingidae 1
Cuculidae 1
Emberizidae 7
Fringillidae 6
Furnariidae 24
Icteridae 6
Incertae sedis 10
Mimidae 1
Parulidae 19
Picidae 11
Pipridae 3
Polioptilidae 1
Rhinocryptidae 1
Thamnophilidae 4
Thraupidae 48
Tityridae 3
Troglodytidae 7
Trogonidae 1
continued
Page 62
37
Table 2.4 (continued)
Turdidae 11
Tyrannidae 36
Vireonidae 8
Total 221
Page 63
38
Table 2.5. Percentage of most common bird species assisting mixed-species flocks in the
Northern and Central Andes. Species present in 10% or more of flocks are listed. Mean
abundance calculated for those flocks with the species present. Asterisk denotes
Neotropical-Nearctic migratory birds.
Species
Common name
% occurrence
in flocks
Mean abundance
± SD
Dendroica fusca* Blackburnian Warbler 61.9 2.78 ± 2.67
Dendroica cerulea* Cerulean Warbler 37.41 1.92 ± 1.09
Vermivora peregrina* Tennessee Warbler 32.65 2.39 ± 3.29
Thraupis episcopus Blue-gray Tanager 31.29 2.80 ± 2.44
Zymmerius chrysops Golden-faced Tyrannulet 25.51 1.32 ± 0.81
Hemithraupis guira Guira Tanager 23.81 2.07 ± 1.08
Mniotilta varia* Black and White Warbler 23.13 1.35 ± 0.71
Tangara vitriolina Scrub Tanager 22.11 2.45 ± 1.03
Parula pitiayumi Tropical Parula 20.07 1.46 ± 0.68
Wilsonia canadensis* Canada Warbler 18.71 1.16 ± 0.42
Myioborus miniatus Slate-throated Whitestart 17.35 2.43 ± 1.20
Tangara gyrola Bay-headed Tanager 16.67 2.35 ± 0.97
Tangara cyanicollis Blue-necked Tanager 16.33 2.04 ± 1.01
Basileuterus culicivorus Golden-crowned Warbler 14.29 1.45 ± 0.67
Vireo olivaceus* Red-eyed Vireo 13.61 1.33 ± 0.57
Coereba flaveola Bananaquit 13.61 2.25 ± 1.74
Piranga rubra* Summer Tanager 12.93 1.13 ± 0.34
Polioptila plumbea Tropical Gnatcatcher 12.24 1.56 ± 0.50
continued
Page 64
39
Table 2.6 (continued)
Ramphocelus flammigerus Flame-rumped Tanager 10.54 3.00 ± 1.57
Pachyramphus polychopterus White-winged Becard 9.52 1.29 ± 0.46
Page 65
40
Table 2.7. Result of three co-occurrence indices, C-score, number of species
combinations and checkerboard pairs, and the null model analysis for 11 sites in the
Andes. Expected score generated using the Knight’s Tour Algorithm. Fixed-fixed null
model (SIM9 in Gotelli 2000). P < 0.05*, P < 0.01**. Two localities, Chicamocha and
Tolima, were excluded due to small sample size (< 3 flocks).
Site Country Observed
C-score
Simulated
C-score
Observed species
Combinations
Simulated species
combinations
Carache Venezuela 10.44 10.07** 34 33.99
Aguachica Colombia 2.68 2.54** 14 13.99
San Jose de la Montana Colombia 5.08 4.89** 26 26
Yariguies Colombia 1.56 1.52* 7 7
Abejorral Colombia 9.53 9.03** 36 36
Paya Colombia 3.44 3.33** 14 15 **
Cauca Colombia 6.55 6.45* 29 29
Sangay National Park Ecuador 1.77 1.74** 8 8
Cajamarca Peru 2.36 2.17** 16 16
Pacora Colombia 7.19 1.14** 22 22
SW Antioquia Colombia 45.61 43.37** 82 100**
Page 66
41
Table 2.8. Number of flocks that showed significant differences (P < 0.05) in the
minimum size ratios and the variance of size ratios when compared with randomly
generated flocks. After conducting the binomial test for greater minimum size ratios and
less variance of size ratios, no significant differences were found. Two localities,
Chicamocha and Tolima, were excluded due to small sample size (< 3 flocks).
Minimum size
ratio
Variance of size
ratio
Site Country Total #
flocks
Smaller Greater Smaller Greater
Carache Venezuela 34 23 2 2 11
Aguachica Colombia 12 9 0 0 2
San Jose de la Montana Colombia 26 14 1 0 1
Yariguies Colombia 7 7 0 0 2
Abejorral Colombia 36 12 1 1 4
Paya Colombia 15 13 0 0 1
Cauca Colombia 29 25 0 0 6
Sangay National Park Ecuador 8 6 0 0 1
Cajamarca Peru 16 9 0 0 2
Pacora Colombia 22 14 1 0 2
SW Antioquia Colombia 100 92 0 0 12
Page 67
42
Figure 2.1.Relative proportion of flocking species in Andean flocks represented by each
foraging guild. Lines were constructed by regressing relative abundance vs. log flock size
(following Feeley 2003; for an example, see Appendix C). a. Carache; b. Aguachica; c.
San Jose de la Montana; d. Yariguies.
0
0.2
0.4
0.6
0.8
1
0.30 0.60 0.78 1.11
Prop
ortio
n of
spe
cies
in fl
ocks
Log flock size
0
0.2
0.4
0.6
0.8
1
0.48 1.04
Prop
ortio
n of
spe
cies
in fl
ocks
Log flock size
0
0.2
0.4
0.6
0.8
1
0.60 0.85 0.95
Prop
ortio
n of
spe
cies
in fl
ocks
Log flock size
0
0.2
0.4
0.6
0.8
1
0.85 1.11 1.28
Prop
ortio
n of
spe
cies
in fl
ocks
Log flock size
Omnivore
Nectarivore
Insectivore
Frugivorea b
c d
Page 68
43
Figure 2.2.(Continued). e. Abejorral; f. Paya; g. Cauca; h. Sangay National Park.
0
0.2
0.4
0.6
0.8
1
0.30 0.70 0.90 1.26
Prop
ortio
n of
spe
cies
in fl
ocks
Log flock size
0
0.2
0.4
0.6
0.8
1
0.60 0.85
Prop
ortio
n of
spe
cies
in fl
ocks
Log flock size
0
0.2
0.4
0.6
0.8
1
0.48 0.85 1.04
Prop
ortio
n of
spe
cies
in fl
ocks
Log flock size0
0.2
0.4
0.6
0.8
1
0.60 0.70 0.90
Prop
ortio
n of
spe
cies
in fl
ocks
Log flock size
Omnivore
Nectarivore
Insectivore
Frugivoree f
h g
Page 69
44
Figure 2.3.(Continued). i. Cajamarca; j. Pacora; k. Southwestern Antioquia; l. All
localities together.
0
0.2
0.4
0.6
0.8
1
0.48 0.90 1.11
Prop
ortio
n of
spe
cies
in fl
ocks
Log flock size
0
0.2
0.4
0.6
0.8
1
0.48 0.78 1.04
Prop
ortio
n of
spe
cies
in fl
ocks
Log flock size
0
0.2
0.4
0.6
0.8
1
0.60 0.85 0.90 1.00 1.04
Prop
ortio
n of
spe
cies
in fl
ocks
Log flock size
0
0.2
0.4
0.6
0.8
1
0.3 0.7 0.8 1.0 1.2
Prop
ortio
n of
spe
cies
in fl
ocks
Log flock size
Omnivore
Nectarivore
Insectivore
Frugivorei j
k l
Page 70
45
3 MULTISCALE INFLUENCE OF DEFORESTATION AND HABITAT
ALTERATION ON NEOTROPICAL-NEARCTIC MIGRATORY BIRDS AND
MIXED-SPECIES FLOCKS IN THE ANDES
Abstract. Understanding how anthropogenic disturbance and deforestation affect the
suitability of wintering grounds remains a key issue in the ecology and conservation of
migratory birds. In this study, I examined the association of landscape-scale (i.e.
percentage of forest cover within 1-km2) and microhabitat level (i.e. habitat complexity)
factors on richness and abundance patterns of Neotropical-Nearctic migrants and mixed-
species flocks within five broadly-defined habitat types (shade coffee, pastures with
isolated trees, successional, secondary forest and mature forest) throughout the Northern
and Central Andes. From 2007-2010, I conducted systematic avian surveys along line
transects at 84 1-km2 pixels distributed from Colombia to Peru based on a stratified-
random design. Greatest richness and abundance of migrants and flocks were detected in
forested habitats such as secondary forest and shade coffee. Forest cover tended to
promote species richness and size of flocks, though the strength of association was
habitat-dependent. Whereas habitat complexity was positively associated with flock size
and migrant abundance and diversity in successional and silvopastoral habitats, the
opposite pattern was true in shade coffee and secondary forests. As a whole, richness and
abundance of Neotropical-Nearctic migrantory birds and encounter rates of flocks were
Page 71
46
poorly explained by simple metrics of forest cover and habitat complexity. My research
supports the idea that intensively managed habitats with overstory trees can contribute to
avian conservation by supporting mixed-species flocks. However, the extent to which
restoration and management at regional (e.g., forest protection) and local (e.g., increasing
structural complexity) scales improve ecological conditions for birds cannot be
generalized since it is habitat specific.
Key words: Neotropical-Nearctic migratory birds, mixed-species flocks, Andes, forest
cover, habitat complexity, shade agriculture, silvopasture.
Introduction
The tropical Andes (hereafter the Andes) are widely recognized as one of the
world´s great centers of biodiversity (Rodríguez-Mahecha et al. 2004). High levels of
both species richness and endemism coupled with one of the greatest rates of
deforestation among tropical forests (Whitmore 1997, Wright 2005) have made the
Andes a major focal point for international conservation (Orme et al. 2005). With more
than 70% of the original cover already transformed, the region accounted for more than
one-third of the global forest area that was loss from 2000 to 2005 (FAO 2009). Despite
current and expected increases in deforestation, habitat degradation and fragmentation of
Andean forests, little is still known on the responses of species and key ecological groups
to these processes. Studies on anthropogenically-altered environments have provided
evidence of the effect of landscape matrix on avifauna (Soulé et al. 1988, Harris & Silva-
Lopez 1992, Enoksson et al. 1995), in particular for boreal and temperate birds (Flather
& Sauer 1996, Jokimaki & Huhta 1996, Bayne & Hobson 1997). Much of this research
Page 72
47
has been conducted in Neotropical lowland ecosystems (e.g. Laurance & Bierregaard
1997, Maldonado-Coelho & Marini 2001, 2004), and comparatively little work has been
done in montane forests in the Andes. Previous studies in Andean and subandean forests
have shown that the nature of the landscape matrix is a major factor influencing resident
bird composition and abundance (Restrepo & Gomez 1998, Renjifo 1999, 2001).
Resident birds are known to be sensitive to high rates of nest predation in fragmented
landscapes (Kattan 1994, Renjifo 1999, 2001), especially for extinction-prone
insectivores and large frugivores (Bierregaard et al. 1992, Karr 1982, Sekercioglu et al.
2002, Renjifo 1999, Kattan et al. 1994).
The effects of deforestation and habitat degradation extend beyond direct
population impacts on resident species and also can alter social systems (e.g., mixed-
species flocks; Maldonado-Coelho & Marini 2004, Lee et al. 2005) and wintering
species, including Neotropical-Nearctic migratory birds that rely on Andean forests
during the nonbreeding season (e.g. Robbins et al. 1989). Indeed, declines in populations
of Neotropical-Neartic migrants are frequently attributed, in part, to habitat degradation
and deforestation on wintering grounds (Terborgh 1980, Holmes & Sherry 1988, Faaborg
& Arendt 1989, Robbins et al. 1989, Rappole & MacDonald 1994). However, there
remain large gaps in our understanding of the sensitivity of migratory birds to large-scale
changes in land cover on wintering grounds. Observational and experimental studies have
linked declines in populations of Neotropical migratory birds to reduced food availability
and habitat complexity associated with diminishing habitat patch size and forest cover, as
well as the conversion of the landscape matrix from high to low-quality habitats (Rappole
& MacDonald 1994, Wunderle & Latta 1996, Johnson & Sherry 2001, Carlo et al. 2004).
Page 73
48
Similarly, mixed-species flocks, a key widespread social system in tropical communities,
are reported to be negatively affected by habitat fragmentation and degradation in the
Neotropics (e.g. Harper 1989, Stouffer & Bierregaard 1995, Maldonado-Coelho & Marini
2004, Kumar & O’Donnell 2007). The structure and dynamics of mixed-species flocks
also are known to change as a consequence of habitat fragmentation and degradation
(Maldonado-Coelho & Marini 2000, 2004, Tellería et al. 2001) by way of alterations in
habitat characteristics (e.g. disappearance of microhabitats) and reduction in food
availability (Maldonado-Coelho & Marini 2000, 2004, Tellería et al. 2001). These factors
can affect this social system by changing the frequency of occurrence and abundance of
species within flocks as well as their propensity to flock (Stouffer & Bierregaard 1995,
Thiollay 1992, 1997, 1999, Van Houtan et al. 2006). Because many migratory birds
frequently join mixed-species flocks (Keast & Morton 1980, Robbins et al. 1989,
Rappole 1995), the overwinter condition of migratory species might depend upon
flocking social systems.
Although Neotropical migrants and mixed-species flocks represent important
components of montane forest bird communities in the Andes, no studies have examined
the sensitivity of both groups to forest loss and degradation across regional or landscape
scales. Several studies have shown the importance of the combined effect of
microhabitat, patch and landscape factors in the distribution and patch use of animals
(e.g. Levin 1992, Dooley & Bowers 1998, Lyra-Jorge et al. 2010), including birds (e.g.
Jokimäki & Huhta 1996, Saab 1999, Sodhi et al. 1999, Lee et al. 2002, Luck 2002, Buler
et al. 2007, Coreau & Martin 2007, Deppe & Rotenberry 2008). Particularly, most avian
Page 74
49
landscape studies in the Neotropics have focused on the response of birds within forest
patches (e.g. Kattan et al. 1994, Stouffer & Bierregaard 1995, Renjifo 1999), and very
few studies have evaluated the simultaneous effect of multiple spatial scales (e.g. patch-
and landscape-levels) on distribution of birds in several habitat types (but see Graham &
Blake 2001). Given the high bird diversity and extensive levels of habitat degradation and
deforestation in the Andes, understanding the effect of landscape context on habitat
relationships is key to determining the conservation potential of different habitats.
In this study, I adopted a multi-scale approach to examine the extent to which
migratory birds and mixed-species flocks respond to changes in landscape forest cover
and in local habitat structure across a broad geographical range in the Andes. I
hypothesized that the value of different habitats to Neotropical-Nearctic migratory birds
and mixed-species flocks (as indicated by abundance and diversity metrics) would be
mediated by local and landscape-scale factors. To the best of my knowledge, this is the
first multi-scale study to test for the effects of deforestation and habitat degradation in the
Andes on mixed-species flocks and Neotropical-Nearctic migratory birds along a gradient
of habitat types.
Study area and methods
Study area
The study area encompassed the Northern and Central Andes, from Northern
Colombia (± 8 o N, 73o W) to Northern Peru (± 5 o S, 78 o W), including Ecuador.
Ecosystems in the Andes are diverse, including deserts, open pampas, dry thorn forest,
deciduous forest, rain forest, cloud forest, and paramo above 3,000 m (Petit et al. 1995).
Page 75
50
The study area represented a range of altitudinal diversity, from tropical lowlands at 400
m to low-montane tropical forest at 2,600 m.
I studied five broadly-defined habitat types in the Andes: shade coffee, pastures with
isolated trees (hereafter termed “silvopastures”), successional, secondary forest and
mature forest (Figure 3.1). In this respect, my study differs from most others that focused
exclusively on mature forest in human-dominated matrices (e.g. Stouffer and Bierregaard
1995).
• Shade coffee (usually Coffea arabica) is planted under a layer of trees that dominate
the canopy, typically represented by Inga spp.(Mimosaceae), Tabebuia spp.
(Bignoniaceae), Cordia alliodora (Boraginaceae), Albizia spp. (Mimosaceae), and
Persea spp. (Lauraceae). This habitat type is usually located between 800 and 2,000
m of elevation and it is distributed virtually throughout my study area in the Andes.
• Silvopastoral systems with grazed fields and mature overstory trees were included as
a focal habitat type because they represent an increasingly popular land use that
supports livestock, produce timber, and contribute to ecological restoration efforts by
providing habitat for other species as well as improving soil conditions (Pomareda
2000). While the overstory component of silvopastures structurally resembled the
most open shade coffee farms, silvopastures generally lacked shrubs and dense
understory.
• Successional habitats are typically represented by second-growth habitats, with little
or no tree development (< 10 cm dbh), open canopy, and usually with poorly-
developed shrub layer (< 1 m height).
Page 76
51
• Secondary forests represented naturally regenerating and riverine forests (i.e., not
planted or otherwise intensively managed) in intermediate to advanced levels of
structural (trees > 10 cm dbh and < 10 m height) and composition development (i.e. >
12 years old).
• Mature forests were structurally complex (high and dense canopy > 10 m height, high
basal area) and floristically diverse habitats with relatively little human use. Mature
forests usually occurred in association with reserves and Important Bird Areas, where
human extractive uses were largely prohibited.
Bird sampling
Data on composition, richness and abundance of migratory birds and mixed-
species foraging flocks were recorded within 1-km2 pixels distributed across the Northern
and Central Andes following a stratified random design (for details see Colorado et al.
200 and Appendix A for a summary of the methodology). Of the 200 1-km2 pixels
initially selected for survey, 84 were visited across 11 different regions (i.e. landscapes)
in Colombia (72 pixels), Ecuador (9) and Peru (3; Figure 3.2; Table 3.1). Neotropical-
Nearctic migrants were surveyed at each of 84 1-km2 pixels, but flock data were obtained
for only 39 1-km2 pixels. Surveys were conducted in October-March 2007- 2010, a
period that typically spans the wet (Oct-Nov) and dry (Jan-Feb) seasons in the Andes and
is unlikely to include the migratory period for most focal species. Within each pixel, three
100-m line transects were randomly placed to survey birds entirely within dominant and
relatively homogeneous habitats; transects were separated at least by 250 m, followed a
constant elevation, and sampled the range of elevations within the pixel (Figure 3.3).
Each of the three transects per pixel was surveyed at least 5 times for a minimum of 15
Page 77
52
surveys per pixel typically within a 2-day period. Transects were walked at constant rate
(ca. 30 min for the 100-m length) and all Neotropical- Nearctic migratory birds seen or
heard were recorded by a single observer. Surveys were conducted during peak activity,
between the first half hour after sunrise and 11:00 h and in the afternoon between 14:30 h
and 17:00 h, except during inclement weather. For each individual detected,
perpendicular distance from the bird to the main transect line was visually estimated to
allow later correction for detection probability within each habitat type (Bibby et al.
1992, Thomas et al. 2006).
Flock sampling
I recorded size and species composition of mixed-species flocks encountered
during transect surveys. A mixed-species flock was defined as at least two different
species foraging and moving in a similar direction, with flock members less than 10 m
apart (Morse 1970). Because the boundaries of a flock are continually changing and not
immediately evident to a field observer, I was unable to record distance from transects
and apply distance-based sampling techniques to individuals within flocks. However,
birds foraging in flocks frequently vocalize with contact or alarm calls, and this behavior
improves the likelihood of detecting flocking individuals even in vegetatively-dense
habitats. For each flock, I recorded the number and identity of species and individuals
participating in flocks. For each region/cluster, I calculated flock encounter rate as the
number of flocks encountered per hour of survey. Observation of a flock lasted 15 min,
as most members were detected within this period. I developed a list of regional species
richness of flocking species by pooling all species detected during surveys, flock
Page 78
53
observations, and incidental observations (Latta & Wunderle 1996, Maldonado-Coelho &
Marini 2004).
Vegetation sampling
Habitat structure was measured along each 100-m line transect using a modified
James & Shugart (1970) method. Two 0.04-ha circular plots were established at two
points randomly selected at 0, 20, 40, 60, 80, or 100-m along each transect. When
adjacent points were selected for sampling, plots were relocated to the adjacent point so
they did not overlap. The following variables were recorded within each plot: tree
density (number of stems ≥ 7.6 cm dbh per ha), shrub density (shrub stem count in two
perpendicular two arm-wide times plot radius length rectangular subplots, < 7.6 dbh),
percentage of canopy cover, percentage of ground cover (< 0.5 m), basal area (m2 per ha),
and canopy height (mean of five-randomly selected trees ≥ 7.6 cm dbh). Because
vegetation variables were highly correlated (Table 3.2), I used principal components
analysis to create a composite measure of structural complexity. A metric of regional
forest cover was calculated using ArcView GIS (Version 3.3, Environmental Systems
Research Institute 2002) to quantify the proportion of forest cover within 1-km2 using
500 m x 500 m images from the Global Land Cover Facility MODIS (2001).
Statistical analyses
Abundance estimates based on transect data were corrected for differences in
detection probability using program DISTANCE (Thomas et al. 2006). I lacked
sufficient numbers of detections to estimate detection probability for individual species
and, consequently, used DISTANCE to calculate a global detection function for each
Page 79
54
habitat based on the four most abundant species: Tennessee Warbler (Vermivora
peregrina), Blackburnian Warbler (Dendroica fusca), Red-Eyed Vireo (Vireo olivaceus)
and Summer Tanager (Piranga rubra). Use of a global detection function also was
biologically valid because most migratory species co-occurred in mixed-species flocks.
To account for the differences in sampling (i.e. number of flocks and individuals) among
habitat types, I calculated sample-based rarefaction curves (i.e. smoothed accumulation
curves) rescaled to the number of individuals to compare the number of mixed-species
flock species among habitat types (following Lee et al. 2005). Samples are rarefied to the
same number of individuals (i.e. rescaling by individuals) to allow a valid comparison of
species richness among datasets (Gotelli and Colwell 2001).
I used χ2 to test how flocking frequency of Neotropical migrant species differed
among habitats. Flocking frequency of species was defined as the proportion of mixed-
species flocks in which each migratory species participated across habitats. Species that
flocked significantly less frequently (P < 0.05) in disturbed/deforested habitats were
classified as “sensitive”, whereas the remaining species can be classified as “persistent”
(sensu Lee et al. 2005).
Flock composition among habitats was compared with a two-step procedure.
First, I performed a multi-response permutation procedure (MRPP) to obtain a non-
parametric multivariate test of compositional differences in the mixed-species flocks
among habitats. MRPP is based on an analysis of a rank-transformed distance matrix,
Page 80
55
adopting Sorensen (Bray-Curtis) distance as the distance measure. MRPP tests if the
within-habitat average dissimilarities are smaller than predicted at random (McCune &
Grace 2002), with a significant MRPP test (i.e. P < 0.5) indicating that flock composition
is more similar within than between habitats. Second, I ran an indirect gradient analysis
with non-metric multidimensional scaling (NMS) to ordinate sample units (i.e. 186
mixed-species flocks) in species space (i.e. 220 bird species), using presence-absence of
species in mixed-species flocks. To facilitate interpretation, I plotted the sample scores
(i.e. mixed-species flocks) in the species space on the first and third NMS axes to
graphically show the relative similarity in flock composition among more contrasting
habitats. NMS is similar in general purpose and philosophy to principal component
analysis (i.e. creating composite variables that summarize the dissimilarities in species
composition of the flocks), but reduces the dimension of the data in a nonlinear approach,
and allows the use of non-parametric tests (Péron & Crochet 2009). The NMS procedure
was run using the “autopilot (slow and thorough)” mode with random starting
configuration and applying the same distance measure used in the MRPP (i.e. Sorensen
distance) as a dissimilarity measure, as suggested by McCune & Grace (2002). Both
techniques have previously been used for the analysis of mixed-species flock
composition (e.g. Lee et al. 2005, Péron & Crochet 2009).
Neotropical-Nearctic migrants and mixed-species flocks. I assessed the
relationship between the occurrence of Neotropical migrant species and flock attributes
(i.e. flock richness and flock occurrence) with a multiple regression analysis including
flock size as a dummy variable since this is highly correlated with Neotropical migrant
Page 81
56
attributes (Neotropical migrants in flocks vs. flock size: r = 0.62, P = 0.0, N = 39;
Neotropical migrant richness per site vs. flock size: r = 0.46, P = 0.003, N = 39).
Species associations with environmental variables at the large and small scales. I
used the Akaike’s Information Criterion corrected for small sample size (AICc; Burnham
& Anderson 2002) to identify the set of environmental variables that best explained
flocks and Neotropical migrants attributes across the Andes. Separate analyses were
completed for flocks (richness, abundance, and encounter rate used as response variables)
and Neotropical migrants (richness and abundance in flocks, richness and abundance on
survey transects).I developed an a priori set of 11 candidate models (Table 3.3)
hypothesized to influence abundance and composition of migratory birds and mixed-
species flocks. Each model was run using a regression analysis on the identical data set
(i.e., pixels without missing data). AIC values were calculated based on the log-
likelihood function and models were ranked according to difference (Δi) from the best
model. Models with Δi < 2 were considered to have a strong empirical support and
general linear models on these models were subsequently run to obtain regression
coefficients to describe the nature (positive/negative) of the associations. Akaike model
weights (wi) were used to indicate the relative weight of evidence for each of the
candidate models. To facilitate interpretation, I used the regression equations of the top-
ranked models to graphically assess the response of the Neotropical migrant and flock
attributes by habitat type to changes in the environmental variables by assigning values to
the two major predictor variables (i.e. forest cover and local habitat structure).
Page 82
57
For all statistical tests, an alpha of 0.05 was used to indicate statistical
significance. Mean values are reported with SD. I conducted log-transformation (Y + 0.5)
for those variables that did not fulfill the normality and homogeneity of variance criteria
and they were back-transformed later for interpretability. Analyses were performed using
EstimateS Version 8.0 (Colwell 2006), Distance 5.0 (Thomas, et al. 2006), PC-ORD
version 5 (McCune & Mefford 1999), R version 2.11 (R Development Core Team 2009),
STATGRAPHICS Centurion XV (Statpoint 2005) and Minitab (Minitab Inc. 2007).
Results
Habitat and landscape attributes
The first principal component explained nearly 75% of the variance in local
habitat structure (Table 3.4) and represented a gradient of habitat complexity that was
associated with anthropogenic changes in the landscape. Increasing values indicated
increasing basal area, canopy height, and tree density.
Structural development and horizontal vegetation volume (e.g. canopy height, tree
density and shrub density) were higher in primary forests of the Cordillera del Cóndor in
Perú (Average percentage of forest cover: 72.8) and lower in the dry valleys of the
Chicamocha River (13.5; Figure 3.4). The former location, along with Serrania de los
Yariguies National Park in Colombia and Sangay National Park in Ecuador, represent the
most vegetatively dense sites visited (Figure 3.4, Table 3.4). On the other hand, the dry
valleys of the Chicamocha River along with the Patia region in Colombia, had less
structural complexity (farthest left along PC1, Figure 3.4, Table 3.4), which is consistent
Page 83
58
with the harsh environmental conditions and extensive areas of exposed soils and
savannas.
Percentage of forest cover within 1 km2 differed among habitats (ANOVA, F4, 240
= 15.11, P < 0.001); forested habitats (mature forest = 57.66 ± 10.23, shade coffee =
46.75 ± 14.62) were surrounded by > 12% more forest cover than other habitats
(silvopastures = 31.24 ± 17.89, successional = 34.86 ± 15.53; Figure 3.5). Similarly,
habitat types significantly differed in habitat complexity (ANOVA, F4, 79 = 25.35, P <
0.001), with mature and secondary forest being significantly more complex (2.47 ± 0.29
and -0.24 ± 0.22, respectively) than other habitats (shade coffee = -0.89 ± 0.41,
silvopastures = -0.97 ± 0.32 and successional = -1.23 ± 0.35). Local structural complexity
of habitat (i.e. PC1) was positively associated with forest cover within 1-km2 (r = 0.58, P
< 0.001, N = 84 pixels; Figure 3.6).
Avian communities
I recorded 220 avian species from 27 families in 186 mixed-species flocks in
Colombia (130 flocks), Venezuela (47), Ecuador (8), and Peru (1) during flock surveys,
with an average number of species of 7.91 ± 4.19 (range 2-21) and average number of
individuals of 15.56 ± 10.11 (range 3-52). Avian families most represented in the flocks
were Thraupidae (N = 46 species) and Tyrannidae (N = 35 species). Differences in
sampling effort contributed to uneven distribution of flock observations among
successional (23 flocks), silvopastures (13), shade coffee (48), secondary forest (81) and
mature forest (21). However, after adjusting for effort, flocking frequency of all
Page 84
59
migratory species was similar among the five habitat types surveyed (χ2 ≤ 6.87, P > 0.1,
df = 4), except for the Rose-breasted Grosbeak (χ2 = 10.91, P = 0.03, df = 4), which
flocked significantly less frequently in natural habitats than in shade coffee.
Of the 30 Neotropical-Nearctic migratory landbird species recorded, 20 (67%)
joined mixed-species flocks. Four Neotropical migrants were among the fifteen most
abundant bird species found in mixed-species flocks in the Andes (Table 3.5).
Blackburnian Warbler was found in nearly half of the flocks detected, Tennessee Warbler
in ∼ 20% of flocks, and Cerulean and Canada Warblers in ∼ 10% of flocks (Table 3.5).
Likewise, the most geographically widespread migrants were Blackburnian Warbler,
Tennessee Warbler, Empidonax Flycatchers, Red-eyed Vireo, Summer Tanager and
Swainson’s Thrush, with the latter being the species detected farthest south of the entire
surveyed range (Figure 3.7).
The majority of Neotropical migrants (24 of 30 species) were recorded in
premontane forests at 1000 - 2000 m elevation and between 2-8 o N in latitude, and 73-77
o W in longitude (Figure 3.8). However, after accounting for regional forest cover, neither
Neotropical migrant richness nor abundance were correlated with latitude (F1, 81 = 1.33, P
= 0.25 and F1, 81 < 0.01, P = 0.95, respectively) or elevation (F1, 81 = 0.28, P = 0.6 and F1,
81 = 0.46, P = 0.5, respectively).
As expected, flock richness increased strongly with flock size (r = 0.87, P < 0.01,
N = 186 flocks). Richness of flocks was positively related to regional avian richness (r =
0.64, P = 0.035, N = 11 regions). After accounting for flock size, mean Neotropical
Page 85
60
migrant richness was positively related to both mean total richness per flock (F2,36 = 10.8,
P < 0.01) and flock occurrence (F2,36 = 8.33, P < 0.01; Figure 3.8). Flocks in forested
habitats (i.e. secondary forest, mature forest, silvopasture and shade coffee) gained
species more rapidly and had higher total numbers of species than in degraded
successional habitats (Figure 3.9). Mean species richness (± 95% confidence intervals) in
flocks was 8.9 ± 1.2 in shade coffee, 8.7 ± 3.1 in silvopastures, 7.8 ± 1 species in
secondary forest, 7.4 ± 1.5 in mature forest, and 5.1 ± 1 in successional. Different levels
of Neotropical migrant species richness in flocks were present in all five habitat types,
with flocks in mature forest showing the smallest expected number of migrants (Figure
3.10). Mean species richness (± 95% confidence intervals) of Neotropical migrants in
flocks was 2.1 ± 0.5 in shade coffee, 1.5 ± 0.76 in silvopasture, 1.3 ± 0.3 in secondary
forest, 1 ± 0.46 in mature forest and 0.9 ± 0.5 in successional.
Comparisons of flock composition among habitats based on average within-group
distances showed that all groups (i.e. habitats) had relatively high dispersions (> 0.6;
MacCune and Grace 2002; Table 3.6), and the species composition of mixed-species
flocks significantly differed among habitats (T = -12.095, P < 0.01; Table 3.6). Within
habitats, species composition of flocks was more similar within shade coffee than other
habitats (Figure 3.11), and most dissimilar within successional habitats (Table 3.6).
Among habitats, the greatest heterogeneity (A < 0.1) was found between flocks in
degraded and non-degraded habitats, whereas high homogeneity (A > 0.1) was recorded
among flocks in degraded habitats (Table 3.6).
Page 86
61
Mixed-species flocks attributes (i.e., encounter rate, size, and species richness)
were best explained by the combined effect of patch- (habitat characteristics) and
landscape-scale (regional forest cover) factors (Table 3.7). Richness of mixed-species
flocks was positively associated with landscape-scale forest cover in all but one habitat
(mature forest), and the positive association between regional forest cover and flock
richness was more evident in less-structured habitats (successional and silvopastures,
Figure 3.12; Appendix E and Appendix F). Flock size increased with forest cover in
silvopastoral, successional and secondary forest, but did not increase in shade coffee and
mature forest (Figure 3.13). Flock encounter rate increased with surrounding forest cover
(when >40% forested) in shade coffee (0.59 ± 0.14 flocks·h-1) but was virtually invariant
across landscapes for secondary forest (0.4 ± 0.1 flocks·h-1), silvopastures (0.3 ± 0.13
flocks·h-1), successional (0.2 ± 0.11 flocks·h-1) and mature forest (0.05 ± 0.16 flocks·h-1)
habitats (Figure 3.14).
Increased habitat complexity seemed to promote diversity and abundance of
flocks in less-structured habitats (Figure 3.15 & Figure 3.16; Appendix F and Appendix
G). Flock richness increased with habitat complexity in more degraded habitats (i.e.
successional) and secondary forests, and tended to decrease in shade coffee and mature
forests. Small changes in habitat complexity enhanced the abundance of flocking species
in successional and silvopastoral habitats. For example, increases as small as ∼ 20% in
habitat complexity doubled the amount of individuals in flocks in these habitats. By
contrast, flock size declined with increasing structural complexity in mature forest and
Page 87
62
shade coffee (Figure 3.16). Finally, flock encounter rate appeared insensitive to changes
in habitat complexity in all habitats (Figure 3.17).
Variation in richness and abundance of Neotropical migratory birds detected
along transects was explained by strong interactions among local-, patch- and landscape-
scale environmental factors (Table 3.8; Appendix H). The relationship between forest
cover and Neotropical migrant richness was weak, and migrants seemed to tolerate
variation in the amount of regional forest cover (Figure 3.18; Appendix H). Abundance
of migrants detected along transects in shade coffee was strongly and positively
associated with increasing forest cover (Figure 3.19).
Attributes of Neotropical migrants were most strongly associated with changes in
structural complexity in agroforestry/silvopastoral systems (Figure 3.20 & Figure 3.21).
The number of Neotropical migrant species was positively related to improvement in
structural complexity only in shade coffee. Similarly, complexity was positively
associated with abundance of Neotropical migrants in shade coffee and silvopastures.
Finally, there were no distinctive patterns in attributes of Neotropical migrants in
secondary, mature and successional habitats with changes in habitat complexity (Figure
3.20 & Figure 3.21).
Discussion
Working across broad latitudinal and altitudinal gradients in the Tropical Andes, I
found evidence that Neotropical-Nearctic migratory birds and mixed-species flocks are
sensitive to habitat changes across multiple scales. Although these montane birds were
Page 88
63
sensitive to landscape-scale forest cover, patterns of response were habitat-dependent
(Table 3.9). Deforestation and habitat degradation in the Neotropics are widely
recognized among the most important threats to bird populations (e.g. Terborgh 1980,
Faaborg & Arendt 1989, Robbins et al. 1989, Rappole & MacDonald 1994), but our
current knowledge has largely been based on studies in Neotropical lowlands (e.g.
Laurence & Bierregaard 1997) with some limited work on resident Andean avifauna
(Kattan et al. 1994, Restrepo & Gomez 1998, Renjifo 1999, 2001). Even less research in
the Andes has focused on wintering populations, such as Neotropical-Nearctic migrants,
and social systems such as mixed-species flocks. Hence, my study fills some of these
gaps in knowledge by suggesting that deterministic ecological processes, such as
deforestation and changes in habitat structure, influence Andean forest bird communities.
Both mixed-species flocks and Neotropical-Nearctic migrants were detected at
∼85 % of my randomly-selected study locations, which highlights that flocks are
important components of montane forest ecosystems across the Northern and Central
Andes. My findings are similar to reports that 5 - 20% of tropical avian communities are
represented by migratory birds, and up to 80% of these species can participate to some
extent in flocks (e.g. Rappole & Warner 1980, Robbins et al. 1989, Hutto 1994, Latta &
Wunderle 1996, Maldonado-Coelho & Marini 2000, 2004, Lee et al. 2005, Sridhar &
Sankar 2008). Across the Andes, approximately 65% of the migratory species recorded
during surveys attended mixed-species flocks, and 25% of the most common flocking
species were migratory. Thus, migrants are not only an important component of avifauna
in the Neotropics, but likely play an important role in maintenance of flocking systems
during the non-breeding period.
Page 89
64
I found that patterns in flock and migrant attributes were well explained by
environmental heterogeneity at multiple spatial scales, though habitat-specific
associations depended upon the landscape context. Poulin & Lefebvre (1996) showed
that Neotropical migrants depended upon intact humid lowland forests in central Panama
for food requirements. Similarly, Marra & Holmes (2001) showed that American
Redstarts wintering in xeric forest or successional habitats in Jamaica performed poorly
compared to those in mature mesic forest or mangrove habitats.
Despite complex interactions among landscape, habitat, and microhabitat
attributes, my results indicate that regional forest cover may play an important role in
determining suitability of nonbreeding habitat for overwintering migratory birds, but
apparently not as important as for mixed species flocks. Increasing amounts of forest
cover were generally associated with increasing the size and the richness of flocks. In my
study areas, migrants were consistently underrepresented in less disturbed mature forest.
Though Neotropical migrants were found in areas with regional forest cover as low as
~10% of a 1-km2 area, certain species of conservation concern, such as Cerulean
Warbler, Canada Warbler and Golden-winged Warbler, showed higher thresholds and
occurred only in landscapes with >20% forest cover within 1-km2 area. Because
Neotropical migrants seem are readily observed in disturbed landscapes, some have
suggested that wintering Neotropical migrants are less sensitive to forest cover than
during the breeding season (Robbins et al. 1987, 1992, Askins et al. 1992). Indeed,
several studies have reported that disturbed forests contained more Neotropical migrants
than undisturbed forests, suggesting that small-scale activities, forest openings, and other
minor-to-moderate disturbances enhance the suitability of forested habitats for many
Page 90
65
species of over-wintering migratory birds (Orejuela et al. 1980, Pearson 1980, Petit et al.
1995). However, other empirical studies have demonstrated that migratory species are
highly dependent upon undisturbed forest while on their wintering grounds (e.g. Petit et
al. 1993).
Regional forest cover may be most important in landscapes surrounding
successional habitats and shade coffee. For example, an increase in ∼ 40% of regional
forest cover was associated with a ~ 25% increase in abundance of Neotropical migrants
in successional habitats and a ∼ 50% increase in shade coffee. My results then are
consistent with a large number of studies that document the importance to birds of forest
habitat availability in fragmented landscapes (e.g. McGarigal & McComb 1995, Saab
1999, Renjifo 2001, Lee et al. 2002, Cleary et al. 2005). Moreover, crops such as coffee
benefit from pollination services provided by nearby forests or other natural habitats,
which offer forage and nesting space for pollinators, and increasing forest conversion
may have negative effects on pollinator diversity (Ricketts 2004). Priess et al. (2007)
found for different landscapes with forest patches and coffee plantations in Indonesia,
that forest reduction and the associated decline in pollinators may directly reduce coffee
yields. Interestingly, Neotropical migrants were less sensitive to changes in regional
forest cover surrounding other habitat types, such as secondary forests. Thus, the strength
of the association between regional forest cover and Neotropical migrants seemed to be
habitat-dependent.
Habitat complexity, particularly as related to overstory trees, was most strongly
related to migratory birds in shade coffee and silvopastoral habitats. In these habitats,
increases in complexity of ∼15% to 20% resulted in a one-fold increase in numbers of
Page 91
66
Neotropical migrants, suggesting that large gains may result from relatively small
changes in habitat management. Increasing the overstory tree component may produce
especially strong results, as Cerulean Warbler, Canada Warbler and Golden-winged
Warbler were virtually absent from sites with less than 45% of canopy cover. Tree-
dominated habitats, in particular shade coffee, are known to hold high conservation value
for resident and migratory birds (Robbins et al. 1992, Wunderle & Waide 1993,
Wunderle & Latta 1996, Greenberg 1997, Wunderle & Latta 2000, Tejeda-Cruz &
Sutherland 2004, Johnson et al. 2006), often supporting more migratory species because
the diverse floristic and multi-layer canopy structure of the shading trees (Robbins et al.
1992, Wunderle & Waide 1993, Greenberg et al. 2000, Johnson & Sherry 2001, Carlo et
al. 2004, Johnson et al. 2005). Wunderle & Latta (2000) showed, for example, that
overwinter site persistence and annual return rates of Neotropical migrants in shade
coffee plantations, fell within the average values reported for native forests. Moreover,
Bakermans et al. (2009) demonstrated not only that shade coffee harbored higher
densities of Neotropical migrants than primary forest, but also that several migratory
species significantly improved their body condition through the winter months.To some
extent, the arboreal component in silvopastures may provide some ecological services
resembling those by shade coffee, in particular leguminous trees such as Inga spp. and
Albizia spp., which may partially explain the similar use of silvopastures and shade
coffee. Tree-dominated habitats also may play an important role in establishing or
retaining connectivity among habitat patches in fragmented landscapes. For example,
resident and migratory birds were more reluctant to cross an open field without trees than
one with overstory trees (pers. obs.). Thus, my study further suggests that even in highly
Page 92
67
disturbed landscapes, managing for increased structural complexity in the matrix may
positively influence Neotropical migrants. Several tropical studies have shown that the
type of matrix surrounding a particular patch may influence the movement of bird species
between patches of habitat and that more structurally complex matrices enhance bird
diversity and mobility, particularly for forest birds (Stouffer & Bierregaard 1995,
Bierregaard & Stouffer 1997, Renjifo 1999, Graham & Blake 2001). The potential
benefits of such a strategy are illustrated by one of my study areas, Abejorral (Colombian
Central Andes, Table 3.1), where despite of having a deforested landscape (< 28% of
forest cover remaining), supported >70% of all migrant species in the matrix dominated
by agroforestry systems moderately connected by riverine forests (pers. obs.).
Mixed-species flocks
Composition and size of mixed-species flocks were sensitive to landscape and
habitat features, particularly associated with reduction of forest cover within 1 km2.
When percentage of forest cover was reduced by half, ∼50% fewer species occurred in
mixed-species flocks in all but one habitat type (mature forest). Likewise, Maldonado-
Coelho & Marini (2001, 2004) and Tellería et al. (2001) reported declining species
richness and size of mixed-species flocks as size of rain forest fragments decreased. My
study further showed that the relationship between the reduction of regional forest cover
and the decline in richness of mixed-species flocks was sharper in more-disturbed habitat
such as successional and silvopastures (Fig. 3.12). This decline in richness in flocks was
mostly due to the decline or local disappearance of sensitive bird species of particular
habitat requirements (Tellería et al. 2001) with decrease in regional forest cover and
reduction in habitat complexity. For example, bark insectivores (Lepidocolaptes spp.),
Page 93
68
ground-dweller flocking bird species (e.g. Golden-crowned Warbler and Three-stripped
Warbler), several brush-finches (Genus Atlapetes and Buarremon) and some migrants
such as Canada Warbler, among others, were absent from habitats with degraded
understory or reduced tree component. However, richness of flocks was greater in
secondary forest and agroforestry/silvopastoral habitats than mature forest, but
composition of flocks in the former habitats was most associated with generalists bird
species (e.g. several Tanagers such as Thraupis spp. and Hemithraupis spp.) as well as
several Neotropical migratory parulids (e.g. Dendroica spp. and Vermivora spp.), which
were virtually absent from mature forest.
Although I did not test mechanisms driving the observed patterns, other studies
show that changes in forest cover and habitat structure can affect resource availability
and the diversity of microhabitats (i.e. reduction in foraging strata), directly affecting the
flocking species pool (Robinson & Holmes 1982, Develey & Peres 2000, Telleria et al.
2001, Lee et al. 2005). The species pool, in turn, influences flocks, as demonstrated by
Latta & Wunderle (1996), who found that richness of mixed-species flocks in Hispaniola
was limited primarily by local species richness. Similarly, Maldonado-Coehlo & Marini
(2004) argued that the decrease in species richness of flocks was due to a reduced species
pool in fragments. In my study areas, I found a strong positive association between
richness of mixed-species flocks with both regional avian richness and Neotropical
migrant richness. Thus, low flock richness might stem from an impoverished regional
species pool of both resident a migratory birds. Reduction in the amount of regional
forest cover and an impoverished species pool may also limit the propensity of species to
flock, since they were more consistently found in areas with forest cover above ~ 20%.
Page 94
69
Several studies in the Neotropical lowlands have shown that flocks tend to disintegrate in
forest fragments below a critical size, mainly due to the limitation to support a flock
territory or the extinction of important nuclear species (Maldonado-Coelho & Marini
2004, Stouffer & Bierregaard 1995). Non-systematic observations on several Andean
flocks in our study sites showed that they exhibit, to some extent, territoriality. In
addition, several nuclear bird species (e.g. Myioborus spp., Hylophilus spp. and
Chlorospingus spp.) were virtually absent from highly deforested habitats (e.g. < 10-15%
forest cover within 1-km2). Therefore, loss of regional forest cover may limit the
presence of important nuclear species key for flock formation.
Conservation implications
Overall, my research shows that Neotropical migrants and mixed-species flocks
were influenced by environmental factors operating across multiple spatial scales, and
that the importance of any particular environmental attribute changes with landscape
context and habitat type. As a whole, (1) regions with lower forest cover seemed less able
to support mixed species flocks, (2) habitat complexity tended to be most important (i.e.,
steeper slope) to flock and migrant attributes in deforested landscapes, and (3) high
structural complexity may partially compensate for some of the negative effects of
deforestation, as suggested by the converging trend lines with increasing hábitat
complexity. Nevertheless, while forested habitats continue to play a key role in
providing suitable habitat for both migratory birds and flocks in fragmented and human-
dominated landscapes, my research cautions that local habitat management or restoration
efforts aimed at enhancing conditions for migratory and flocking birds should consider
the strong interactions with environmental attributes at other spatial scales. In particular,
Page 95
70
local conservation actions should carefully consider not only the type of habitat or
ecosystem but also the amount of regional forest cover in the surrounding landscape
matrix.
My research provides additional evidence that shade coffee can provide an
important habitat to overwintering migrants and generalist resident bird species (e.g.
Perfecto et al. 1996, Greenberg et al. 1997, Wunderle & Latta 1998, 2000, Johnson et al.
2006, Bakermans et al. 2009). Nevertheless, conservationists must be careful not to
judge value solely in terms of richness since given that (1) sensitive species, including
regional endemics, often are poorly represented in agroforestry systems and (2) managed
lands may fail to perform other ecosystem services (Tejeda-Cruz & Sutherland 2004,
Johnson et al. 2006). Consequently, agroforestry habitats should not be viewed as
surrogates for mature or primary forests.
Additional work is needed to develop landscape and habitat-specific guidelines
for management and ecological restoration. Future studies on Neotropical migrants
should explicitly incorporate multiple scales and elucidate underlying ecological
mechanisms. Given the scale-dependent nature of habitat selection (e.g. Hutto 1985,
Kelly & Hutto 2005, Deppe & Rotenberry 2008), studies at different spatial scales in the
Andes are needed to understand patterns of habitat use by montane forest birds, including
Neotropical migrants, and to identify effective conservation strategies for fragmented
environments.
Page 96
71
Literature cited
Askins, R. A., Ewert, D. N., & Norton, R. L. (1992). Abundance of wintering migrants in
fragmented and continuous forests in the U.S. Virgin Islands. En J. M. Hagan, &
D. M. Johnston (Edits.), Ecology and conservation of neotropical migrant
landbirds (págs. 197-206). Washington, D.C.: Smithsonian Institution Press.
Bakermans, M. H., Vitz, A. C., Rodewald, A. D., & Rengifo, C. G. (2009). Migratory
songbird use of shade coffee in the Venezuelan Andes with implications for
conservation of cerulean warbler. Biological Conservation , 142, 2476-2483.
Bayne, E. M., & Hobson, K. A. (1997). Comparing the effects of landscape
fragmentation by forestry and agriculture on artificial nests. Conservation Biology
, 11, 1418-1429.
Bibby, C. J., Burgess, D., & Hill, D. A. (1992). Bird census techniques. London:
Academic Press.
Bierregaard, R. O., & Stouffer, P. (1997). Understory birds and dynamic habitat mosaics
in Amazonian rainforests. En W. F. Laurance, & R. O. Bierregaard (Edits.),
Tropical Forest Remnants: Ecology, Management, and Conservation of
Fragmented Communities (págs. 138-155). Chicago, Il: University of Chicago
Press.
Bierregaard, R. O., Lovejoy, T. E., Kapos, V., dos Santos, A. A., & Hutchings, R. W.
(1992). The biological dynamics of the tropical rainforest fragments a prospective
comparison of fragments and continuous forest. BioScience , 42, 859-866.
Page 97
72
Buler, J. J., Moore, F. R., & Woltmann, S. A. (2007). multi-scale examination of stopover
habitat use by birds. Ecology , 88, 1789–1802.
Burnham, K. P., & Anderson, D. R. (2002). Model selection and multimodel inference: a
practical information-theoretical approach (2nd Edition ed.). New York, New
York, US: Springer-Verlag.
Carlo, T. A., Collazo, J. A., & Groom, M. J. (2004). Influences of fruit diversity and
abundance on bird use of two shaded coffee plantations. Biotropica , 36 (4), 602-
614.
Cleary, D. F., Genner, M. J., Boyle, T. J., Setyawati, T., Angraeti, C. D., & Menken, S.
B. (2005). Associations of birds species richness and community composition
with local- and landscape-scale environmental factors in Borneo. Landscape
Ecology , 20, 989-1001.
Colorado, G., Hamel, P., Rodewald, A., & Thogmartin, W. (2008). El grupo cerúleo:
colaboration to assess nonbreeding range of Cerulean Warbler in South America.
Ornitología Neotropical , 19 (Suppl.), 521-529.
Colwell, R. K. (2006). EstimateS: Statistical estimation of species richness and shared
species from samples. Version 8. http://purl.oclc.org/estimates.
Coreau, A., & Martin, J. L. (2007). Multi-scale study of bird distribution and their
response to vegetation change: a Mediterranean example. Landscape Ecology ,
22, 747-764.
Page 98
73
Deppe, J. L., & Rotenberry, J. T. (2008). Scale-dependent habitat use by fall migratory
birds: vegetation structure, floristics, and geography. Ecological monographs , 78
(3), 461-487.
Develey, P. F., & Peres, C. A. (2000). Resource seasonality and the structure of mixed
species bird flock in a coastal Atlantic forest of south-eastern Brazil. Journal of
Tropical Ecology , 16, 33-53.
Dooley, J. L., & Bowers, M. A. (1998). Demographic responses to habitat fragmentation:
experimental tests at the landscape and patch scale. Ecology , 79, 969-980.
Environmental Systems Research Institute. (2002). ArcGIS software. California, US.
Faarborg, J., & Arendt, W. J. (1989). Long-term declines in witer resident walbers in a
Puerto Rican dry forest. American Birds , 43, 1226-1230.
FAO. (2009). The State of the World’s Forests. Rome: Food and Agriculture
Organization of the United
Nations.http://www.fao.org/docrep/011/i0350e/i0350e00.HTM.
Flather, C. H., & Sauer, J. R. (1996). Using landscape ecology to test hypotheses about
large-scale abundance patterns in migratory birds. Ecology , 77, 28-35.
Gotelli, N. J., & Colwell, R. K. (2001). Quantifying biodiversity: procedures and pitfalls
in the in the measurement and comparison of species richness. Ecology letters , 4,
379-391.
Graham, C. H., & Blake, G. (2001). The influence of patch and landscape level factors on
bird assemblages in a fragmented tropical landscape. Ecological Applications ,
11, 1709-1721.
Page 99
74
Greenberg, R. (2000). Birds of many feathers: the formation and structure of mixed-
species flocks of forest birds. En S. Boinski, & P. A. Garber (Edits.), On the move
(págs. 521-558). Chicago: University of Chicago Press.
Greenberg, R., Bichier, P., & Sterling, J. (1997). Bird populations in rustic and planted
shade coffee plantations of eastern Chiapas, Mexico. Biotropica , 29, 501-514.
Harper, L. H. (1989). The persistence of ant-following birds in small forest fragments.
Acta Amazonica , 19, 249-263.
Harris, L. D., & Silva-Lopez, G. (1992). Forest fragmentation and the conservation of
biological diversity. En P. L. Fiedler, & S. K. Jain (Edits.), Conservation biology:
the theory and practice of nature conservation, preservation, and management
(págs. 197-237). New York, US: Chapman and Hall.
Holmes, R. T., & Sherry, T. W. (1988). Assessing population trends of New Hampshire
forest birds: local vs. regional patterns. Auk , 105, 756-768.
Hutto, R. L. (1985). Habitat selection by nonbreeding, migratory land birds. En M. L.
Cody (Ed.), Habitat selection in birds. (págs. 455-476). Orlando: Academic Press.
Hutto, R. (1994). The composition and social organization of mixed-species flocks in a
tropical deciduous foret in western Mexico. Condor , 96, 105-118.
James, F. C., & Shugart, H. H. (1970). A quantitative method of habitat description.
Audubon Field Notes , 24, 727-736.
Johnson, M. D., & Sherry, T. W. (2001). Effecs of food availabiliy on the distribution of
migratory warblers among habitats in Jamaica . Jornal of Animal Ecology , 70,
546-560.
Page 100
75
Johnson, M. D., Sherry, T. W., Holmes, R. T., & Marra, P. P. (2006). Assessing habitat
quality for a migratory songbird wintering in natural and agricultural habitats.
Conservation Biology , 20 (5), 1433-1444.
Johnson, M. D., Sherry, T. W., Strong, A. M., & Medori, A. (2005). Migrants in
Neotropical bird communities: an assessment of the breeding currency hypothesis.
Journal of Animal Ecology , 74 (2), 333-341.
Jokimäki, J., & Huhta, E. (1996). Effects of landscape matrix and habitat structure on a
bird community in northern Finland: a multi-scale approach. Ornis Fennica , 73,
97-113.
Jullien, M., & Thiollay, J. M. (1998). Multi-species territoriality and dynamics of
neotropical understory bird flocks. Journal of Animal Ecology , 67, 227-252.
Karr, J. R. (1982). Population variability and extinction in the avifauna of a land bridge
island. Ecology , 63, 1975-1978.
Kattan, G. H., Alvarez-López, H., & Giraldo, M. (1994). Forest fragmentation and bird
extinctions: San Antonio eighty years later. Conservation Biology , 8, 138-146.
Keast, A., & Morton, E. S. (1980). Migrant birds in the neotropics: Ecology, behavior,
distribution, and conservation. Washington, D C: Smithsonian Institution Press.
Kelly, J. F., & Hutto, R. L. (2005). An east-west comparison of migration in North
American wood warblers. Condor , 107, 197-211.
Kumar, A., & O´Donnell, S. (2007). Fragmentation and elevation effects on bird-army
ant interactions in neotropical montane forest of Costa Rica. Journal of Tropical
Ecology , 23, 581-590.
Page 101
76
Latta, S. C., & Wunderle, J. M. (1996). The composition and foraging ecology of mixed-
species flocks in pine forest of Hspaniola. Condor , 98, 595-607.
Laurence, W. F., & Bierregaard, R. O. (Edits.). (1997). Tropical forest remnants:
ecology, management, and conservation of fragmented communities. Chicago,
Illinois, US: University of Chicago Press.
Lee, M., Fahrig, L., Freemark, K., & Currie, D. J. (2002). Importance of patch scale vs.
landscape scale on selected forest birds. Oikos , 96 (1), 110-118.
Lee, T. M., Soh, M. C., Sodhi, N., Koh, L. P., & Lim, S. L. (2005). Effects of habitat
disturbance on mixed species bird flocks in a tropical sub-montane rainforest.
Biological Conservation , 122, 193-204.
Levin, S. A. (1992). The problem of pattern and scale in ecology. Ecology , 73 (6), 1943-
1967.
Lovejoy, T. E., Bierregaard, R. O., Rylands, A. B., Malcolm, J. B., Quintela, C., Harper,
L. H., y otros. (1986). Edge and other effects of isolation on Amazon forest
fragments. En M. A. Soulé (Ed.), Conservation biology. The science of scarcity
and diversity (págs. 257-285). Sunderland: Sinauer Associates.
Luck, G. W. (2002). The habitat requirements of the rufous treecreeper (Climacteris
rufa). 1. Preferential habitat use demonstrated at multiple spatial scales.
Biological Conservation , 105, 383-394.
Lyra-Jorge, M. C., Ribeiro, M. C., Ciocheti, G., Tambosi, L. R., & Pivello, V. R. (2010).
Influence of multi-scale landscape structure on the occurrence of carnivorous
Page 102
77
mammals in a human-modified savanna, Brazil. European Journal of Wildlife
Research , 56 (3), 359-368.
Maldonado-Coelho, M., & Marini, M. A. (2000). Effects of forest fragment size and
successional stage on mixed-species bird flocks in southeastern Brazil. Condor ,
102, 585-594.
Maldonado-Coelho, M., & Marini, M. A. (2004). Mixed-species bird flocks from
Brazilian Atlantic forest: the effects of forest fragmentation and seasonality on
their size, richness and stability. Biological Conservation , 116, 19-26.
Marra, P. P., & Holmes, R. T. (2001). Consequences of dominance-mediated habitat
segregation in American Redstarts during the nonbreeding season. Auk , 118, 92-
104.
McCun, B., & Mefford, M. J. (1999). PC-ORD. Multivariate Analysis of Ecological
Data, Version 4. MjM Software Design. Gleneden Beach, OR, USA.
McCune, B., & Grace, J. (2002). Analysis of Ecological Communities. Gleneden Beach:
MjM Software Design.
McGarigal, K., & McComb, W. C. (1995). Relationships between landscape structure
and breeding birds in the Oregon Coast Range. Ecological Monographs , 65, 235-
260.
Minitab Inc. (2007). Minitab Version 15.1. PA, US.
MODIS. (2001). Global land cover facility. University of Maryland, NASA, Institute for
Advanced Computer Analysis.
Page 103
78
Morse, D. H. (1970). Ecological aspects of some mixed-species foraging flocks of birds.
Ecological monographs , 40, 119-168.
Orejuela, J. E., Rait, J. R., & Humberto, A. (1980). Differential use by North American
migrants of three types of Colombian forests. En A. Keast, & E. S. Morto (Edits.),
Migrant birds in the Neotropics: ecology, behavior, distribution and conservation
(págs. 253-264). Washington D.C.: Smithsonian Institution Press.
Orme, C. D., Davies, R. G., Burgess, M., Eigenbrod, F., Pickup, N., Olson, V. A., y otros.
(2005). Global hotspots of species richness are not congruent with endemism or
threat. Nature , 436, 1016-1019.
Pearson, D. L. (1980). Bird migration in Amazonian Ecuador, Peru and Bolivia. En A.
Keast, & E. S. Morton (Edits.), Migrant birds in the Neotropics: ecology,
behavior, distribution and conservation (págs. 273-283). Washington, DC.:
Smithsonian Institution Press.
Perfecto, I., Rice, R., Greenberg, R., & van de Voor, M. E. (1996). Shade coffee: a
disappearing refuge for biodiversity. BioScience , 46, 598-608.
Peron, G., & Crochet, P.-A. (2009). Edge effect and structure of mixed-species bird
flocks in an Afrotropical lowland forest. Journal of Ornithology , 150, 585-599.
Petit, D. R., Lynch, J. F., Hutto, R. L., Blake, J. G., & Waide, R. B. (1995). Habitat Use
and Conservation in the Neotropics. En T. E. Martin, & D. M. Finch, Ecology and
Management of Neotropical Migratory Birds (págs. 145-197). New York, New
York, US: Oxford University Press Inc.
Page 104
79
Petit, D. R., Lynch, J. F., Hutto, R. L., Blake, J. G., & Waide, R. B. (1993). Management
and conservation of migratory landbirds overwintering in the Neotropics. En D.
M. Finch, & P. W. Stangel (Edits.), Status and management of Neotropical
migratory birds (págs. 70-92). Fort Collins, CO: Gen. Tech. Rep. RM-229. USDA
Forest Service, Rocky Mt. Forest Range Exp. Sta.
Pomareda, C. (2000). Perspectivas en los mercados y oportunidades para la inversión en
ganadería. Costa Rica: CATIE-FAO-SIDE.
Poulin, B., & Lefebvre, G. (1996). Dietary relationships of migrant and resident birds
from a humid forest in Central Panama. Auk , 113, 277-287.
Priess, J. A., Mimler, M., Klein, A. M., Schwarze, S., Tscharntke, T., & Steffan-
Dewenter, I. (2007). Linking deforestation scenarios to pollination services and
economic returns in coffee agroforestry systems. Ecological Applications , 17 (2),
407-417.
Rappole, J. H. (1995). The Ecology of Migrant Birds: A Neotropical perspective.
Washington D.C.: Smithsonian Institution Press.
Rappole, J. H., & McDonald, M. V. (1994). Cause and effect in population declines of
migratory birds. Auk , 111, 652-660.
Rappole, J. H., & Warner, D. W. (1980). Ecological aspects of migrant bird behavior in
Veracruz, Mexico. En A. Keast, & E. S. Morton (Edits.), Migrant birds in the
neotropics: ecology, distribution, and conservation (págs. 253-393). Washington:
Smithsonian Institution Press.
Page 105
80
R-Development Core Team. (2009). R: A language and environment for statistical
computing. Obtenido de R Foundation for Statistical Computing: www.R-
project.org
Renjifo, L. M. (1999). Composition changes in a subandean avifauna after long-term
forest fragmentation. Conservation Biology , 13, 1124-1139.
Renjifo, L. M. (2001). Effect of natural and anthropogenic landscape matrices on the
abundance of subandean bird species. Ecological Applications , 11 (1), 14-31.
Restrepo, C., & Gómez, N. (1998). Responses of understory birds to anthropogenic edges
in a Neotropical montane forest. Ecological Applications , 8, 170-183.
Ricketts, T. H. (2004). Tropical forest fragments enhance pollinator activity in nearby
coffee crops. Conservation Biology , 18, 1262-1271.
Robbins, C. J., Sauer, R. S., Greenberg, R. S., & Droeger, S. (1989). Popoulation declines
in Nort America Birds that migrate to the Neotropics. Proceedings of the National
Academy of Sciences , 86, 7658-7662.
Robbins, C. S., Dowell, B. A., Dawson, D. K., Colon, J. A., Estrada, R., Sutton, A., y
otros. (1992). Comparison of Neotropical migrant landbird populations wintering
in tropical forest, isolated forest fragments, and agricultural habitats. En J. M.
Hagan III, & D. W. Johnston, Ecology and Conservation of Neotropical Migrant
Landbirds (págs. 207-220). Washington DC: Smithsonian Institution Press.
Robbins, C. S., Dowell, B. A., Dawson, D. K., Colon, J., Espinoza, F., Rodriguez, J., y
otros. (1987). Comparison of Neotropical winter bird populations in isolated
patches versus extensive forest. Acta Oecol./Oecol. Gen. , 8, 282-292.
Page 106
81
Robinson, S. K., & Holmes, R. T. (1982). Foraging behavior of forest birds: the
relationships among search tactics, diet, and habitat structure. Ecology , 63, 1918-
1931.
Rodríguez-Mahecha, J. V., Salaman, P., Jorgensen, P., Consiglio, T., Forno, E., Telesca,
A., y otros. (2004). Tropical Andes. En R. A. Mittermeier, P. R. Gil, M.
Hoffmann, J. Pilgrim, T. Brooks, C. Goettsch Mittermeier, y otros, Hotspots
Revisited: Earth´s Biologically Richest and Most Endangered Terrestrial
Ecoregions (págs. 73-79). Mexico City: CEMEX.
Saab, V. (1999). Importance of spatial scale to habitat use by breeding birds in riparian
forests: a hierarchical analysis. Ecological Applications , 9, 135-151.
Sekercioglu, C. H., Ehrlich, P. R., Daily, G. C., Aygen, D., Goehring, D., & Sandi, R. F.
(2002). Disappearance of insectivorous birds from tropical forest fragments.
Proceedings of the National Academy of Sciences (USA) , 99, 263-267.
Sodhi, N. S., Briffett, C., Kong, L., & Yuen, B. (1999). Bird use of linear areas of a
tropical city: implications for park connector design and management. Landscape
and Urban Planning , 45, 123–130.
Soulé, M. E., Bolger, D. T., Albert, A. C., Wright, J., Sorice, M., & Hill, S. (1988).
Reconstructed dynamics of rapid extinctions of chaparral-requiring birds in urban
habitat islands. Conservation Biology , 2, 75-92.
Sridhar, H., & Sankar, K. (2008). Effects of habitat degradation on mixed-species bird
flocks in Indian rain forests. Journal of Tropical Ecology , 24, 135-147.
STATPOINT. (2005). Statgraphics Centurion XV. Herndon, VA, US: StatPoint.
Page 107
82
Stouffer, P. C., & Bierregaard, R. O. (1995). Use of Amazonian forest fragments by
understory insectivorous birds. Ecology , 76, 2429-2445.
Tejeda-Cruz, C., & Sutherland, W. J. (2004). Bird responses to shade coffee production.
Animal Conservation , 7, 169-179.
Tellería, J. L., Virgós, E., Carbonell, R., Pérez-Tris, J., & Santos, T. (2001). Behavioural
responses to changing landscapes: flock structure and anti-predator strategies of
tits wintering in fragmented forests. Oikos , 95, 253-264.
Terborgh, J. (1980). The conservation status of Neotropical migrants: present and future.
En A. Keast, & E. S. Morton (Edits.), Migrant birds in the Neotropics: ecology,
behavior, distribution, and conservation (págs. 21-30). Washington, DC.:
Smithsonian Institution Press.
Thiollay, J. (1999). Frequency of mixed species flocking in tropical forest birds and
correlates of predation risk: an intertropical comparison. Journal of Avian Biology
, 30, 282-294.
Thiollay, J. M. (1997). Disturbance, selective logging and bird diversity: a neotropical
forest study. Diversity and conservation , 6, 1377-1395.
Thiollay, J. M. (1992). Influence of selective logging on bird species diversity in a
Guianan rain forest. Conservation Biology , 6 (1), 47-63.
Thiollay, J. M. (1993). Response of raptor community to shrinking area and degradation
of tropical rain forest in the South Western Ghats (India). Ecography , 16, 97-110.
Page 108
83
Thomas, L., Laake, J. L., Strindberg, S., Marques, F. F., Buckland, S. T., Borchers, D. L.,
y otros. (2006). Distance 5.0. Release 2. United Kingdom: Research Unit for
Wildlife Population Assessment, University of St. Andrews.
Van Houtan, K. S., Pimm, S. L., Bierregaard, R. O., Lovejoy, T. E., & Stouffer, P. C.
(2006). Local extinctions in flocking birds in Amazonian forest fragments.
Evolutionary Ecology Research , 8, 129-148.
Whitmore, T. C. (1997). Tropical forest disturbance, dissappearance, and species loss. En
W. F. Laurence, & R. O. Bierregaard, Tropical Forest Remnants: Ecology,
Management, and Conservation of Fragmented Communities (págs. 3-12).
Chicago, US: The University of Chicago Press.
Wright, S. J. (2005). Tropical forests in a changing environment. Trends in Ecology and
Evolution , 20, 553-560.
Wunderle, J. M., & Latta, S. C. (1996). Avian abundance in sun and shade coffee
plantations and remnant pine forests in the Cordillera Central, Dominican
Republic. Ornitologia Neotropical , 7, 19-34.
Wunderle, J. M., & Latta, S. C. (2000). Winter site fidelity of Nearctic migrants in shade
coffee plantations of different sizes in the Dominican Republic. The Auk , 117 (3),
596-614.
Wunderle, J. M., & Waide, B. (1993). Distribution of overwintering Nearctic migrants in
the Bahamas and Greater Antilles. Condor , 95, 904-933.
Page 109
84
Table 3.1. Site characteristics for 11 different landscapes on the Colombian, Ecuadorian
and Peruvian Andes. Values presented are mean ± SD.
Correlation with
Habitat variable Mean ± SD PC1 PC2
Tree density (stems ha-1) 320.67 ± 197.87 0.973** -0.184
Shrub density 19.01 ± 11.8 0.904** -0.124
Canopy cover (%) 52.33 ± 16.17 0.829** 0.491
Ground cover (%) 54.39 ± 21.81 0.68* 0.708*
Basal area (m2 ha-1) 21.6 ± 22.67 0.824** -0.352
Canopy height (m) 10.33 ± 4.45 0.923** -0.332
Eigenvalue 4.44 1.03
Cumulative variance explained (%) 74.06 91.18
Page 110
85
Table 3.2. Pearson’s correlations for 6 structural variables derived from 487 vegetation
plots in 11 regions in the Andes. *P < 0.05; **P < 0.01.
Tree density
(stems ha-1)
Shrub density Canopy cover
(%)
Ground cover
(%)
Basal area
(m2 ha-1)
Shrub density 0.599**
Canopy cover (%) 0.461** 0.161
Ground cover (m) 0.223 0.384* 0.548**
Basal area (m2 ha-1) 0.579** 0.366* 0.202 0.039
Canopy Height (m) 0.767** 0.457** 0.433** 0.322* 0.8**
Page 111
86
Table 3.3. Set of candidate models to test for relationships between flocks and migrants
attributes and environmental effects. K represents number of parameters to be estimated.
Hypothesis Candidate model K Ecological rationale
Null model Null (Ø) 1 No relationship. Predictor variables do not explain variation any better than a constant.
Deforestation Forest cover within 1 km2 pixel
2 Forested landscapes improve connectivity, reduce area and edge effects, and reduce human-associated disturbances.
Habitat patch type Habitat types 5 Habitat types differ in the quality and type of resources provided to different species.
Local structural complexity
Structural complexity of local habitat
2 Increasing levels of structural complexity, both vertically (e.g., canopy height) and horizontally (e.g., shrub density), promote greater number of species and individuals.
Deforestation and habitat type
Forest cover + Habitat type
6 Species and flocks are sensitive both to amounts of forest cover in the landscape and type of habitat patch.
Habitat type and local structural complexity
Habitat type + local structure
6 Species and flocks are sensitive to both habitat type and local structural complexity.
Interaction- deforestation and habitat in the landscape
Forest cover + Habitat type + interaction
10 The effect of deforestation (i.e. percentage of forest cover) depends upon the type and amount of habitat in the landscape.
Interaction-Habitat type and local structural complexity
Habitat type + local structure + interaction
10 Sensitivity to deforestation depends on the structural complexity of the habitat.
Interaction-deforestation and local structural complexity
Forest cover + Local structure + interaction
4 Regional forest cover is associated with local habitat structure.
Deforestation-habitat type and local structural complexity relationships
Habitat type + local structure + forest cover
7 Multi-scale effects of predictor variables on attributes of mixed-species flocks and migrants.
Interaction- deforestation-Habitat type and local structural complexity relationships
Habitat type + local structure + forest cover + interactions
20 Landscape context affects relationships with habitat type and structure.
Page 112
87
Table 3.4.Correlation of habitat variables with derived Principal Components Analysis
scores, eigenvalue and cumulative variance explained in 11 regions in the Northern and
Central Andes. *P < 0.05; **P < 0.01.
Correlation with
Habitat variable Mean ± SD PC1 PC2
Tree density (stems ha-1) 320.67 ± 197.87 0.973** -0.184
Shrub density 19.01 ± 11.8 0.904** -0.124
Canopy cover (%) 52.33 ± 16.17 0.829** 0.491
Ground cover (%) 54.39 ± 21.81 0.68* 0.708*
Basal area (m2 ha-1) 21.6 ± 22.67 0.824** -0.352
Canopy height (m) 10.33 ± 4.45 0.923** -0.332
Eigenvalue 4.44 1.03
Cumulative variance explained (%) 74.06 91.18
Page 113
88
Table 3.5. Fifteen most common bird species in 186 mixed-species flocks in the Andes.
The metric represents the percentage of flocks that included the listed species.
Species
Occurrence in mixed-
species flocks (%)
Blackburnian Warbler Dendroica fusca 0.43
Blue-gray Tanager Thraupis episcopus 0.35
Golden-faced Tyrannulet Zymmerius chrysops 0.26
Slate-throated Whitestart Myioborus miniatus 0.25
Scrub Tanager Tangara vitriolina 0.24
Bay-headed Tanager Tangara gyrola 0.23
Tennessee Warbler Vermivora peregrina 0.22
Blue-necked Tanager Tangara cyanicollis 0.18
Golden-crowned Warbler Basileuterus culicivorus 0.14
Bananaquit Coereba flaveola 0.14
Cerulean Warbler Dendroica cerulea 0.13
Tropical Parula Parula pitiayumi 0.13
Golden-fronted Whitestart Myioborus ornatus 0.12
Canada Warbler Wilsonia canadensis 0.11
Golden Tanager Tangara arthus 0.11
Page 114
89
Table 3.6. Summary statistics for MRPP results of comparisons of average within-group
distance of mixed-species flocks across five different habitats in the Andes. T represents
the test statistic describing the separation between habitats (the more negative, the
stronger the separation); P represents the probability of the expected delta (the weighted
mean within-group distance) calculated for all possible partitions of the data being as
small or smaller than the observed delta; and A represents the chance-corrected within
group agreement describing the within-group homogeneity as compared to random
expectation (e.g. A = 0 when heterogeneity within groups equals expectation by chance;
MacCune and Grace 2002).
Habitat (sample size) Average within-group distance (ranked Sorenson
distance)
T P A
Successional (23) 0.933
Secondary forest (81) 0.916
Mature forest (21) 0.901
Silvopasture (13) 0.895
Shade coffee (48) 0.84
All (186 flocks) -12.095 0.000 0.020
Multiple pairwise comparisons
Shade vs. mature forest -15.094 0.037 0.000
Shade vs. secondary forest -10.035 0.013 0.000
Secondary vs. mature forest -9.198 0.014 0.000
Pastures w/trees vs. mature forest -5.548 0.021 0.000
Successional vs. mature forest -4.975 0.028 0.000
Shade coffee vs. pastures w/trees -3.830 0.009 0.002
Secondary forest vs. successional -1.815 0.003 0.054
Shade coffee vs. successional -0.978 0.003 0.158
Pastures w/trees vs. successional -0.767 0.004 0.208
Secondary forest vs. silvopasture -0.589 0.001 0.245
Page 115
90
Table 3.7. Regression models to relate flock attributes and environmental variables.
Model selection was based on biased-adjusted Akaike’s Information Criterion (AICc).
Statistics include the number of estimated parameters (K), the second-order Akaike
Information Criterion (AICc), AIC differences (ΔAICc), and Akaike weights (wi).
Models are listed in descending order of wi. Models with ΔAICc < 2 are listed.
Model K AICc ΔAICc wi
Flock richness
Habitat + local structure + forest cover
+ interactions 20 191.587 0.000 0.985
Flock size
Habitat + local structure + Habitat x
local structure 10 102.538 0.000 0.485
Habitat + local structure + forest cover
+ interactions 20 103.057 0.518 0.374
Flock encounter rate
Habitat + forest cover + interactions 10 21.888 0.000 0.441
Local structure + forest cover +
interactions 4 23.244 1.356 0.224
Page 116
91
Table 3.8. Regression models relating environmental variables and richness and
abundance of Neotropical migrants detected on transects. Model selection was based on
biased-adjusted Akaike’s Information Criterion (AICc). Statistics include the number of
estimated parameters (K), the second-order Akaike information Criterion (AICc), AIC
differences (ΔAICc), and Akaike weights (wi). Models are listed in descending order of
wi. Only models with ΔAICc < 2 are listed.
Model K AICc ΔAICc wi
Neotropical migrants richness
NTMB richness = local structure + forest cover + local
structure*forest cover 4 91.047 0.000 0.533
NTMB richness = habitat type 5 92.693 1.646 0.234
Neotropical migrants abundance
NTMB abundance = local structure + forest cover + local
structure*forest cover 4 207.15 0.000 0.481
NTMB abundance = habitat type 5 208.41 1.26 0.256
Page 117
92
Table 3.9. Summary of main relationships of forest cover and habitat complexity on
flocks and Neotropical migrant attributes in different habitat types.
Attribute Forest cover Habitat complexity
Flock richness Successional habitat + + Silvopasture + + Shade coffee + 0 Secondary forest + + Mature forest 0 - Flock size Successional habitat + + Silvopasture + + Shade coffee 0 - Secondary forest + + Mature forest - - Flock encounter rate Successional habitat 0 0 Silvopasture 0 0 Shade coffee + 0 Secondary forest 0 0 Mature forest 0 0 NTMB richness on transects Successional habitat 0 0 Silvopasture 0 0 Shade coffee 0 + Secondary forest 0 0 Mature forest 0 0 NTMB abundance on transects Successional habitat 0 0 Silvopasture 0 + Shade coffee + + Secondary forest 0 0 Mature forest 0 0
Page 118
93
Figure 3.1. Five habitat types identified during surveys in the Andes. From the top left to
the bottom, clockwise: mature forest, secondary forest, shade coffee, pastures with
isolated trees and successional.
Page 119
94
Figure 3.2. Eleven surveyed locations in the Northern and Central Andes. Numbers
represent 1-km2 pixel sites visited within each region. From north to south: Aguachica,
San José de la Montaña, Yariguies, Chicamocha, Abejorral, Paya, Ibague, Rosas, Patia,
Sangay National Park and Chingozales.
Page 120
95
Figure 3.3. Example of field sampling design for allocating 100 m line transects within 1-
km2 pixels to survey bird fauna and to locate temporary vegetation plots in the Andes.
Page 121
96
Figu
re 3
.4. O
rdin
atio
n of
hab
itat f
eatu
res f
or 1
1 re
gion
s in
the
Nor
ther
n an
d C
entra
l And
es b
ased
on
habi
tat f
acto
rs. D
ata
labe
ls re
fer
to p
erce
ntag
e of
fore
st c
over
per
regi
on. P
C1
refle
cted
incr
easi
ng h
abita
t com
plex
ity (e
.g.,
dens
ity o
f woo
dy p
lant
s, ca
nopy
hei
ght a
nd
cove
r, ba
sal a
rea,
gro
und
cove
r), a
nd P
C2
was
pos
itive
ly c
orre
late
d w
ith p
erce
ntag
e of
gro
und
cove
r.
PC1
PC2
-3-1
13
5-2
-1.5-1
-0.50
0.51
1.5
Chic
amoc
ha: 1
3.5
Agua
chic
a; 3
7.6
Ibag
ue; 1
5.4
Yari
guie
s; 5
5.9
Rosa
s; 5
9.4
Abej
orra
l; 27
.6
Paya
; 47.
1 Sa
n Jo
se d
e la
Mon
tana
; 49.
3
Chin
goza
les;
72.
8
Sang
ay N
atio
nal P
ark;
65.
4 Pa
tía: 1
6.4
96
Page 122
97
Figu
re 3
.5. P
erce
nt fo
rest
cov
er w
ithin
1-k
m2 p
ixel
s diff
ered
am
ong
five
habi
tat t
ypes
in th
e A
ndes
, 200
7-20
10. D
iffer
ent l
ette
rs
indi
cate
sign
ifica
nt d
iffer
ence
s am
ong
habi
tats
usi
ng α
= 0
.05.
010203040506070
Mat
ure
fore
stSh
ade
coff
eeSe
cond
ary
fore
stSu
cces
sion
alSi
lvop
astu
res
Regional forest cover (%)
Hab
itat t
ype
97
a
b
bc
d
cde
de
Page 123
98
Figu
re 3
.6. R
elat
ions
hip
betw
een
stru
ctur
al c
ompl
exity
of t
he h
abita
t and
per
cent
age
of fo
rest
cov
er o
btai
ned
for 8
4 1-
km2 p
ixel
s in
the
And
es.
-4-3-2-1012345
010
2030
4050
6070
80
Increasing habitat complexity (PC1)
Fore
st c
ove
r (%
)
98
Page 124
99
Figure 3.7. Species richness of Neotropical-Nearctic migrants increased with flock
richness and flock encounter rate (i.e. Number of flocks encountered per hour of survey).
Lineal models were constructed accounting for flock size.
Flock richness
NTM
B ric
hnes
s
0 3 6 9 12 15-0.5
0
0.5
1
1.5
Flock encounter rate
NTM
B ric
hnes
s
0 0.5 1 1.5-0.5
00.5
11.5
22.5
Page 125
100
Figu
re 3
.8. G
eogr
aphi
c di
strib
utio
n of
Neo
tropi
cal-N
earc
tic m
igra
nts i
n th
e A
ndes
alo
ng e
leva
tion
and
latit
ude
grad
ient
s.
0
250
500
750
1000
1250
1500
1750
2000
2250
2500
-6-5
-4-3
-2-1
01
23
45
67
89
Elevation (m)
Lati
tud
e
Cat
har
us
ust
ula
tus
Cat
har
us
min
imu
s
De
nd
roic
a ce
rule
aD
en
dro
ica
fusc
a
De
nd
roic
a ca
stan
ea
Myi
arch
us
crin
itu
s
Mn
ioti
lta
vari
aSe
top
hag
a ru
tici
lla
Pir
anga
ru
bra
Ve
rmiv
ora
pe
regr
ina
Emp
ido
nax
sp
.P
he
uct
icu
s lu
do
vici
anu
s
Seiu
rus
no
veb
ora
cen
sis
Vir
eo
oliv
ace
us
Ve
rmiv
ora
ch
ryso
pte
raC
on
top
us
sp.
Pro
ton
ota
ria
citr
ea
Op
oro
rnis
ph
ilad
elp
hia
Wils
on
ia c
anad
en
sis
Pir
anga
oliv
ace
a
De
nd
roic
a p
ete
chia
Tyra
nn
us
sava
na
Cal
idri
s m
inu
tilla
Ch
arad
riu
s co
llari
s
Act
itis
mac
ula
ria
Trin
ga f
lavi
pe
s
Trin
ga m
ela
no
leu
caTr
inga
so
litar
ia
100
Page 126
101
Figu
re 3
.8b.
Geo
grap
hic
dist
ribut
ion
of N
eotro
pica
l-Nea
rctic
mig
rant
s in
the
And
es a
long
ele
vatio
n an
d lo
ngitu
de g
radi
ents
.
0
250
500
750
1000
1250
1500
1750
2000
2250
2500
-80
-79
-78
-77
-76
-75
-74
-73
-72
Elevation (m)
Lon
gitu
de
Cat
har
us
ust
ula
tus
Cat
har
us
min
imu
s
De
nd
roic
a ce
rule
aD
en
dro
ica
fusc
a
De
nd
roic
a ca
stan
ea
Myi
arch
us
crin
itu
s
Mn
ioti
lta
vari
aSe
top
hag
a ru
tici
lla
Pir
anga
ru
bra
Ve
rmiv
ora
pe
regr
ina
Emp
ido
nax
sp
.P
he
uct
icu
s lu
do
vici
anu
s
Seiu
rus
no
veb
ora
cen
sis
Vir
eo
oliv
ace
us
Ve
rmiv
ora
ch
ryso
pte
raC
on
top
us
sp.
Pro
ton
ota
ria
citr
ea
Op
oro
rnis
ph
ilad
elp
hia
Wils
on
ia c
anad
en
sis
Pir
anga
oliv
ace
a
De
nd
roic
a p
ete
chia
Tyra
nn
us
sava
na
Cal
idri
s m
inu
tilla
Ch
arad
riu
s co
llari
s
Act
itis
mac
ula
ria
Trin
ga f
lavi
pe
s
Trin
ga m
ela
no
leu
caTr
inga
so
litar
ia
101
Page 127
102
Figure 3.9. Sample-based smoothed accumulation curves of species in mixed-species
flocks among five habitats. Arrow indicates maximum rarefaction point in the number of
individuals achieved for all the habitats.
0
20
40
60
80
100
120
140
0 100 200 300 400 500 600 700 800 900
No.
of s
peci
es in
mix
ed s
peci
es f
lock
s
No. of individuals
shaded monoculturemature forestpastures with isolated treessecondary forestsuccessional
Page 128
103
Figure 3.10. Sample-based smoothed accumulation curves of Neotropical-Nearctic
migrant species assisting mixed-species flocks among five habitats. Arrow indicates
maximum rarefaction point in the number of individuals achieved for all the habitats.
0
2
4
6
8
10
12
14
16
18
0 10 20 30 40 50 60
No.
of N
TMB
spec
ies
in m
ixed
spe
cies
floc
ks
No. of individuals
shaded monoculturemature forestpastures with isolated treessecondary forestsuccessional
Page 129
104
Figure 3.11. NMS ordination joint plot of sample scores (i.e. mixed-species flocks) in
species space on the first and third NMS axes for the two most contrasting habitats, shade
coffee (open circles) and mature forest (crosses).
-1
-0.5
0
0.5
1
-1 -0.5 0 0.5 1
NM
S 3
NMS 1
Page 130
105
Figure 3.12. Relationship between flock species richness and increasing percentage of
forest cover within 1-km2 pixels in the Andes, 2007-2010. Graphs constructed using top-
ranked models simulating a gradient of forest cover. Dotted lines along major line
represent standard errors for the predictions.
0
2
4
6
8
10
12
0 20 40 60 80
Floc
k ric
hnes
s
Forest cover (%)
0
2
4
6
8
10
12
0 20 40 60 80
Floc
k ric
hnes
s
Forest cover (%)
0
2
4
6
8
10
12
0 20 40 60 80
Floc
k ric
hnes
s
Forest cover (%)
0
2
4
6
8
10
12
0 20 40 60 80
Floc
k ric
hnes
s
Forest cover (%)
0
2
4
6
8
10
12
0 20 40 60 80
Floc
k ric
hnes
s
Forest cover (%)
silvopastures
shade coffee
successional
secondary forest
mature forest
Page 131
106
Figure 3.13. Relationship between flock size and increasing percentage of forest cover
within 1-km2 pixels in the Andes, 2007-2010. Graphs constructed using top-ranked
models simulating a gradient of forest cover. Dotted lines along major line represent
standard errors for the predictions.
0
5
10
15
20
25
0 20 40 60 80
Floc
k ab
unda
nce
Forest cover (%)
0
5
10
15
20
25
0 20 40 60 80
Floc
k ab
unda
nce
Forest cover (%)
0
5
10
15
20
25
0 20 40 60 80
Floc
k ab
unda
nce
Forest cover (%)
0
5
10
15
20
25
0 20 40 60 80
Floc
k ab
unda
nce
Forest cover (%)
0
5
10
15
20
25
0 20 40 60 80
Floc
k ab
unda
nce
Forest cover (%)
silvopastures
shade coffee
successional
secondary forest
mature forest
Page 132
107
Figure 3.14. Relationship between flock encounter rate per hour and increasing
percentage of forest cover within 1-km2 pixels in the Andes, 2007-2010. Graphs
constructed using top-ranked models simulating a gradient of forest cover. Dotted lines
along major line represent standard errors for the predictions.
-1
-0.5
0
0.5
1
1.5
2
0 20 40 60 80Floc
k en
coun
ter r
ate
Forest cover (%)-1
-0.5
0
0.5
1
1.5
2
0 20 40 60 80Floc
k en
coun
ter r
ate
Forest cover (%)
-1
-0.5
0
0.5
1
1.5
2
0 20 40 60 80Floc
k en
coun
ter r
ate
Forest cover (%)-1
-0.5
0
0.5
1
1.5
2
0 20 40 60 80Floc
k en
coun
ter r
ate
Forest cover (%)
-1
-0.5
0
0.5
1
1.5
2
0 20 40 60 80Floc
k en
coun
ter r
ate
Forest cover (%)
silvopastures
shade coffee
successional
secondary forest
mature forest
Page 133
108
Figure 3.15. Relationship between richness of flocks and habitat structure in the Andes,
2007-2010. Graphs constructed using top-ranked models simulating a gradient of habitat
complexity. Dotted lines along major line represent SE for the predictions. Gray line:
high regional forest cover (61.9%). Blue line: low regional forest cover (19.6%).
-4
-2
0
2
4
6
8
10
12
14
16
-3 -2 -1 0 1 2 3
Floc
k ric
hnes
s
Gradient of habitat complexity
0
2
4
6
8
10
12
14
16
-3 -2 -1 0 1 2 3
Floc
k ric
hnes
s
Gradient of habitat complexity
-2
0
2
4
6
8
10
12
14
16
-3 -2 -1 0 1 2 3
Floc
k ric
hnes
s
Gradient of habitat complexity
0
2
4
6
8
10
12
14
16
-3 -2 -1 0 1 2 3
Floc
k ric
hnes
s
Gradient of habitat complexity
0
2
4
6
8
10
12
14
16
-3 -2 -1 0 1 2 3
Floc
k ric
hnes
s
Gradient of habitat complexity
silvopastures
shade coffee
successional
secondary forest
mature forest
Page 134
109
Figure 3.16. Relationship between flock size and habitat structure in the Andes, 2007-
2010. Graphs constructed using top-ranked models simulating a gradient of habitat
complexity. Dotted lines along major line represent SE for the predictions. Gray line:
high regional forest cover (61.9%). Blue line: low regional forest cover (19.6%).
0
5
10
15
20
25
30
35
40
45
-3 -2 -1 0 1 2 3
Floc
k si
ze
Gradient of habitat complexity
0
5
10
15
20
25
30
35
40
45
-3 -2 -1 0 1 2 3
Floc
k si
ze
Gradient of habitat complexity
0
5
10
15
20
25
30
35
40
45
-3 -2 -1 0 1 2 3
Floc
k si
ze
Gradient of habitat complexity
0
5
10
15
20
25
30
35
40
45
-3 -2 -1 0 1 2 3
Floc
k si
ze
Gradient of habitat complexity
0
5
10
15
20
25
30
35
40
45
-3 -2 -1 0 1 2 3
Floc
k si
ze
Gradient of habitat complexity
silvopastures
shade coffee
successional
secondary forest
mature forest
Page 135
110
Figure 3.17. Relationship between flock encounter rate per hour and habitat structure in
the Andes, 2007-2010. Graphs constructed using top-ranked models simulating a gradient
of habitat complexity. Dotted lines along major line represent standard errors for the
predictions. Dotted lines along major line represent SE for the predictions. Gray line:
high regional forest cover (61.9%). Blue line: low regional forest cover (19.6%).
-2
-1.5
-1
-0.5
0
0.5
1
1.5
2
2.5
-3 -2 -1 0 1 2 3
Floc
k en
coun
ter r
ate
Gradient of habitat complexity -2
-1.5
-1
-0.5
0
0.5
1
1.5
2
2.5
-3 -2 -1 0 1 2 3
Floc
k en
coun
ter r
ate
Gradient of habitat complexity
-2
-1.5
-1
-0.5
0
0.5
1
1.5
2
2.5
-3 -2 -1 0 1 2 3
Floc
k en
coun
ter r
ate
Gradient of habitat complexity-2
-1.5
-1
-0.5
0
0.5
1
1.5
2
2.5
-3 -2 -1 0 1 2 3Fl
ock
enco
unte
r rat
e
Gradient of habitat complexity
-2
-1.5
-1
-0.5
0
0.5
1
1.5
2
2.5
-3 -2 -1 0 1 2 3
Floc
k en
coun
ter r
ate
Gradient of habitat complexity
silvopastures
shade coffee
successional
secondary forest
mature forest
Page 136
111
Figure 3.18. Association between richness of Neotropical migrant birds recorded on
distance-based line transects and percentage of forest cover within 1-km2 pixels in the
Andes. Graphs constructed using top-ranked models simulating a gradient of forest cover.
Dotted lines along major line represent standard errors for the predictions.
-1
-0.5
0
0.5
1
1.5
0 20 40 60 80
Neo
trop
ical
mig
rant
rich
ness
Forest cover (%)-1
-0.5
0
0.5
1
1.5
0 20 40 60 80
Neo
trop
ical
mig
rant
rich
ness
Forest cover (%)
-1
-0.5
0
0.5
1
1.5
0 20 40 60 80
Neo
trop
ical
mig
rant
rich
ness
Forest cover (%)-1
-0.5
0
0.5
1
1.5
0 20 40 60 80N
eotr
opic
al m
igra
nt ri
chne
ss
Forest cover (%)
-1
-0.5
0
0.5
1
1.5
0 20 40 60 80
Neo
trop
ical
mig
rant
rich
ness
Forest cover (%)
silvopastures
shade coffee
successional
secondary forest
mature forest
Page 137
112
Figure 3.19. Association between abundance of Neotropical migrant birds recorded on
distance-based line transects and percentage of forest cover within 1-km2 pixels in the
Andes. Graphs constructed using top-ranked models simulating a gradient of forest cover.
Dotted lines along major line represent standard errors for the predictions
-0.5
0.5
1.5
2.5
3.5
4.5
0 20 40 60 80
Neo
trop
ical
mig
rant
abu
ndan
ce
Forest cover (%)-0.5
0.5
1.5
2.5
3.5
4.5
0 20 40 60 80
Neo
trop
ical
mig
rant
abu
ndan
ce
Forest cover (%)
-0.5
0.5
1.5
2.5
3.5
0 20 40 60 80
Neo
trop
ical
mig
rant
abu
ndan
ce
Forest cover (%)-0.5
0.5
1.5
2.5
3.5
0 20 40 60 80
Neo
trop
ical
mig
rant
abu
ndan
ce
Forest cover (%)
-0.5
0.5
1.5
2.5
0 20 40 60 80
Neo
trop
ical
mig
rant
abu
ndan
ce
Forest cover (%)
silvopastures
shade coffee
successional
secondary forest
mature forest
Page 138
113
Figure 3.20. Association between richness of Neotropical migrant birds and local habitat
structure in the Andes. Graphs constructed using top-ranked models simulating a gradient
of habitat structure. Dotted lines along major line represent standard errors for the
predictions. Dotted lines along major line represent SE for the predictions. Gray line:
high regional forest cover (63.8%). Blue line: low regional forest cover (17.8%).
-1
-0.5
0
0.5
1
1.5
2
2.5
3
-3 -2 -1 0 1 2 3
Neo
trop
ical
mig
rant
rich
ness
Gradient of habitat complexity-1
-0.5
0
0.5
1
1.5
2
2.5
3
-3 -2 -1 0 1 2 3
Neo
trop
ical
mig
rant
rich
ness
Gradient of habitat complexity
-1
-0.5
0
0.5
1
1.5
2
2.5
3
-3 -2 -1 0 1 2 3
Neo
trop
ical
mig
rant
rich
ness
Gradient of habitat complexity-1
-0.5
0
0.5
1
1.5
2
2.5
3
-3 -2 -1 0 1 2 3
Neo
trop
ical
mig
rant
rich
ness
Gradient of habitat complexity
-1
-0.5
0
0.5
1
1.5
2
2.5
3
-3 -2 -1 0 1 2 3
Neo
trop
ical
mig
rant
rich
ness
Gradient of habitat complexity
silvopastures
shade coffee
successional
secondary forest
mature forest
Page 139
114
Figure 3.21. Association between abundance of Neotropical migrant birds and local
habitat structure in the Andes. Graphs constructed using top-ranked models simulating a
gradient of habitat structure. Dotted lines along major line represent standard errors for
the predictions. Dotted lines along major line represent SE for the predictions. Gray line:
high regional forest cover (63.8%). Blue line: low regional forest cover (17.8%).
-1
0
1
2
3
4
5
-3 -2 -1 0 1 2 3
Neo
trop
ical
mig
rant
abu
ndan
ce
Gradient of habitat complexity-1
0
1
2
3
4
5
-3 -2 -1 0 1 2 3
Neo
trop
ical
mig
rant
abu
ndan
ce
Gradient of habitat complexity
-1
0
1
2
3
4
5
-3 -2 -1 0 1 2 3
Neo
trop
ical
mig
rant
abu
ndan
ce
Gradient of habitat complexity-1
0
1
2
3
4
5
-3 -2 -1 0 1 2 3
Neo
trop
ical
mig
rant
abu
ndan
ce
Gradient of habitat complexity
-1
0
1
2
3
4
5
-3 -2 -1 0 1 2 3
Neo
trop
ical
mig
rant
abu
ndan
ce
Gradient of habitat complexity
silvopastures
shade coffee
successional
secondary forest
mature forest
Page 140
115
4 PATTERNS OF MASS CHANGE IN WINTERING NEOTROPICAL-NEARCTIC
MIGRATORY BIRDS IN SHADED MONOCULTURES IN THE ANDES
Abstract. Despite the widely accepted idea that shaded monocultures are valuable
habitats for Neotropical migrants in disturbed landscapes, little empirical evidence is
available in relation to the quality of this habitat for Neotropical-Nearctic migratory birds
in the Andes. I evaluated the suitability of shaded monocultures for overwintering
Neotropical-Nearctic migratory birds by examining diurnal and seasonal variation in
body condition of migrants in shaded monocultures in the Colombian Andes.
Futhermore, because Neotropical-Nearctic migrants frequently join mixed-species flocks
during the nonbreeding season, I also evaluated the extent to which body condition
changed with flocking behavior. During October-April 2008-2009 and 2009-2010, I mist-
netted 8 species of Neotropical-Nearctic migrants in shaded monocultures in the
Colombian Andes. Body condition improved throughout the day for Cerulean Warbler,
Blackburnian Warbler, Tennessee Warbler, and especially Canada Warbler. Similarly,
body condition improved across the season for Tennessee Warbler, Rose-breasted
Grosbeak, and Summer Tanager. Neither body condition nor seasonal change in body
condition differed between flocking and solitary individuals for most of the migratory
species evaluated. However, Cerulean and Blackburnian Warblers showed stronger
improvements in condition when foraging solitary than in flocks. My results provided
Page 141
116
additional evidence that several common Neotropical migrants, including species of
conservation concern such as Cerulean Warbler, may improve their body condition in
agroforestry systems of shaded monocultures.
Keywords: shaded monocultures, agroforestry systems, foraging enhancement,
flocking behavior, body condition, migratory birds, Colombia.
Introduction
Population declines in Neotropical-Nearctic migratory birds have been widely
documented during the breeding, migration and winter periods (Robbins et al. 1989,
Hussell et al. 1992, Faaborg & Arendt 1992, Faaborg et al. 2010). While most studies
focus on impacts of breeding season events , recent work demonstrates that habitat
quality experienced by birds during the non-breeding season may contribute strongly to
population limitation of Neotropical migrants (Holmes et al. 1989, Sliwa and Sherry
1992, Marra et al. 1993, Marra and Holmes 2001, Sherry et al. 2005). The availability of
high quality non-breeding habitat continues to be reduced byforest loss and conversion of
undisturbed forests to other land uses (Hutto 1988, Robbins et al. 1989, Terborgh 1989,
Petit et al. 1995). Although agroforestry systems also represent a form of land
conversion and intensification, previous studies suggest that agroforestry systems, in
particular shade coffee, might be beneficial for migratory birds and may represent a
valuable habitat by supporting high levels of biodiversity (Perfecto et al. 1996, Greenberg
et al. 2000, Perfecto et al. 2003, Komar 2006). The ecological value of agroforestry
systems to support migratory birds during the nonbreeding period usually has been
evaluated using measures such as richness, abundance and survival estimates (Wunderle
Page 142
117
& Latta 1996, Johnson et al. 2006). However, these measures can be impractical and
misleading indicators of habitat quality because of the large amount of time and large
datasets needed (Johnson et al. 2006). These disadvantages have encouraged the use of
other metrics, particularly body condition (i.e. body mass corrected for body size) and its
patterns of overwinter change (Strong & Sherry 2001, Marra & Holmes 2001). Body
condition of migrants in wintering grounds has shown to be directly affected by habitat
quality and food availability (e.g. Strong & Sherry 2000). Improvement of body
condition is known to be related to annual survival (Sillet et al. 2000) and potentially
associated with carry-over effects to future reproductive success (Marra et al. 1998).Our
understanding of how different overwintering habitats (e.g. shaded agriculture) may
affect body condition remains limited (Strong & Sherry 2000, Wunderle & Latta 2000,
Bakermans et al. 2009). For example, despite the relevance of body condition as a proxy
for evaluating habitat quality of shade coffee for Neotropical migrants, only one recent
study conducted in the Venezuelan Andes showed that migrants can improve their body
condition while wintering in shade coffee (Bakermans et al. 2009).
Not only is body condition influenced by food availability (Strong and Sherry
2000), but other factors including social behavior (i.e. association in mixed species
flocks), might also influence body condition given that participating in flocks may incur a
variety of benefits (e.g.. enhancing foraging ability; Cody 1971, Waite & Grubb 1988,
Sridhar et al. 2009) and costs (e.g. intraspecific and interspecific competition for food
resources; Terborgh 1990, Greenberg 2000, Polo & Bautista 2002, Lange & Leimar
2004). Since a large proportion of Neotropical migratory birds join mixed species flocks
while in their wintering grounds (Moynihan 1962, Powell 1985, Robbins et al. 1989,
Page 143
118
Hutto 1994, Rappole 1995, Latta & Wunderle 1996), including some species of
conservation concern such as the Cerulean Warbler (BirdLife International 2008),
understanding the ways in which flock participation may influence condition of
migratory birds during the nonbreeding period, may provide insight about limiting factors
affecting the overwinter performance of migratory birds. This knowledge is especially
important today, as montane habitas in the Neotropical Andes have been extensively
deforested and fragmented.
In this study, I evaluated (1) the suitability of shaded monocultures for
overwintering Neotropical-Nearctic migratory birds by examining diurnal and seasonal
variation in body condition and (2) the extent to which diurnal and seasonal variation in
body condition was associated with flocking behavior of Neotropical-Nearctic migratory
birds wintering in shaded monocultures.
Study area and methods
Study area
Study sites were established in Southwestern Antioquia department, Colombia, in
the municipalities of Jerico (Cultivares farm: 5o 48’ N, 75o 48’ W. Western Andes),
Fredonia (Gualanday farm; 5o 56’ N, 75o 39’ W. Central Andes) and Tamesis (La
Cumbre farm; 5o 45’ N, 75o 42’ W. Western Andes; Fig. 1). Elevation ranged from 1450
to 1650 m. In all locations, the primary habitat type was shaded monoculture of coffee
(Coffea arabica; Rubiaceae) and cardamom (Elettaria cardamomum; Zingiberaceae).
Page 144
119
Common shading trees included Inga spp. (Mimosaceae), Cordia alliodora
(Boraginaceae), and Persea spp. (Lauraceae).
Bird sampling
Migrants were captured in the three study sites from October to March during the
wintering seasons (October to March) of 2008-2009 and 2009-2010, using ten standard
nylon mist nets (12 m x 2.5 m, 36 mm mesh), deployed not only horizontally (i.e. ground
nets) but vertically (i.e. ~ 1-10 m height) by using a pulley system. Each site was visited
three times every season. In order to improve capture rate, three banding stations were
established within each site and separated by > 200 m. Mist nets were arranged using a
combination of ground and canopy nets in order to capture all the birds that passed
through a particular location. Nets were checked every 30 to 45 minutes.
Each station was run for 4 days for a total of 36 mist-netting days per wintering
season per location (3 stations per site x 4 days per visit x 3 visits per year). Mist nets
were run continuously 7-10 hours per day, opened within half an hour after sunrise,
typically between ∼ 6:30 h and ∼16:30 h. Captured birds were banded with numbered
aluminum leg bands and sexed and aged when possible by external characters and degree
of skull of ossification. Unflattened wing chord and tail lengths were measured using a
ruler (± 1 mm). Birds were weighed using a digital scale with precision ± 0.1 g. All birds
were examined for body molt with a possible range from 0 (none) to 4 (heavy), flight
feather molt in terms of symmetry and flight feather wear.
I used several indicators to determine whether a bird was considered captured
while foraging in a flock or solitary. First, mist nets were usually observed with
Page 145
120
binoculars from a distance. This allowed us to determine if a flock hadmoved through the
area. Second, as our research in these farms spans several years, our knowledge of the
local flocking systems, in particular routes and timing of movement, is fairly good. Due
to this understanding in the behavior of the flocks and the species that join them, we
could anticipate and follow flock movements while watching nets.When a flock was
passing through our arrangement of canopy and ground mist nets, we were generally
confident that caught birds were flocking birds. Likewise, when no flocks were observed
either moving toward the nets or falling in the nets, caught birds were considered solitary
foragers. Finally, the number and type of bird species captured per net run was also
sometimes used as complementary criteria. Because we stacked nets and constructed a
pulley system to capture birds throughout the vertical strata (~1.0-10 m), we were
successful intercepting flocks and nearly always captured multiple flock participants.
Consequently, a bird captured alone or with one other bird in the same net or in the
closest net during the same net run was considered solitary. This pattern was confirmed
by our years of experience banding birds at these sites.
Body condition index
To assess physical condition of birds, I calculated a body condition index that
accounts for structural size. Body condition represents a good and useful proxy for
assessing habitat quality and its effects on individuals (Brown 1996, Johnson 2007). The
body condition metric accounted for body frame (structural) size by first performing a
principal components analysis (PCA) on wing chord and tail length. I then regressed
body mass against PC1 scores and the residuals were used as an index of body condition
(Wunderle & Latta 2000). The extent to which the predicted values deviated from
Page 146
121
expected mass given a certain body size (i.e., residuals) indicated whether the bird was in
good (i.e., residual above the regression line) or poor (i.e. residual below) body condition.
I also tested the degree of association between body size (i.e. PC1) and flocking behavior
(e.g. smaller birds tended to join flocks more than large birds; Thiollay & Jullien 1998).
Statistical analysis
I used data only from first captured individuals (i.e., recaptures were excluded),
and selected eight Neotropical-Nearctic migratory species based on sample size (> 25
captures during the two-year period of study; Table 4.1) and regularity in flocks in my
study sites: Cerulean Warbler (Dendroica cerulea), Blackburnian Warbler (Dendroica
fusca), Tennessee Warbler (Vermivora peregrina), Canada Warbler (Wilsonia
Canadensis), Rose-breasted Grosbeak (Pheucticus ludovicianus), Red-eyed Vireo (Vireo
olivaceus), Summer Tanager (Piranga rubra), and Empidonax flycatchers (Empidonax
spp.).
I first assessed correlations between body condition and time of day, day of
season, sex, age, body molt and season. Because mean body conditions did not differ
among the three study locations (Jerico, Tamesis and Fredonia; P > 0.1), data from the
three locations were pooled together for analyses. Similarly, there was no a significant
relationship between body condition and sex, age, body molt or year for any of the
studied species (all P > 0.1; Appendix J). To further evaluate if flock and solitary samples
were comparable, I tested for differences between solitary and flocking birds for sex, age
and season. Similar sex ratios (i.e., proportions of males and females) were captured for
solitary and flocking categories for Cerulean Warbler (χ2 = 0.14, df = 1, P = 0.71),
Blackburnian Warbler (χ2 = 1.51, df = 1, P = 0.22), Tennessee Warbler (χ2 = 0.001, df =
Page 147
122
1, P = 0.97), Canada Warbler (χ2 = 0.09, df = 1, P = 0.76), Rose-breasted Grosbeak (χ2 =
0.23, df = 1, P = 0.63) and Summer Tanager (χ2 = 0.001, df = 1, P = 0.98). Age
distributions (i.e. adult vs. juvenile) also were similar for solitary and flocking categories
across the same migratory species (χ2 < 2.68, df = 1, P > 0.1). Cerulean Warblers were
captured marginally more frequently in flocks than solitary in the wintering season of
2009-2010 than in the previous season (χ2 = 3.57, df = 1, P = 0.06), whereas other species
were evenly captured in flock vs. solitary in both seasons (χ2 < 3.26, df = 1, P > 0.1).
Because I also found no differences in body condition based on sex, age, molt, and year, I
pooled the data for subsequent analyses.
To determine if shaded monocultures provided habitat that allowed migratory
birds to gain mass, I ran regression models separately for each species to test
relationships between (1) body condition and time of day (i.e., trends in daily mass
change) and (2) body condition and day of season. I assessed the effect of social status
(i.e. flock and solitary) on daily and seasonal changes (hour of day and day of season,
respectively) in body condition separately for each species using linear regression
analysis. Previous studies have shown that these temporal variables can strongly affect
body condition (e.g. Carlisle et al. 2005, Seewagen & Slayton 2008). I excluded
Empidonax flycatchers from the seasonal analysis (i.e. relationship of body condition by
social status and day of the season), since no birds were captured in flocks later in the
season (∼after day 90). I constructed linear regression models for (1) hour of day and (2)
day of the season as predictors, and I incorporated social status as an indicator variable.
The models were run as,
Page 148
123
𝐵𝐶𝐼 = 𝛽0 + 𝛽1 × ℎ𝑜𝑢𝑟 𝑜𝑓 𝑑𝑎𝑦 + 𝛽2 × 𝑓𝑙𝑜𝑐𝑘 𝑠𝑡𝑎𝑡𝑢𝑠 + 𝛽3 × ℎ𝑜𝑢𝑟 𝑜𝑓 𝑑𝑎𝑦 × 𝑓𝑙𝑜𝑐𝑘 𝑠𝑡𝑎𝑡𝑢𝑠
𝐵𝐶𝐼 = 𝛽0 + 𝛽1 × 𝑑𝑎𝑦 𝑜𝑓 𝑠𝑒𝑎𝑠𝑜𝑛 + 𝛽2 × 𝑓𝑙𝑜𝑐𝑘 𝑠𝑡𝑎𝑡𝑢𝑠 + 𝛽3 × 𝑑𝑎𝑦 𝑜𝑓 𝑠𝑒𝑎𝑠𝑜𝑛 × 𝑓𝑙𝑜𝑐𝑘 𝑠𝑡𝑎𝑡𝑢𝑠
I finally assessed whether the variances of the body condition of birds captured in
flock and solitary were significantly different (e.g. birds in flocks present less variation in
their body condition throughout the season than birds foraging solitary) using an F-test
for the ratio of variances which compares standard deviations. Data for each migrant
were checked for normality and homocedasticity. All statistical analyses were conducted
using STATGRAPHICS Centurion XV (Statpoint 2005).
Results
I captured and recorded complete measurements of 624 new individuals of 8
Neotropical migrant species in shaded monocultures from the wintering seasons 2008-
2009 and 2009-2010 (Table 4.1). After adjusting for effort, the average capture rate of
Neotropical-Nearctic migratory species in shaded monocultures in southwestern
Antioquia was 4.85 birds/100 net hours. Weights varied from 7.59 g (Tennessee Warbler)
to 56.5 g (Rose-breasted Grosbeak), with Cerulean Warbler averaging the minimum
weight (8.86 ± 0.54 g, N = 54) and Rose-breasted Grosbeak averaging the maximum
(43.68 ± 4.95 g, N = 78; Table 4.1). Most body condition scores were negative regardless
of social status (Table 4.2). For the 8 migrant species, the first principal component (PC1)
explained 96.3% of the variation in linear measurements and both wing and tail length
loaded positively with PC1 (r = 0.98, P < 0.001). I found no evident capture bias in body
frame (i.e. PC1) and flocking status (all P > 0.1 for all species; Table 4.3).
Page 149
124
Temporal changes in body condition in shade monocultures
Four of eight migratory species showed evidence that body condition improved
throughout the day – Cerulean Warbler (β = 0.001 ± 0.0004, t = 2.43, P = 0.02),
Blackburnian Warbler (β = 0.001 ± 0.0003, t = 3.35, P = 0.001), Tennessee Warbler (β =
0.001 ± 0.0004, t = 3.57, P < 0.01), and Canada Warbler (β = 0.002 ± 0.0003, t = 5.14, P
< 0.01, Table 4.4). There were no significant associations between body condition and
time of day for Rose-breasted Grosbeak, Red-eyed Vireo, Summer Tanager and
Empidonax flycatchers (P > 0.1, Table 4.4).
Body condition improved over the non-breeding season for Tennessee Warbler (β
= 0.005 ± 0.0015, t = 3.19, P = 0.002), Rose-breasted Grosbeak (β = 0.023 ± 0.0062, t =
3.7, P < 0.01), and Summer Tanager (β = 0.021 ± 0.0067, t = 3.07, P < 0.01; Table 4.4).
Associations between body condition and flocking behavior
Irrespective of flocking behavior, birds were generally in poor body condition
early in the morning (Fig. 4.2), but only Cerulean Warbler showed significantly different
patterns of diurnal changes in body condition depending on social status. Ceruleans that
were captured when foraging solitarily showed increasing measures of body condition
throughout the day than individuals captured while participating in flocks (β solitary:
0.0023 ± 0.001; β flocks: 0.0002 ± 0.0006, P = 0.05, Table 4.5; Fig. 4.2). Daily changes
in body condition were not significantly related to social status for other species (P >
0.01, Table 4.5).
Differences in daily changes in body condition between individuals in flock or
solitary were not associated to sex or age, except for Summer Tanager for which males
Page 150
125
marginally improved their body condition while foraging in flocks (β = 1.877 ± 4.111)
when compared with females in flocks (β = -2.385 ± 2.066; F4, 46 = 2.17, P = 0.09; β
social status x sex: -1.0207 ± 0.4521, t = 2.26, P = 0.03, Table 4.6).
Seasonal changes in body condition were not significantly related to flocking
behavior for most migratory bird species (P > 0.1; Table 4.7, Fig. 4.3), with the exception
of Blackburnian Warbler, which showed that increasing body condition across the seaon
for birds captured alone (β = 0.044 ± 0.002, P = 0.01) compared to birds captured in
flocks (β = -0.0006 ± 0.0013, P = 0.64, Table 4.7, Fig. 4.3). Differences in seasonal
changes in body condition between individuals in flock or solitary were not associated to
sex or age. I also found no evidence that variances of body condition differed between
flock and solitary foragers (F- test for the ratio of variances, P > 0.08, Table 4.8).
Discussion
Despite the widely accepted idea that shaded monocultures (e.g. shade coffee) are
valuable habitats for Neotropical migrants in disturbed landscapes (Wunderle & Latta
1996, Tejeda-Cruz and Sutherland, Koman 2006), little empirical evidence is available to
demonstrate the quality of this habitat for migratory birds in the Andes (but see
Bakermans et al. 2009). My study revealed that several common Neotropical-Nearctic
migratory species improved body condition both throughout the day and across the
season in shaded monocultures in the Colombia Andes. However, I found no evidence
that participating in mixed-species foraging flocks enhanced overwintering performance.
In fact, for Cerulean and Blackburnian Warblers, the strongest daily and seasonal
Page 151
126
improvements in condition were associated with solitary foragers, not those individuals
participating in flocks. My findings then suggest that advantages to participating in flocks
are complex and do not simply translate into mass gain.
About half of the Neotropical-Nearctic migratory birds I examined during my
study (4 out of 8 species), improved their body condition as the day progressed
(Cerulean Warbler, Blackburnian Warbler, Tennessee Warbler and Canada Warbler).
Several studies support the linear increase in body masses throughout the day (Moore &
Kerlinger 1987, Moore & Wang 1991, Winker et al. 1992, Dunn 2002, Jones et al. 2002),
and daily increase in body condition is well established theoretically (e.g. McNamara et
al. 1994), empirically (e.g. Lehikoinen 1987, Rogers & Smith 1993, Gosler 1996,
Koivula et al. 2002, Bonter et al. 2007), and by experimental studies (e.g. Ekman & Hake
1990, Bednekoff & Krebs 1995). While this pattern also has been supported for migrating
birds (Dunn 2000, Schaub & Jenni 2000, Delingat et al. 2009), little information is
available in relation to daily body condition gains for migratory birds wintering in the
Neotropics (e.g. Strong & Sherry 2001, Brown & Sherry 2006, Bakermans et al. 2009),
particularly for the Andes. Thus, my data contribute novel information on daily patterns
of body condition improvement for several common migratory birds in shaded
monocultures. Rate of increase of body condition was virtually identical for Cerulean
Warbler, Blackburnian Warbler and Tennessee Warbler (β = 0.001), whereas it was
nearly twice as rapid for Canada Warbler (β = 0.002). The daily improvement of body
condition by the migratory birds in my study may be explained by the constant feeding
activity of these birds throughout the day, particularly after the overnight fasting. Other
Page 152
127
species (i.e. Summer Tanager, Rose-breasted Grosbeak, Red-eyed Vireo and Empidonax
flycatchers) showed a more stable body condition across the day.
My study also revealed that approximately half of the Neotropical migrants I
tested (Tennessee Warbler, Rose-breasted Grosbeak and Summer Tanager) improved
body condition in shaded monocultures in the Colombian Andes throughout the wintering
season. At present, only one study has provided direct evidences of seasonal
improvement of body condition for three common Neotropical migrants in this habitat in
Venezuela (Bakermans et al. 2009), whereas others have shown stable patterns or
negative changes in the body condition throughout the wintering period (Strong & Sherry
2000, Wunderle & Latta 2000). Similar to Bakermans et al. (2009), nearly 80% of the
migratory birds caught in my study sites had <5% of fat stores in their bodies. Theoretical
and empirical studies have shown that the predictability in food resources in a particular
habitat allows birds to reduced or even eliminate fat storaging (Rappole & Warner 1980,
Strong & Sherry 2000). My study expands on the Venezuela patterns by providing further
evidence of not only seasonal but diurnal gains for several common Neotropical
migrants. This is especially relevant when considering that body condition cannot only
influence the overwinter survival of a bird (e.g. increase risk of mortality by starvation),
but also has carry over effects on the future reproductive period of birds (Marra et al.
1998, Sillet et al. 2000, Strong & Sherry 2000, Norris et al. 2004, Smith & Moore 2005).
Since temporal improvements in body condition have been largely regarded as the most
relevant metric to assess habitat quality for birds in breeding and stopover sites (e.g.
Lilliendahl 2002, Seewagen & Slayton 2008, Delingat et al. 2009, Benson & Bednarz
Page 153
128
2010), future studies in habitat quality of migrant birds in nonbreeding habitats should
also attempt to include this metric.
My results did not provide compelling evidence that participating in mixed-
species foraging flocks benefited migrants via improvements in body condition, either
over daily or seasonal periods. To the contrary, the only statistically significant patterns
suggested that flock participation reduced mass gain for two species of migratory birds,
Cerulean Warbler and Blackburnian Warbler, both of which show strong flocking
propensities (> 75% of observations, unpubl. data) Interestingly, Cerulean Warbler is a
sensitive species exhibiting strong populations declines (e.g. Hamel 2000). Since several
studies have shown that flocking behavior promotes survival of bird species by reducing
predation pressure on individuals (Thiollay & Jullien 1998, Sridhar et al. 2009), my
results could be showing a behavioral response of maximizing overwinter survival.
Across the nonbreeding season, I found that individuals of Blackburnian Warbler
captured while foraging alone showed positive trends in body condition, in contrast to
patterns exhibited by birds captured while foraging with flocks.
As better body condition was not detected for most flocking vs. solitary
individuals the potential benefit of assisting flocks might be related to other reasons such
as reducing risk of predation. Many studies have shown that animals are subject to a
lower predation risk when in groups than when solitary (Foster & Treherne 1981, Godin
1986, Morgan & Colgan 1987, Jullien & Thiollay 1998, Jullien & Clobert 2000, Zoratto
Page 154
129
et al. 2009), but competition for food remains one of the major costs of living in groups
(Greenberg 2000, Polo & Bautista 2002). Moreover, theoretical models predict that
joining a group will either have no effect or a negative effect on the net mean foraging
rate of an individual (Ruxton et al. 1995, Krause & Ruxton 2002). This has been
empirically supported by Warkentin & Morton (2000) and Pomara et al. (2003), who
demonstrated that foraging rates varied little or not at all between flocking and solitary
birds for migratory species in their wintering grounds, and joining mixed-species flocks
was more likely associated to reduce predation risk. At the same time, flocking may
confer protection against predation without necessarily improving feeding efficiency
(Rabenold & Christensen 1979, Hutto 1988, Pomara et al. 2003). Thus, solitary foragers
might improve condition at expense of increasing predation risk. Few significant
relationships between body condition and flocking behavior may stem from species-
specific tradeoffs and differences in the relative advantages of flocking. For instance,
some species may use substantially different foraging strategies when solitary than when
flocking (Pomara et al. 2003). These differences, in turn, imply that not necessarily all
participants in flocks accrue benefits and certain species that are joined by other species
might in fact suffer costs (e.g. Zamora et al. 1992, Cimprich & Grubb 1994, Pomara et al.
2003, Faaborg et al. 2010). For example, Jullien & Clobert (2000) studied the survival
rates of birds in several tropical forests, including French Guiana, discriminated by their
flocking propensity (i.e. obligate, facultative and solitary or pairs species). While survival
rates of obligate flock members were significantly higher than estimates for the species
feeding alone or in pairs, survival rates of facultative flock members did not differ from
those of nonflocking species (Jullien & Clobert 2000). In addition, birds may also spread
Page 155
130
their mass gain more evenly throughout the day when feeding becomes more predictable
(e.g. McNamara & Houston 1990, Houston et al. 1993). An important caveat to my
findings is that I was not able to recapture the same individuals nor to determine the
proportion of time an individual spent foraging solitary versus with a flock throughout
the day. My knowledge of social status is limited to the time of capture. Therefore, the
possibility remains that birds switched strategies (i.e., foraged with flocks or alone)
depending upon their condition and mass gain in the period preceding capture.
My study showed that several common migratory species improved their body condition
in the agroforestry system of shaded monocultures. However, the extent to which this
agricultural system represents high quality habitat requires additional study, especially
comparisons with other types of habitats and the integration of demographic and
behavioral information. Though my study did not include estimations of demographic
parameters, the improvement of body condition for several common Neotropical
migratory birds at a daily and seasonal basis demonstrate that shaded monocultures
provide quality habitat for several common wintering Neotropical-Nearctic migratory
species, as suggested elsewhere (Wunderle & Latta 1996, Greenberg et al. 1997, Petit et
al. 1999), including Cerulean Warbler. Because mixed-species flocks are affected by
habitat disturbance and fragmentation (e.g. Maldonado-Coehlo & Marini 2004, Lee et al.
2005), future work also should continue to explore the benefits of flocking for migratory
and resident birds across disturbance gradients.
Page 156
131
Literature cited
Bakermans, M. H., Vitz, A. C., Rodewald, A. D., & Rengifo, C. G. (2009). Migratory
songbird use of shade coffee in the Venezuelan Andes with implications for
conservation of cerulean warbler. Biological Conservation , 142, 2476-2483.
Beauchamp, G. (2004). Reduced flocking by birds on island with relaxed predation.
Proceedings of the Royal Society B , 271, 1039-1042.
Bednekoff, P. A., & Krebs, J. R. (1995). Great tit fat reserves: effects of changing and
unpredictable day length. Functional Ecology , 9, 457-462.
Benson, T. J., & Bednarz, J. C. (2010). Relationships among survival, body condition and
habitat of breeding swainson's warblers. The Condor , 112 (1), 138-148.
Berner, T. O., & Grubb, T. C. (1985). An experimental analysis of mixed species
flocking in birds of deciduous woodland. Ecology , 66, 1229-1236.
BirdLife, I. (2008). Dendroica cerulea, 2010.4. Retrieved September 26, 2010, from
IUCN Red List of Threatened Species: www.iucnredlist.org
Bonter, D. N., Donovan, T. M., & Brooks, E. W. (2007). Daily mass changes in landbirds
during migration stopover on the south shore of lake Ontario. The Auk , 124 (1),
122-133.
Brown, D. R., & Sherry, T. W. (2006). Behavioral response of Jamaica resident birds to
foot manipulation. Biotropica , 38, 91-99.
Brown, M. E. (1996). Assessing body condition in birds. Current Ornithology , 13, 67-
135.
Page 157
132
Carlisle, J. D., Kaltenecker, G. S., & Swanson, D. L. (2005). Stopover ecology of aurumn
landbird migrants in the Boise foothills of southwestern Idaho. Condor , 107, 244-
258.
Cimprich, D. A., & Grubb, T. C. (1994). Consequences for Carolina Chickadees of
foraging with tufted titmice in winter. Ecology , 75, 1615-1625.
Cody, M. L. (1971). Finch flocks in the Mohave desert. Theoretical Population Biology ,
2, 141-158.
Cresswell, W. (1998). Diurnal and seasonal mass variation in blackbirds Turdus merula:
consequences for mass-dependent predation risk. Journal of Animal Ecology , 67,
78-90.
Cresswell, W. (1994). Flocking as an effective anti-predation strategy in redshanks,
Tringa totanus. Animal Behaviour , 47, 433-442.
Delingat, J., Dierschke, V., Schmaljohann, H., & Bairlein, F. (2009). Diurnal patterns of
body mass change during stopover in a migrating songbird, the northern wheatear
Oenanthe oenanthe. Journal of Avian Biology , 40, 625-634.
Dolby, A. S., & Grubb, T. C. (1998). Benefits to satellite members in mixed-species
foraging groups: an experimental analysis. Animal Behaviour , 56, 501-509.
Dunn, E. H. (2002). A cross-Canada comparison of mass change in birds during
migration stopover. Wilson Bulletin , 114, 368-379.
Dunn, E. H. (2000). Temporal and spatial patterns in daily mass gain of Magnolia
Warblers during migratory stopover. Auk , 117, 12-21.
Page 158
133
Ekman, J. B., & Hake, M. K. (1990). Monitoring starvation risk: adjustments of body
reserves in greenfinches (Carduelis chloris L.) during periods of unpredictable
foraging success. Behaviroural Ecology , 1, 62-67.
Faarborg, J., Holmes, R. T., Anders, A. D., Bildstein, K. L., Dugger, K. M., Gauthreaux,
S. A., et al. (2010). Recent advances in understanding migration systems of New
World land birds. Ecological Monographs , 80 (1), 3-48.
Fitzpatrick, J. W. (1980). Wintering of North American tyrant flycatchers in the
Neotropics. In A. Keast, & E. S. Morton (Eds.), Migrant birds in the Neotropics:
Ecology, behavior, distribution, and conservation (pp. 67-78). Washington, D.C.:
Smithsonian Institution Press.
Forsman, J. T., Mönkkönen, M., Helle, P., & Inkeröinen, J. (1998). Heterospecific
attraction and food resources in migrants´ breeding patch selection in northern
boreal forests. Oecologia , 115, 278-286.
Foster, W. A., & Treherne, J. E. (1981). Evidence for the dilution effect in the selfish
herd from dish predation on a marine insect. Nature , 293, 466-467.
Godin, J. G. (1986). Risk of predation and foraging behaviour in shoaling banded killifish
(Fundulus diaphanus). Canadian Journal of Zoology , 64, 1675-1678.
Godin, J. G., Classon, L. J., & Abrahams, M. V. (1988). Group vigilance and shoal size
in a small characin fish. Behaviour , 104, 29-40.
Gosler, A. G. (1996). Environmental and social determinants of winter fat storage in the
great tit Parus major. Journal of Animal Ecology , 65, 1-17.
Page 159
134
Gradwohl, J., & Greenberg, R. (1980). The formation of antwren flocks on Barro
Colorado Island, Panama. Auk , 97, 385-395.
Greenberg, R. (2000). Birds of many feathers: the formation and structure of mixed-
species flocks of forest birds. In S. Boinski, & P. A. Garber (Eds.), On the move
(pp. 521-558). Chicago: University of Chicago Press.
Greenberg, R., Bichier, P., & Sterling, J. (1997). Bird populations in rustic and planted
shade coffee plantations of eastern Chiapas, Mexico. Biotropica , 29, 501-514.
Grubb, J. R. (1987). Changes in the flocking behaviour of wintering English titmice with
time, weather and supplementary food. Animal Behaviour , 35, 794-806.
Hamel, P. B. (2000). Cerulean warbler (Dendroica cerulea). In A. Poole, & F. Gill (Eds.),
The Birds of North America. Philadelphia (No. 511): The Birds of North America,
Inc.
Hamilton, W. D. (1971). Geometry of the Selfish Herd. Journal of Theoretical Biology ,
31, 295-311.
Hart, P. J., & Freed, L. A. (2003). Structure and dynamics of mixed-species floks in a
Hawaiian rainforest. Auk , 120, 1-14.
Hino, T. (1998). Mutualistic and commensal organization of avian mixed-species
foraging flocks in a forest of western Madagascar. Journal of Avian Biology , 29,
17-24.
Houston, A. I., McNamara, J. M., & Hutchinson, J. M. (1993). General results
concerning the trade-off between gaining energy and avoiding predation.
Philosophical Transactions of the Royal Society of London B , 341, 375-397.
Page 160
135
Hutto, R. L. (1988). Foraing behavior patterns suggest a possible cost associated with
participation in mixed-species bird flocks. Oikos , 51, 79-83.
Hutto, R. (1994). The composition and social organization of mixed-species flocks in a
tropical deciduous foret in western Mexico. Condor , 96, 105-118.
Johnson, M. D. (2007). Measuring habitat quality: a review. Condor , 109, 489-504.
Jones, J., Ramoni-Perazzi, P., Carruthers, E. H., & Robertson, R. J. (2002). Species
composition of bird communities in shade coffee plantations in the Venezuelan
Andes. Ornitologia Neotropical , 13, 397-412.
Jullien, M., & Clobert, J. (2000). The survival value of flocking in Neotropical birds:
reality or fiction? Ecology , 81 (12), 3416-3430.
Jullien, M., & Thiollay, J. M. (1998). Multi-species territoriality and dynamics of
neotropical understory bird flocks. Journal of Animal Ecology , 67, 227-252.
Koivula, K., Orell, M., & Lahti, K. (2002). Plastic daily fattening routines in willow tits.
Journal of Animal Behavior , 71, 816-823.
Kotagama, S. W., & Goodale, E. (2004). The composition and spatial organization of
mixed-species flocks in a Sri Lankan rainforest. Forktail , 20, 63-70.
Krause, J., & Ruxton, G. D. (2002). Living in groups. New York: Oxford University
Press.
Lange, H., & Leimar, O. (2004). Social stability and daily body mass gain in great tits.
Behavioral Ecology , 15 (4), 549-554.
Page 161
136
Latta, S. C., & Wunderle, J. M. (1996). The composition and foraging ecology of mixed-
species flocks in pine forest of Hspaniola. Condor , 98, 595-607.
Lee, T. M., Soh, M. C., Sodhi, N., Koh, L. P., & Lim, S. L. (2005). Effcts of habitat
disturbance on mixed species bird flocks in a tropical sub-montane rainforest.
Biological conservation , 122, 193-204.
Lehikoinen, E. (1987). Seasonality of the daily weight cycle in wintering passerines and
its consequences. Ornis Scandinavica , 18, 216-226.
Lilliendahl, K. (2002). Daily patterns of body mass gain in four species of small
wintering birds. Journal Avian Biology , 33, 212-218.
Maldonado-Coelho, M., & Marini, M. A. (2000). Effects of forest fragment size and
successional stage on mixed-species bird flocks in southeastern Brazil. Condor ,
102, 585-594.
Maldonado-Coelho, M., & Marini, M. A. (2004). Mixed-species bird flocks from
Brazilian Atlantic forest: the effects of forest fragmentation and seasonality on
their size, richness and stability. Biological Conservation , 116, 19-26.
Marra, P. P., Hobson, K. A., & Holmes, R. T. (1998). Linking winter and summer events
in a migratory bird by using stable-carbon isotopes. Science , 282, 1884-1886.
McNamara, J. M., Houston, A. I., & Lima, S. L. (1994). Foraging routines of small birds
in winter: A theoretical investigation. Journal of Avian Biology , 25, 287-302.
Metcalfe, N. B. (1984). The effects of mixed-species flocking on the vigilance of
shorebirds: Who do they trust? Animal Behaviour , 32, 986-993.
Page 162
137
Metcalfe, N. B., & Ure, S. E. (1995). Diurnal variation in flight performance and hence
potential predation risk in small birds. Proceedings of the Royal Society of
London Series B-Biological Sciences , 261, 395-400.
Moore, F. R., & Kerlinger, P. (1987). Stopover and fat deposition by North American
wood-warblers (Parulinae) following spring migration over the Gulf of Mexico.
Oecologia , 74, 47-54.
Moore, F. R., & Wang, Y. (1991). Evidence of food based competition among passerine
migrants during stopover. Behavioral Ecology and Sociobiology , 28, 85-90.
Morgan, M. J., & Colgan, P. W. (1987). The effects of predator presence and shoal size
on foraging in bluntnose minnows, Pimephales notatus. Environmental Biology of
Fishes , 20, 105-111.
Morse, D. H. (1977). Feeding behavior and predator avoidance in heterospecific groups.
BioScience , 27, 332-339.
Moynihan, M. (1962). The organization and probable evolution of some mixed species
flocks of neotropical birds. Smithsonian Miscellaneous Collections , 143, 1-140.
Munn, C. A. (1985). Permanent canopy and understory flocks in Amazonia: Species
composition and population density. Ornithological Monographs , 36, 683-710.
Munn, C. A., & Terborgh, J. (1979). Multi-species territoriality in neotropical forraging
flocks. Condor , 81, 338-347.
Neill, S. R., & Cullen, J. M. (1974). Experiments on whether schooling of prey affects
hunting behaviour of cephalopods and fish predators. Journal of Zoology , 172,
549-569.
Page 163
138
Norris, D. R., Marra, P. P., Kyser, T. K., Sherry, T. W., & Ratcliffe, L. M. (2004).
Tropical winter habitat limits reproductive success on the temperate breeding
grounds in a migratory bird. Proceedings of the Royal Society of London Series B
, 271, 59-64.
Peron, G., & Crochet, P.-A. (2009). Edge effect and structure of mixed-species bird
flocks in an Afrotropical lowland forest. Journal of Ornithology , 150, 585-599.
Petit, D. R., & Bildstein, K. L. (1987). Effect of group size and location within the group
on the foraging behavior of White Ibises. Condor , 89, 602-609.
Petit, L. J., Petit, D. R., Christian, D. G., & Powell, H. D. (1999). Bird communities of
natural and modified habitats in Panama. Ecography , 22, 292-304.
Polo, V., & Bautista, L. M. (2002). Daily body mass regulation in dominance-structured
coal tit (Parus ater) flock in response to variable food access: a laboratory study.
Behavioral Ecology , 13 (5), 696-704.
Pomara, L. Y., Cooper, R. J., & Petit, L. J. (2003). Mixed-species flocking and foraging
behavior of four Neotropical warblers in Panamanian shade coffee fields and
forests. Auk , 120, 1000-1012.
Powell, G. N. (1974). Experimental analysis of the social value of flocking by starlings
(Sturnus vulgaris) in relation to predation and foraging. Animal Behaviour , 22,
501-505.
Powell, G. V. (1985). Sociobiology and adaptive significance of interspecific foraging
flocks in the Neotropics. In P. A. Buckley, M. S. Foster, E. S. Morton, R. S.
Page 164
139
Ridgely, & F. G. Buckley (Eds.), Neotropical Ornithology. Ornithological
Monographs. (Vol. 36, pp. 713-732). Washington: A.O.U.
Powell, G. V. (1977). Socioecology of mixed species flocks in a neotropical forest. Davis,
CA.: Ph. D. dissertation. University of California.
Pulliam, H. R. (1973). On the advantages of flocking. Journal of Theoretical Biology ,
38, 419-422.
Rabenold, K. N., & Christensen, C. R. (1979). Effects of aggregation on feeding and
survival in a communal wren. Behavioral Ecology and Sociobiology , 6, 39-44.
Rappole, J. H. (1995). The Ecology of Migrant Birds: A Neotropical perspective.
Washington D.C.: Smithsonian Institution Press.
Rappole, J. H., & Warner, D. W. (1980). Ecological aspects of migrant bird behavior in
Veracruz, Mexico. In A. Keast, & E. S. Morton (Eds.), Migrant birds in the
neotropics: ecology, distribution, and conservation (pp. 253-393). Washington:
Smithsonian Institution Press.
Robbins, C. J., Sauer, R. S., Greenberg, R. S., & Droeger, S. (1989). Popoulation declines
in Nort America Birds that migrate to the Neotropics. Proceedings of the National
Academy of Sciences , 86, 7658-7662.
Rogers, C. M., & Smith, J. N. (1993). Life-history theory in the nonbreeding period:
trade-off in avian fat reserves? Ecology , 74, 419-426.
Ruxton, G. D., Hall, S. J., & Gurney, W. S. (1995). Attraction towards feeding
conspecifics when food patches are exhaustible. American Naturalist , 145, 653-
660.
Page 165
140
Schaub, M., & Jenni, L. (2000). Fuel deposition rate of three passerine bird species along
the migratory route. Oecologia , 122, 306-317.
Seewagen, C. L., & Slayton, E. J. (2008). Mass changes of migratory landbirds during
stopovers in a New York City park. Wilson Journal of Ornithology , 120 (2), 296-
303.
Siegfried, W. R., & Underhill, L. G. (1975). Experiments on flocking as an anti-predator
strategy in doves. South African Journal of Science , 71 (6), 188-189.
Sillett, T. S., Holmes, R. T., & Sherry, T. W. (2000). The El NIño Southern oscitalion
impacts population dynamics of a migratory songs-bird throughout its annual
cycle. Science , 288, 2040-2042.
Smith, R. J., & Moore, F. R. (2005). Arrival timing and seasonal reproductive
performance in a long-distance migratory landbird. Behavioral Ecology and
Sociobiology , 57, 231-239.
Sridhar, H., Beauchamp, G., & Shanker, K. (2009). Why do birds participate in mixed-
species foraging flocks? A large-scale synthesis. Animal Behaviour , 78, 337-347.
STATPOINT. (2005). Statgraphics Centurion XV. Herndon, VA, US: StatPoint.
Strong, A. M., & Sherry, T. W. (2001). Body condition of Swainson's Warblers wintering
in Jamaica and the conservation value of Caribbean gry forest. Wilson Bulletin ,
113, 410-418.
Strong, A. M., & Sherry, T. W. (2000). Habitat-specific effects of food abundance on the
condition of ovenbirds wintering in Jamaica. Journal of Animal Ecology , 69,
883-895.
Page 166
141
Suhonen, J. (1993). Risk of predation and foraging sites of individuals in mixed-species
tit flocks. Animal Behaviour , 45, 1193-1198.
Swynnerton, C. F. (1915). Mixed bird parties. Ibis , 67, 346-354.
Szekely, T., Szep, T., & Juhasz, T. (1989). Mixed species flocking of tits (Parus spp.): a
field experiment. Oecologia , 78, 490-495.
Terborgh, J. (1990). Mixed flock and polyspecific associations: Costs and benefits of
mixed groups to birds and monkeys. American Journal of Primatology , 21, 87-
100.
Thiollay, J.-M. (1999). Frequency of mixed species flocking in tropical forest birds and
correlates of predation risk: an intertropical comparison. Journal of Avian Biology
, 30, 282-294.
Thiollay, J.-M., & Jullien, M. (1998). Flocking behaviour of foraging birds in a
neotropical rain forest and the antipredator defence hypothesis. Ibis , 140, 382-
394.
Treherne, J. E., & Foster, W. A. (1980). The effects of group size on predator avoidance
in a marine insect. Animal Behaviour , 28, 1119-1122.
Turner, E. R. (1964). Social feeding in birds. Behaviour , 24, 1-46.
Waite, T. A., & Grubb, T. C. (1988). Copying of foraging location in mixed-species
flocks of temperate-deciduous woodland birds: an experimental study. Condor ,
90, 132-140.
Page 167
142
Warkentin, I. G., & Morton, E. S. (2000). Flocking and foraging behavior of wintering
prothonotary warblers. Wilson Bulletin , 112 (1), 88-98.
Winker, K. D., Warner, W., & Weisbrod, A. R. (1992). Daily mass gains among
woodland migrants at an inland stopover site. Auk , 109, 853-862.
Winterbottom, J. M. (1943). On woodland bird parties in northern Rhodesia. Ibis , 84,
437-442.
Wunderle, J. M., & Latta, S. C. (1996). Avian abundance in sun and shade coffe
plantation and remmant pine forest in the Cordillera entral, Dominican Republic.
Ornitologia Neotropical , 7, 19-34.
Wunderle, J. M., & Latta, S. C. (2000). Winter site fidelity of Nearctic migrants in shade
coffee plantations of different sizes in the Dominican Republic. The Auk , 117 (3),
596-614.
Zamora, R., Hodar, J. A., & Gomez, J. M. (1992). Dartford warblers follow stonechats
while foraging. Ornis Scandinavica , 23, 167-174.
Zoratto, F., Santucci, D., & Alleva, E. (2009). Theories commonly adopted to explain the
antipredatory benefits of the group life: the case of starling (Sturnus vulgaris).
Rend. Fis. Acc. Lincei , 20, 163-176.
Page 168
143
Table 4.1. First captured individuals and mean weight of 8 Neotropical migratory species
in shaded monocultures over two winter seasons in southwestern Antioquia, Colombia,
2008-2010. Values are mean ± standard deviation.
Species Trophic Guild Individuals
captured
Weight
(g)
Cerulean Warbler, Dendroica cerulea Insectivore 54 8.86 ± 0.54
Blackburnian Warbler, Dendroica fusca Insectivore 124 9.12 ± 0.57
Tennessee Warbler, Vermivora
peregrina
Nectarivore/Insectivor
e 171 9.52 ± 0.87
Canada Warbler, Wilsonia canadensis Insectivore 73 9.6 ± 0.62
Rose-breasted Grosbeak, Pheucticus
ludovicianus Omnivore 78 43.68 ± 4.95
Red-eyed Vireo, Vireo olivaceus Omnivore 28 15.63 ± 2.22
Summer Tanager, Piranga rubra Omnivore 55 30.17 ± 3.73
Empidonax flycatchers, Empidonax spp. Insectivore 41 11.85 ± 0.77
Page 169
144
Table 4.2. Body condition for Neotropical-Neartic migratory birds captured in flocks and
solitary in shaded monocultures in southwestern Antioquia Department, Colombia, 2008-
2010. Values are mean ± SE. Values in parenthesis are sample sizes.
Species Flock Solitary
Cerulean Warbler -0.326 ± 0.08 (38) -0.085 ± 0.11 (16)
Blackburnian Warbler -0.035 ± 0.07 (75) 0.076 ± 0.08 (49)
Tennessee Warbler -0.004 ± 0.06 (98) -0.198 ± 0.07 (72)
Canada Warbler 0.128 ± 0.11 (29) -0.074 ± 0.09 (44)
Rose-breasted Grosbeak -0.923 ± 0.82 (42) -0.123 ± 0.67 (36)
Red-eyed Vireo 0.005 ± 0.65 (14) -0.195 ± 0.39 (14)
Summer Tanager -0.393 ± 0.91 (18) -0.611 ± 0.33 (37)
Empidonax flycatchers -0.108 ± 0.13 (10) -0.097 ± 0.09 (31)
Page 170
145
Table 4.3. Result of ANOVA test for differences in body frame (PC1) between
Neotropical-Nearctic migratory birds captured in flocks and solitary in shaded
monocultures in southwestern Antioquia department, Colombia, 2008-2010. Values are
mean ± SE. Values in parenthesis are sample sizes.
Species Flock Solitary F P
Cerulean Warbler -0.078 ± 0.41 (38) -0.224 ± 0.44 (16) 0.79 0.38
Blackburnian Warbler 0.038 ± 0.24 (75) 0.057 ± 0.41 (49) 0.01 0.93
Tennessee Warbler 0.077 ± 0.22 (98) 0.001 ± 0.27 (72) 0.21 0.65
Canada Warbler -0.19 ± 0.49 (29) 0.02 ± 0.41 (44) 0.44 0.51
Rose-breasted Grosbeak 0.02 ± 0.33 (42) 0.147 ± 0.43 (36) 0.23 0.63
Red-eyed Vireo 0.306 ± 0.63 (14) -0.022 ± 0.8 (14) 0.49 0.49
Summer Tanager -0.235 ± 0.73 (18) -0.057 ± 0.38 (37) 0.24 0.63
Empidonax flycatchers 0.181 ± 0.58 (10) -0.136 ± 0.36 (31) 0.85 0.36
Page 171
146
Table 4.4. Regression models to relate body condition and (1) time of day and (2) day of
season for Neotropical-Neartic migratory bird species in shaded monocultures in
southwestern Antioquia department, Colombia, 2008-2010.
Time of day Day of season
Species df F P F P
Cerulean Warbler 1, 52 5.9 0.02 0.18 0.67
Blackburnian Warbler 1, 122 11.25 0.001 2.1 0.15
Tennessee Warbler 1, 172 12.72 0.001 10.2 0.002
Canada Warbler 1, 71 26.43 0.001 1.31 0.26
Rose-breasted Grosbeak 1, 80 0.04 0.84 11.55 0.001
Red-eyed Vireo 1, 26 0.13 0.73 1.86 0.19
Summer Tanager 1, 55 0.86 0.36 9.42 0.003
Empidonax flycatchers 1, 39 1.46 0.23 0.3 0.59
Page 172
147
Tabl
e 4.
5. C
oeff
icie
nts (
± SE
) of r
egre
ssio
n m
odel
s to
eval
uate
the
rela
tions
hip
betw
een
daily
cha
nges
in b
ody
cond
ition
and
floc
king
beha
vior
in N
eotro
pica
l-Nea
rtic
mig
rato
ry b
irds i
n sh
aded
mon
ocul
ture
s in
Sout
hwes
tern
Ant
ioqu
ia d
epar
tmen
t, C
olom
bia.
200
8-
2010
. Int
erac
tion
term
repr
esen
ts st
atus
x T
ime
of d
ay. P
< 0
.01*
, P <
0.0
5**,
0.0
5 <
P <
0.1*
**.
Spec
ies
N
F- fu
ll m
odel
P
Soci
al S
tatu
s Ti
me
of D
ay
Inte
ract
ion
Term
Cer
ulea
n W
arbl
er
54
3.56
0
.02
-1
.310
7 ±
0.72
31**
* 0.
0002
± 0
.000
6 0
.002
± 0
.001
*
Bla
ckbu
rnia
n W
arbl
er
124
4.61
0
.004
0.7
209
± 0.
456
0.00
16 ±
0.0
005
-0.0
01 ±
0.0
007
Tenn
esse
e W
arbl
er
176
5.98
0
.007
0.4
913
± 0.
42
0.00
17 ±
0.0
005
-0
.001
1 ±
0.00
07
Can
ada
War
bler
73
8.
89
0.0
01
0.22
36 ±
0.4
737
0.00
16 ±
0.0
005
0.00
02 ±
0.0
007
Ros
e-br
east
ed G
rosb
eak
82
0.14
0.
94
-0
.720
5 ±
2.89
18
-0
.001
6 ±
0.00
34
0.00
19 ±
0.0
048
Red
-eye
d V
ireo
28
0.9
0.45
-0
.179
± 3
.211
3 0.
0042
± 0
.003
6
-0.0
002
± 0.
0051
Sum
mer
Tan
ager
57
1.
56
0.21
4.0
283
± 3.
304
0.00
79 ±
0.0
041
-0
.007
8 ±
0.00
5
Empi
dona
x fly
catc
hers
41
0.
78
0.51
1.
1564
± 1
.730
7 0.
0029
± 0
.003
1
-0.0
023
± 0.
0032
147
Page 173
148
Tabl
e 4.
6. M
ean
body
con
ditio
n fo
r eig
ht N
eotro
pica
l-Nea
rctic
mig
rato
ry b
ird sp
ecie
s in
rela
tion
to th
eir s
ocia
l sta
tus,
segr
egat
ed b
y
sex,
age
and
seas
on in
shad
ed m
onoc
ultu
res i
n so
uthw
este
rn A
ntio
quia
dep
artm
ent,
Col
ombi
a, 2
008-
2010
. Val
ues a
re m
ean
± SD
.
Sam
ple
size
in p
aren
thes
is. *
P <
0.0
5.
Spec
ies
Stat
us
Sex
Age
Se
ason
Mal
e Fe
mal
e A
dult
Juve
nile
20
08-2
009
2009
-201
0 C
erul
ean
War
bler
Fl
ock
-0.1
98 ±
0.4
82 (2
2)
-0.
511
± 0.
499
(14)
-0
.319
± 0
.488
(33)
-0
.372
± 0
.579
(5)
-0.4
96 ±
0.5
53 (1
1)
-0.2
57 ±
0.4
59 (2
7)
So
litar
y -0
.091
± 0
.46
(10)
-0
.216
± 0
.388
(5)
-0.1
04 ±
0.4
47 (1
3)
-0.0
01 ±
0.5
85 (3
) -0
.016
± 0
.393
(11)
-0
.237
± 0
.59
(5)
Bla
ckbu
rnia
n W
arbl
er
Floc
k 0
.021
± 0
.553
(33)
-
0.07
7 ±
0.61
5 (4
4)
-0.0
57 ±
0.5
64 (8
7)
-0.
073
± 0.
412
(10)
-
0.09
± 0
.543
(36)
-0
.041
± 0
.555
(61)
So
litar
y 0
.163
± 0
.515
(16)
0.0
33 ±
0.5
86 (3
4)
0.0
52 ±
0.5
47 (5
4)
0.1
79 ±
0.3
21 (7
) 0
.044
± 0
.509
(24)
0.
081
± 0.
54 (3
7)
Tenn
esse
e W
arbl
er
Floc
k 0
.067
± 0
.739
(52)
-
0.21
5 ±
0.66
7 (3
6)
-0.0
15 ±
0.7
33 (1
02)
- 0
.164
± 0
.827
(41)
-0
.134
± 0
.643
(61)
So
litar
y 0
.048
± 0
.858
(38)
-
0.26
5 ±
0.84
9 (2
6)
-0.0
01 ±
0.9
16 (7
5)
-0.3
95 ±
0.7
3 (3
) -0
.051
± 0
.78
(32)
0
.006
± 0
.992
(46)
Can
ada
War
bler
Fl
ock
0.0
14 ±
0.7
23 (1
3)
0.
168
± 0.
547
(13)
0
.113
± 0
.609
(31)
0.
525
(1)
0.22
4 ±
0.59
3 (1
1)
0.0
91 ±
0.6
17 (2
1)
So
litar
y 0
.042
± 0
.683
(18)
-0
.187
± 0
.56
(21)
-0
.064
± 0
.614
(41)
-
0.14
3 ±
0.15
3 (2
) 0.
014
± 0.
598
(20)
-0
.147
± 0
.593
(24)
Ros
e-br
east
ed G
rosb
eak
Floc
k -0
.151
± 5
.773
(29)
-
2.19
6 ±
4.96
9 (1
7)
-0.8
94 ±
5.5
77 (4
5)
-2.2
26 (1
) -1
.237
± 2
.835
(16)
-0.7
5 ±
6.59
1 (3
0)
So
litar
y -0
.012
± 4
.587
(22)
-
0.28
5 ±
3.30
1 (1
6)
-0.1
23 ±
4.0
66 (3
8)
- -0
.031
± 5
.095
(18)
-0
.201
± 3
.073
(20)
Red
-eye
d V
ireo
Floc
k -
- -0
.937
± 2
.585
(7)
0.9
47 ±
1.9
78 (8
) 0
.46
± 2.
382
(4)
-0.1
77 ±
2.5
34 (1
1)
So
litar
y -
- -0
.331
± 1
.559
(10)
0
.146
± 1
.356
(4)
-0.4
84 ±
2.5
76 (4
) -0
.079
± 0
.923
(10)
Sum
mer
Tan
ager
Fl
ock
1.8
77 ±
4.1
11 (1
4)
-2.
385
± 2.
066
(6)*
0.
598
± 4.
087
(20)
-
0.9
62 ±
4.0
84 (1
2)
0.05
3 ±
4.30
8 (8
)
So
litar
y -0
.523
± 2
.104
(23)
-0
.533
± 2
.08
(10)
-0
.579
± 2
.061
(36)
-1
.739
(1)
-0.3
14 ±
2.3
59 (2
1)
-
1.0
± 1.
512
(16)
Empi
dona
x fly
catc
hers
Fl
ock
- -
-0.1
08 ±
0.4
18 (1
2)
- -0
.294
± 0
.618
(5)
-0.0
28 ±
0.3
31 (7
)
So
litar
y -
- -
0.07
6 ±
0.51
(27)
-0
.203
± 0
.472
(5)
-0.0
57 ±
0.4
56 (2
4)
-0.2
32 ±
0.6
47 (8
)
148
Page 174
149
Tabl
e 4.
7. C
oeff
icie
nts (
± SE
) of r
egre
ssio
n m
odel
s to
eval
uate
the
rela
tions
hip
betw
een
seas
onal
cha
nges
in b
ody
cond
ition
and
flock
ing
beha
vior
in N
eotro
pica
l-Nea
rtic
mig
rato
ry b
irds i
n sh
aded
mon
ocul
ture
s in
Sout
hwes
tern
Ant
ioqu
ia d
epar
tmen
t, C
olom
bia.
Inte
ract
ion
term
repr
esen
ts st
atus
x D
ay o
f sea
son.
P <
0.0
1*, P
< 0
.05*
*, 0
.05
< P
< 0.
1***
. ***
. Em
pido
nax
Flyc
atch
ers w
ere
excl
uded
from
this
ana
lysi
s for
lack
of i
ndiv
idua
ls c
augh
t in
flock
s lat
er in
the
seas
on.
Spec
ies
N
F- fu
ll m
odel
P
Soci
al S
tatu
s D
ay o
f Sea
son
Inte
ract
ion
Term
Cer
ulea
n W
arbl
er
54
0.98
0.
41
0.18
42 ±
0.4
161
0.00
05 ±
0.0
019
0.00
05 ±
0.0
032
Bla
ckbu
rnia
n W
arbl
er
124
3.44
0.
02
0.5
76 ±
0.3
072*
**
-0.0
006
± 0.
0013
0.
005
± 0.
002*
*
Tenn
esse
e W
arbl
er
176
4.66
0.
004
-
0.47
61 ±
0.5
335
0.00
44 ±
0.0
02
0.00
18 ±
0.0
031
Can
ada
War
bler
73
1.
19
0.32
-0.3
9 ±
0.33
54
-0.0
024
± 0.
002
0.00
17 ±
0.0
026
Ros
e-br
east
ed G
rosb
eak
82
4.56
0.
006
1.68
66 ±
2.1
066
0.02
81 ±
0.0
084
-0.0
132
± 0.
0131
Red
-eye
d V
ireo
28
1.81
0.
17
-
2.01
52 ±
2.0
481
-0.0
187
± 0.
0085
0.
0126
9 ±
0.01
219
Sum
mer
Tan
ager
57
3.
48
0.02
1.
9203
± 2
.415
2 0.
0302
± 0
.012
5 -0
.014
8 ±
0.01
5
149
Page 175
150
Tabl
e 4.
8. F
-test
for c
ompa
rison
of s
tand
ard
devi
atio
ns o
f bod
y co
nditi
on b
etw
een
flock
and
solit
ary
indi
vidu
als f
or N
eotro
pica
l-
Nea
rctic
mig
rato
ry b
irds i
n sh
aded
mon
ocul
ture
s in
Sout
hwes
tern
Ant
ioqu
ia d
epar
tmen
t, C
olom
bia.
Spec
ies
Floc
k So
litar
y F
df
P
Cer
ulea
n W
arbl
er
0.49
3 0.
455
1.17
37
, 15
0.77
Bla
ckbu
rnia
n W
arbl
er
0.58
7 0.
562
1.09
74
, 48
0.75
Tenn
esse
e W
arbl
er
0.69
6 0.
661
1.11
98
, 71
0.65
Can
ada
War
bler
0.
603
0.59
4 1.
03
28, 4
3 0.
91
Ros
e-br
east
ed G
rosb
eak
3.22
1 3.
172
1.03
42
, 36
0.93
Red
-eye
d V
ireo
2.41
8 1.
469
2.71
13
, 13
0.08
Sum
mer
Tan
ager
2.
871
2.04
1 1.
98
17, 3
6 0.
08
Empi
dona
x fly
catc
hers
0.
4179
0.
499
0.7
9, 3
0 0.
6
150
Page 176
151
Figu
re 4
.1.B
andi
ng st
atio
ns in
Sou
thw
este
rn A
ntio
quia
dep
artm
ent,
Col
ombi
a. 1
. Gua
land
ay fa
rm, F
redo
nia
Mun
icip
ality
, 2.
Cul
tivar
es fa
rm, J
eric
o M
unic
ipal
ity a
nd 3
. La
Cum
bre
farm
, Tam
esis
Mun
icip
ality
. Sou
rce:
msn
Enc
arta
.
151
Page 177
152
Figu
re 4
.2.R
elat
ions
hip
betw
een
daily
bod
y co
nditi
on a
nd so
cial
stat
us in
Neo
tropi
cal m
igra
tory
bird
spec
ies i
n sh
aded
mon
ocul
ture
s
in A
ntio
quia
dep
artm
ent,
Col
ombi
a. O
pen
circ
le w
ith so
lid li
ne: b
irds i
n flo
cks.
Clo
sed
circ
le w
ith d
otte
d lin
e: so
litar
y bi
rds.
6:00
8:00
10:0
012
:00
14:0
016
:00
18:0
0-1
.4-1
-0.6
-0.20.2
0.61
BCI CERW
Floc
kSo
litary
6:00
8:00
10:0
012
:00
14:0
016
:00
18:0
0-1
-0.50
0.51
1.52
BCI BLWA
BCI TEWA
Hour
6:00
8:00
10:0
012
:00
14:0
016
:00
18:0
0-1
.8
-0.80.2
1.2
2.2
Hour
6:00
8:00
10:0
012
:00
14:0
016
:00
18:0
0-1
.4
-0.9
-0.40.1
0.6
1.1
1.6
BCI CAWA
152
BLBW
Page 178
153
Figu
re 4
.2. (
Con
tinue
d) R
elat
ions
hip
betw
een
daily
bod
y co
nditi
on a
nd so
cial
stat
us in
Neo
tropi
cal m
igra
tory
bird
spec
ies i
n sh
aded
mon
ocul
ture
s in
Ant
ioqu
ia d
epar
tmen
t, C
olom
bia.
Ope
n ci
rcle
with
solid
line
: bird
s in
flock
s. C
lose
d ci
rcle
with
dot
ted
line:
solit
ary
bird
s.
Floc
kSo
litary
Hour
6:00
8:00
10:0
012
:00
14:0
016
:00
18:0
0-2
0
-1001020
BCI RBGB
Floc
kSo
litary
Hour
6:00
8:00
10:0
012
:00
14:0
016
:00
18:0
0-4
.9
-2.9
-0.91.1
3.1
5.1
BCI REVI
Floc
kSo
litary
Hour
6:00
8:00
10:0
012
:00
14:0
016
:00
18:0
0-5-214710 BCI SUTA
BCI EMFL
Hour
6:00
8:00
10:0
012
:00
14:0
016
:00
18:0
0-1
.1
-0.7
-0.30.1
0.5
0.9
1.3
153
Page 179
154
Figu
re 4
.3. R
elat
ions
hip
betw
een
seas
onal
bod
y co
nditi
on a
nd so
cial
stat
us in
Neo
tropi
cal m
igra
tory
bird
spec
ies i
n sh
aded
mon
ocul
ture
s in
Ant
ioqu
ia D
ept.,
Col
ombi
a. O
pen
circ
le w
ith so
lid li
ne: b
irds i
n flo
cks.
Clo
sed
circ
le w
ith d
otte
d lin
e: so
litar
y bi
rds.
Day
of s
easo
n40
8012
016
020
024
0-1
.4-1
-0.6
-0.20.2
0.61
BCI CERW
Day
of s
easo
n40
8012
016
020
024
0-1
-0.50
0.51
1.52
BCI BLWA
Day
of s
easo
n70
110
150
190
230
-1.8
-0.80.2
1.2
2.2
BCI TEWA
Day
of s
easo
n40
8012
016
020
024
0-1
.4
-0.9
-0.40.1
0.6
1.1
1.6
BCI CAWA
154
BLBW
Page 180
155
Figu
re 4
.3. (
Con
tinue
d). R
elat
ions
hip
betw
een
seas
onal
bod
y co
nditi
on a
nd so
cial
stat
us in
Neo
tropi
cal m
igra
tory
bird
spec
ies i
n
shad
ed m
onoc
ultu
res i
n A
ntio
quia
dep
artm
ent,
Col
ombi
a. O
pen
circ
le w
ith so
lid li
ne: b
irds i
n flo
cks.
Clo
sed
circ
le w
ith d
otte
d lin
e:
solit
ary
bird
s.
Day
of s
easo
n40
8012
016
020
024
0-6-2261014 BCI RBGB
Day
of s
easo
n40
8012
016
020
024
0-4
.9
-2.9
-0.91.1
3.1
5.1
BCI REVI
Day
of s
easo
n60
100
140
180
220
-6-30369
BCI SUTA
155
Page 181
156
5 BIBLIOGRAPHY
Algar, A. C., Sleep, D. J., & Nudds, T. D. (2005). Niches, null models, and forest birds:
Testing competing community assembly hypotheses in disturbed and undisturbed
hardwood forest. Ecoscience , 12 (4), 574-580.
Anderson, D. R., Burnham, K. P., & Thompson, W. L. (2000). Null hypothesis testing:
problems, prevalence, and an alternative. Journal of Wildlife Management , 64 (4),
912-923.
Askins, R. A., Ewert, D. N., & Norton, R. L. (1992). Abundance of wintering migrants in
fragmented and continuous forests in the U.S. Virgin Islands. In J. M. Hagan, & D.
M. Johnston (Eds.), Ecology and conservation of neotropical migrant landbirds
(pp. 197-206). Washington, D.C.: Smithsonian Institution Press.
Bakermans, M. H., Vitz, A. C., Rodewald, A. D., & Rengifo, C. G. (2009). Migratory
songbird use of shade coffee in the Venezuelan Andes with implications for
conservation of cerulean warbler. Biological Conservation , 142, 2476-2483.
Bayne, E. M., & Hobson, K. A. (1997). Comparing the effects of landscape
fragmentation by forestry and agriculture on artificial nests. Conservation Biology
, 11, 1418-1429.
Beauchamp, G. (2004). Reduced flocking by birds on island with relaxed predation.
Proceedings of the Royal Society B , 271, 1039-1042.
Page 182
157
Bednekoff, P. A., & Krebs, J. R. (1995). Great tit fat reserves: effects of changing and
unpredictable day length. Functional Ecology , 9, 457-462.
Bell, G. (2000). The distribution of abundance in neutral communities. American
Naturalist , 155, 606-617.
Bellwood, D. R., Wainwright, P. C., Fulton, C. J., & Hoey, A. (2002). Assembly rules
and functional groups at global biogeographical scales. Functional Ecology , 16,
557-562.
Benson, T. J., & Bednarz, J. C. (2010). Relationships among survival, body condition and
habitat of breeding swainson's warblers. The Condor , 112 (1), 138-148.
Berner, T. O., & Grubb, T. C. (1985). An experimental analysis of mixed species
flocking in birds of deciduous woodland. Ecology , 66, 1229-1236.
Bibby, C. J., Burgess, D., & Hill, D. A. (1992). Bird census techniques. London:
Academic Press.
Bierregaard, R. O., & Stouffer, P. (1997). Understory birds and dynamic habitat mosaics
in Amazonian rainforests. In W. F. Laurance, & R. O. Bierregaard (Eds.), Tropical
Forest Remnants: Ecology, Management, and Conservation of Fragmented
Communities (pp. 138-155). Chicago, Il: University of Chicago Press.
Bierregaard, R. O., Lovejoy, T. E., Kapos, V., dos Santos, A. A., & Hutchings, R. W.
(1992). The biological dynamics of the tropical rainforest fragments a prospective
comparison of fragments and continuous forest. BioScience , 42, 859-866.
BirdLife, I. (2008). Dendroica cerulea, 2010.4. Retrieved September 26, 2010, from
IUCN Red List of Threatened Species: www.iucnredlist.org
Page 183
158
Bonter, D. N., Donovan, T. M., & Brooks, E. W. (2007). Daily mass changes in landbirds
during migration stopover on the south shore of lake Ontario. The Auk , 124 (1),
122-133.
Brown, D. R., & Sherry, T. W. (2006). Behavioral response of Jamaica resident birds to
foot manipulation. Biotropica , 38, 91-99.
Brown, M. E. (1996). Assessing body condition in birds. Current Ornithology , 13, 67-
135.
Buler, J. J., Moore, F. R., & Woltmann, S. A. (2007). multi-scale examination of stopover
habitat use by birds. Ecology , 88, 1789–1802.
Burnham, K. P., & Anderson, D. R. (2002). Model selection and multimodel inference: a
practical information-theoretical approach (2nd Edition ed.). New York, New
York, US: Springer-Verlag.
Burns, K. C. (2007). Patterns in the assembly of an island plant community. Journal of
Biogeography , 34, 760-768.
Carlisle, J. D., Kaltenecker, G. S., & Swanson, D. L. (2005). Stopover ecology of aurumn
landbird migrants in the Boise foothills of southwestern Idaho. Condor , 107, 244-
258.
Carlo, T. A., Collazo, J. A., & Groom, M. J. (2004). Influences of fruit diversity and
abundance on bird use of two shaded coffee plantations. Biotropica , 36 (4), 602-
614.
Case, T. J., Faaborg, J., & Sidell, R. (1983). The role of body size in the assembly of
West Indian bird communities. Evolution , 37, 1062-1074.
Page 184
159
Chase, J. M. (2003). Community assembly: when should history matter. Oecologia , 136,
489-498.
Cimprich, D. A., & Grubb, T. C. (1994). Consequences for Carolina Chickadees of
foraging with tufted titmice in winter. Ecology , 75, 1615-1625.
Cleary, D. F., Genner, M. J., Boyle, T. J., Setyawati, T., Angraeti, C. D., & Menken, S.
B. (2005). Associations of birds species richness and community composition with
local- and landscape-scale environmental factors in Borneo. Landscape Ecology ,
20, 989-1001.
Clements, F. E. (1916). Plant Succession: An Analysis of the Development of Vegetation.
Washington: Carnegie Institution of Washington.
Cody, M. L. (1971). Finch flocks in the Mohave desert. Theoretical Population Biology ,
2, 141-158.
Cole, B. (1983). Assembly of mangrove ant communities: colonization abilities. Journal
of Animal Ecology , 52, 349-355.
Colorado, G., Hamel, P., Rodewald, A., & Thogmartin, W. (2008). El grupo cerúleo:
colaboration to assess nonbreeding range of Cerulean Warbler in South America.
Ornitología Neotropical , 19 (Suppl.), 521-529.
Colwell, R. K. (2006). EstimateS: Statistical estimation of species richness and shared
species from samples. Version 8. http://purl.oclc.org/estimates.
Connor, E. F., & Simberloff, D. (1979). The assembly of species communities: chance or
competition? Ecology , 60, 1132-1140.
Page 185
160
Coreau, A., & Martin, J. L. (2007). Multi-scale study of bird distribution and their
response to vegetation change: a Mediterranean example. Landscape Ecology , 22,
747-764.
Cresswell, W. (1998). Diurnal and seasonal mass variation in blackbirds Turdus merula:
consequences for mass-dependent predation risk. Journal of Animal Ecology , 67,
78-90.
Cresswell, W. (1994). Flocking as an effective anti-predation strategy in redshanks,
Tringa totanus. Animal Behaviour , 47, 433-442.
Curson, J., Quinn, D., & Beadle, D. (1994). Warblers of the Americas. Boston: Houghton
Mifflin.
Dayan, T., & Simberloff, D. (2005). Ecological and community-wide character
displacement: the next generation. Ecology Letters , 8, 875-894.
Dayan, T., & Simberloff, D. (1994). Morphological relationships among coexisting
heteromyids: an incisive dental character. American Naturalist , 143, 462-477.
Delingat, J., Dierschke, V., Schmaljohann, H., & Bairlein, F. (2009). Diurnal patterns of
body mass change during stopover in a migrating songbird, the northern wheatear
Oenanthe oenanthe. Journal of Avian Biology , 40, 625-634.
Deppe, J. L., & Rotenberry, J. T. (2008). Scale-dependent habitat use by fall migratory
birds: vegetation structure, floristics, and geography. Ecological monographs , 78
(3), 461-487.
Page 186
161
Develey, P. F., & Peres, C. A. (2000). Resource seasonality and the structure of mixed
species bird flock in a coastal Atlantic forest of south-eastern Brazil. Journal of
Tropical Ecology , 16, 33-53.
Diamond, J. M. (1975). Assembly of species communities. In M. L. Cody, & J. M.
Diamond, Ecology and evolution of communities (pp. 342-444). Cambridge,
Massachusetts, US: Harvard University Press.
Diamond, J. M., & Gilpin, M. E. (1982). Examination of the "null" model of Connor and
Simberloff for species co-occurrences on islands. Oecologia , 52, 64-74.
Dolby, A. S., & Grubb, T. C. (1998). Benefits to satellite members in mixed-species
foraging groups: an experimental analysis. Animal Behaviour , 56, 501-509.
Dooley, J. L., & Bowers, M. A. (1998). Demographic responses to habitat fragmentation:
experimental tests at the landscape and patch scale. Ecology , 79, 969-980.
Dunn, E. H. (2002). A cross-Canada comparison of mass change in birds during
migration stopover. Wilson Bulletin , 114, 368-379.
Dunn, E. H. (2000). Temporal and spatial patterns in daily mass gain of Magnolia
Warblers during migratory stopover. Auk , 117, 12-21.
Ekman, J. B., & Hake, M. K. (1990). Monitoring starvation risk: adjustments of body
reserves in greenfinches (Carduelis chloris L.) during periods of unpredictable
foraging success. Behaviroural Ecology , 1, 62-67.
Environmental Systems Research Institute. (2002). ArcGIS software. California, US.
Page 187
162
Ewert, N. D., & Askins, R. A. (1991). Flocking behavior of migratory warblers in winter
in the Virgin Islands. Condor , 93, 864-868.
Faarborg, J., & Arendt, W. J. (1989). Long-term declines in witer resident walbers in a
Puerto Rican dry forest. American Birds , 43, 1226-1230.
Faarborg, J., Holmes, R. T., Anders, A. D., Bildstein, K. L., Dugger, K. M., Gauthreaux,
S. A., et al. (2010). Recent advances in understanding migration systems of New
World land birds. Ecological Monographs , 80 (1), 3-48.
FAO. (2009). The State of the World’s Forests. Rome: Food and Agriculture
Organization of the United
Nations.http://www.fao.org/docrep/011/i0350e/i0350e00.HTM.
Fargione, J., Brown, C. S., & Tilman, D. (2003). Community assembly and invasion: an
experimental test of neutral versus niche processes. Proceedings of the National
Academy of Sciences of the USA , 100, 8916-8920.
Feeley, K. (2003). Analysis of avian communities in Lake Guri, Venezuela, using
multiple assembly rule models. Oecologia , 137, 104-113.
Fitzpatrick, J. W. (1980). Wintering of North American tyrant flycatchers in the
Neotropics. In A. Keast, & E. S. Morton (Eds.), Migrant birds in the Neotropics:
Ecology, behavior, distribution, and conservation (pp. 67-78). Washington, D.C.:
Smithsonian Institution Press.
Flather, C. H., & Sauer, J. R. (1996). Using landscape ecology to test hypotheses about
large-scale abundance patterns in migratory birds. Ecology , 77, 28-35.
Page 188
163
Forsman, J. T., Mönkkönen, M., Helle, P., & Inkeröinen, J. (1998). Heterospecific
attraction and food resources in migrants´ breeding patch selection in northern
boreal forests. Oecologia , 115, 278-286.
Foster, W. A., & Treherne, J. E. (1981). Evidence for the dilution effect in the selfish
herd from dish predation on a marine insect. Nature , 293, 466-467.
Fox, B. J. (1989). Small-mammal community pattern in Australian heathland: a
taxonomically based rule for species assembly. In D. W. Morris, Z. Abramsky, B.
J. Fox, & M. R. Willig (Eds.), The Structure of Mammalian Communities (pp. 91-
103). Lubbock: Texas Technical University.
Fox, B. J., & Brown, J. H. (1993). Assembly rules for functional groups in North
American desert rodent communities. Oikos , 67, 358-370.
Fox, B. J., & Kitkland, G. L. (1992). North American soricid communities follow
Australian small mammal assembly rule. Journal of Mammology , 73, 491-503.
Gaddis, P. K. (1983). Composition and behavior of mixed-species flocks of forest birds
in North-central Florida. Florida Field Naturalist , 11, 25-44.
Gilpin, M. E., & Diamond, J. M. (1984). Are species co-occurrences on islands non-
random, and are null hypotheses useful in communitiy ecology? In Ecological
communities: conceptual issues and the evidence (pp. 297-315). Princeton, NJ:
Princeton University Press.
Godin, J. G. (1986). Risk of predation and foraging behaviour in shoaling banded killifish
(Fundulus diaphanus). Canadian Journal of Zoology , 64, 1675-1678.
Page 189
164
Godin, J. G., Classon, L. J., & Abrahams, M. V. (1988). Group vigilance and shoal size
in a small characin fish. Behaviour , 104, 29-40.
Goodale, E., & Kotagama, S. W. (2005). Testing the roles of species in mixed-species
birds flocks of a Sri Lankan rain forest. Journal of Tropical Ecology , 21, 669-676.
Gosler, A. G. (1996). Environmental and social determinants of winter fat storage in the
great tit Parus major. Journal of Animal Ecology , 65, 1-17.
Gotelli, H. J., & Ellison, A. M. (2002). Assembly rules for New England ant
assemblages. Oikos , 99, 591-599.
Gotelli, N. J. (2000). Null model analysis of species co-occurrence patterns. Ecology , 81,
2606-2621.
Gotelli, N. J., & Colwell, R. K. (2001). Quantifying biodiversity: procedures and pitfalls
in the in the measurement and comparison of species richness. Ecology letters , 4,
379-391.
Gotelli, N. J., & Entsminger, G. L. (2005). EcoSim: Null models sofware for ecology.
Version 7. Acquired Intelligence Inc. & Kesey-Bear, Jericho, VT.
http://garyentsminger.com/ecosim.htm.7.0 edn.
Gotelli, N. J., & Graves, G. R. (1996). Null models in ecology. Washington, D.C.:
Smithsonian Institution Press.
Gotelli, N. J., & McCabe, D. J. (2002). Species co-occurrence: a meta-analysis of J.M.
Diamond's assembly rules model. Ecology , 83 (8), 2091-2096.
Page 190
165
Gradwohl, J., & Greenberg, R. (1980). The formation of antwren flocks on Barro
Colorado Island, Panama. Auk , 97, 385-395.
Graham, C. H., & Blake, G. (2001). The influence of patch and landscape level factors on
bird assemblages in a fragmented tropical landscape. Ecological Applications , 11,
1709-1721.
Graves, G. R., & Gotelli, N. j. (1993). Assambly of avian mixed-spicies flocks in
Amazonian. Proceeding of the National Academy of Sciences , 90, 1388-1391.
Greenberg, R. (2000). Birds of many feathers: the formation and structure of mixed-
species flocks of forest birds. In S. Boinski, & P. A. Garber (Eds.), On the move
(pp. 521-558). Chicago: University of Chicago Press.
Greenberg, R., Bichier, P., & Sterling, J. (1997). Bird populations in rustic and planted
shade coffee plantations of eastern Chiapas, Mexico. Biotropica , 29, 501-514.
Greenberg, R., Bichier, P., & Sterling, J. (1997). Bird populations in rustic and planted
shade coffee plantations of eastern Chiapas, Mexico. Biotropica , 29, 501-514.
Grubb, J. R. (1987). Changes in the flocking behaviour of wintering English titmice with
time, weather and supplementary food. Animal Behaviour , 35, 794-806.
Hamel, P. B. (2000). Cerulean warbler (Dendroica cerulea). In A. Poole, & F. Gill (Eds.),
The Birds of North America. Philadelphia (No. 511): The Birds of North America,
Inc.
Hamilton, W. D. (1971). Geometry of the Selfish Herd. Journal of Theoretical Biology ,
31, 295-311.
Page 191
166
Hardin, G. (1960). The competitive exclusion principle. Science , 131 (3409), 1292-1297.
Harper, L. H. (1989). The persistence of ant-following birds in small forest fragments.
Acta Amazonica , 19, 249-263.
Harris, L. D., & Silva-Lopez, G. (1992). Forest fragmentation and the conservation of
biological diversity. In P. L. Fiedler, & S. K. Jain (Eds.), Conservation biology: the
theory and practice of nature conservation, preservation, and management (pp.
197-237). New York, US: Chapman and Hall.
Hart, P. J., & Freed, L. A. (2003). Structure and dynamics of mixed-species floks in a
Hawaiian rainforest. Auk , 120, 1-14.
Hino, T. (1998). Mutualistic and commensal organization of avian mixed-species
foraging flocks in a forest of western Madagascar. Journal of Avian Biology , 29,
17-24.
Holdaway, R. J., & Sparrow, A. D. (2006). Assembly rules operating along a primary
riverbed-grassland successional sequence. Journal of Ecology , 94, 1092-1102.
Holdridge, L. R. (1967). Life zone ecology. San Jose, Costa Rica: Tropical Science
Center.
Holmes, R. T., & Sherry, T. W. (1988). Assessing population trends of New Hampshire
forest birds: local vs. regional patterns. Auk , 105, 756-768.
Houston, A. I., McNamara, J. M., & Hutchinson, J. M. (1993). General results
concerning the trade-off between gaining energy and avoiding predation.
Philosophical Transactions of the Royal Society of London B , 341, 375-397.
Page 192
167
Hubbell, S. P. (2001). The Unified Neutral Theory of Biodiversity and Biogeography.
New Jersey, US: Princeton University Pres.
Hubbell, S. P. (1979). Tree dispersion, abundance, and diversity in a tropical dry forest.
Science , 203 (4387), 1299-1309.
Hubbell, S. P., & Foster, R. B. (1986). Commonness and rarity in a neotropical forest:
implications for tropical tree conservation. In M. E. Soulé (Ed.). Sunderland, MA,
US: Sinauer Associates.
Hutchinson, G. E. (1959). Homage to Santa Rosalia, or why are there so many kinds of
animals? American Naturalist , 93, 145-159.
Hutto, R. L. (1988). Foraing behavior patterns suggest a possible cost associated with
participation in mixed-species bird flocks. Oikos , 51, 79-83.
Hutto, R. L. (1985). Habitat selection by nonbreeding, migratory land birds. In M. L.
Cody (Ed.), Habitat selection in birds. (pp. 455-476). Orlando: Academic Press.
Hutto, R. L. (1994). The composition andsocial-organization of mixe-species flocks in a
tropical deciduous forest in Western Mexico. Condor , 96, 105-118.
Hutto, R. (1994). The composition and social organization of mixed-species flocks in a
tropical deciduous foret in western Mexico. Condor , 96, 105-118.
James, F. C. (1971). Ordinations of habitat relationships among breeding birds. Wilson
Bulletin , 83, 215-236.
James, F. C., & Shugart, H. H. (1970). A quantitative method of habitat description.
Audubon Field Notes , 24, 727-736.
Page 193
168
James, F. C., Johnston, R. F., Wamer, N. O., Niemi, G. J., & Boecklen, W. J. (1984). The
Grinellian niche of the wood thrush. American Naturalist , 124, 17-47.
John, R., Dalling, J. W., Harms, K. E., Yaitt, J. B., Stallard, R. F., Mirabello, M., et al.
(2007). Soil nutrients influence spatial distribution of tropical tree species.
Proceedings of the National Academy of Sciences. USA , 104, 864-869.
Johnson, M. D. (2007). Measuring habitat quality: a review. Condor , 109, 489-504.
Johnson, M. D., & Sherry, T. W. (2001). Effecs of food availabiliy on the distribution of
migratory warblers among habitats in Jamaica . Jornal of Animal Ecology , 70,
546-560.
Johnson, M. D., Sherry, T. W., Holmes, R. T., & Marra, P. P. (2006). Assessing habitat
quality for a migratory songbird wintering in natural and agricultural habitats.
Conservation Biology , 20 (5), 1433-1444.
Johnson, M. D., Sherry, T. W., Strong, A. M., & Medori, A. (2005). Migrants in
Neotropical bird communities: an assessment of the breeding currency hypothesis.
Journal of Animal Ecology , 74 (2), 333-341.
Jokimäki, J., & Huhta, E. (1996). Effects of landscape matrix and habitat structure on a
bird community in northern Finland: a multi-scale approach. Ornis Fennica , 73,
97-113.
Jones, J., Ramoni-Perazzi, P., Carruthers, E. H., & Robertson, R. J. (2002). Species
composition of bird communities in shade coffee plantations in the Venezuelan
Andes. Ornitologia Neotropical , 13, 397-412.
Page 194
169
Jullien, M., & Clobert, J. (2000). The survival value of flocking in Neotropical birds:
reality or fiction? Ecology , 81 (12), 3416-3430.
Jullien, M., & Thiollay, J. M. (1998). Multi-species territoriality and dynamics of
neotropical understory bird flocks. Journal of Animal Ecology , 67, 227-252.
Karr, J. R. (1982). Population variability and extinction in the avifauna of a land bridge
island. Ecology , 63, 1975-1978.
Kattan, G. H., Alvarez-López, H., & Giraldo, M. (1994). Forest fragmentation and bird
extinctions: San Antonio eighty years later. Conservation Biology , 8, 138-146.
Keast, A., & Morton, E. S. (1980). Migrant birds in the neotropics: Ecology, behavior,
distribution, and conservation. Washington, D C: Smithsonian Institution Press.
Keddy, P. A. (1992). Assembly and response rules: two goals for predictive community
ecology. Journal of Vegetation Science , 3, 157-164.
Kelly, J. F., & Hutto, R. L. (2005). An east-west comparison of migration in North
American wood warblers. Condor , 107, 197-211.
Koivula, K., Orell, M., & Lahti, K. (2002). Plastic daily fattening routines in willow tits.
Journal of Animal Behavior , 71, 816-823.
Kotagama, S. W., & Goodale, E. (2004). The composition and spatial organization of
mixed-species flocks in a Sri Lankan rainforest. Forktail , 20, 63-70.
Krause, J., & Ruxton, G. D. (2002). Living in groups. New York: Oxford University
Press.
Page 195
170
Kruger, R. F., De Carvalho, C. J., & Ribeiro, P. B. (2010). Assembly rules in muscid fly
assemblages in the grasslands biome of southern Brazil. Neotropical Entomology ,
39 (3), 345-353.
Kumar, A., & O´Donnell, S. (2007). Fragmentation and elevation effects on bird-army
ant interactions in neotropical montane forest of Costa Rica. Journal of Tropical
Ecology , 23, 581-590.
Lange, H., & Leimar, O. (2004). Social stability and daily body mass gain in great tits.
Behavioral Ecology , 15 (4), 549-554.
Latta, S. C., & Wunderle, J. M. (1996). The composition and foraging ecology of mixed-
species flocks in pine forest of Hspaniola. Condor , 98, 595-607.
Laurence, W. F., & Bierregaard, R. O. (Eds.). (1997). Tropical forest remnants: ecology,
management, and conservation of fragmented communities. Chicago, Illinois, US:
University of Chicago Press.
Lee, M., Fahrig, L., Freemark, K., & Currie, D. J. (2002). Importance of patch scale vs.
landscape scale on selected forest birds. Oikos , 96 (1), 110-118.
Lee, T. M., Soh, M. C., Sodhi, N., Koh, L. P., & Lim, S. L. (2005). Effcts of habitat
disturbance on mixed species bird flocks in a tropical sub-montane rainforest.
Biological conservation , 122, 193-204.
Lehikoinen, E. (1987). Seasonality of the daily weight cycle in wintering passerines and
its consequences. Ornis Scandinavica , 18, 216-226.
Levin, S. A. (1992). The problem of pattern and scale in ecology. Ecology , 73 (6), 1943-
1967.
Page 196
171
Lilliendahl, K. (2002). Daily patterns of body mass gain in four species of small
wintering birds. Journal Avian Biology , 33, 212-218.
Lortie, C. J., Brooker, R. W., Choler, P., Kikvidze, Z., Michalet, R., Pugnaire, F. I., et al.
(2004). Rethinking plant community theory. Oikos , 107 (2), 433-438.
Lovejoy, T. E., Bierregaard, R. O., Rylands, A. B., Malcolm, J. B., Quintela, C., Harper,
L. H., et al. (1986). Edge and other effects of isolation on Amazon forest
fragments. In M. A. Soulé (Ed.), Conservation biology. The science of scarcity and
diversity (pp. 257-285). Sunderland: Sinauer Associates.
Luck, G. W. (2002). The habitat requirements of the rufous treecreeper (Climacteris
rufa). 1. Preferential habitat use demonstrated at multiple spatial scales. Biological
Conservation , 105, 383-394.
Lyra-Jorge, M. C., Ribeiro, M. C., Ciocheti, G., Tambosi, L. R., & Pivello, V. R. (2010).
Influence of multi-scale landscape structure on the occurrence of carnivorous
mammals in a human-modified savanna, Brazil. European Journal of Wildlife
Research , 56 (3), 359-368.
MacArthur, R. H., & Levins, R. (1967). The limiting similarity, convergence and
divergence of coexisting species. The American Naturalist , 101, 377-385.
MacArthur, R. H., & Wilson, E. O. (1967). The Theory of Island Biogeography.
Princeton, NJ: Princeton University Press.
Maldonado-Coelho, M., & Marini, M. A. (2000). Effects of forest fragment size and
successional stage on mixed-species bird flocks in southeastern Brazil. Condor ,
102, 585-594.
Page 197
172
Maldonado-Coelho, M., & Marini, M. A. (2004). Mixed-species bird flocks from
Brazilian Atlantic forest: the effects of forest fragmentation and seasonality on
their size, richness and stability. Biological Conservation , 116, 19-26.
Manly, B. F. (1995). A note on the analysis of species co-occurrences. Ecology , 76,
1109-1115.
Marra, P. P., & Holmes, R. T. (2001). Consequences of dominance-mediated habitat
segregation in American Redstarts during the nonbreeding season. Auk , 118, 92-
104.
Marra, P. P., Hobson, K. A., & Holmes, R. T. (1998). Linking winter and summer events
in a migratory bird by using stable-carbon isotopes. Science , 282, 1884-1886.
McCun, B., & Mefford, M. J. (1999). PC-ORD. Multivariate Analysis of Ecological
Data, Version 4. MjM Software Design. Gleneden Beach, OR, USA.
McCune, B., & Grace, J. (2002). Analysis of Ecological Communities. Gleneden Beach:
MjM Software Design.
McGarigal, K., & McComb, W. C. (1995). Relationships between landscape structure
and breeding birds in the Oregon Coast Range. Ecological Monographs , 65, 235-
260.
McGill, B. J., Maurer, B. A., & Weiser, M. D. (2006). Empirical evaluation of neutral
theory. Ecology , 87, 1411-1423.
McNamara, J. M., Houston, A. I., & Lima, S. L. (1994). Foraging routines of small birds
in winter: A theoretical investigation. Journal of Avian Biology , 25, 287-302.
Page 198
173
Metcalfe, N. B. (1984). The effects of mixed-species flocking on the vigilance of
shorebirds: Who do they trust? Animal Behaviour , 32, 986-993.
Metcalfe, N. B., & Ure, S. E. (1995). Diurnal variation in flight performance and hence
potential predation risk in small birds. Proceedings of the Royal Society of London
Series B-Biological Sciences , 261, 395-400.
Meyer, C. F., & Kalko, E. K. (2008). Bat assemblages on Neotropical land-bridge
islands: nestes subsets and null model analyses of species co-occurrence patterns.
Diversity and Distributions , 14, 644-654.
Mikkelson, G. M. (1993). How do food webs fall apart? A study of changes in trophic
structure during relaxation on habitat fragments. Oikos , 67, 539-547.
Minitab Inc. (2007). Minitab Version 15.1. PA, US.
MODIS. (2001). Global land cover facility. University of Maryland, NASA, Institute for
Advanced Computer Analysis.
Moore, F. R., & Kerlinger, P. (1987). Stopover and fat deposition by North American
wood-warblers (Parulinae) following spring migration over the Gulf of Mexico.
Oecologia , 74, 47-54.
Moore, F. R., & Wang, Y. (1991). Evidence of food based competition among passerine
migrants during stopover. Behavioral Ecology and Sociobiology , 28, 85-90.
Morgan, M. J., & Colgan, P. W. (1987). The effects of predator presence and shoal size
on foraging in bluntnose minnows, Pimephales notatus. Environmental Biology of
Fishes , 20, 105-111.
Page 199
174
Morse, D. H. (1970). Ecological aspects of some mixed-species foraging flocks of birds.
Ecological monographs , 40, 119-168.
Morse, D. H. (1970). Ecological aspects of some mixed-species foraging flocks of birds.
Ecological Monographs , 40, 119-168.
Morse, D. H. (1977). Feeding behavior and predator avoidance in heterospecific groups.
BioScience , 27, 332-339.
Moynihan, M. (1962). The organization and probable evolution of some mixed species
flocks of neotropical birds. Smithsonian Miscellaneous Collections , 143, 1-140.
Munn, C. A. (1985). Permanent canopy and understory flocks in Amazonia: Species
composition and population density. Ornithological Monographs , 36, 683-710.
Munn, C. A., & Terborgh, J. (1979). Multi-species territoriality in neotropical forraging
flocks. Condor , 81, 338-347.
Neill, S. R., & Cullen, J. M. (1974). Experiments on whether schooling of prey affects
hunting behaviour of cephalopods and fish predators. Journal of Zoology , 172,
549-569.
Norris, D. R., Marra, P. P., Kyser, T. K., Sherry, T. W., & Ratcliffe, L. M. (2004).
Tropical winter habitat limits reproductive success on the temperate breeding
grounds in a migratory bird. Proceedings of the Royal Society of London Series B ,
271, 59-64.
Orejuela, J. E., Rait, J. R., & Humberto, A. (1980). Differential use by North American
migrants of three types of Colombian forests. In A. Keast, & E. S. Morto (Eds.),
Page 200
175
Migrant birds in the Neotropics: ecology, behavior, distribution and conservation
(pp. 253-264). Washington D.C.: Smithsonian Institution Press.
Orme, C. D., Davies, R. G., Burgess, M., Eigenbrod, F., Pickup, N., Olson, V. A., et al.
(2005). Global hotspots of species richness are not congruent with endemism or
threat. Nature , 436, 1016-1019.
Pacala, S. W., & Tilman, D. (1994). Limiting similarity in mechanistic and spatial models
of plant competition in heterogeneous environments. American Naturalist , 143,
222-257.
Pearson, D. L. (1980). Bird migration in Amazonian Ecuador, Peru and Bolivia. In A.
Keast, & E. S. Morton (Eds.), Migrant birds in the Neotropics: ecology, behavior,
distribution and conservation (pp. 273-283). Washington, DC.: Smithsonian
Institution Press.
Peres-Neto, P. R., Olden, J. D., & Jackson, D. A. (2001). Environmentally constrained
null models: site suitability as occupancy criterion. Oikos , 93, 110-120.
Perfecto, I., Rice, R., Greenberg, R., & van de Voor, M. E. (1996). Shade coffee: a
disappearing refuge for biodiversity. BioScience , 46, 598-608.
Peron, G., & Crochet, P.-A. (2009). Edge effect and structure of mixed-species bird
flocks in an Afrotropical lowland forest. Journal of Ornithology , 150, 585-599.
Petit, D. R., & Bildstein, K. L. (1987). Effect of group size and location within the group
on the foraging behavior of White Ibises. Condor , 89, 602-609.
Petit, D. R., Lynch, J. F., Hutto, R. L., Blake, J. G., & Waide, R. B. (1995). Habitat Use
and Conservation in the Neotropics. In T. E. Martin, & D. M. Finch, Ecology and
Page 201
176
Management of Neotropical Migratory Birds (pp. 145-197). New York, New
York, US: Oxford University Press Inc.
Petit, D. R., Lynch, J. F., Hutto, R. L., Blake, J. G., & Waide, R. B. (1993). Management
and conservation of migratory landbirds overwintering in the Neotropics. In D. M.
Finch, & P. W. Stangel (Eds.), Status and management of Neotropical migratory
birds (pp. 70-92). Fort Collins, CO: Gen. Tech. Rep. RM-229. USDA Forest
Service, Rocky Mt. Forest Range Exp. Sta.
Petit, L. J., Petit, D. R., Christian, D. G., & Powell, H. D. (1999). Bird communities of
natural and modified habitats in Panama. Ecography , 22, 292-304.
Pianka, E. R. (1986). Ecology and natural history od desert lizards. Princeton: Princeton
University Press.
Pielou, D. P., & Pielou, E. C. (1968). Association among species of infrequent
occurrence: the insect and spider fauna of Polyporus betulinus (Bulliard) Fries.
Journal of Theoretical Biology , 21, 202-216.
Polo, V., & Bautista, L. M. (2002). Daily body mass regulation in dominance-structured
coal tit (Parus ater) flock in response to variable food access: a laboratory study.
Behavioral Ecology , 13 (5), 696-704.
Pomara, L. Y., Cooper, R. J., & Petit, L. J. (2003). Mixed-species flocking and foraging
behavior of four Neotropical warblers in Panamanian shade coffee fields and
forests. Auk , 120, 1000-1012.
Pomareda, C. (2000). Perspectivas en los mercados y oportunidades para la inversión en
ganadería. Costa Rica: CATIE-FAO-SIDE.
Page 202
177
Poulin, B., & Lefebvre, G. (1996). Dietary relationships of migrant and resident birds
from a humid forest in Central Panama. Auk , 113, 277-287.
Powell, G. N. (1974). Experimental analysis of the social value of flocking by starlings
(Sturnus vulgaris) in relation to predation and foraging. Animal Behaviour , 22,
501-505.
Powell, G. V. (1985). Sociobiology and adaptive significance of interspecific foraging
flocks in the Neotropics. In P. A. Buckley, M. S. Foster, E. S. Morton, R. S.
Ridgely, & F. G. Buckley (Eds.), Neotropical Ornithology. Ornithological
Monographs. (Vol. 36, pp. 713-732). Washington: A.O.U.
Powell, G. V. (1977). Socioecology of mixed species flocks in a neotropical forest. Davis,
CA.: Ph. D. dissertation. University of California.
Powell, G. V. (1979). Structure and dynamics of interspecific flocks in a neotropical mid-
elevation forest. Auk , 96, 375-390.
Priess, J. A., Mimler, M., Klein, A. M., Schwarze, S., Tscharntke, T., & Steffan-
Dewenter, I. (2007). Linking deforestation scenarios to pollination services and
economic returns in coffee agroforestry systems. Ecological Applications , 17 (2),
407-417.
Pulliam, H. R. (1973). On the advantages of flocking. Journal of Theoretical Biology ,
38, 419-422.
Rabenold, K. N., & Christensen, C. R. (1979). Effects of aggregation on feeding and
survival in a communal wren. Behavioral Ecology and Sociobiology , 6, 39-44.
Page 203
178
Rappole, J. H. (1995). The Ecology of Migrant Birds: A Neotropical perspective.
Washington D.C.: Smithsonian Institution Press.
Rappole, J. H., & McDonald, M. V. (1994). Cause and effect in population declines of
migratory birds. Auk , 111, 652-660.
Rappole, J. H., & Warner, D. W. (1980). Ecological aspects of migrant bird behavior in
Veracruz, Mexico. In A. Keast, & E. S. Morton (Eds.), Migrant birds in the
neotropics: ecology, distribution, and conservation (pp. 253-393). Washington:
Smithsonian Institution Press.
R-Development Core Team. (2009). R: A language and environment for statistical
computing. Retrieved from R Foundation for Statistical Computing: www.R-
project.org
Renjifo, L. M. (1999). Composition changes in a subandean avifauna after long-term
forest fragmentation. Conservation Biology , 13, 1124-1139.
Renjifo, L. M. (2001). Effect of natural and anthropogenic landscape matrices on the
abundance of subandean bird species. Ecological Applications , 11 (1), 14-31.
Reshi, Z., Rashid, I., Khuroo, A. A., & Wafai, B. A. (2008). Effect of invasion by
Centaurea iberica on community assembly of a mountain grassland of Kashmir
Himalaya, India. Tropical Ecology , 49 (2), 147-156.
Restrepo, C., & Gómez, N. (1998). Responses of understory birds to anthropogenic edges
in a Neotropical montane forest. Ecological Applications , 8, 170-183.
Ricketts, T. H. (2004). Tropical forest fragments enhance pollinator activity in nearby
coffee crops. Conservation Biology , 18, 1262-1271.
Page 204
179
Ricklefs, R. E. (1987). Community diversity: relative roles of local and regional
processes. Science , 235, 167-171.
Robbins, C. J., Sauer, R. S., Greenberg, R. S., & Droeger, S. (1989). Popoulation declines
in Nort America Birds that migrate to the Neotropics. Proceedings of the National
Academy of Sciences , 86, 7658-7662.
Robbins, C. S., Dowell, B. A., Dawson, D. K., Colon, J. A., Estrada, R., Sutton, A., et al.
(1992). Comparison of Neotropical migrant landbird populations wintering in
tropical forest, isolated forest fragments, and agricultural habitats. In J. M. Hagan
III, & D. W. Johnston, Ecology and Conservation of Neotropical Migrant
Landbirds (pp. 207-220). Washington DC: Smithsonian Institution Press.
Robbins, C. S., Dowell, B. A., Dawson, D. K., Colon, J., Espinoza, F., Rodriguez, J., et
al. (1987). Comparison of Neotropical winter bird populations in isolated patches
versus extensive forest. Acta Oecol./Oecol. Gen. , 8, 282-292.
Robinson, S. K., & Holmes, R. T. (1982). Foraging behavior of forest birds: the
relationships among search tactics, diet, and habitat structure. Ecology , 63, 1918-
1931.
Robinson, S. K., & Terborgh, J. (1995). Interspecific aggression and habitat selection by
Amazonian birds. Journal of Animal Ecology , 64, 1-11.
Robson, D. S. (1972). Appendix: statistical tests of significance. Journal of Theoretical
Biology , 34, 350-352.
Rodríguez-Mahecha, J. V., Salaman, P., Jorgensen, P., Consiglio, T., Forno, E., Telesca,
A., et al. (2004). Tropical Andes. In R. A. Mittermeier, P. R. Gil, M. Hoffmann, J.
Page 205
180
Pilgrim, T. Brooks, C. Goettsch Mittermeier, et al., Hotspots Revisited: Earth´s
Biologically Richest and Most Endangered Terrestrial Ecoregions (pp. 73-79).
Mexico City: CEMEX.
Rogers, C. M., & Smith, J. N. (1993). Life-history theory in the nonbreeding period:
trade-off in avian fat reserves? Ecology , 74, 419-426.
Root, R. B. (1967). the niche exploitation pattern of the blue-gray gnatcatcher. Ecological
Monographs , 37, 317-350.
Ruxton, G. D., Hall, S. J., & Gurney, W. S. (1995). Attraction towards feeding
conspecifics when food patches are exhaustible. American Naturalist , 145, 653-
660.
Saab, V. (1999). Importance of spatial scale to habitat use by breeding birds in riparian
forests: a hierarchical analysis. Ecological Applications , 9, 135-151.
Sanders, N. J., Gotelli, N. J., Heller, N., & Gordon, D. M. (2003). Community
disassembly by an invasive species. Proceedings of the National Academy of
Sciences , 100, 2474-2477.
Sanders, N. J., Gotelli, N. J., Wittman, S. E., Ratchford, J. S., Ellison, A. M., & Jules, E.
S. (2007). Assembly rules of ground-foraging ant assemblages are contingent on
disturbance, habitat and spatial scale. Journal of Biogeography , 34, 1632-1641.
Sanderson, J. G., Moulton, M. P., & Selfridge, R. G. (1998). Null matrices and the
analysis of species co-occurrences. Oecologia , 116, 275-283.
Schaub, M., & Jenni, L. (2000). Fuel deposition rate of three passerine bird species along
the migratory route. Oecologia , 122, 306-317.
Page 206
181
Schluter, D. (1984). A variance test for detecting species asociation, with some examples
applications. Ecology , 65, 998-1005.
Seewagen, C. L., & Slayton, E. J. (2008). Mass changes of migratory landbirds during
stopovers in a New York City park. Wilson Journal of Ornithology , 120 (2), 296-
303.
Sekercioglu, C. H., Ehrlich, P. R., Daily, G. C., Aygen, D., Goehring, D., & Sandi, R. F.
(2002). Disappearance of insectivorous birds from tropical forest fragments.
Proceedings of the National Academy of Sciences (USA) , 99, 263-267.
Siegfried, W. R., & Underhill, L. G. (1975). Experiments on flocking as an anti-predator
strategy in doves. South African Journal of Science , 71 (6), 188-189.
Sillett, T. S., Holmes, R. T., & Sherry, T. W. (2000). The El NIño Southern oscitalion
impacts population dynamics of a migratory songs-bird throughout its annual
cycle. Science , 288, 2040-2042.
Simberloff, D., & Boecklen, W. (1981). Santa Rosalia reconsidered: size ratios and
competition. Evolution , 35, 1206-1228.
Simberloff, D., & Connor, E. F. (1981). Missing species combinations. American
naturalist , 118, 215-239.
Smith, R. J., & Moore, F. R. (2005). Arrival timing and seasonal reproductive
performance in a long-distance migratory landbird. Behavioral Ecology and
Sociobiology , 57, 231-239.
Page 207
182
Sodhi, N. S., Briffett, C., Kong, L., & Yuen, B. (1999). Bird use of linear areas of a
tropical city: implications for park connector design and management. Landscape
and Urban Planning , 45, 123–130.
Sokal, R. R., & Rohlf, F. F. (1995). Biometry: the principles and practice of statistics in
biological research. New York: W.H. Freeman & Co.
Soulé, M. E., Bolger, D. T., Albert, A. C., Wright, J., Sorice, M., & Hill, S. (1988).
Reconstructed dynamics of rapid extinctions of chaparral-requiring birds in urban
habitat islands. Conservation Biology , 2, 75-92.
Sridhar, H., & Sankar, K. (2008). Effects of habitat degradation on mixed-species bird
flocks in Indian rain forests. Journal of Tropical Ecology , 24, 135-147.
Sridhar, H., Beauchamp, G., & Shanker, K. (2009). Why do birds participate in mixed-
species foraging flocks? A large-scale synthesis. Animal Behaviour , 78, 337-347.
STATPOINT. (2005). Statgraphics Centurion XV. Herndon, VA, US: StatPoint.
Stone, L., & Roberts, A. (1990). The checkerboard score and species distributions.
Oecologia , 85, 74-79.
Stouffer, P. C., & Bierregaard, R. O. (1995). Use of Amazonian forest fragments by
understory insectivorous birds. Ecology , 76, 2429-2445.
Strong, A. M. (2000). Divergent foraging strategies of two Neotropical migrant Warblers:
implications for winter habitat use. The Auk , 117 (2), 381-392.
Page 208
183
Strong, A. M., & Sherry, T. W. (2001). Body condition of Swainson's Warblers wintering
in Jamaica and the conservation value of Caribbean gry forest. Wilson Bulletin ,
113, 410-418.
Strong, D. R., Simberloff, D., Abele, L., & Thistle, A. B. (1984). Ecological
communities: conceptual issues and the evidence. Princeton, NJ: Princeton
University Press.
Suhonen, J. (1993). Risk of predation and foraging sites of individuals in mixed-species
tit flocks. Animal Behaviour , 45, 1193-1198.
Svenning, J. C., Kinner, D. A., Stallard, R. F., Engelbrecht, B. M., & Wright, S. J. (2004).
Ecological determinism in plant community structure across a tropical forest
landscape. Ecology , 94, 1003-1010.
Swynnerton, C. F. (1915). Mixed bird parties. Ibis , 67, 346-354.
Szekely, T., Szep, T., & Juhasz, T. (1989). Mixed species flocking of tits (Parus spp.): a
field experiment. Oecologia , 78, 490-495.
Tejeda-Cruz, C., & Sutherland, W. J. (2004). Bird responses to shade coffee production.
Animal Conservation , 7, 169-179.
Tellería, J. L., Virgós, E., Carbonell, R., Pérez-Tris, J., & Santos, T. (2001). Behavioural
responses to changing landscapes: flock structure and anti-predator strategies of
tits wintering in fragmented forests. Oikos , 95, 253-264.
Terborgh, J. (1990). Mixed flock and polyspecific associations: Costs and benefits of
mixed groups to birds and monkeys. American Journal of Primatology , 21, 87-
100.
Page 209
184
Terborgh, J. (1980). The conservation status of Neotropical migrants: present and future.
In A. Keast, & E. S. Morton (Eds.), Migrant birds in the Neotropics: ecology,
behavior, distribution, and conservation (pp. 21-30). Washington, DC.:
Smithsonian Institution Press.
Terborgh, J., Foster, R. B., & Nunez, P. (1996). Tropical tree communities: A test of the
nonequilibrium hipothesis. Ecology , 77 (2), 561-567.
Thiollay, J. (1999). Frequency of mixed species flocking in tropical forest birds and
correlates of predation risk: an intertropical comparison. Journal of Avian Biology ,
30, 282-294.
Thiollay, J. M. (1997). Disturbance, selective logging and bird diversity: a neotropical
forest study. Diversity and conservation , 6, 1377-1395.
Thiollay, J. M. (1992). Influence of selective logging on bird species diversity in a
Guianan rain forest. Conservation Biology , 6 (1), 47-63.
Thiollay, J. M. (1993). Response of raptor community to shrinking area and degradation
of tropical rain forest in the South Western Ghats (India). Ecography , 16, 97-110.
Thiollay, J.-M. (1999). Frequency of mixed species flocking in tropical forest birds and
correlates of predation risk: an intertropical comparison. Journal of Avian Biology ,
30, 282-294.
Thiollay, J.-M., & Jullien, M. (1998). Flocking behaviour of foraging birds in a
neotropical rain forest and the antipredator defence hypothesis. Ibis , 140, 382-394.
Page 210
185
Thomas, L., Laake, J. L., Strindberg, S., Marques, F. F., Buckland, S. T., Borchers, D. L.,
et al. (2006). Distance 5.0. Release 2. United Kingdom: Research Unit for Wildlife
Population Assessment, University of St. Andrews.
Tilman, D. (2004). Niche tradeoffs, neutrality, and community structure: a stochastic
theory of resource competition, invasion, and community assembly. The National
Academy of Sciences , 101, 10854-10861.
Tilman, D. (1988). Plant Strategies and the Dynamics and Structure of Plant
Communities. Monographs in Population Biology. Princeton: Princeton University
Press.
Treherne, J. E., & Foster, W. A. (1980). The effects of group size on predator avoidance
in a marine insect. Animal Behaviour , 28, 1119-1122.
Turner, E. R. (1964). Social feeding in birds. Behaviour , 24, 1-46.
Van Houtan, K. S., Pimm, S. L., Bierregaard, R. O., Lovejoy, T. E., & Stouffer, P. C.
(2006). Local extinctions in flocking birds in Amazonian forest fragments.
Evolutionary Ecology Research , 8, 129-148.
Waite, T. A., & Grubb, T. C. (1988). Copying of foraging location in mixed-species
flocks of temperate-deciduous woodland birds: an experimental study. Condor ,
90, 132-140.
Wallem, P. K., Anderson, C. B., Martinez-pastur, G., & Lencinas, M. V. (2010). Using
assembly rules to measure the resilience of riparian plant communities to beaver
invasion in subantarctic forest. Biological invasions , 12, 325-335.
Page 211
186
Warkentin, I. G., & Morton, E. S. (2000). Flocking and foraging behavior of wintering
prothonotary warblers. Wilson Bulletin , 112 (1), 88-98.
Weiher, E., & Keddy, P. A. (1999). Ecological Assembly Rules: Perspectives, Advances,
Retreats. Cambridge, United Kingdom: Cambridge University Press.
Whitmore, T. C. (1997). Tropical forest disturbance, dissappearance, and species loss. In
W. F. Laurence, & R. O. Bierregaard, Tropical Forest Remnants: Ecology,
Management, and Conservation of Fragmented Communities (pp. 3-12). Chicago,
US: The University of Chicago Press.
Wiens, J. A. (1982). On size ratios and sequences in ecological communities - are there
no rules. Annales Zoologici Feninici , 19 (4), 297-308.
Wilson, J. B. (1989). A null model of guild proportionality, applied to stratification of a
New Zealand temperate rain forest. Oecologia , 80, 263-267.
Wilson, J. B. (1999). Assembly rules in plant communities . In Ecological Assembly
Rules: Perspectives, advances, retreats (pp. 130-164). Cambridge: Cambridge
University Press.
Wilson, J. B., & Gitay, H. (1995). Community structure and assembly rules in a dune
slack: Variance in richness, guild proportionality, biomass constancy and
dominance/diversity relations. Vegetatio , 116, 93-106.
Wilson, J. B., & Roxburgh, S. H. (1994). A demonstration of guild-based assembly rules
for a plant community, and determination of intrinsic guilds. Oikos , 69, 267-276.
Wilson, J. B., & Whittaker, R. J. (1995). Assembly rules demonstrated in a saltmarsh
community. Journal of Ecology , 83, 801-807.
Page 212
187
Wilson, J. B., Steel, J. E., & King, W. M. (2000). Quantitative aspects of community
tructure examined in a semi-arid grassland. Jurnal of Ecology , 88, 749-756.
Winker, K. D., Warner, W., & Weisbrod, A. R. (1992). Daily mass gains among
woodland migrants at an inland stopover site. Auk , 109, 853-862.
Winterbottom, J. M. (1943). On woodland bird parties in northern Rhodesia. Ibis , 84,
437-442.
Wright, S. J. (2005). Tropical forests in a changing environment. Trends in Ecology and
Evolution , 20, 553-560.
Wunderle, J. M., & Latta, S. C. (1996). Avian abundance in sun and shade coffee
plantations and remnant pine forests in the Cordillera Central, Dominican
Republic. Ornitologia Neotropical , 7, 19-34.
Wunderle, J. M., & Latta, S. C. (2000). Winter site fidelity of Nearctic migrants in shade
coffee plantations of different sizes in the Dominican Republic. The Auk , 117 (3),
596-614.
Wunderle, J. M., & Waide, B. (1993). Distribution of overwintering Nearctic migrants in
the Bahamas and Greater Antilles. Condor , 95, 904-933.
Zamora, R., Hodar, J. A., & Gomez, J. M. (1992). Dartford warblers follow stonechats
while foraging. Ornis Scandinavica , 23, 167-174.
Zobel, K., Zobel, M., & Peet, R. K. (1993). Change in pattern diversity during secondary
succession in estonian forests. Jurnal of Vegetation Science , 4 (4), 489-498.
Page 213
188
Zoratto, F., Santucci, D., & Alleva, E. (2009). Theories commonly adopted to explain the
antipredatory benefits of the group life: the case of starling (Sturnus vulgaris).
Rend. Fis. Acc. Lincei , 20, 163-176.
Page 214
189
APPENDICES
Appendix A. Field design for Neotropical-Nearctic migratory birds and mixed-species
flocks surveys in the Northern and Central Andes.
A predictive map to elucidate occurrence of Cerulean Warbler in the Andes was created
by members of El Grupo Ceruleo, a subcommittee of the Cerulean Warbler technical
group. This map was developed by the combination of five GIS hypothetical models of
potential distribution of the bird in the Northern and Central Andes (Barker et al. 20061).
This map then represents the locations with the highest probability of occurrence of the
species. We used a stratified-random design to select 20 locations (hereafter called
random points) to verify the occurrence of the species (Colorado et al. 20082), and I
applied this design to accomplish the aims of chapter 2 and chapter 3 of my dissertation.
Each of these random points, represented by a 1-km2 area (or pixel) in the GIS map, was
predicted as potential habitat by all five hypothetical models. Each of these 20 random
points was paired with a randomly selected point (paired point) defined to have been
selected by three or fewer of the five models as potential habitat within a 5-km circus
radius of the random point. Finally, around each of the random and paired points a
systematically arrayed grid of four additional 1-km2 survey sites oriented in the cardinal
directions and located 1 km from the central random or paired point was selected. The
resulting total was ten 1-km2 pixels (i.e. one random point and four cardinal random
points, plus one paired point and four cardinal paired points) at each one of the 20
Page 215
190
locations. The final sample consisted of two hundred 1-km2 pixels in the Northern and
Central Andes.
1 Barker, S., S. Benítez, J. Baldy, D. Cisneros H., G. Colorado, F. Cuesta, I. Davidson, D.
Díaz, A. Ganzenmueller, S. García, M. K. Girvan, E. Guevara, P. Hamel, A. B.
Hennessey, O. L. Hernández, S. Herzog, D. Mehlman, M. I. Moreno, E.
Ozdenerol, P. Ramoni-Perazzi, M. Romero, D. Romo, P. Salaman, T. Santander,
C. Tovar, M. Welton, T. Will, C. Pedraza, & G. Galindo. 2006. Modeling the
South American Range of the Cerulean Warbler. Proceedings of the 26th ESRI
International User Conference.
2 Colorado G., Hamel P., Rodewald A. and W. Thogmartin. 2008. El grupo cerúleo:
collaboration to assess nonbreeding range of cerulean warbler in south America.
Ornitologia Neotropical (suppl.) 19: 521-529.
Page 216
191
Appendix B. Presence-absence matrix built from the species pool of flocking species in
the locality of Aguachica, Eastern Andes, Colombia.
Species
Floc
k 1
Floc
k 2
Floc
k 3
Floc
k 4
Floc
k 5
Floc
k 6
Floc
k 7
Floc
k 8
Floc
k 9
Floc
k 10
Floc
k 11
Floc
k 12
Xenops minutes 0 0 0 0 0 0 0 0 1 0 0 0
Xiphorhynchus triangularis 0 0 0 0 0 0 0 0 1 0 0 0
Dysithamnus mentalis 0 0 1 0 0 0 0 0 0 0 0 0
Cymbilaimus lineatus 0 0 0 0 1 0 0 0 0 0 0 0
Todirostrum cinereum 0 0 0 0 0 0 1 0 0 1 0 0
Leptopogon amaurocephalus 0 0 0 0 0 0 0 0 0 1 0 0
Phylloscartes ophtalmicus 0 0 0 0 0 0 0 0 0 1 0 1
Myiodynastes maculatus 1 0 0 0 0 0 0 0 0 0 0 0
Empidonax spp. 0 0 0 0 0 0 1 1 0 0 0 0
Phyllomyias nigrocapillus 0 0 1 0 0 0 0 0 0 0 0 0
Myiarchus cephalotes 0 0 0 1 1 0 0 0 0 0 0 0
Mionectes oleagineus 0 0 0 0 1 0 0 0 0 0 0 0
Elaenia flavogaster 0 0 0 0 0 0 1 0 0 0 0 0
Chiroxiphia lanceolata 0 0 0 0 0 0 0 1 0 1 0 0
Corapipo leucorrhoa 0 0 0 0 0 0 0 0 0 0 0 1
Thryothorus rufalbus 0 0 0 0 0 0 0 0 0 0 0 1
Catharus aurantiirostris 0 0 0 0 0 0 0 0 0 0 0 1
continued
Page 217
192
Appendix B. (continued)
Turdus leucomelas 0 0 1 0 0 0 0 0 0 0 0 0
Hylophilus flavipes 0 0 0 1 1 0 0 0 0 0 0 0
Mniotilta varia 1 0 1 1 1 0 0 0 0 0 0 0
Dendroica fusca 1 0 0 1 0 0 0 0 0 0 0 0
Vermivora peregrina 1 0 0 1 1 1 0 1 1 0 1 0
Parula pitiayumi 0 0 0 0 0 0 0 0 0 1 0 0
Basileuterus culicivorus 1 1 1 1 0 0 0 1 1 0 0 1
Basileuterus rufifrons 0 1 0 0 0 0 1 0 1 1 0 1
Basileuterus cinereicollis 0 0 1 1 0 0 0 0 0 0 0 0
Euphonia laniirostris 0 0 0 0 1 0 0 0 0 0 1 0
Thraupis episcopus 0 0 0 0 0 1 1 0 0 0 0 0
Thraupis palmarum 0 0 0 0 1 0 0 0 0 0 0 0
Ramphocelus carbo 0 0 0 0 0 0 0 1 0 1 1 0
Tangara gyrola 0 0 0 1 1 0 0 0 0 0 0 0
Tangara guttata 0 0 1 1 1 0 1 0 0 0 0 0
Tangara cyanoptera 0 0 0 0 0 0 1 0 1 0 0 0
Piranga rubra 0 0 0 0 0 0 0 0 1 1 0 0
Chlorospingus canigularis 0 0 0 0 0 0 0 0 0 0 0 1
Rhodinocichla rosea 0 1 0 0 0 0 0 0 0 0 0 0
Pheucticus ludovicianus 1 0 0 0 1 0 0 0 0 0 0 0
Arremon schlegeli 0 1 0 0 0 0 0 0 1 1 0 0
Atlapetes rufinuchus 0 0 0 0 0 0 0 0 0 0 0 1
Arremon torquatus 0 0 0 0 0 0 0 0 0 0 0 1
Continued
Page 218
193
Appendix B. (continued)
Saltator striatipectus 0 0 0 0 0 1 0 1 0 1 0 0
Saltator maximus 0 0 0 0 0 0 0 0 0 1 0 0
Tiaris fuliginosus 0 0 0 0 0 0 0 1 0 0 0 0
Volatinia jacarina 0 0 0 0 0 0 0 0 0 1 0 0
Page 219
194
Appendix C. Percentage of species per guild in 311 mixed-species bird flocks recorded
in 13 regions in the Andes. 2007-2010.
Region Flock No. Frugivore Omnivore Insectivore Nectarivore No. species
No. % No. % No. % No. %
Carache Flock 1 7 46.7 0 0.0 8 53.3 0 0.0 15
Carache Flock 2 9 64.3 0 0.0 5 35.7 0 0.0 14
Carache Flock 3 6 46.2 0 0.0 7 53.8 0 0.0 13
Carache Flock 4 5 62.5 0 0.0 3 37.5 0 0.0 8
Carache Flock 5 8 61.5 0 0.0 5 38.5 0 0.0 13
Carache Flock 6 7 53.8 0 0.0 6 46.2 0 0.0 13
Carache Flock 7 2 25.0 0 0.0 6 75.0 0 0.0 8
Carache Flock 8 1 16.7 0 0.0 5 83.3 0 0.0 6
Carache Flock 9 6 60.0 0 0.0 4 40.0 0 0.0 10
Carache Flock 10 4 66.7 0 0.0 2 33.3 0 0.0 6
Carache Flock 11 5 62.5 1 12.5 2 25.0 0 0.0 8
Carache Flock 12 7 70.0 0 0.0 2 20.0 1 10.0 10
Carache Flock 13 3 75.0 0 0.0 1 25.0 0 0.0 4
Carache Flock 14 1 25.0 0 0.0 3 75.0 0 0.0 4
Carache Flock 15 3 60.0 0 0.0 2 40.0 0 0.0 5
Carache Flock 16 4 66.7 0 0.0 2 33.3 0 0.0 6
Carache Flock 17 1 33.3 0 0.0 2 66.7 0 0.0 3
Carache Flock 18 2 100.0 0 0.0 0 0.0 0 0.0 2
Carache Flock 19 4 100.0 0 0.0 0 0.0 0 0.0 4
continued
Page 220
195
Appendix C. (continued)
Carache Flock 20 5 71.4 0 0.0 2 28.6 0 0.0 7
Carache Flock 21 4 80.0 0 0.0 1 20.0 0 0.0 5
Carache Flock 22 2 66.7 0 0.0 1 33.3 0 0.0 3
Carache Flock 23 3 100.0 0 0.0 0 0.0 0 0.0 3
Carache Flock 24 2 40.0 2 40.0 1 20.0 0 0.0 5
Carache Flock 25 8 61.5 0 0.0 5 38.5 0 0.0 13
Carache Flock 26 3 50.0 0 0.0 3 50.0 0 0.0 6
Carache Flock 27 1 25.0 0 0.0 3 75.0 0 0.0 4
Carache Flock 28 3 100.0 0 0.0 0 0.0 0 0.0 3
Carache Flock 29 2 66.7 0 0.0 1 33.3 0 0.0 3
Carache Flock 30 2 66.7 0 0.0 1 33.3 0 0.0 3
Carache Flock 31 0 0.0 0 0.0 2 66.7 1 33.3 3
Carache Flock 32 1 50.0 0 0.0 1 50.0 0 0.0 2
Carache Flock 33 4 50.0 0 0.0 4 50.0 0 0.0 8
Carache Flock 34 3 50.0 1 16.7 2 33.3 0 0.0 6
Aguachica Flock 35 1 16.7 0 0.0 5 83.3 0 0.0 6
Aguachica Flock 36 0 0.0 2 50.0 2 50.0 0 0.0 4
Aguachica Flock 37 3 37.5 0 0.0 5 62.5 0 0.0 8
Aguachica Flock 38 2 22.2 0 0.0 7 77.8 0 0.0 9
Aguachica Flock 39 6 54.5 0 0.0 5 45.5 0 0.0 11
Aguachica Flock 40 2 66.7 0 0.0 1 33.3 0 0.0 3
Aguachica Flock 41 4 57.1 0 0.0 3 42.9 0 0.0 7
Aguachica Flock 42 3 42.9 1 14.3 3 42.9 0 0.0 7
Aguachica Flock 43 2 25.0 1 12.5 5 62.5 0 0.0 8
Aguachica Flock 44 5 41.7 2 16.7 5 41.7 0 0.0 12
Aguachica Flock 45 2 66.7 0 0.0 1 33.3 0 0.0 3
continued
Page 221
196
Appendix C. (continued)
Aguachica Flock 46 4 44.4 1 11.1 4 44.4 0 0.0 9
San Jose de la Montana Flock 47 3 37.5 0 0.0 5 62.5 0 0.0 8
San Jose de la Montana Flock 48 1 11.1 0 0.0 7 77.8 1 11.1 9
San Jose de la Montana Flock 49 5 62.5 0 0.0 3 37.5 0 0.0 8
San Jose de la Montana Flock 50 3 37.5 0 0.0 5 62.5 0 0.0 8
San Jose de la Montana Flock 51 3 60.0 0 0.0 2 40.0 0 0.0 5
San Jose de la Montana Flock 52 3 50.0 1 16.7 2 33.3 0 0.0 6
San Jose de la Montana Flock 53 3 42.9 0 0.0 4 57.1 0 0.0 7
San Jose de la Montana Flock 54 4 33.3 0 0.0 8 66.7 0 0.0 12
San Jose de la Montana Flock 55 2 22.2 0 0.0 5 55.6 2 22.2 9
San Jose de la Montana Flock 56 0 0.0 0 0.0 4 80.0 1 20.0 5
San Jose de la Montana Flock 57 1 25.0 0 0.0 2 50.0 1 25.0 4
San Jose de la Montana Flock 58 3 42.9 0 0.0 4 57.1 0 0.0 7
San Jose de la Montana Flock 59 1 25.0 1 25.0 2 50.0 0 0.0 4
San Jose de la Montana Flock 60 2 28.6 0 0.0 2 28.6 3 42.9 7
San Jose de la Montana Flock 61 5 45.5 0 0.0 4 36.4 2 18.2 11
San Jose de la Montana Flock 62 6 46.2 1 7.7 4 30.8 2 15.4 13
San Jose de la Montana Flock 63 1 14.3 0 0.0 3 42.9 3 42.9 7
San Jose de la Montana Flock 64 2 28.6 0 0.0 5 71.4 0 0.0 7
San Jose de la Montana Flock 65 2 28.6 0 0.0 5 71.4 0 0.0 7
San Jose de la Montana Flock 66 2 40.0 0 0.0 3 60.0 0 0.0 5
San Jose de la Montana Flock 67 1 20.0 0 0.0 4 80.0 0 0.0 5
San Jose de la Montana Flock 68 1 16.7 0 0.0 4 66.7 1 16.7 6
San Jose de la Montana Flock 69 0 0.0 0 0.0 3 75.0 1 25.0 4
San Jose de la Montana Flock 70 0 0.0 0 0.0 5 62.5 3 37.5 8
San Jose de la Montana Flock 71 2 18.2 1 9.1 6 54.5 2 18.2 11
continued
Page 222
197
Appendix C. (continued)
San Jose de la Montana Flock 72 4 44.4 0 0.0 4 44.4 1 11.1 9
Yariguies Flock 73 9 69.2 0 0.0 4 30.8 0 0.0 13
Yariguies Flock 74 7 50.0 0 0.0 7 50.0 0 0.0 14
Yariguies Flock 75 4 30.8 0 0.0 9 69.2 0 0.0 13
Yariguies Flock 76 9 47.4 0 0.0 10 52.6 0 0.0 19
Yariguies Flock 77 3 25.0 0 0.0 8 66.7 1 8.3 12
Yariguies Flock 78 1 12.5 0 0.0 7 87.5 0 0.0 8
Yariguies Flock 79 3 42.9 0 0.0 4 57.1 0 0.0 7
Chicamocha Flock 80 6 85.7 0 0.0 1 14.3 0 0.0 7
Chicamocha Flock 81 2 66.7 0 0.0 1 33.3 0 0.0 3
Chicamocha Flock 82 2 66.7 0 0.0 1 33.3 0 0.0 3
Abejorral Flock 83 1 16.7 0 0.0 5 83.3 0 0.0 6
Abejorral Flock 84 6 50.0 0 0.0 5 41.7 1 8.3 12
Abejorral Flock 85 4 80.0 0 0.0 1 20.0 0 0.0 5
Abejorral Flock 86 4 66.7 0 0.0 2 33.3 0 0.0 6
Abejorral Flock 87 4 40.0 1 10.0 4 40.0 1 10.0 10
Abejorral Flock 88 10 47.6 1 4.8 10 47.6 0 0.0 21
Abejorral Flock 89 2 25.0 0 0.0 6 75.0 0 0.0 8
Abejorral Flock 90 9 50.0 1 5.6 8 44.4 0 0.0 18
Abejorral Flock 91 3 33.3 0 0.0 5 55.6 1 11.1 9
Abejorral Flock 92 3 60.0 0 0.0 1 20.0 1 20.0 5
Abejorral Flock 93 11 61.1 1 5.6 5 27.8 1 5.6 18
Abejorral Flock 94 5 50.0 0 0.0 4 40.0 1 10.0 10
Abejorral Flock 95 2 50.0 0 0.0 2 50.0 0 0.0 4
Abejorral Flock 96 3 60.0 0 0.0 1 20.0 1 20.0 5
Abejorral Flock 97 2 20.0 1 10.0 6 60.0 1 10.0 10
continued
Page 223
198
Appendix C. (continued)
Abejorral Flock 98 8 44.4 1 5.6 8 44.4 1 5.6 18
Abejorral Flock 99 3 37.5 1 12.5 4 50.0 0 0.0 8
Abejorral Flock 100 4 80.0 0 0.0 1 20.0 0 0.0 5
Abejorral Flock 101 5 62.5 0 0.0 3 37.5 0 0.0 8
Abejorral Flock 102 5 62.5 0 0.0 3 37.5 0 0.0 8
Abejorral Flock 103 5 83.3 0 0.0 1 16.7 0 0.0 6
Abejorral Flock 104 2 66.7 0 0.0 0 0.0 1 33.3 3
Abejorral Flock 105 3 75.0 0 0.0 1 25.0 0 0.0 4
Abejorral Flock 106 3 42.9 0 0.0 4 57.1 0 0.0 7
Abejorral Flock 107 6 85.7 0 0.0 1 14.3 0 0.0 7
Abejorral Flock 108 1 16.7 0 0.0 4 66.7 1 16.7 6
Abejorral Flock 109 3 60.0 0 0.0 2 40.0 0 0.0 5
Abejorral Flock 110 5 71.4 0 0.0 2 28.6 0 0.0 7
Abejorral Flock 111 9 52.9 1 5.9 6 35.3 1 5.9 17
Abejorral Flock 112 1 33.3 0 0.0 2 66.7 0 0.0 3
Abejorral Flock 113 11 57.9 0 0.0 7 36.8 1 5.3 19
Abejorral Flock 114 9 56.3 1 6.3 5 31.3 1 6.3 16
Abejorral Flock 115 6 28.6 1 4.8 13 61.9 1 4.8 21
Abejorral Flock 116 4 100.0 0 0.0 0 0.0 0 0.0 4
Abejorral Flock 117 1 50.0 0 0.0 0 0.0 1 50.0 2
Abejorral Flock 118 3 100.0 0 0.0 0 0.0 0 0.0 3
Paya Flock 119 5 83.3 0 0.0 1 16.7 0 0.0 6
Paya Flock 120 2 33.3 0 0.0 3 50.0 1 16.7 6
Paya Flock 121 2 40.0 0 0.0 3 60.0 0 0.0 5
Paya Flock 122 4 50.0 0 0.0 4 50.0 0 0.0 8
Paya Flock 123 4 50.0 0 0.0 4 50.0 0 0.0 8
continued
Page 224
199
Appendix C. (continued)
Paya Flock 124 5 50.0 0 0.0 5 50.0 0 0.0 10
Paya Flock 125 3 50.0 0 0.0 3 50.0 0 0.0 6
Paya Flock 126 3 42.9 0 0.0 4 57.1 0 0.0 7
Paya Flock 127 3 33.3 0 0.0 5 55.6 1 11.1 9
Paya Flock 128 4 66.7 0 0.0 2 33.3 0 0.0 6
Paya Flock 129 1 25.0 0 0.0 3 75.0 0 0.0 4
Paya Flock 130 3 50.0 0 0.0 2 33.3 1 16.7 6
Paya Flock 131 4 66.7 0 0.0 1 16.7 1 16.7 6
Paya Flock 132 3 42.9 0 0.0 4 57.1 0 0.0 7
Paya Flock 133 3 75.0 0 0.0 1 25.0 0 0.0 4
Tolima Flock 134 5 50.0 0 0.0 5 50.0 0 0.0 10
Tolima Flock 135 1 33.3 0 0.0 2 66.7 0 0.0 3
Cauca Flock 136 6 42.9 0 0.0 8 57.1 0 0.0 14
Cauca Flock 137 3 50.0 2 33.3 1 16.7 0 0.0 6
Cauca Flock 138 2 28.6 0 0.0 4 57.1 1 14.3 7
Cauca Flock 139 8 80.0 0 0.0 2 20.0 0 0.0 10
Cauca Flock 140 6 60.0 0 0.0 4 40.0 0 0.0 10
Cauca Flock 141 8 61.5 0 0.0 5 38.5 0 0.0 13
Cauca Flock 142 6 60.0 1 10.0 3 30.0 0 0.0 10
Cauca Flock 143 2 25.0 1 12.5 5 62.5 0 0.0 8
Cauca Flock 144 7 58.3 1 8.3 4 33.3 0 0.0 12
Cauca Flock 145 8 72.7 1 9.1 2 18.2 0 0.0 11
Cauca Flock 146 5 45.5 1 9.1 5 45.5 0 0.0 11
Cauca Flock 147 6 75.0 0 0.0 2 25.0 0 0.0 8
Cauca Flock 148 2 40.0 1 20.0 1 20.0 1 20.0 5
Cauca Flock 149 1 25.0 0 0.0 3 75.0 0 0.0 4
continued
Page 225
200
Appendix C. (continued)
Cauca Flock 150 1 33.3 0 0.0 2 66.7 0 0.0 3
Cauca Flock 151 3 60.0 0 0.0 2 40.0 0 0.0 5
Cauca Flock 152 3 50.0 0 0.0 2 33.3 1 16.7 6
Cauca Flock 153 11 57.9 0 0.0 7 36.8 1 5.3 19
Cauca Flock 154 1 20.0 0 0.0 3 60.0 1 20.0 5
Cauca Flock 155 9 64.3 0 0.0 5 35.7 0 0.0 14
Cauca Flock 156 4 57.1 0 0.0 3 42.9 0 0.0 7
Cauca Flock 157 5 55.6 0 0.0 3 33.3 1 11.1 9
Cauca Flock 158 7 63.6 0 0.0 3 27.3 1 9.1 11
Cauca Flock 159 0 0.0 2 28.6 4 57.1 1 14.3 7
Cauca Flock 160 9 50.0 0 0.0 8 44.4 1 5.6 18
Cauca Flock 161 6 54.5 0 0.0 5 45.5 0 0.0 11
Cauca Flock 162 7 70.0 0 0.0 3 30.0 0 0.0 10
Cauca Flock 163 3 42.9 0 0.0 4 57.1 0 0.0 7
Cauca Flock 164 4 80.0 0 0.0 1 20.0 0 0.0 5
Sangay National Park Flock 165 4 44.4 1 11.1 4 44.4 0 0.0 9
Sangay National Park Flock 166 4 50.0 0 0.0 4 50.0 0 0.0 8
Sangay National Park Flock 167 5 100.0 0 0.0 0 0.0 0 0.0 5
Sangay National Park Flock 168 4 57.1 0 0.0 2 28.6 1 14.3 7
Sangay National Park Flock 169 5 100.0 0 0.0 0 0.0 0 0.0 5
Sangay National Park Flock 170 4 100.0 0 0.0 0 0.0 0 0.0 4
Sangay National Park Flock 171 2 40.0 0 0.0 3 60.0 0 0.0 5
Sangay National Park Flock 172 4 100.0 0 0.0 0 0.0 0 0.0 4
Cajamarca Flock 173 3 75.0 0 0.0 1 25.0 0 0.0 4
Cajamarca Flock 174 5 62.5 0 0.0 3 37.5 0 0.0 8
Cajamarca Flock 175 5 83.3 0 0.0 1 16.7 0 0.0 6
continued
Page 226
201
Appendix C. (continued)
Cajamarca Flock 176 2 66.7 0 0.0 0 0.0 1 33.3 3
Cajamarca Flock 177 3 75.0 0 0.0 1 25.0 0 0.0 4
Cajamarca Flock 178 2 20.0 0 0.0 7 70.0 1 10.0 10
Cajamarca Flock 179 3 33.3 0 0.0 6 66.7 0 0.0 9
Cajamarca Flock 180 6 66.7 0 0.0 3 33.3 0 0.0 9
Cajamarca Flock 181 5 38.5 0 0.0 8 61.5 0 0.0 13
Cajamarca Flock 182 2 25.0 0 0.0 6 75.0 0 0.0 8
Cajamarca Flock 183 1 25.0 0 0.0 3 75.0 0 0.0 4
Cajamarca Flock 184 2 50.0 0 0.0 2 50.0 0 0.0 4
Cajamarca Flock 185 2 50.0 0 0.0 2 50.0 0 0.0 4
Cajamarca Flock 186 0 0.0 2 50.0 2 50.0 0 0.0 4
Cajamarca Flock 187 3 37.5 0 0.0 5 62.5 0 0.0 8
Cajamarca Flock 188 2 22.2 0 0.0 7 77.8 0 0.0 9
Cajamarca Flock 189 6 54.5 0 0.0 5 45.5 0 0.0 11
Pacora Flock 190 4 50.0 0 0.0 4 50.0 0 0.0 8
Pacora Flock 191 2 40.0 0 0.0 3 60.0 0 0.0 5
Pacora Flock 192 3 75.0 0 0.0 1 25.0 0 0.0 4
Pacora Flock 193 6 66.7 0 0.0 3 33.3 0 0.0 9
Pacora Flock 194 6 50.0 0 0.0 6 50.0 0 0.0 12
Pacora Flock 195 3 27.3 0 0.0 7 63.6 1 9.1 11
Pacora Flock 196 4 57.1 0 0.0 3 42.9 0 0.0 7
Pacora Flock 197 5 55.6 0 0.0 4 44.4 0 0.0 9
Pacora Flock 198 3 33.3 0 0.0 6 66.7 0 0.0 9
Pacora Flock 199 1 33.3 0 0.0 2 66.7 0 0.0 3
Pacora Flock 200 4 57.1 0 0.0 3 42.9 0 0.0 7
Pacora Flock 201 4 66.7 0 0.0 2 33.3 0 0.0 6
continued
Page 227
202
Appendix C. (continued)
Pacora Flock 202 3 60.0 0 0.0 2 40.0 0 0.0 5
Pacora Flock 203 1 25.0 0 0.0 3 75.0 0 0.0 4
Pacora Flock 204 2 50.0 0 0.0 2 50.0 0 0.0 4
Pacora Flock 205 2 50.0 0 0.0 2 50.0 0 0.0 4
Pacora Flock 206 3 60.0 0 0.0 2 40.0 0 0.0 5
Pacora Flock 207 3 42.9 0 0.0 4 57.1 0 0.0 7
Pacora Flock 208 4 57.1 0 0.0 2 28.6 1 14.3 7
Pacora Flock 209 3 60.0 0 0.0 1 20.0 1 20.0 5
Pacora Flock 210 4 50.0 0 0.0 4 50.0 0 0.0 8
Pacora Flock 211 4 66.7 0 0.0 2 33.3 0 0.0 6
SW Antioquia Flock 212 2 20.0 0 0.0 7 70.0 1 10.0 10
SW Antioquia Flock 213 3 33.3 0 0.0 6 66.7 0 0.0 9
SW Antioquia Flock 214 6 66.7 0 0.0 3 33.3 0 0.0 9
SW Antioquia Flock 215 5 38.5 0 0.0 8 61.5 0 0.0 13
SW Antioquia Flock 216 2 25.0 0 0.0 6 75.0 0 0.0 8
SW Antioquia Flock 217 1 14.3 0 0.0 6 85.7 0 0.0 7
SW Antioquia Flock 218 2 40.0 0 0.0 3 60.0 0 0.0 5
SW Antioquia Flock 219 2 33.3 0 0.0 4 66.7 0 0.0 6
SW Antioquia Flock 220 0 0.0 0 0.0 6 100.0 0 0.0 6
SW Antioquia Flock 221 4 44.4 0 0.0 5 55.6 0 0.0 9
SW Antioquia Flock 222 4 36.4 0 0.0 7 63.6 0 0.0 11
SW Antioquia Flock 223 1 14.3 0 0.0 6 85.7 0 0.0 7
SW Antioquia Flock 224 1 16.7 0 0.0 5 83.3 0 0.0 6
SW Antioquia Flock 225 0 0.0 0 0.0 4 100.0 0 0.0 4
SW Antioquia Flock 226 4 33.3 0 0.0 8 66.7 0 0.0 12
SW Antioquia Flock 227 3 30.0 0 0.0 7 70.0 0 0.0 10
continued
Page 228
203
Appendix C. (continued)
SW Antioquia Flock 228 1 12.5 0 0.0 7 87.5 0 0.0 8
SW Antioquia Flock 229 6 37.5 0 0.0 10 62.5 0 0.0 16
SW Antioquia Flock 230 1 16.7 0 0.0 5 83.3 0 0.0 6
SW Antioquia Flock 231 3 25.0 0 0.0 9 75.0 0 0.0 12
SW Antioquia Flock 232 7 46.7 0 0.0 7 46.7 1 6.7 15
SW Antioquia Flock 233 1 14.3 0 0.0 6 85.7 0 0.0 7
SW Antioquia Flock 234 3 27.3 0 0.0 8 72.7 0 0.0 11
SW Antioquia Flock 235 1 14.3 0 0.0 6 85.7 0 0.0 7
SW Antioquia Flock 236 4 33.3 0 0.0 7 58.3 1 8.3 12
SW Antioquia Flock 237 3 30.0 0 0.0 7 70.0 0 0.0 10
SW Antioquia Flock 238 4 40.0 0 0.0 5 50.0 1 10.0 10
SW Antioquia Flock 239 3 33.3 0 0.0 6 66.7 0 0.0 9
SW Antioquia Flock 240 4 50.0 0 0.0 4 50.0 0 0.0 8
SW Antioquia Flock 241 2 33.3 0 0.0 4 66.7 0 0.0 6
SW Antioquia Flock 242 4 57.1 0 0.0 3 42.9 0 0.0 7
SW Antioquia Flock 243 0 0.0 0 0.0 6 100.0 0 0.0 6
SW Antioquia Flock 244 4 40.0 0 0.0 6 60.0 0 0.0 10
SW Antioquia Flock 245 5 62.5 0 0.0 3 37.5 0 0.0 8
SW Antioquia Flock 246 3 30.0 0 0.0 7 70.0 0 0.0 10
SW Antioquia Flock 247 2 25.0 0 0.0 6 75.0 0 0.0 8
SW Antioquia Flock 248 12 44.4 0 0.0 14 51.9 1 3.7 27
SW Antioquia Flock 249 8 53.3 0 0.0 6 40.0 1 6.7 15
SW Antioquia Flock 250 13 50.0 0 0.0 13 50.0 0 0.0 26
SW Antioquia Flock 251 10 83.3 0 0.0 1 8.3 1 8.3 12
SW Antioquia Flock 252 6 60.0 0 0.0 3 30.0 1 10.0 10
SW Antioquia Flock 253 5 55.6 0 0.0 4 44.4 0 0.0 9
continued
Page 229
204
Appendix C. (continued)
SW Antioquia Flock 254 2 33.3 1 16.7 3 50.0 0 0.0 6
SW Antioquia Flock 255 4 57.1 0 0.0 3 42.9 0 0.0 7
SW Antioquia Flock 256 5 62.5 0 0.0 3 37.5 0 0.0 8
SW Antioquia Flock 257 4 33.3 0 0.0 8 66.7 0 0.0 12
SW Antioquia Flock 258 6 37.5 1 6.3 9 56.3 0 0.0 16
SW Antioquia Flock 259 3 42.9 0 0.0 4 57.1 0 0.0 7
SW Antioquia Flock 260 6 66.7 0 0.0 3 33.3 0 0.0 9
SW Antioquia Flock 261 3 42.9 0 0.0 4 57.1 0 0.0 7
SW Antioquia Flock 262 2 50.0 0 0.0 2 50.0 0 0.0 4
SW Antioquia Flock 263 2 25.0 0 0.0 6 75.0 0 0.0 8
SW Antioquia Flock 264 3 33.3 0 0.0 6 66.7 0 0.0 9
SW Antioquia Flock 265 5 62.5 0 0.0 3 37.5 0 0.0 8
SW Antioquia Flock 266 2 28.6 0 0.0 5 71.4 0 0.0 7
SW Antioquia Flock 267 3 33.3 0 0.0 6 66.7 0 0.0 9
SW Antioquia Flock 268 3 50.0 0 0.0 2 33.3 1 16.7 6
SW Antioquia Flock 269 2 40.0 0 0.0 3 60.0 0 0.0 5
SW Antioquia Flock 270 2 25.0 0 0.0 6 75.0 0 0.0 8
SW Antioquia Flock 271 5 50.0 0 0.0 5 50.0 0 0.0 10
SW Antioquia Flock 272 2 25.0 1 12.5 5 62.5 0 0.0 8
SW Antioquia Flock 273 4 50.0 0 0.0 4 50.0 0 0.0 8
SW Antioquia Flock 274 1 14.3 0 0.0 6 85.7 0 0.0 7
SW Antioquia Flock 275 3 27.3 0 0.0 8 72.7 0 0.0 11
SW Antioquia Flock 276 4 40.0 1 10.0 5 50.0 0 0.0 10
SW Antioquia Flock 277 3 37.5 0 0.0 5 62.5 0 0.0 8
SW Antioquia Flock 278 2 25.0 0 0.0 6 75.0 0 0.0 8
SW Antioquia Flock 279 1 14.3 0 0.0 6 85.7 0 0.0 7
continued
Page 230
205
Appendix C. (continued)
SW Antioquia Flock 280 2 40.0 0 0.0 3 60.0 0 0.0 5
SW Antioquia Flock 281 2 33.3 0 0.0 4 66.7 0 0.0 6
SW Antioquia Flock 282 0 0.0 0 0.0 6 100.0 0 0.0 6
SW Antioquia Flock 283 4 44.4 0 0.0 5 55.6 0 0.0 9
SW Antioquia Flock 284 5 41.7 0 0.0 7 58.3 0 0.0 12
SW Antioquia Flock 285 1 14.3 0 0.0 6 85.7 0 0.0 7
SW Antioquia Flock 286 1 16.7 0 0.0 5 83.3 0 0.0 6
SW Antioquia Flock 287 0 0.0 0 0.0 4 100.0 0 0.0 4
SW Antioquia Flock 288 4 33.3 0 0.0 8 66.7 0 0.0 12
SW Antioquia Flock 289 3 30.0 0 0.0 7 70.0 0 0.0 10
SW Antioquia Flock 290 2 22.2 0 0.0 7 77.8 0 0.0 9
SW Antioquia Flock 291 6 37.5 0 0.0 10 62.5 0 0.0 16
SW Antioquia Flock 292 1 16.7 0 0.0 5 83.3 0 0.0 6
SW Antioquia Flock 293 4 30.8 0 0.0 9 69.2 0 0.0 13
SW Antioquia Flock 294 7 46.7 0 0.0 7 46.7 1 6.7 15
SW Antioquia Flock 295 1 14.3 0 0.0 6 85.7 0 0.0 7
SW Antioquia Flock 296 3 27.3 0 0.0 8 72.7 0 0.0 11
SW Antioquia Flock 297 1 14.3 0 0.0 6 85.7 0 0.0 7
SW Antioquia Flock 298 5 38.5 0 0.0 7 53.8 1 7.7 13
SW Antioquia Flock 299 4 36.4 0 0.0 7 63.6 0 0.0 11
SW Antioquia Flock 300 4 40.0 0 0.0 5 50.0 1 10.0 10
SW Antioquia Flock 301 4 40.0 0 0.0 6 60.0 0 0.0 10
SW Antioquia Flock 302 4 50.0 0 0.0 4 50.0 0 0.0 8
SW Antioquia Flock 303 2 33.3 0 0.0 4 66.7 0 0.0 6
SW Antioquia Flock 304 4 57.1 0 0.0 3 42.9 0 0.0 7
SW Antioquia Flock 305 0 0.0 0 0.0 6 100.0 0 0.0 6
continued
Page 231
206
Appendix C. (continued)
SW Antioquia Flock 306 5 45.5 0 0.0 6 54.5 0 0.0 11
SW Antioquia Flock 307 7 70.0 0 0.0 3 30.0 0 0.0 10
SW Antioquia Flock 308 3 30.0 0 0.0 7 70.0 0 0.0 10
SW Antioquia Flock 309 2 25.0 0 0.0 6 75.0 0 0.0 8
SW Antioquia Flock 310 6 54.5 0 0.0 5 45.5 0 0.0 11
SW Antioquia Flock 311 6 42.9 0 0.0 8 57.1 0 0.0 14
Page 232
207
Appendix D. Bird species and families recorded in 311 mixed-species flocks in the
Andes, 2007-2010.
Species Family Guilds
Piaya cayana Cuculidae Insectivore-frugivore
Eubucco bourcierii Capitonidae Frugivore-insectivore
Veniliornis kirkii Picidae Insectivore
Picoides fumigatus Picidae Insectivore
Melanerpes rubricapillus Picidae Insectivore
Melanerpes formicivorus Picidae Insectivore
Picumnus granadensis Picidae Insectivore
Picumnus squamulatus Picidae Insectivore
Picumnus olivaceus Picidae Insectivore
Colaptes rubiginosus Picidae Insectivore
Colaptes punctigula Picidae Insectivore
Dryocopus lineatus Picidae Insectivore
Piculus rivolii Picidae Insectivore
Trogon personatus Trogonidae Frugivore-insectivore
Furnariidae Furnariidae Insectivore
Lepidocolaptes souleyetii Furnariidae Insectivore
Continued
Page 233
208
Appendix D. (continued)
Lepidocolaptes affinis Furnariidae Insectivore
Lepidocolaptes lacrymiger Furnariidae Insectivore
Dendrocincla fuliginosa Furnariidae Insectivore
Anabacerthia striaticollis Furnariidae Insectivore
Automolus ochrolaemus Furnariidae Insectivore
Xenops rutilans Furnariidae Insectivore
Xenops minutus Furnariidae Insectivore
Dendrocincla homochroa Furnariidae Insectivore
Sittasomus griseicapillus Furnariidae Insectivore
Xiphorhynchus flavigaster Furnariidae Insectivore
Xiphorhynchus susurrans Furnariidae Insectivore
Xiphorhynchus triangularis Furnariidae Insectivore
Cranioleuca erythrops Furnariidae Insectivore
Synallaxis azarae Furnariidae Insectivore
Synallaxis subpudica Furnariidae Insectivore
Synallaxis brachyura Furnariidae Insectivore
Synallaxis albescens Furnariidae Insectivore
Glyphorhynchus spirurus Furnariidae Insectivore
Xyphorhynchus picus Furnariidae Insectivore
Myiarchus cephalotes Tyrannidae Insectivore-frugivore
Myiotriccus ornatus Tyrannidae Insectivore-frugivore
Continued
Page 234
209
Appendix D. (continued)
Mionectes striaticollis Tyrannidae Frugivore-insectivore
Mionectes oleagineus Tyrannidae Frugivore-insectivore
Poecilotricus ruficeps Tyrannidae Insectivore
Elaenia frantzii Tyrannidae Frugivore-insectivore
Elaenia flavogaster Tyrannidae Frugivore-insectivore
Phyrromyias cinnamomeus Tyrannidae Insectivore
Tyrannus melancholicus Tyrannidae Insectivore-frugivore
Mecocerculus leucophrys Tyrannidae Insectivore-frugivore
Myiophobus flavicans Tyrannidae Insectivore-frugivore
Ochthoeca fumicolor Tyrannidae Insectivore
Ochthoeca rufipectoralis Tyrannidae Insectivore
Cyanocorax yncas Corvidae Omnivore
Chiroxiphia lanceolata Pipridae Frugivore
Corapipo leucorrhoa Pipridae Frugivore
Manacus manacus Pipridae Frugivore
Henicorhina leucosticta Troglodytidae Insectivore
Henicorhina leucophrys Troglodytidae Insectivore
Thryothorus mystacalis Troglodytidae Insectivore
Thryothorus maculipectus Troglodytidae Insectivore
Thryothorys genibarbis Troglodytidae Insectivore
Thryothorus leucotis Troglodytidae Insectivore
Continued
Page 235
210
Appendix D. (continued)
Thryothorus rufalbus Troglodytidae Insectivore
Catharus aurantiirostris Turdidae Frugivore-insectivore
Catharus ustulatus Turdidae Frugivore-insectivore
Turdus ignobilis Turdidae Frugivore-insectivore
Turdus serranus Turdidae Frugivore-insectivore
Turdus flavipes Turdidae Frugivore-insectivore
Myadestes ralloides Turdidae Frugivore-insectivore
Turdus grayi Turdidae Frugivore-insectivore
Turdus olivater Turdidae Frugivore-insectivore
Turdus obsoletus Turdidae Frugivore-insectivore
Turdus fuscater Turdidae Frugivore-insectivore
Turdus leucomelas Turdidae Frugivore-insectivore
Diglossa cyanea Thraupidae Nectarivore-Insectivore
Diglossa albilatera Thraupidae Nectarivore-Insectivore
Diglossa caerulescens Thraupidae Nectarivore-Insectivore
Mimus gilvus Mimidae Insectivore-frugivore
Euphonia cyanocephala Fringillidae Frugivore
Euphonia xanthogaster Fringillidae Frugivore
Euphonia laniirostris Fringillidae Frugivore
Euphonia mesochrysa Fringillidae Frugivore
Euphonia_trinitatis Fringillidae Frugivore
Continued
Page 236
211
Appendix D. (continued)
Euphonia_saturata Thraupidae Frugivore
Hemithraupis guira Thraupidae Frugivore-insectivore
Hemithraupis flavirostris Thraupidae Frugivore-insectivore
Thraupis episcopus Thraupidae Frugivore
Thraupis palmarum Thraupidae Frugivore
Thraupis cyanocephala Thraupidae Frugivore
Ramphocelus dimidiatus Thraupidae Frugivore
Ramphocelus flammigerus Thraupidae Frugivore
Ramphocelus carbo Thraupidae Frugivore
Tangara vitriolina Thraupidae Frugivore
Tangara gyrola Thraupidae Frugivore
Tangara cyanicollis Thraupidae Frugivore
Tangara heinei Thraupidae Frugivore
Tangara nigroviridis Thraupidae Frugivore
Tangara xanthocephala Thraupidae Frugivore
Tangara arthus Thraupidae Frugivore
Tangara vassorii Thraupidae Frugivore
Tangara parzudakii Thraupidae Frugivore
Tangara guttata Thraupidae Frugivore
Tangara schrankii Thraupidae Frugivore
Tangara chilensis Thraupidae Frugivore
Continued
Page 237
212
Appendix D. (continued)
Tangara cyanoptera Thraupidae Frugivore
Tangara labradorides Thraupidae Frugivore
Tangara ruficervix Thraupidae Frugivore
Tangara cayana Thraupidae Frugivore
Piranga flava Cardinalidae Frugivore-insectivore
Zonotrichia capensis Emberizidae Granivore
Saltator striatipectus Incertae sedis Frugivore-granivore
Saltator atripennis Incertae sedis Frugivore-granivore
Saltator coerulescens Incertae sedis Frugivore-granivore
Saltator maximus Incertae sedis Frugivore-granivore
Fringillidae Fringillidae Frugivore
Syndactyla subalaris Furnariidae Insectivore
Pseudocolaptes boissonneautii Furnariidae Insectivore
Margarornis squamiger Furnariidae Insectivore
Thamnophilus multistriatus Thamnophilidae Insectivore
Thamnophilus doliatus Thamnophilidae Insectivore
Dysithamnus mentalis Thamnophilidae Insectivore
Cymbilaimus lineatus Thamnophilidae Insectivore
Scytalopus sp. Rhinocryptidae Insectivore
Pachyramphus polychopterus Tityridae Frugivore-insectivore
Pachyramphus rufus Tityridae Frugivore-insectivore
Continued
Page 238
213
Appendix D. (continued)
Pachyramphus versicolor Tityridae Frugivore-insectivore
Pipreola riefferii Cotingidae Frugivore
Myiarchus tuberculifer Tyrannidae Insectivore
Zymmerius chrysops Tyrannidae Insectivore
Zymmerius villissimus Tyrannidae Insectivore
Camptostoma obsoletum Tyrannidae Insectivore
Todirostrum cinereum Tyrannidae Insectivore
Todirostrum sylvia Tyrannidae Insectivore
Tolmomyias sulphurescens Tyrannidae Insectivore-frugivore
Leptopogon superciliaris Tyrannidae Insectivore-frugivore
Leptopogon rufipectus Tyrannidae Insectivore-frugivore
Leptopogon amaurocephalus Tyrannidae Insectivore-frugivore
Phylloscartes ophtalmicus Tyrannidae Insectivore
Phylloscartes poecilotis Tyrannidae Insectivore
Myiodynastes maculatus Tyrannidae Insectivore-frugivore
Myiozetetes cayanensis Tyrannidae Insectivore-frugivore
Myiozetetes similis Tyrannidae Insectivore-frugivore
Empidonax sp Tyrannidae Insectivore
Contopus sp Tyrannidae Insectivore
Phyllomyias griseiceps Tyrannidae Insectivore
Phyllomyias nigrocapillus Tyrannidae Insectivore
Continued
Page 239
214
Appendix D. (continued)
Phaeomyias murina Tyrannidae Insectivore
Pitangus sulphuratus Tyrannidae Insectivore-frugivore
Myiobus atricaudus Tyrannidae Insectivore
Myiarchus apicalis Tyrannidae Insectivore-frugivore
Polioptila plumbea Polioptilidae Insectivore
Vireo olivaceus Vireonidae Frugivore-insectivore
Vireo leucophrys Vireonidae Frugivore-insectivore
Hylophilus decurtatus Vireonidae Insectivore-frugivore
Hylophilus flavipes Vireonidae Insectivore-frugivore
Hylophilus semibrunneus Vireonidae Insectivore-frugivore
Vireo flavifrons Vireonidae Frugivore-insectivore
Cyclarhis nigrirostris Vireonidae Frugivore-insectivore
Cyclarhis gujanensis Vireonidae Frugivore-insectivore
Icterus chrysater Icteridae Frugivore
Icterus galbula Icteridae Frugivore
Icterus nigrogularis Icteridae Frugivore
Cacicus chrysonotus Icteridae Frugivore
Psaracolius decumanus Icteridae Frugivore
Molothrus oryzibora Icteridae Frugivore-granivore
Mniotilta varia Parulidae Insectivore
Dendroica fusca Parulidae Insectivore
Continued
Page 240
215
Appendix D. (continued)
Vermivora peregrina Parulidae Insectivore
Vermivora chrysoptera Parulidae Insectivore
Dendroica petechia Parulidae Insectivore
Dendroica castanea Parulidae Insectivore
Dendroica cerulea Parulidae Insectivore
Parula pitiayumi Parulidae Insectivore
Wilsonia canadensis Parulidae Insectivore
Oporornis philadephia Parulidae Insectivore
Setophaga ruticilla Parulidae Insectivore
Basileuterus culicivorus Parulidae Insectivore
Basileuterus coronatus Parulidae Insectivore
Basileuterus tristriatus Parulidae Insectivore
Basileuterus rufifrons Parulidae Insectivore
Basileuterus cinereicollis Parulidae Insectivore
Basileuterus luteoviridis Parulidae Insectivore
Myioborus miniatus Parulidae Insectivore
Myioborus ornatus Parulidae Insectivore
Coereba flaveola Incertae sedis Nectarivore
Piranga rubra Cardinalidae Frugivore-insectivore
Piranga olivacea Cardinalidae Frugivore-insectivore
Anisognathus lacrymosus Thraupidae Frugivore
Continued
Page 241
216
Appendix D. (continued)
Anisognathus somptuosus Thraupidae Frugivore
Chlorospingus flavigularis Incertae sedis Frugivore
Chlorospingus ophthalmicus Incertae sedis Frugivore
Chlorospingus canigularis Incertae sedis Frugivore
Dacnis cayana Thraupidae Frugivore-insectivore
Dacnis hartlaubi Thraupidae Frugivore-insectivore
Dacnis lineata Thraupidae Frugivore-insectivore
Cyanerpes caeruleus Thraupidae Omnivore
Chlorophonia cyanea Thraupidae Frugivore
Conirostrum speciosum Thraupidae Nectarivore-insectivore
Conirostrum albifrons Thraupidae Nectarivore-insectivore
Tachyphonus rufus Thraupidae Frugivore
Tachyphonus luctuosus Thraupidae Frugivore
Hemispingus superciliaris Thraupidae Frugivore
Hemispingus atropileus Thraupidae Frugivore
Cnemoscopus rubrirostris Thraupidae Frugivore
Chlorornis riefferii Thraupidae Frugivore
Chlorophanes spiza Thraupidae Frugivore-nectarivore
Thlypopsis fulviceps Thraupidae Frugivore
Pipraeidea melanonota Thraupidae Frugivore
Rhodinocichla rosea Thraupidae Omnivore
Continued
Page 242
217
Appendix D. (continued)
Pheucticus ludovicianus Cardinalidae Frugivore-insectivore
Arremonops conirostris Emberizidae Granivore
Arremon schlegeli Emberizidae Omnivore
Atlapetes gutturalis Cardinalidae Frugivore
Atlapetes semirufus Cardinalidae Frugivore
Atlapetes latinuchus Cardinalidae Frugivore
Atlapetes rufinuchus Cardinalidae Frugivore
Atlapetes schistaseus Cardinalidae Frugivore
Cyanocompsa brissoni Cardinalidae Frugivore-insectivore
Arremon brunneinucha Emberizidae Omnivore
Arremon torquatus Emberizidae Omnivore
Carduelis psaltria Fringillidae Granivore
Tiaris olivaceus Incertae sedis Granivore
Tiaris fuliginosus Incertae sedis Granivore
Sporophila nigricollis Emberizidae Granivore
Volatinia jacarina Emberizidae Granivore
Page 243
218
App
endi
x E
. Cha
ract
eris
tics o
f 84
1-km
2 pix
els s
urve
yed
in 1
1 di
ffer
ent r
egio
ns in
the
And
es in
Col
ombi
a, E
cuad
or a
nd P
eru.
Win
terin
g se
ason
s 200
7-20
10.
Loc
ality
ID C
ode
Pred
omin
ant
habi
tat
No.
tree
s/ha
Bas
al
area
m2/
ha
Hei
ght
(m)
%
cano
py
cove
r
%
Gro
und
cove
r
Ave
rage
Shru
b
dens
ity
%
Fore
st
cove
r
per
pixe
l
Lon
g.
Lat
. E
leva
tion
(m)
Agu
achi
ca
Ran
dom
Cen
ter (
124)
Se
cond
ary
fore
st
205.
92
4.86
5.
92
41.6
7 35
.83
6.42
45
.25
-73.
496
8.32
1 77
7
Agu
achi
ca
Ran
dom
Eas
t (12
4)
Seco
ndar
y fo
rest
65
..895
2.
68
9.11
17
.50
47.5
0 3.
17
48.6
7 -7
3.49
6 8.
303
1246
Agu
achi
ca
Ran
dom
Nor
th (1
24)
Seco
ndar
y fo
rest
61
.78
2.97
9.
87
31.6
7 41
.67
6.00
31
.67
-73.
496
8.34
1 91
2
Agu
achi
ca
Ran
dom
Sou
th (1
24)
Seco
ndar
y fo
rest
18
1.21
11
.99
11.8
1 32
.50
16.6
7 1.
67
38.1
7 -7
3.51
4 8.
321
589
Agu
achi
ca
Ran
dom
Wes
t (12
4)
Seco
ndar
y fo
rest
49
.42
3.94
9.
33
19.1
7 0.
00
0.00
32
.33
-73.
478
8.32
1 54
9
Agu
achi
ca
Paire
d C
ente
r (12
4)
Silv
opas
ture
s 13
5.91
7.
99
11.1
6 60
.83
5.83
5.
50
23.0
0 -7
3.47
8 8.
338
1021
Agu
achi
ca
Paire
d Ea
st (1
24)
Succ
essi
onal
49
0.09
11
.89
12.7
5 47
.50
40.0
0 14
.00
39.1
7 -7
3.46
0 8.
338
1676
Agu
achi
ca
Paire
d N
orth
(124
) Se
cond
ary
fore
st
135.
91
3.10
10
.88
24.1
7 51
.67
17.5
8 31
.83
-73.
478
8.35
6 13
74
Agu
achi
ca
Paire
d So
uth
(124
) Se
cond
ary
fore
st
333.
59
7.24
8.
47
64.1
7 39
.17
12.1
7 46
.00
-73.
469
8.32
1 12
83
Agu
achi
ca
Paire
d W
est (
124)
Sh
ade
coff
ee
193.
57
5.59
8.
00
52.5
0 38
.33
4.17
39
.83
-73.
496
8.34
7 89
0
cont
inue
d
218
Page 244
219
App
endi
x E.
(con
tinue
d)
Sn
J. d
e la
Mon
taña
R
ando
m E
ast (
216)
Sh
ade
coff
ee
177.
09
5.02
5.
79
53.3
3 61
.67
9.33
63
.43
-75.
728
7.00
4 15
40
Sn J.
de
la
Mon
taña
R
ando
m N
orth
(216
) Se
cond
ary
fore
st
271.
82
11.1
0 6.
87
55.8
3 51
.67
12.3
3 46
.00
-75.
746
7.02
2 10
57
Sn J.
de
la
Mon
taña
Pa
ired
Wes
t (21
6)
Seco
ndar
y fo
rest
45
3.03
12
.16
8.82
60
.83
75.0
0 11
.33
70.2
9 -7
5.74
0 7.
004
1159
Sn V
de
chuc
urí
Ran
dom
Cen
ter (
231)
M
atur
e fo
rest
26
3.58
6.
18
9.81
50
.00
75.8
3 11
.17
51.0
0 -7
3.37
9 6.
812
2036
Sn V
de
chuc
urí
Ran
dom
Eas
t (23
1)
Mat
ure
fore
st
218.
28
5.95
9.
79
62.5
0 72
.50
8.42
57
.57
-73.
361
6.81
2 22
16
Sn V
de
chuc
urí
Ran
dom
Nor
th (2
31)
Seco
ndar
y fo
rest
28
4.17
12
.90
8.70
72
.50
59.1
7 15
.50
68.2
9 -7
3.37
9 4.
831
1292
Sn V
de
chuc
urí
Ran
dom
Wes
t (23
1)
Seco
ndar
y fo
rest
30
4.76
9.
40
12.5
6 53
.33
70.0
0 12
.50
65.0
0 -7
3.39
7 6.
812
1817
Sn V
de
chuc
urí
Paire
d C
ente
r (23
1)
Mat
ure
fore
st
539.
51
123.
53
20.8
9 77
.50
76.6
7 15
.83
66.4
3 -7
3.36
0 6.
852
1926
cont
inue
d
219
Page 245
220
App
endi
x E.
(con
tinue
d)
Sn
V d
e
chuc
urí
Paire
d Ea
st (2
31)
Mat
ure
fore
st
378.
90
41.2
1 8.
47
49.1
7 47
.50
8.42
26
.57
-73.
342
6.85
8 24
50
Sn V
de
chuc
urí
Paire
d N
orth
(231
) M
atur
e fo
rest
31
7.12
47
.64
7.70
66
.67
65.0
0 19
.83
68.1
4 -7
3.35
8 6.
871
1962
Sn V
de
chuc
urí
Paire
d So
uth
(231
) M
atur
e fo
rest
51
4.80
15
7.57
21
.33
75.0
0 65
.83
16.5
8 42
.43
-73.
363
6.84
1 20
20
Sn V
de
chuc
urí
Paire
d W
est (
231)
Se
cond
ary
fore
st
576.
58
128.
10
6.43
69
.17
49.1
7 21
.92
49.5
7 -7
3.37
8 6.
852
1681
Chi
cam
ocha
R
ando
m C
ente
r (24
8)
Silv
opas
ture
s 24
.71
0.78
4.
20
15.0
0 8.
33
9.50
5.
25
-72.
821
6.54
6 84
2
Chi
cam
ocha
R
ando
m E
ast (
248)
Su
cces
sion
al
543.
63
6.67
4.
84
34.1
7 0.
00
13.9
2 19
.71
-72.
803
6.54
6 99
5
Chi
cam
ocha
R
ando
m N
orth
(248
) Su
cces
sion
al
32.9
5 0.
98
4.56
12
.50
31.6
7 6.
25
13.4
3 -7
2.82
1 6.
563
1364
Chi
cam
ocha
R
ando
m S
outh
(248
) Si
lvop
astu
res
242.
99
6.95
6.
55
25.0
0 2.
50
14.3
3 19
.57
-72.
821
6.52
8 10
68
Chi
cam
ocha
R
ando
m W
est (
248)
Su
cces
sion
al
0.00
0.
00
0.00
3.
33
0.00
12
.33
6.71
-7
2.83
8 6.
546
1169
Chi
cam
ocha
Pa
ired
Cen
ter (
248)
Su
cces
sion
al
0.00
0.
00
0.00
0.
00
0.00
15
.00
15.0
0 -7
2.82
1 6.
555
1251
Chi
cam
ocha
Pa
ired
East
(248
) Si
lvop
astu
res
263.
58
9.10
5.
13
28.3
3 1.
67
5.42
19
.86
-72.
803
6.55
5 11
25
Chi
cam
ocha
Pa
ired
Nor
th (2
48)
Succ
essi
onal
49
.42
0.50
4.
00
15.8
3 45
.00
15.5
0 19
.29
-72.
821
6.57
2 12
65
Chi
cam
ocha
Pa
ired
Sout
h (2
48)
Silv
opas
ture
s 94
.72
12.6
8 8.
50
42.5
0 24
.17
9.50
9.
71
-72.
821
6.53
7 95
7
cont
inue
d
220
Page 246
221
App
endi
x E.
(con
tinue
d)
Pa
cora
,
Abe
jorr
al
Paire
d C
ente
r (30
7)
Shad
e co
ffee
15
6.50
4.
50
6.36
55
.00
50.0
0 10
.42
29.1
4 -7
5.50
6 5.
561
1288
Paco
ra,
Abe
jorr
al
Paire
d Ea
st (3
07)
Succ
essi
onal
13
8.38
4.
80
6.39
57
.00
46.0
0 10
.10
19.0
0 -7
5.48
8 5.
561
1250
Paco
ra,
Abe
jorr
al
Paire
d N
orth
(307
) Se
cond
ary
fore
st
160.
62
3.05
6.
47
58.3
3 48
.33
10.5
0 34
.00
-75.
506
5.57
9 11
32
Paco
ra,
Abe
jorr
al
Paire
d W
est (
307)
Si
lvop
astu
res
205.
92
5.02
5.
56
65.0
0 56
.67
13.0
0 24
.00
-75.
524
5.56
1 10
82
Paya
,
Boy
acá
Ran
dom
Cen
ter (
314)
Se
cond
ary
fore
st
617.
76
17.4
1 9.
54
65.8
3 24
.17
35.5
0 45
.50
-72.
496
5.60
4 13
74
Paya
,
Boy
acá
Ran
dom
Eas
t (31
4)
Shad
e co
ffee
12
7.67
7.
30
9.33
45
.83
64.1
7 4.
42
29.5
0 -7
2.47
8 5.
604
1325
Paya
,
Boy
acá
Ran
dom
Nor
th (3
14)
Succ
essi
onal
14
8.26
5.
66
6.91
50
.00
71.6
7 9.
42
37.0
0 -7
2.49
6 5.
622
1770
Paya
,
Boy
acá
Ran
dom
Sou
th (3
14)
Silv
opas
ture
s 25
1.22
9.
21
9.57
67
.50
71.6
7 11
.25
58.8
3 -7
2.49
6 5.
586
2179
cont
inue
d
221
Page 247
222
App
endi
x E.
(con
tinue
d)
Pa
ya,
Boy
acá
Ran
dom
Wes
t (31
4)
Succ
essi
onal
49
0.09
27
.06
14.6
9 74
.17
74.1
7 35
.42
71.8
3 -7
2.51
4 5.
604
1500
Paya
,
Boy
acá
Paire
d C
ente
r (31
4)
Seco
ndar
y fo
rest
20
5.92
7.
28
11.7
9 47
.50
91.6
7 14
.83
32.5
0 -7
2.52
3 5.
631
1998
Paya
,
Boy
acá
Paire
d Ea
st (3
14)
Seco
ndar
y fo
rest
16
8.86
5.
11
7.15
65
.83
63.3
3 13
.50
65.1
7 -7
2.50
5 5.
631
1951
Pa
ya,
Boy
acá
Paire
d N
orth
(314
) Se
cond
ary
fore
st
210.
04
2.38
8.
32
38.3
3 96
.67
36.4
2 26
.00
-72.
523
5.64
9 20
77
Paya
,
Boy
acá
Paire
d So
uth
(314
) Su
cces
sion
al
164.
74
5.77
8.
26
37.5
0 73
.33
8.58
54
.67
-72.
541
5.63
1 21
75
Paya
,
Boy
acá
Paire
d W
est (
314)
Se
cond
ary
fore
st
313.
00
15.4
2 11
.93
38.3
3 82
.50
11.3
3 49
.67
-72.
523
5.61
3 20
96
Ibag
ué
Ran
dom
Cen
ter (
395)
Se
cond
ary
fore
st
247.
11
15.6
3 13
.60
42.5
0 59
.17
1.83
14
.20
-75.
012
4.50
4 58
6
Ibag
ué
Ran
dom
Eas
t (39
5)
Silv
opas
ture
s 32
9.47
6.
75
8.90
43
.33
65.0
0 3.
67
17.1
4 -7
4.99
4 4.
504
567
Ibag
ué
Ran
dom
Nor
th (3
95)
Seco
ndar
y fo
rest
16
8.86
16
.42
16.3
6 61
.67
55.8
3 31
.58
14.2
9 -7
5.01
3 4.
522
657
Ibag
ué
Ran
dom
Sou
th (3
95)
Seco
ndar
y fo
rest
12
7.67
7.
21
6.45
18
.33
60.8
3 12
.08
12.8
6 -7
5.01
2 4.
486
619
cont
inue
d
222
Page 248
223
App
endi
x E.
(con
tinue
d)
Ib
agué
R
ando
m W
est (
395)
Se
cond
ary
fore
st
300.
65
13.4
8 8.
34
45.8
3 45
.83
23.2
5 16
.71
-75.
030
4.52
1 65
6
Ibag
ué
Paire
d C
ente
r (39
5)
Succ
essi
onal
11
9.43
17
.14
6.32
37
.50
66.6
7 16
.58
14.1
4 -7
5.01
3 4.
477
624
Ibag
ué
Paire
d Ea
st (3
95)
Silv
opas
ture
s 40
7.72
20
.94
8.91
50
.00
59.1
7 30
.25
15.7
1 -7
4.99
5 4.
477
595
Ibag
ué
Paire
d N
orth
(395
) Si
lvop
astu
res
115.
32
15.8
6 7.
98
30.0
0 55
.83
31.0
0 17
.14
-75.
013
4.49
5 59
1
Ibag
ué
Paire
d So
uth
(395
) Se
cond
ary
fore
st
226.
51
12.0
1 8.
09
50.8
3 67
.50
22.5
0 17
.00
-75.
011
4.48
6 61
9
Ibag
ué
Paire
d W
est (
395)
Se
cond
ary
fore
st
634.
24
19.9
1 8.
64
45.0
0 56
.67
28.1
7 14
.57
-75.
028
4.47
7 64
3
Ros
as, C
auca
R
ando
m C
ente
r (56
1)
Shad
e co
ffee
61
.78
1.94
7.
33
35.0
0 64
.17
18.0
8 57
.75
-76.
737
2.22
9 16
64
Ros
as, C
auca
R
ando
m E
ast (
561)
Sh
ade
coff
ee
185.
33
4.90
6.
39
68.3
3 44
.17
10.5
8 72
.00
-76.
720
2.22
9 17
09
Ros
as, C
auca
R
ando
m N
orth
(561
) Sh
ade
coff
ee
41.1
8 1.
22
7.13
25
.83
61.6
7 3.
83
61.4
3 -7
6.73
7 2.
247
1794
Ros
as, C
auca
R
ando
m S
outh
(561
) Sh
ade
coff
ee
247.
11
7.79
6.
90
57.5
0 50
.83
15.6
7 67
.29
-76.
737
2.21
2 18
33
Ros
as, C
auca
R
ando
m W
est (
561)
Sh
ade
coff
ee
271.
82
13.3
7 7.
85
56.6
7 31
.67
17.6
7 54
.71
-76.
755
2.22
9 12
48
Ros
as, C
auca
Pa
ired
Cen
ter (
561)
M
atur
e fo
rest
32
1.24
23
.20
9.00
73
.75
42.5
0 18
.13
39.8
6 -7
6.68
8 2.
213
2376
Ros
as, C
auca
Pa
ired
East
(561
) Se
cond
ary
fore
st
255.
34
18.4
9 8.
49
55.0
0 35
.00
20.3
3 68
.71
-76.
670
2.21
3 13
86
Patia
, Cau
ca
Ran
dom
Cen
ter (
581)
Se
cond
ary
fore
st
148.
26
4.42
4.
98
44.1
7 68
.33
6.67
14
.80
-77.
171
1.98
8 58
1
Patia
, Cau
ca
Ran
dom
Eas
t (58
1)
Silv
opas
ture
s 11
9.43
4.
11
6.17
45
.83
50.0
0 3.
25
15.5
7 -7
7.15
3 1.
988
595
Patia
, Cau
ca
Ran
dom
Wes
t (58
1)
Silv
opas
ture
s 22
2.40
14
.16
8.10
72
.50
57.5
0 12
.17
18.8
6 -7
7.18
8 1.
988
554
Patia
, Cau
ca
Ran
dom
Nor
th (5
81)
Silv
opas
ture
s 14
8.26
7.
88
6.07
39
.17
81.6
7 7.
08
17.5
7 -7
7.17
1 2.
005
575
cont
inue
d
223
Page 249
224
App
endi
x E.
(con
tinue
d)
Pa
tia, C
auca
R
ando
m S
outh
(581
) Se
cond
ary
fore
st
177.
09
4.02
5.
91
63.3
3 51
.67
12.8
3 18
.00
-77.
171
1.97
0 57
5
Patia
, Cau
ca
Paire
d C
ente
r (58
1)
Silv
opas
ture
s 53
.54
3.63
7.
04
38.0
0 59
.00
8.70
17
.86
-77.
144
1.97
0 57
9
Patia
, Cau
ca
Paire
d Ea
st (5
81)
Silv
opas
ture
s 24
7.11
10
.37
4.90
44
.17
61.6
7 2.
67
10.2
9 -7
7.12
7 1.
970
611
Patia
, Cau
ca
Paire
d N
orth
(581
) Se
cond
ary
fore
st
267.
70
5.73
5.
98
64.1
7 44
.17
4.92
18
.86
-77.
144
1.98
8 59
3
Patia
, Cau
ca
Paire
d So
uth
(581
) Su
cces
sion
al
107.
08
2.73
5.
31
33.3
3 76
.67
17.1
7 16
.86
-77.
144
1.95
2 60
5
Patia
, Cau
ca
Paire
d W
est (
581)
Se
cond
ary
fore
st
304.
76
7.67
6.
14
70.0
0 54
.17
6.67
15
.14
-77.
162
1.97
0 58
6
P.N
San
gay
Ran
dom
Cen
ter (
667)
M
atur
e fo
rest
54
9.89
11
5.01
16
.60
78.3
3 58
.33
37.2
5 18
.00
-78.
090
-1.6
76
1000
P.N
San
gay
Ran
dom
Eas
t (66
7)
Mat
ure
fore
st
731.
36
36.4
1 17
.47
75.0
0 61
.67
41.0
0 76
.86
-78.
073
-1.6
76
885
P.N
San
gay
Ran
dom
Nor
th (6
67)
Mat
ure
fore
st
964.
68
37.6
0 19
.30
78.3
3 59
.17
39.0
8 75
.14
-78.
090
-1.6
59
1238
P.N
San
gay
Ran
dom
Sou
th (6
67)
Mat
ure
fore
st
988.
46
75.9
7 17
.87
75.8
3 60
.00
34.5
0 66
.00
-78.
090
-1.6
87
1035
P.N
San
gay
Paire
d C
ente
r (66
7)
Mat
ure
fore
st
685.
01
41.3
8 23
.17
62.5
0 60
.83
36.9
2 65
.44
-78.
111
-1.6
51
1083
P.N
San
gay
Paire
d Ea
st (6
67)
Mat
ure
fore
st
824.
64
37.8
0 23
.15
49.1
7 53
.33
60.0
8 65
.44
-78.
101
-1.6
51
1045
P.N
San
gay
Paire
d N
orth
(667
) M
atur
e fo
rest
66
3.83
41
.27
21.0
0 43
.33
47.5
0 43
.33
65.4
4 -7
8.11
1 -1
.640
10
44
P.N
San
gay
Paire
d So
uth
(667
) M
atur
e fo
rest
54
4.11
12
9.21
27
.11
46.6
7 36
.67
35.3
3 65
.44
-78.
111
-1.6
57
1234
P.N
San
gay
Paire
d W
est (
667)
M
atur
e fo
rest
80
2.61
40
.68
22.9
8 50
.00
54.1
7 60
.67
65.4
4 -7
8.11
4 -1
.651
11
80
Chi
ngoz
ales
R
ando
m N
orth
(734
) Se
cond
ary
fore
st
457.
15
47.2
8 17
.12
85.0
0 92
.50
39.0
0 66
.67
-78.
679
-4.9
06
1350
Chi
ngoz
ales
R
ando
m S
outh
(734
) M
atur
e fo
rest
35
8.30
3.
94
8.00
50
.00
87.5
0 78
.00
79.0
0 -7
8.68
2 -4
.942
15
80
Chi
ngoz
ales
R
ando
m W
est (
734)
M
atur
e fo
rest
88
9.58
36
.07
18.8
9 10
0.00
90
.00
0.00
74
.50
-78.
692
-4.9
19
1080
224
Page 250
225
App
endi
x F.
Neo
tropi
cal-N
earc
tic m
igra
tory
bird
s and
mix
ed-s
peci
es fl
ocks
attr
ibut
es re
cord
ed in
1-k
m2 p
ixel
s (84
and
39
pixe
ls,
resp
ectiv
ely)
in 1
1 di
ffer
ent r
egio
ns in
the
And
es in
Col
ombi
a, E
cuad
or a
nd P
eru.
Win
terin
g se
ason
s 200
7-20
10.
Loc
ality
ID
Cod
e N
TM
B r
ichn
ess
NT
MB
abu
ndan
ce
Floc
k ri
chne
ss
Floc
k si
ze
Floc
k en
coun
ter
rate
Agu
achi
ca
Ran
dom
Cen
ter (
124)
0.
39 ±
0.0
1 0.
52 ±
0.0
4 6
± 2.
83
19 ±
18.
38
0.39
± 1
Agu
achi
ca
Ran
dom
Eas
t (12
4)
0.64
± 0
.03
2.56
± 0
.01
- -
-
Agu
achi
ca
Ran
dom
Nor
th (1
24)
0.67
± 0
.05
2.67
± 0
.1
- -
-
Agu
achi
ca
Ran
dom
Sou
th (1
24)
0.46
± 0
.02
1.37
± 0
.02
- -
-
Agu
achi
ca
Ran
dom
Wes
t (12
4)
0.46
± 0
.01
1.03
± 0
.1
7.5
± 6.
36
10 ±
9.9
0.
23 ±
0.5
7
Agu
achi
ca
Paire
d C
ente
r (12
4)
1.14
± 0
.02
1.94
± 0
.03
11
17
0.11
± 0
.06
Agu
achi
ca
Paire
d Ea
st (1
24)
0.40
± 0
.04
1.00
± 0
.02
8.5
± 0.
71
12.5
± 0
.71
0.2
± 1.
15
Agu
achi
ca
Paire
d N
orth
(124
) 0.
15 ±
0.0
3 0.
15 ±
0.0
5 7
11
0.15
± 0
.57
Agu
achi
ca
Paire
d So
uth
(124
) 0.
38 ±
0.0
2 0.
51 ±
0.0
7 9
9 0.
13 ±
0.2
8
Agu
achi
ca
Paire
d W
est (
124)
0.
76 ±
0.0
5 2.
18 ±
0.0
2 5
± 2.
83
18 ±
8.4
9 0.
22 ±
0.7
6
San
J. de
la M
onta
ña
Ran
dom
Eas
t (21
6)
2.00
± 0
.01
3.00
± 0
.01
- -
-
Con
tinue
d
225
Page 251
226
App
endi
x F.
(con
tinue
d)
Sa
n J.
de la
Mon
taña
R
ando
m N
orth
(216
) 0.
73 ±
0.0
2 1.
45 ±
0.0
5 -
- -
San
J. de
la M
onta
ña
Paire
d W
est (
216)
0.
62 ±
0.0
2 3.
40 ±
0.1
-
- -
San
V d
e ch
ucur
í R
ando
m C
ente
r (23
1)
0.42
± 0
.01
0.73
± 0
.02
12
46
0.10
± 0
.35
San
V d
e ch
ucur
í R
ando
m E
ast (
231)
0.
80 ±
0.0
3 2.
93 ±
0.1
2 14
32
0.
13 ±
0.3
2
San
V d
e ch
ucur
í R
ando
m N
orth
(231
) 0.
47 ±
0.0
2 1.
18 ±
0.0
5 10
± 2
.52
13.5
± 5
.13
0.24
± 0
.67
San
V d
e ch
ucur
í R
ando
m W
est (
231)
2.
71 ±
0.0
5 11
.23
± 2.
28
13.3
3 ±
7.31
35
.67
± 12
.32
1.16
± 0
.55
San
V d
e ch
ucur
í Pa
ired
Cen
ter (
231)
0.
36 ±
0.0
2 0.
87 ±
0.0
9 -
- -
San
V d
e ch
ucur
í Pa
ired
East
(231
) 0.
42 ±
0.0
3 0.
76 ±
0.0
4 -
- -
San
V d
e ch
ucur
í Pa
ired
Nor
th (2
31)
0.26
± 0
.03
0.71
± 0
.05
- -
-
San
V d
e ch
ucur
í Pa
ired
Sout
h (2
31)
0.33
± 0
.04
0.85
± 0
.02
- -
-
San
V d
e ch
ucur
í Pa
ired
Wes
t (23
1)
0.35
± 0
.01
1.05
± 0
.11
- -
-
Ric
aute
R
ando
m C
ente
r (24
8)
0.13
± 0
.01
0.13
± 0
.03
0 0
0
Ric
aute
R
ando
m E
ast (
248)
-
- 0
0 0
Con
tinue
d
226
Page 252
227
App
endi
x F.
(con
tinue
d)
R
icau
te
Ran
dom
Nor
th (2
48)
- -
0 0
0
Ric
aute
R
ando
m S
outh
(248
) -
- 3
5 0.
4 ±
0.29
Ric
aute
R
ando
m W
est (
248)
-
- 0
0 0
Ric
aute
Pa
ired
Cen
ter (
248)
-
- 0
0 0
Ric
aute
Pa
ired
East
(248
) 0.
40 ±
0.0
2 0.
40 ±
0.0
5 3
4 0.
4 ±
0.47
Ric
aute
Pa
ired
Nor
th (2
48)
- -
0 0
0
Ric
aute
Pa
ired
Sout
h (2
48)
- -
7 14
0.
24 ±
0.7
2
Paco
ra, A
bejo
rral
Pa
ired
Cen
ter (
307)
0.
92 ±
0.0
2 3.
76 ±
0.0
6 -
- -
Paco
ra, A
bejo
rral
Pa
ired
East
(307
) 1.
28 ±
0.0
1 1.
37 ±
0.0
1 2.
5 ±
0.71
7
± 1.
41
0.23
± 0
.45
Paco
ra, A
bejo
rral
Pa
ired
Nor
th (3
07)
0.76
± 0
.03
3.29
± 0
.13
19.2
± 6
.05
9.27
± 1
3.05
1.
15 ±
2.6
5
Paco
ra, A
bejo
rral
Pa
ired
Wes
t (30
7)
0.60
± 0
.03
3.72
± 0
.02
- -
-
Paya
, Boy
acá
Ran
dom
Cen
ter (
314)
0.
50 ±
0.0
2 0.
74 ±
0.0
3 -
- -
Paya
, Boy
acá
Ran
dom
Eas
t (31
4)
0.86
± 0
.01
1.51
± 0
.1
8 17
0.
11 ±
0.2
5
Con
tinue
d
227
Page 253
228
App
endi
x F.
(con
tinue
d)
Pa
ya, B
oyac
á R
ando
m N
orth
(314
) 0.
64 ±
0.0
5 3.
43 ±
0.1
5 8
± 2
16 ±
4.3
6 0.
32 ±
0.8
7
Paya
, Boy
acá
Ran
dom
Sou
th (3
14)
0.11
± 0
.04
0.78
± 0
.05
6 12
0.
11 ±
0.5
Paya
, Boy
acá
Ran
dom
Wes
t (31
4)
- -
6 ±
10 ±
0.
21 ±
0.2
9
Paya
, Boy
acá
Paire
d C
ente
r (31
4)
0.58
± 0
.01
0.87
± 0
.4
- -
-
Paya
, Boy
acá
Paire
d Ea
st (3
14)
0.19
± 0
.02
0.38
± 0
.04
4.75
± 2
.13
7.75
± 2
.02
0.29
± 0
.87
Paya
, Boy
acá
Paire
d N
orth
(314
) 0.
19 ±
0.0
2 0.
19 ±
0.0
5 6
17
0.09
± 0
.35
Paya
, Boy
acá
Paire
d So
uth
(314
) 0.
63 ±
0.0
3 1.
88 ±
0.0
2 6.
5 ±
1.41
10
.5 ±
4.2
8 0.
38 ±
0.8
9
Paya
, Boy
acá
Paire
d W
est (
314)
-
- -
- -
Ibag
ué
Ran
dom
Cen
ter (
395)
0.
16 ±
0.0
1 0.
16 ±
0.0
5 6.
5 ±
2.25
6.
5 ±
4.82
0.
32 ±
0.5
9
Ibag
ué
Ran
dom
Eas
t (39
5)
0.57
± 0
.04
1.33
± 0
.07
- -
-
Ibag
ué
Ran
dom
Nor
th (3
95)
0.30
± 0
.02
0.40
± 0
.04
- -
-
Ibag
ué
Ran
dom
Sou
th (3
95)
- -
- -
-
Ibag
ué
Ran
dom
Wes
t (39
5)
0.53
± 0
.01
1.37
± 0
.08
- -
-
Con
tinue
d
228
Page 254
229
App
endi
x F.
(con
tinue
d)
Ib
agué
Pa
ired
Cen
ter (
395)
0.
42 ±
0.0
1 0.
74 ±
0.0
4 -
- -
Ibag
ué
Paire
d Ea
st (3
95)
0.30
± 0
.03
1.61
± 0
.09
- -
-
Ibag
ué
Paire
d N
orth
(395
) 0.
24 ±
0.0
2 0.
49 ±
0.0
1 -
- -
Ibag
ué
Paire
d So
uth
(395
) 0.
40 ±
0.0
1 0.
40 ±
0.0
2 -
- -
Ibag
ué
Paire
d W
est (
395)
0.
51 ±
0.0
2 1.
20 ±
0.0
4 -
- -
Ros
as, C
auca
R
ando
m C
ente
r (56
1)
0.53
± 0
.04
6.02
± 0
.02
14
31
0.18
± 0
.45
Ros
as, C
auca
R
ando
m E
ast (
561)
0.
83 ±
0.0
5 0.
83 ±
0.0
3 8.
23 ±
4.5
5 13
.85
± 8.
73
1.52
± 2
.08
Ros
as, C
auca
R
ando
m N
orth
(561
) 0.
21 ±
0.0
1 1.
71 ±
0.0
5 -
- -
Ros
as, C
auca
R
ando
m S
outh
(561
) 0.
53 ±
0.0
1 2.
63 ±
0.0
7 9.
78 ±
2.1
1 16
± 4
.47
0.95
± 1
.73
Ros
as, C
auca
R
ando
m W
est (
561)
1.
14 ±
0.0
6 3.
73 ±
0.0
8 9.
67 ±
4.6
3 15
± 6
.07
0.97
± 1
.73
Ros
as, C
auca
Pa
ired
Cen
ter (
561)
-
- -
- -
Ros
as, C
auca
Pa
ired
East
(561
) 0.
75 ±
0.0
4 1.
00 ±
0.0
7 -
- -
Patia
, Cau
ca
Ran
dom
Cen
ter (
581)
1.
75 ±
0.0
5 5.
00 ±
0.0
3 -
- -
Con
tinue
d
229
Page 255
230
App
endi
x F.
(con
tinue
d)
Pa
tia, C
auca
R
ando
m E
ast (
581)
0.
55 ±
0.0
2 3.
45 ±
0.0
2 -
- -
Patia
, Cau
ca
Ran
dom
Wes
t (58
1)
1.60
± 0
.01
6.40
± 0
.1
- -
-
Patia
, Cau
ca
Ran
dom
Nor
th (5
81)
0.60
± 0
.04
6.00
± 0
.12
- -
-
Patia
, Cau
ca
Ran
dom
Sou
th (5
81)
1.33
± 0
.05
6.33
± 0
.04
- -
-
Patia
, Cau
ca
Paire
d C
ente
r (58
1)
0.89
± 0
.01
3.56
± 0
.08
- -
-
Patia
, Cau
ca
Paire
d Ea
st (5
81)
2.00
± 0
.04
9.33
± 0
.05
- -
-
Patia
, Cau
ca
Paire
d N
orth
(581
) 1.
00 ±
0.0
5 1.
75 ±
0.0
7 -
- -
Patia
, Cau
ca
Paire
d So
uth
(581
) 0.
14 ±
0.0
3 0.
43 ±
0.0
1 -
- -
Patia
, Cau
ca
Paire
d W
est (
581)
1.
00 ±
0.0
4 6.
40 ±
0.0
4 -
- -
P.N
San
gay
Ran
dom
Cen
ter (
667)
0.
16 ±
0.0
2 0.
16 ±
0.0
3 4.
67 ±
0.5
7 12
± 4
.36
0.25
± 0
.29
P.N
San
gay
Ran
dom
Eas
t (66
7)
0.08
± 0
.01
0.08
± 0
.01
- -
-
P.N
San
gay
Ran
dom
Nor
th (6
67)
0.08
± 0
.02
0.08
± 0
.01
- -
-
P.N
San
gay
Ran
dom
Sou
th (6
67)
- -
5.33
± 1
.53
13.3
3 ±
4.73
0.
25 ±
0.2
Con
tinue
d
230
Page 256
231
App
endi
x F.
(con
tinue
d)
P.
N S
anga
y Pa
ired
Cen
ter (
667)
-
- 9
13
0.08
± 0
.42
P.N
San
gay
Paire
d Ea
st (6
67)
0.15
± 0
.04
0.15
± 0
.02
8 19
0.
08 ±
0.3
5
P.N
San
gay
Paire
d N
orth
(667
) 0.
15 ±
0.0
1 0.
30 ±
0.0
1 -
- -
P.N
San
gay
Paire
d So
uth
(667
) 0.
15 ±
0.0
1 0.
15 ±
0.0
4 -
- -
P.N
San
gay
Paire
d W
est (
667)
-
- -
- -
Chi
ngoz
ales
R
ando
m N
orth
(734
) -
- -
- -
Chi
ngoz
ales
R
ando
m S
outh
(734
) -
- 4
7 0.
21 ±
0.4
Chi
ngoz
ales
R
ando
m W
est (
734)
0.
13 ±
0.0
1 0.
13 ±
0.0
2 -
- -
231
Page 257
232
App
endi
x G
. Coe
ffic
ient
s of t
op-r
anke
d re
gres
sion
mod
els r
elat
ing
flock
rich
ness
and
abu
ndan
ce a
ttrib
utes
and
env
ironm
enta
l
varia
bles
in th
e A
ndes
. Sta
tistic
s inc
lude
mod
el e
stim
ates
, the
stan
dard
err
ors (
SE) a
nd t-
stat
istic
. Ana
lysi
s bas
ed o
n 39
1-k
m2 p
ixel
s.
Para
met
ers
Estim
ate
SE
t P
Floc
k ri
chne
ss =
hab
itat t
ype
+ lo
cal s
truc
ture
+ fo
rest
cov
er +
inte
ract
ions
Inte
rcep
t 34
.034
9.
621
3.53
7 0.
002
Hab
itat (
Past
ures
with
isol
ated
tree
s)
-20.
449
10.2
55
-1.9
94
0.06
1
Hab
itat (
Seco
ndar
y fo
rest
) -2
5.86
1 9.
864
-2.6
22
0.01
7
Hab
itat (
Shad
e co
ffee
) -6
.495
16
.345
-0
.397
0.
696
Hab
itat (
Succ
essi
onal
) -3
4.79
5 10
.132
-3
.434
0.
003
Fore
st c
over
-0
.384
0.
165
-2.3
27
0.03
1
Loca
l stru
ctur
e -6
.622
2.
318
-2.8
56
0.01
0
Past
ures
with
isol
ated
tree
s x F
ores
t cov
er
0.23
5 0.
191
1.23
0 0.
234
Seco
ndar
y fo
rest
x F
ores
t cov
er
0.36
3 0.
173
2.10
4 0.
049
cont
inue
d
232
Page 258
233
App
endi
x G
. (co
ntin
ued)
Sh
ade
coff
ee x
For
est c
over
0.
070
0.27
3 0.
256
0.80
1
Succ
essi
onal
x F
ores
t cov
er
0.52
6 0.
181
2.90
5 0.
009
Past
ures
with
isol
ated
tree
s x lo
cal s
truct
ure
12.6
41
2.93
3 4.
310
0.00
0
Seco
ndar
y fo
rest
x lo
cal s
truct
ure
-0.7
04
4.24
6 -0
.166
0.
870
Shad
e co
ffee
x lo
cal s
truct
ure
60.2
30
28.9
72
2.07
9 0.
051
Succ
essi
onal
x lo
cal s
truct
ure
7.33
0 2.
574
2.84
8 0.
010
Loca
l stru
ctur
e x
fore
st c
over
0.
094
0.04
1 2.
298
0.03
3
Past
ures
with
isol
ated
tree
s x F
ores
t cov
er x
loca
l stru
ctur
e -0
.175
0.
080
-2.1
85
0.04
2
Seco
ndar
y fo
rest
x F
ores
t cov
er x
loca
l stru
ctur
e 0.
121
0.10
1 1.
192
0.24
8
Shad
e co
ffee
x F
ores
t cov
er x
loca
l stru
ctur
e -1
.095
0.
508
-2.1
56
0.04
4
Succ
essi
onal
x F
ores
t cov
er x
loca
l stru
ctur
e -0
.121
0.
046
-2.6
54
0.01
6
Floc
k ab
unda
nce
= ha
bita
t typ
e +
loca
l str
uctu
re +
fore
st c
over
+ in
tera
ctio
ns
Inte
rcep
t 8.
459
3.09
3 2.
735
0.01
3
cont
inue
d
233
Page 259
234
App
endi
x G
. (co
ntin
ued)
H
abita
t (Pa
stur
es w
ith is
olat
ed tr
ees)
-4
.679
3.
296
-1.4
2 0.
172
Hab
itat (
Seco
ndar
y fo
rest
) -6
.070
3.
171
-1.9
15
0.07
1
Hab
itat (
Shad
e co
ffee
) -4
.861
5.
254
-0.9
25
0.36
6
Hab
itat (
Succ
essi
onal
) -8
.231
3.
257
-2.5
27
0.02
1
Fore
st c
over
-0
.088
0.
053
-1.6
52
0.11
5
Loca
l stru
ctur
e -1
.325
0.
745
-1.7
78
0.09
1
Past
ures
with
isol
ated
tree
s x F
ores
t cov
er
0.06
7 0.
062
1.08
4 0.
292
Seco
ndar
y fo
rest
x F
ores
t cov
er
0.09
2 0.
055
1.66
1 0.
113
Shad
e co
ffee
x F
ores
t cov
er
0.07
2 0.
088
0.81
6 0.
425
Succ
essi
onal
x F
ores
t cov
er
0.13
0 0.
058
2.22
5 0.
038
Past
ures
with
isol
ated
tree
s x lo
cal s
truct
ure
3.34
6 0.
943
3.55
0.
002
Seco
ndar
y fo
rest
x lo
cal s
truct
ure
0.96
2 1.
365
0.70
5 0.
489
Shad
e co
ffee
x lo
cal s
truct
ure
3.23
5 9.
312
0.34
7 0.
732
cont
inue
d
234
Page 260
235
App
endi
x G
. (co
ntin
ued)
Su
cces
sion
al x
loca
l stru
ctur
e 2.
025
0.82
7 2.
448
0.02
4
Loca
l stru
ctur
e x
fore
st c
over
0.
020
0.01
3 1.
531
0.14
2
Past
ures
with
isol
ated
tree
s x F
ores
t cov
er x
loca
l stru
ctur
e -0
.066
0.
026
-2.5
79
0.01
8
Seco
ndar
y fo
rest
x F
ores
t cov
er x
loca
l stru
ctur
e -0
.009
0.
033
-0.2
8 0.
782
Shad
e co
ffee
x F
ores
t cov
er x
loca
l stru
ctur
e -0
.068
0.
163
-0.4
16
0.68
2
Succ
essi
onal
x F
ores
t cov
er x
loca
l stru
ctur
e -0
.034
0.
015
-2.3
17
0.03
2
Floc
k ab
unda
nce
= ha
bita
t typ
e +
loca
l str
uctu
re +
hab
itat t
ype
x lo
cal
stru
ctur
e
Inte
rcep
t 3.
4 0.
534
6.36
3 0.
001
Hab
itat (
Past
ures
with
isol
ated
tree
s)
-0.8
42
0.64
8 -1
.299
0.
204
Hab
itat (
Seco
ndar
y fo
rest
) -0
.764
0.
591
-1.2
93
0.20
6
Hab
itat (
Shad
e co
ffee
) -0
.762
0.
755
-1.0
10
0.32
1
Hab
itat (
Succ
essi
onal
) -1
.977
0.
617
-3.2
05
0.00
3
Con
tinue
d
235
Page 261
236
App
endi
x G
. (co
ntin
ued)
Lo
cal s
truct
ure
-0.1
91
0.16
0 -1
.194
0.
242
Past
ures
with
isol
ated
tree
s x lo
cal s
truct
ure
1.05
6 0.
324
3.25
8 0.
003
Seco
ndar
y fo
rest
x lo
cal s
truct
ure
0.30
0 0.
342
0.87
7 0.
388
Shad
e co
ffee
x lo
cal s
truct
ure
-0.5
23
1.15
5 -0
.453
0.
654
Succ
essi
onal
x lo
cal s
truct
ure
0.87
6 0.
223
3.92
7 0.
001
Floc
k en
coun
ter
rate
= h
abita
t typ
e +
fore
st c
over
+ h
abita
t typ
e x
fore
st
cove
r
Inte
rcep
t 0.
916
0.34
8 -0
.955
0.
348
Hab
itat (
Past
ures
with
isol
ated
tree
s)
0.98
2 0.
394
-0.0
36
0.97
2
Hab
itat (
Seco
ndar
y fo
rest
) 1.
017
0.41
7 -0
.079
0.
938
Hab
itat (
Shad
e co
ffee
) 1.
226
0.54
6 -1
.812
0.
080
Hab
itat (
Succ
essi
onal
) 0.
964
0.38
1 -1
.026
0.
314
Fore
st c
over
0.
506
0.00
6 -0
.284
0.
778
Past
ures
with
isol
ated
tree
s x F
ores
t cov
er
0.50
8 0.
008
0.12
0 0.
906
Seco
ndar
y fo
rest
x F
ores
t cov
er
0.50
8 0.
008
0.84
3 0.
406
cont
inue
d
236
Page 262
237
App
endi
x G
. (co
ntin
ued)
Sh
ade
coff
ee x
For
est c
over
0.
510
0.01
0 2.
843
0.00
8
Succ
essi
onal
x F
ores
t cov
er
0.50
7 0.
007
1.32
2 0.
197
Floc
k en
coun
ter
rate
= lo
cal s
truc
ture
+ fo
rest
cov
er +
fore
st c
over
x lo
cal
stru
ctur
e
Inte
rcep
t 0.
629
0.12
2 -4
.625
0.
000
Loca
l stru
ctur
e 0.
558
0.05
7 1.
559
0.12
8
Fore
st c
over
0.
503
0.00
3 3.
136
0.00
3
Loca
l stru
ctur
e x
fore
st c
over
0.
501
0.00
1 -2
.725
0.
010
237
Page 263
238
App
endi
x H
. Coe
ffic
ient
s of t
op-r
anke
d re
gres
sion
mod
els (
ΔAIC
c <
2) re
latin
g N
eotro
pica
l mig
rant
attr
ibut
es a
nd e
nviro
nmen
tal
varia
bles
in th
e A
ndes
. Sta
tistic
s inc
lude
mod
el e
stim
ates
, the
stan
dard
err
ors (
SE),
t for
est
imat
e an
d P
valu
e.
Para
met
ers
Estim
ate
SE
t P
NT
MB
ric
hnes
s = lo
cal s
truc
ture
+ fo
rest
cov
er +
loca
l str
uctu
re x
fore
st c
over
In
terc
ept
-0.0
39
0.10
8 -0
.362
0.
718
Loca
l stru
ctur
e 0.
150
0.06
3 2.
389
0.01
9
Fore
st c
over
0.
001
0.00
2 0.
426
0.67
1
Loca
l stru
ctur
e x
fore
st c
over
-0
.005
0.
001
-4.0
26
0.00
0
NTM
B ri
chne
ss =
Hab
itat
Inte
rcep
t -0
.401
0.
095
-4.2
33
0.00
0
Hab
itat x
Pas
ture
s with
isol
ated
tree
s 0.
428
0.14
1 3.
040
0.00
3
Hab
itat x
Sec
onda
ry fo
rest
0.
384
0.12
0 3.
201
0.00
2
Hab
itat x
Sha
de c
offe
e 0.
656
0.16
4 3.
997
0.00
0
Hab
itat x
Suc
cess
iona
l 0.
071
0.15
0 0.
477
0.63
5
NT
MB
abu
ndan
ce =
loca
l str
uctu
re +
fore
st c
over
+ lo
cal s
truc
ture
x fo
rest
cov
er
Inte
rcep
t 0.
455
0.21
6 2.
112
0.03
8
Loca
l stru
ctur
e 0.
264
0.12
6 2.
101
0.03
9
Fore
st c
over
0.
004
0.00
5 0.
880
0.38
1
Loca
l stru
ctur
e x
fore
st c
over
-0
.009
0.
002
-3.9
52
0.00
1
co
ntin
ued
238
Page 264
239
App
endi
x H
. (co
ntin
ued)
N
TM
B a
bund
ance
= H
abita
t
Inte
rcep
t -0
.205
0.
189
-1.0
83
0.28
2
Hab
itat (
Past
ures
with
isol
ated
tree
s)
0.96
3 0.
280
3.43
8 0.
001
Hab
itat (
Seco
ndar
y fo
rest
) 0.
685
0.23
9 2.
866
0.00
5
Hab
itat (
Shad
e co
ffee
) 1.
456
0.32
7 4.
451
0.00
1
Hab
itat (
Succ
essi
onal
) 0.
288
0.29
9 0.
965
0.33
8
239
Page 265
240
App
endi
x I.
Occ
urre
nce
of N
eotro
pica
l-Nea
rctic
mig
rant
land
bird
s in
84 1
-km
2 pix
els s
urve
yed
in 1
1 di
ffer
ent r
egio
ns in
the
And
es
in C
olom
bia,
Ecu
ador
and
Per
u. W
inte
ring
seas
ons 2
007-
2010
.
LOC
ALI
TY
ID C
OD
E SW
TH
GC
TH
CER
W
BLB
W
BB
WA
G
CFL
B
AW
W
AM
RE
SUTA
TE
WA
Em
pido
nax
Flyc
atch
ers
RB
GR
N
OW
A
REV
I
Agu
achi
ca
Ran
dom
Cen
ter (
124)
X
X
X
Agu
achi
ca
Ran
dom
Eas
t (12
4)
X
X
X
X
Agu
achi
ca
Ran
dom
Nor
th (1
24)
X
X
X
X
X
A
guac
hica
R
ando
m S
outh
(124
) X
X
X
X
Agu
achi
ca
Ran
dom
Wes
t (12
4)
X
X
X
X
Agu
achi
ca
Paire
d C
ente
r (12
4)
X
X
X
X
X
X
X
X
X
Agu
achi
ca
Paire
d Ea
st (1
24)
X
X
X
X
Agu
achi
ca
Paire
d N
orth
(124
)
X
Agu
achi
ca
Paire
d So
uth
(124
) X
X
X
Agu
achi
ca
Paire
d W
est (
124)
X
X
X
X
X
X
X
Sn J.
de
la M
onta
ña
Ran
dom
Eas
t (21
6)
X
X
X
X
X
X
X
Sn
J. d
e la
Mon
taña
R
ando
m N
orth
(216
)
X
X
co
ntin
ued
240
Page 266
241
App
endi
x I.
(con
tinue
d)
Sn J.
de
la M
onta
ña
Paire
d W
est (
216)
X
X
X
San
V. d
e C
hucu
rí R
ando
m C
ente
r (23
1)
X
X
X
Sa
n V
. de
Chu
curí
Ran
dom
Eas
t (23
1)
X
X
X
X
San
V. d
e C
hucu
rí R
ando
m N
orth
(231
)
X
X
X
San
V. d
e C
hucu
rí R
ando
m W
est (
231)
X
X
X
X
X
San
V. d
e C
hucu
rí Pa
ired
Cen
ter (
231)
X
X
X
San
V. d
e C
hucu
rí Pa
ired
East
(231
) X
X
X
X
Sa
n V
. de
Chu
curí
Paire
d N
orth
(231
)
X
X
X
San
V. d
e C
hucu
rí Pa
ired
Sout
h (2
31)
X
X
X
San
V. d
e C
hucu
rí Pa
ired
Wes
t (23
1)
X
X
X
X
X
R
icau
te, S
anta
nder
R
ando
m C
ente
r (24
8)
X
R
icau
te, S
anta
nder
R
ando
m E
ast (
248)
R
icau
te, S
anta
nder
R
ando
m N
orth
(248
)
R
icau
te, S
anta
nder
R
ando
m S
outh
(248
)
R
icau
te, S
anta
nder
R
ando
m W
est (
248)
R
icau
te, S
anta
nder
Pa
ired
Cen
ter (
248)
R
icau
te, S
anta
nder
Pa
ired
East
(248
)
X
co
ntin
ued
241
Page 267
242
App
endi
x I.
(con
tinue
d)
Ric
aute
, San
tand
er
Paire
d N
orth
(248
)
R
icau
te, S
anta
nder
Pa
ired
Sout
h (2
48)
Abe
jorr
al
Paire
d C
ente
r (30
7)
X
X
X
X
X
X
X
Abe
jorr
al
Paire
d Ea
st (3
07)
X
X
X
X
X
X
X
X
X
A
bejo
rral
Pa
ired
Nor
th (3
07)
X
X
X
X
X
X
Abe
jorr
al
Paire
d W
est (
307)
X
X
X
X
X
Paya
, Boy
acá
Ran
dom
Cen
ter (
314)
X
Paya
, Boy
acá
Ran
dom
Eas
t (31
4)
X
X
X
X
X
Pa
ya, B
oyac
á R
ando
m N
orth
(314
) X
X
X
X
X
X
Pa
ya, B
oyac
á R
ando
m S
outh
(314
)
X
Paya
, Boy
acá
Ran
dom
Wes
t (31
4)
Paya
, Boy
acá
Paire
d C
ente
r (31
4)
X
Pa
ya, B
oyac
á Pa
ired
East
(314
)
X
X
Pa
ya, B
oyac
á Pa
ired
Nor
th (3
14)
X
X
Paya
, Boy
acá
Paire
d So
uth
(314
)
X
X
X
Paya
, Boy
acá
Paire
d W
est (
314)
Ib
agué
R
ando
m C
ente
r (39
5)
X
cont
inue
d
242
Page 268
243
App
endi
x I.
(con
tinue
d)
Ibag
ué
Ran
dom
Eas
t (39
5)
X
Ib
agué
R
ando
m N
orth
(395
)
X
X
X
Ibag
ué
Ran
dom
Sou
th (3
95)
Ibag
ué
Ran
dom
Wes
t (39
5)
X
X
X
Ib
agué
Pa
ired
Cen
ter (
395)
X
X
X
Ibag
ué
Paire
d Ea
st (3
95)
X
X
Ibag
ué
Paire
d N
orth
(395
)
X
Ibag
ué
Paire
d So
uth
(395
)
X
X
Ib
agué
Pa
ired
Wes
t (39
5)
X
X
Ros
as, C
auca
R
ando
m C
ente
r (56
1)
X
X
X
R
osas
, Cau
ca
Ran
dom
Eas
t (56
1)
X
X
X
X
X
X
Ros
as, C
auca
R
ando
m N
orth
(561
)
X
X
R
osas
, Cau
ca
Ran
dom
Sou
th (5
61)
X
X
X
X
Ros
as, C
auca
R
ando
m W
est (
561)
X
X
X
X
X
Ros
as, C
auca
Pa
ired
Cen
ter (
561)
R
osas
, Cau
ca
Paire
d Ea
st (5
61)
X
X
X
Pa
tía, C
auca
R
ando
m C
ente
r (58
1)
X
X
cont
inue
d
243
Page 269
244
App
endi
x I.
(con
tinue
d)
Patía
, Cau
ca
Ran
dom
Eas
t (58
1)
X
X
Patía
, Cau
ca
Ran
dom
Wes
t (58
1)
X
Patía
, Cau
ca
Ran
dom
Nor
th (5
81)
X
X
X
Patía
, Cau
ca
Ran
dom
Sou
th (5
81)
X
X
Patía
, Cau
ca
Paire
d C
ente
r (58
1)
X
X
Patía
, Cau
ca
Paire
d Ea
st (5
81)
X
Patía
, Cau
ca
Paire
d N
orth
(581
)
X
Patía
, Cau
ca
Paire
d So
uth
(581
)
X
Patía
, Cau
ca
Paire
d W
est (
581)
X
X
X
X
X
P.N
San
gay
Ran
dom
Cen
ter (
667)
X
P.N
San
gay
Ran
dom
Eas
t (66
7)
P.N
San
gay
Ran
dom
Nor
th (6
67)
P.N
San
gay
Ran
dom
Sou
th (6
67)
P.N
San
gay
Paire
d C
ente
r (66
7)
P.N
San
gay
Paire
d Ea
st (6
67)
P.N
San
gay
Paire
d N
orth
(667
)
X
cont
inue
d
244
Page 270
245
App
endi
x I.
(con
tinue
d)
P.N
San
gay
Paire
d So
uth
(667
)
X
P.N
San
gay
Paire
d W
est (
667)
C
hing
ozal
es
Ran
dom
Nor
th (7
34)
Chi
ngoz
ales
R
ando
m S
outh
(734
)
C
hing
ozal
es
Ran
dom
Wes
t (73
4)
X
245
Page 271
246
App
endi
x J.
Rel
atio
nshi
p of
bod
y co
nditi
on a
nd se
x, a
ge, b
ody
mol
t and
seas
on fo
r Neo
tropi
cal-N
earc
tic m
igra
tory
bird
spec
ies i
n
shad
ed m
onoc
ultu
res i
n So
uthw
este
rn A
ntio
quia
dep
artm
ent,
Col
ombi
a, 2
008-
2010
. *P
< 0.
05 a
nd *
*P <
0.0
1.
Spec
ies
Sex
Age
B
ody
mol
t Y
EAR
Cer
ulea
n W
arbl
er
F 1,5
2= 0
.28
F 1,5
2= 0
.02
F 1,5
2= 1
.08
F 1,5
2= 0
.0
Bla
ckbu
rnia
n W
arbl
er
F 1,1
22=
0.83
F 1
,122
= 0.
48
F 1,1
22=
2.58
F 1
,122
= 0.
24
Tenn
esse
e W
arbl
er
F 1,1
44=
3.18
F 1
,172
= 0.
65
F 1,1
72=
0.49
F 1
,172
= 0.
49
Can
ada
War
bler
F 1
,60=
0.3
1 F 1
,70=
0.0
4 F 1
,71=
2.5
7 F 1
,71=
2.3
3
Ros
e-br
east
ed G
rosb
eak
F 1,8
0= 2
.14
F 1,8
0= 0
.46
F 1,8
0= 0
.04
F 1,8
0= 0
.11
Red
-eye
d V
ireo
- F 1
,26=
2.8
2 F 1
,26=
0.0
2 F 1
,26=
0.0
2
Sum
mer
Tan
ager
F 1
,51=
3.3
6 F 1
,55=
0.2
8 F 1
,55=
0.3
9 F 1
,55=
2.9
8
Empi
dona
x fly
catc
hers
-
F 1,3
9= 0
.27
F 1,3
9= 0
.78
F 1,3
9= 0
.09
246


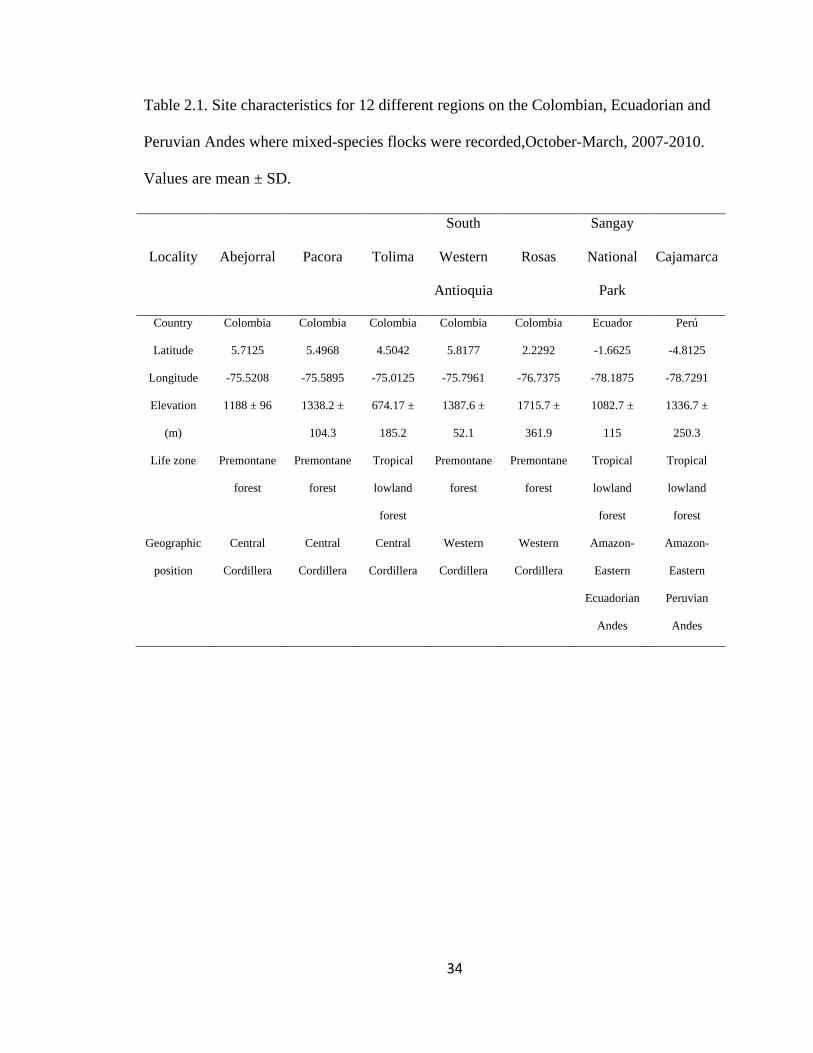
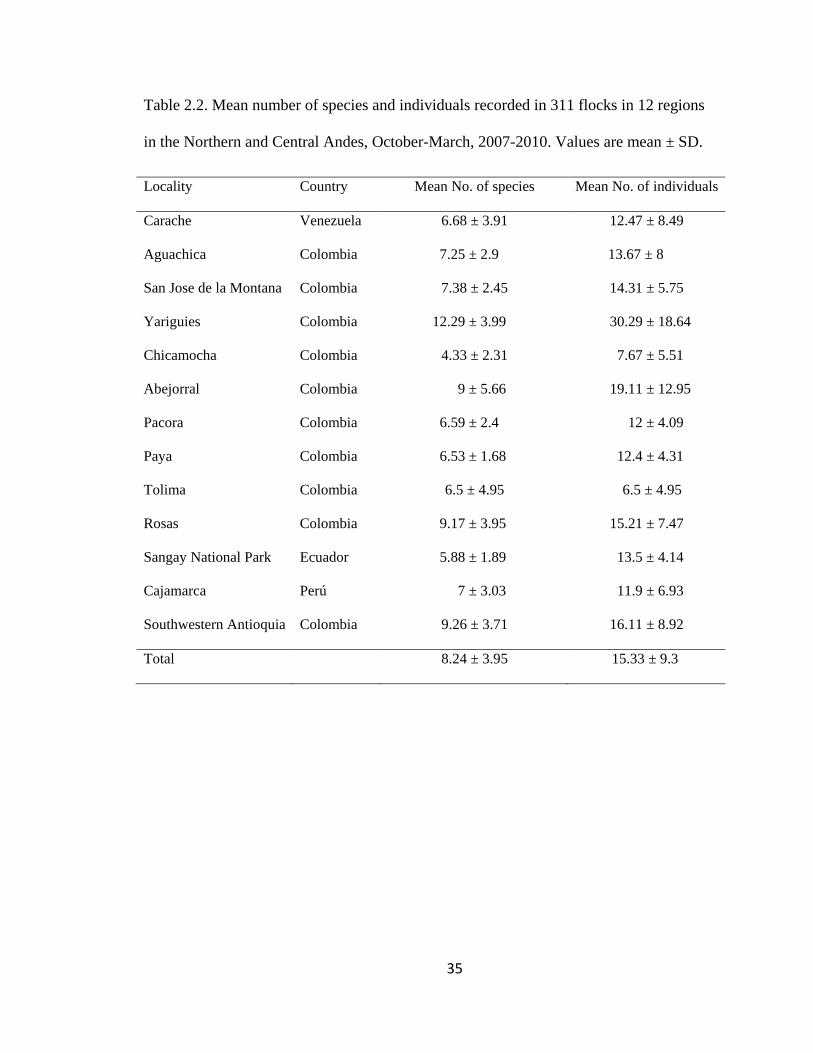
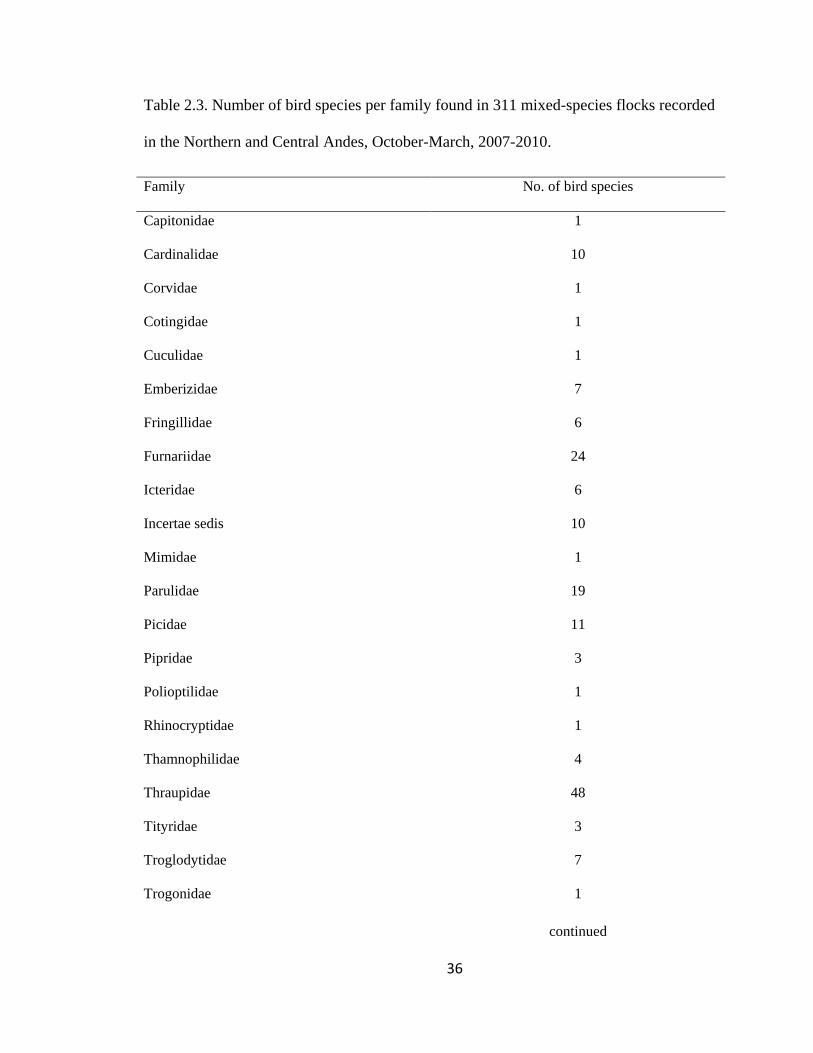
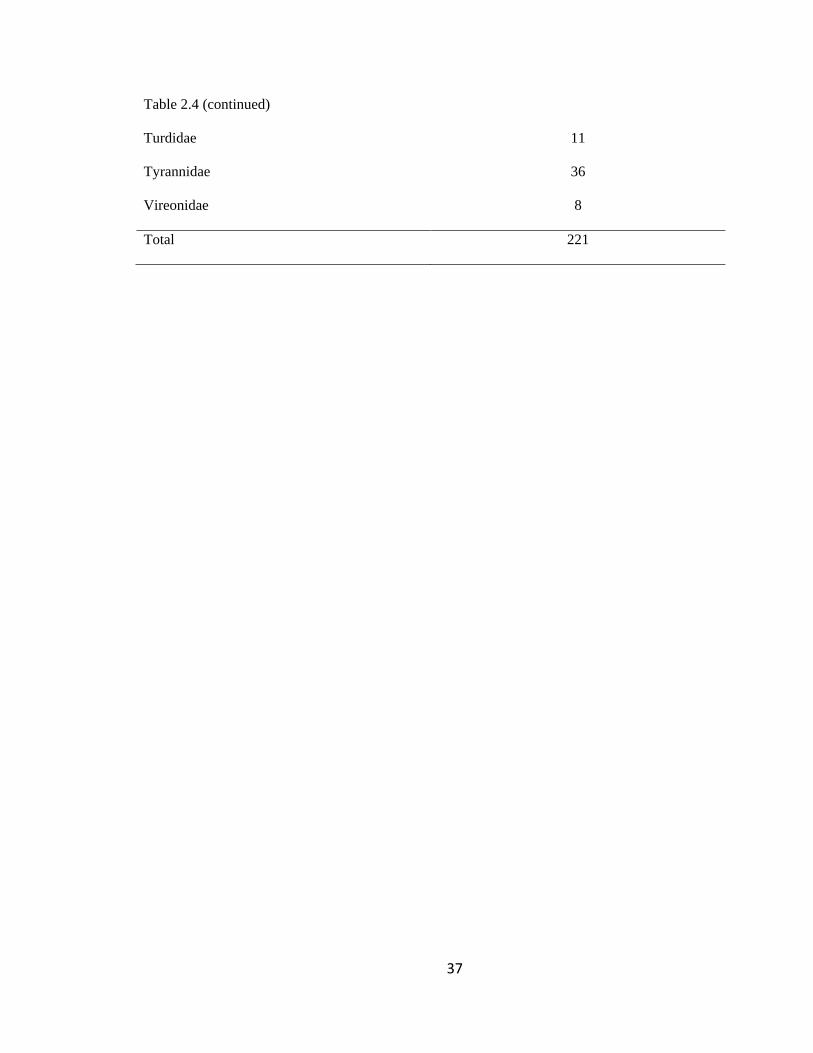
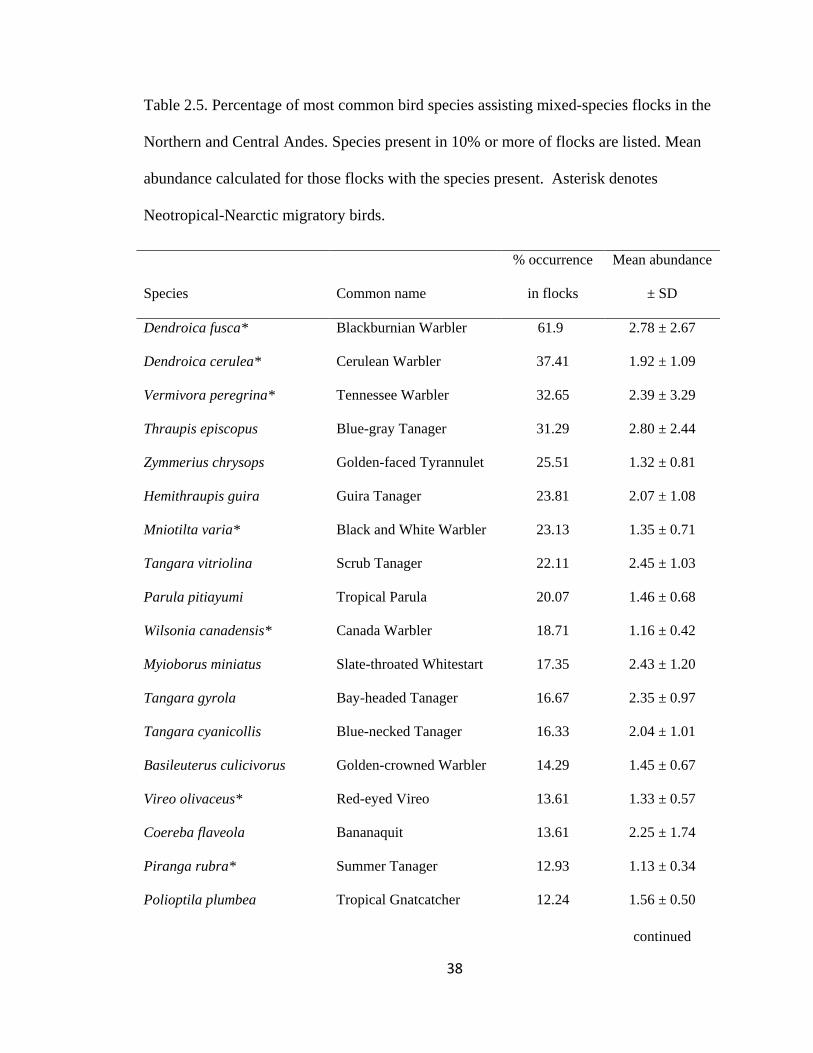

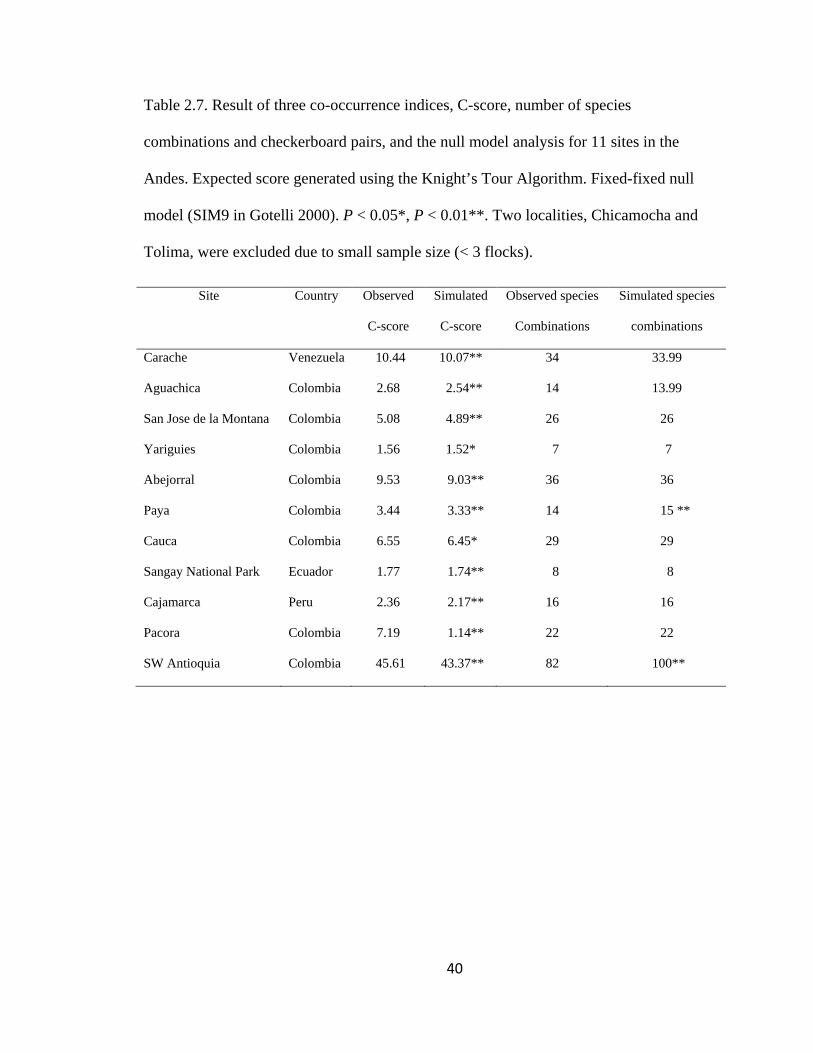
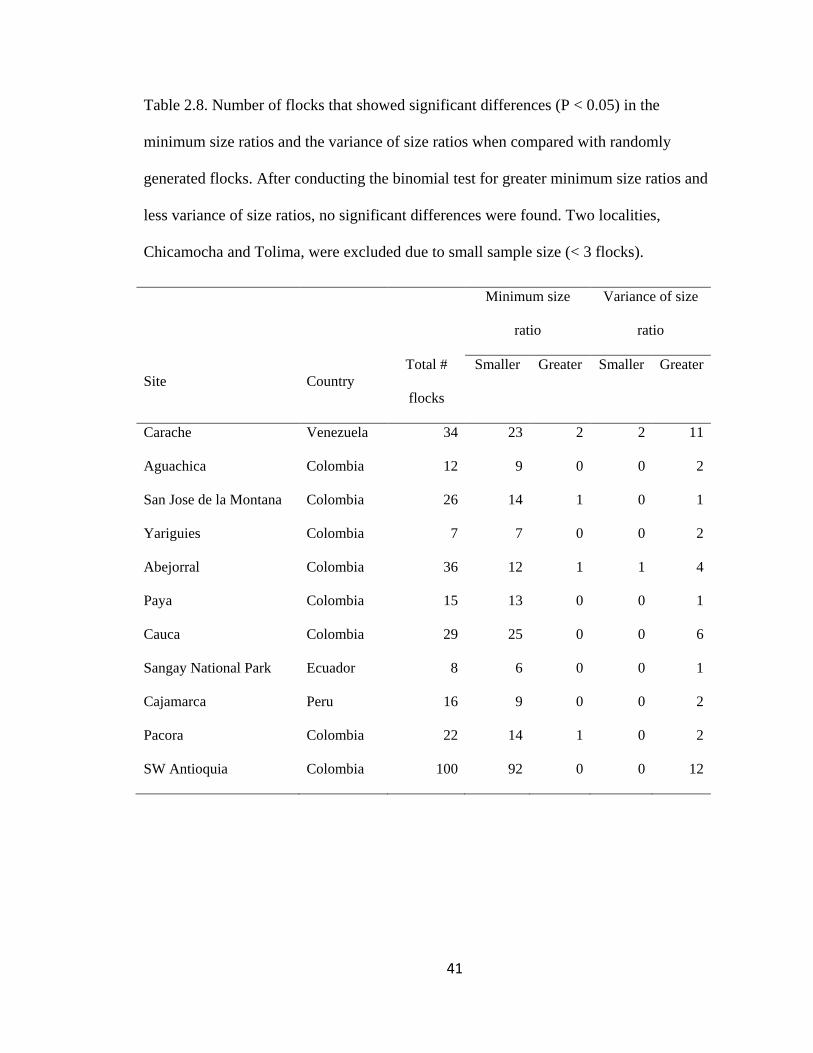
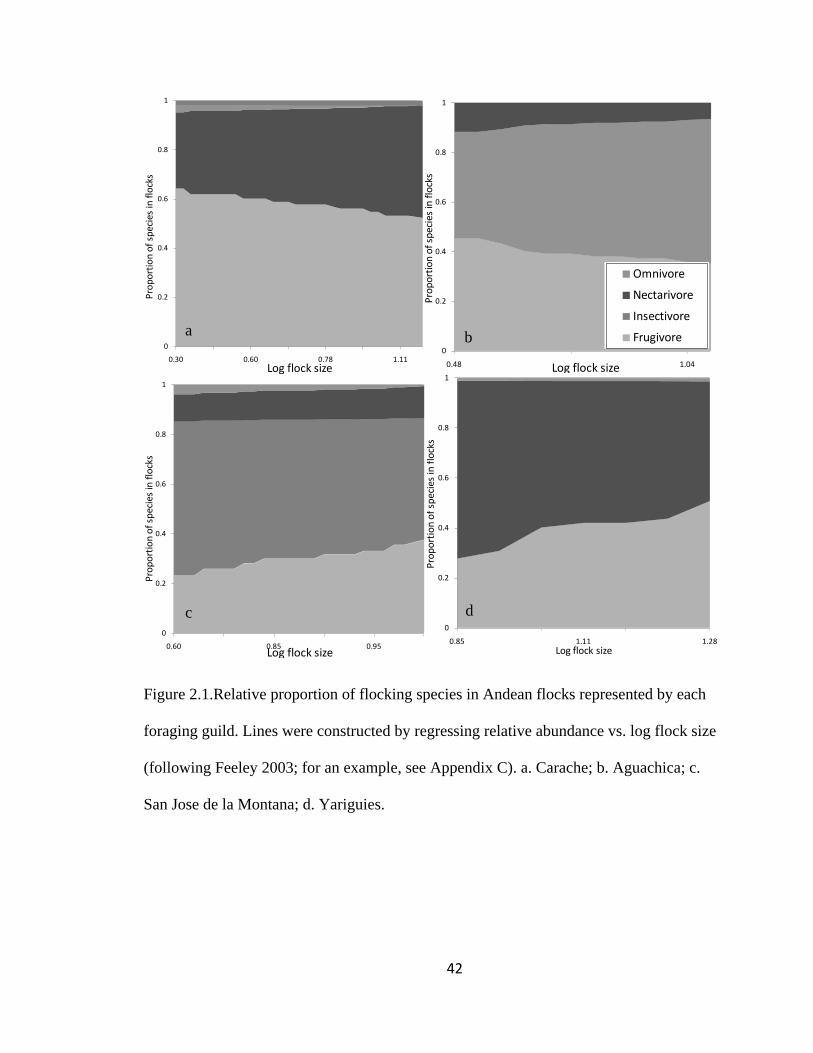
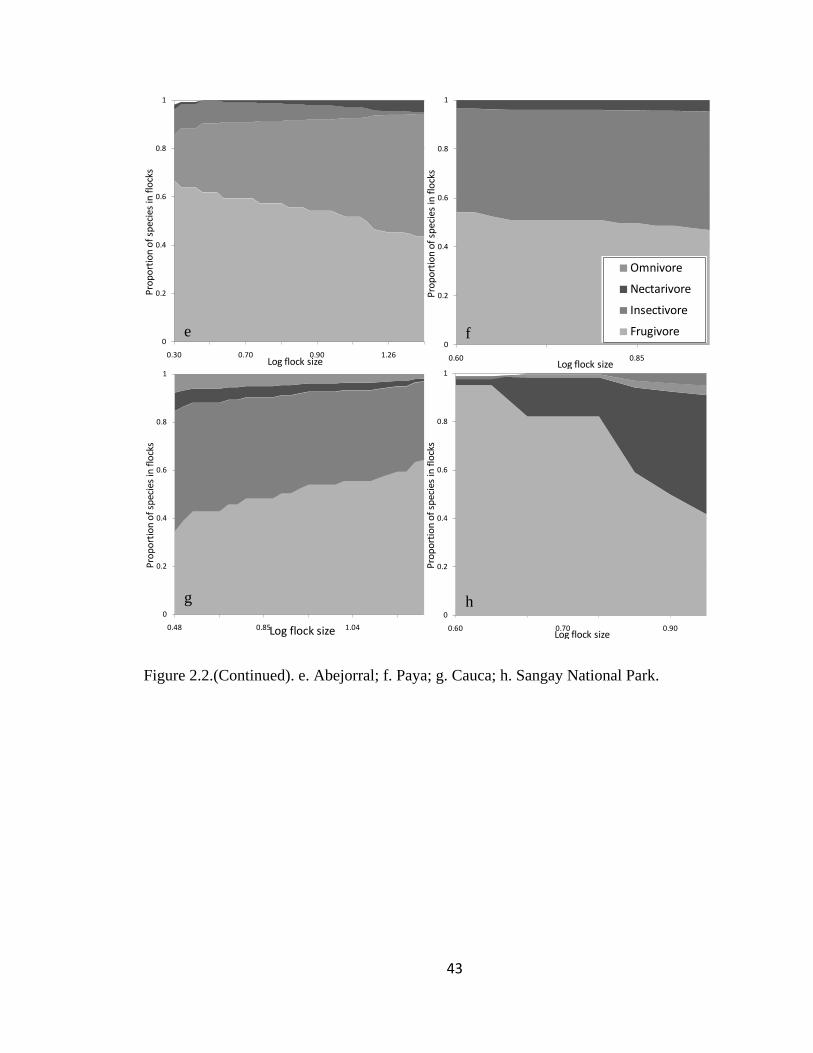
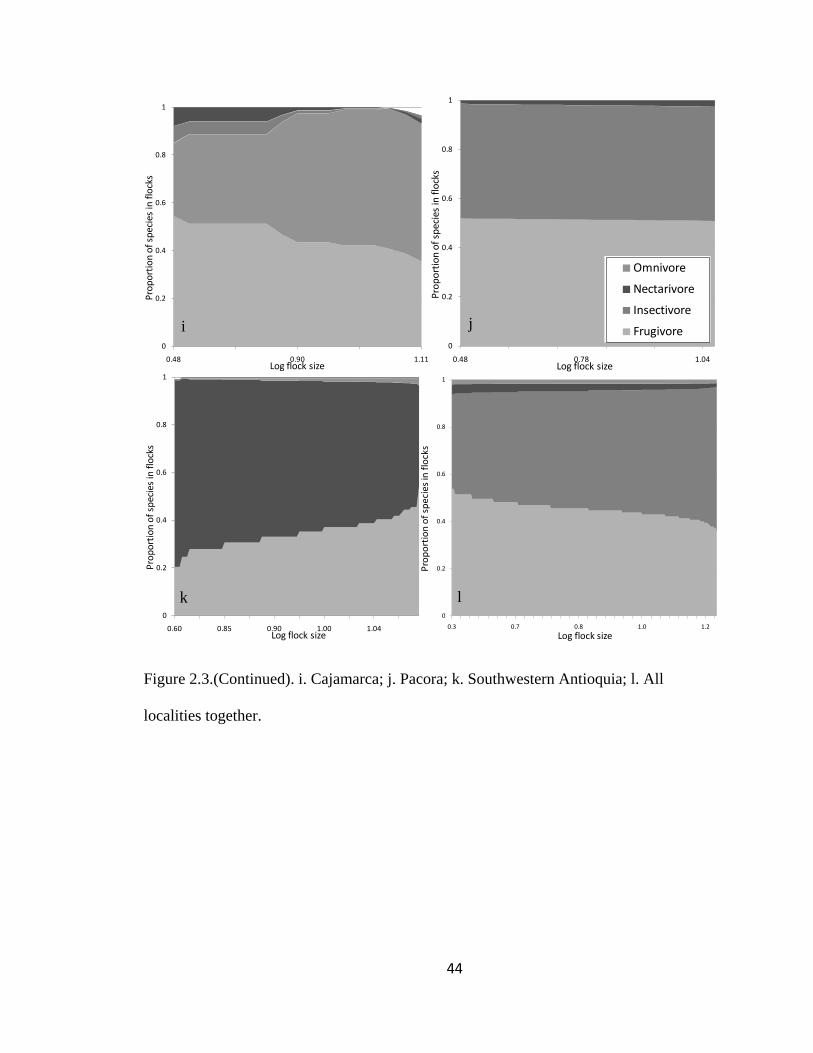
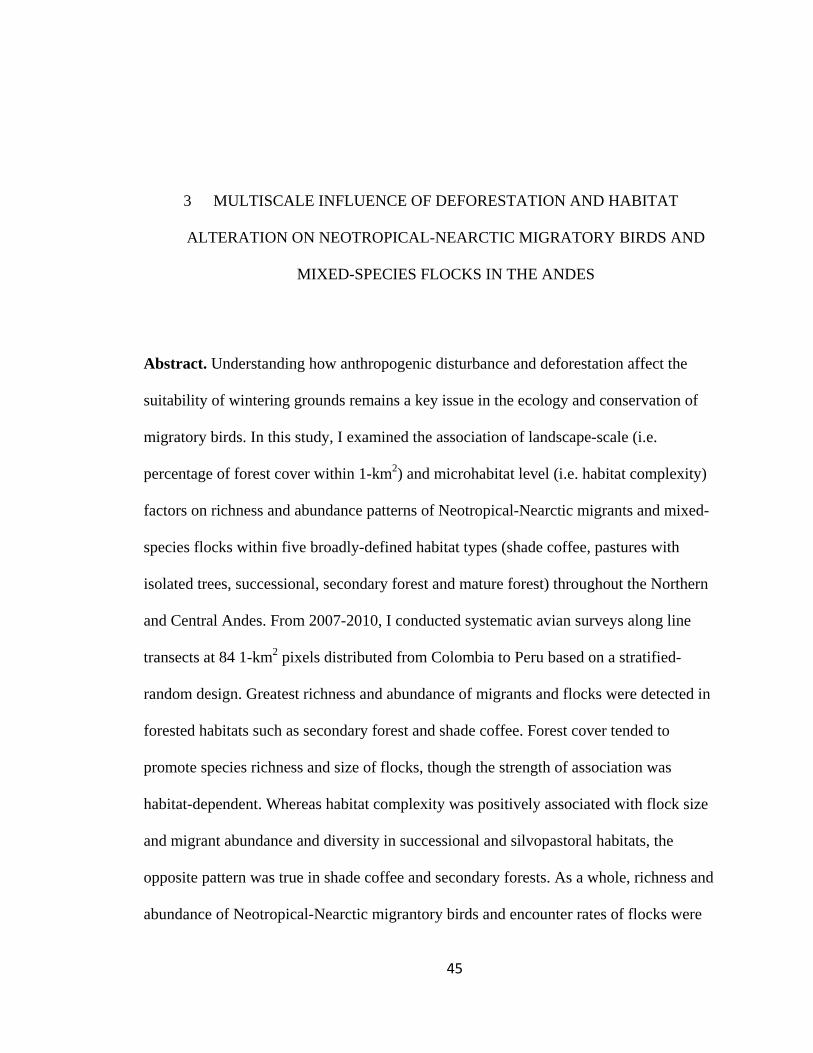
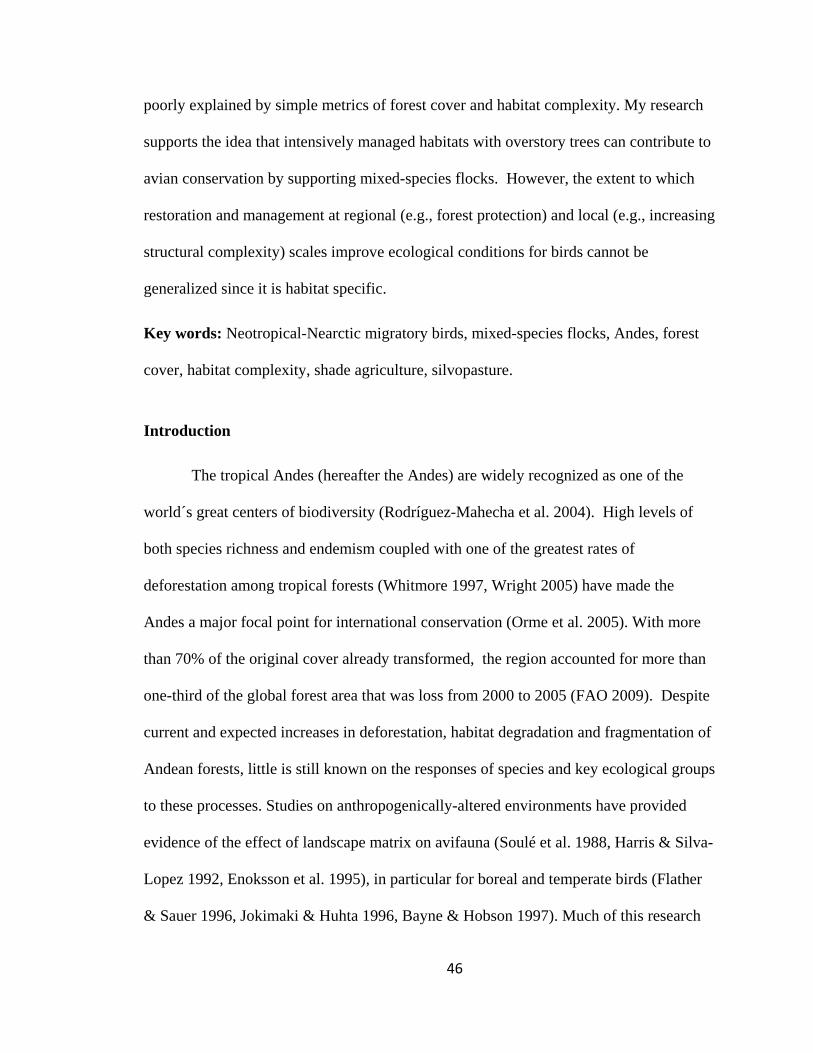
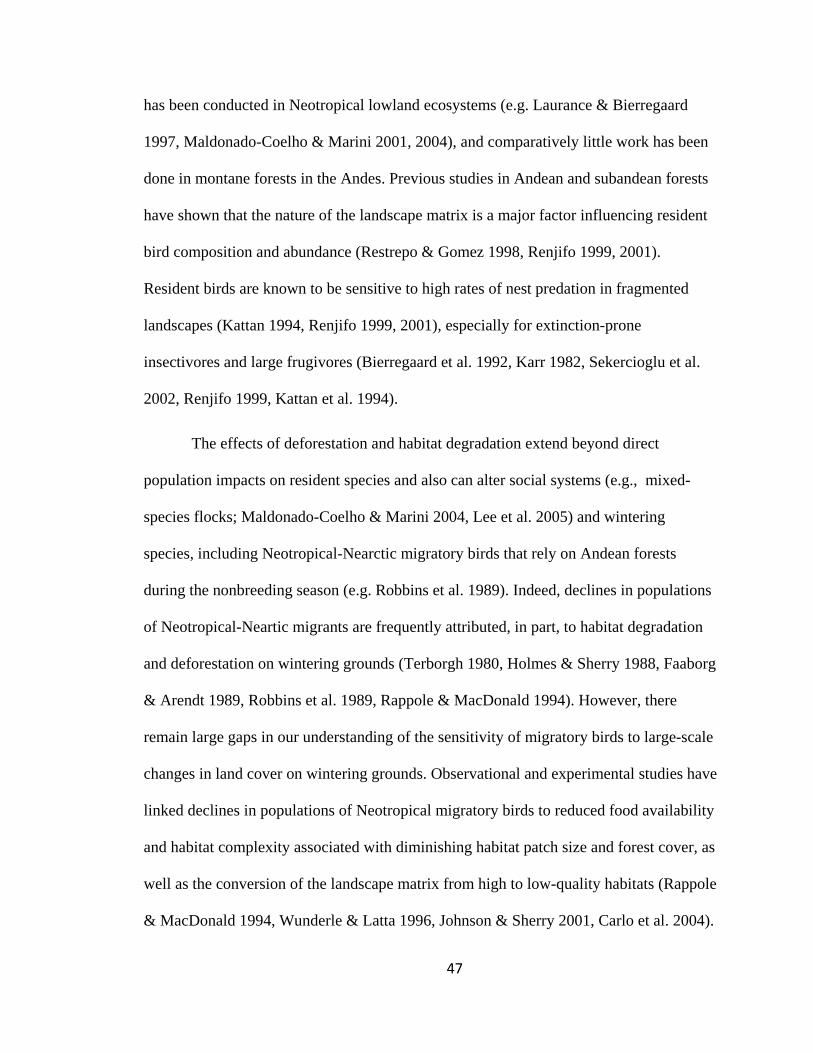
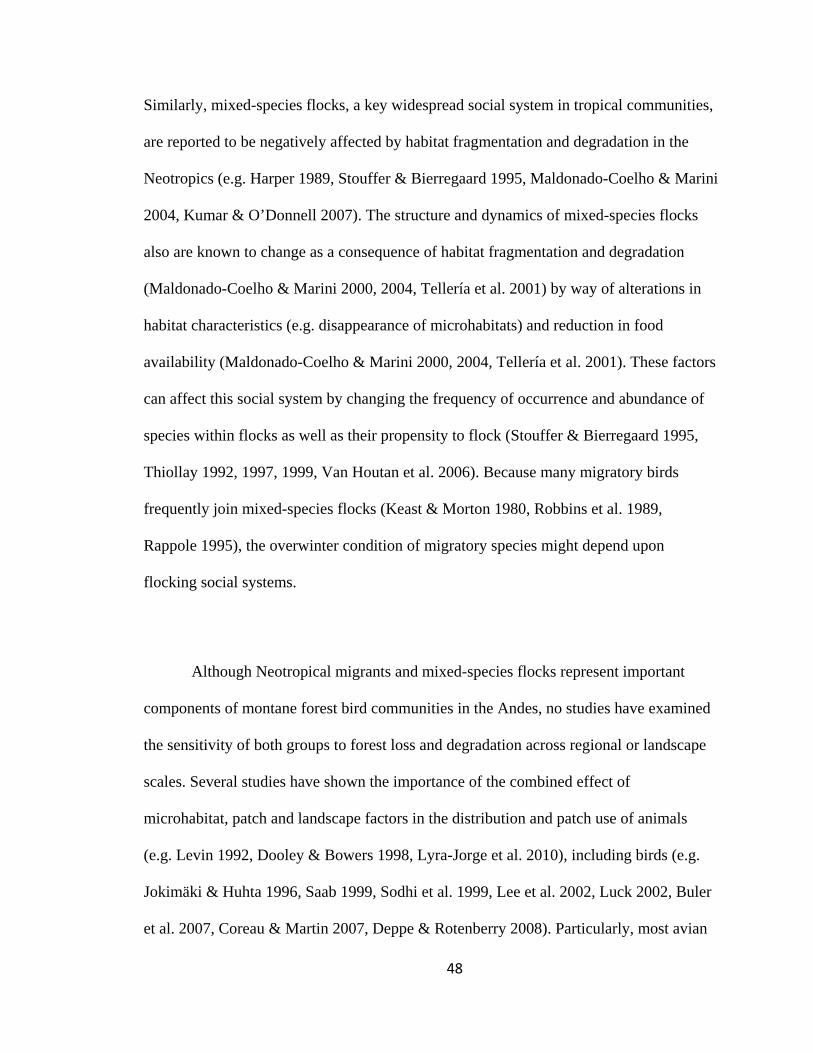
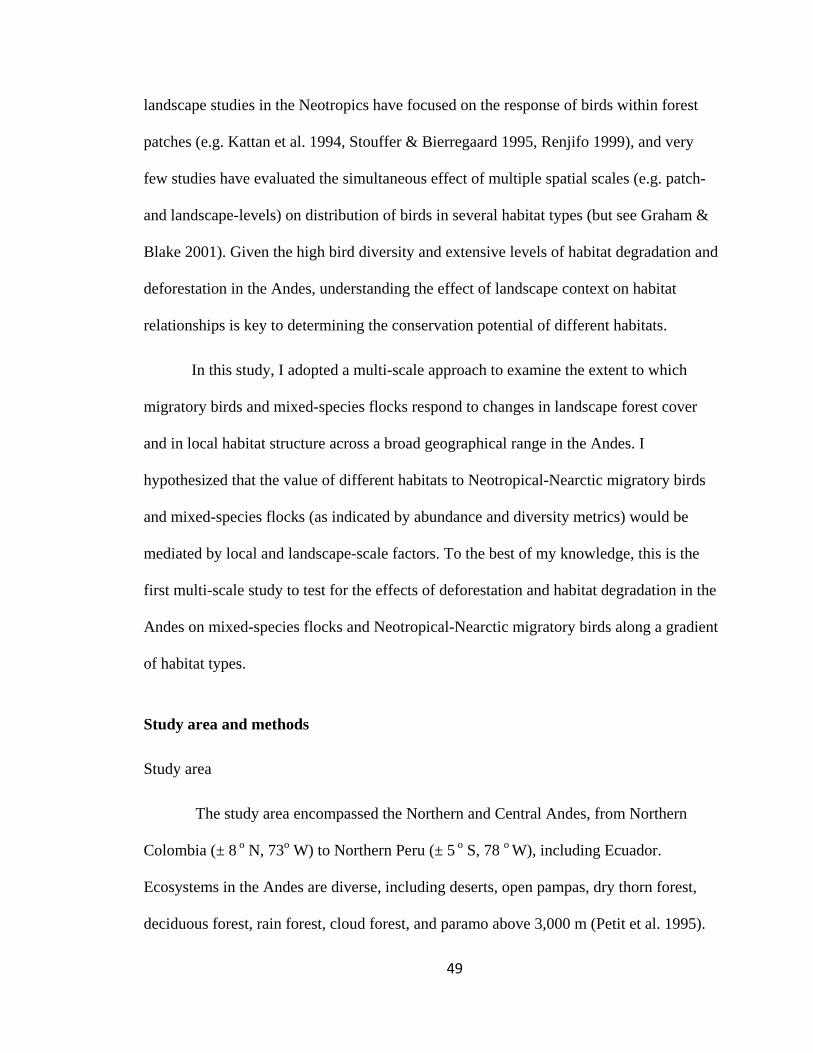
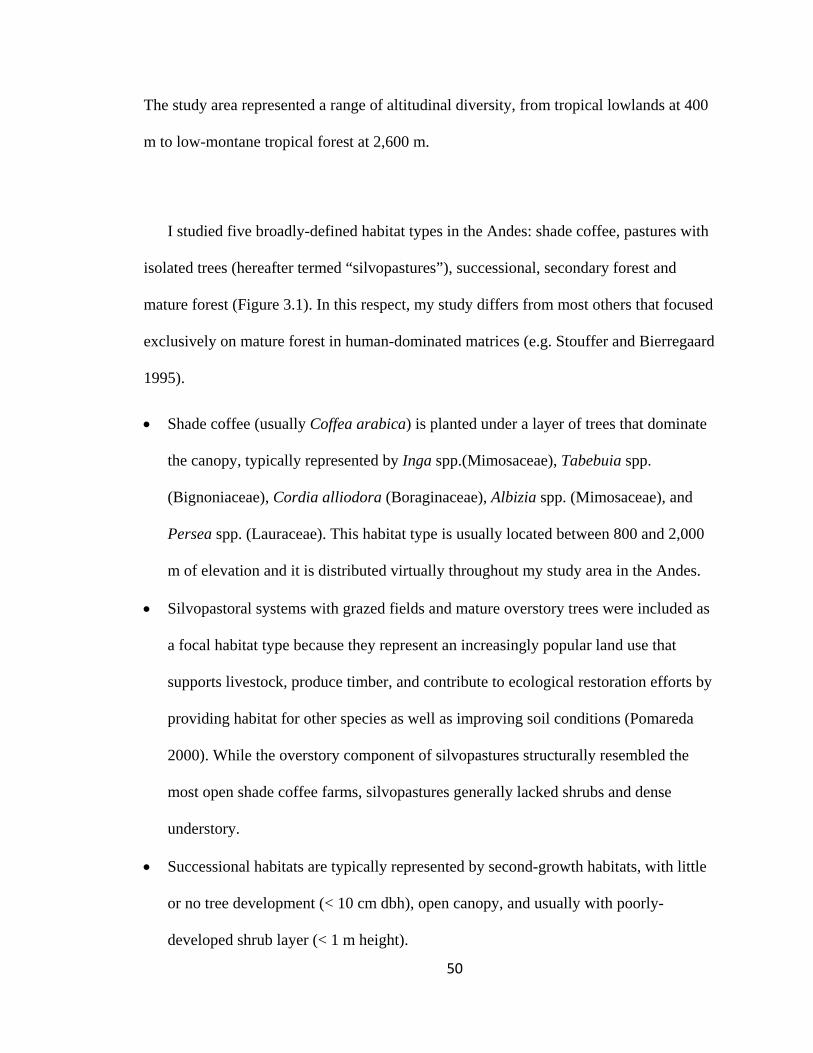
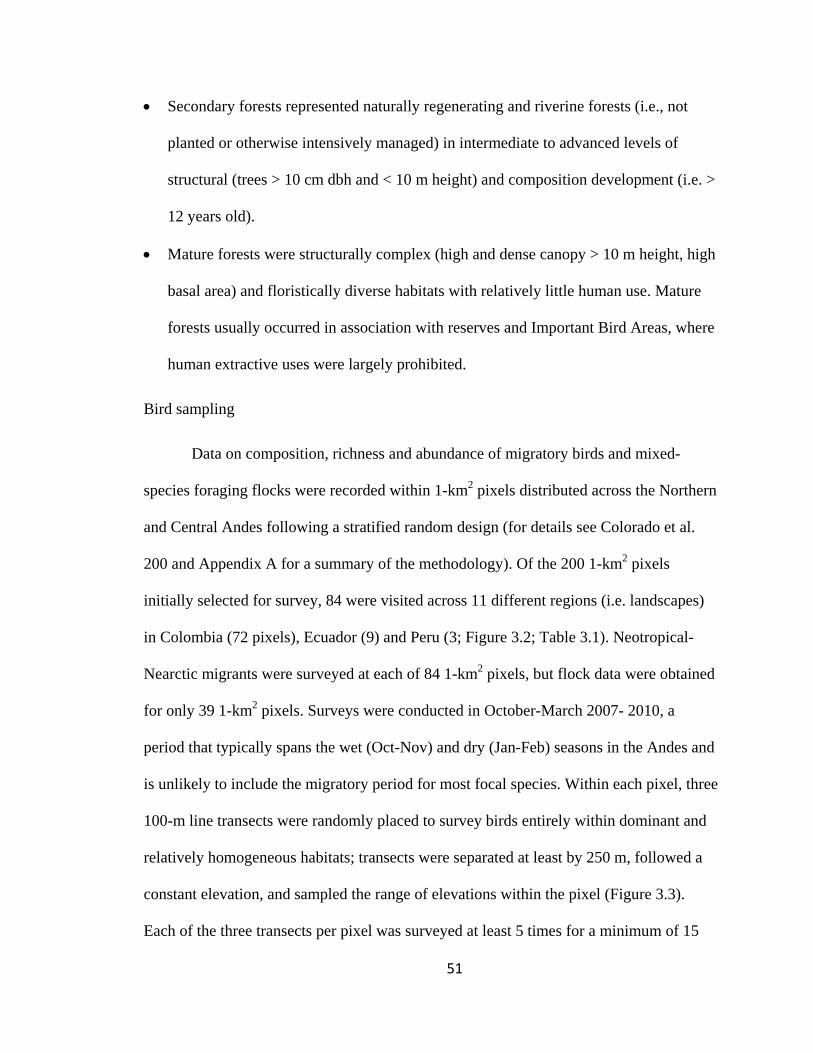
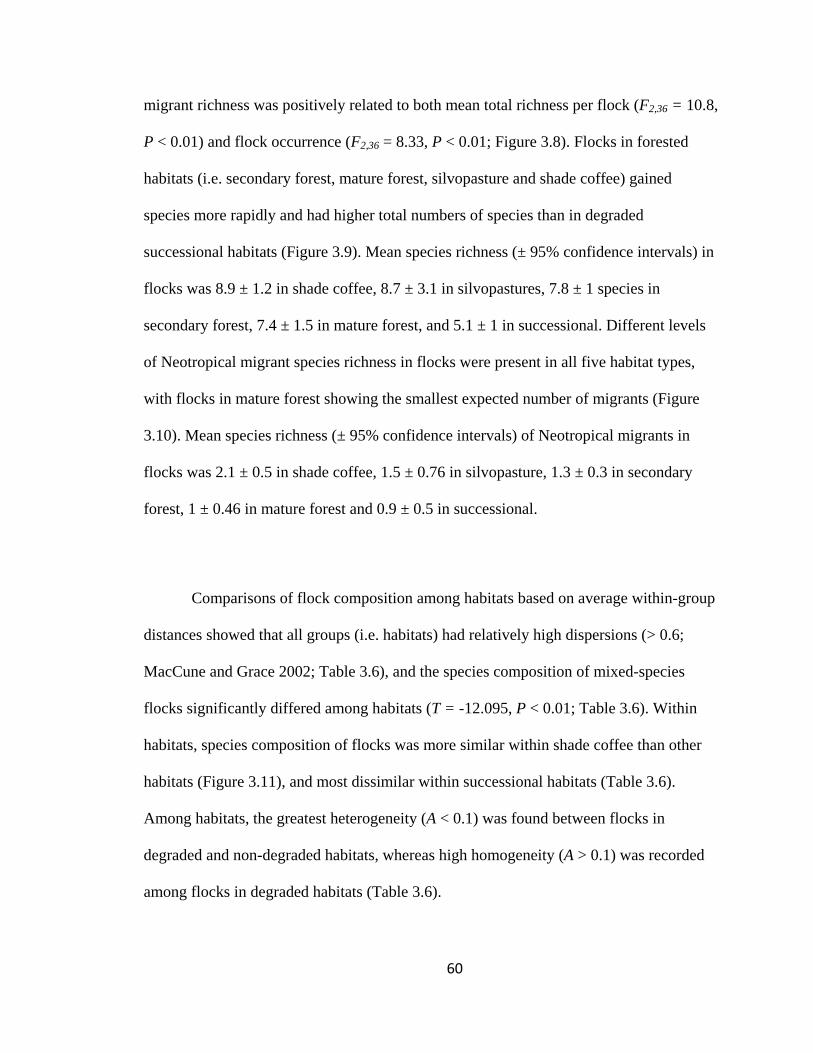
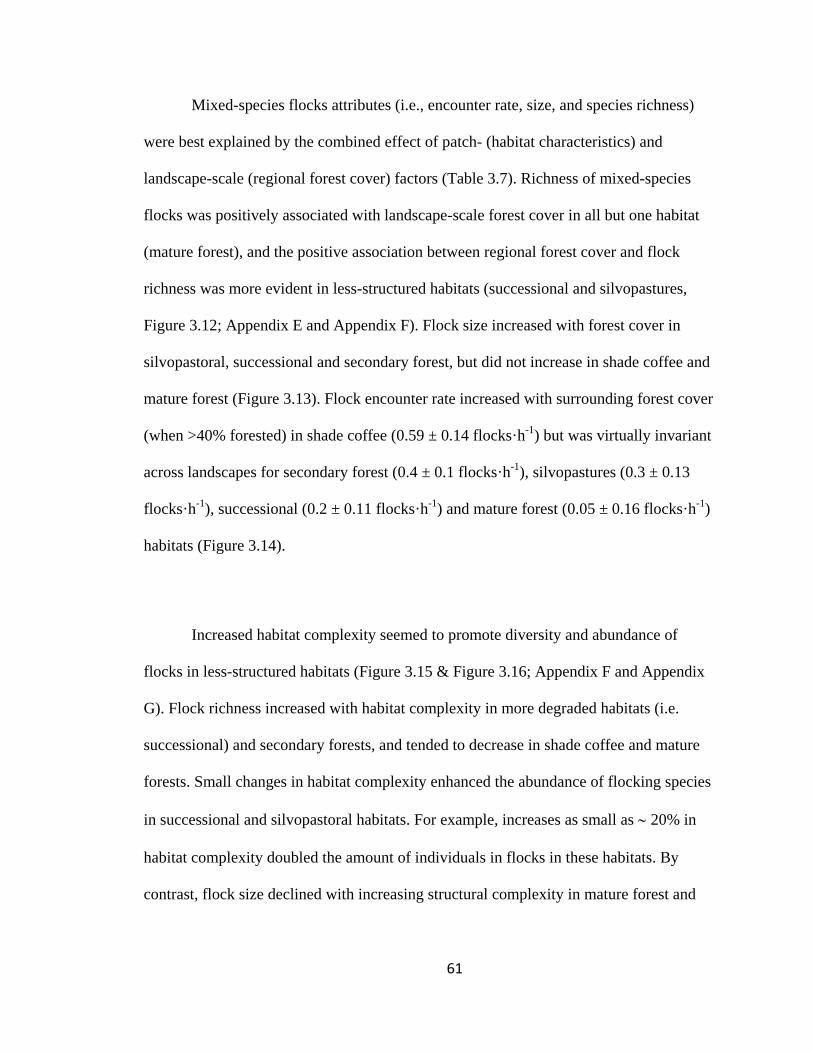
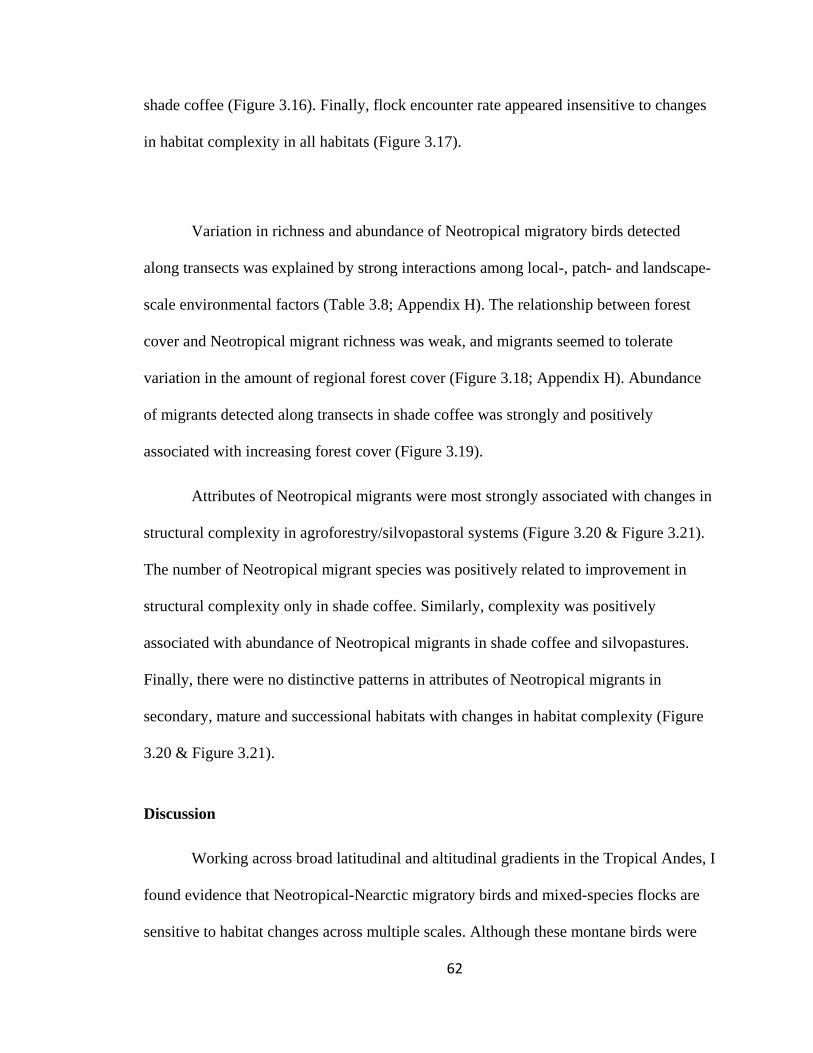
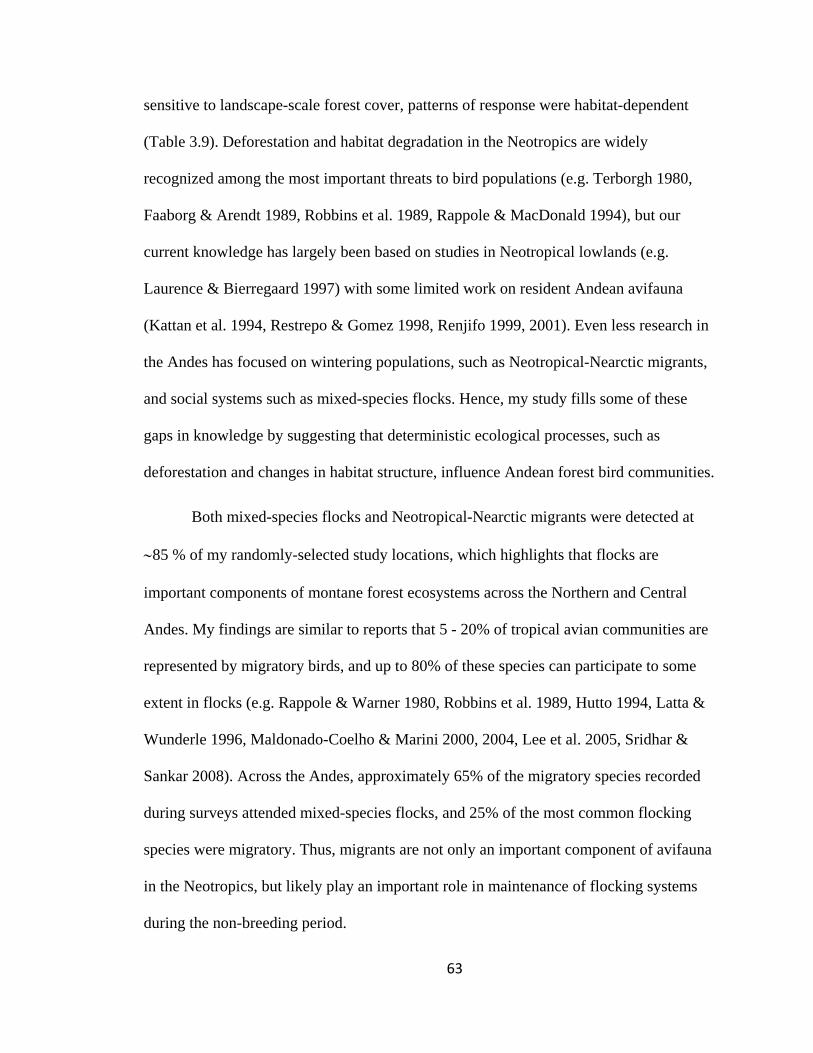
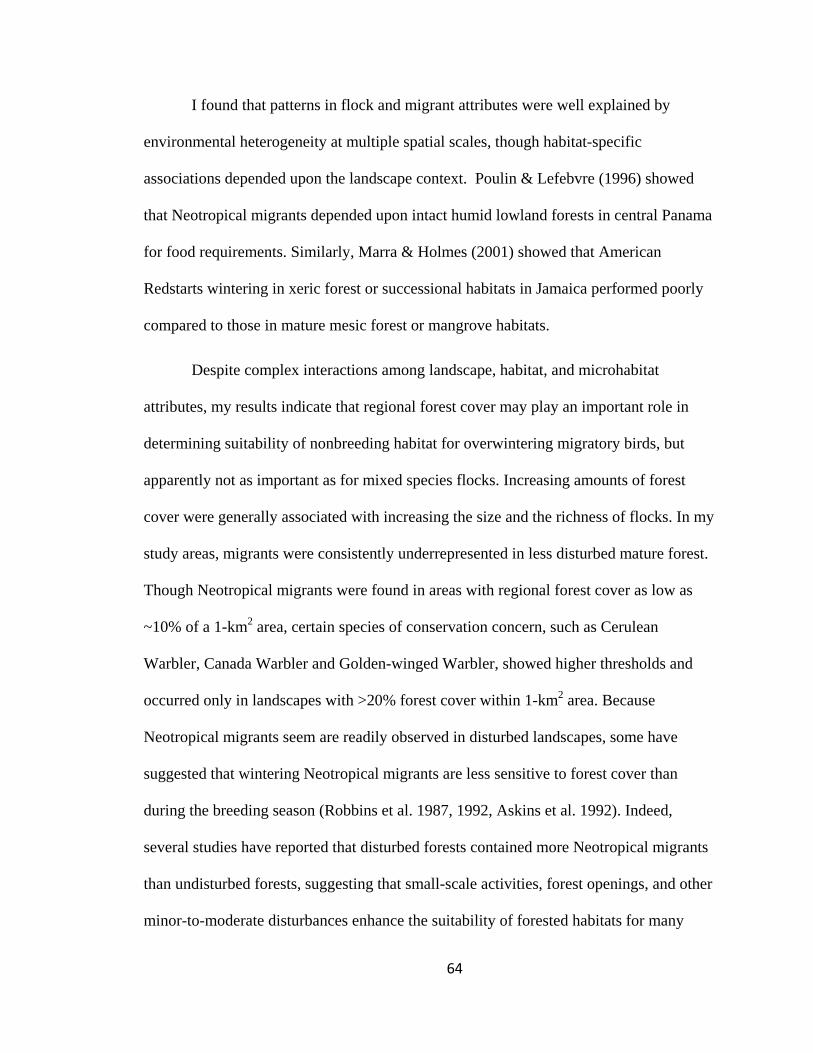
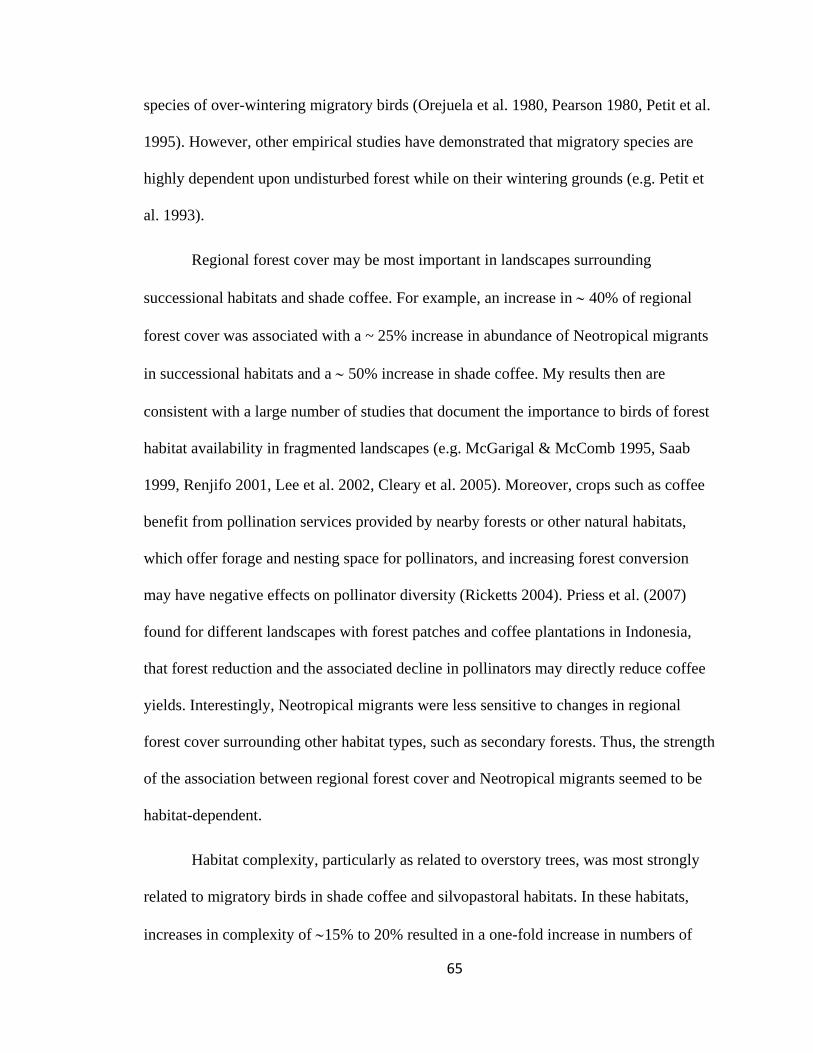
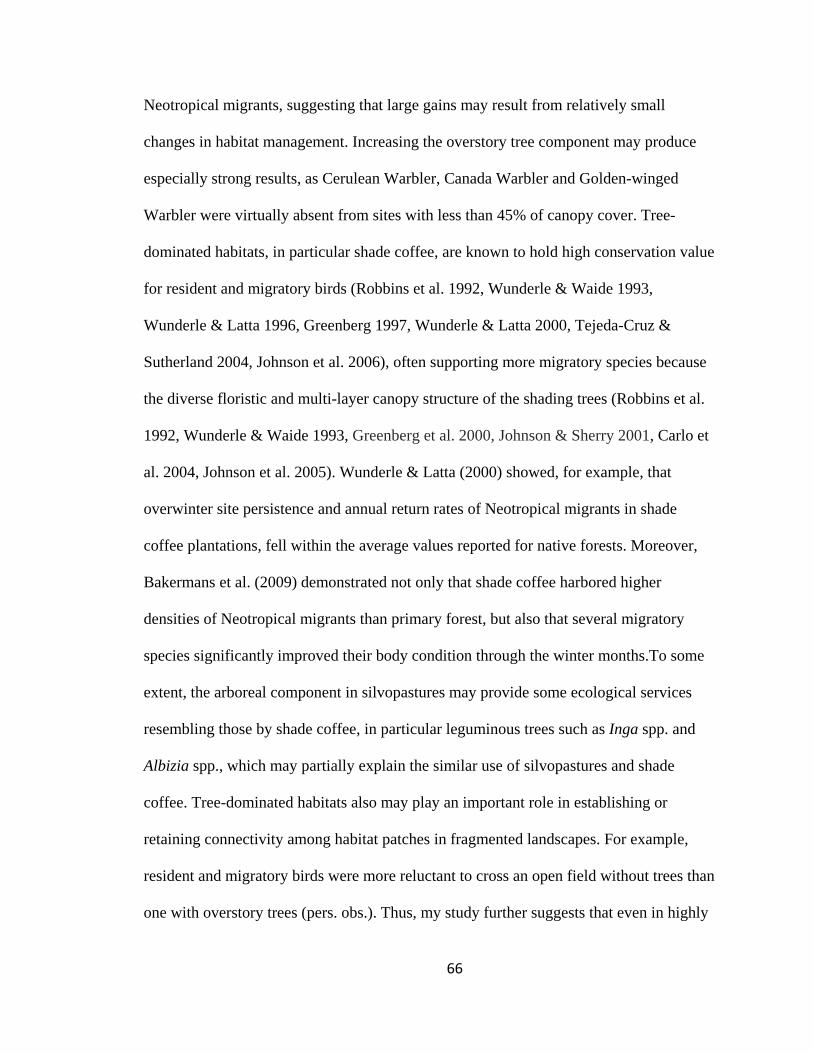
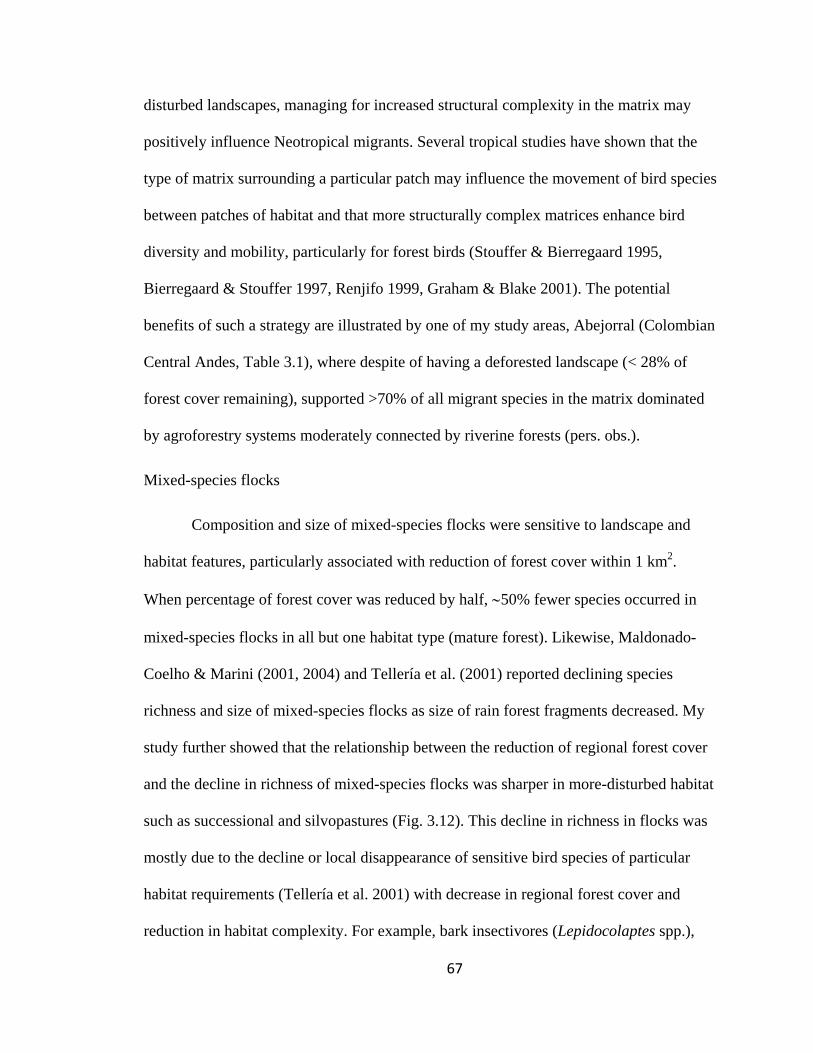

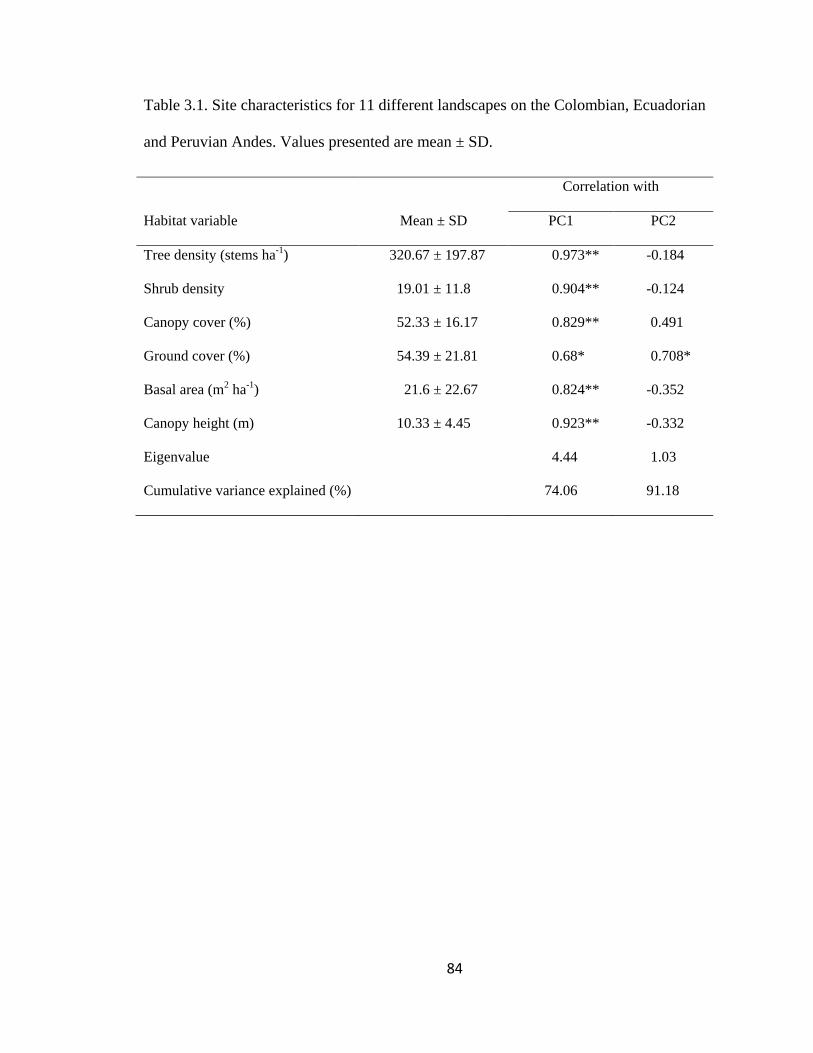
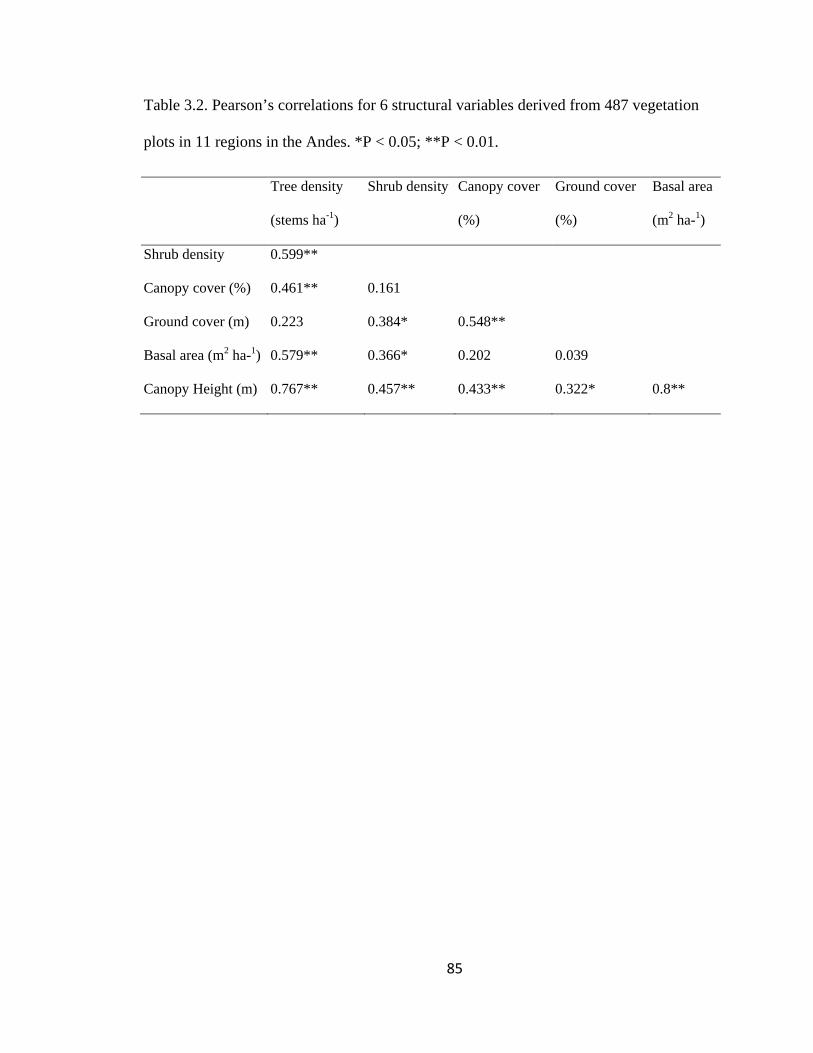
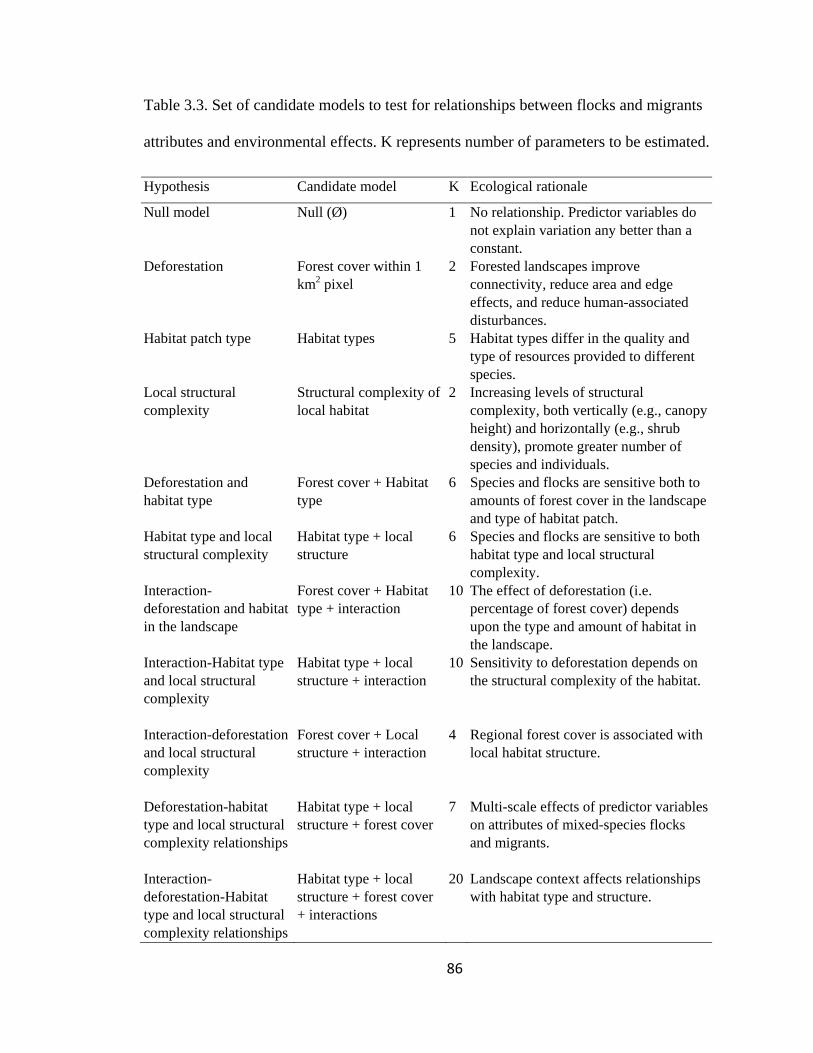
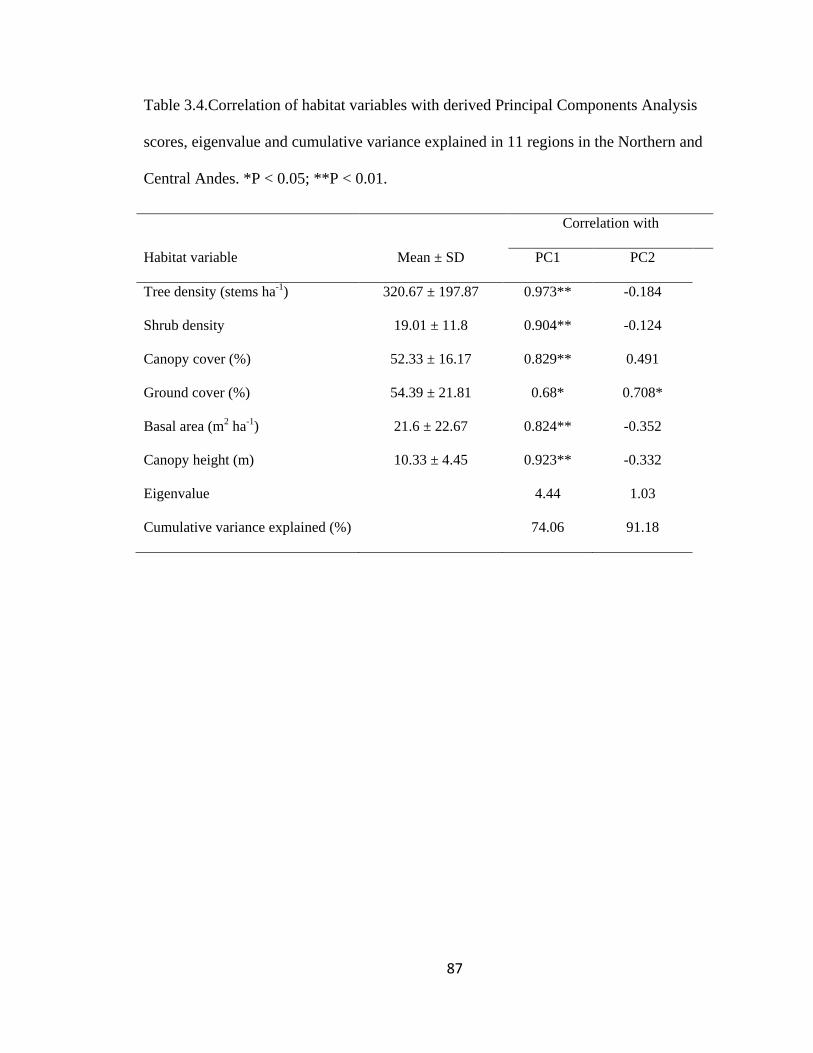
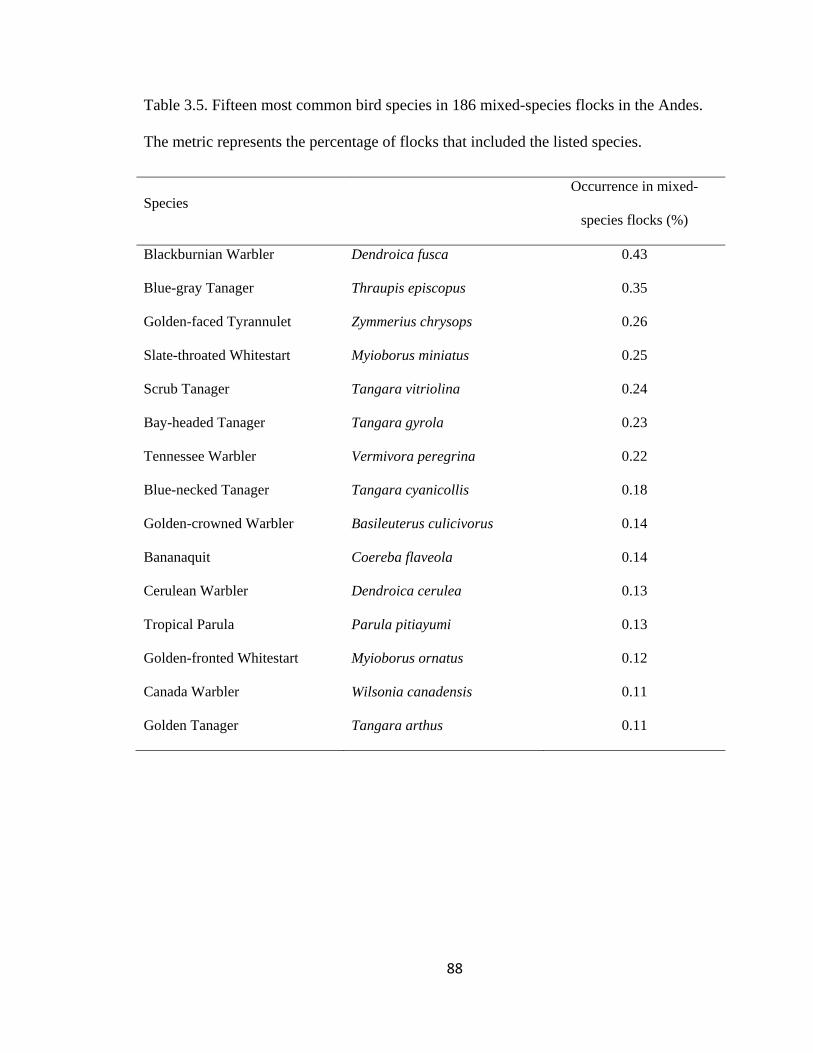
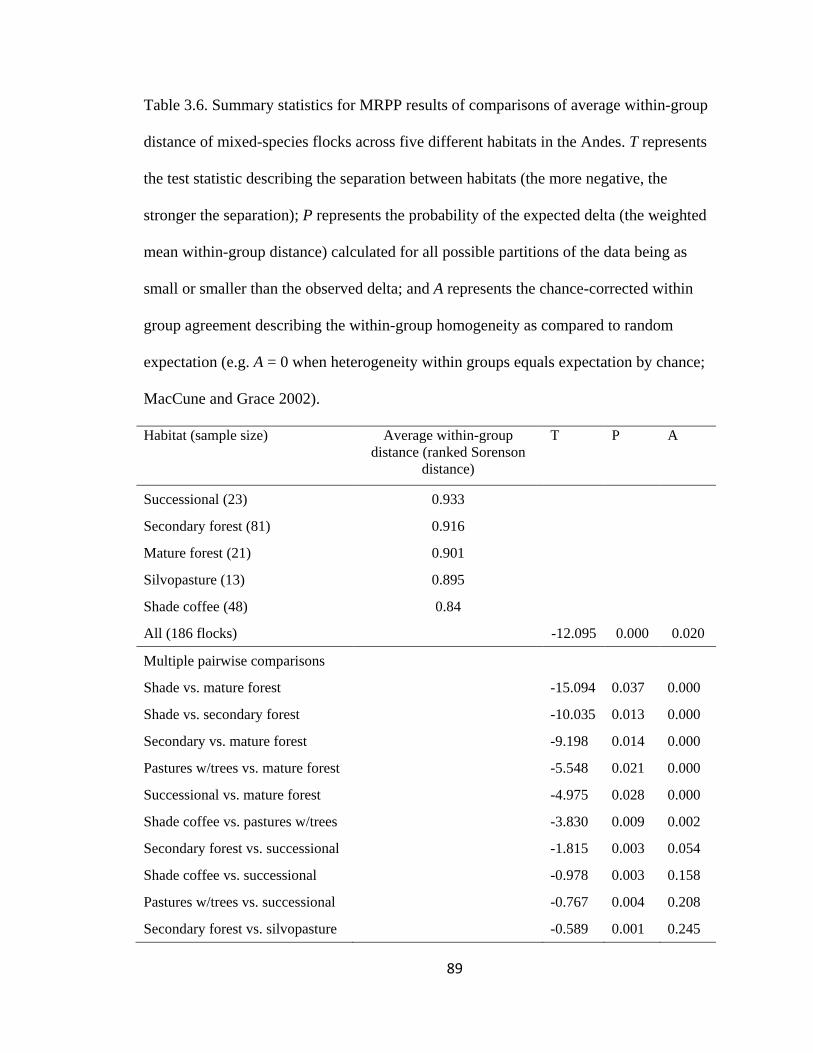
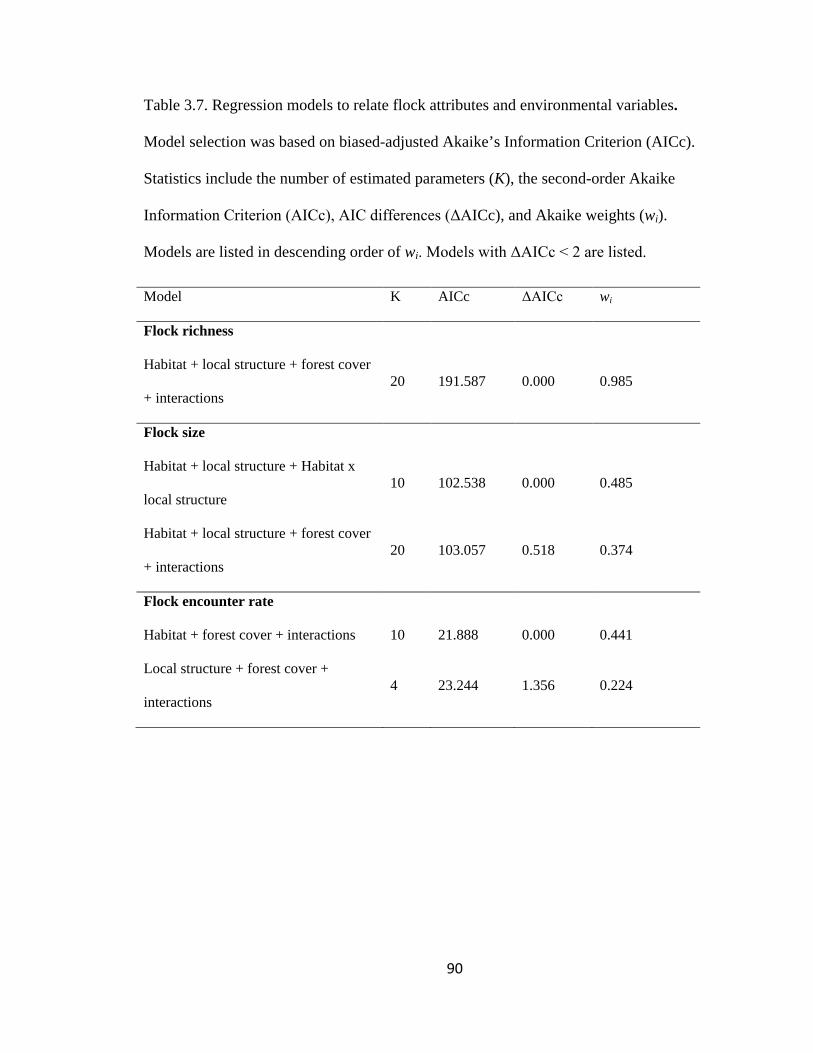
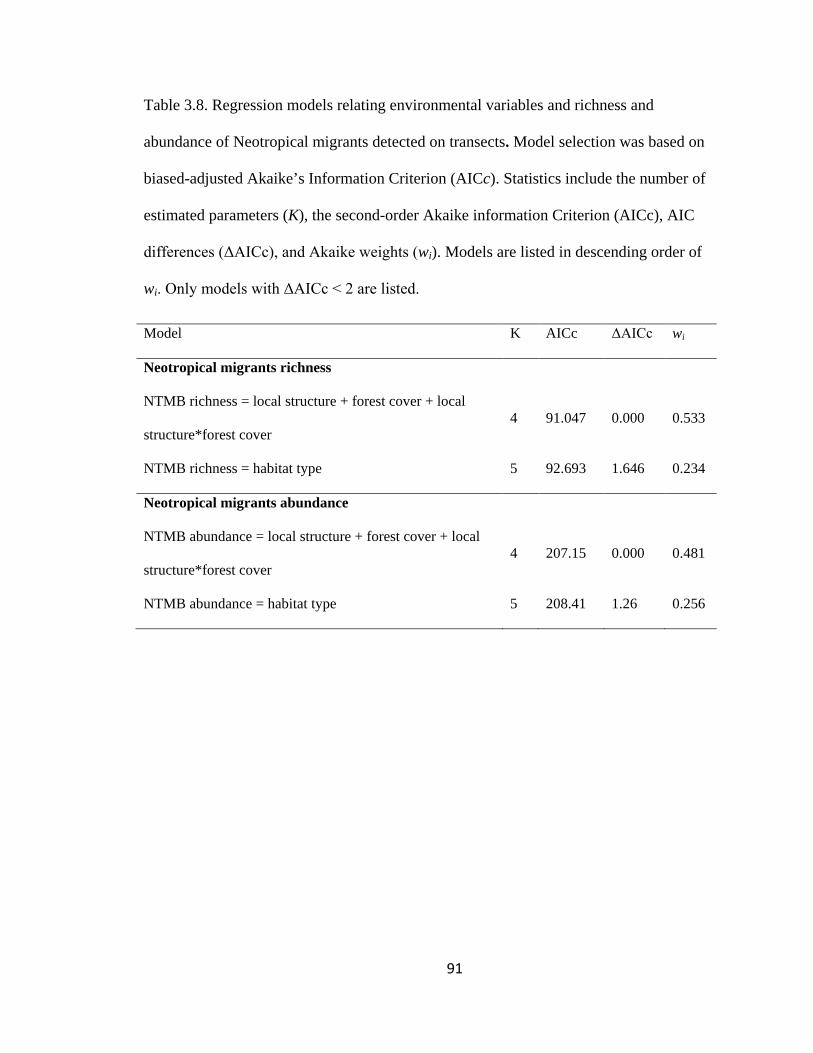
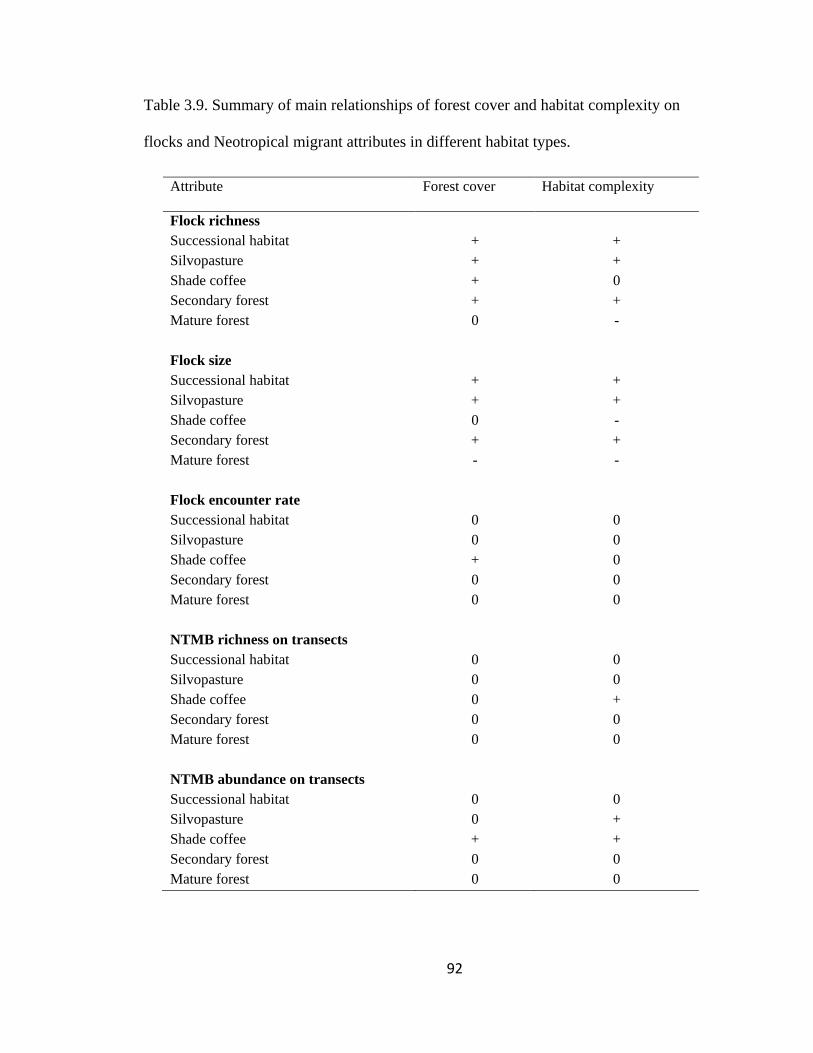
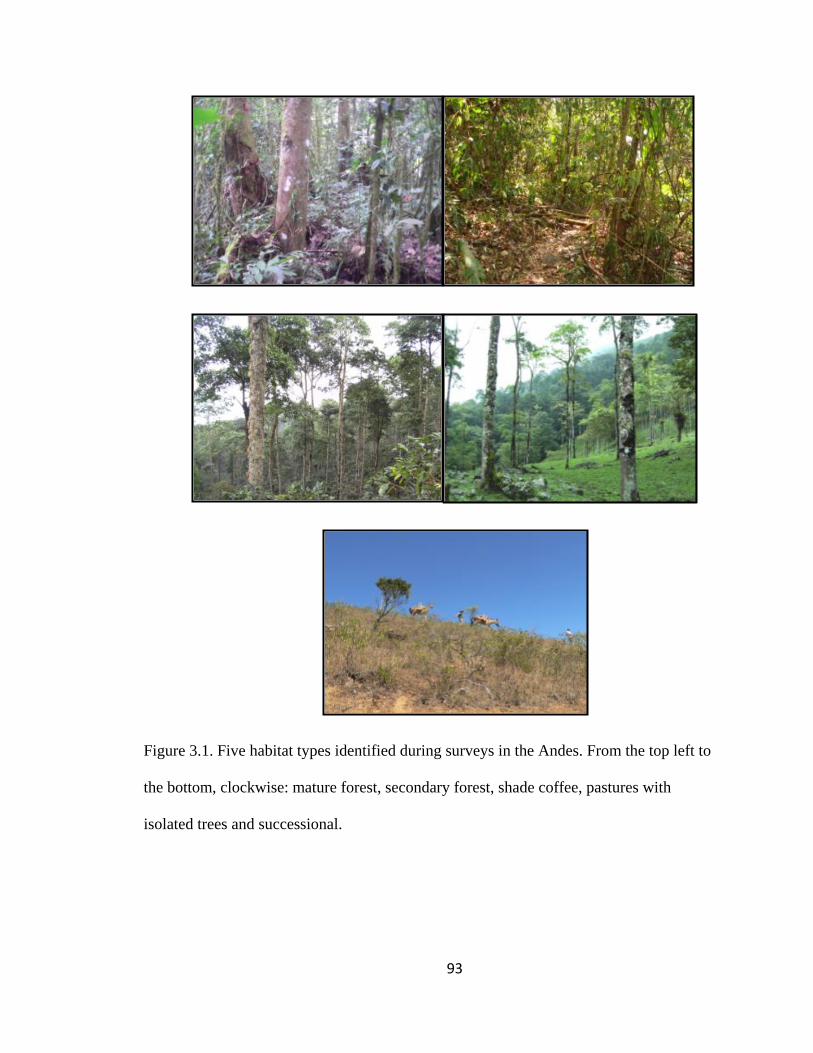
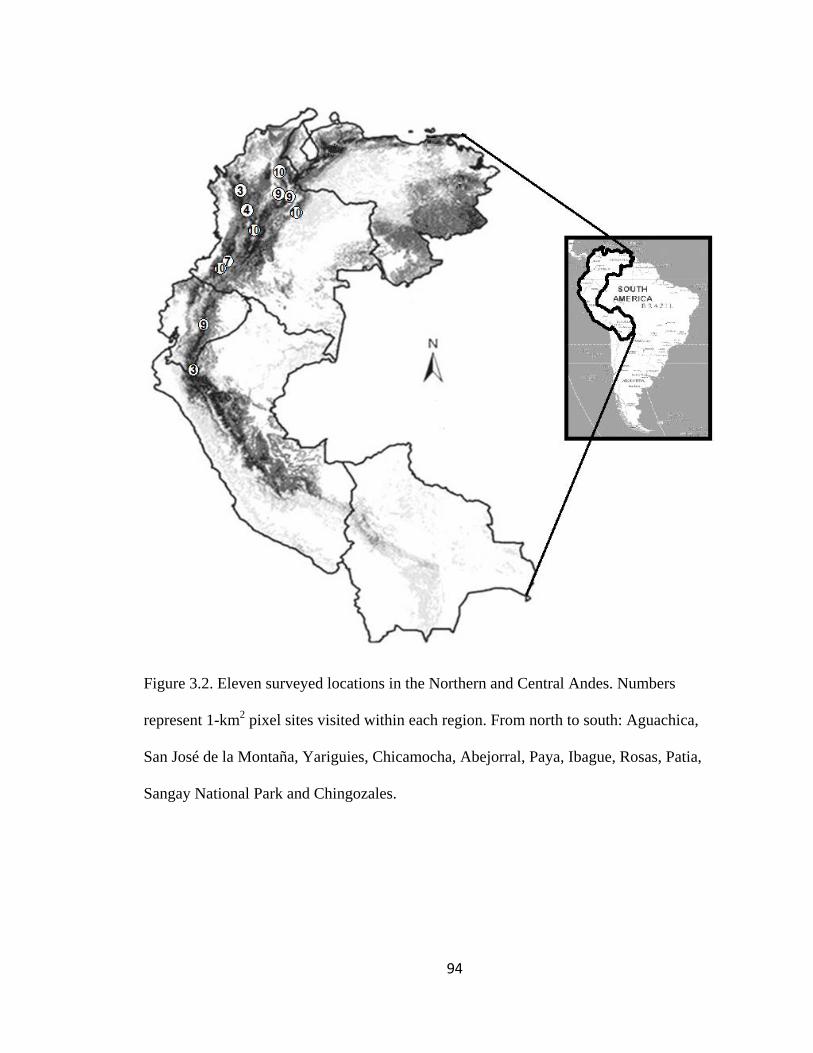
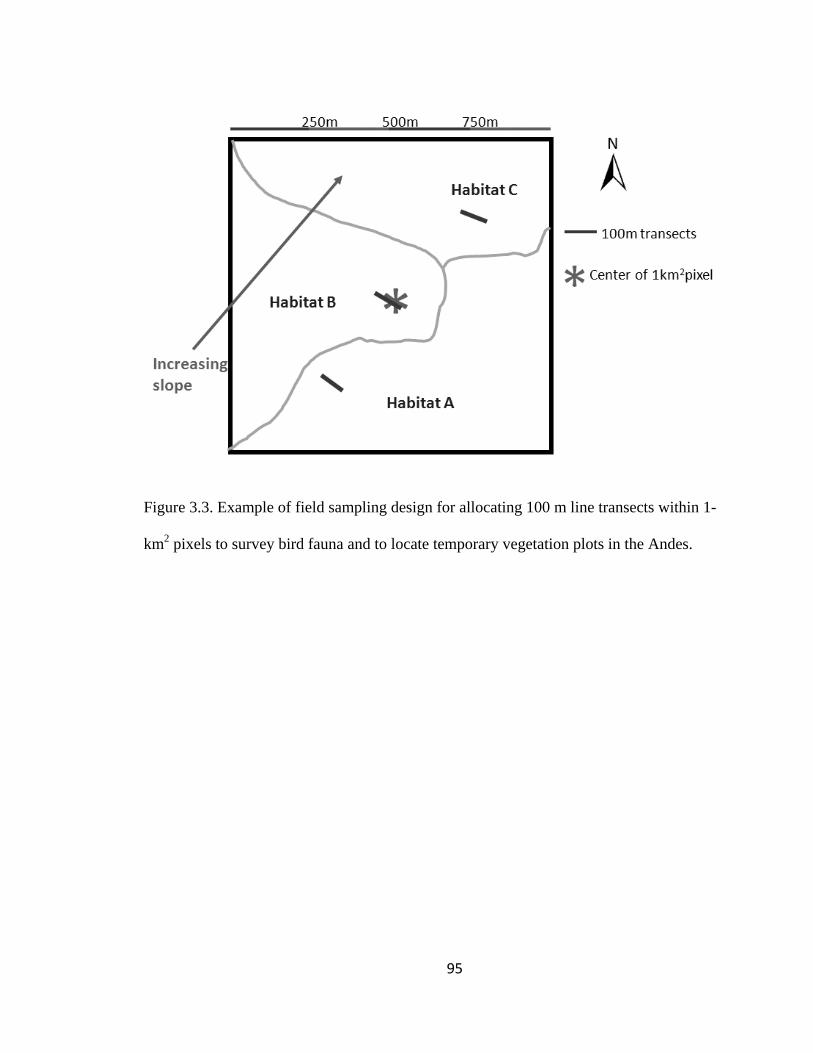
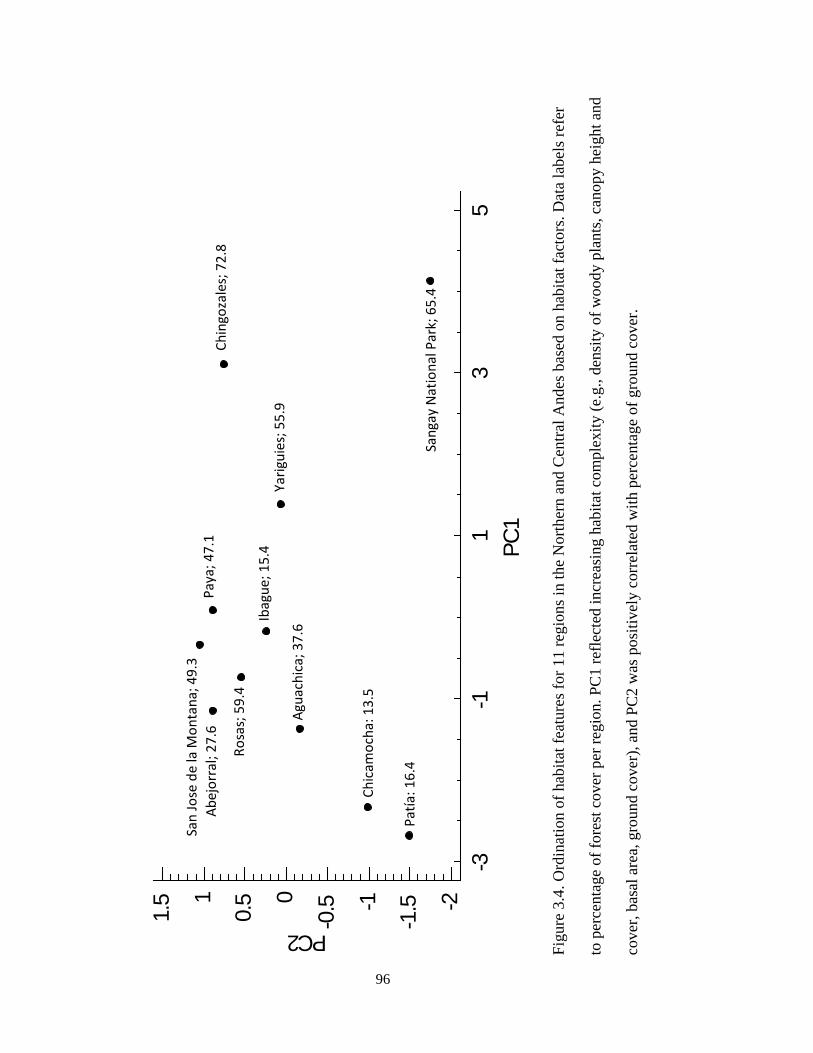
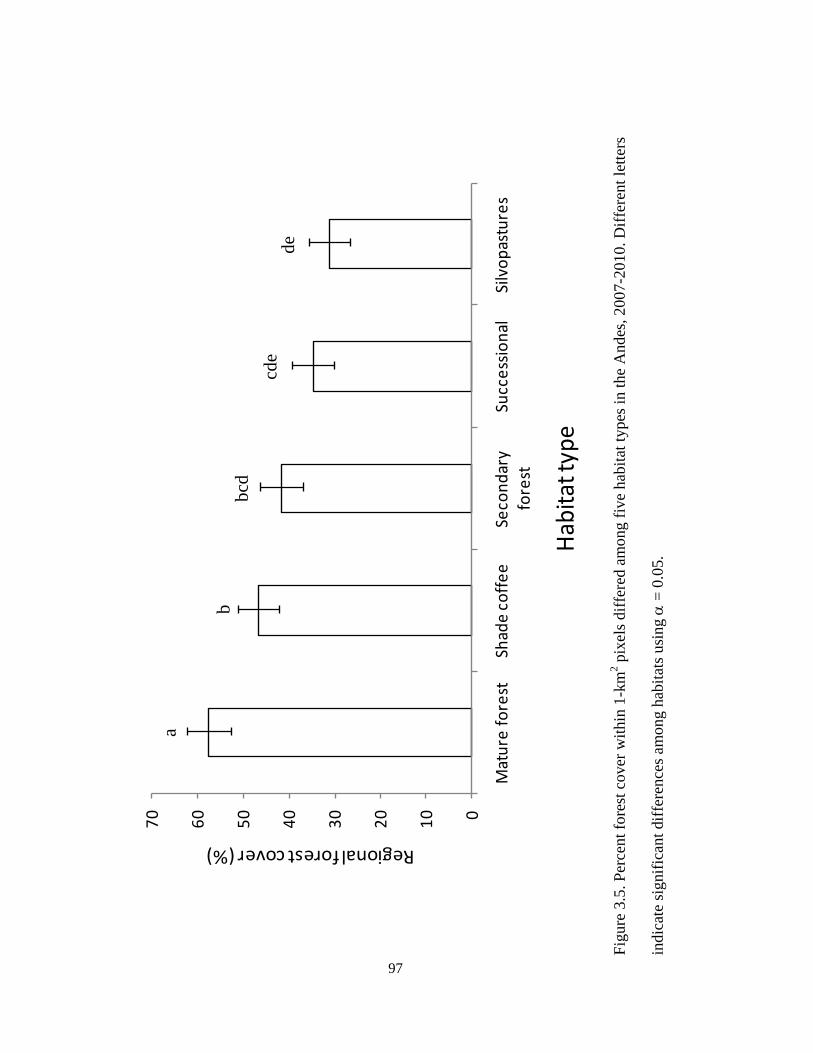
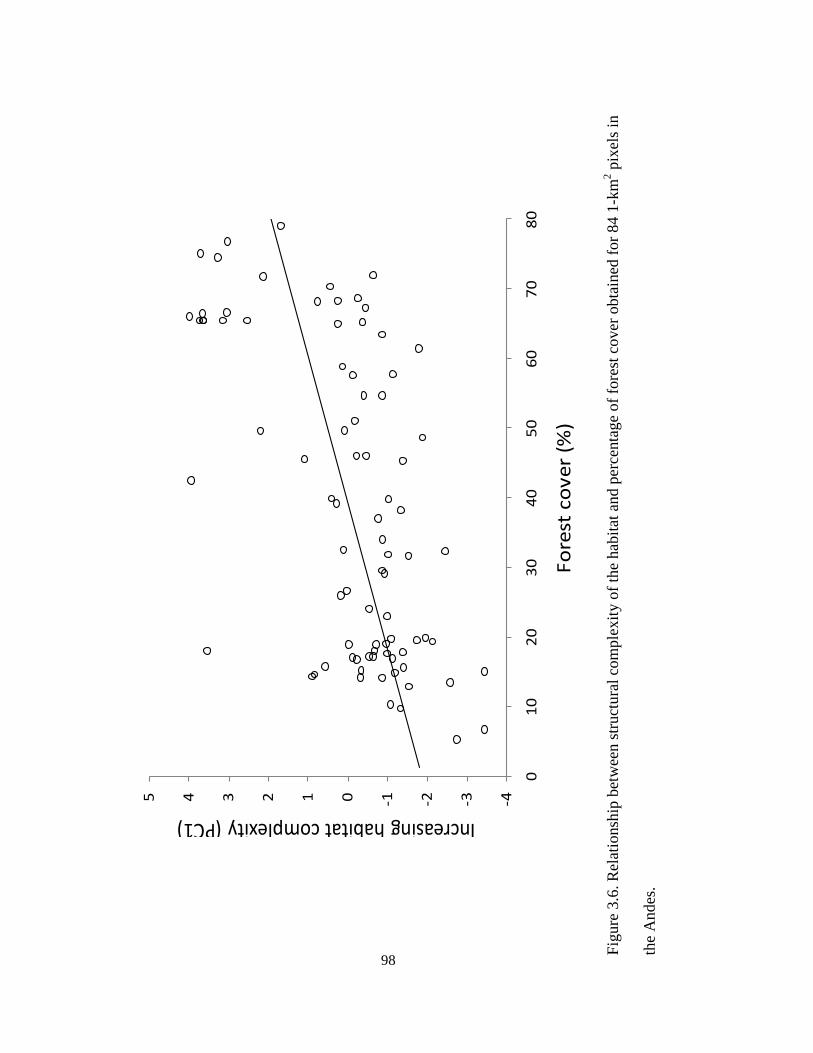
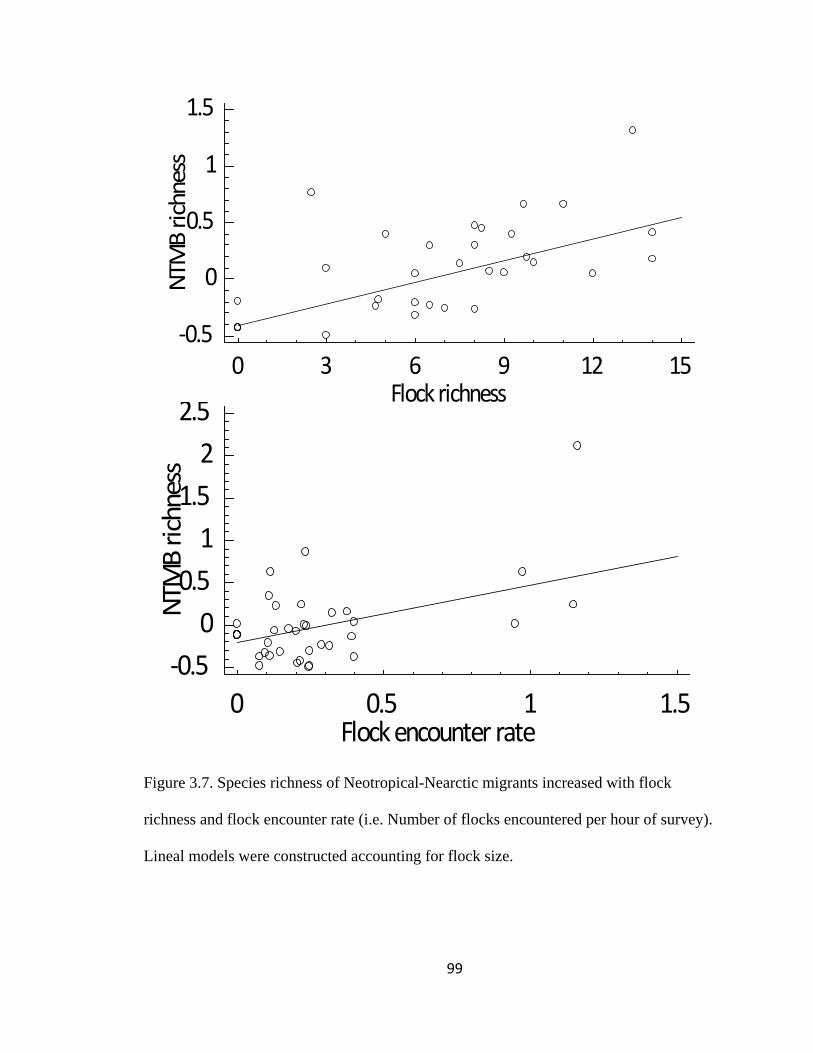
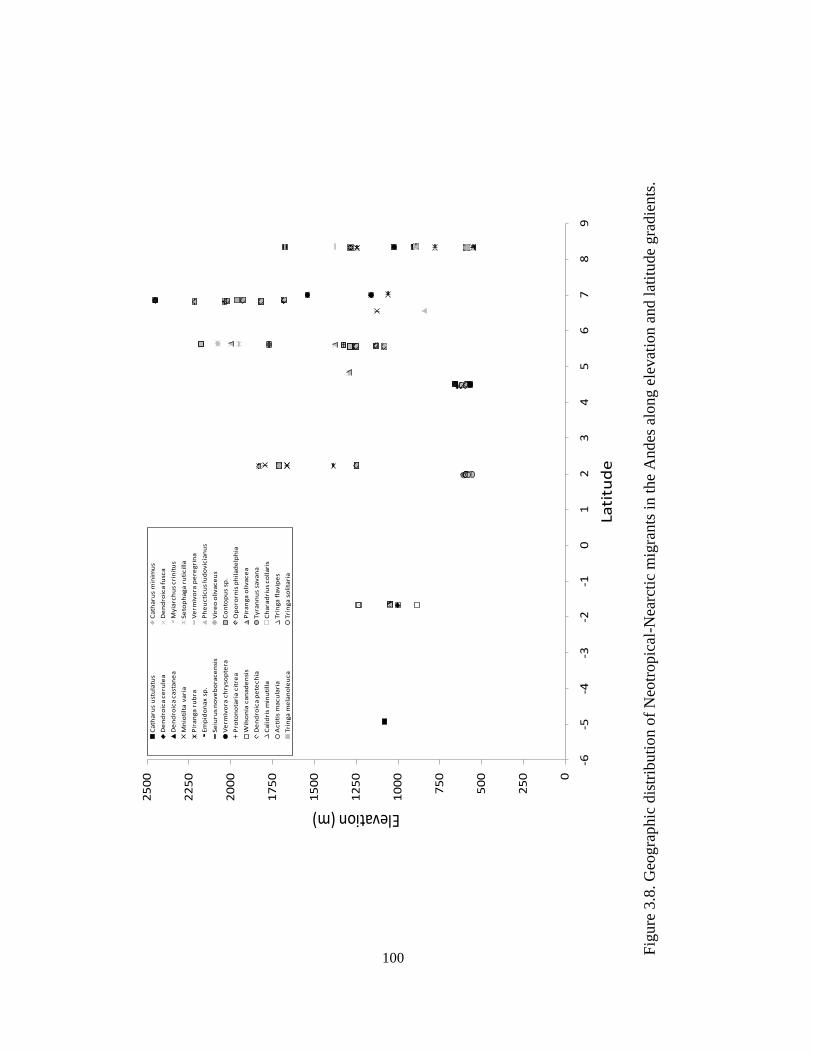
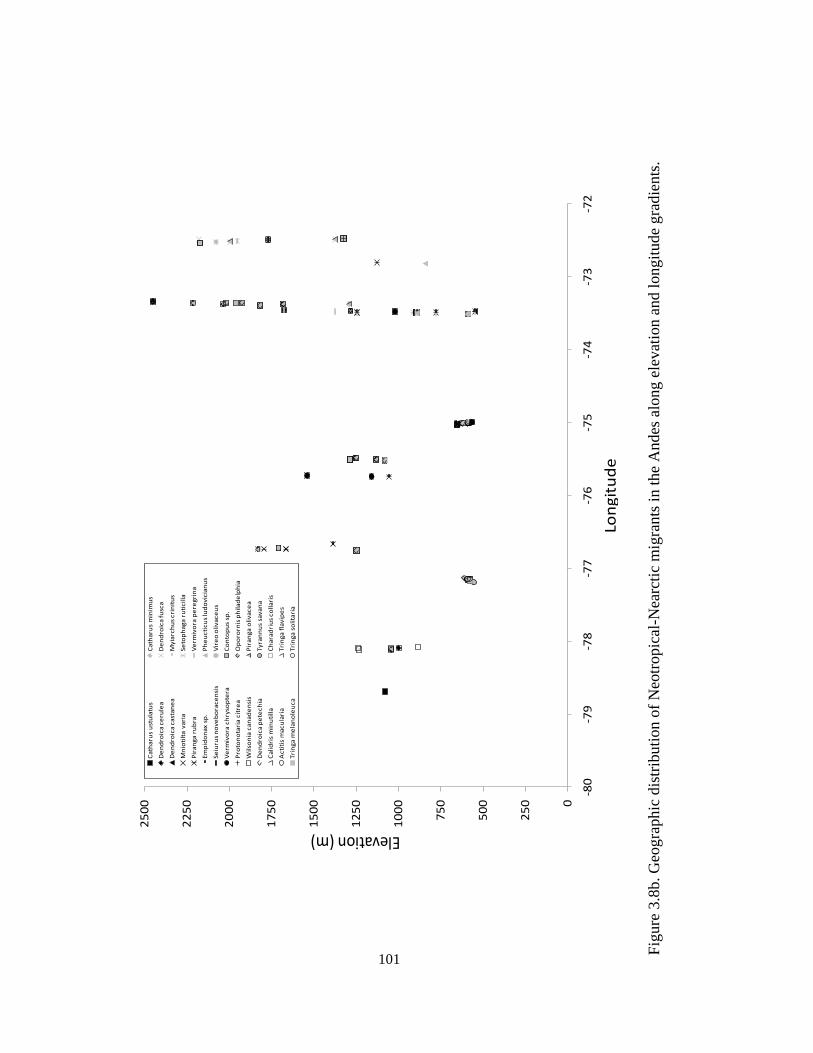
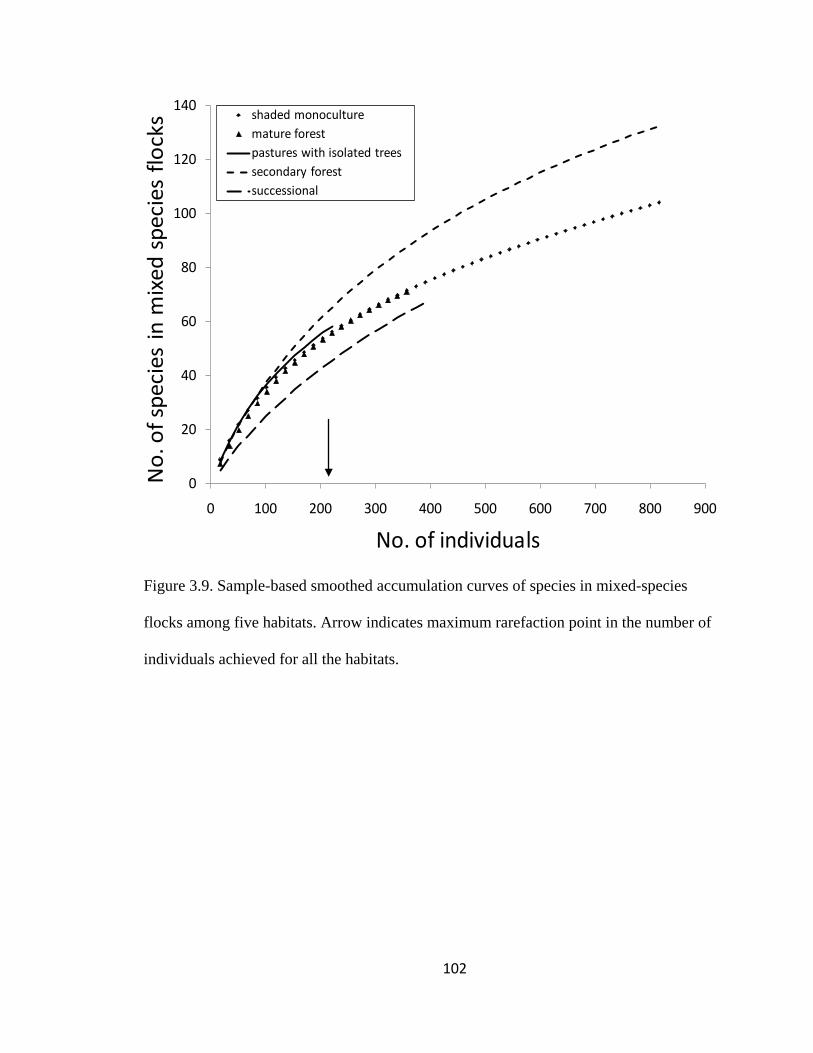
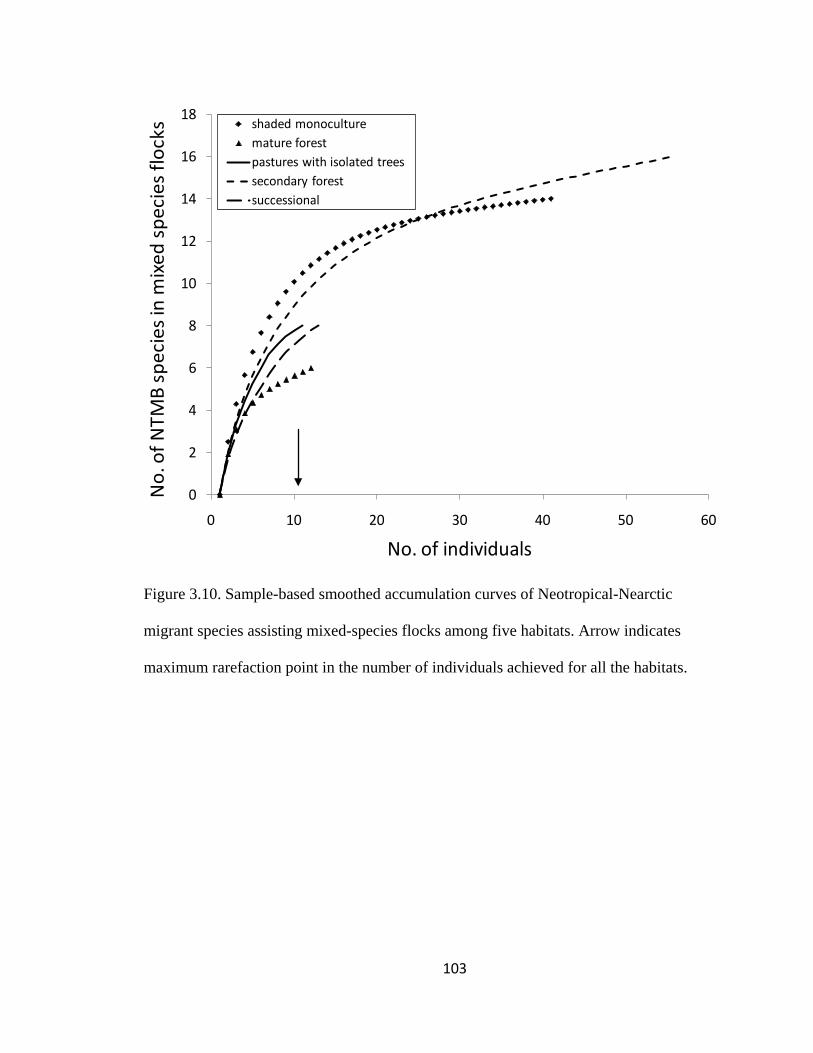
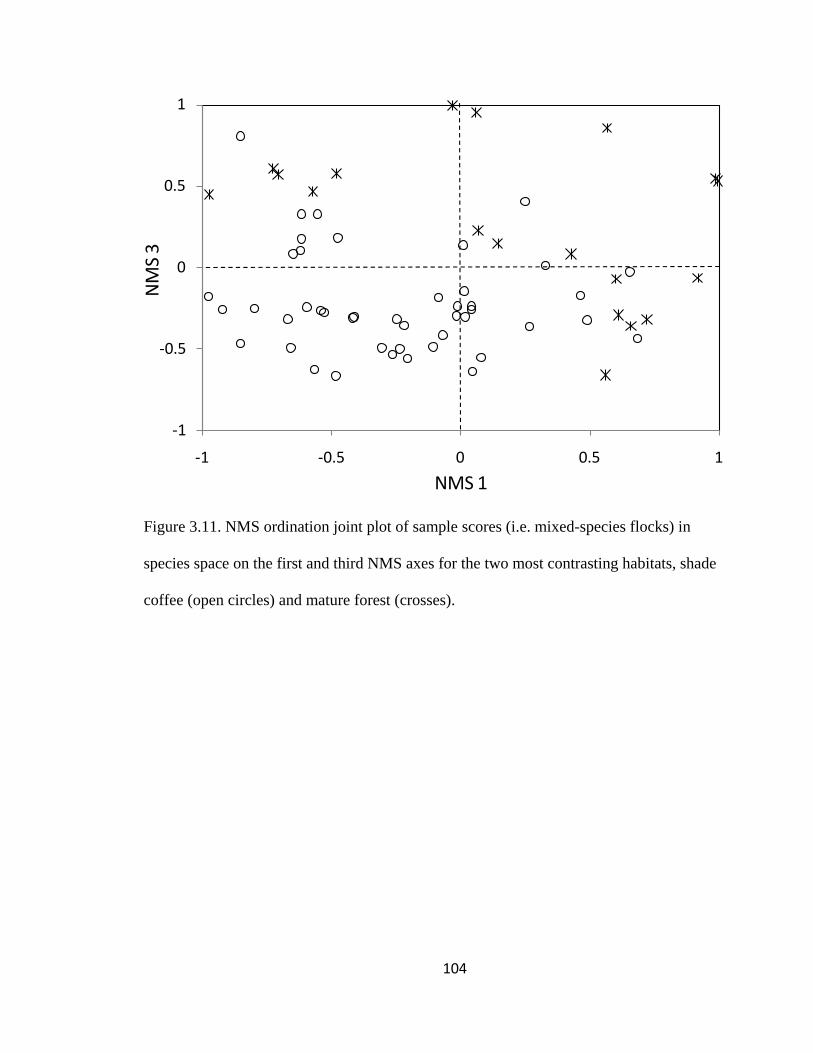
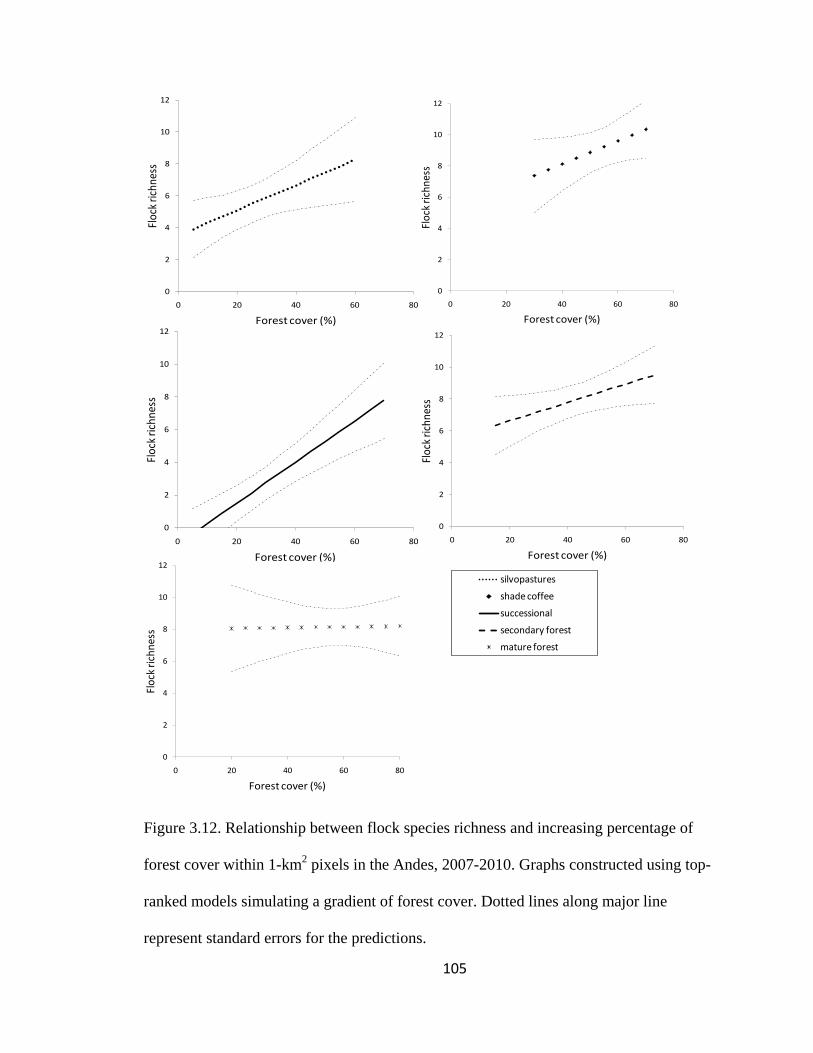
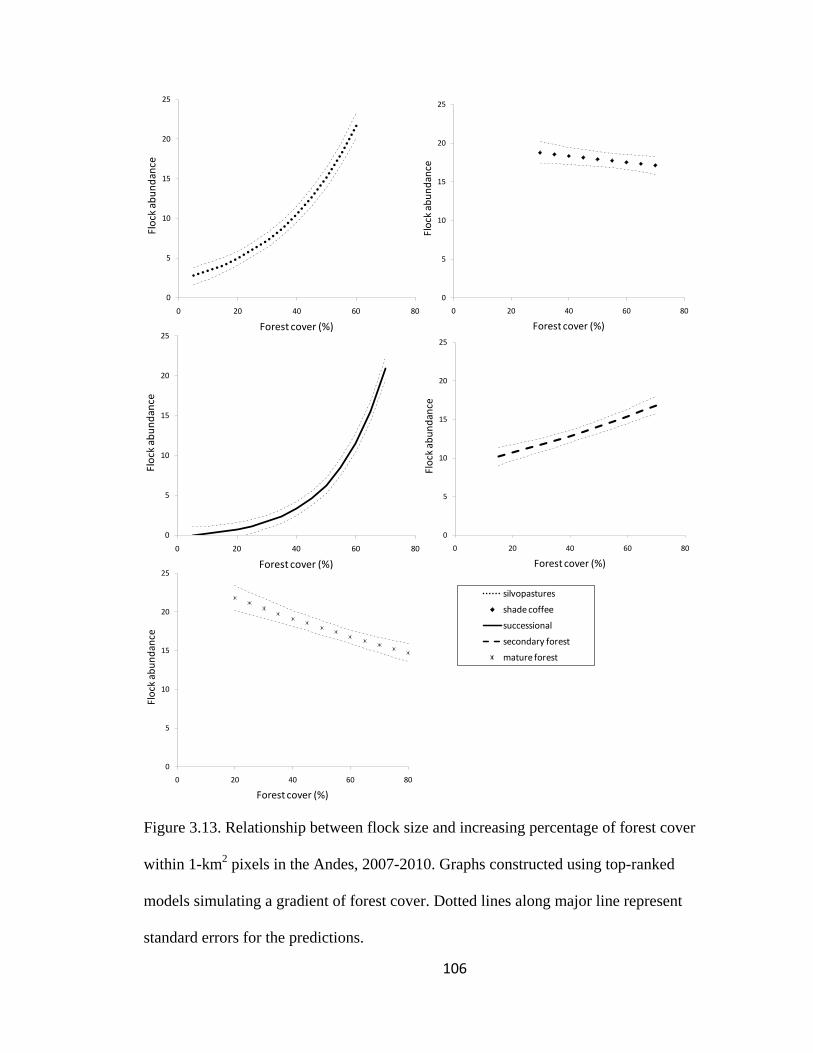
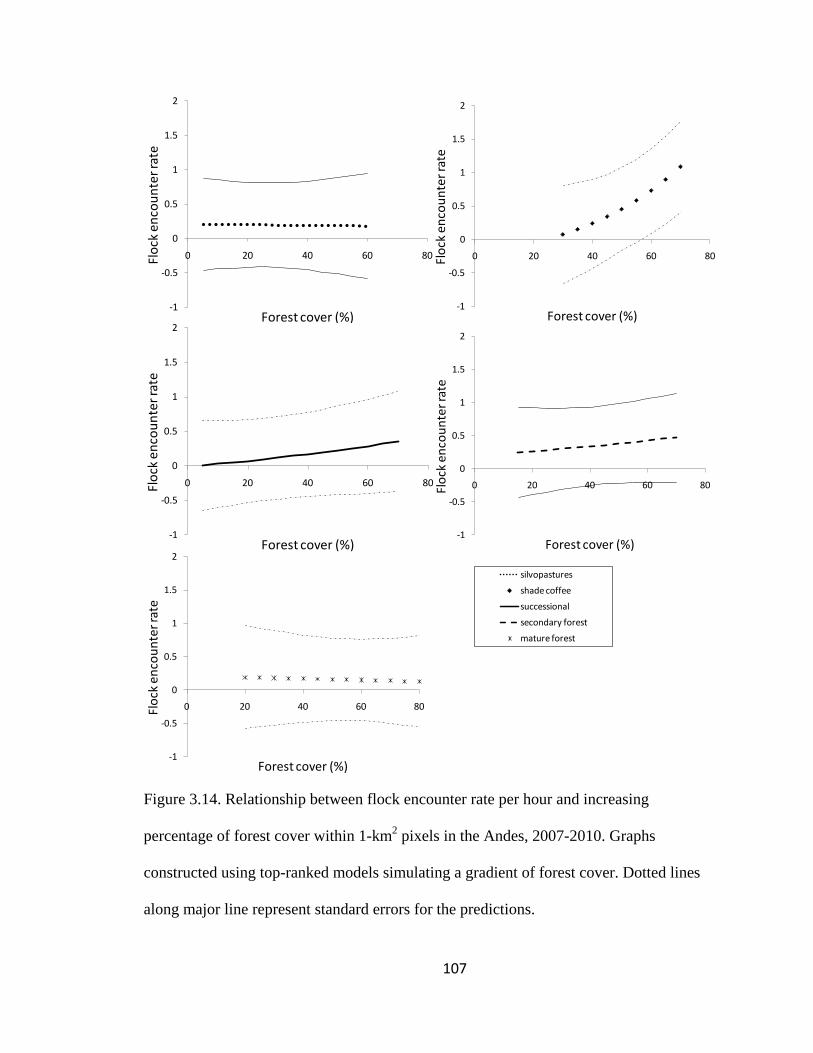
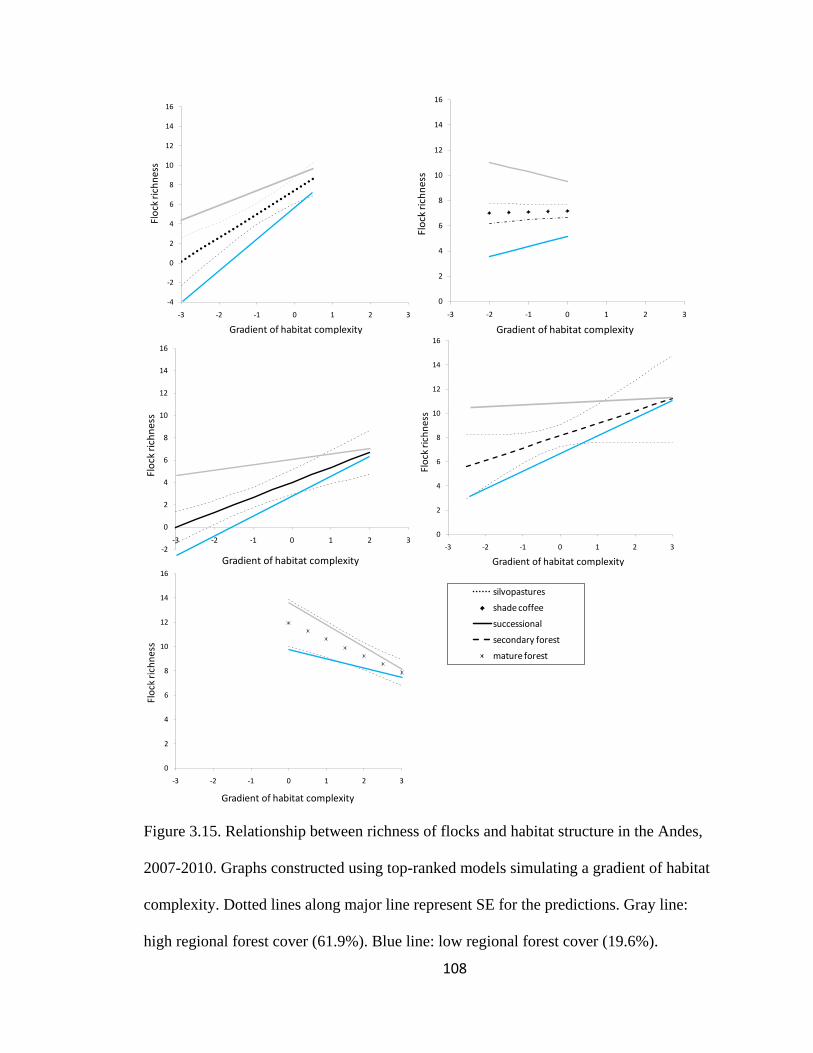
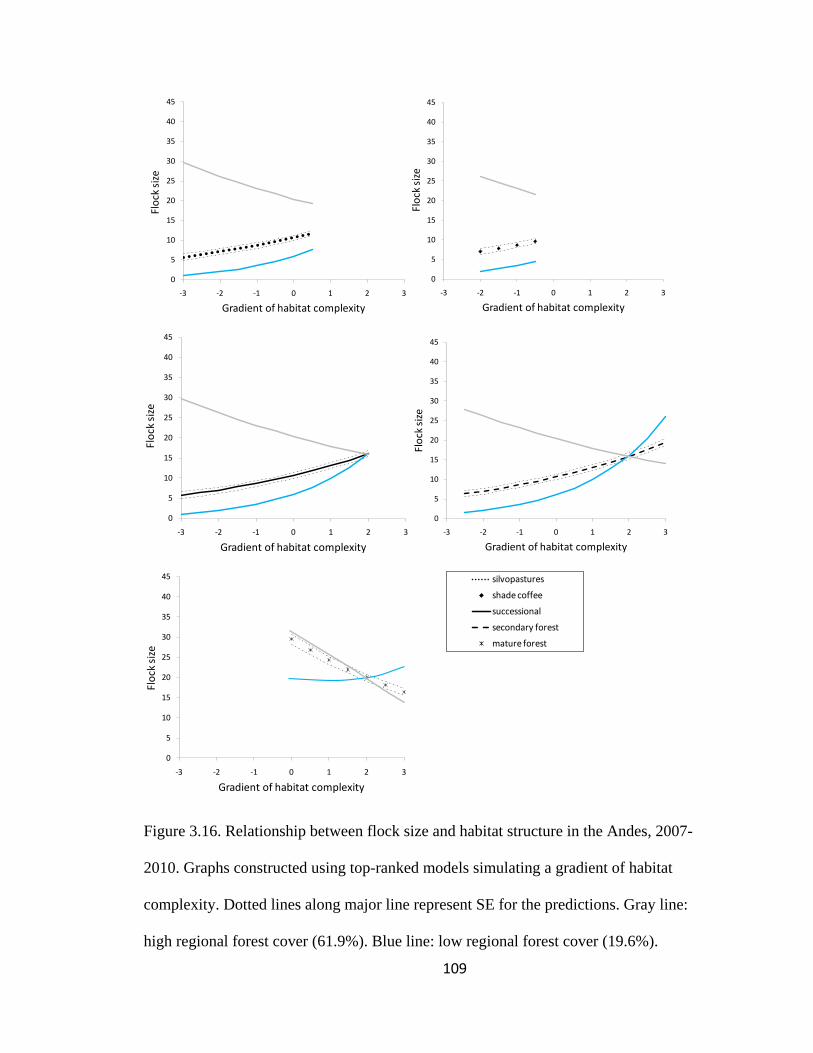
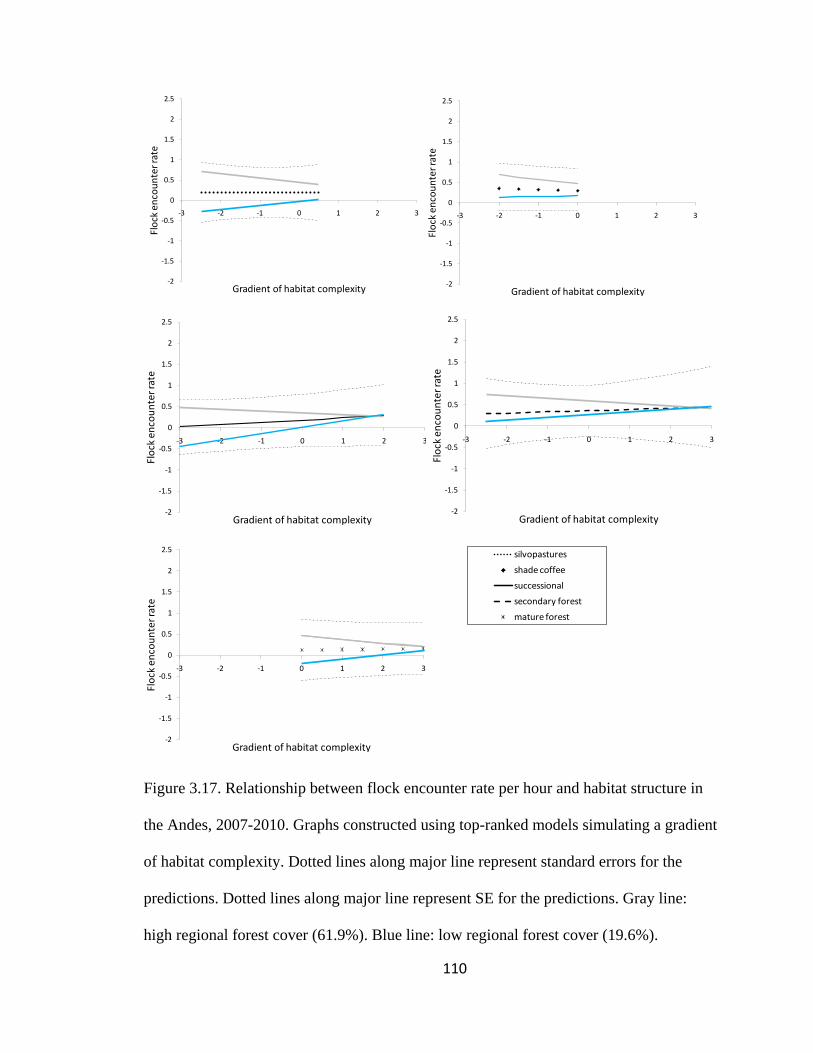
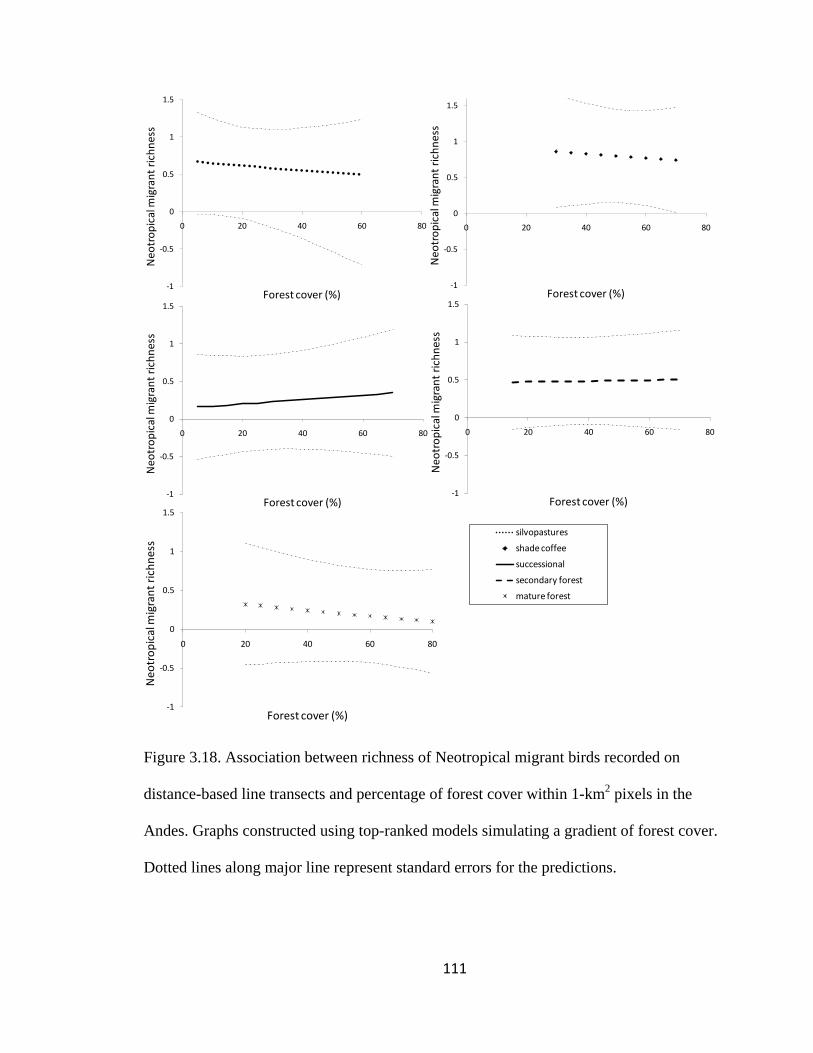
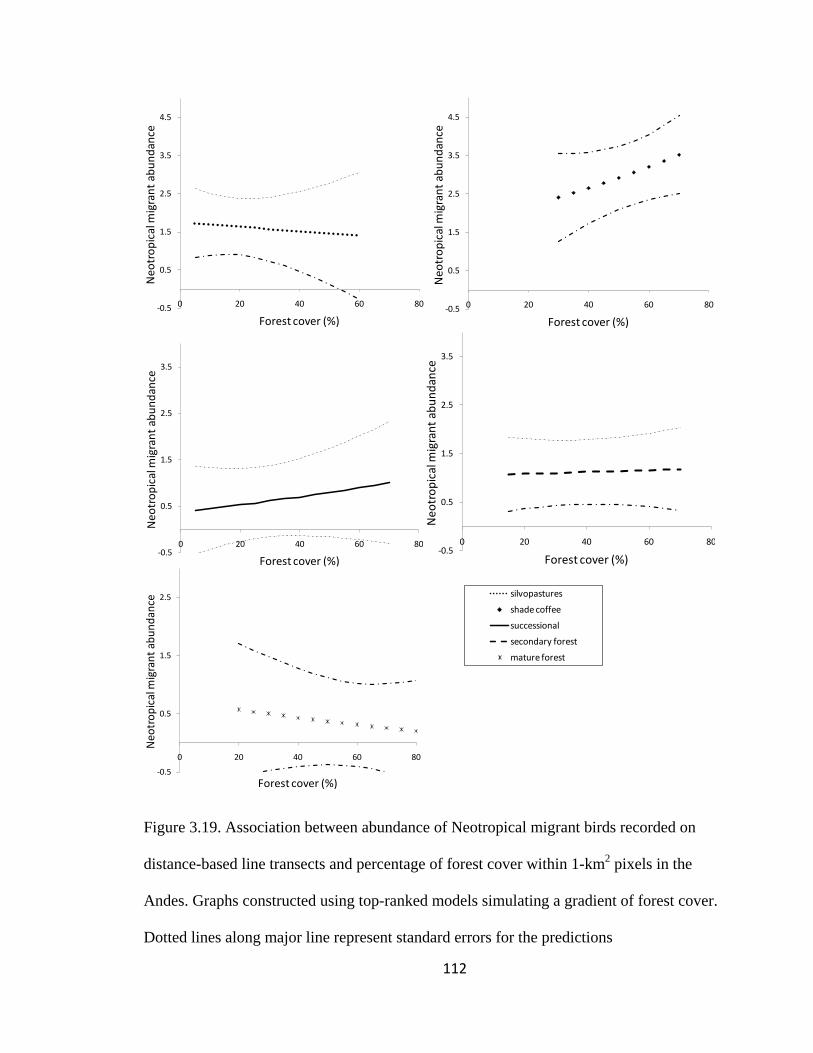
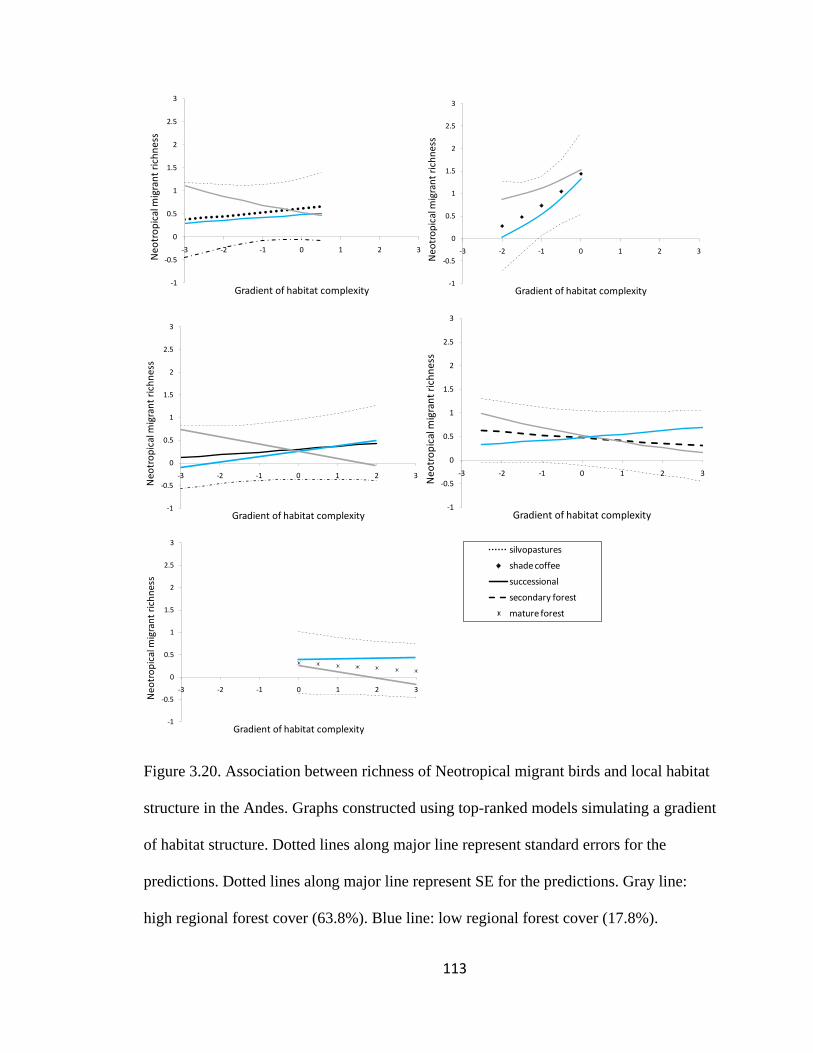
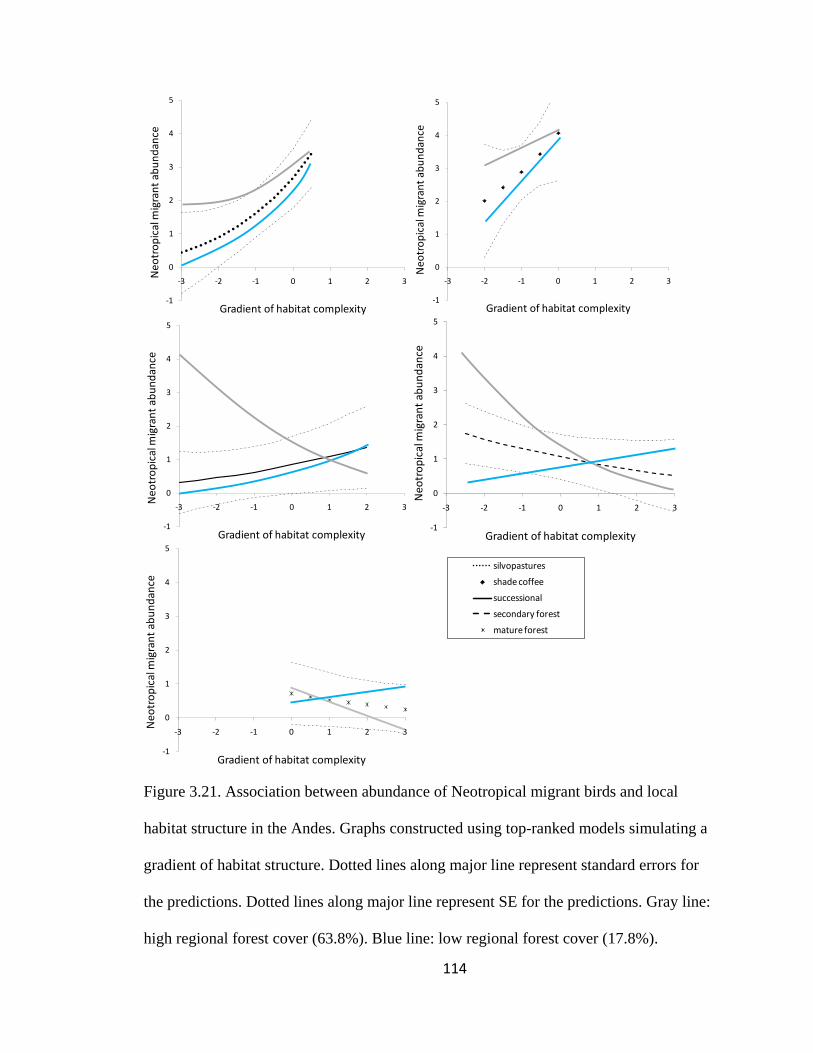
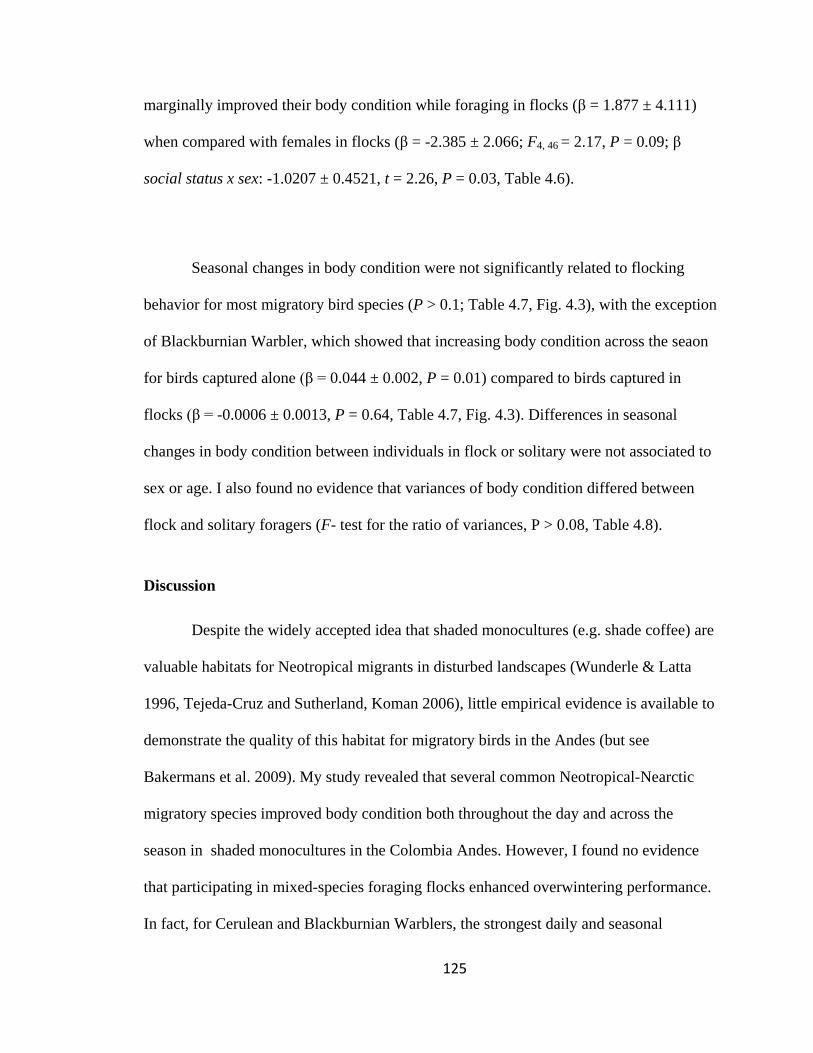
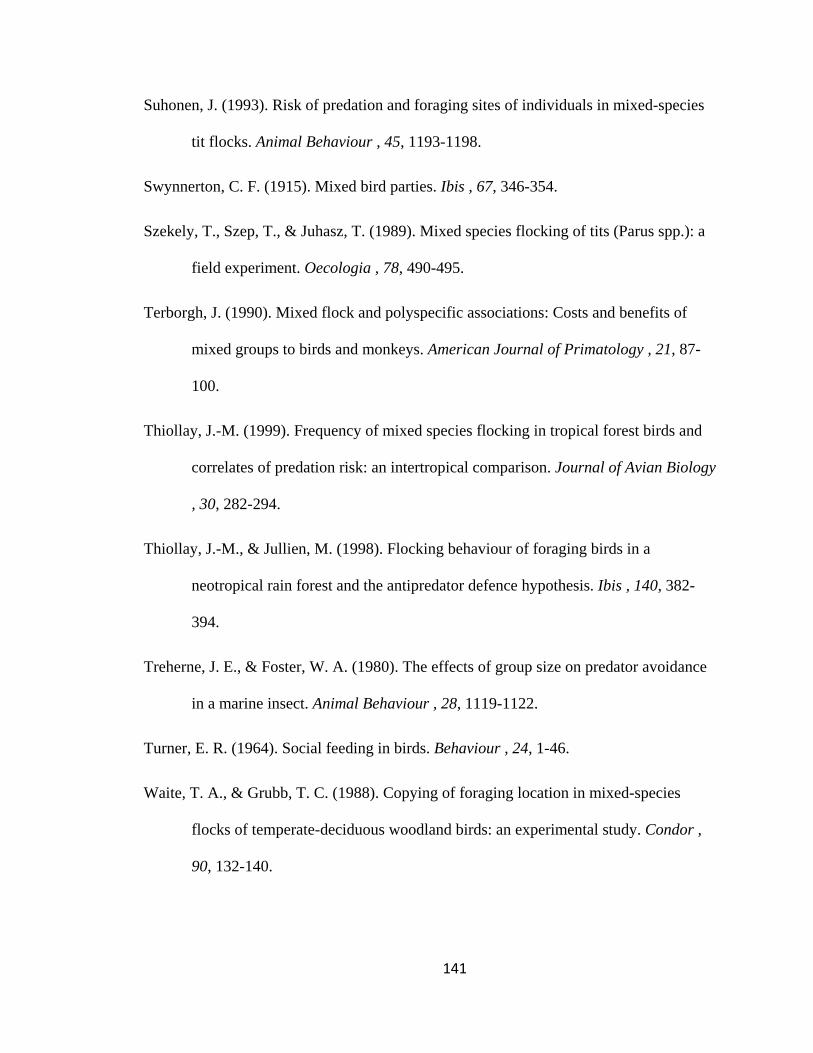
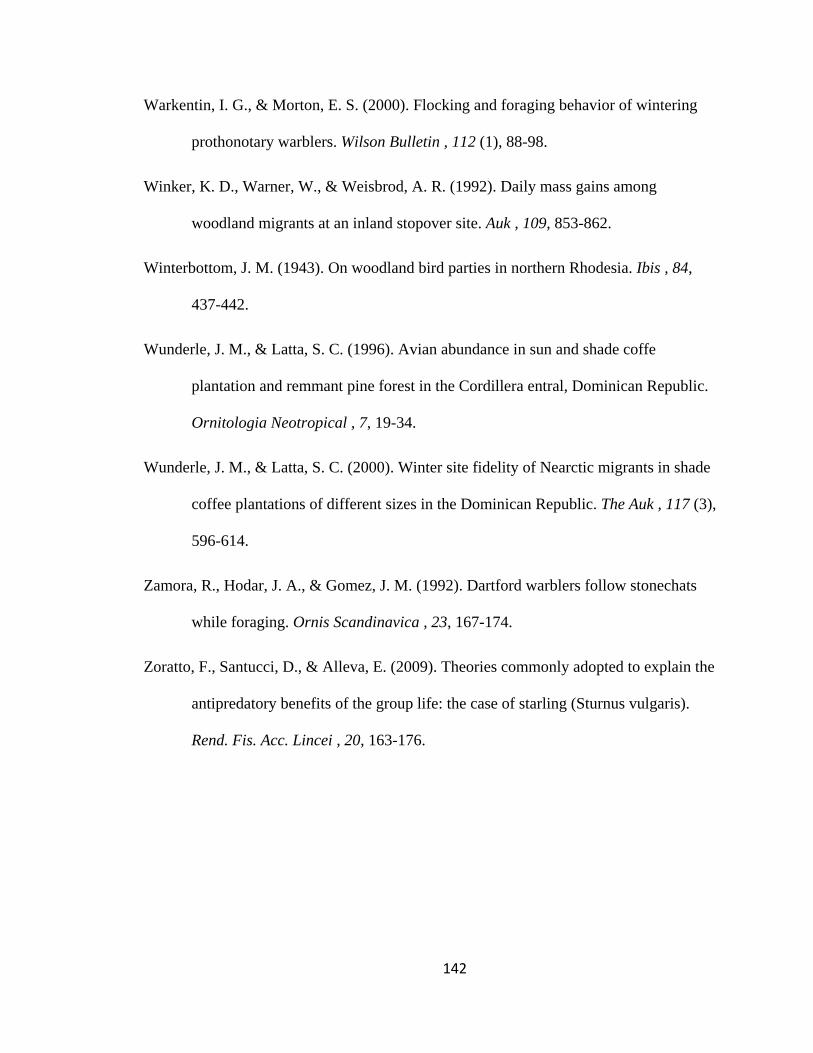
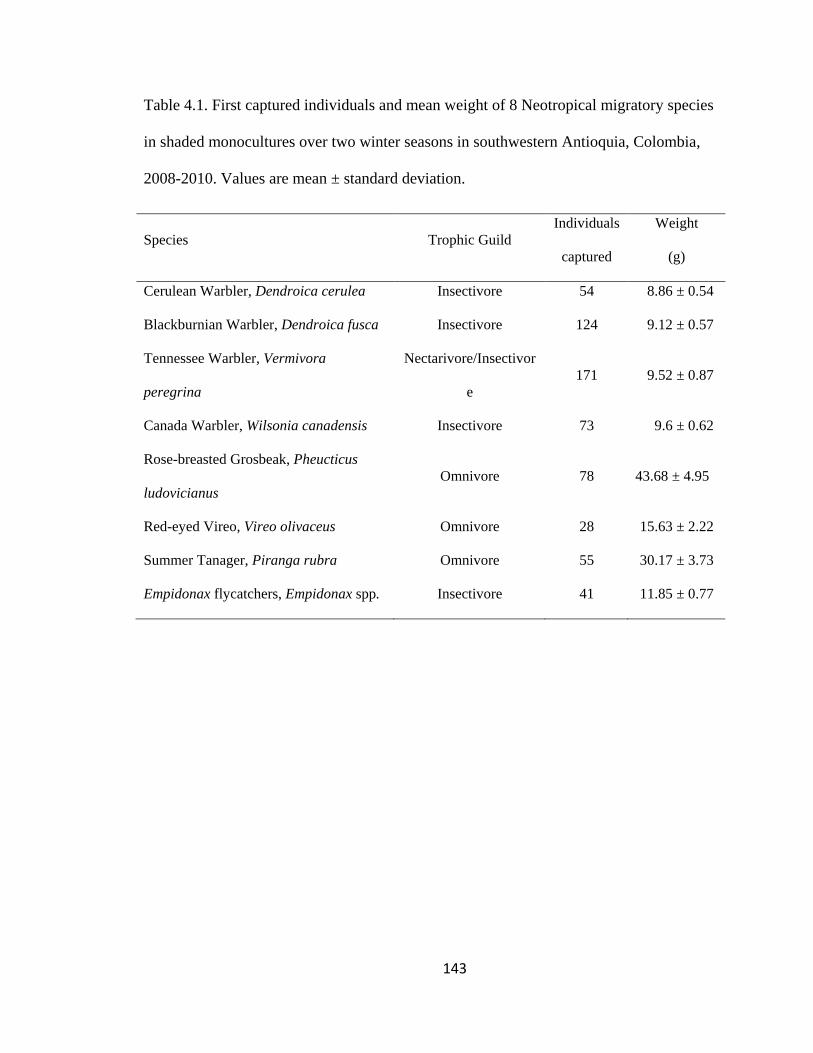
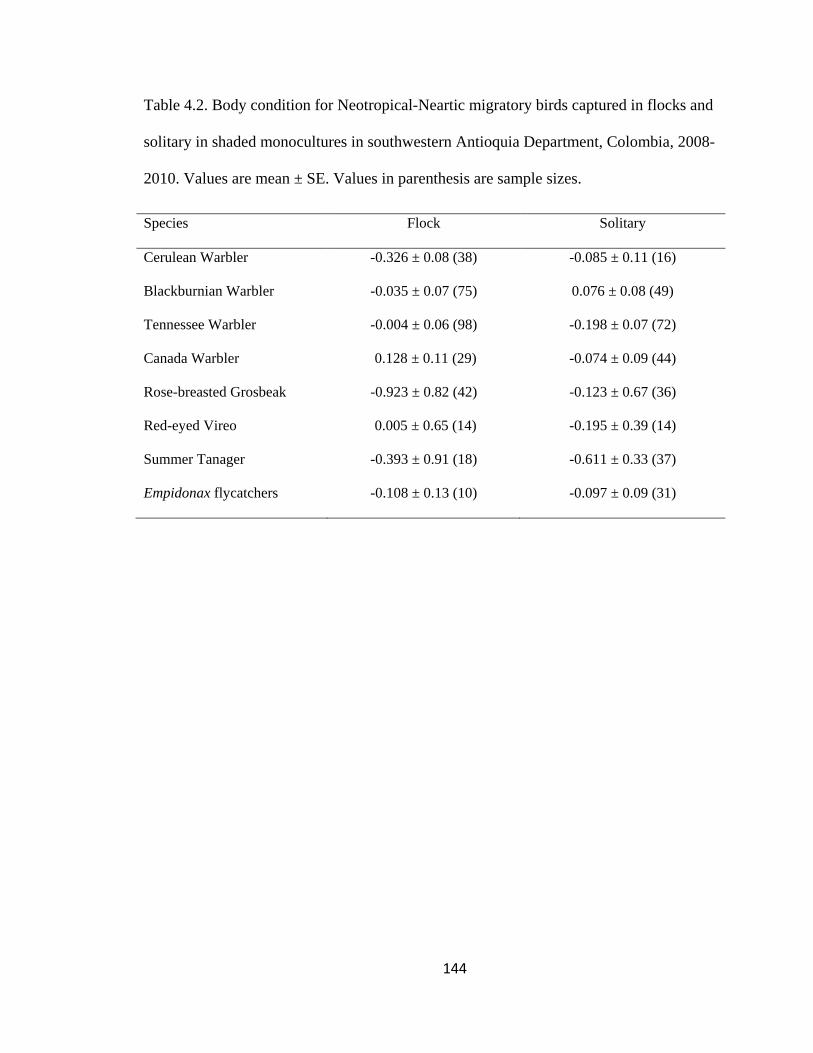
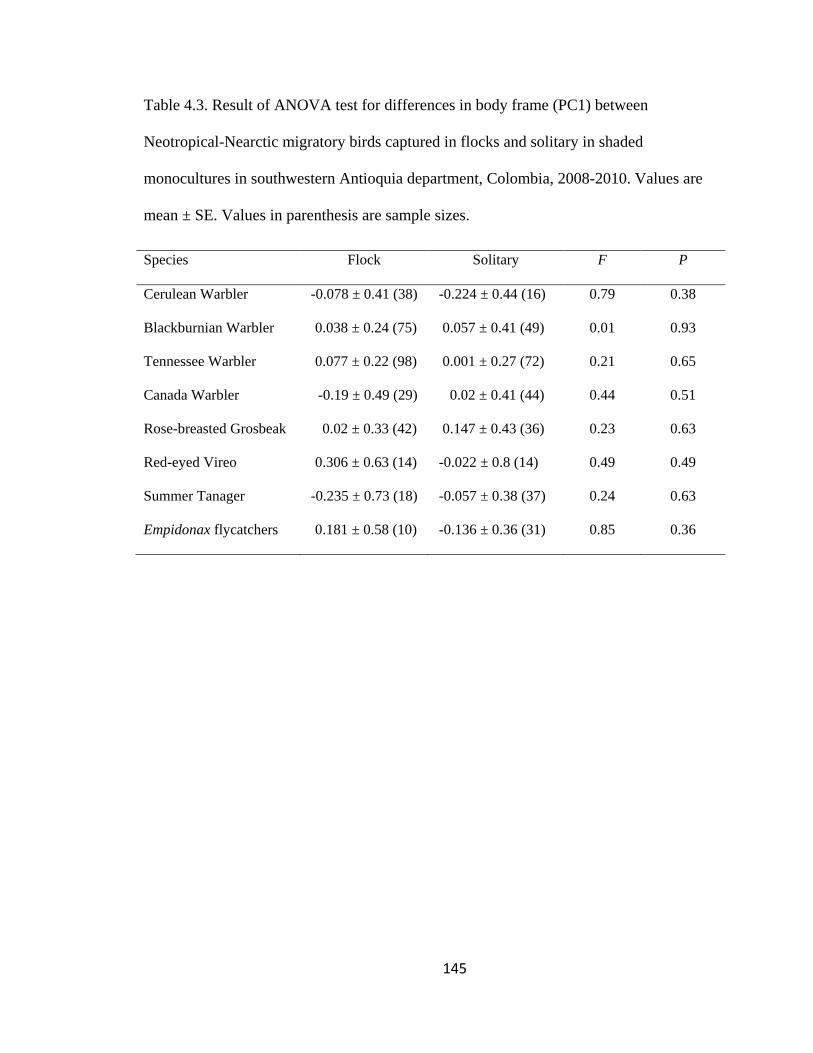
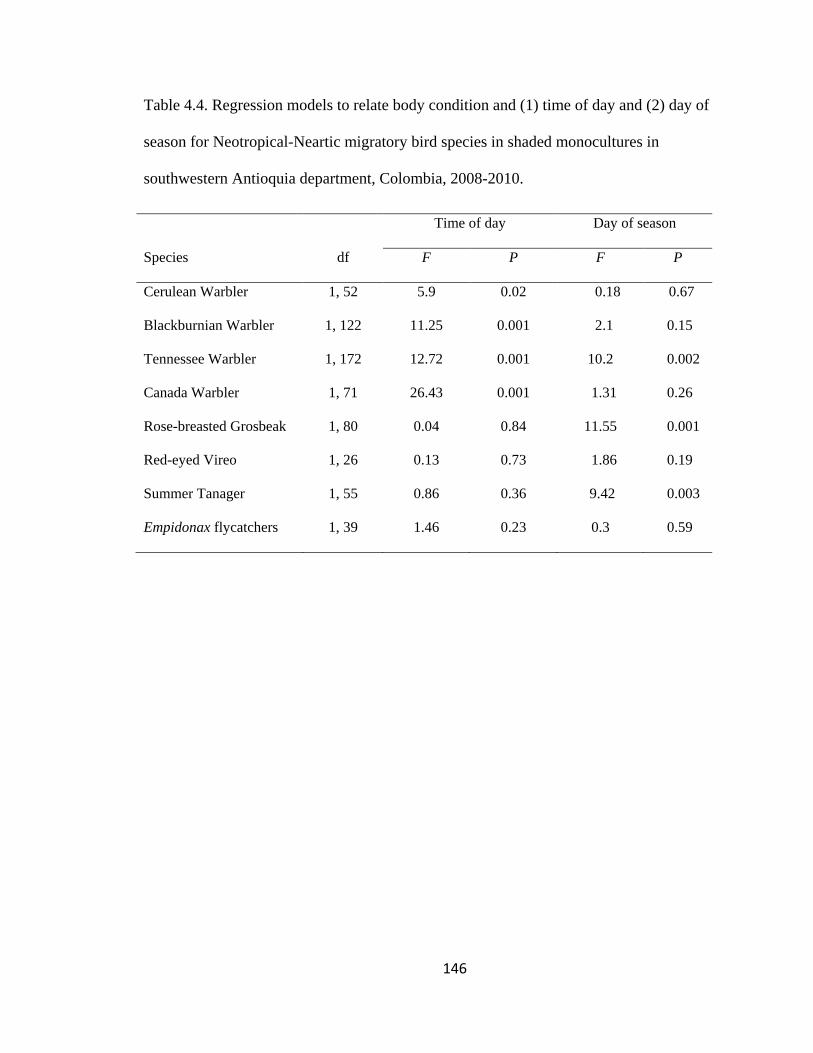
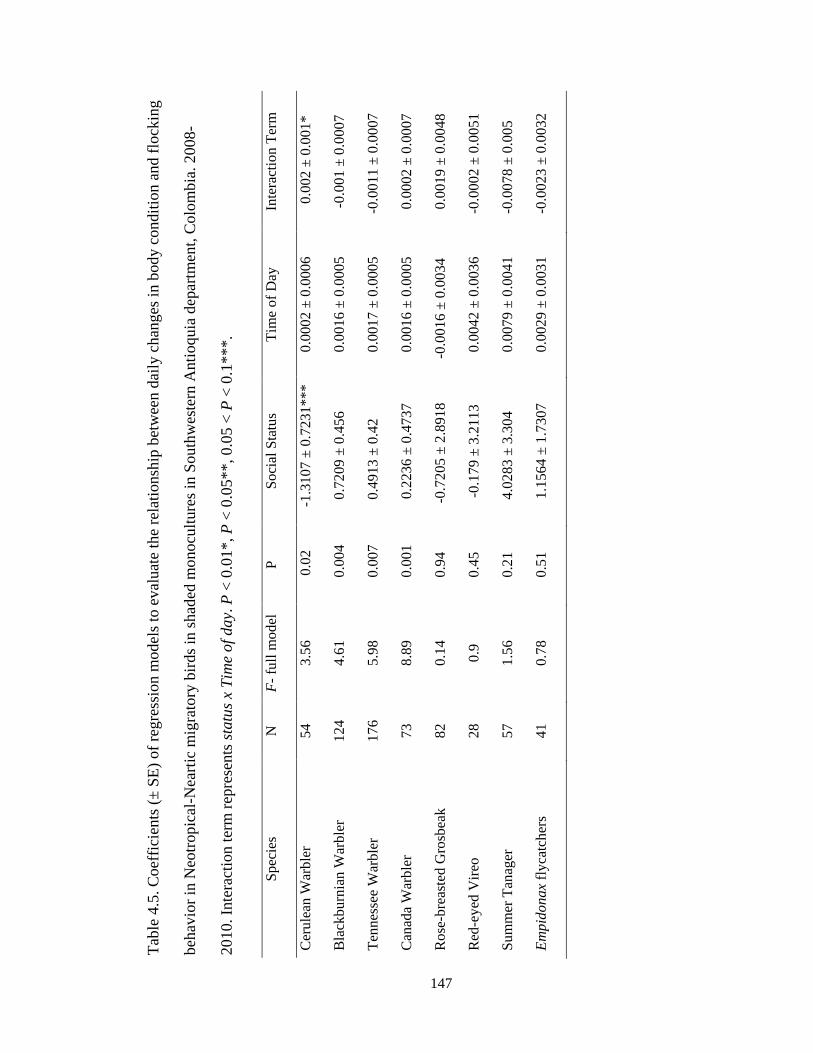
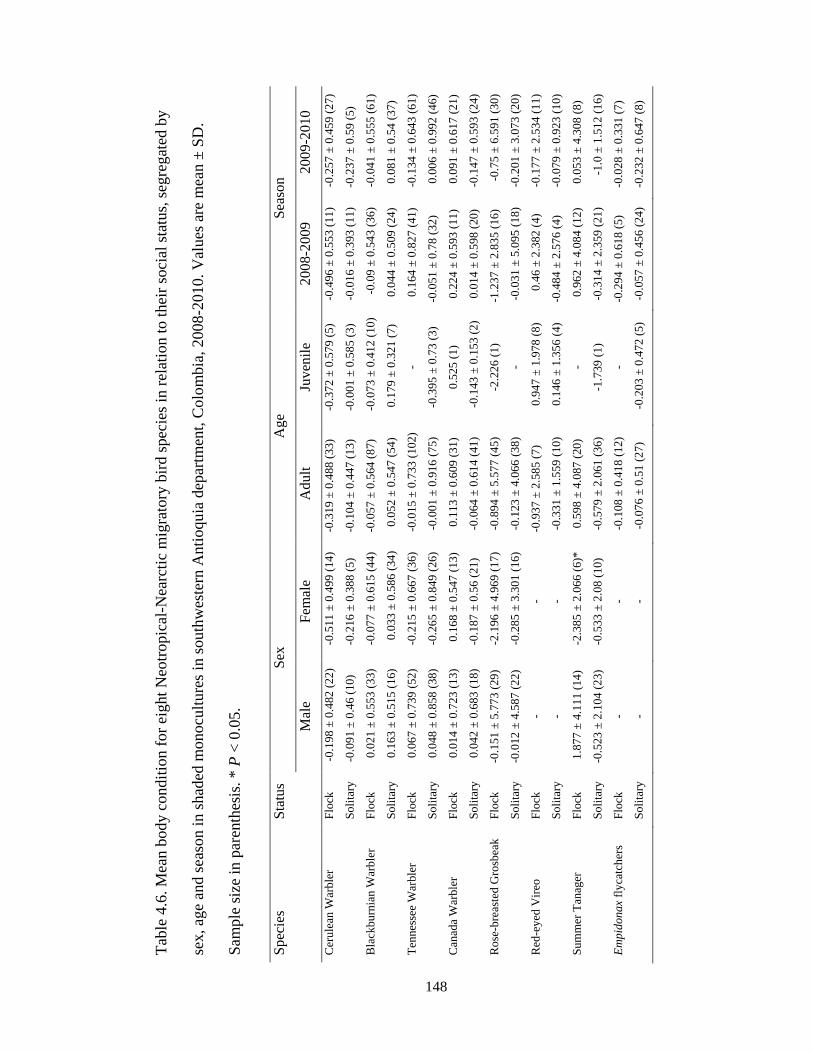
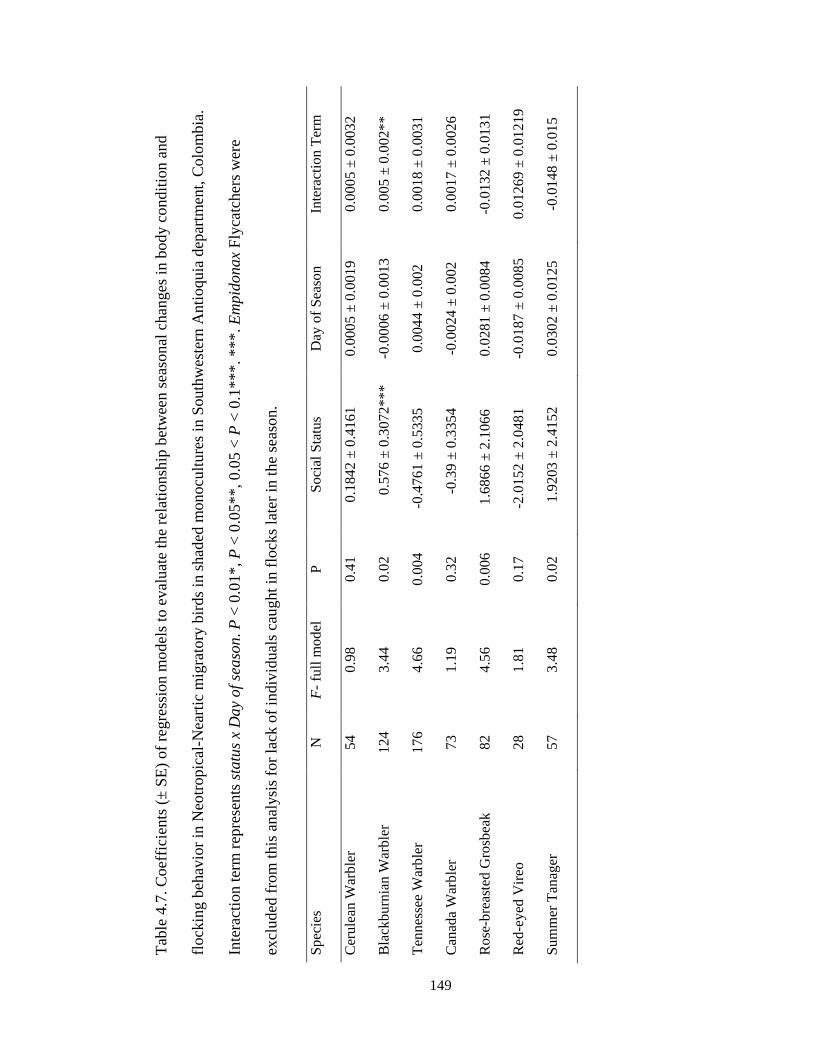
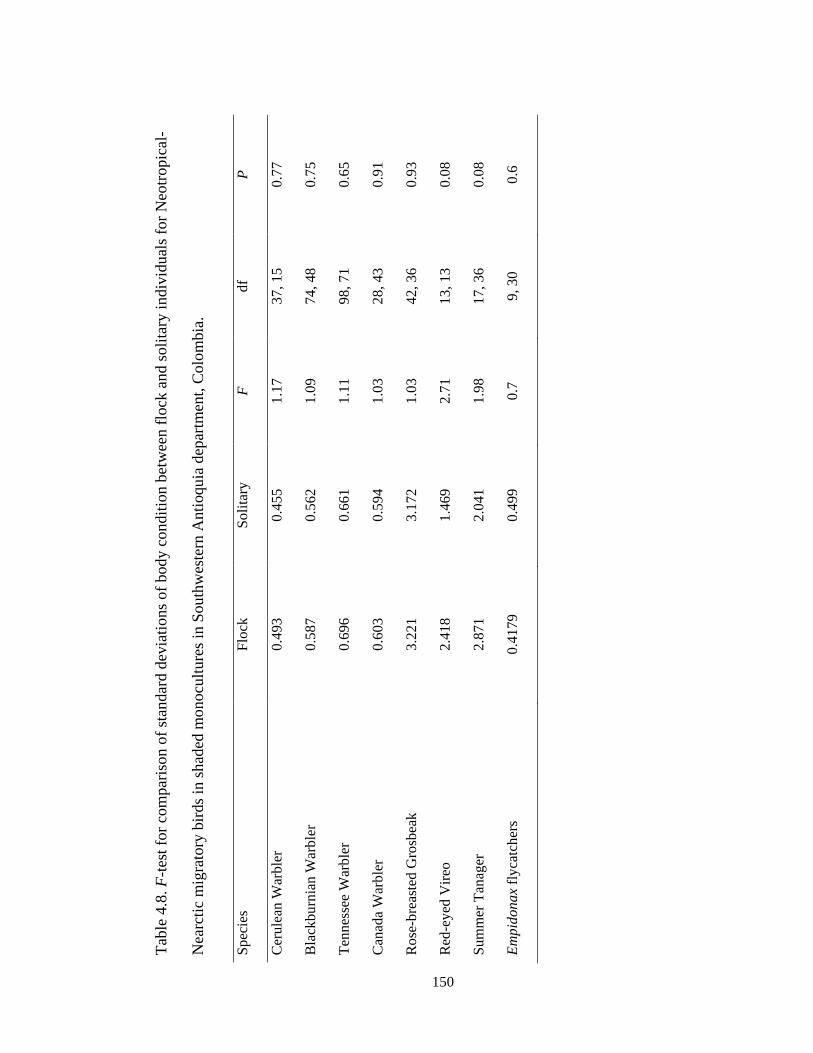
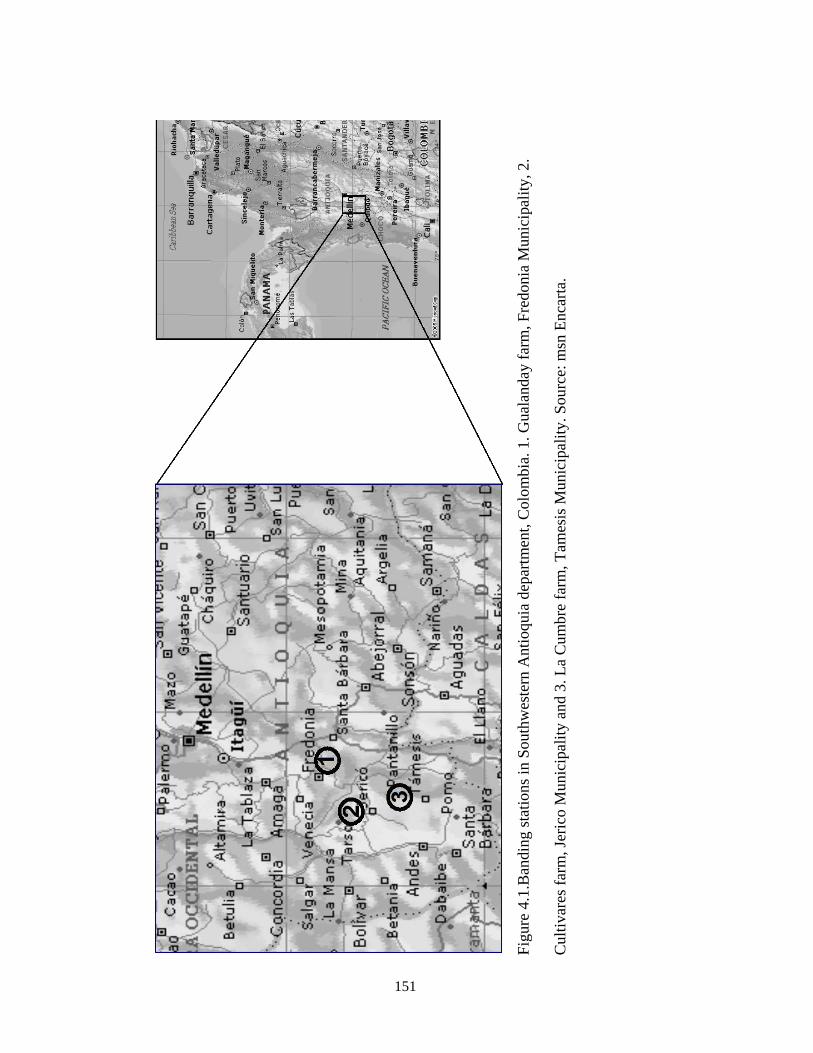
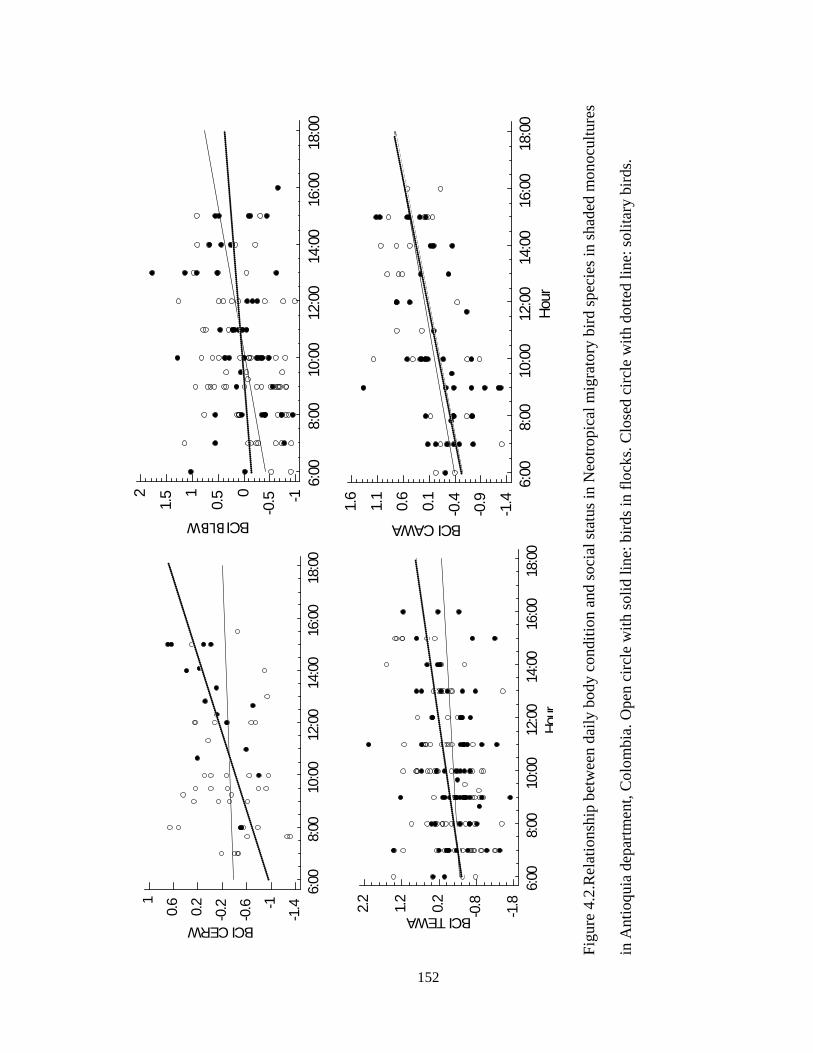
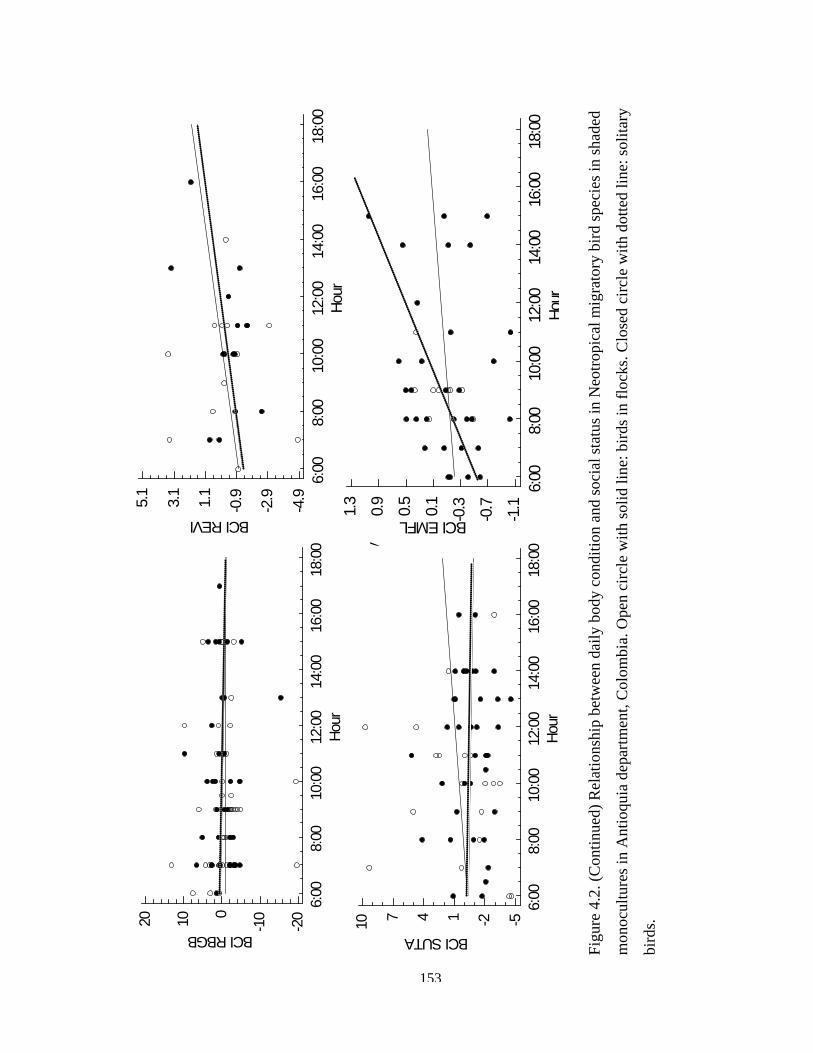
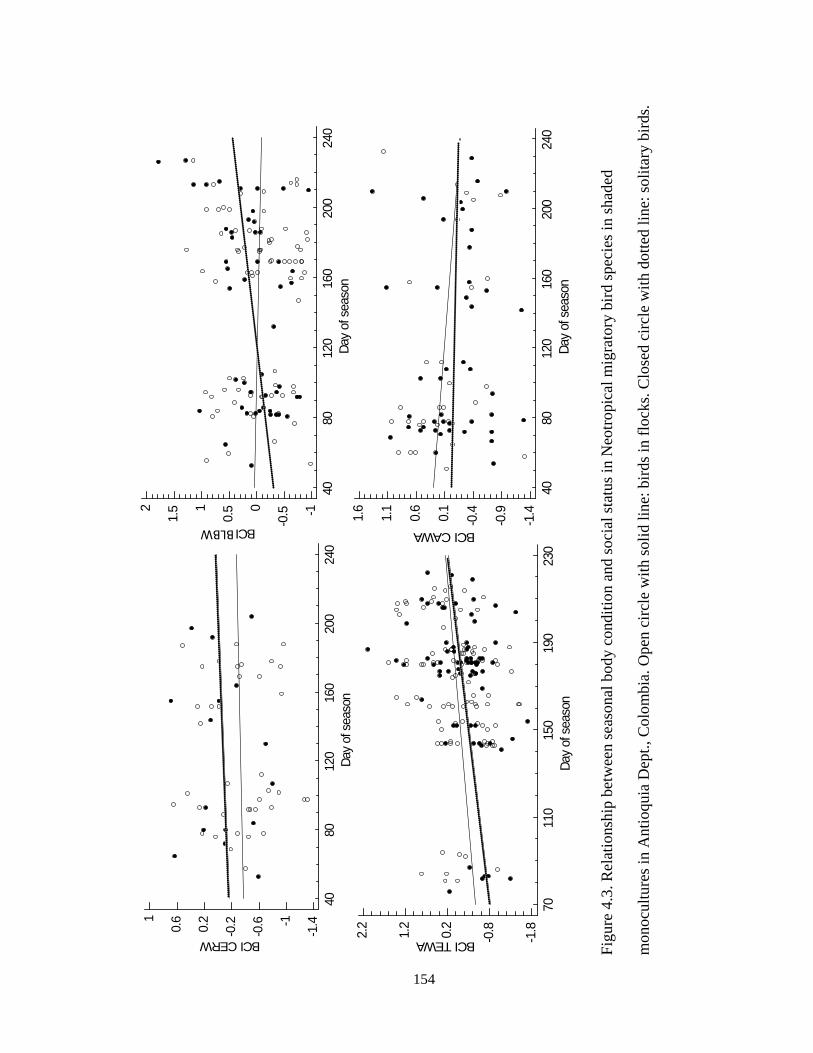
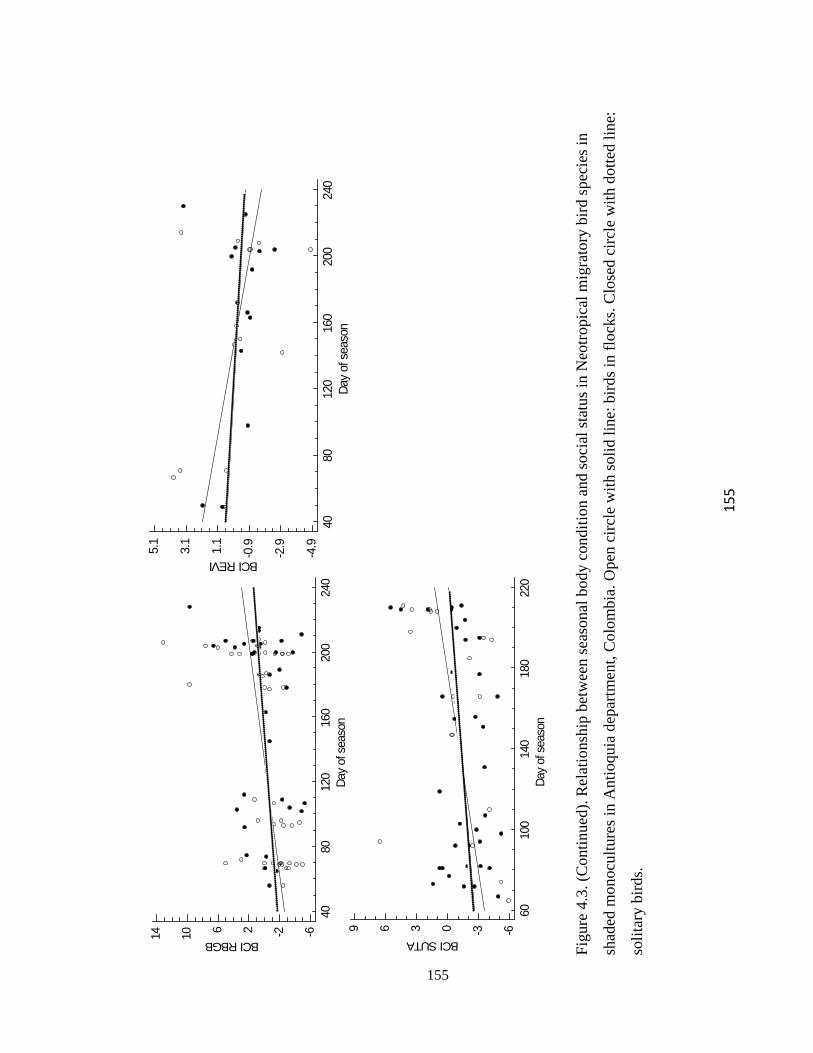

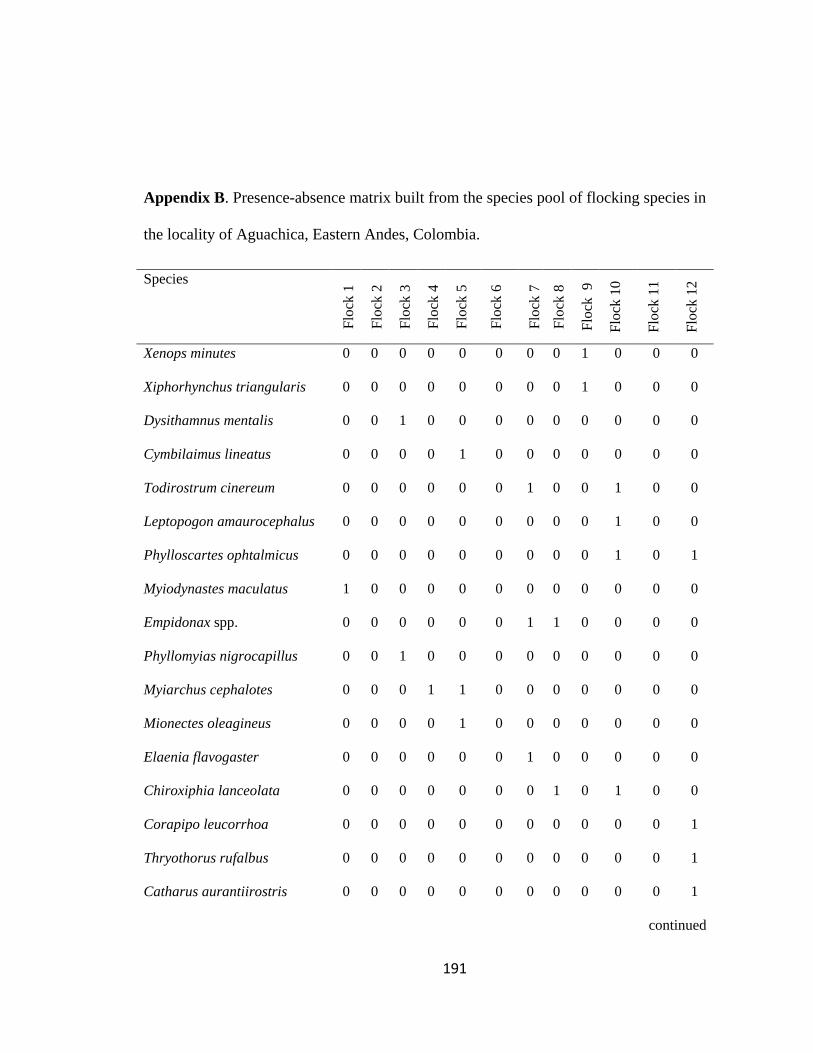
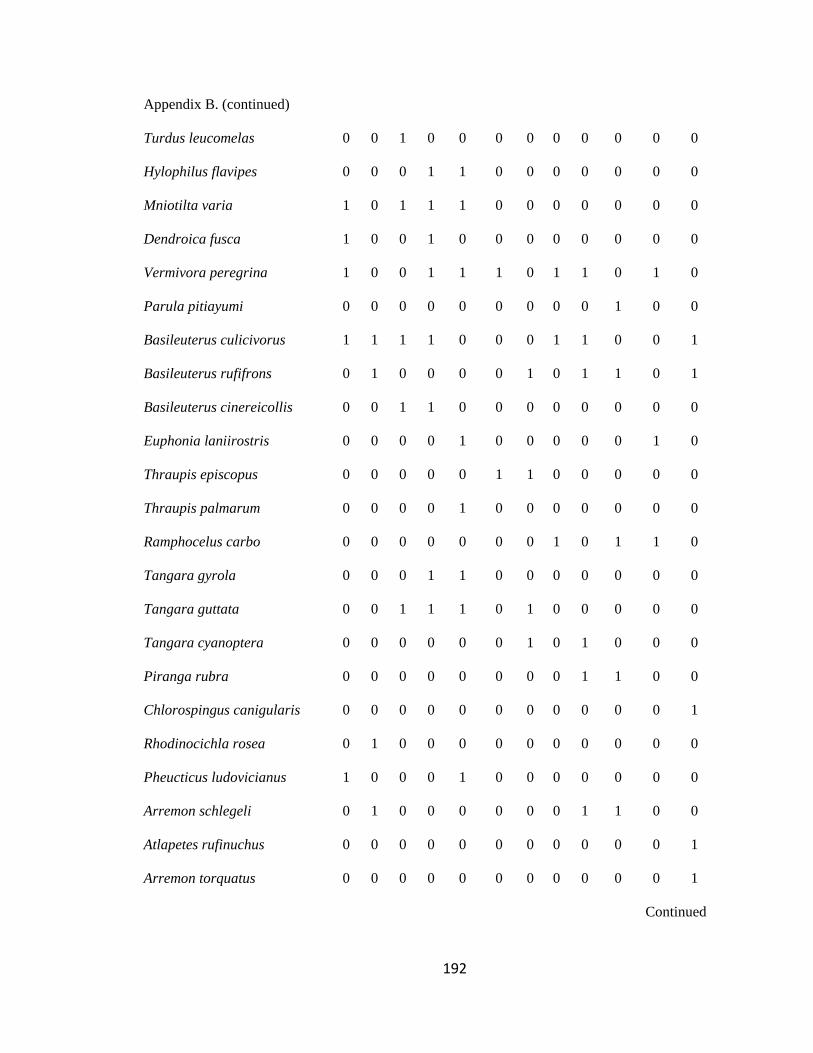
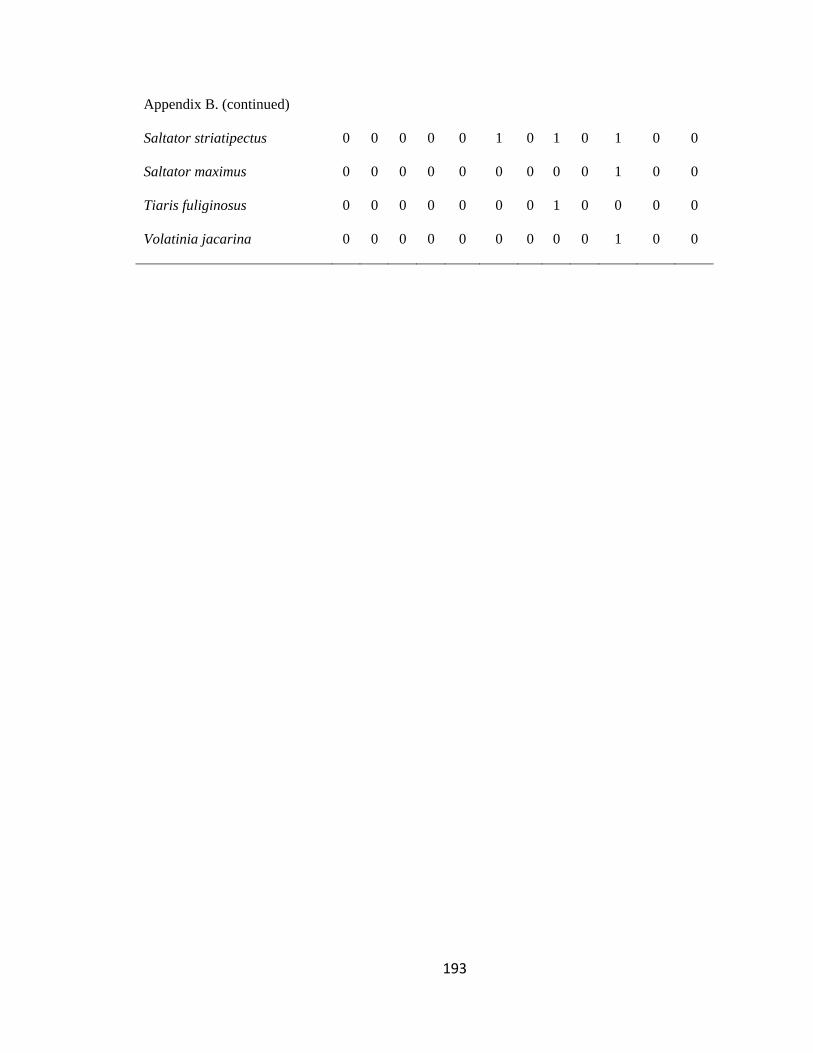
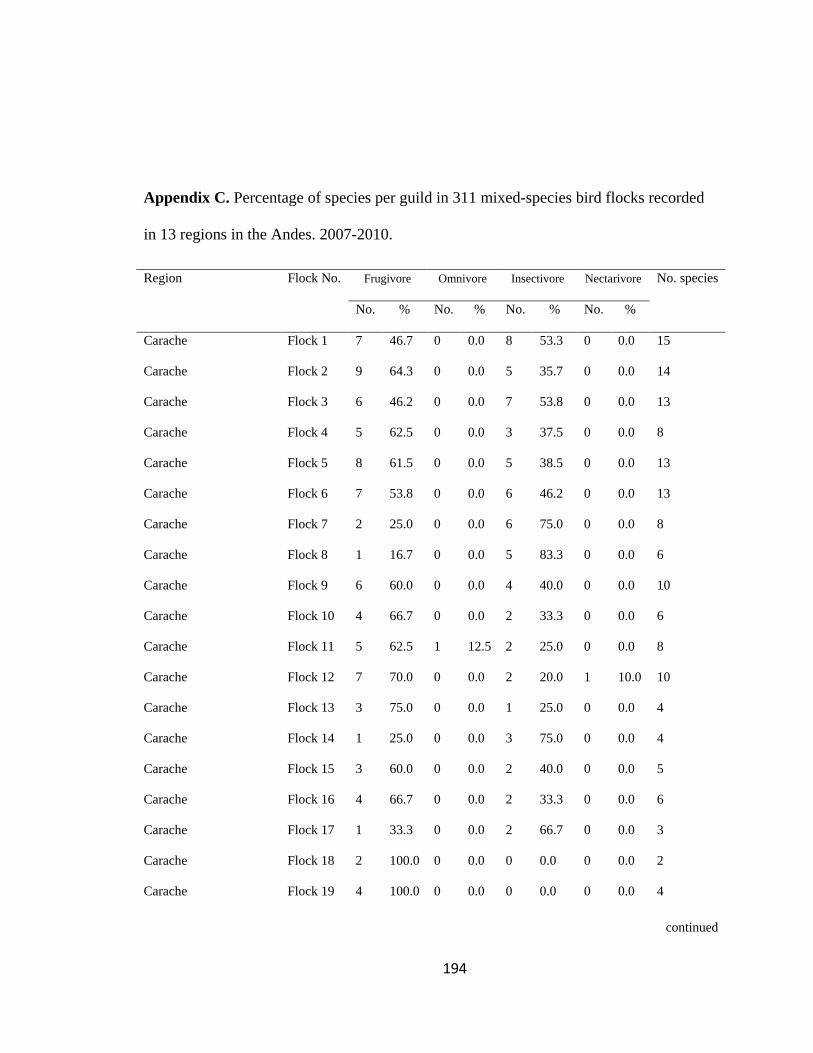
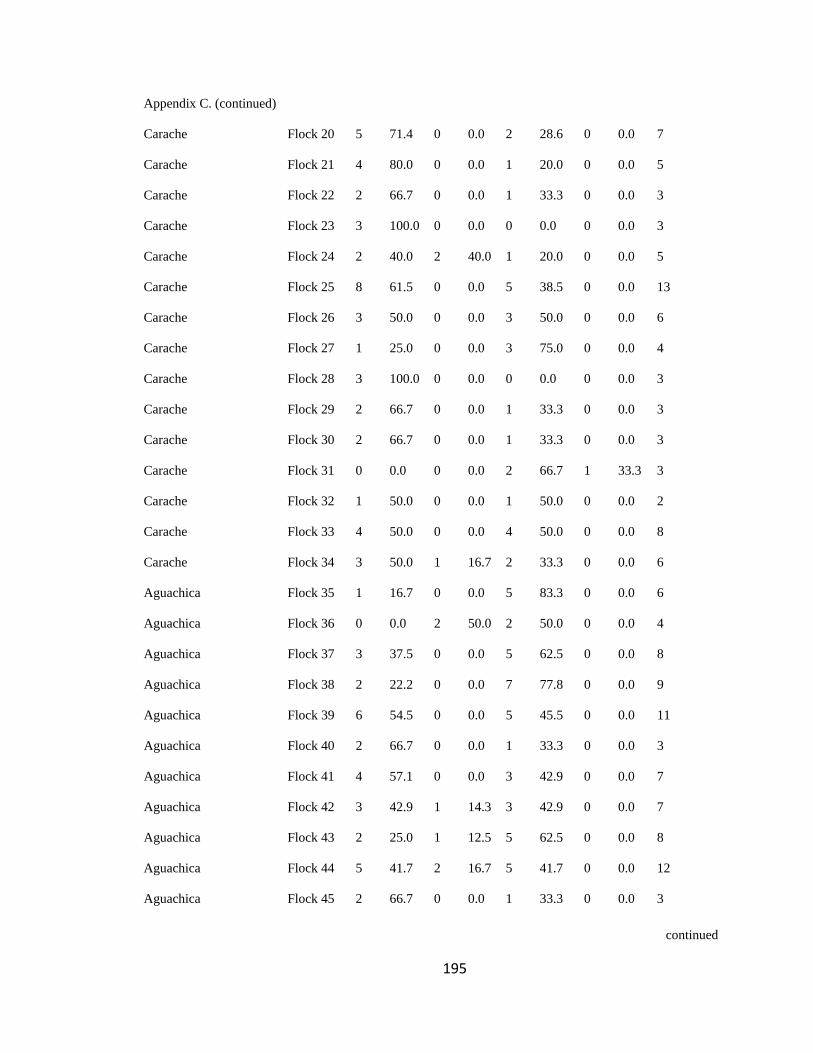
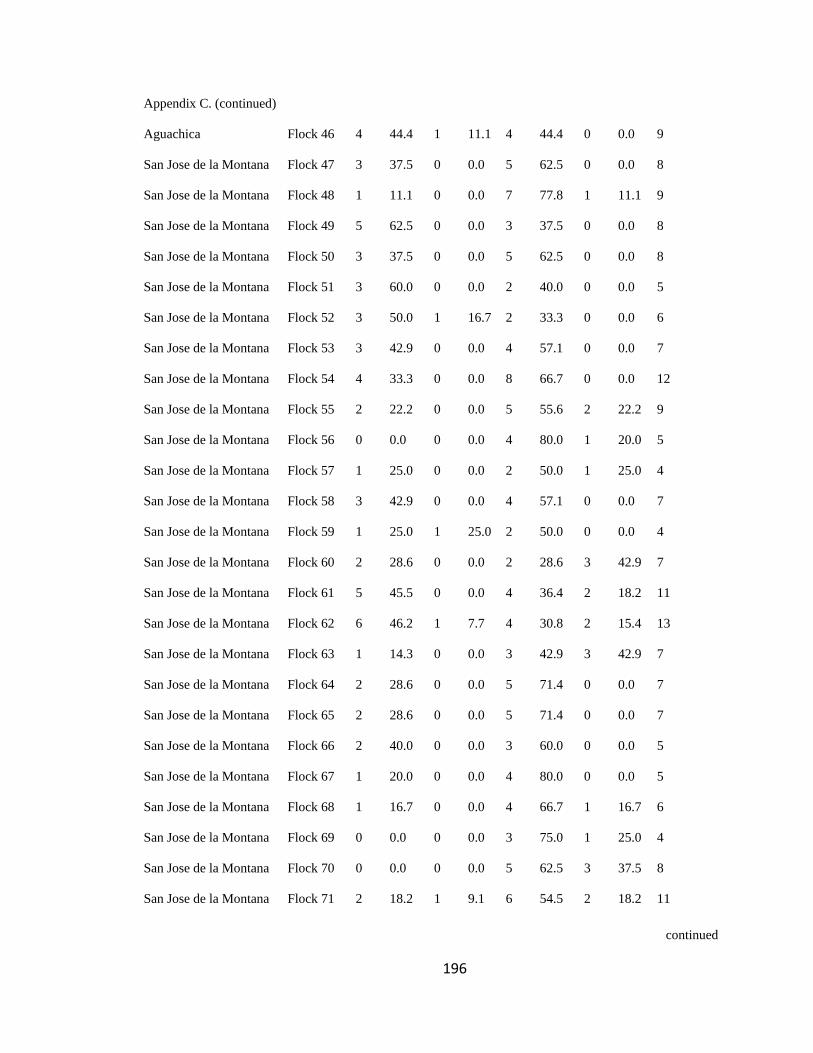
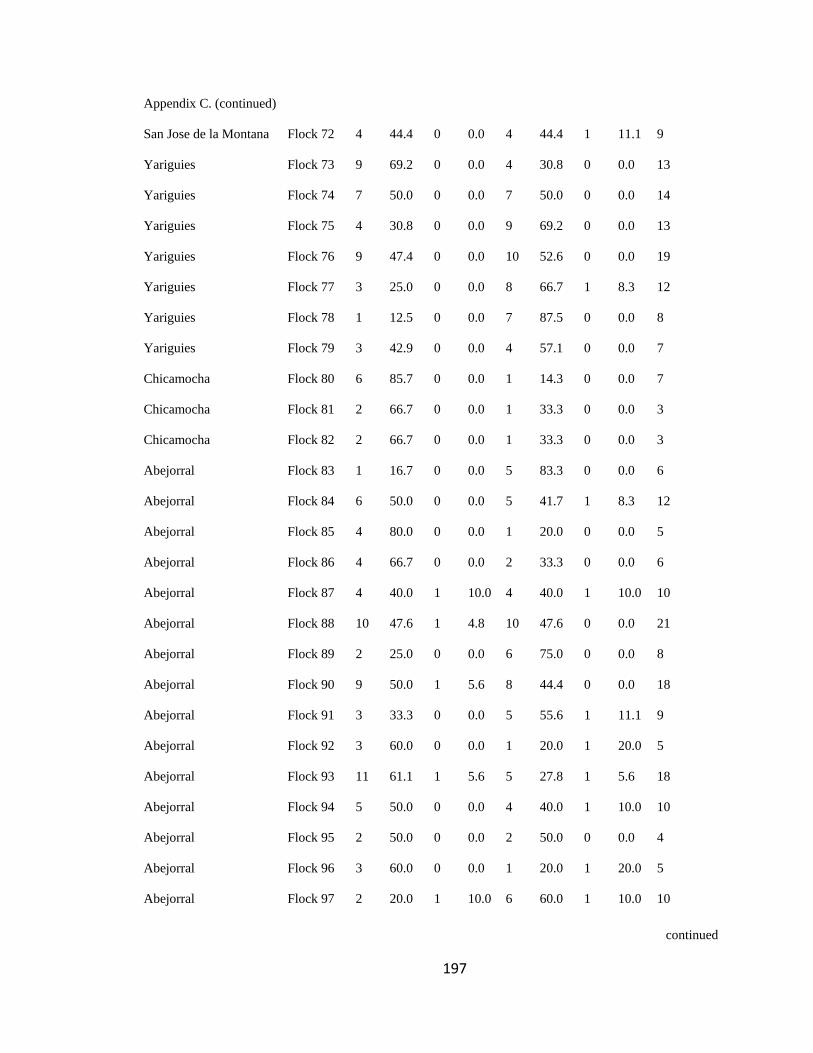
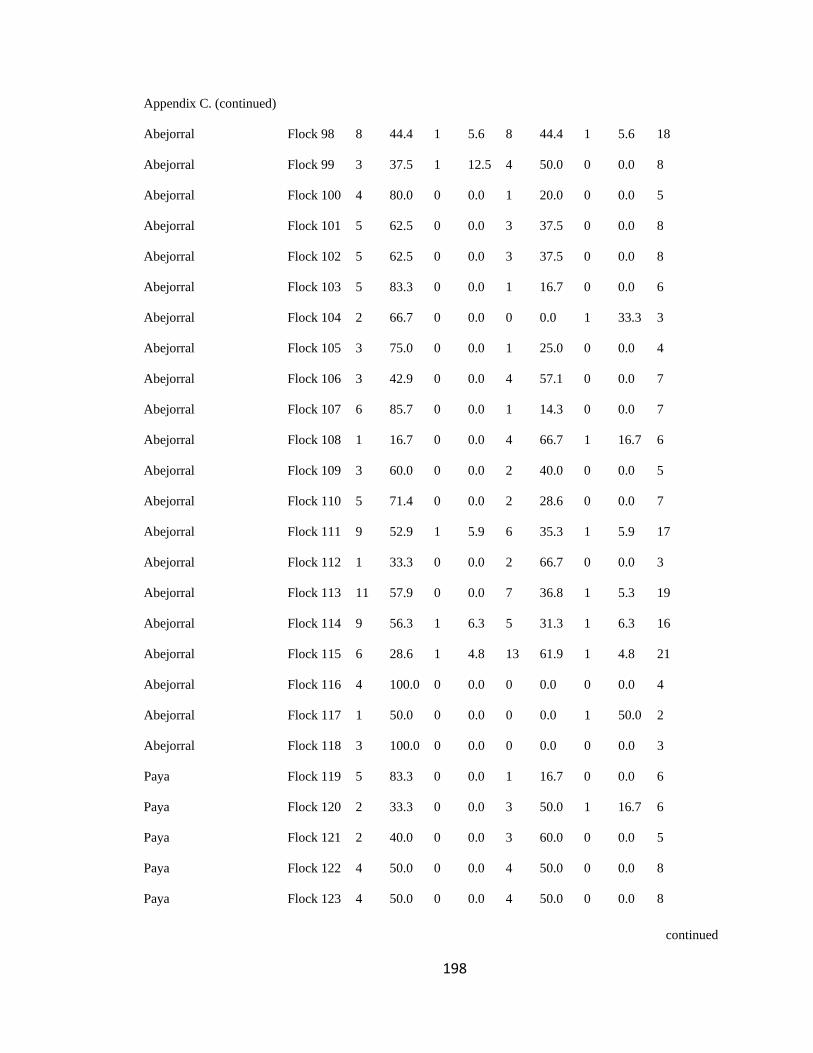
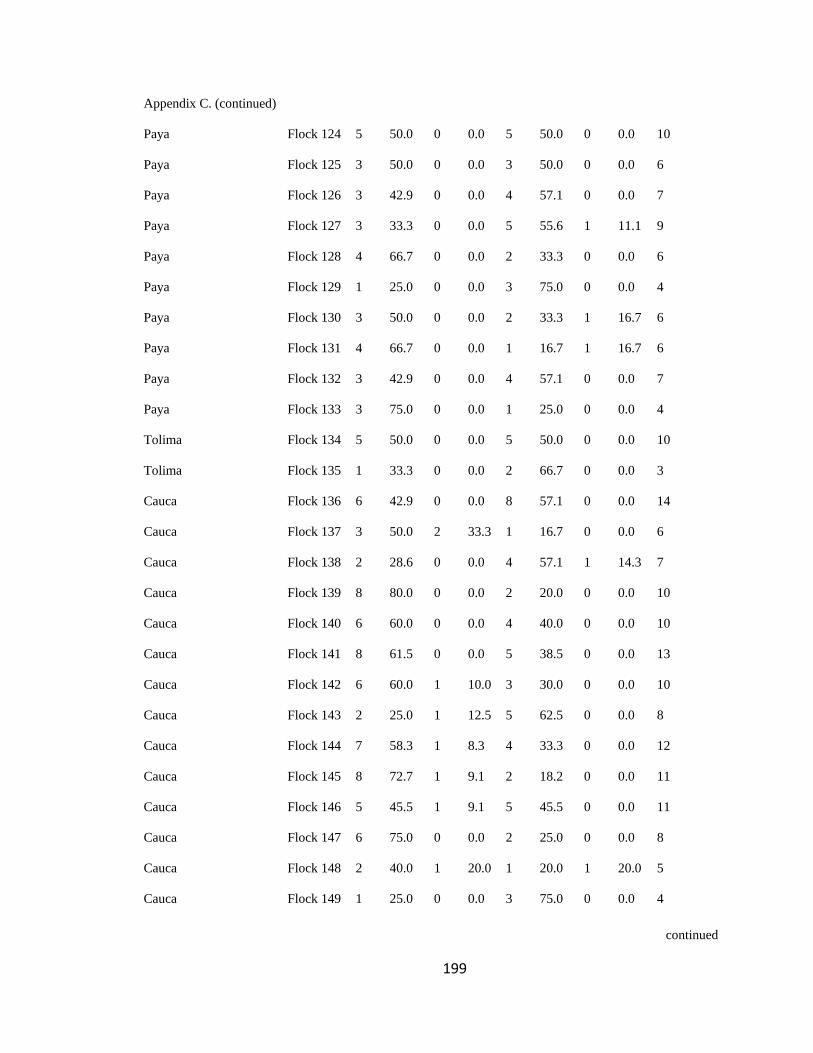
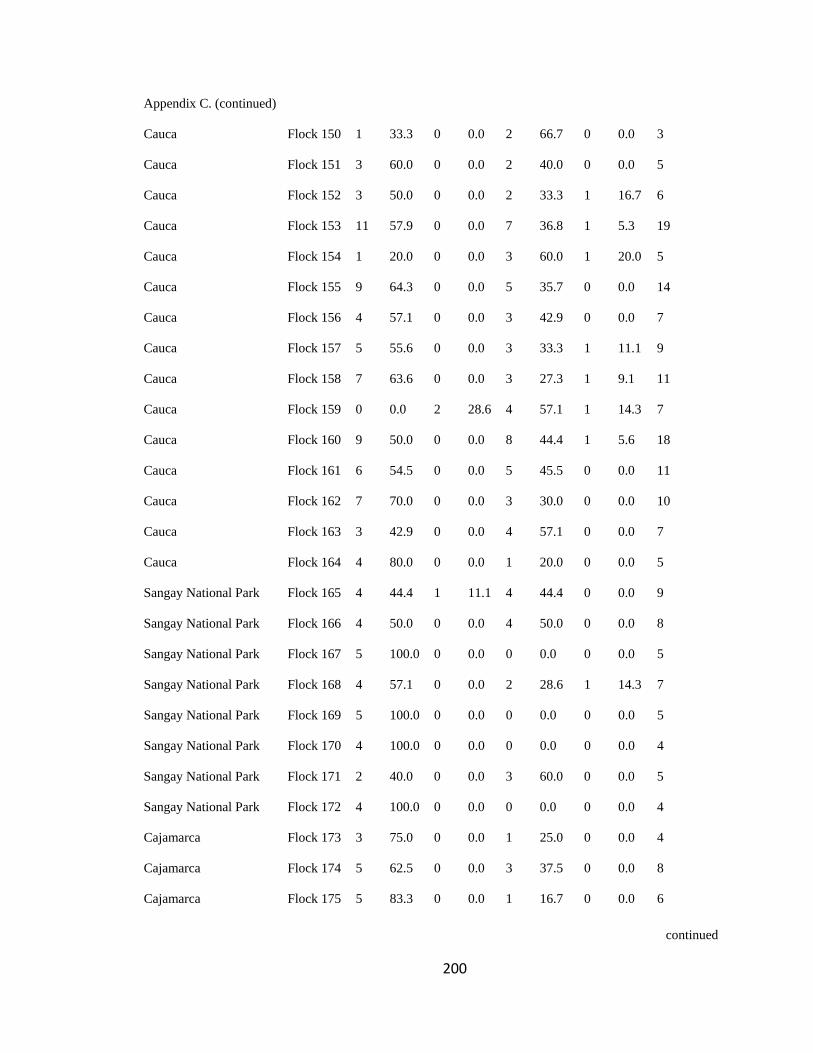
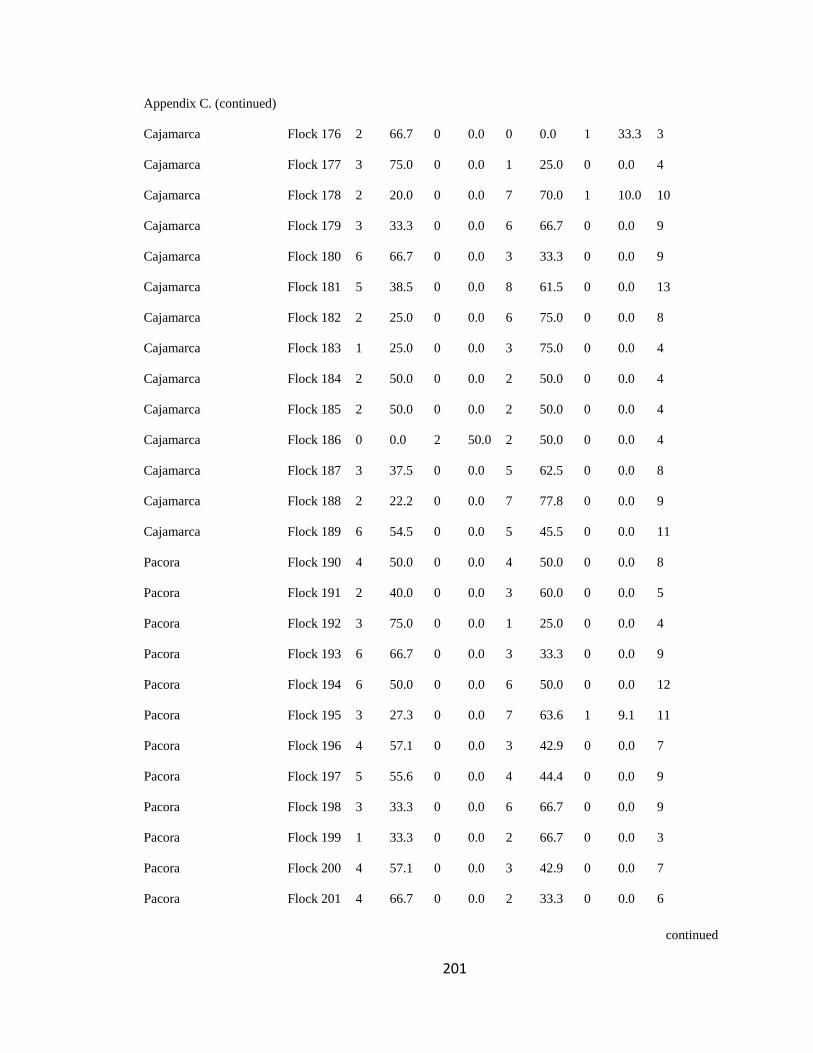
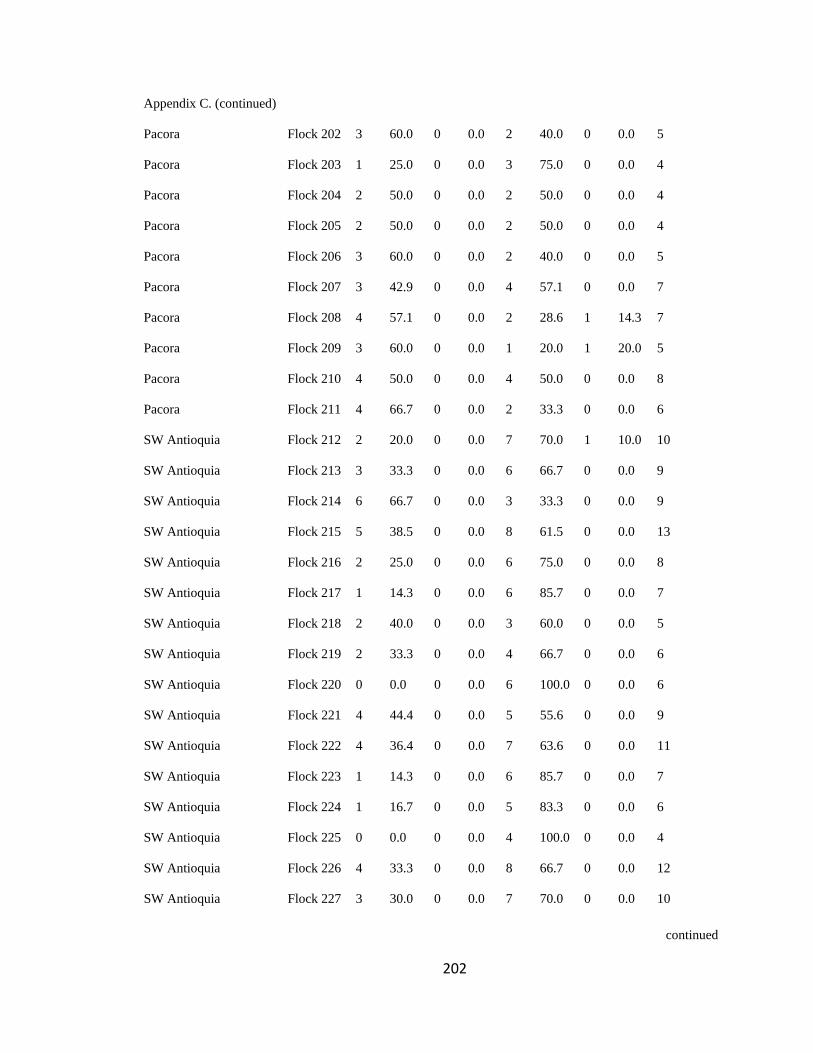
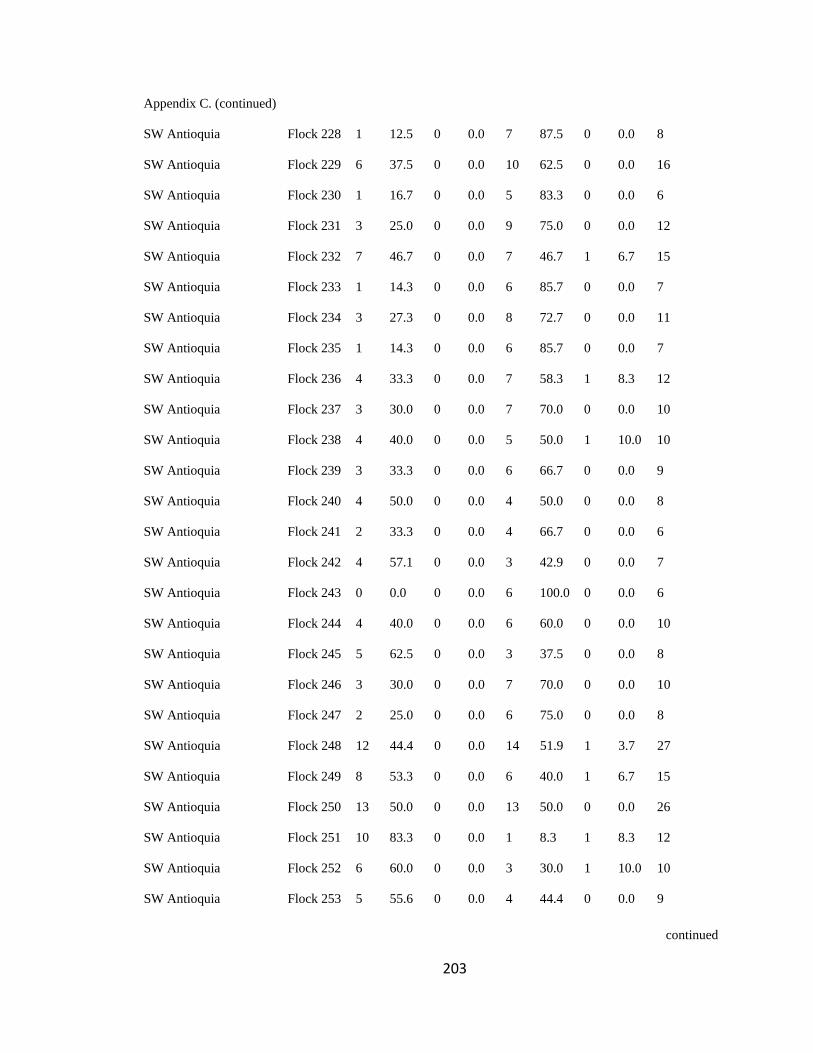
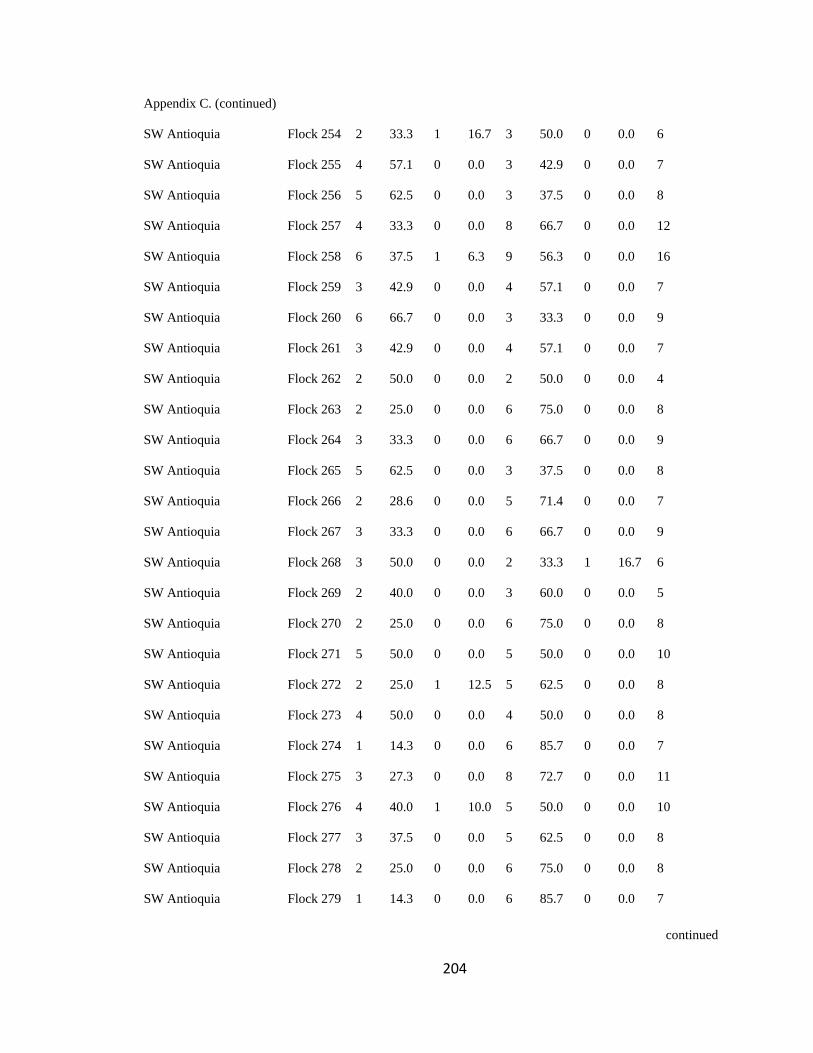
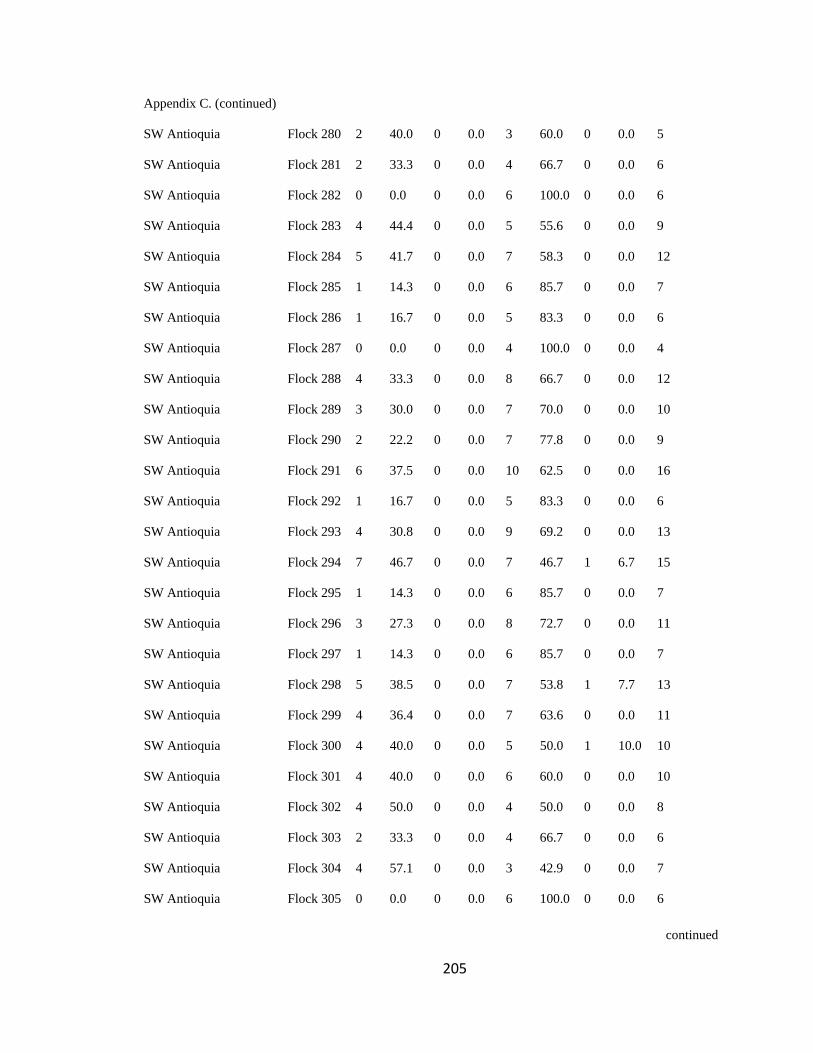
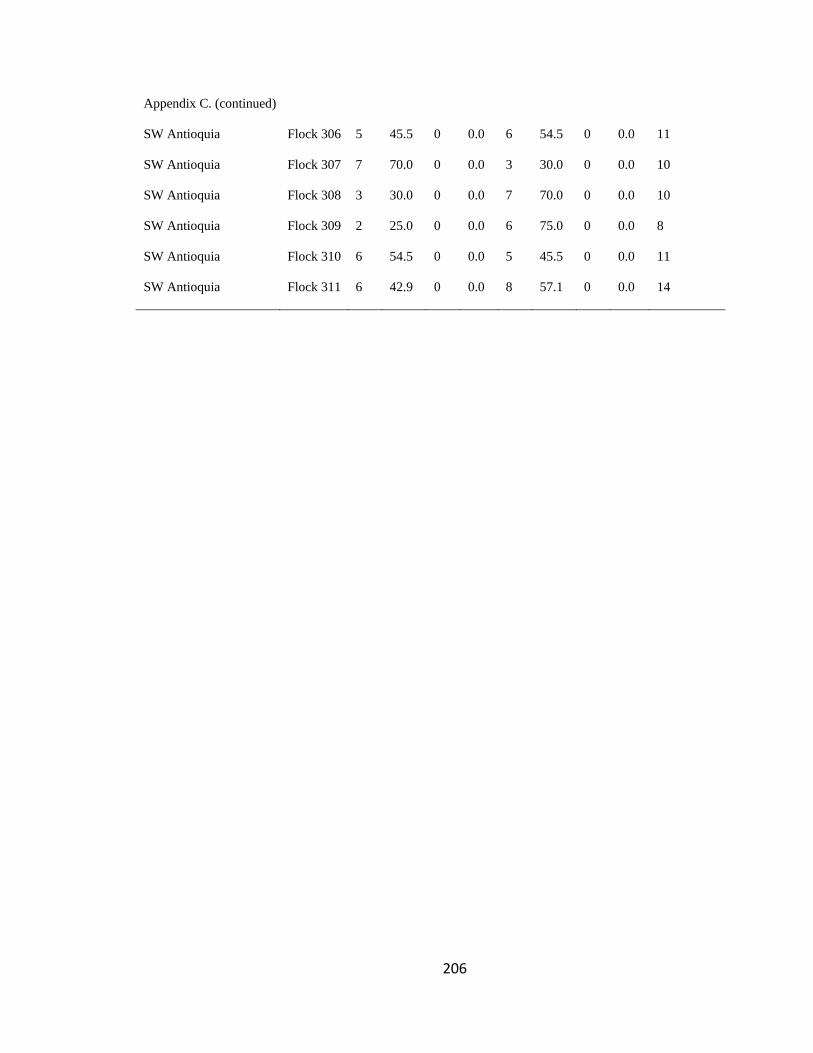
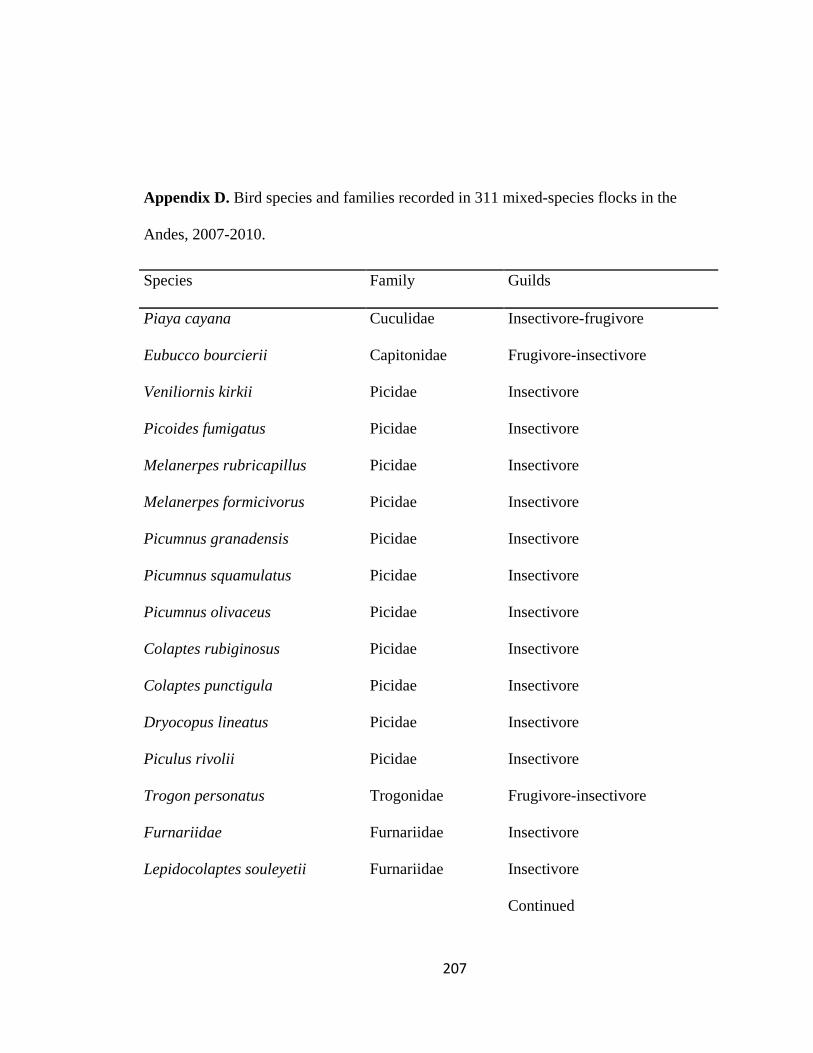
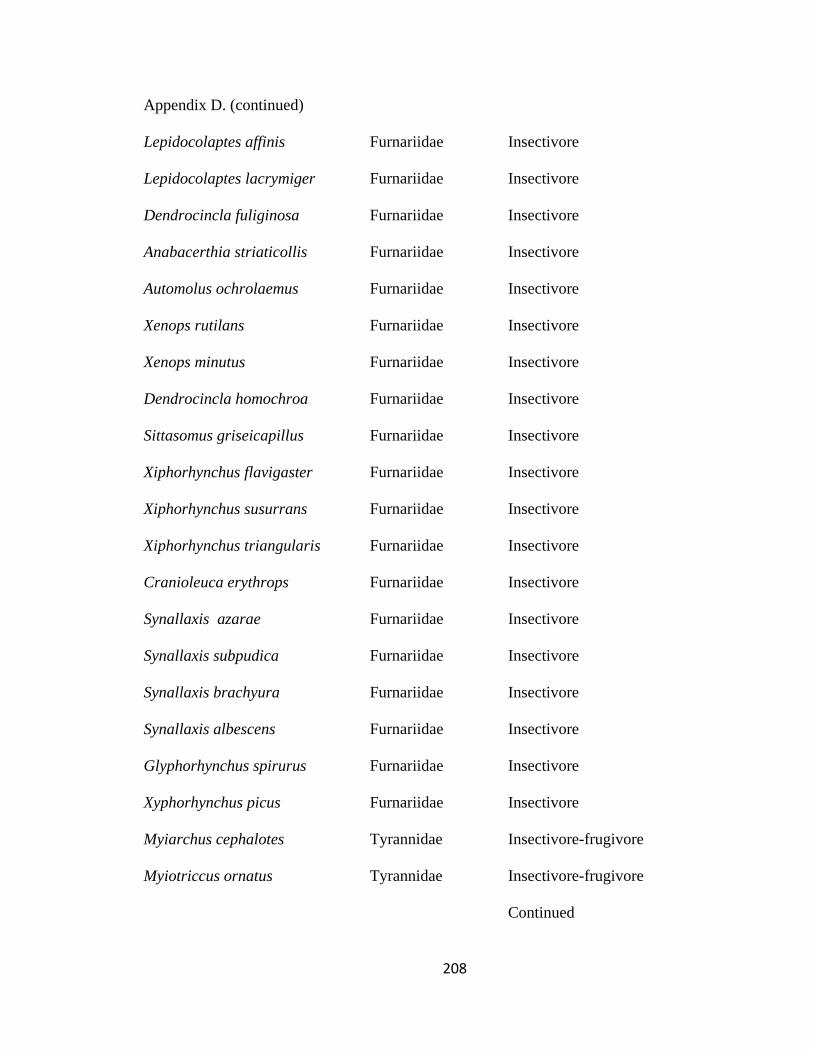
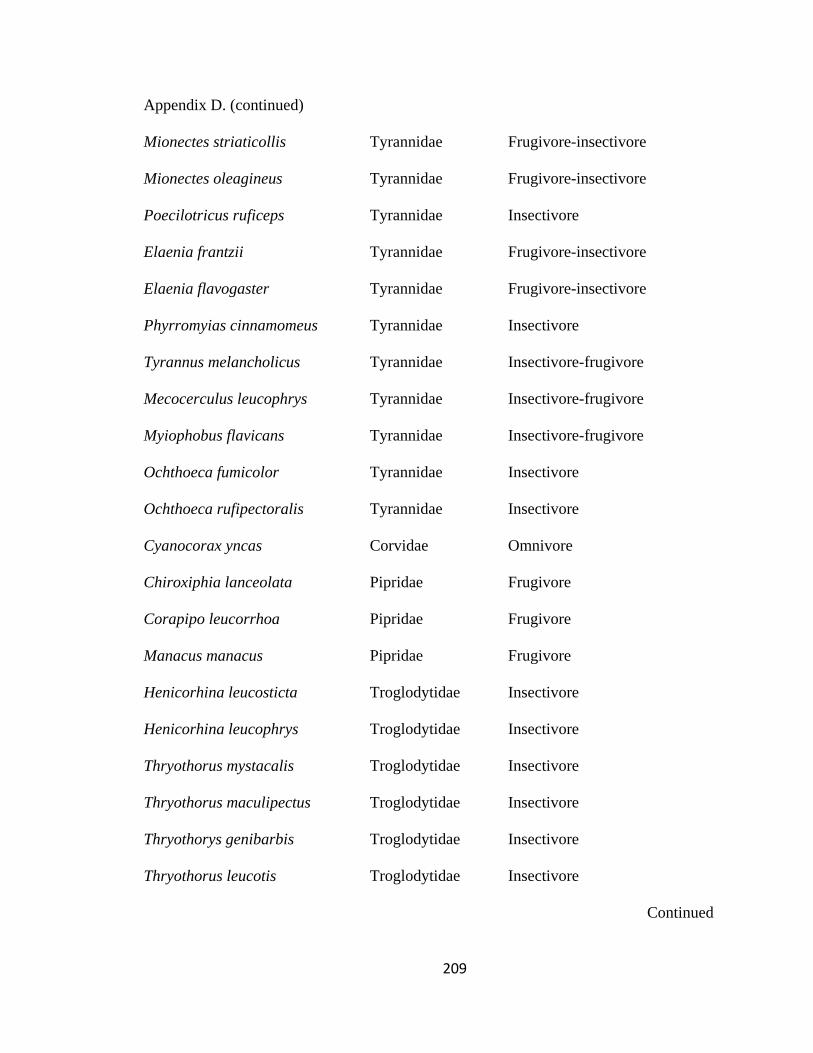
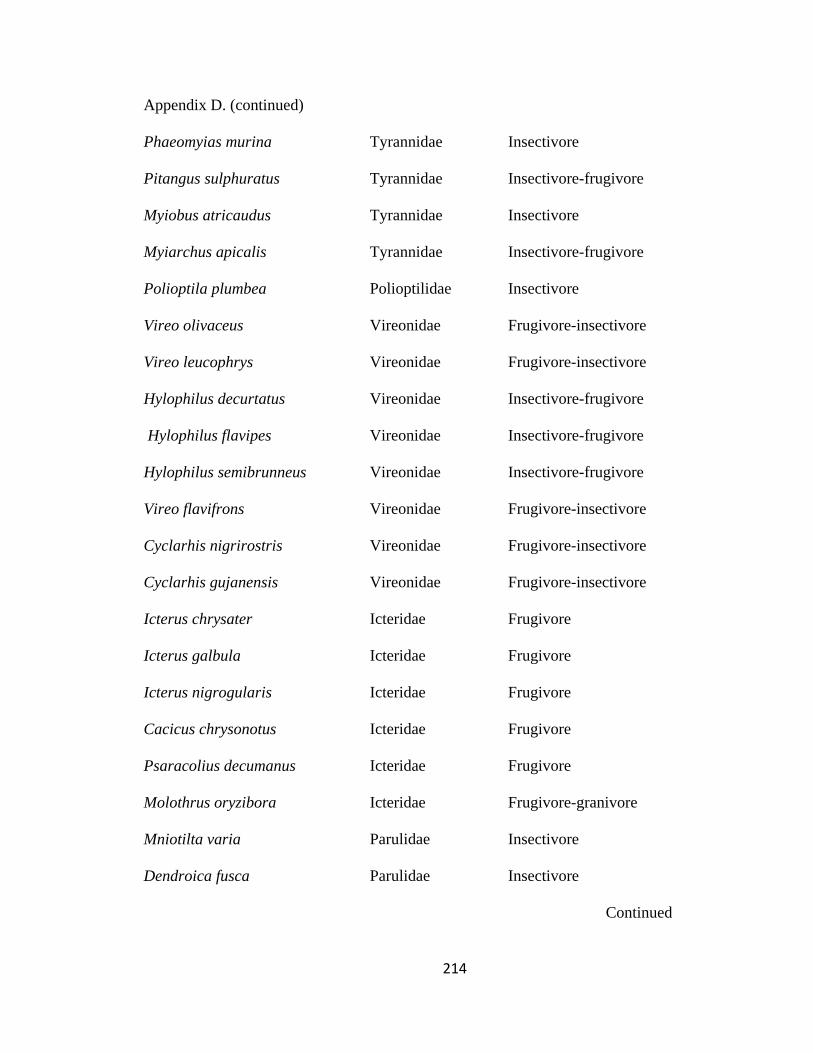
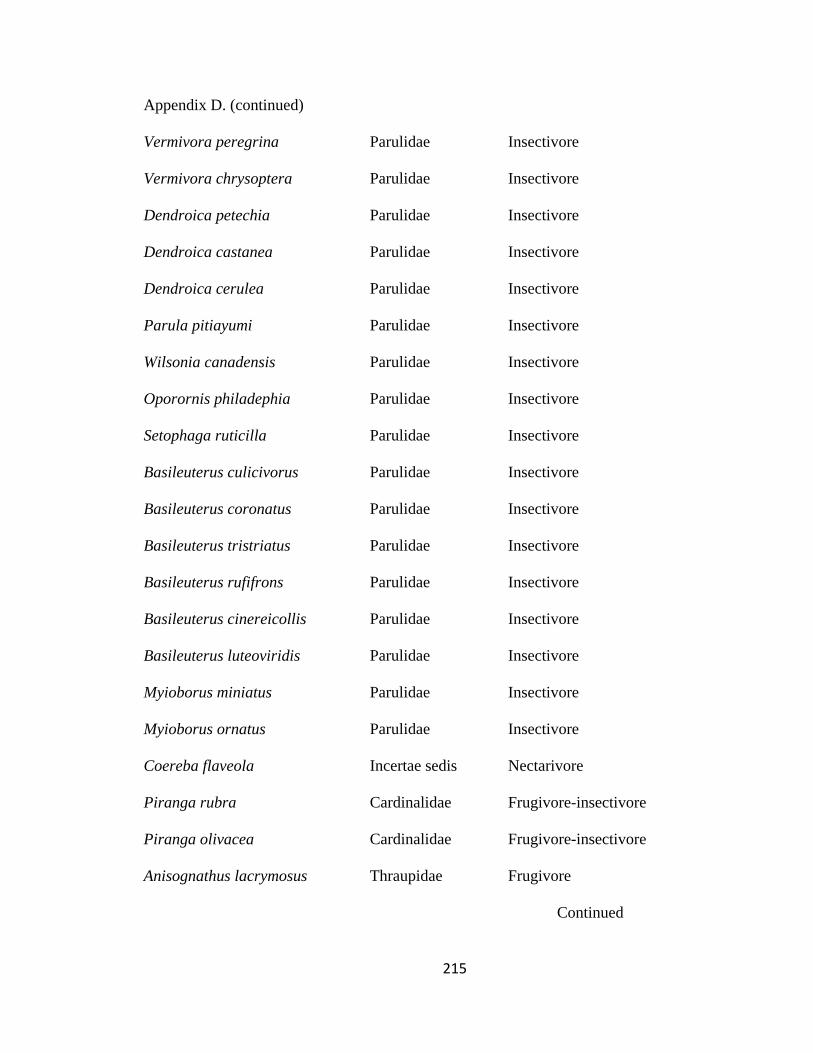
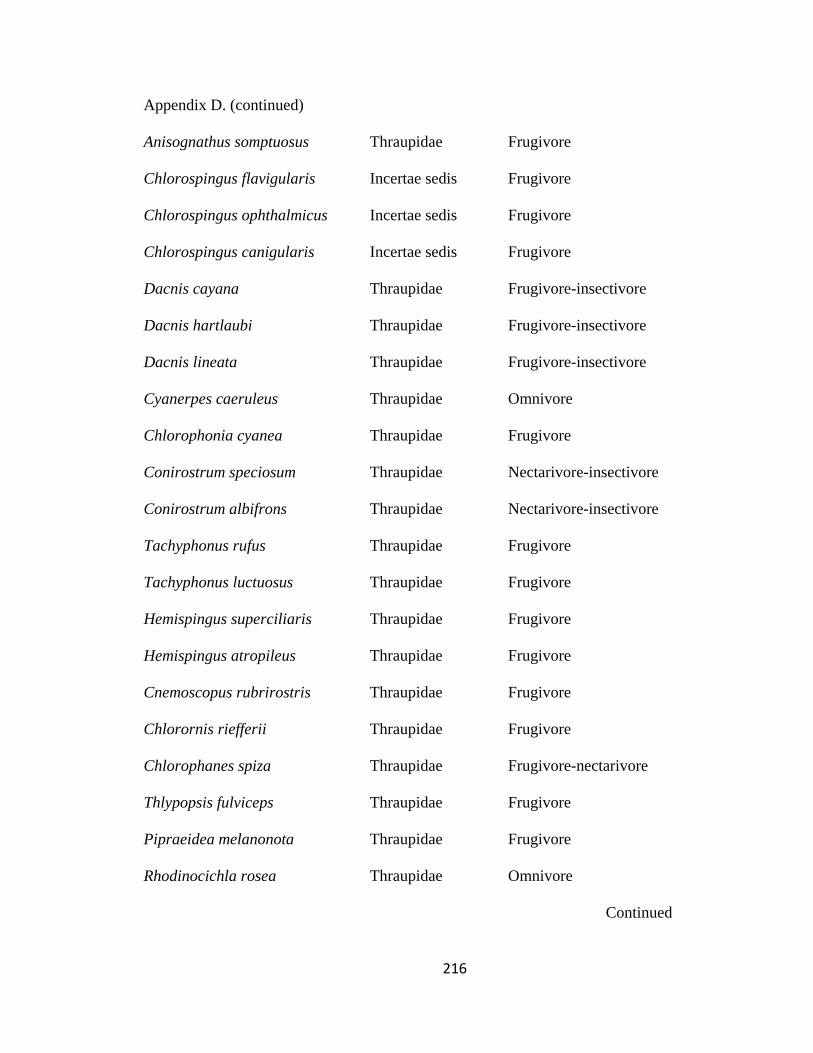
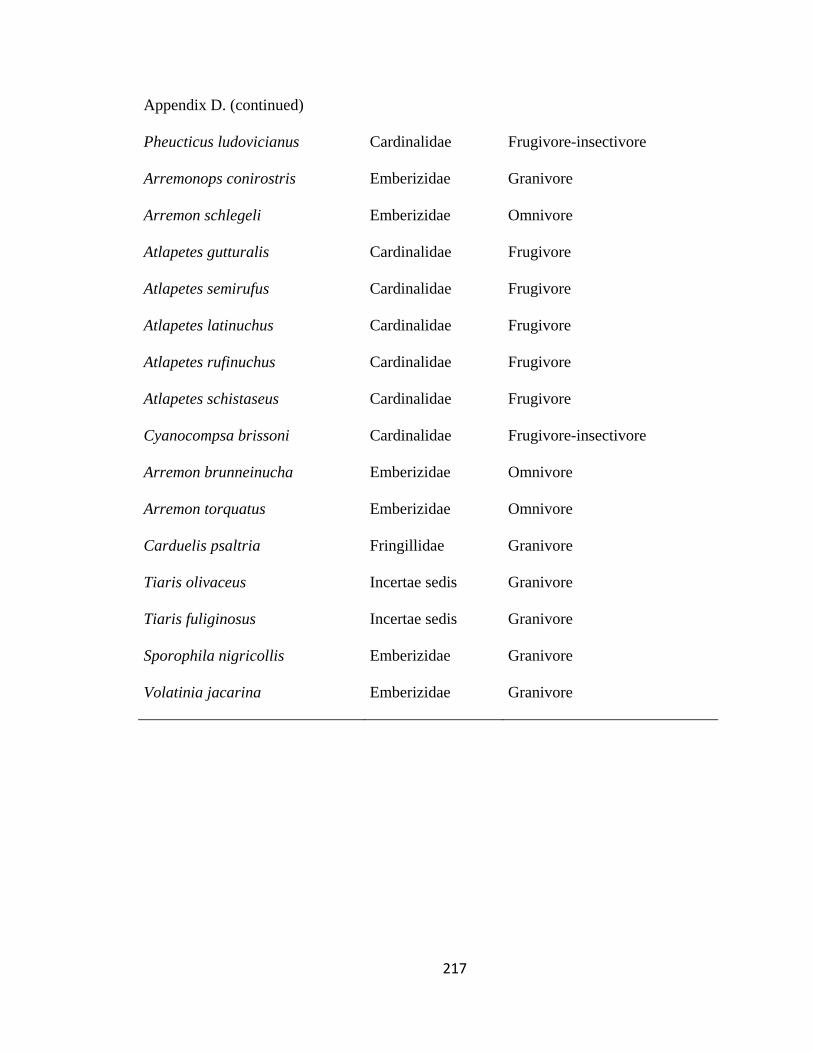
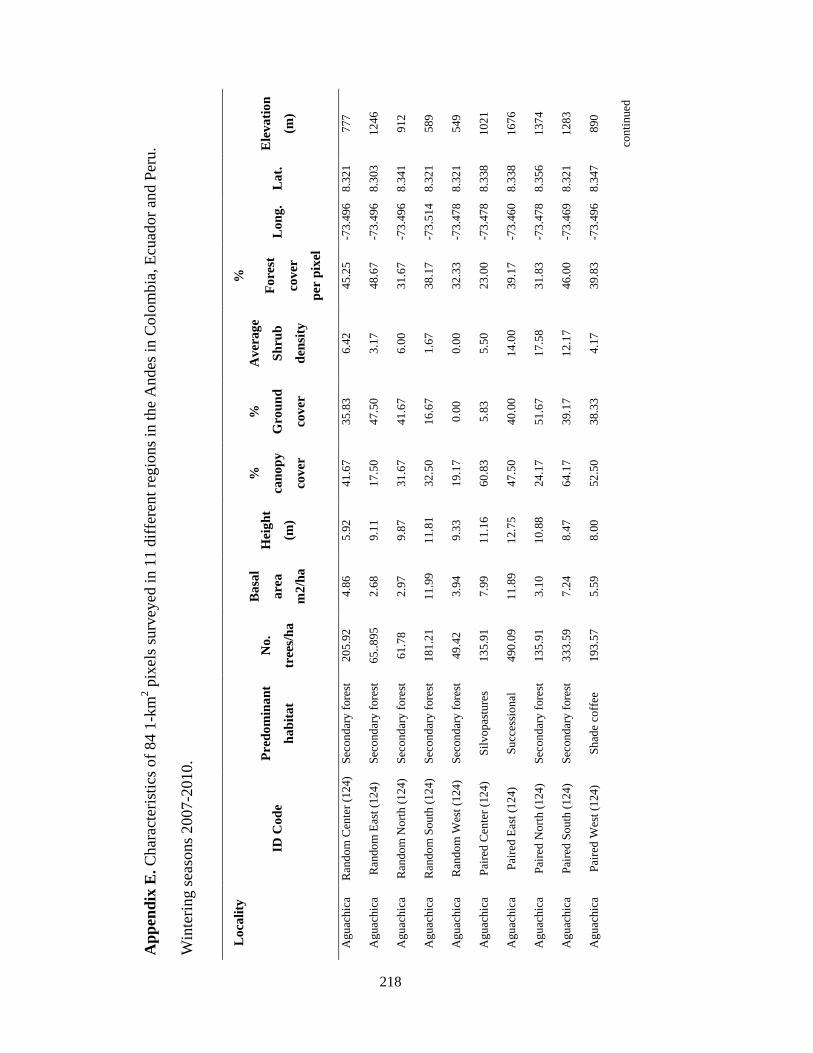
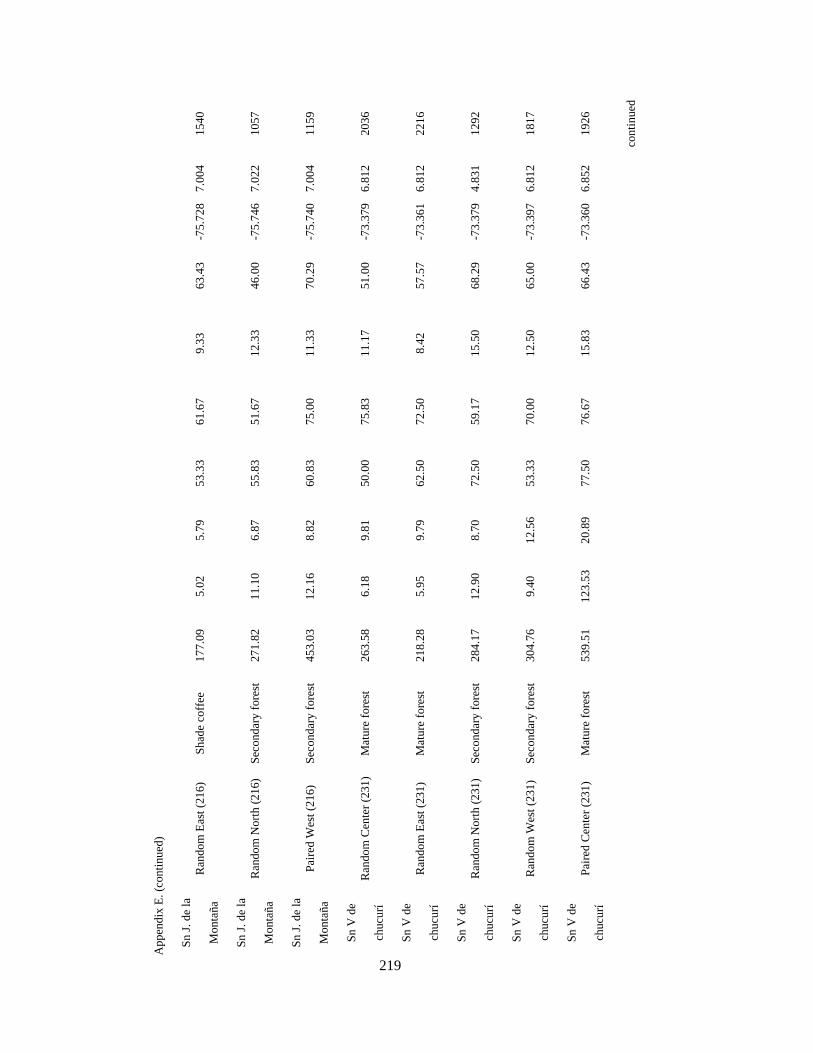
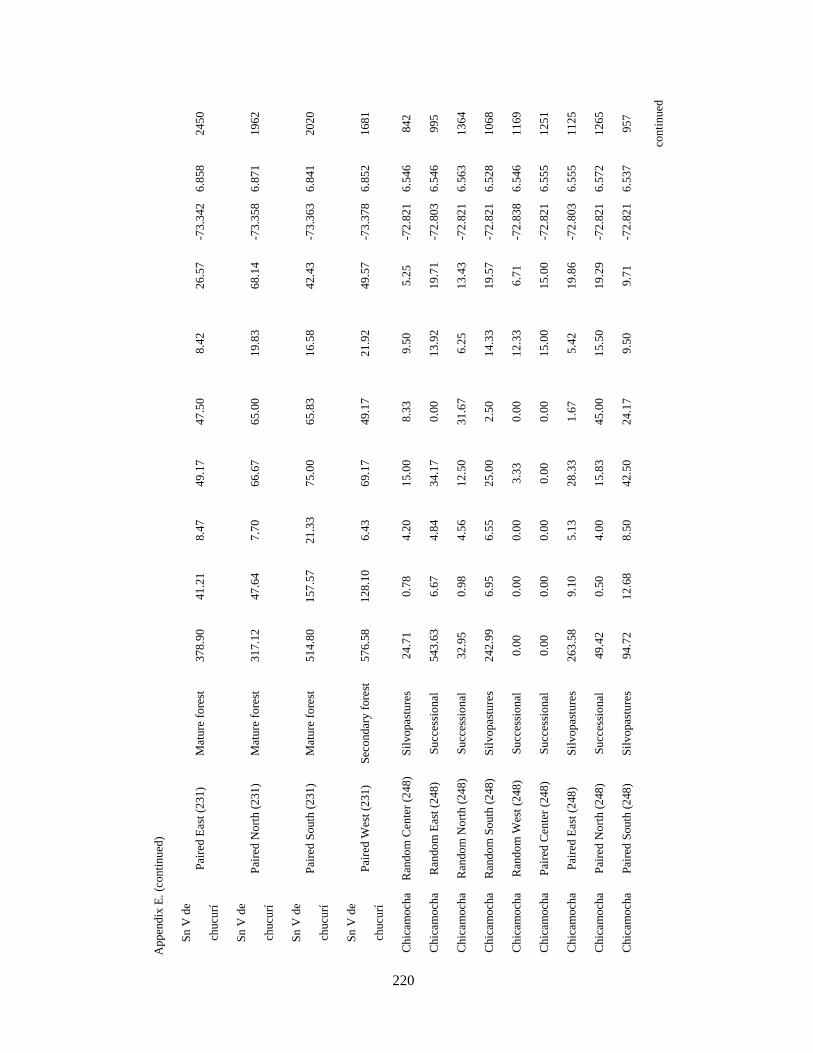
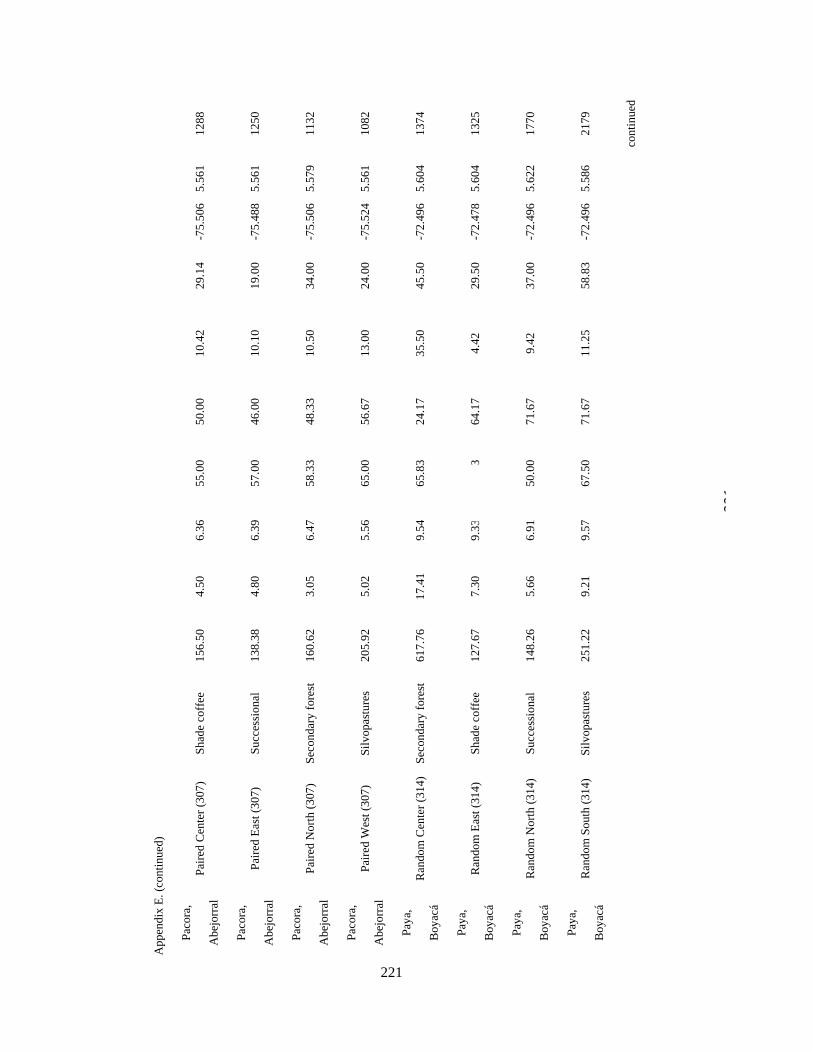
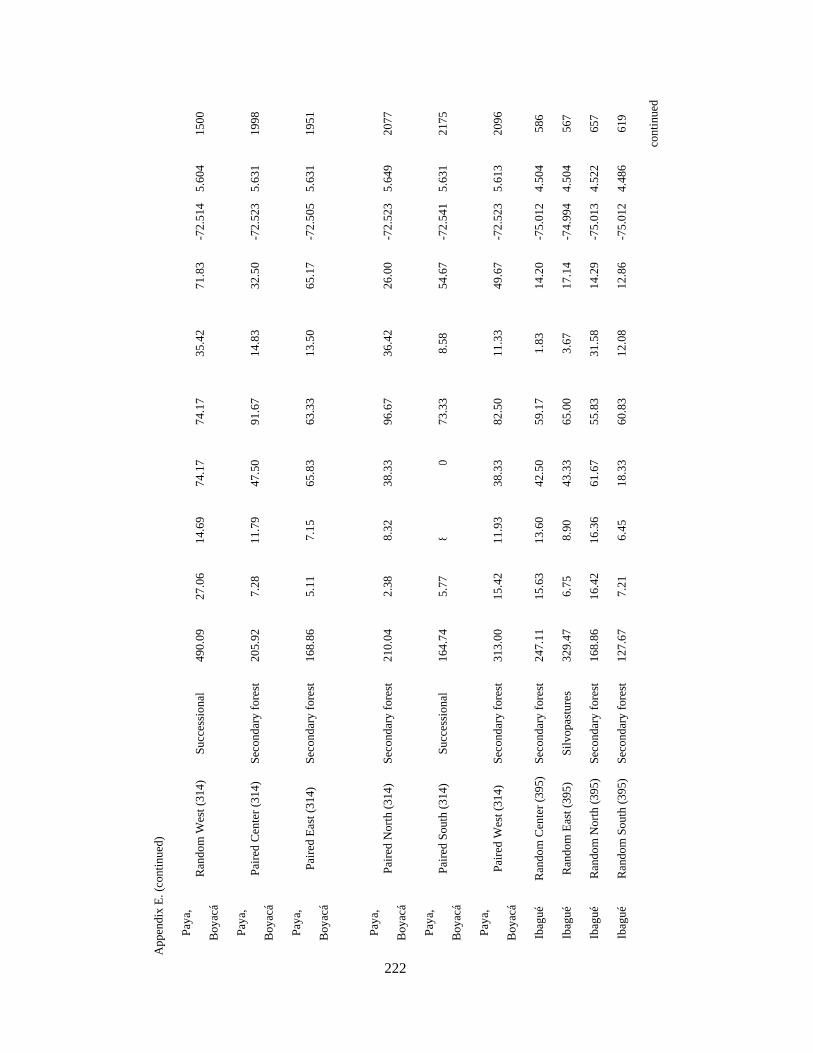
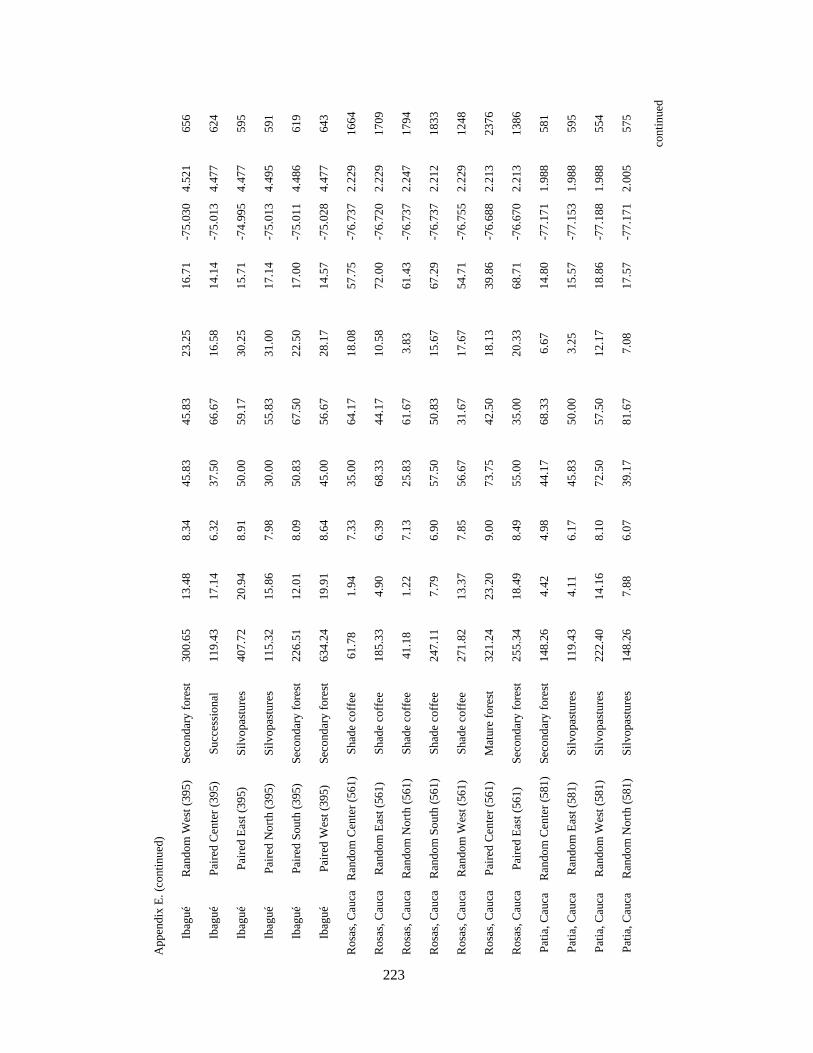
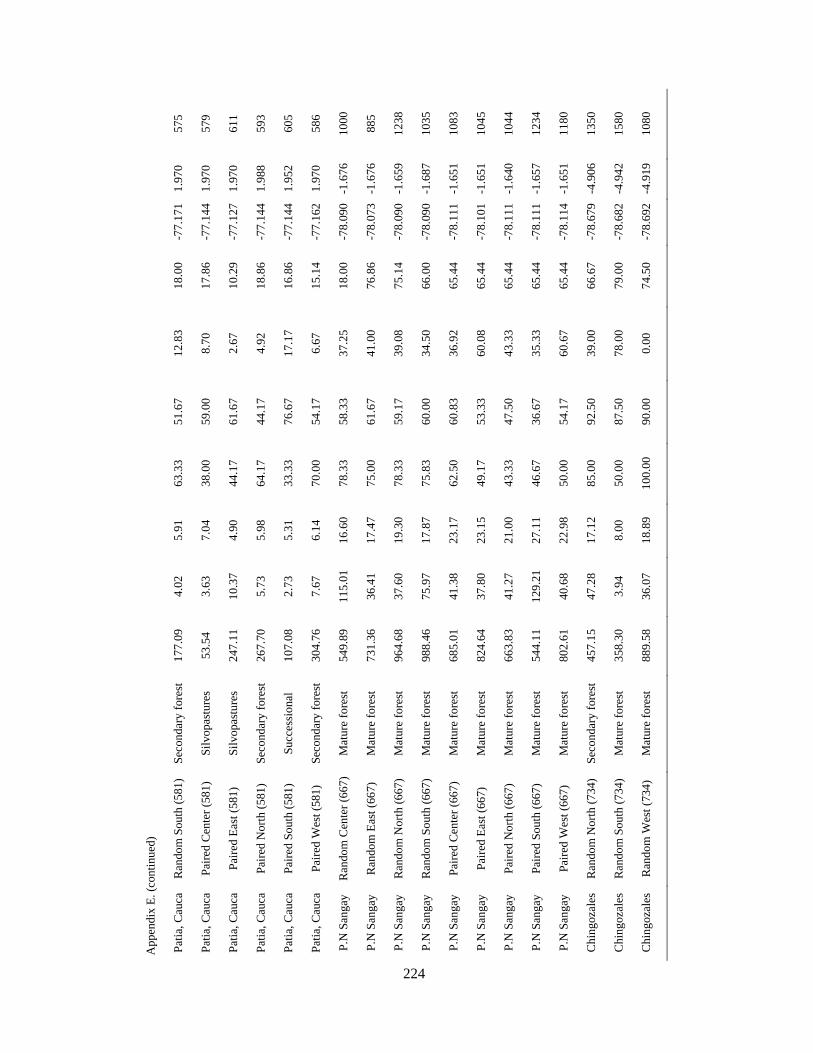
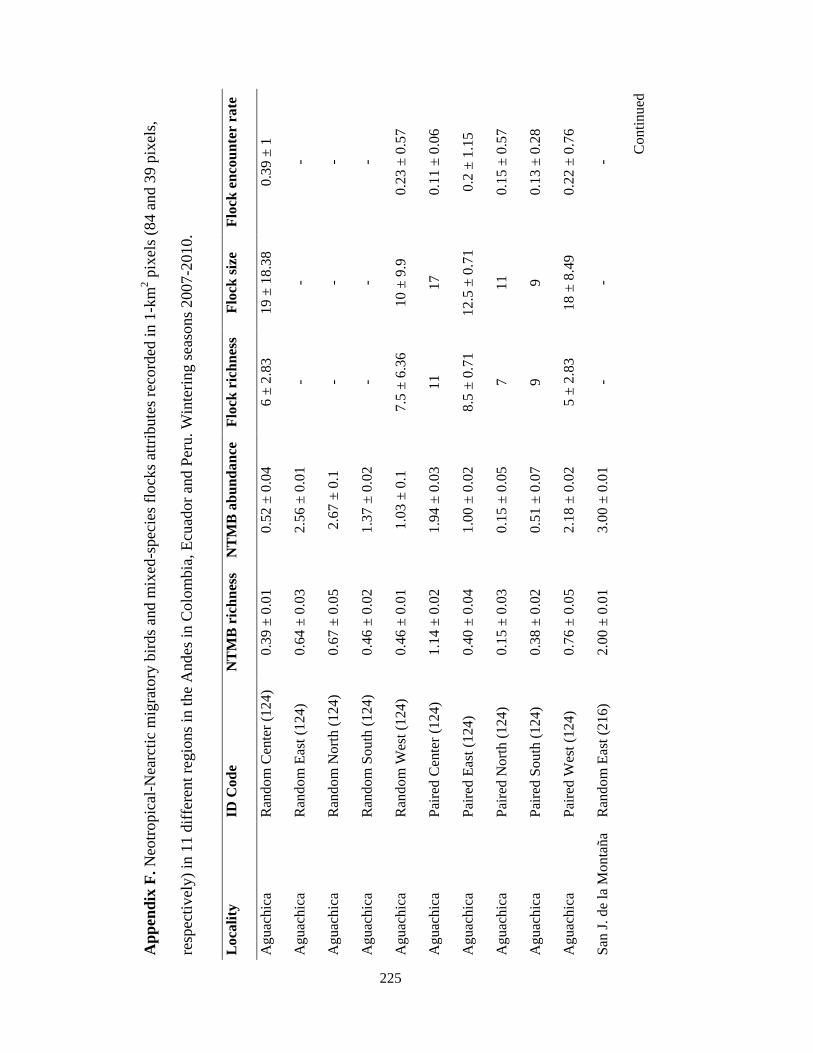
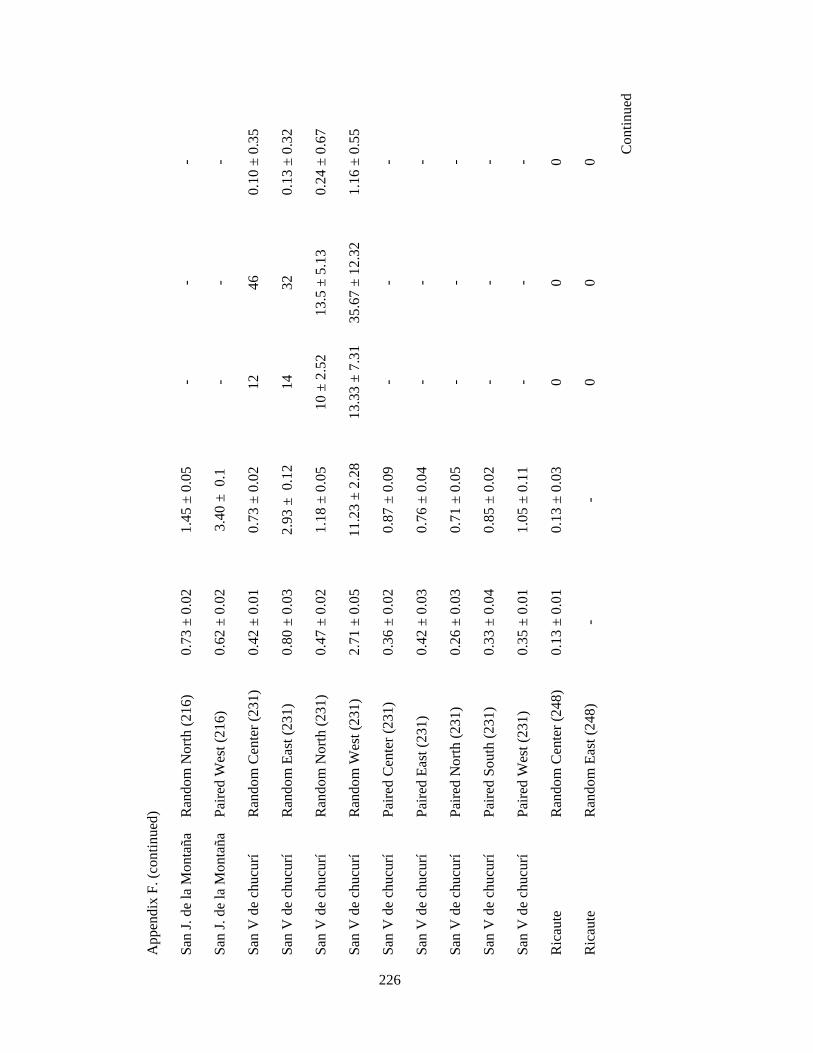
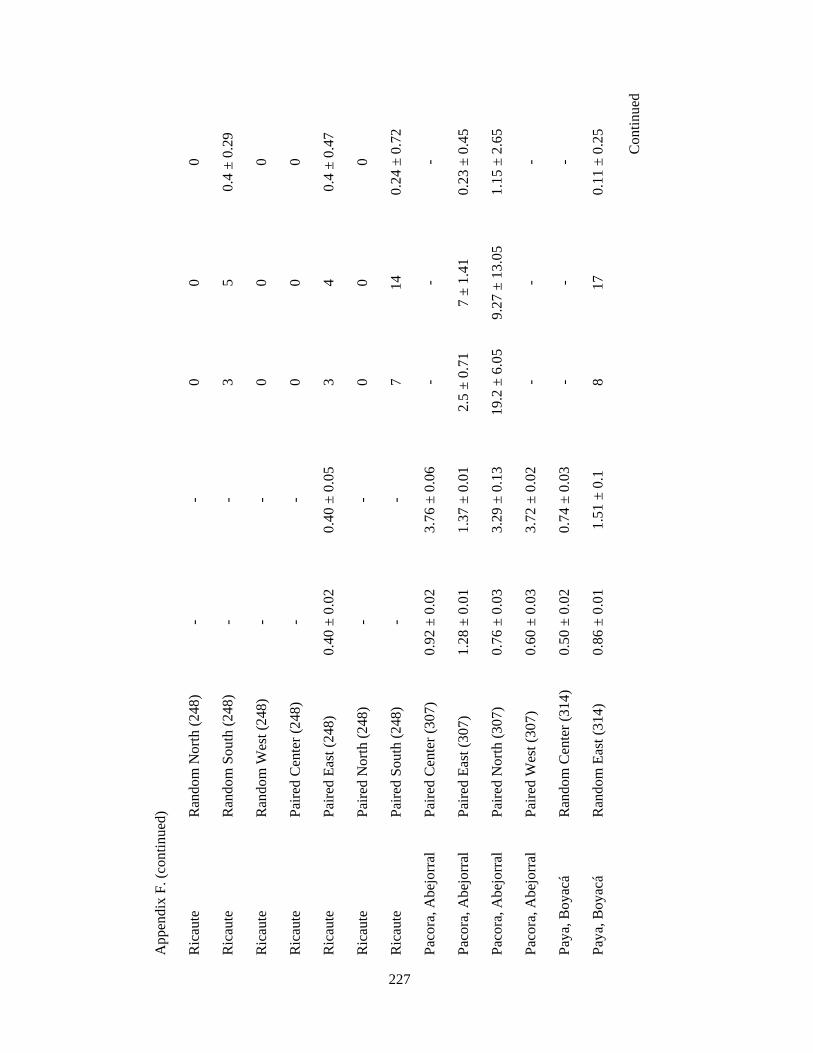
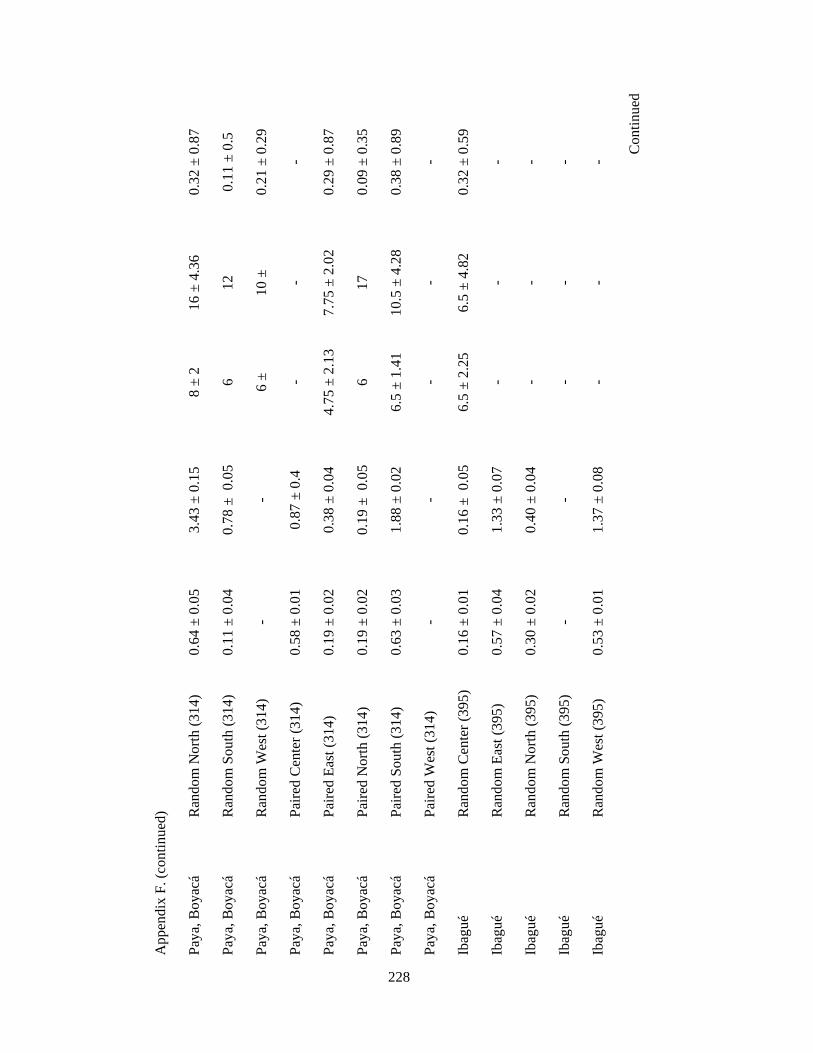
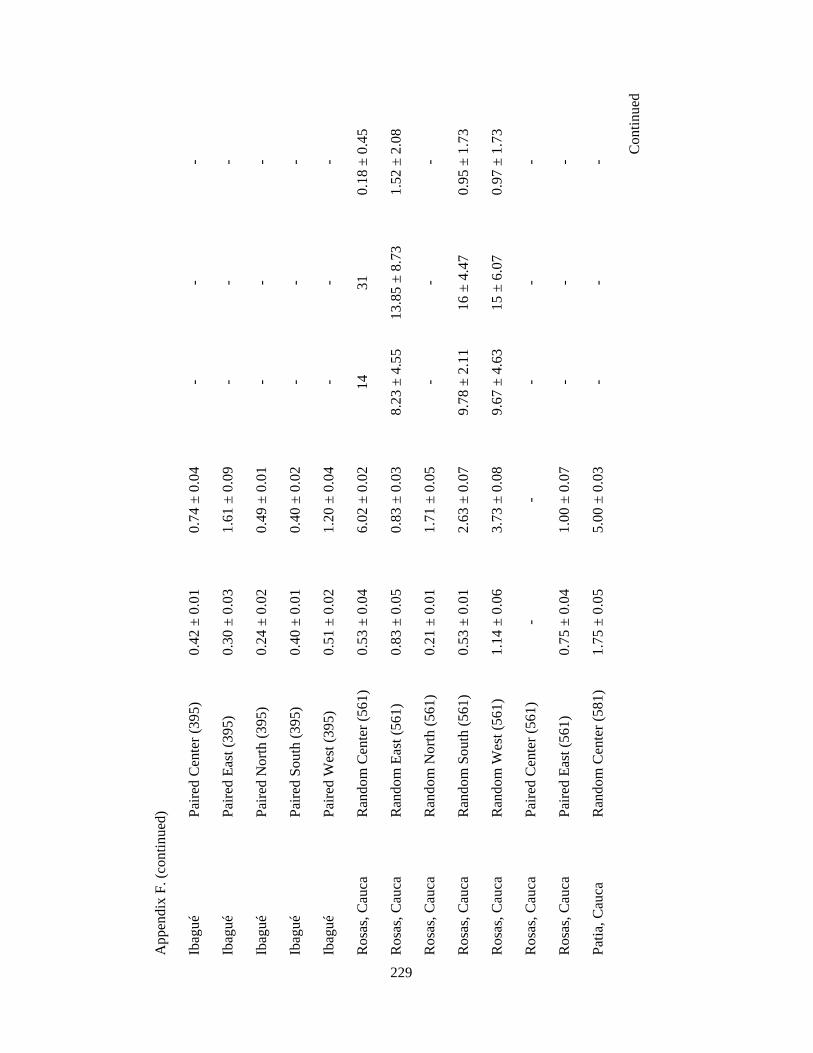
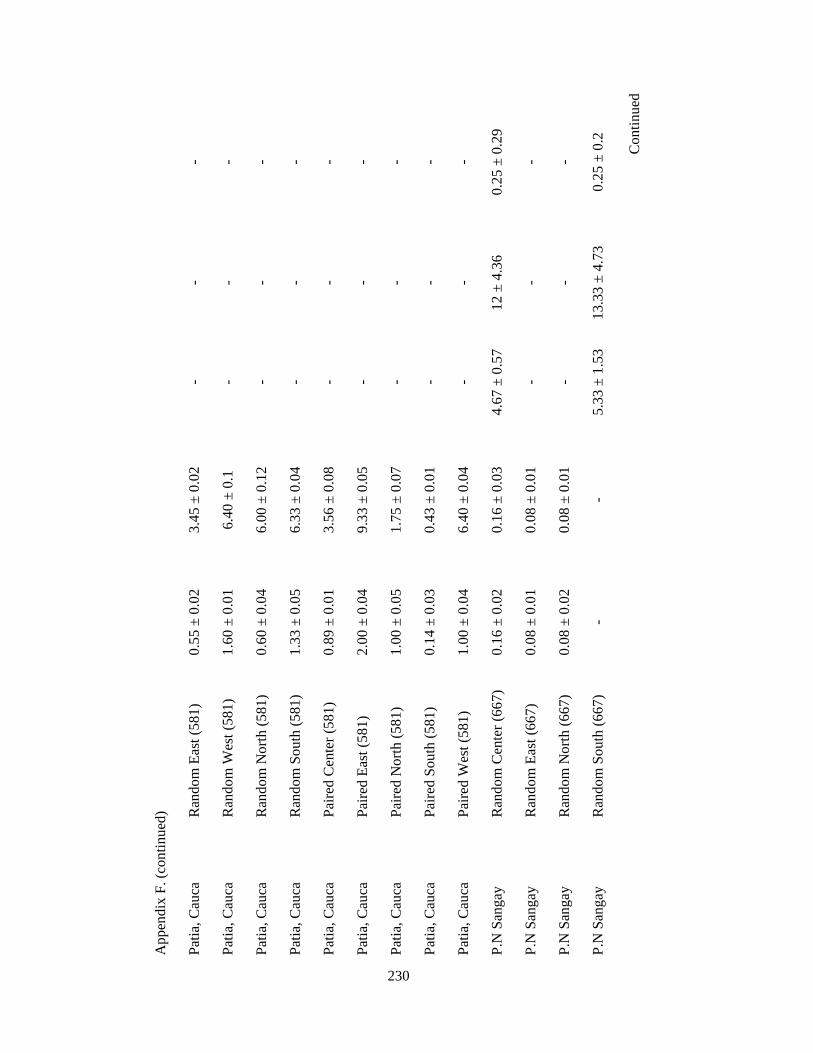
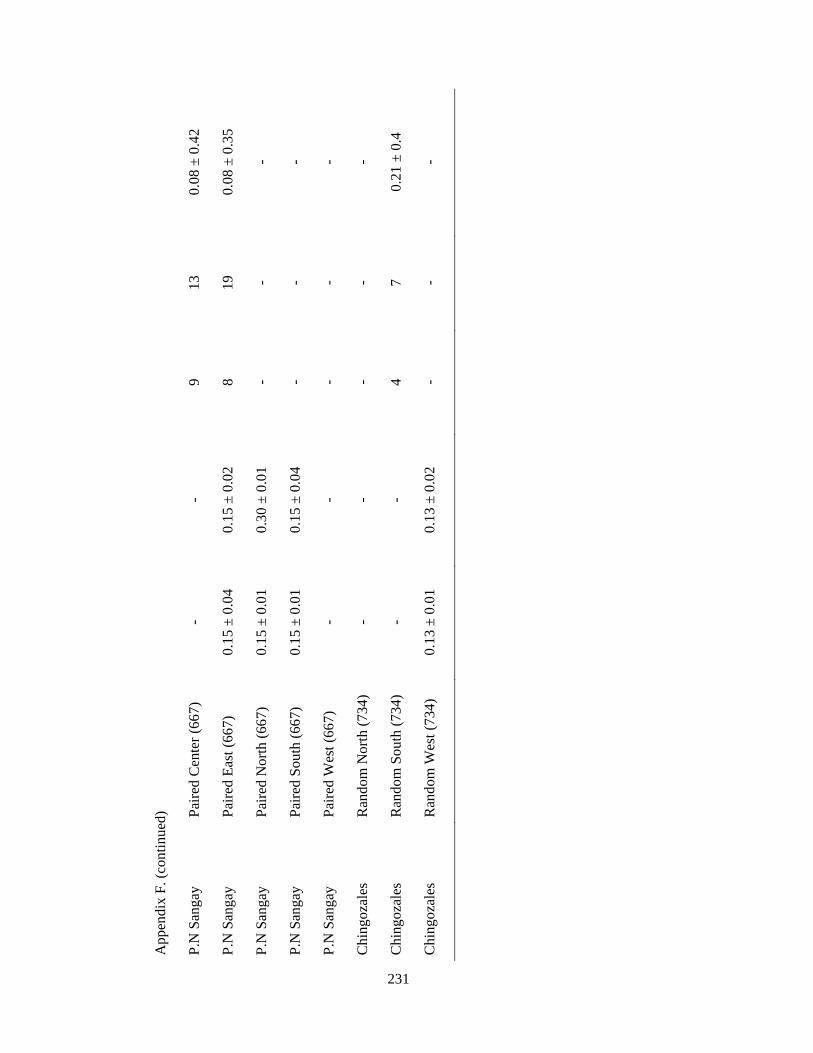
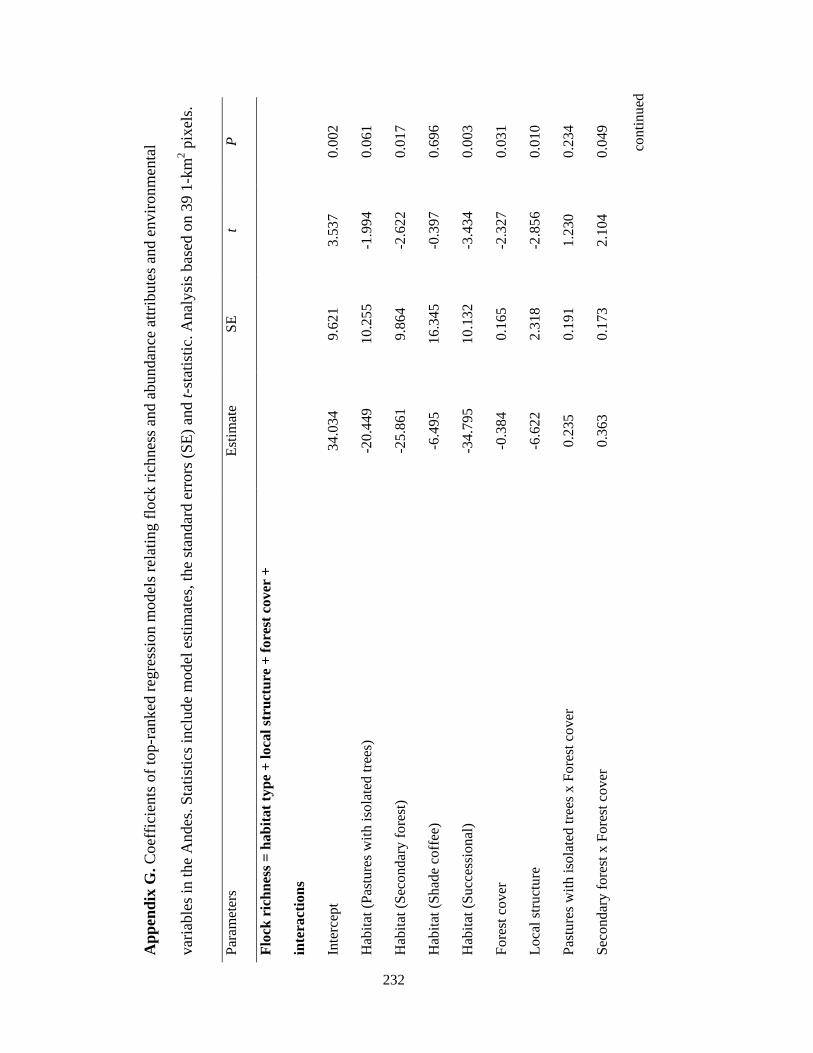
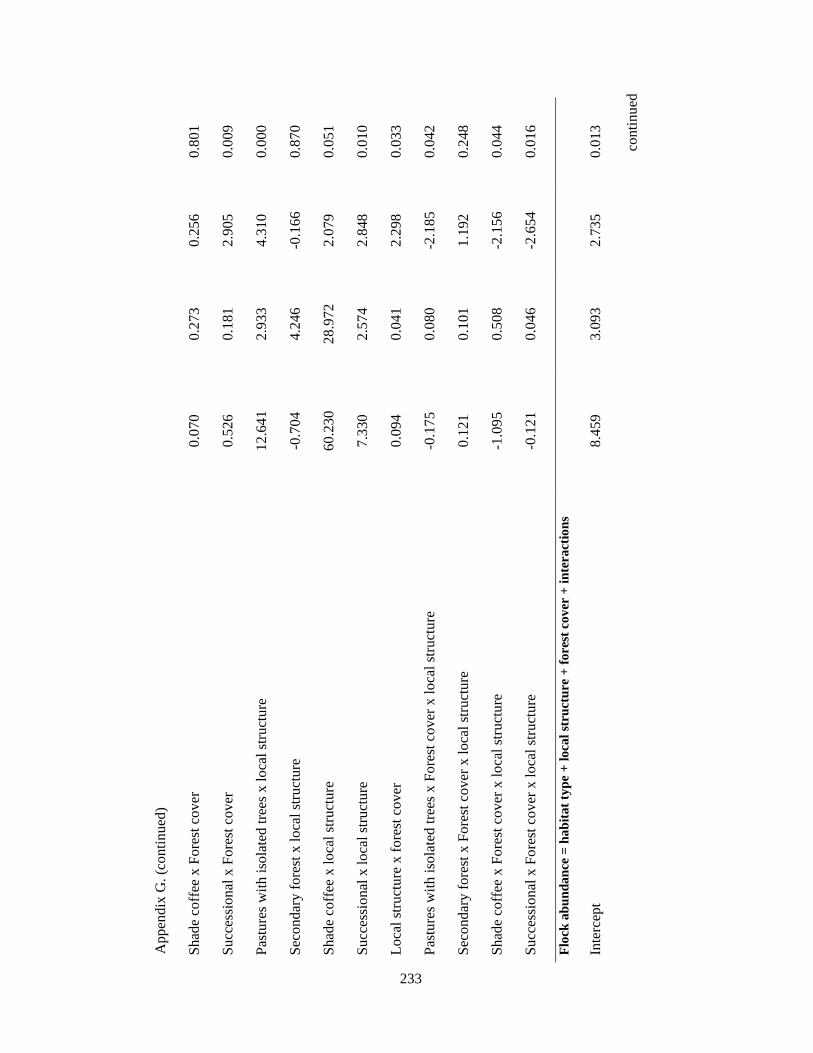
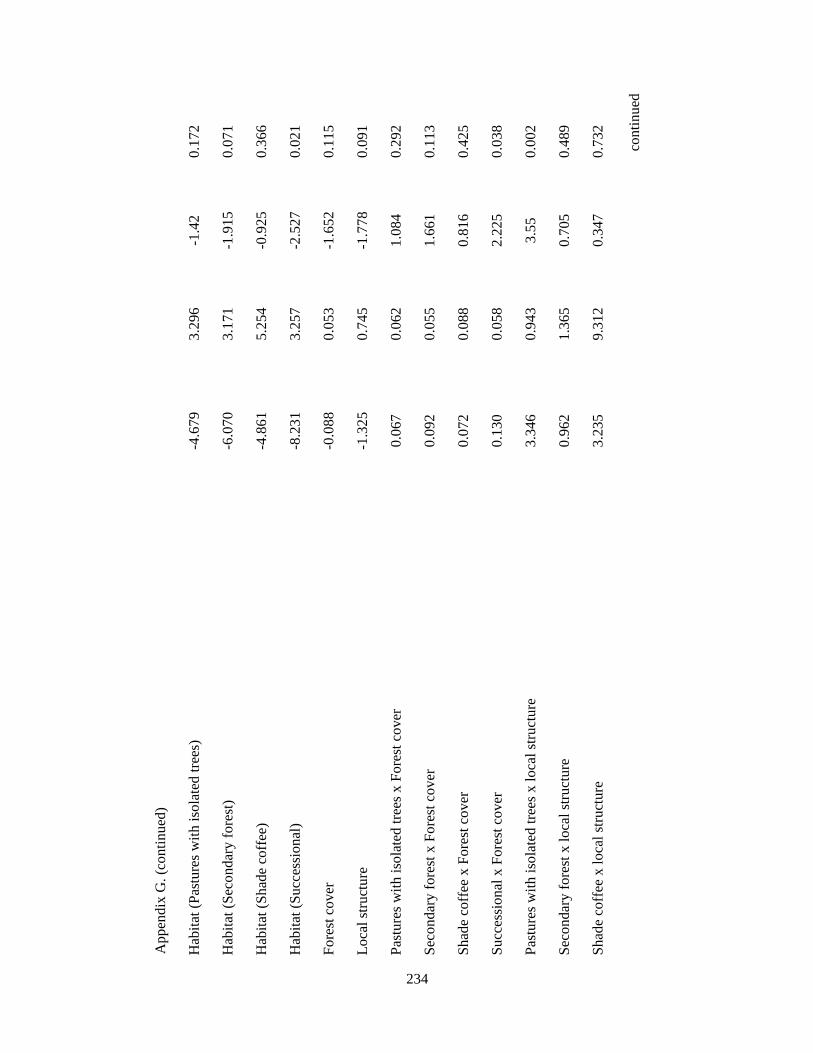
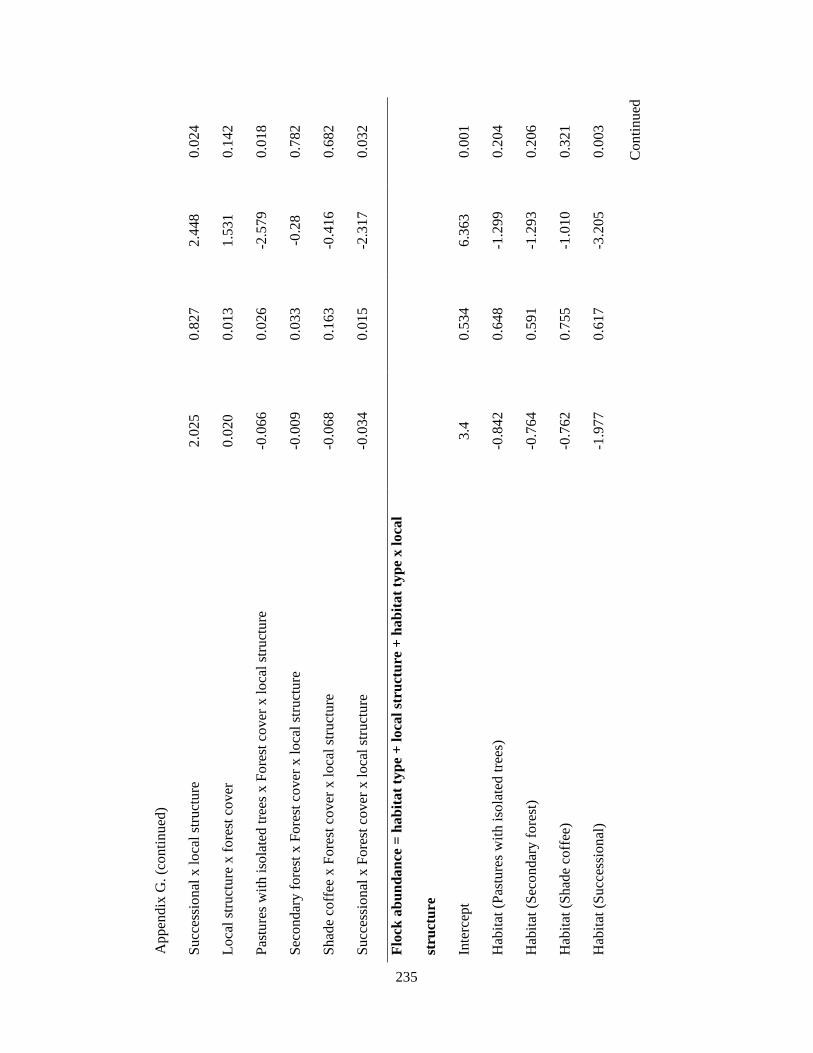
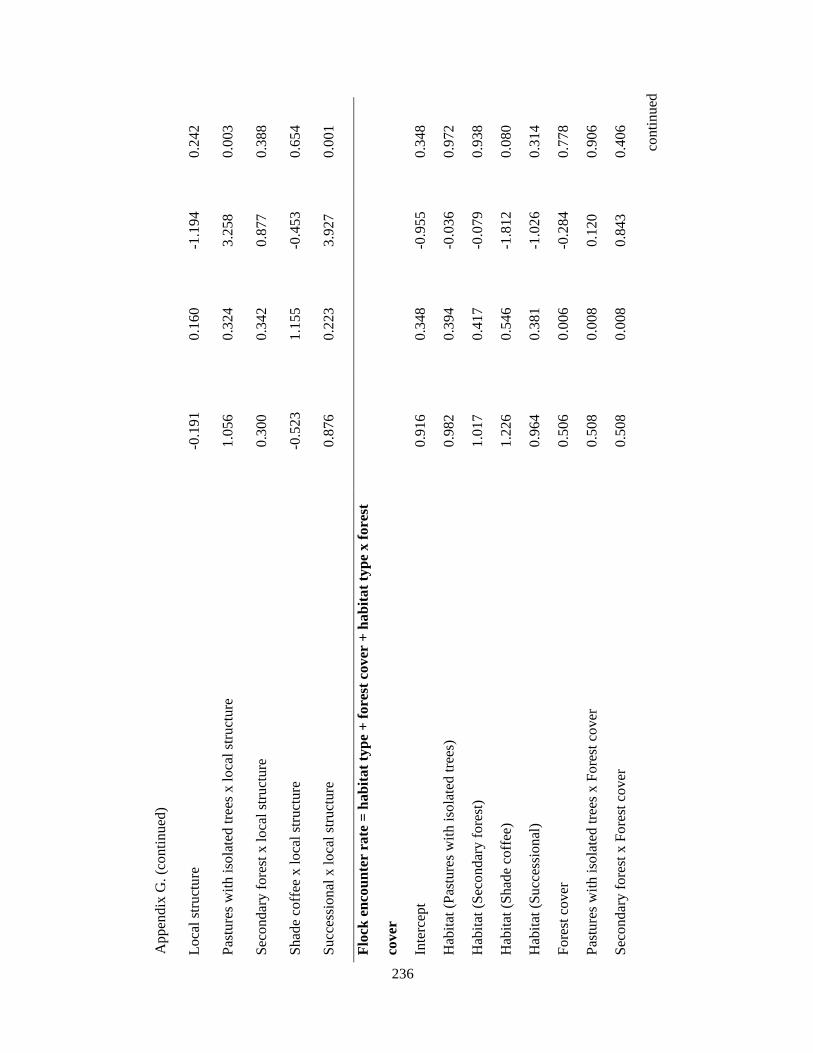
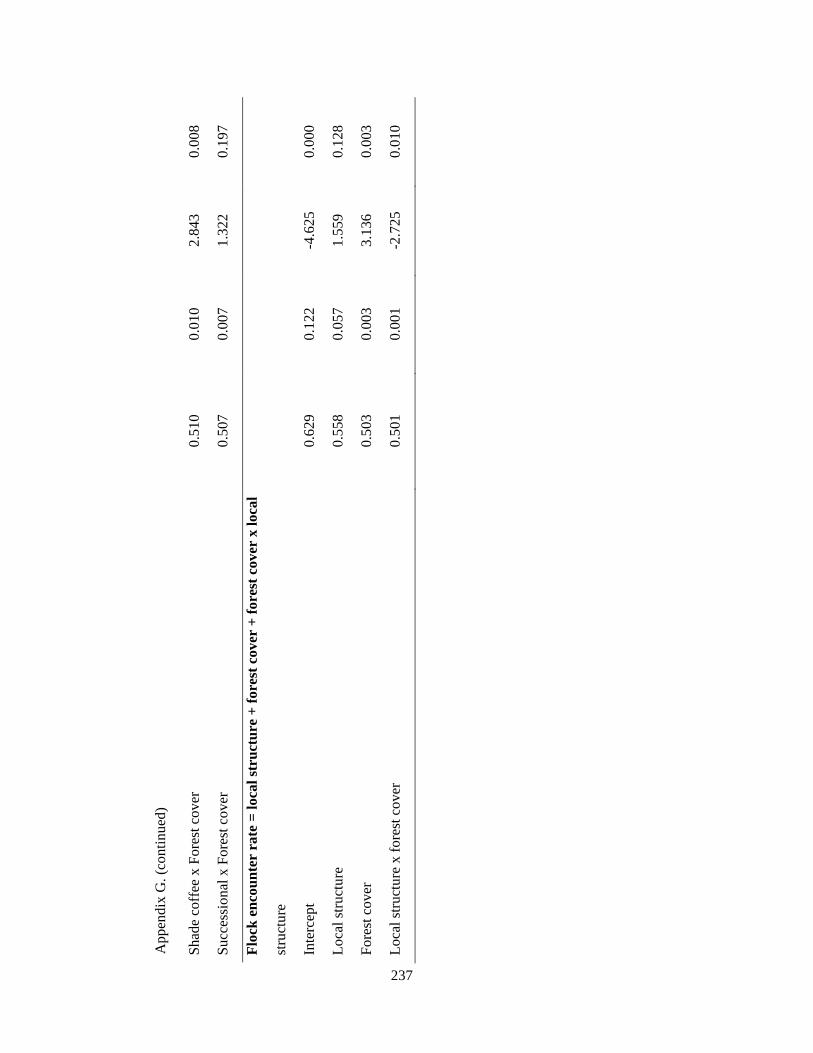
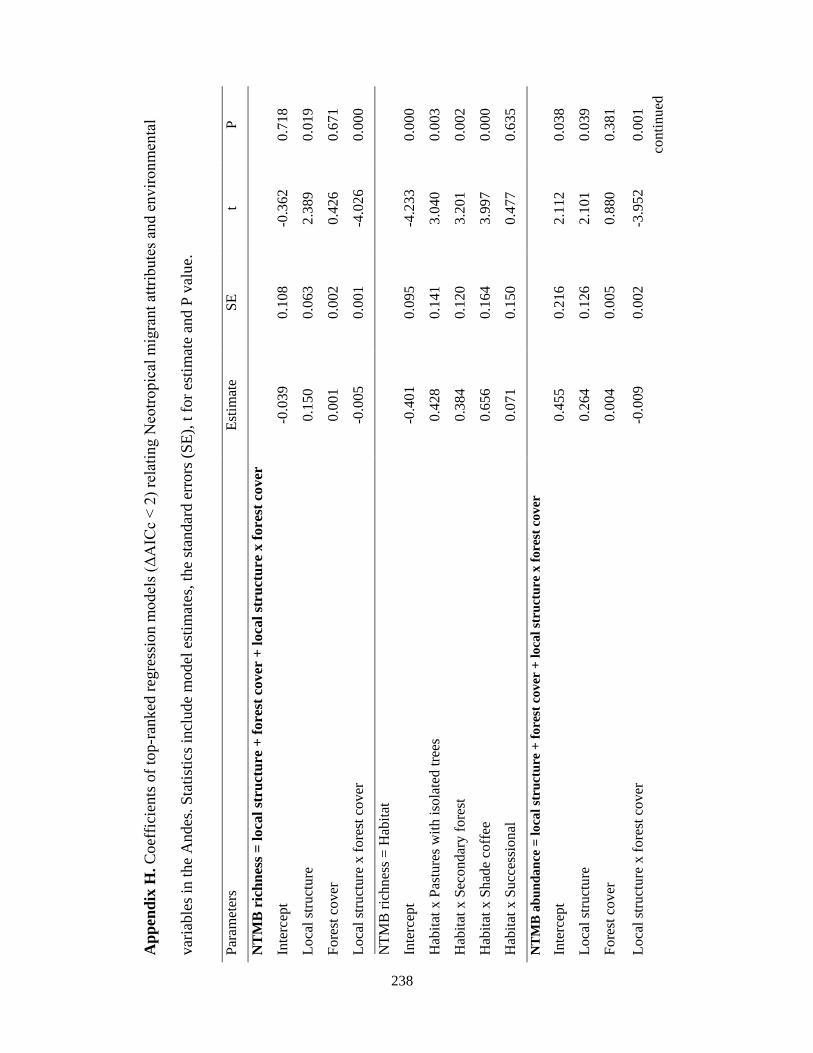
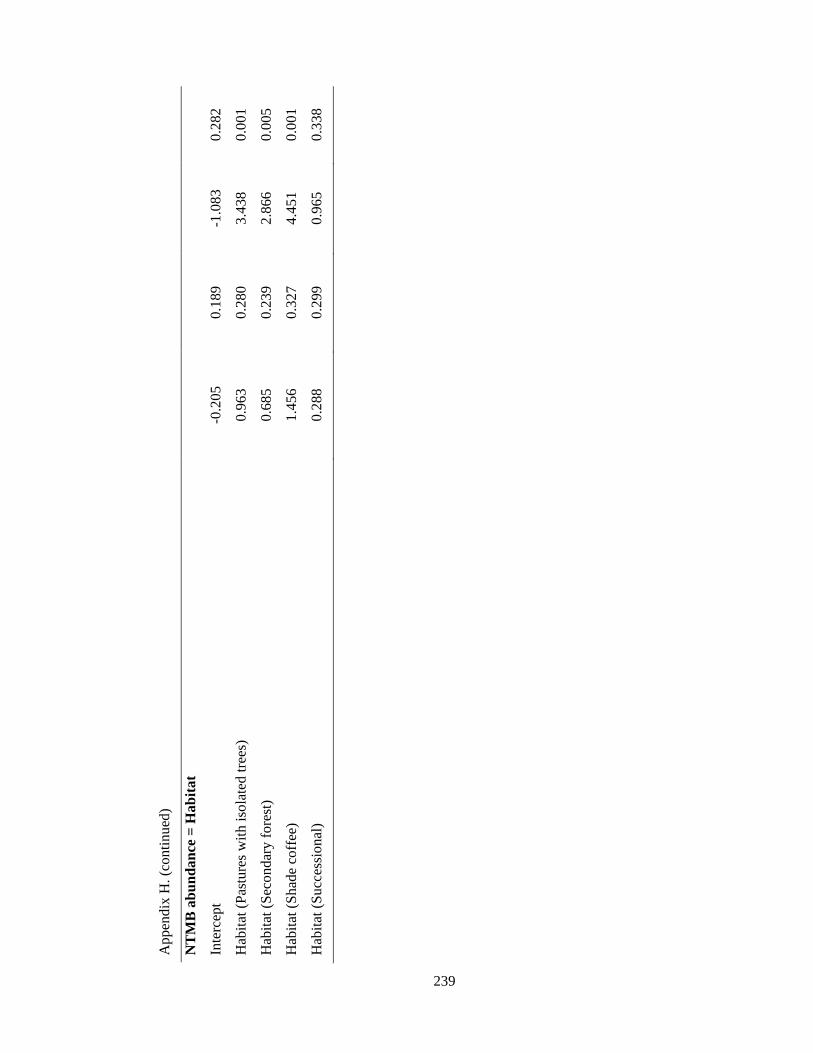
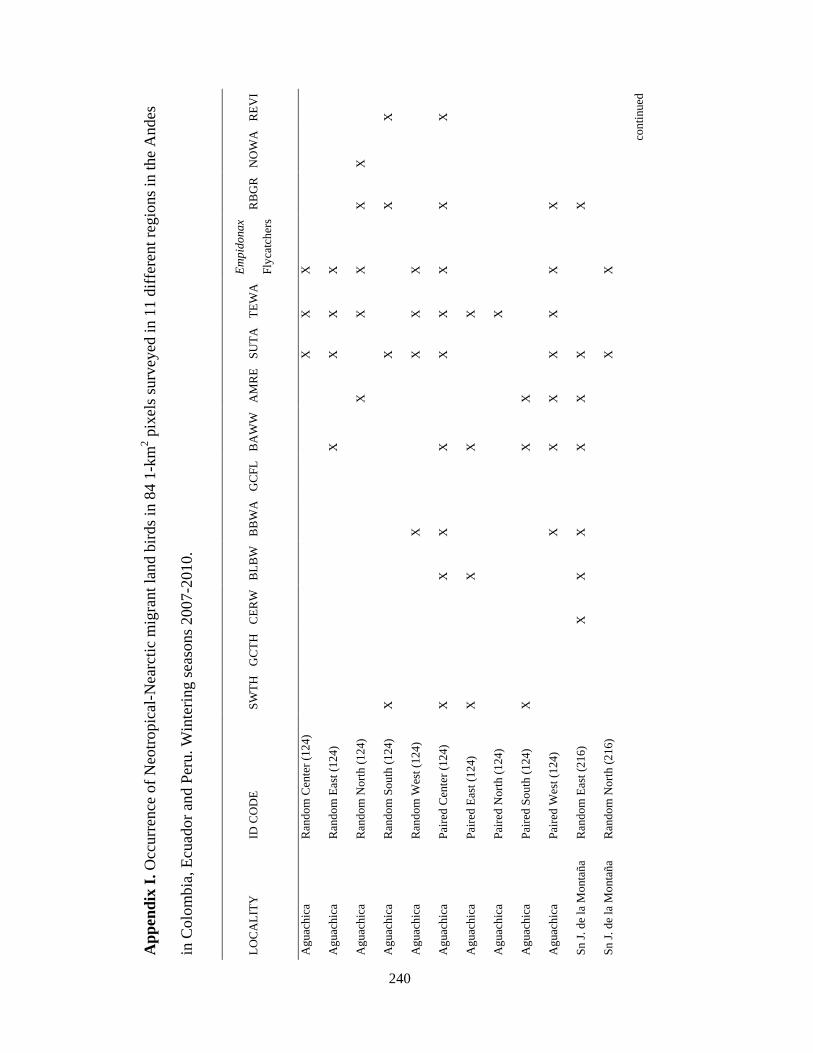
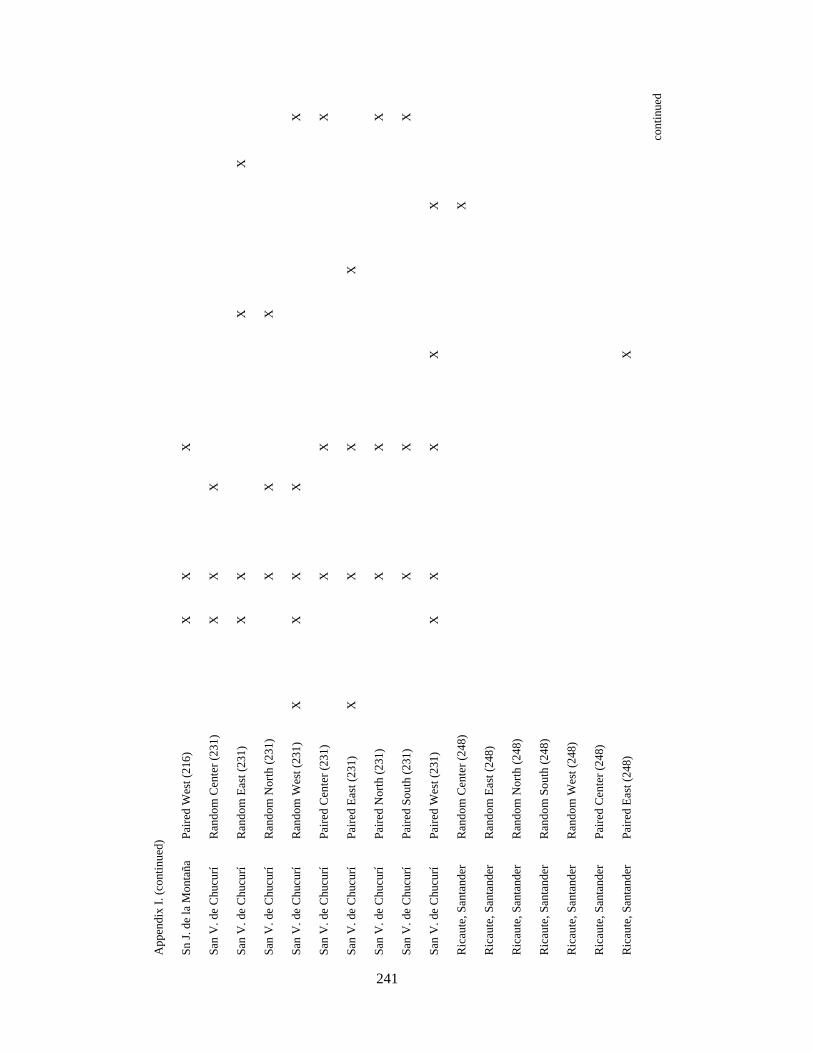
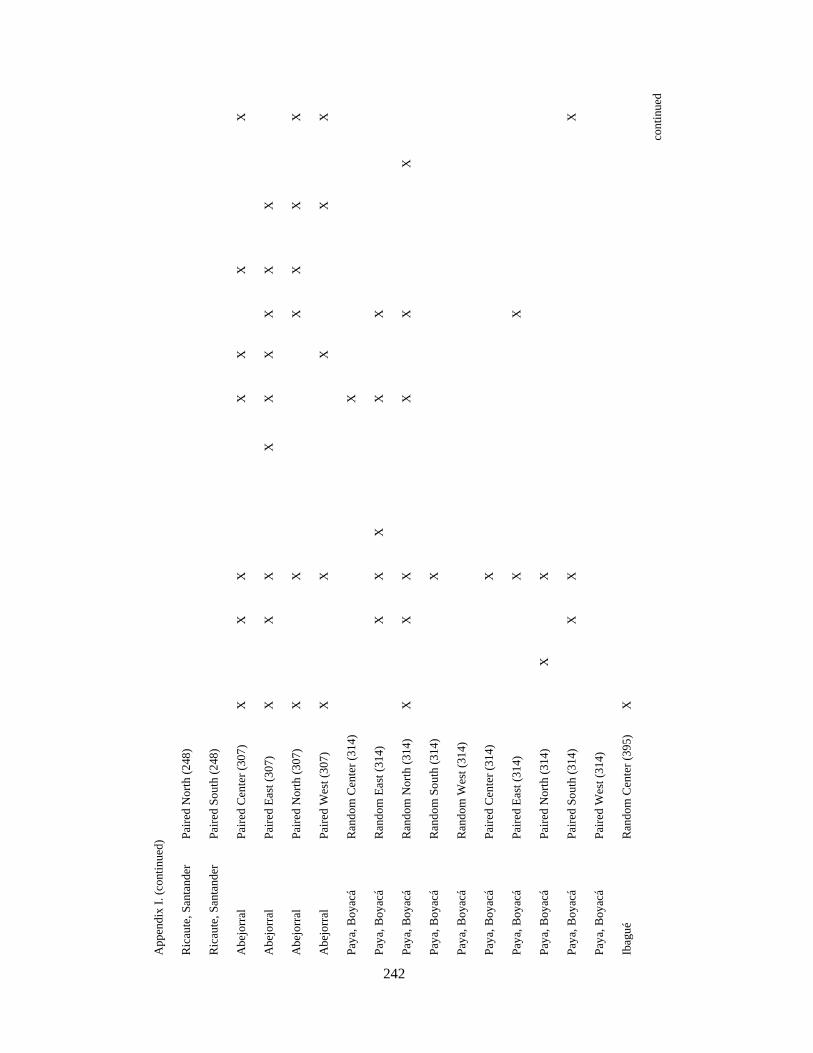
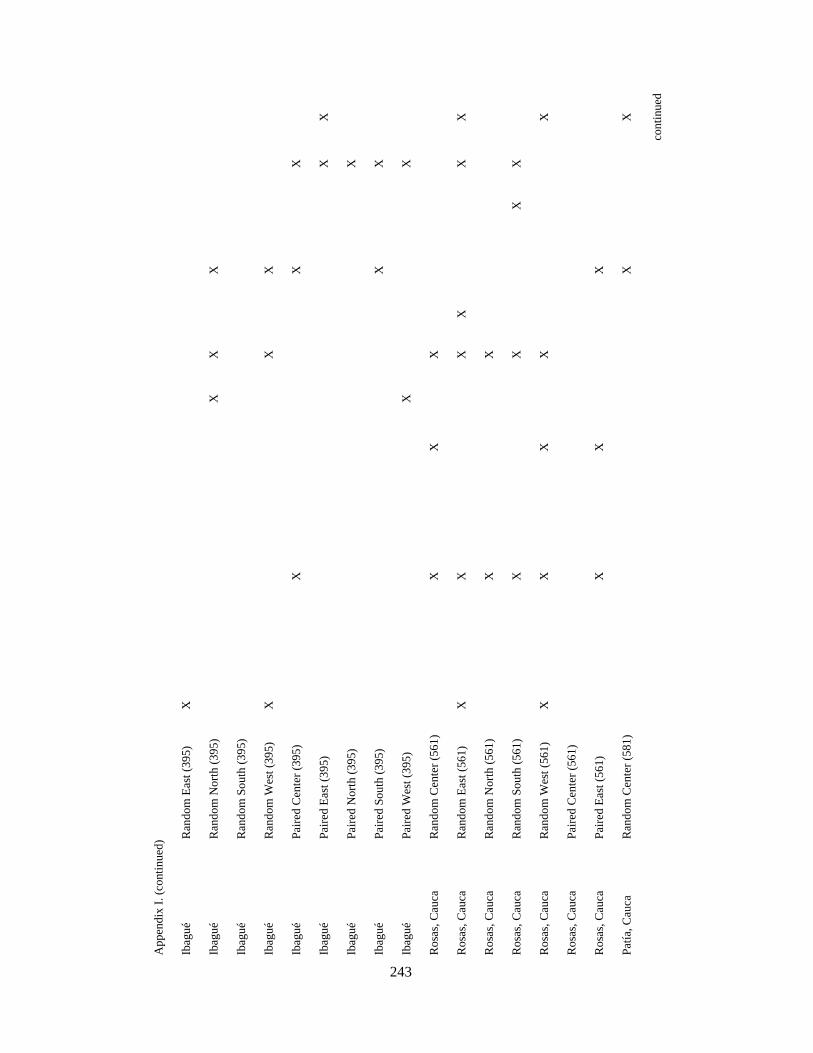
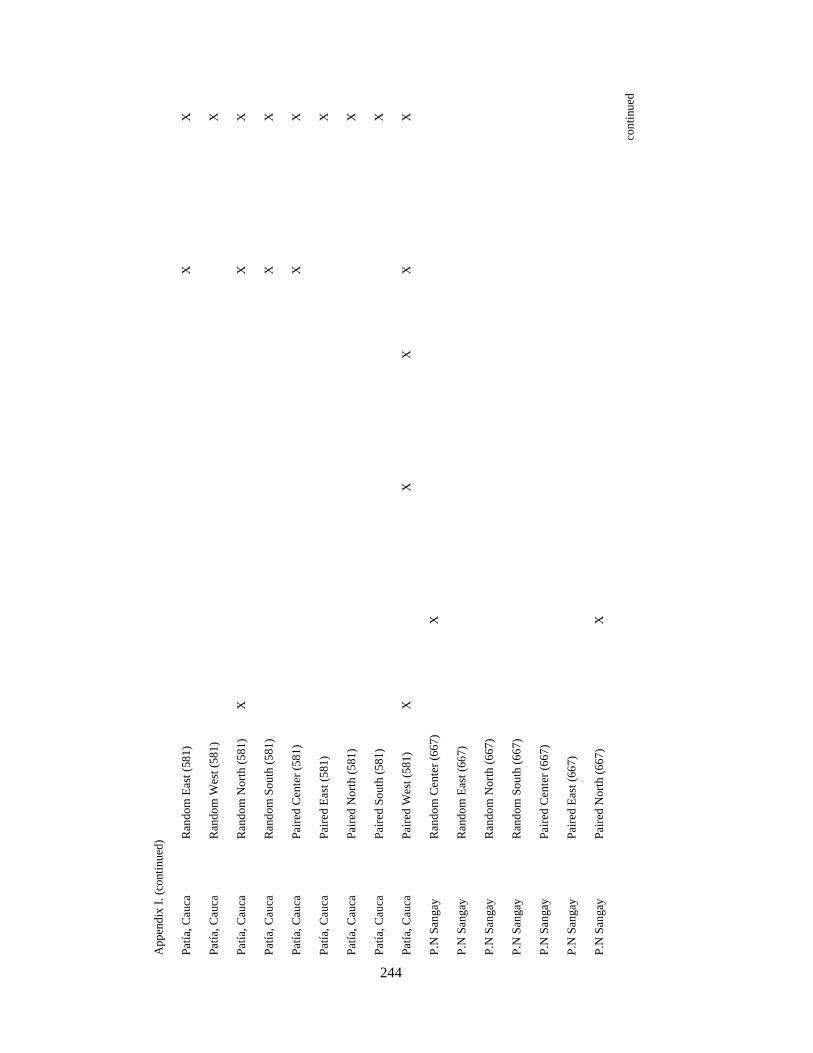
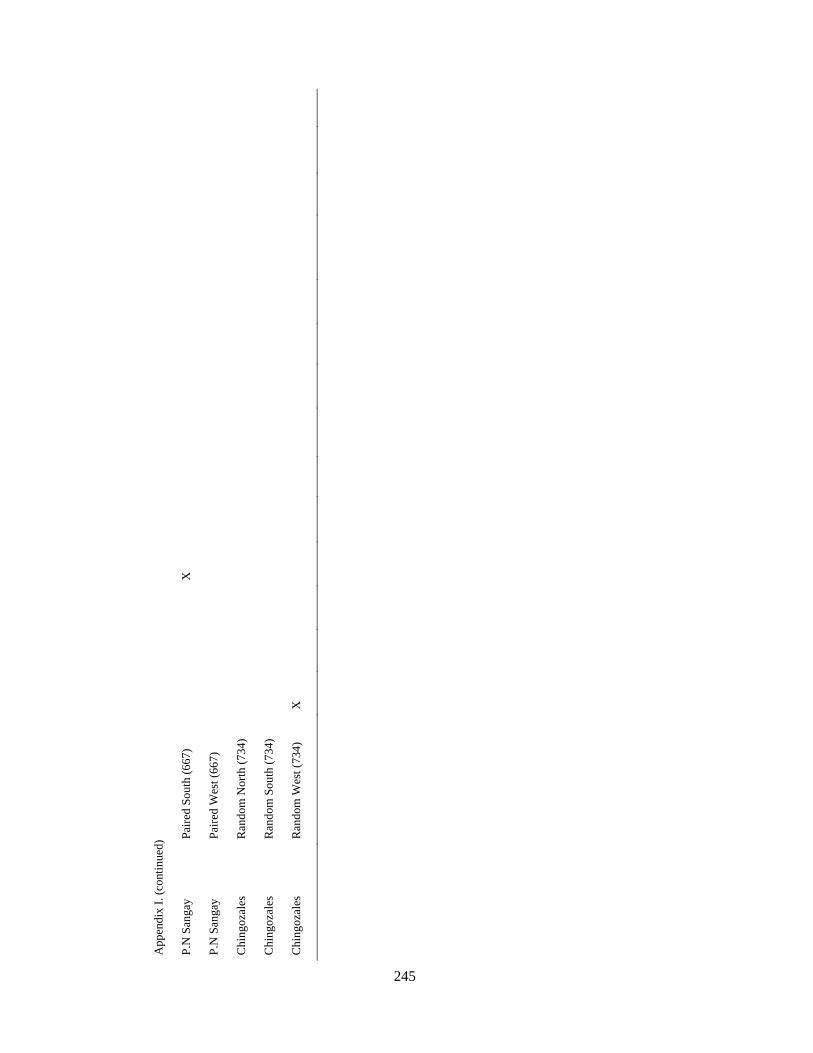
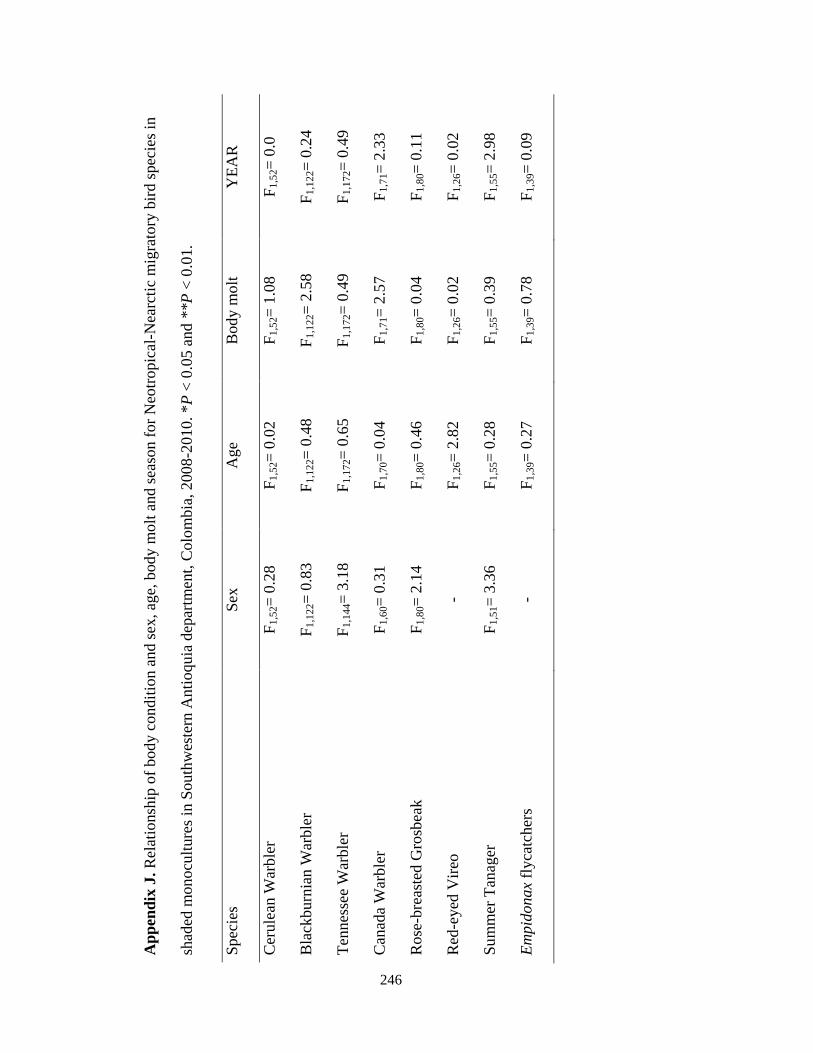


![Neotropical cervidology_12[1]](https://static.documents.pub/doc/80x56/547f4ab5b37959a22b8b56e0/neotropical-cervidology121.jpg)


