Downloaded from ebooks.lab-aids.com Downloaded from ebooks.lab-aids.com Downloaded from ebooks.lab-aids.com Downloaded from ebooks.lab-aids.com Downloaded from ebooks.lab-aids.com Downloaded from ebooks.lab-aids.com Downloaded from ebooks.lab-aids.com Downloaded from ebooks.lab-aids.com Downloaded from ebooks.lab-aids.com Downloaded from ebooks.lab-aids.com Downloaded from ebooks.lab-aids.com Downloaded from ebooks.lab-aids.com Downloaded from ebooks.lab-aids.com Downloaded from ebooks.lab-aids.com Downloaded from ebooks.lab-aids.com Downloaded from ebooks.lab-aids.com Downloaded from ebooks.lab-aids.com Downloaded from ebooks.lab-aids.com Downloaded from ebooks.lab-aids.com Downloaded from ebooks.lab-aids.com Downloaded from ebooks.lab-aids.com Downloaded from ebooks.lab-aids.com Downloaded from ebooks.lab-aids.com Downloaded from ebooks.lab-aids.com Downloaded from ebooks.lab-aids.com Downloaded from ebooks.lab-aids.com Downloaded from ebooks.lab-aids.com Downloaded from ebooks.lab-aids.com Downloaded from ebooks.lab-aids.com Downloaded from ebooks.lab-aids.com Downloaded from ebooks.lab-aids.com Downloaded from ebooks.lab-aids.com Downloaded from ebooks.lab-aids.com Downloaded from ebooks.lab-aids.com Downloaded from ebooks.lab-aids.com Downloaded from ebooks.lab-aids.com Downloaded from ebooks.lab-aids.com Downloaded from ebooks.lab-aids.com Downloaded from ebooks.lab-aids.com Downloaded from ebooks.lab-aids.com Downloaded from ebooks.lab-aids.com Downloaded from ebooks.lab-aids.com Downloaded from ebooks.lab-aids.com Downloaded from ebooks.lab-aids.com Downloaded from ebooks.lab-aids.com Downloaded from ebooks.lab-aids.com Downloaded from ebooks.lab-aids.com Downloaded from ebooks.lab-aids.com Downloaded from ebooks.lab-aids.com Downloaded from ebooks.lab-aids.com Downloaded from ebooks.lab-aids.com Downloaded from ebooks.lab-aids.com Downloaded from ebooks.lab-aids.com Downloaded from ebooks.lab-aids.com Downloaded from ebooks.lab-aids.com Downloaded from ebooks.lab-aids.com Downloaded from ebooks.lab-aids.com Downloaded from ebooks.lab-aids.com Downloaded from ebooks.lab-aids.com Downloaded from ebooks.lab-aids.com Downloaded from ebooks.lab-aids.com Downloaded from ebooks.lab-aids.com Downloaded from ebooks.lab-aids.com Downloaded from ebooks.lab-aids.com Downloaded from ebooks.lab-aids.com Downloaded from ebooks.lab-aids.com Downloaded from ebooks.lab-aids.com Downloaded from ebooks.lab-aids.com Downloaded from ebooks.lab-aids.com Downloaded from ebooks.lab-aids.com Downloaded from ebooks.lab-aids.com Downloaded from ebooks.lab-aids.com Downloaded from ebooks.lab-aids.com Downloaded from ebooks.lab-aids.com Downloaded from ebooks.lab-aids.com Downloaded from ebooks.lab-aids.com Downloaded from ebooks.lab-aids.com Downloaded from ebooks.lab-aids.com Downloaded from ebooks.lab-aids.com Downloaded from ebooks.lab-aids.com Downloaded from ebooks.lab-aids.com E-3 M ichael loved to bike through the park. The air smelled fresher there than on the street, and he always saw so many interesting things. Once, he had come across a bird’s nest with several young chicks still in it. As he watched, one of the parents had brought food for the chicks to eat. He wondered if he would see anything like that today. Suddenly, he saw a small frog near the edge of Turtle Pond. It looked very familiar. In fact, it looked just like the frog his sister kept as a pet. It was different from the frogs he usually saw at Turtle Pond. “Could that be my sister’s frog?” Michael wondered. If so, how did it get there? Did it escape, or could his sister have let it go? Could a pet frog survive in Turtle Pond? How would it affect the other animals that also lived in the pond? • • • What are the relationships between an organism and its environ- ment? What effect do humans have on these relationships? In this unit, you will explore ecology: the study of the relationships between organisms, including humans, and the environment. Ecology Downloaded from ebooks.lab-aids.com
Transcript
Downloaded from ebooks.lab-aids.comDownloaded from ebooks.lab-aids.comDownloaded from ebooks.lab-aids.comDownloaded from ebooks.lab-aids.comDownloaded from ebooks.lab-aids.comDownloaded from ebooks.lab-aids.comDownloaded from ebooks.lab-aids.comDownloaded from ebooks.lab-aids.comDownloaded from ebooks.lab-aids.comDownloaded from ebooks.lab-aids.comDownloaded from ebooks.lab-aids.comDownloaded from ebooks.lab-aids.comDownloaded from ebooks.lab-aids.comDownloaded from ebooks.lab-aids.comDownloaded from ebooks.lab-aids.comDownloaded from ebooks.lab-aids.comDownloaded from ebooks.lab-aids.comDownloaded from ebooks.lab-aids.comDownloaded from ebooks.lab-aids.comDownloaded from ebooks.lab-aids.comDownloaded from ebooks.lab-aids.comDownloaded from ebooks.lab-aids.comDownloaded from ebooks.lab-aids.comDownloaded from ebooks.lab-aids.comDownloaded from ebooks.lab-aids.comDownloaded from ebooks.lab-aids.comDownloaded from ebooks.lab-aids.comDownloaded from ebooks.lab-aids.comDownloaded from ebooks.lab-aids.comDownloaded from ebooks.lab-aids.comDownloaded from ebooks.lab-aids.comDownloaded from ebooks.lab-aids.comDownloaded from ebooks.lab-aids.comDownloaded from ebooks.lab-aids.comDownloaded from ebooks.lab-aids.comDownloaded from ebooks.lab-aids.comDownloaded from ebooks.lab-aids.comDownloaded from ebooks.lab-aids.comDownloaded from ebooks.lab-aids.comDownloaded from ebooks.lab-aids.comDownloaded from ebooks.lab-aids.comDownloaded from ebooks.lab-aids.comDownloaded from ebooks.lab-aids.comDownloaded from ebooks.lab-aids.comDownloaded from ebooks.lab-aids.comDownloaded from ebooks.lab-aids.comDownloaded from ebooks.lab-aids.comDownloaded from ebooks.lab-aids.comDownloaded from ebooks.lab-aids.comDownloaded from ebooks.lab-aids.comDownloaded from ebooks.lab-aids.comDownloaded from ebooks.lab-aids.comDownloaded from ebooks.lab-aids.comDownloaded from ebooks.lab-aids.comDownloaded from ebooks.lab-aids.comDownloaded from ebooks.lab-aids.comDownloaded from ebooks.lab-aids.comDownloaded from ebooks.lab-aids.comDownloaded from ebooks.lab-aids.comDownloaded from ebooks.lab-aids.comDownloaded from ebooks.lab-aids.comDownloaded from ebooks.lab-aids.comDownloaded from ebooks.lab-aids.comDownloaded from ebooks.lab-aids.comDownloaded from ebooks.lab-aids.comDownloaded from ebooks.lab-aids.comDownloaded from ebooks.lab-aids.comDownloaded from ebooks.lab-aids.comDownloaded from ebooks.lab-aids.comDownloaded from ebooks.lab-aids.comDownloaded from ebooks.lab-aids.comDownloaded from ebooks.lab-aids.comDownloaded from ebooks.lab-aids.comDownloaded from ebooks.lab-aids.comDownloaded from ebooks.lab-aids.comDownloaded from ebooks.lab-aids.comDownloaded from ebooks.lab-aids.comDownloaded from ebooks.lab-aids.comDownloaded from ebooks.lab-aids.comDownloaded from ebooks.lab-aids.comDownloaded from ebooks.lab-aids.comE-3
Michael loved to bike through the park. The air smelled fresher there than on the street, and he always saw so
many interesting things.
Once, he had come across a bird’s nest with several young chicks still in it. As he watched, one of the parents had brought food for the chicks to eat. He wondered if he would see anything like that today.
Suddenly, he saw a small frog near the edge of Turtle Pond. It looked very familiar. In fact, it looked just like the frog his sister kept as a pet. It was different from the frogs he usually saw at Turtle Pond.
“Could that be my sister’s frog?” Michael wondered. If so, how did it get there? Did it escape, or could his sister have let it go? Could a pet frog survive in Turtle Pond? How would it affect the other animals that also lived in the pond?
• • •
What are the relationships between an organism and its environ-ment? What effect do humans have on these relationships?
In this unit, you will explore ecology: the study of the relationships between organisms, including humans, and the environment.
Ecology
Downloaded from ebooks.lab-aids.com
Have you ever thought that it would be cool to have parrots flying around in your backyard? Or wished that there were hippos in
your local lake? What happens when you introduce an organism into a new environment?
What are the trade-offs of introducing a species into a new environment?
E-4
talk ing it o
ve
r
CHALLENGE
72 The Miracle Fish?
Fishing on Lake Victoria
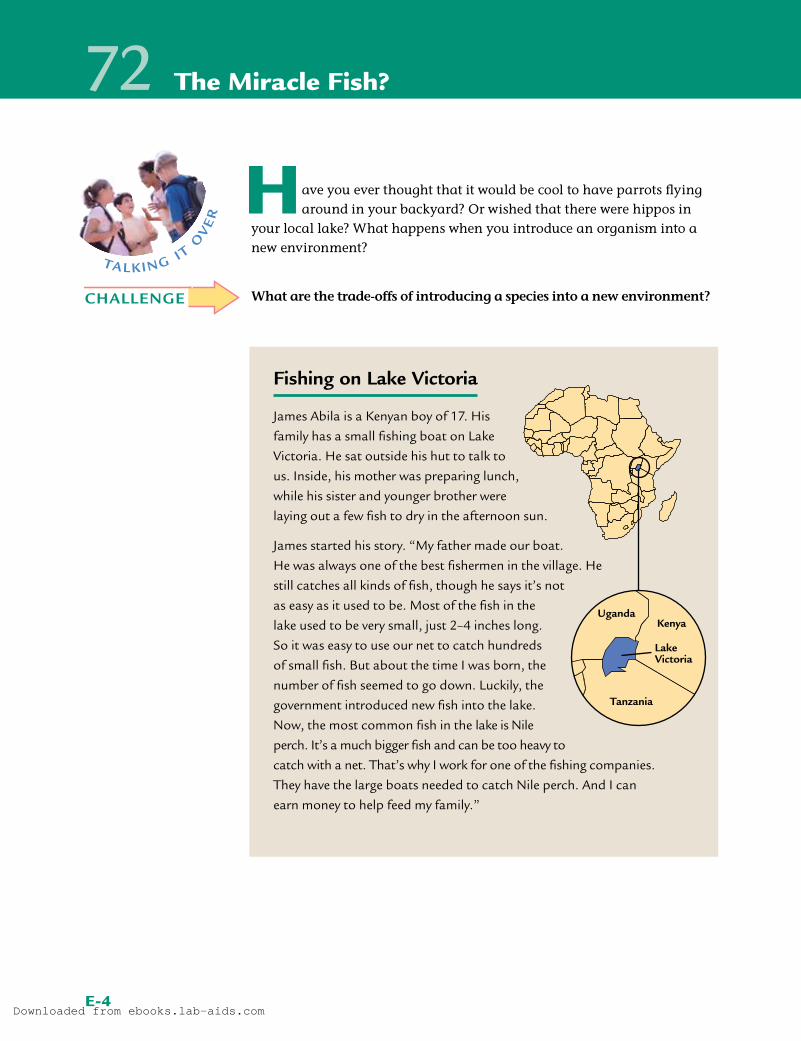
James Abila is a Kenyan boy of 17. His family has a small fishing boat on Lake Victoria. He sat outside his hut to talk to us. Inside, his mother was preparing lunch, while his sister and younger brother were laying out a few fish to dry in the afternoon sun.
James started his story. “My father made our boat. He was always one of the best fishermen in the village. He still catches all kinds of fish, though he says it’s not as easy as it used to be. Most of the fish in the lake used to be very small, just 2–4 inches long. So it was easy to use our net to catch hundreds of small fish. But about the time I was born, the number of fish seemed to go down. Luckily, the government introduced new fish into the lake. Now, the most common fish in the lake is Nile perch. It’s a much bigger fish and can be too heavy to catch with a net. That’s why I work for one of the fishing companies. They have the large boats needed to catch Nile perch. And I can earn money to help feed my family.”
UgandaKenya
Tanzania
LakeVictoria
Downloaded from ebooks.lab-aids.com
E-5
Procedure 1. Work with your group to read the story of Nile perch in Lake Victoria.
2. Discuss whether you think Nile perch should have been introduced into Lake Victoria.
3. Use Student Sheet 72.1, “Intra-act: The Miracle Fish?” and have each member of your group take a different perspective from the list below:
• James
• James’s father
• An owner of a fishing company
• An environmentalist
4. From the perspective of your character, mark whether you agree or dis-agree with the statements on Student Sheet 72.1, “Intra-act Discussion: The Miracle Fish?” Predict what you think other members of your group will say.
5. Discuss the statements with your group.
The Miracle Fish? • Activity 72
For each student
1 Student Sheet 72.1, “Intra-act: The Miracle Fish?”
1 Student Sheet 72.2, “Discussion Web: Should Nile Perch Have Been Introduced?”
Materials
This man is holding a large Nile perch.
Downloaded from ebooks.lab-aids.com
E-6
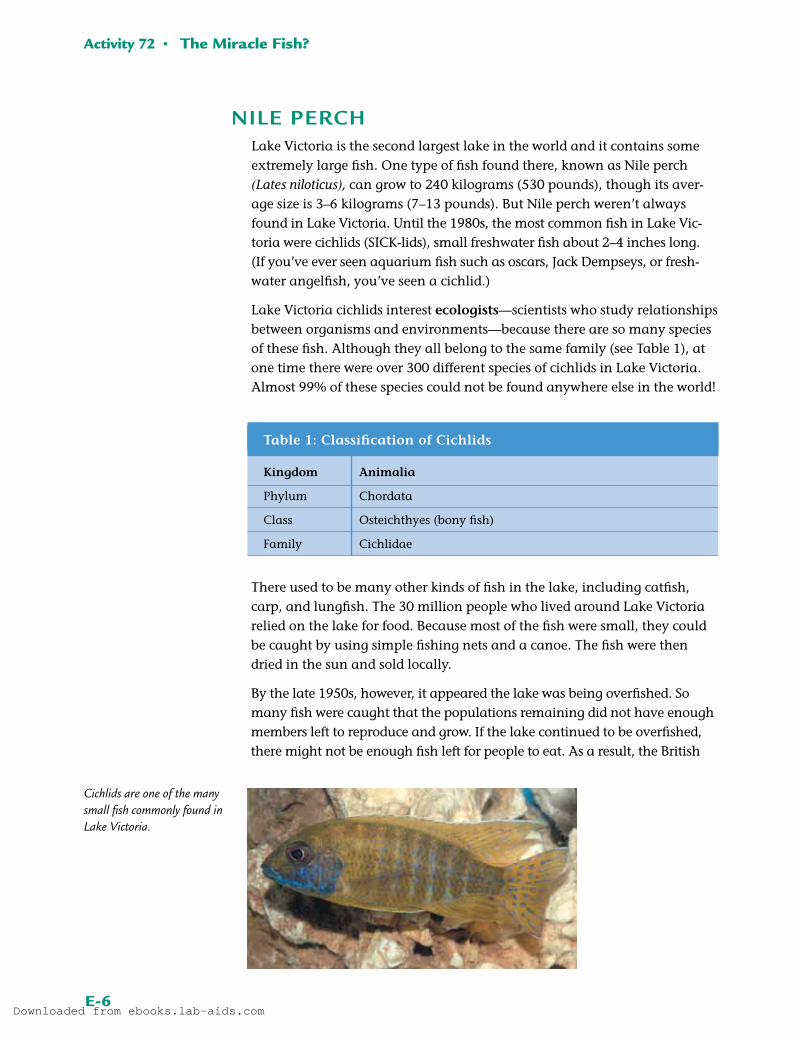
Nile PerchLake Victoria is the second largest lake in the world and it contains some extremely large fish. One type of fish found there, known as Nile perch (Lates niloticus), can grow to 240 kilograms (530 pounds), though its aver-age size is 3–6 kilograms (7–13 pounds). But Nile perch weren’t always found in Lake Victoria. Until the 1980s, the most common fish in Lake Victoria were cichlids (SICKlids), small freshwater fish about 2–4 inches long. (If you’ve ever seen aquarium fish such as oscars, Jack Dempseys, or freshwater angelfish, you’ve seen a cichlid.)
Lake Victoria cichlids interest ecologists—scientists who study relationships between organisms and environments—because there are so many species of these fish. Although they all belong to the same family (see Table 1), at one time there were over 300 different species of cichlids in Lake Victoria. Almost 99% of these species could not be found anywhere else in the world!
There used to be many other kinds of fish in the lake, including catfish, carp, and lungfish. The 30 million people who lived around Lake Victoria relied on the lake for food. Because most of the fish were small, they could be caught by using simple fishing nets and a canoe. The fish were then dried in the sun and sold locally.
By the late 1950s, however, it appeared the lake was being overfished. So many fish were caught that the populations remaining did not have enough members left to reproduce and grow. If the lake continued to be overfished, there might not be enough fish left for people to eat. As a result, the British
Activity 72 • The Miracle Fish?
Kingdom Animalia
Phylum Chordata
Class Osteichthyes (bony fish)
Family Cichlidae
Table 1: Classification of Cichlids
Cichlids are one of the many small fish commonly found in Lake Victoria.
Downloaded from ebooks.lab-aids.com
E-7
government (which ruled this part of Africa at that time) decided to intro-duce new fish species, such as Nile perch, into the lake. They wanted to increase the amount of fish that was available to eat; they hoped to provide more highprotein fish for local people and to be able to sell extra fish to other countries. Ecologists were opposed to this idea. They were worried that the introduction of Nile perch, which had no natural enemies within the lake, would negatively affect the lake’s ecosystem. Before a final decision could be made, Nile perch were secretly added into the lake. Eventually, more Nile perch were deliberately added by the government in the early 1960s.
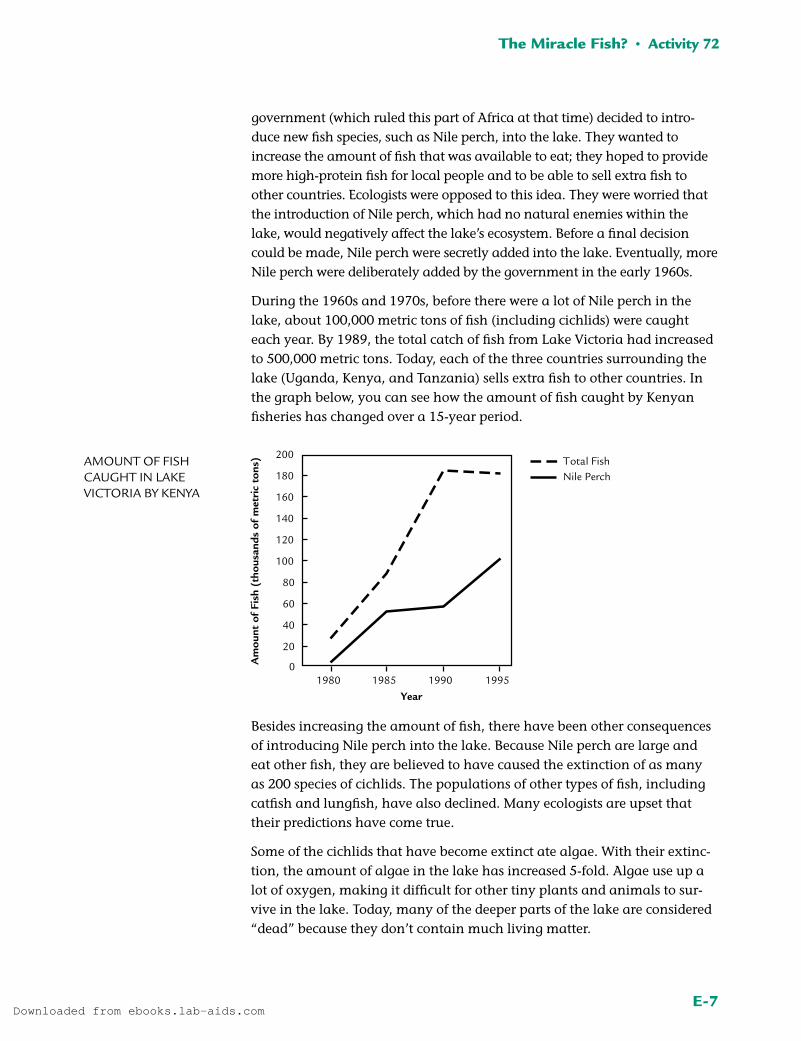
During the 1960s and 1970s, before there were a lot of Nile perch in the lake, about 100,000 metric tons of fish (including cichlids) were caught each year. By 1989, the total catch of fish from Lake Victoria had increased to 500,000 metric tons. Today, each of the three countries surrounding the lake (Uganda, Kenya, and Tanzania) sells extra fish to other countries. In the graph below, you can see how the amount of fish caught by Kenyan fisheries has changed over a 15year period.
Besides increasing the amount of fish, there have been other consequences of introducing Nile perch into the lake. Because Nile perch are large and eat other fish, they are believed to have caused the extinction of as many as 200 species of cichlids. The populations of other types of fish, including catfish and lungfish, have also declined. Many ecologists are upset that their predictions have come true.
Some of the cichlids that have become extinct ate algae. With their extinc-tion, the amount of algae in the lake has increased 5-fold. Algae use up a lot of oxygen, making it difficult for other tiny plants and animals to sur-vive in the lake. Today, many of the deeper parts of the lake are considered “dead” because they don’t contain much living matter.
The Miracle Fish? • Activity 72
Total FishNile Perch
1980 1985 1990 19950
20
40
60
80
100
120
140
160
180
200
Year
Am
ount
of
Fish
(th
ousa
nds
of m
etri
c to
ns)
Amount of fish CAught in LAke ViCtoriA by kenyA
Downloaded from ebooks.lab-aids.com
E-8
However, many of the original goals have been met. In 1979, there were 16,000 fishermen along the Kenyan shores of the lake. In 1993, there were 82,300. Many people are now employed by companies that process and sell Nile perch overseas. Over time, these fish have brought more money into the African countries surrounding the lake. Local people, who now eat Nile perch as part of their diet, consider Nile perch a “savior.”
Some ecologists wonder how long the current situation can last. Nile perch are predators. As populations of other fish decline, the Nile perch’s food sources are declining. The stomachs of some large Nile perch have been found to con-tain smaller, juvenile Nile perch. What will happen to the population of Nile perch if their food supply dwindles even further? Will the Nile perch popula-tion be overfished like the fish populations before it? Only time will tell.
aNalysis 1. Based on the reading, how did the amount of fish caught in Lake Victoria
change from the 1960s to 1989?
2. Based on the graph showing amounts of fish caught in Lake Victoria, describe how the amount of Nile perch caught by Kenya changed from 1980 to 1995.
3. Look again at the graph. How do you think the number of metric tons of fish caught relates to the size of the total fish population from year to year? Explain your reasoning.
4. How did the introduction of Nile perch affect the food supply of the peo-ple who lived near Lake Victoria?
5. What effect did the introduction of Nile perch have on the organisms that lived in the lake?
6. Should Nile perch have been introduced into Lake Victoria? Support your answer with evidence and discuss the trade-offs of your decision.
Hint: To write a complete answer, first state your opinion. Provide two or more pieces of evidence that support your opinion. Then consider all sides of the issue and identify the trade-offs of your decision.
7. What do you predict will happen to Lake Victoria over the next 20–30 years? Why?
exteNsioN Find current information about the ecology and distribution of the Nile perch and about efforts to manage the perch on the Issues and Life Science page of the SEPUP website.
Activity 72 • The Miracle Fish?
Downloaded from ebooks.lab-aids.com
E-9
73 Introduced Species
Introduced, non-native, exotic, and non-indigenous are all words used to describe species that humans have introduced outside of the species’
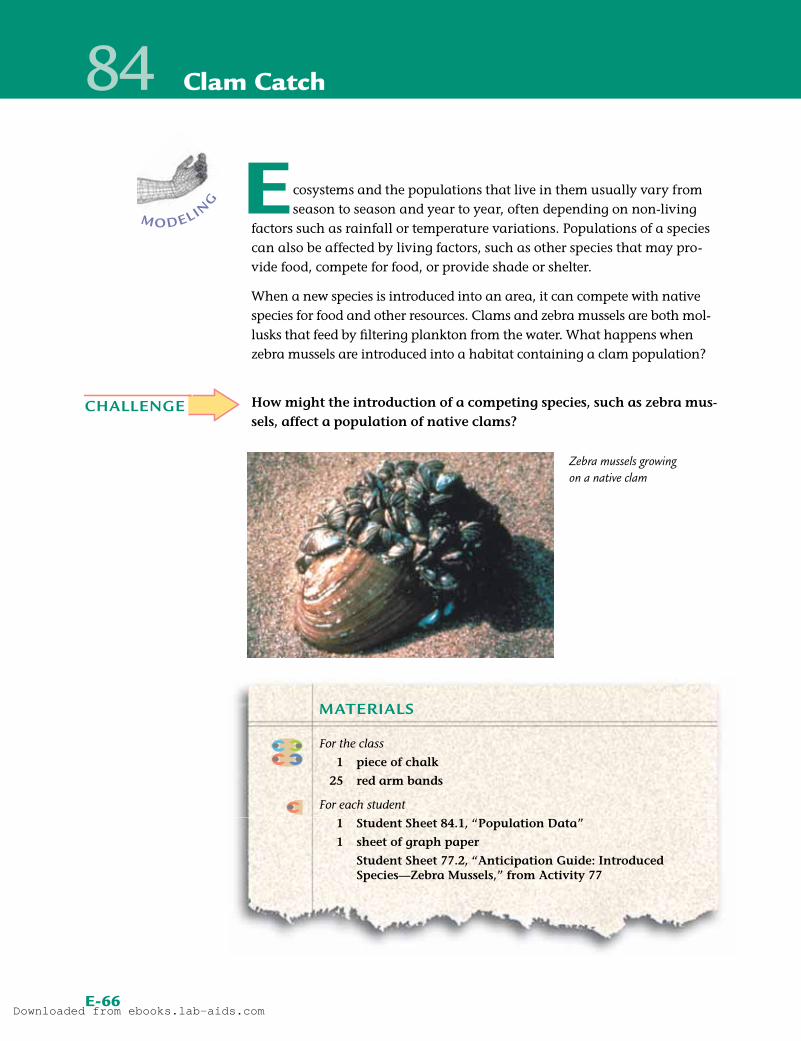
normal range. The Nile perch is an introduced species that was placed deliberately into Lake Victoria. In other cases, the introduction of a new species into a new environment is accidental. Consider the case of the zebra mussel, which is named for the black and white stripes found on its shell. It was accidentally introduced into the United States in the 1980s and it is now estimated to cause up to $5 billion dollars of damage each year!
What effect can an introduced species have on an environment? What, if anything, should be done to control introduced species?
project
CHALLENGE
For the class
books, magazines, CD-ROMs, Internet access, etc.
For each student
1 Student Sheet 73.1, “Introduced Species Research”
Materials
Downloaded from ebooks.lab-aids.com
E-10
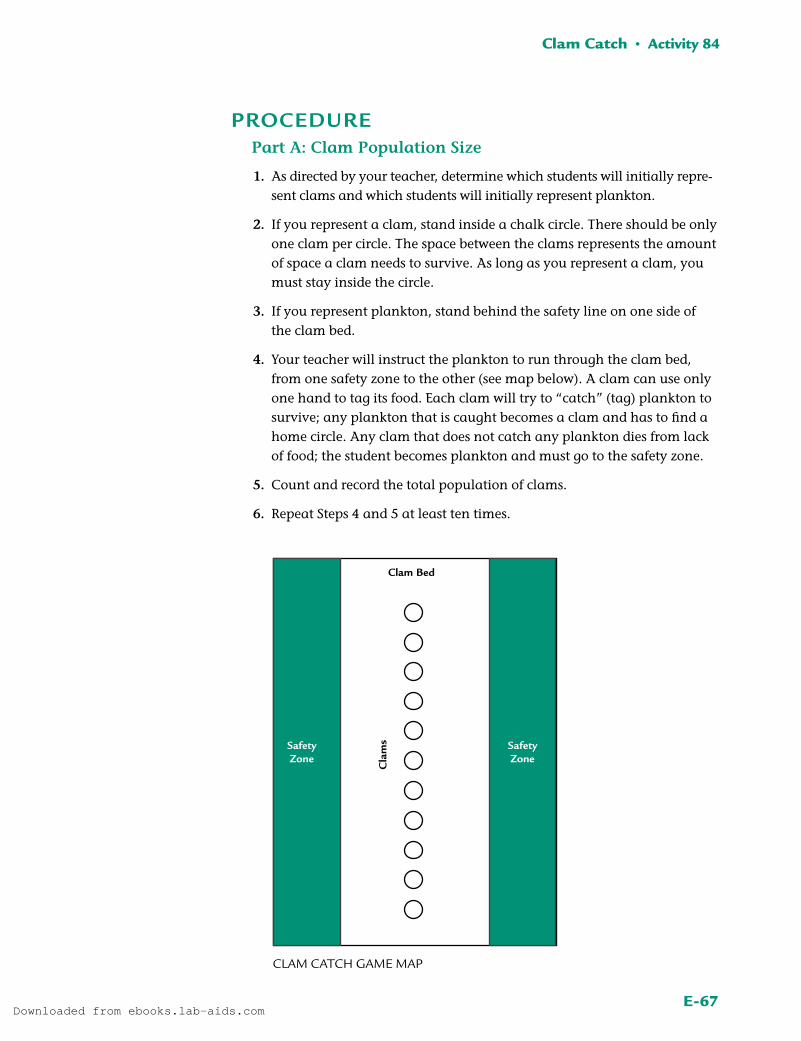
Procedure 1. Read about the introduced species described on the following pages.
As directed by your teacher, decide which one species your group will research.
2. Over the next few days or weeks, find information on this species from books, magazines, CD-ROMs, the Internet, and/or interviews. You can also go to the Issues and Life Science page of the SEPUP website to link to sites with more information on species mentioned in this activity.
3. Use this information to complete Student Sheet 73.1, “Introduced Spe-cies Research.” You should provide the following:
• common and scientific name of your species
• its native and current range; its relationship to and effect on people
• its effect on new ecosystem(s)
• its place in a foodweb
• the reasons for its success
• issues related to its future growth or spread
Later in this unit, you will use your research to create a class presentation.
exteNsioNVisit a local greenhouse or botanical garden. Look at the labels of orna-mental plants used in landscaping. Where did these plants originally come from? Is the introduction of these species considered to be good or bad?
Activity 73 • Introduced Species
Downloaded from ebooks.lab-aids.com
E-11
Response to Tiger Mosquitoes Raises Questions The public outcry over the worsening problem with the tiger mosquito (Aedes albopictus) continues. In response, the city has begun nighttime spraying of insecticide. Jesse But-ler, principal of the Little Town Preschool, said, “How can the city be allowed to spray poison on the backyards where children play?” City spokesperson Kate O’Neil told reporters that the insecticide is harmless to people. “Tiger mos-quitoes are very aggressive. They are much worse than the native mosquitoes. Apart from the nui-sance, tiger mosquitoes can spread diseases such as yellow fever. We
have to take action!” O’Neil invites interested residents to attend the Camford Mosquito Abatement Board presentation on the tiger mosquito problem and possible solutions.
Kudzu Brings Down Power Lines!
Kudzu (KUD-zoo), sometimes referred
to as “the vine that ate the South,” has
finally pushed local patience to the limit.
Properly called Pueraria lobata, it was
first introduced in the 1920s to the southern
United States as food for farm animals and
to reduce soil erosion. Today, this fast-
growing vine from Japan has overgrown
entire forests and choked local ecosystems.
Last week, the weight of kudzu vines pulled
down power lines, causing a two-day power
outage. Mayor Lam has called for control
measures. All community members are
invited to a town council meeting to con-
sider what should be done to control this
destructive vine.
Introduced Species • Activity 73
Downloaded from ebooks.lab-aids.com
E-12
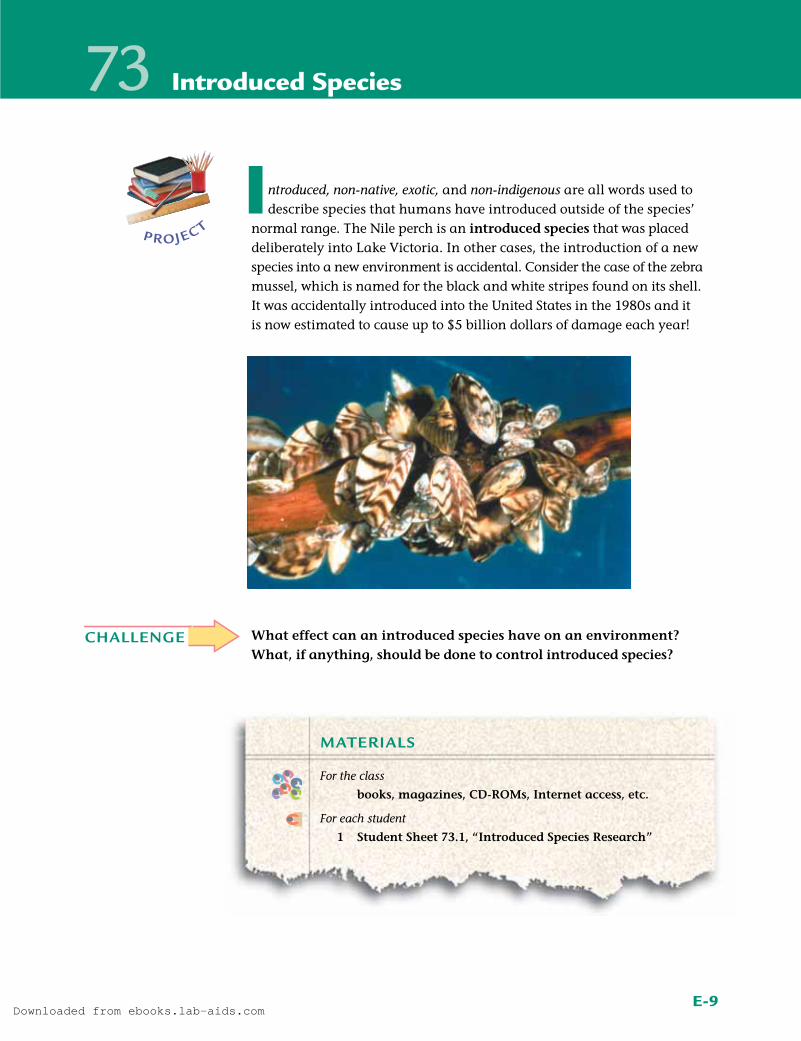
Nutria Hunting on State Marshes?
Ecologists from City University are con-
sidering teaming with local hunters in a
surprise move to reduce the population
of nutria (NEW-tree-uh) in state marshes.
Nutria (Myocastor coypus) are large,
beaver-like rodents whose burrows and
voracious grazing are causing serious dam-
age to marshes.
Ecologist Charlie Desmond told reporters
that nutria are native to South America.
They were brought to North America for
their fur. When they escaped into the wild,
their population exploded. “If we don’t act
soon, we could lose our marshlands in just
a few years,” he cautioned. Duck hunters,
bird watchers, sport fishers, and hikers are
pressuring the state legislature to come
up with a solution. Nutria hunting is one
option being seriously explored.
Aquarium Plant Turns Out to Be Worst WeedYou may have seen this aquatic plant sold in small bunches at aquarium stores. It’s a popular plant because goldfish like swim-ming between its stems. But when aquari-ums are dumped out into lakes, ponds, or rivers, hydrilla (hie-DRILL-uh) can quickly grow into a dense mat that chokes out other vegetation. This change of the environ-ment is dramatic for native animals and plants. Hydrilla verticillata, as it is known scientifically, can clog up city water intake valves and get tangled in boat propellers. “We used to have the best swimming hole down by the bridge,” said Rita Aziz, a 7th grader at Junior Middle School. “Now it’s filled with this gross weed. The last time I swam there, I got tangled in it. It was scary. I would really like to find a way to do something about it.”
Activity 73 • Introduced Species
Downloaded from ebooks.lab-aids.com
E-13
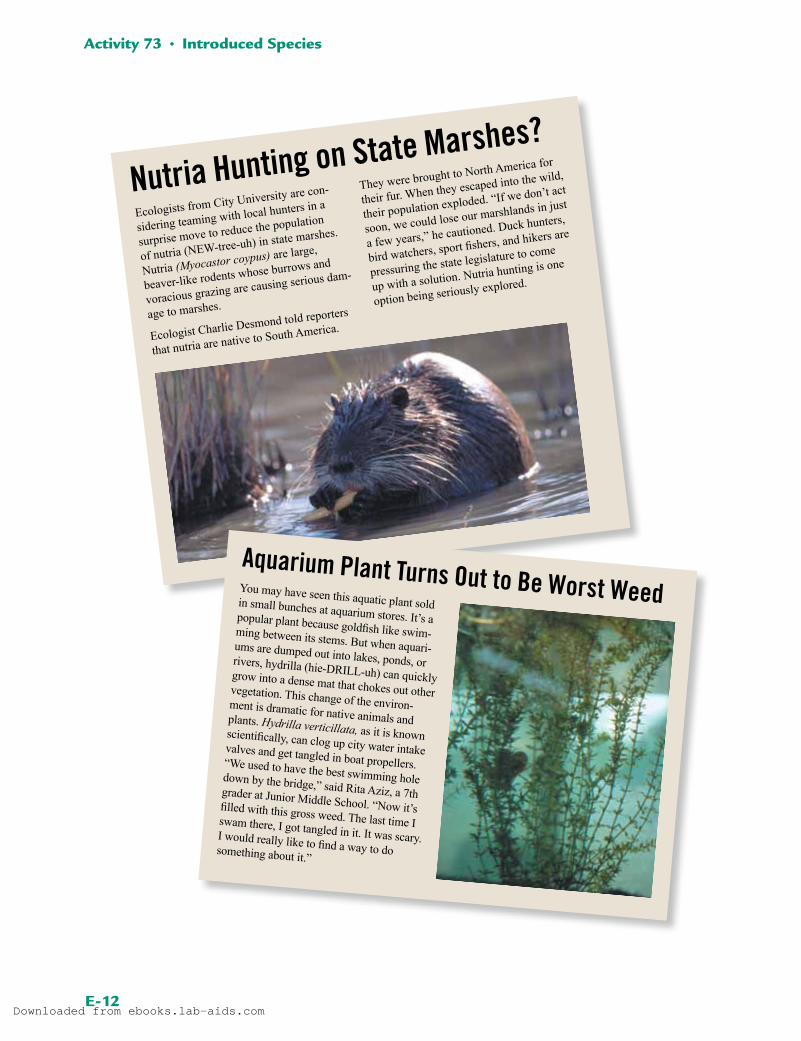
A Landscape Beauty Is Taking Over
What is the link between landscaping
your yard and the recent reports that local
marsh species are declining? Purple loose-
strife (Lythrum salicaria), whose magenta
flowers are admired by gardeners, is the
weed to blame. It was introduced from
Europe as a medicinal herb in the early
1800s and is still sold today as a landscaping
plant. According to the Fish and Wildlife
Service ecologist Johanna Brown, “It totally
takes over an area, crowding out native spe-
cies. It’s really devastating for fragile marsh
ecosystems.” Brian Van Horn, a teacher at
Middleton Junior High, is also concerned.
“It’s a tough plant to get rid of and killing
it can damage the marshes even more.” A
meeting at Middleton Junior High will be
held to discuss this issue.
Cut Down Trees to Protect Them? Agency Advises on Longhorn Beetle Threat
When Keesha Murray, age 3, was injured by a falling branch in Tot Play Park, local neighborhoods woke up to the threat of the Asian longhorn beetle. Her father, Toby Murray, said that Keesha had played under the big maple tree many times. Under the attack of the Asian longhorn beetle, the tree had recently died, which led to the
loss of the tree limb. “Keesha was scratched up and scared. We were lucky it wasn’t worse,” he said. Shade trees all over the city have been dying due to the recent inva-sion of this wood-boring beetle from Japan, known scientifically
as Anoplophora glabri pennis. The beetle larvae are very hard to kill. One suggestion is to cut down all trees within city parks to prevent the beetle from spreading.
Introduced Species • Activity 73
Downloaded from ebooks.lab-aids.com
E-14
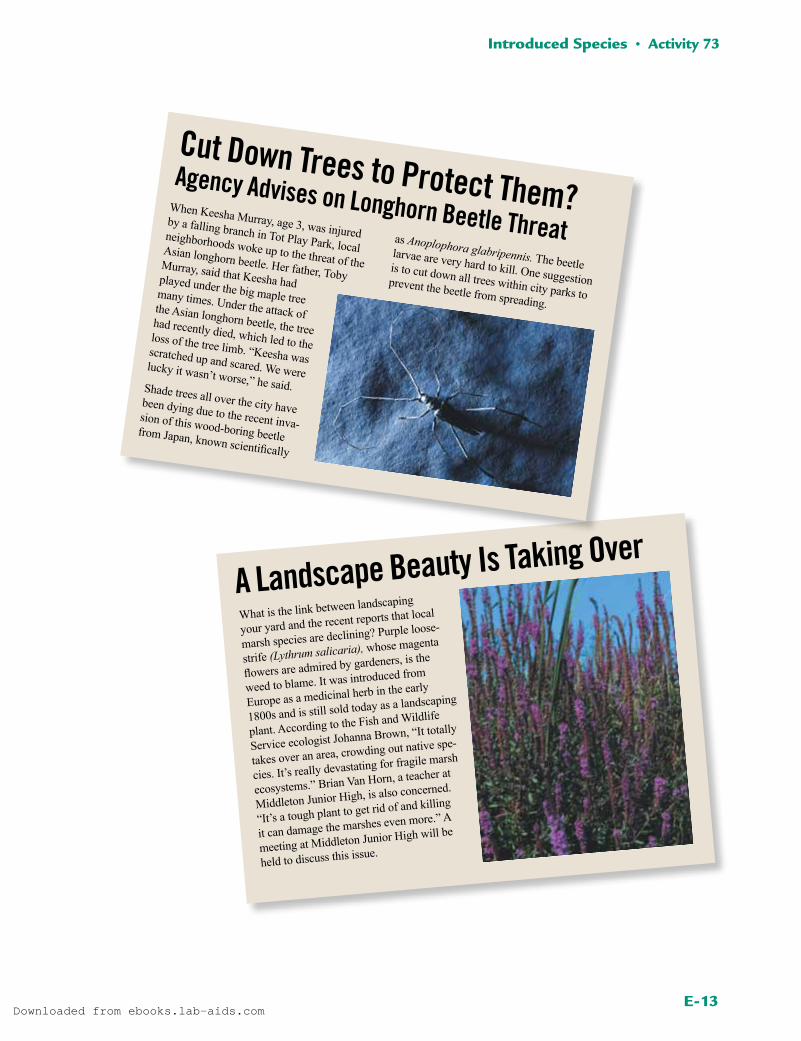
Brown Snake Problem Bites GuamGuam, a tiny, tropical island, is a U.S. terri-
tory with a problem. People have been bit-
ten. Bird, bat, and lizard populations have
declined. The culprit? The brown tree snake
(Boiga irregularis) from New Guinea.
After baby Oscar Gonzalez was bitten by a
brown tree snake, local people were spurred
to action. “Most of us know about
them. Those snakes climb the
power poles and short out electric-
ity on the island several times a
week,” Nicki DeLeon, a long-time
resident of Guam, told reporters.
“Back in the 1960s and even the
1970s, the jungle was full of birds
singing. We used to see bats and lit-
tle lizards running around. They’re
not so easy to find now.”
Scientists are working to find ways
to control the snake before the last
of the unique island species disap-
pear forever. Dr. Sheila Dutt, a researcher
with EcoSave International, said, “As well as
helping with snake control on Guam, we are
desperate to prevent this snake from hitching
a ride in air cargo. I don’t even want to think
of the effect this snake could have in other
parts of the United States.”
Guam
Pacific OceanUnited States
Farmers Rally to Scare Off StarlingsThe recent outbreak of hog cholera may be related to starling (Sturnus vulgaris) drop-pings getting into pig food. Carol Polsky, a pig farmer in Poseyville, encouraged local farmers to work together to help get rid of
the birds. “In addition to spreading disease, those birds eat crops, seeds, and animal feed. A flock of starlings will eat just about anything and they poop everywhere. That spreads disease to other animals, not just pigs,” Polsky told reporters. Many control options are available, according to Dr. Tony Caro of the Agri-cultural Sciences Board. Dr. Caro com-mented, “In 1891, 60 starlings were released in New York and now they are the most common bird in America!” But a representative of the local nature society told reporters that the latest annual sur-vey showed that starling populations had dropped since the previous year. Dr. Caro will be speaking at the next meeting of the County Farm Association, where control measures for starlings will be discussed.
Activity 73 • Introduced Species
Downloaded from ebooks.lab-aids.com
E-15
74 Observing Organisms
How do scientists know how introduced species affect ecosystems? Natural environments are constantly changing. How do you figure
out what changes are due to the introduced organism and what changes are due to other factors? Ecology is the study of relationships between liv-ing organisms and the physical environment. Ecologists begin by studying organisms in the natural environment. They often supplement this informa-tion with laboratory investigations.
What can you discover about an organism in a laboratory investigation?
laborato
ry
CHALLENGE
Downloaded from ebooks.lab-aids.com
E-16
For each pair of students
1 Lumbriculus variegatus, or similar test organism
1 150-mm petri dish
1 piece of filter paper
1 pipet
1 small paintbrush
1 hand lens (optional)
spring water (or treated tap water)
For the Extension
For the class
Lumbriculus variegatus, or similar test organisms
pipets
microscopes
microscope slides
Materials
Procedure 1. Discuss with your group some guidelines for studying animals in the
classroom. Record your ideas in your science notebook. Be prepared to share these ideas with the class.
2. Draw a table in your science notebook like the one below, and record your observations and inferences about the blackworm. Not every observation will result in an inference.
Blackworm
Observations Inferences
Activity 74 • Observing Organisms
Downloaded from ebooks.lab-aids.com
E-17
3. Pour 1–2 cm of water into the bottom of the petri dish.
4. Use the pipet to add a single blackworm from the culture to your petri dish. (Do not pick a blackworm that is dark and has a lighter section at one or both ends; this worm has recently been broken and is regenerat-ing itself.)
5. Carefully observe the blackworm. Then use the brush to gently investi-gate this organism.
6. Record your observations. How much can you find out about a black-worm? Without injuring the worm, explore its behavior. For example, watch to see:
• How does it move?
• Does it respond differently to different actions on various parts of its body, such as touching?
• Can you identify which end is the head?
• What else do you observe?
7. Place the filter paper in the lid of the petri dish. Use the pipet and a few drops of water to completely moisten the filter paper.
8. Use the pipet to move the blackworm onto the filter paper.
9. Observe the blackworm’s movement on this surface. How does its movement here compare with its movement in water? Record your observations.
10. Return your blackworm to the class culture before cleaning up.
exteNsioNPlace a blackworm on a microscope slide. Add one drop of water. (If there is too much water on the slide, use a pipet to suction off the excess water.) Observe the worm under low and medium power. What internal structures can you see?
Observing Organisms • Activity 74
Downloaded from ebooks.lab-aids.com
Activity 74 • Observing Organisms
E-18
aNalysis 1. Review your notes on how the blackworm responded to touch. How
could these reactions help it to survive in the wild?
2. Based on what you now know about blackworms, in what type of envi-ronment do you think blackworms live? Explain your reasoning.
3. As an ecologist, you are asked to write an entry in an encyclopedia on the blackworm, Lumbriculus variegatus. Use your laboratory notes to write a paragraph describing the blackworm.
4. a. A student reading your encyclopedia entry thinks that you should include more information about blackworms. What questions do you think he or she might have after reading your entry?
b. How might you get the information necessary to answer his or her questions?
Downloaded from ebooks.lab-aids.com
E-19
The Range of Disease • Activity 31
75 Classifying Animals
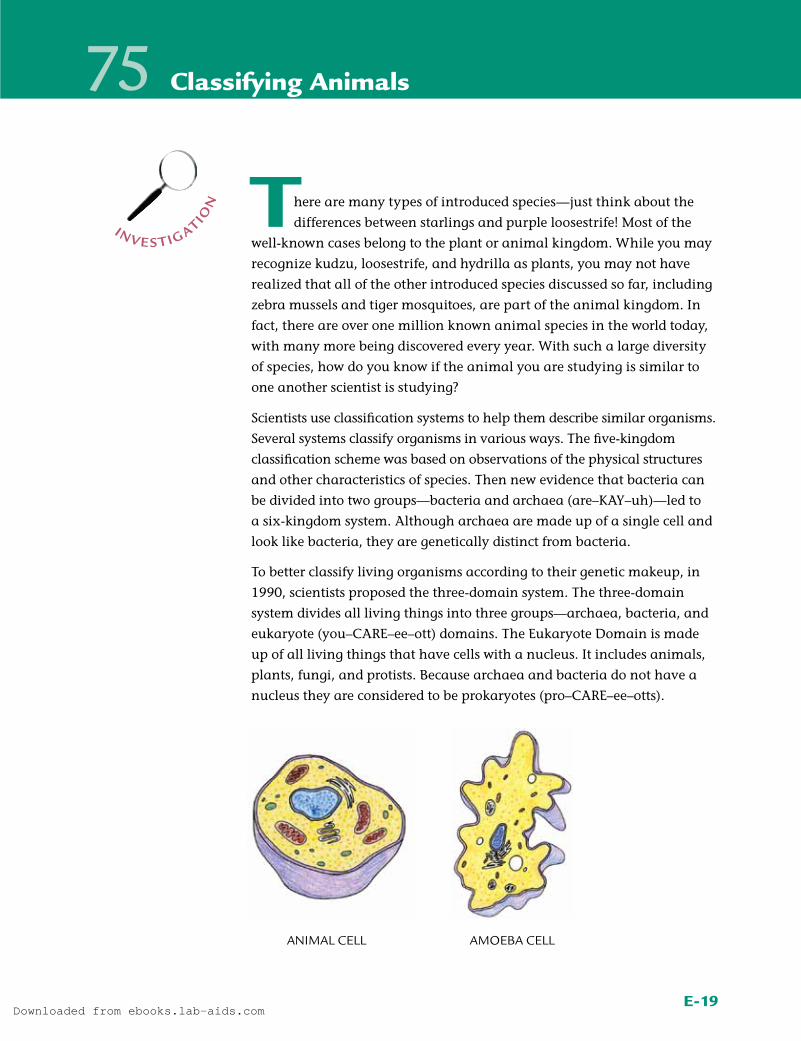
AnimAL CeLL AmoebA CeLL
There are many types of introduced species—just think about the
differences between starlings and purple loosestrife! Most of the
well-known cases belong to the plant or animal kingdom. While you may
recognize kudzu, loosestrife, and hydrilla as plants, you may not have
realized that all of the other introduced species discussed so far, including
zebra mussels and tiger mosquitoes, are part of the animal kingdom. In
fact, there are over one million known animal species in the world today,
with many more being discovered every year. With such a large diversity
of species, how do you know if the animal you are studying is similar to
one another scientist is studying?
Scientists use classification systems to help them describe similar organisms.
Several systems classify organisms in various ways. The fivekingdom
classification scheme was based on observations of the physical structures
and other characteristics of species. Then new evidence that bacteria can
be divided into two groups—bacteria and archaea (are–KAY–uh)—led to
a six-kingdom system. Although archaea are made up of a single cell and
look like bacteria, they are genetically distinct from bacteria.
To better classify living organisms according to their genetic makeup, in
1990, scientists proposed the three-domain system. The three-domain
system divides all living things into three groups—archaea, bacteria, and
eukaryote (you–CARE–ee–ott) domains. The Eukaryote Domain is made
up of all living things that have cells with a nucleus. It includes animals,
plants, fungi, and protists. Because archaea and bacteria do not have a
nucleus they are considered to be prokaryotes (pro–CARE–ee–otts).
inves t igation
Downloaded from ebooks.lab-aids.com
E-20
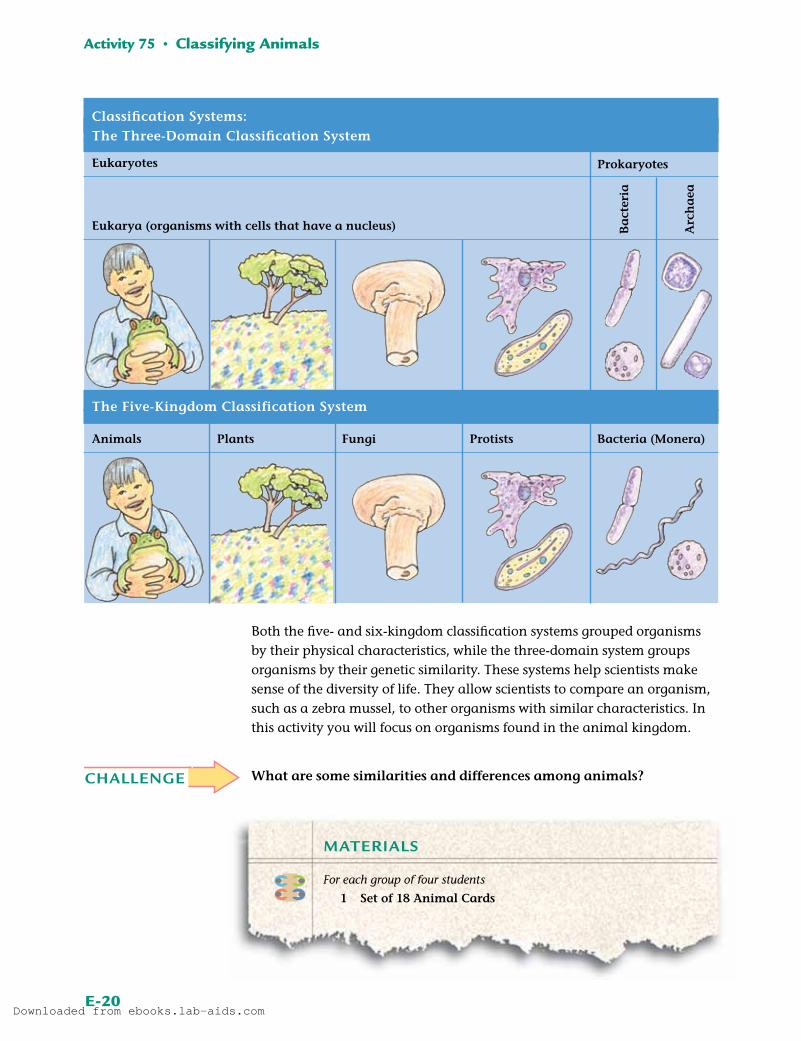
Both the five and sixkingdom classification systems grouped organisms by their physical characteristics, while the three-domain system groups organisms by their genetic similarity. These systems help scientists make sense of the diversity of life. They allow scientists to compare an organism, such as a zebra mussel, to other organisms with similar characteristics. In this activity you will focus on organisms found in the animal kingdom.
What are some similarities and differences among animals?
Activity 75 • Classifying Animals
For each group of four students
1 Set of 18 Animal Cards
Materials
CHALLENGE
Classification Systems:The Three-Domain Classification System
Eukaryotes Prokaryotes
Eukarya (organisms with cells that have a nucleus)
The Five-Kingdom Classification System
Animals Plants Fungi Protists Bacteria (Monera)
Ba
cter
ia
Arc
ha
ea
Downloaded from ebooks.lab-aids.com
E-21
Classifying Animals • Activity 75
ProcedurePart A: Exploring the Animal Kingdom
1. Spread your Animal Cards out on a table.
2. Look at each of the Animal Cards, noting similarities and differences among the animals.
3. Read the information on each card. This information represents what you might discover if you observed the animals more closely and were able to dissect a specimen.
4. With your group of four, classify the Animal Cards into four to eight groups. Work together to agree on a classification system.
• Listen to and consider explanations and ideas of other members of your group.
• If you disagree with your group members about how to classify an animal, explain why you disagree.
5. In your science notebook write down the groups that you created.
6. Share your categories with another group of students. Explain why you classified the animals the way you did. Discuss how your group’s cate-gories were similar to or different from those of the other student group.
Part B: A Biologist’s Perspective
7. Get a set of Phylum (FIE–lum) Cards from your teacher. (The plural of phylum is phyla.) Rearrange your classification of animals if necessary, and record your changes in your science notebook.
8. Biologists use information such as that found on the Phylum Cards to classify animals. Each phylum contains similar species. There are about 35 animal phyla. Your teacher will share with you how biologists group the animals on your cards into six of these phlya. Humans are grouped in the phylum Chordata, as shown below.
Humans are members of one of many phyla of animals.
Downloaded from ebooks.lab-aids.com
E-22
9. Adjust your animal groups so they look like the phyla used by biologists today. Then complete Analysis Questions 1–3.
aNalysis 1. How did your categories change when you followed the biologists’ sys-
tem of phyla? Did your number of categories increase, decrease, or stay the same?
2. Look carefully at how biologists group these animals into phyla. What types of characteristics are used to group animals into phyla?
3. Animals without backbones are called invertebrates. How many inverte-brate phyla do the animals on your Animal Cards represent? List these phyla.
4. Reflection: What characteristics were most important to you when you grouped the Animal Cards? How are these characteristics different from the ones that biologists use to classify? What do you now think is the best way to group animals? Explain.
Activity 75 • Classifying Animals
Downloaded from ebooks.lab-aids.com
76 People, Birds, and Bats
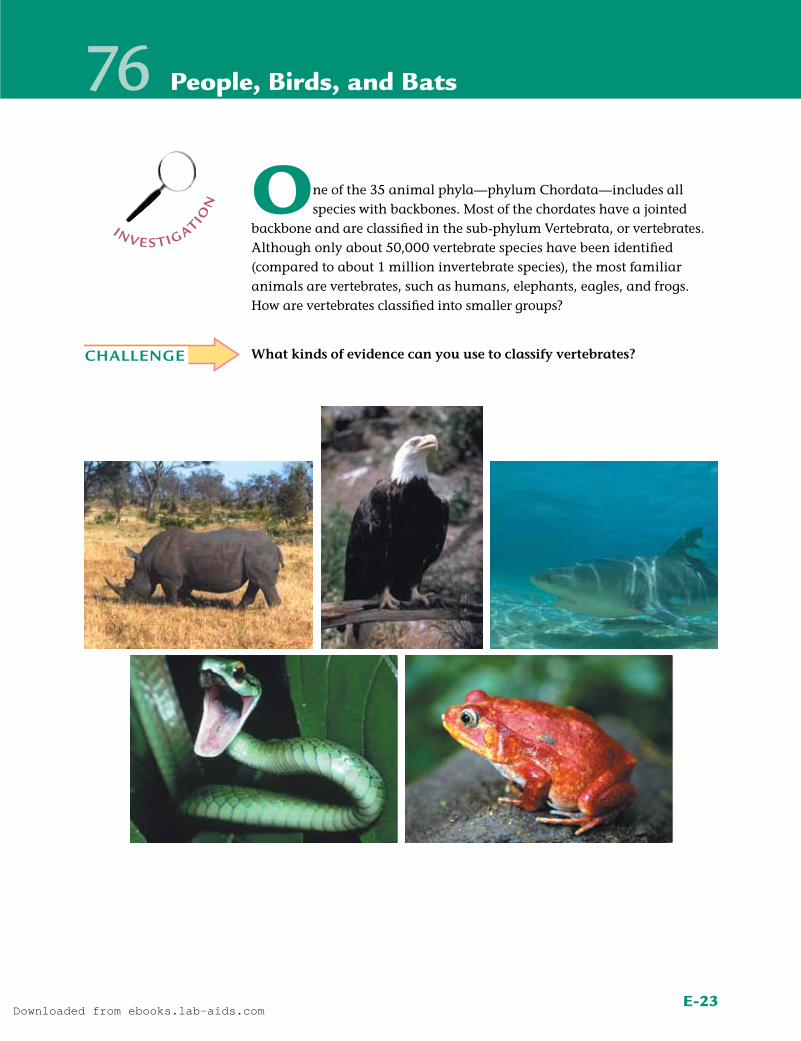
One of the 35 animal phyla—phylum Chordata—includes all species with backbones. Most of the chordates have a jointed
backbone and are classified in the subphylum Vertebrata, or vertebrates. Although only about 50,000 vertebrate species have been identified (compared to about 1 million invertebrate species), the most familiar animals are vertebrates, such as humans, elephants, eagles, and frogs. How are vertebrates classified into smaller groups?
What kinds of evidence can you use to classify vertebrates?
E-23
inves t igation
CHALLENGE
Downloaded from ebooks.lab-aids.com
E-24
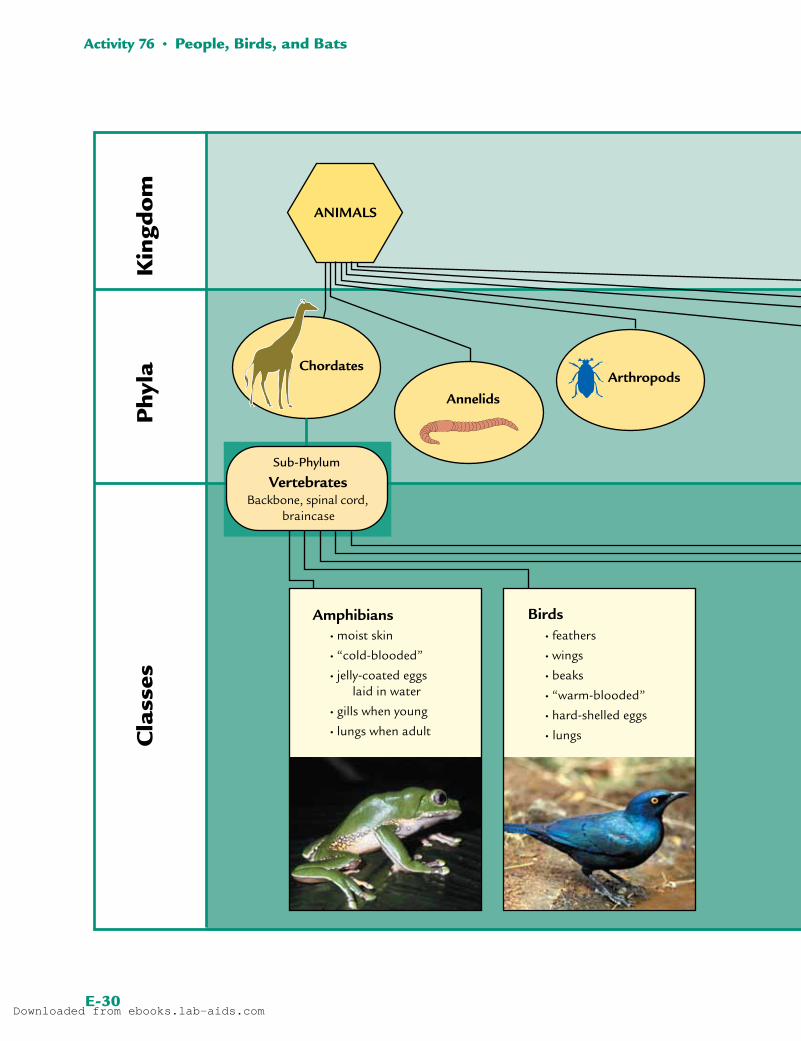
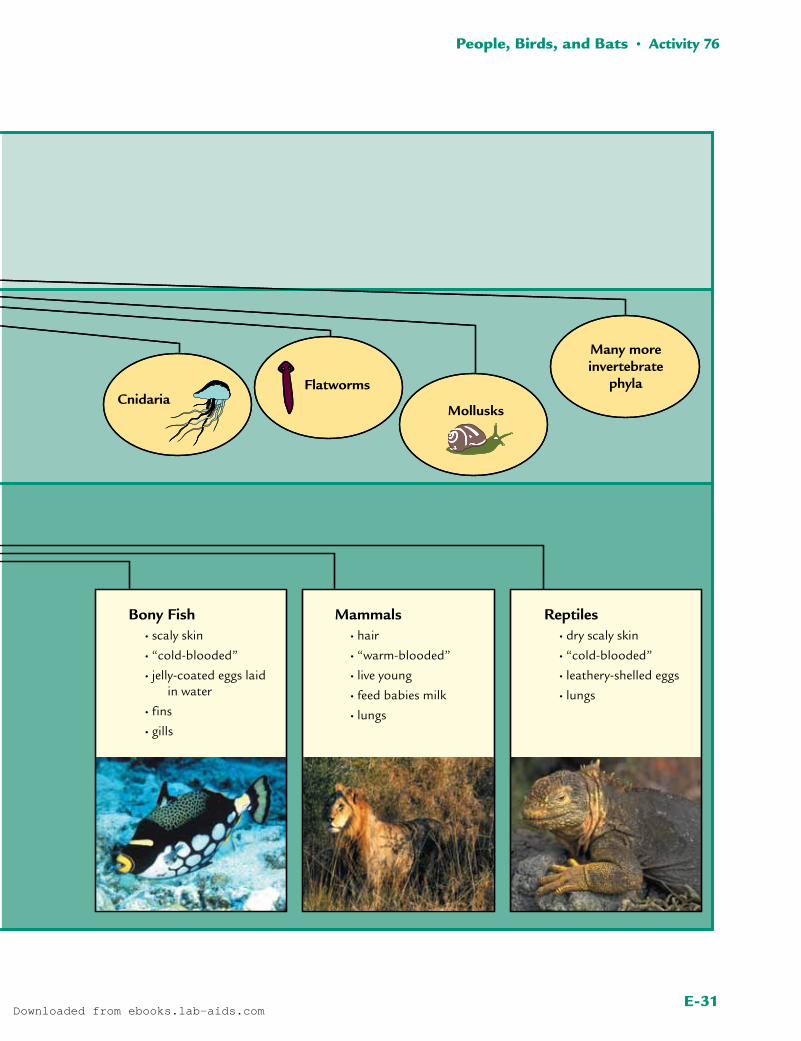
Procedure 1. Carefully read the Classification Chart on the last two pages of this
activity to compare characteristics of the five classes of vertebrates. “Cold-blooded” animals are animals that adjust their body temperature by moving to warmer or cooler locations. Their temperatures sometimes vary with the environment’s temperature, but they aren’t always cold. “Warm-blooded” animals regulate their body temperature to a fairly constant level by generating heat within their bodies, but they aren’t always warm. Because of this, scientists now use different terms to describe these animals.
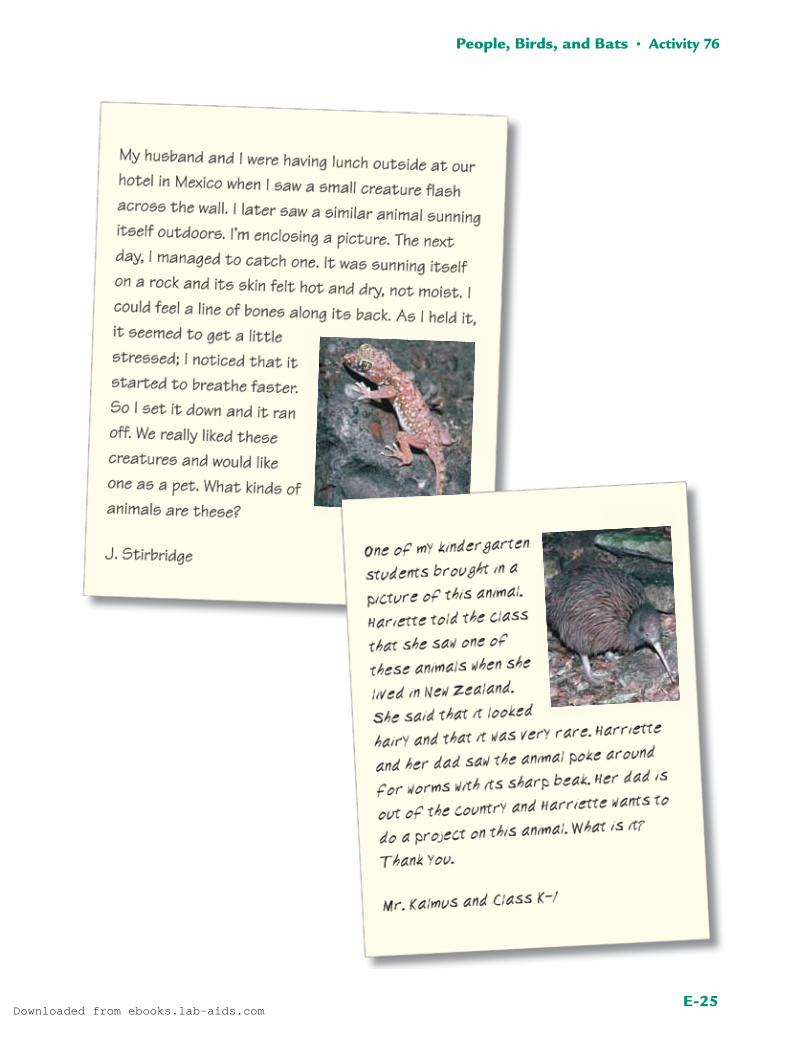
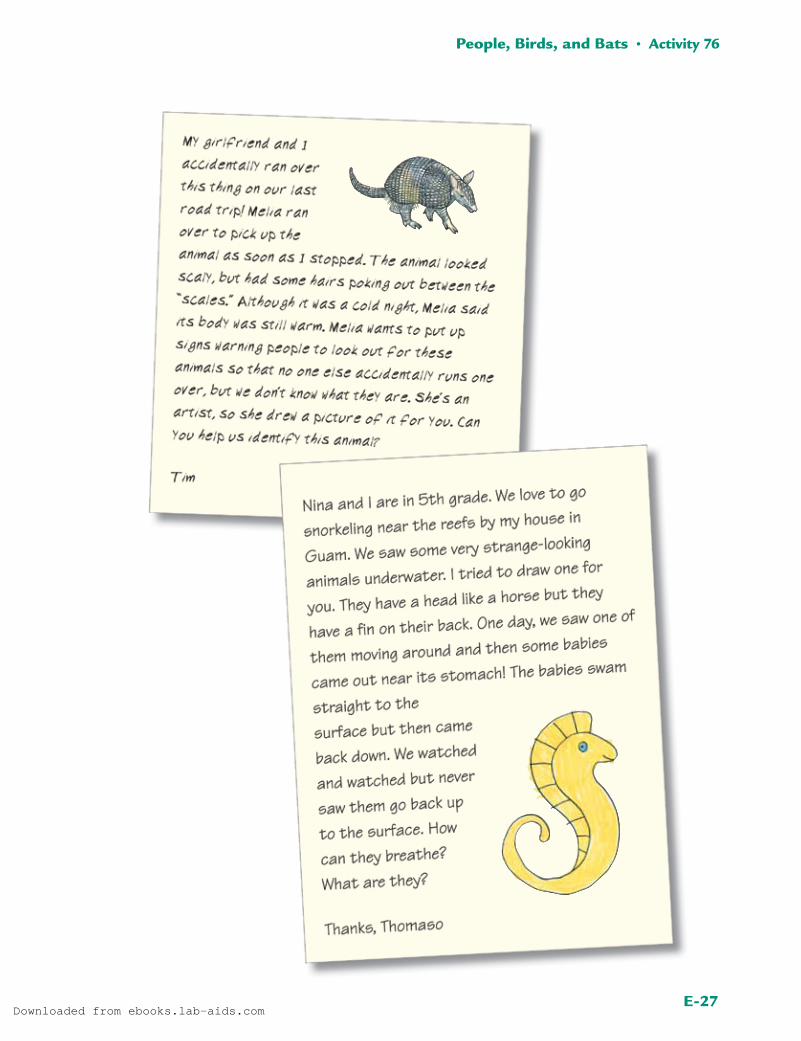
2. Pretend you work at a zoo. Some people have discovered some strange vertebrates and ask you for help in identifying them. They have sent you letters containing pictures and descriptions of these creatures. You can find the letters on the following pages.
For each mystery vertebrate:
a. Read the letter and look at the picture.
b. Discuss with your group members which vertebrate class might include this species.
c. In your science notebook, record which class you believe it belongs to and your reasons. You do not need to agree with your group members.
aNalysis1. What characteristics do you think best distinguish each vertebrate
class?
2. Why do some vertebrates appear to fit into two or more different classes?
exteNsioN Find out how technological advances are being used to study the various classes of animals on the Issues and Life Science page of the SEPUP website.
Activity 76 • People, Birds, and Bats
Downloaded from ebooks.lab-aids.com
E-25
People, Birds, and Bats • Activity 76
Downloaded from ebooks.lab-aids.com
E-26
Activity 76 • People, Birds, and Bats
Downloaded from ebooks.lab-aids.com
E-27
People, Birds, and Bats • Activity 76
Downloaded from ebooks.lab-aids.com
E-28
Activity 76 • People, Birds, and Bats
Downloaded from ebooks.lab-aids.com
E-29
People, Birds, and Bats • Activity 76
From: Ruby RiterSubject: strange animalI’m a travel writer with the Leisure Time Gazette. I was on assignment in Malaysia and saw these strange animals on the mud near mangrove swamps. I want to write about them for next week’s travel section, but I need more information. I saw some of these animals swimming underwater, but I didn’t see any of them come up for air. However, they seemed to do okay on land too. When I checked them out through a telephoto lens, I noticed that they had some kind of fin going down their back as well as scales on their bodies. Can you get back to me ASAP? My deadline is in three days. Thanks a lot.
Downloaded from ebooks.lab-aids.com
E-30
Activity 76 • People, Birds, and Bats
Amphibians
ANIMALS
Arthropods
Kin
gdo
mP
hyla
Cla
sses
Birds
Chordates
Annelids
VertebratesSub-Phylum
Backbone, spinal cord, braincase
Many moreinvertebrate
phyla
Bony Fish ReptilesMammals
CnidariaFlatworms
Mollusks
• moist skin
• “cold-blooded”
• jelly-coated eggs laid in water
• gills when young
• lungs when adult
• feathers
• wings
• beaks
• “warm-blooded”
• hard-shelled eggs
• lungs
• scaly skin
• “cold-blooded”
• jelly-coated eggs laid in water
• fins
• gills
• hair
• “warm-blooded”
• live young
• feed babies milk
• lungs
• dry scaly skin
• “cold-blooded”
• leathery-shelled eggs
• lungs
Downloaded from ebooks.lab-aids.com
E-31
People, Birds, and Bats • Activity 76
Amphibians
ANIMALS
Arthropods
Kin
gdo
mP
hyla
Cla
sses
Birds
Chordates
Annelids
VertebratesSub-Phylum
Backbone, spinal cord, braincase
Many moreinvertebrate
phyla
Bony Fish ReptilesMammals
CnidariaFlatworms
Mollusks
• moist skin
• “cold-blooded”
• jelly-coated eggs laid in water
• gills when young
• lungs when adult
• feathers
• wings
• beaks
• “warm-blooded”
• hard-shelled eggs
• lungs
• scaly skin
• “cold-blooded”
• jelly-coated eggs laid in water
• fins
• gills
• hair
• “warm-blooded”
• live young
• feed babies milk
• lungs
• dry scaly skin
• “cold-blooded”
• leathery-shelled eggs
• lungs
Downloaded from ebooks.lab-aids.com
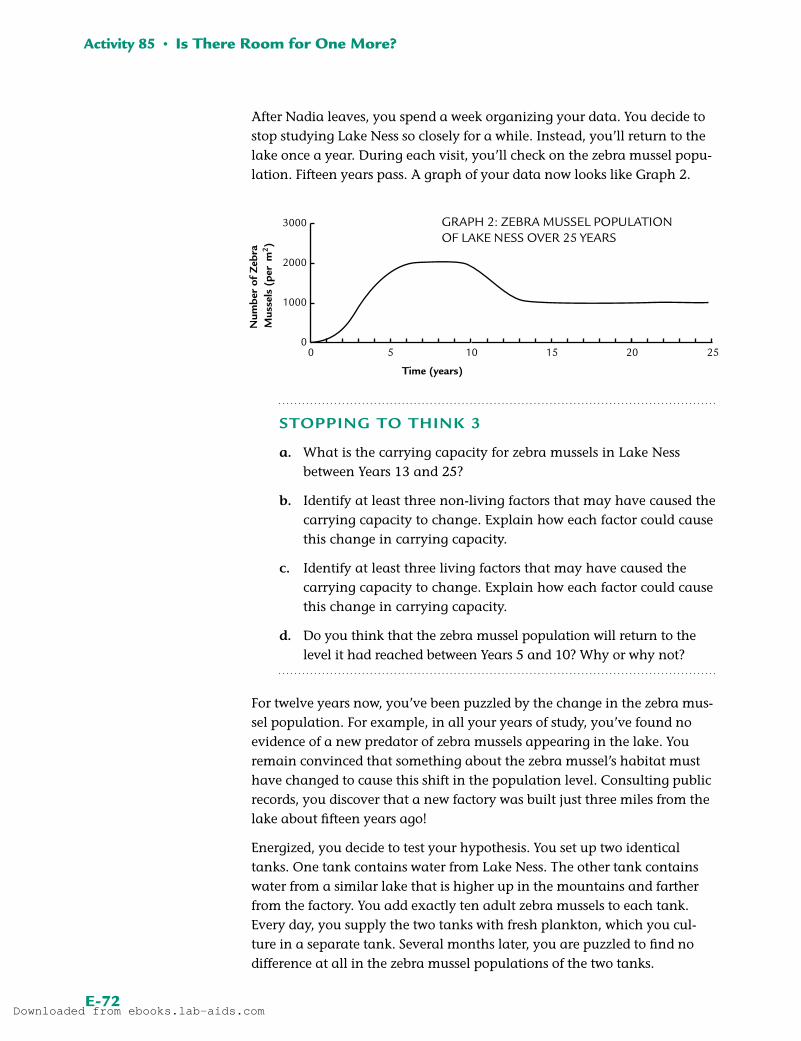
77 Ups and Downs
You can gather ecological information by studying an individual organism, as you did in Activity 74, “Observing Organisms.” But
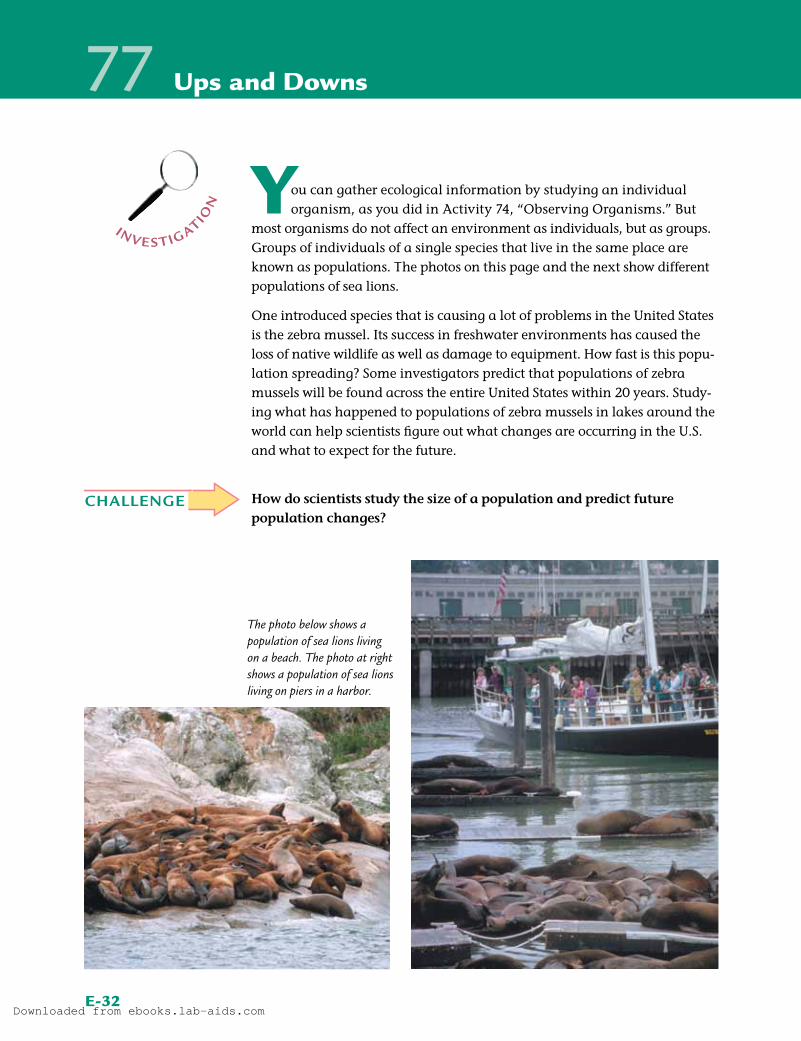
most organisms do not affect an environment as individuals, but as groups. Groups of individuals of a single species that live in the same place are known as populations. The photos on this page and the next show different populations of sea lions.
One introduced species that is causing a lot of problems in the United States is the zebra mussel. Its success in freshwater environments has caused the loss of native wildlife as well as damage to equipment. How fast is this popu-la tion spreading? Some investigators predict that populations of zebra mussels will be found across the entire United States within 20 years. Study-ing what has happened to populations of zebra mussels in lakes around the world can help scientists figure out what changes are occurring in the U.S. and what to expect for the future.
How do scientists study the size of a population and predict future population changes?
E-32
inves t igation
CHALLENGE
The photo below shows a population of sea lions living on a beach. The photo at right shows a population of sea lions living on piers in a harbor.
Downloaded from ebooks.lab-aids.com
E-33
ProcedureComplete the “Before” column of Student Sheet 77.2, “Anticipation Guide: Intro-duced Species—Zebra Mussels.”
Part A: Initial Observations
1. In your group of four, review the two tables below. Imagine that two dif-ferent groups of ecologists collected data on the size of the zebra mussel population in Lake Miko for two different time periods.
Number of Zebra Mussels (per square meter) 393 802 1,086 2,179
Table 2: Zebra Mussel Population in Lake Miko, Period 2 (1971 to 1976)
Year 1959 1960 1962 1968
Number of Zebra Mussels (per square meter) 2,211 95 93 97
Table 1: Zebra Mussel Population in Lake Miko, Period 1 (1959 to 1968)
Downloaded from ebooks.lab-aids.com
E-34
2. Divide your group in half. Assign one of the two data tables to each pair within your group.
3. With your partner, create a line graph of the data in your table using Student Sheet 77.1, “Ups and Downs.” Remember, independent variables, such as time, are always graphed on the x-axis. Since you will compare graphs within your group, make sure that the x-axes of both graphs use the same scale.
4. After completing your graph, respond to the two questions on Student Sheet 77.1 as directed.
Part B: A More Complete Analysis
5. Show your graph to the other students in your group. Point out the over-all population trend—is the population increasing, decreasing, or stay-ing the same?
6. Compare the two graphs. Discuss what conclusions you can make about the population trend in Lake Miko during Period 1 vs. Period 2.
7. Place the two graphs together, with the graph for Table 1 first and the graph for Table 2 second. If necessary, fold the edges of your sheets to fit the graphs together.
8. As a group, discuss what happens to the population trends when the two graphs are connected. Discuss how what you see with the two graphs together is different from what you see with each of the individ-ual graphs. Be sure to:
• Describe what happens to the population size of zebra mussels in Lake Miko from 1959–1976.
• Discuss whether you can make any definite conclusions about whether the population is increasing, decreasing, or staying the same.
aNalysis 1. a. Sketch a line on your graph predicting what you think will happen
to the size of this population of zebra mussels during the ten years after 1976.
b. Explain your prediction. Why do you think the graph will look that way?
c. What additional information would make you more confident of your prediction? Explain.
Activity 77 • Ups and Downs
Downloaded from ebooks.lab-aids.com
E-35
2. a. What factors do you think affect the size of a population?
b. Explain how each factor might affect population size: Would it cause the population to increase, decrease, or stay the same? Why?
3. As you know from your own graph, data were not collected every year. Explain whether you would expect a well-designed experiment to collect data every year. What might prevent the collection of such data?
4. Shown below are graphs of zebra mussel populations in three lakes near Lake Mikolajskie. Describe the population trend in each graph. How does each population change over time?
5. The data presented in this activity are similar to actual data collected in Lake Mikolajskie, Poland, between 1959 and 1987. Zebra mussels have been found in lakes in that area for over 150 years. Shown below are the data collected from 1977–87. How does this additional information compare to your answer to Question 1?
0 5 10 15 20 25 300
500
1000
1500
2000
Year
Num
ber
of M
usse
ls(p
er s
quar
e m
eter
)
a
Ups and Downs • Activity 77
ZebrA musseL PoPuLAtions in three LAkes
Year
Num
ber
of M
usse
ls(p
er s
quar
e m
eter
)0 5 10 15 20 25 30
0
500
1000
1500
2000 c
Year0 5 10 15 20 25 30
0
500
1000
1500
2000
Num
ber
of M
usse
ls(p
er s
quar
e m
eter
)
b
Year 1977 1979 1982 1983 1987
Number of Zebra Mussels (per square meter) 77 104 81 55 85
Table 3: Zebra Mussel Population in Lake Miko, Period 3 (1977 to 1987)
Downloaded from ebooks.lab-aids.com
E-36
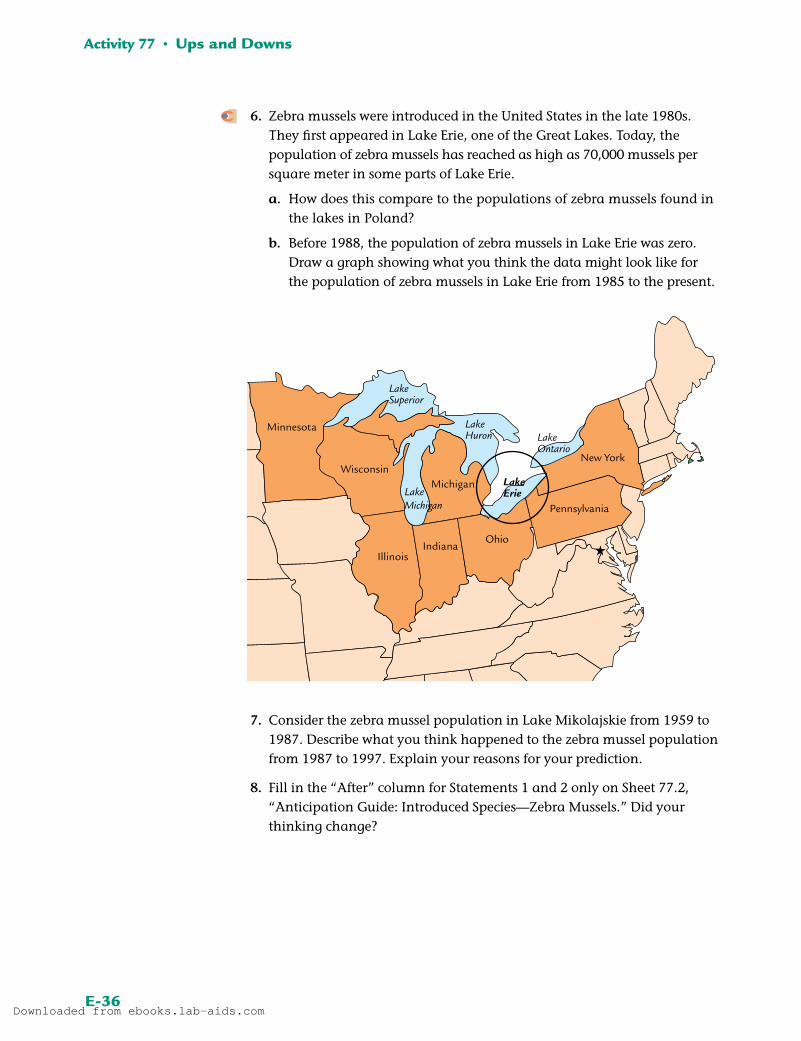
6. Zebra mussels were introduced in the United States in the late 1980s. They first appeared in Lake Erie, one of the Great Lakes. Today, the population of zebra mussels has reached as high as 70,000 mussels per square meter in some parts of Lake Erie.
a. How does this compare to the populations of zebra mussels found in the lakes in Poland?
b. Before 1988, the population of zebra mussels in Lake Erie was zero. Draw a graph showing what you think the data might look like for the population of zebra mussels in Lake Erie from 1985 to the present.
7. Consider the zebra mussel population in Lake Mikolajskie from 1959 to 1987. Describe what you think happened to the zebra mussel population from 1987 to 1997. Explain your reasons for your prediction.
8. Fill in the “After” column for Statements 1 and 2 only on Sheet 77.2, “Anticipation Guide: Introduced Species—Zebra Mussels.” Did your thinking change?
Activity 77 • Ups and Downs
Illinois
WisconsinMichigan
IndianaOhio
New York
Pennsylvania
LakeSuperior
LakeHuron
LakeMichigan
LakeOntario
Minnesota
LakeErie
Downloaded from ebooks.lab-aids.com
E-37
Digestion, an Absorbing Tale • Activity 15
How do introduced species affect other organisms within a habitat? What happens to the populations of native species when a new
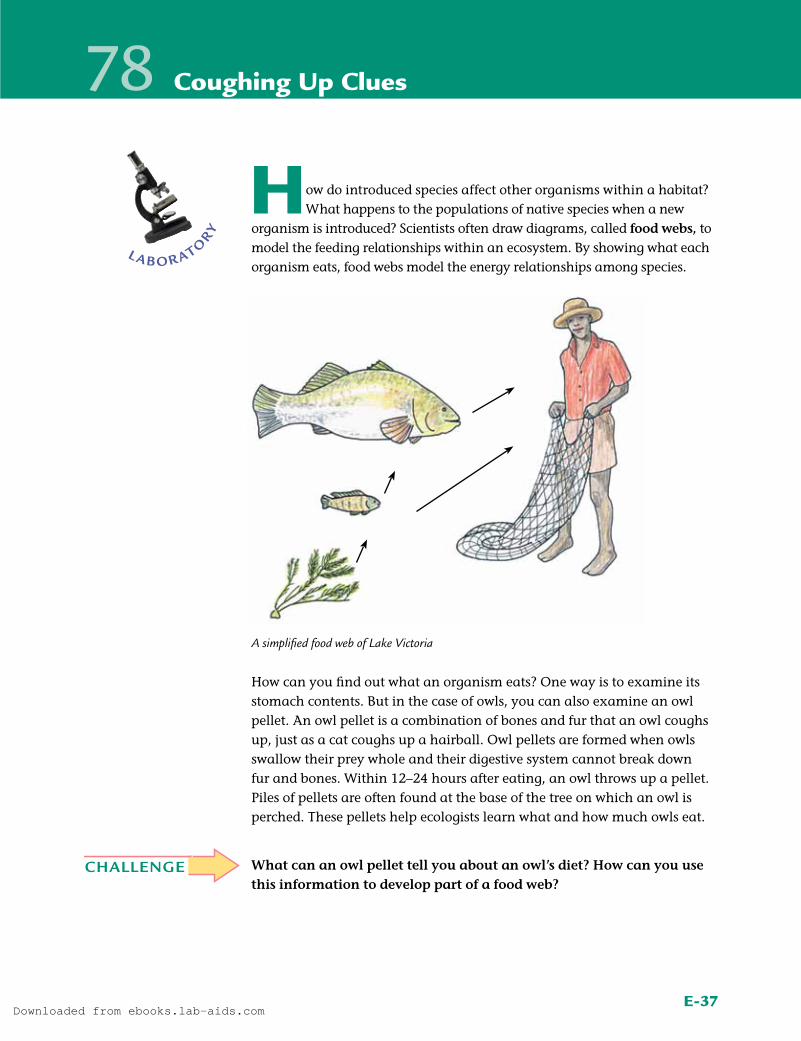
organism is introduced? Scientists often draw diagrams, called food webs, to model the feeding relationships within an ecosystem. By showing what each organism eats, food webs model the energy relationships among species.
How can you find out what an organism eats? One way is to examine its stomach contents. But in the case of owls, you can also examine an owl pellet. An owl pellet is a combination of bones and fur that an owl coughs up, just as a cat coughs up a hairball. Owl pellets are formed when owls swallow their prey whole and their digestive system cannot break down fur and bones. Within 12–24 hours after eating, an owl throws up a pellet. Piles of pellets are often found at the base of the tree on which an owl is perched. These pellets help ecologists learn what and how much owls eat.
What can an owl pellet tell you about an owl’s diet? How can you use this information to develop part of a food web?
78 Coughing Up Clues
laborato
ry
CHALLENGE
A simplified food web of Lake Victoria
Downloaded from ebooks.lab-aids.com
E-38
Procedure 1. Use the wooden sticks to carefully pull the owl pellet into four equal-sized
pieces. Provide each member of your group with one of the four pieces.
2. Use your pair of sticks to gently separate all of the bones from the fur of your piece of owl pellet.
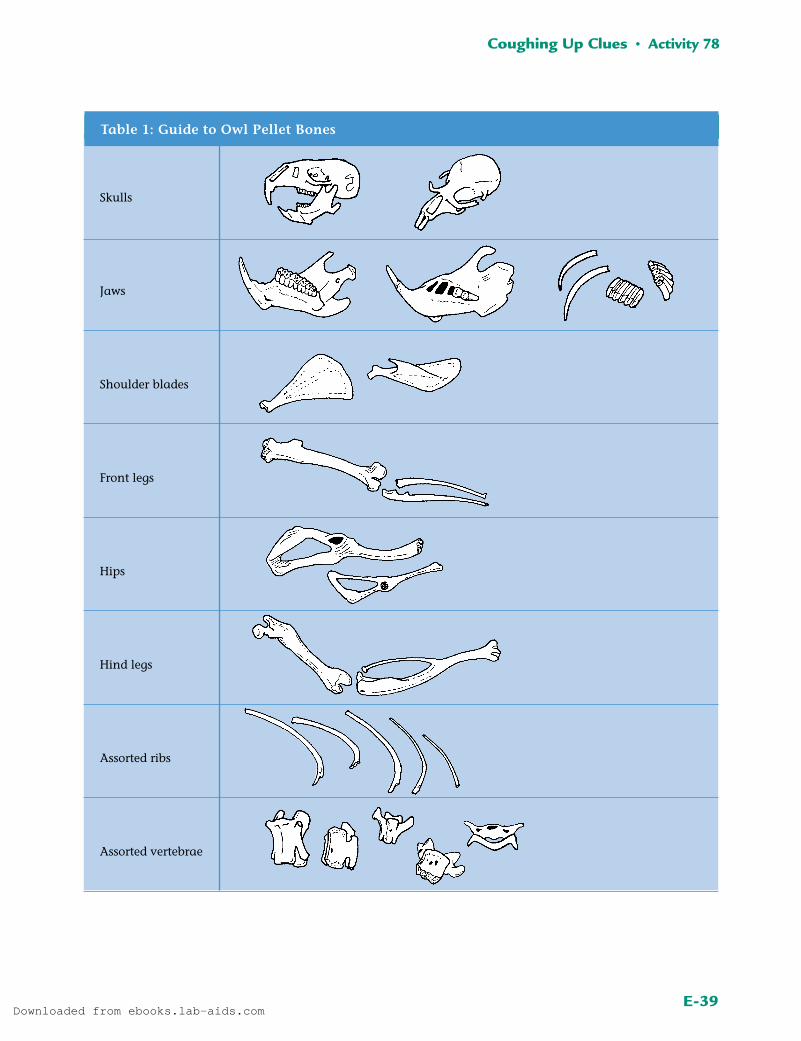
3. Work with your group to divide all of the bones into groups based on their shapes. Use Table 1, “Guide to Owl Pellet Bones,” to help you.
4. Count and record the number of bones in each of your categories.
5. Try to arrange the bones to make a skeleton of one (or more) animal. Sketch your final arrangement(s).
aNalysis 1. What did you learn about the diet of owls from investigating an owl
pellet? Include information about the type and number of organisms in an owl’s diet. (Remember that an owl ejects a pellet within 12 to 24 hours after eating.)
2. a. The organisms that you uncovered in your owl pellet are likely to be voles, small rodents similar to mice. Owls also eat other small mammals, such as shrews, and insects. Use this information on owl diet to develop a food web.
b. Voles eat mostly plant material such as grass, seeds, roots, and bark. Shrews eat insects. Add these relationships to your food web.
c. The great horned owl sometimes eats other owls. It also eats small mammals like voles. Add the great horned owl to your food web.
Activity 78 • Coughing Up Clues
For each group of four students
1 owl pellet
1 small petri dish or other small container (optional)
glue (optional)
cardboard or paper (optional)
For each student
2 pointed wooden sticks
Materials
Downloaded from ebooks.lab-aids.com
E-39
Coughing Up Clues • Activity 78
Skulls
Jaws
Shoulder blades
Front legs
Hips
Hind legs
Assorted ribs
Assorted vertebrae
Table 1: Guide to Owl Pellet Bones
Downloaded from ebooks.lab-aids.com
E-40
3. Copy the graph shown below, which is similar to graphs you made in Activity 77, “Ups and Downs.” It predicts the change in the population of owls as they first move into a new habitat.
a. Draw a line showing what you think will happen over the same time period to the population of one of the species that owls eat.
b. Draw a line, using a different color or symbol, showing what you think might happen over the same time period to the population of one of the species that eats owls. Be sure to include a key identifying what species each line represents.
4. Reflection: All living things have a place in a food web. What would your personal food web look like?
exteNsioN 1To identify the skulls you found in your owl pellet and learn more about owl pellets, go to the Issues and Life Science page of the SEPUP website.
exteNsioN 2Research the food web of the introduced species you are studying. What effects, if any, has your species had on native species? What effects do you predict it will have in the future?
Activity 78 • Coughing Up Clues
Time (years)
Num
ber
of o
wls
owL PoPuLAtion oVer time
Downloaded from ebooks.lab-aids.com
E-41
79 Eating for Energy
One important part of every organism’s habitat is a source of food. The introduction of new species into an ecosystem often changes
the availability of food.
How are the energy relationships among organisms in an ecosystem affected by the introduction of a new species?
readiNgUse Student Sheet 79.1, “Talking Drawing: Eating for Energy,” to prepare you for the following reading.
Is it possible that a scenario like the one in Lake Victoria could happen in the United States? Scientists are waiting to see. But in the United States, the main concern isn’t a large predator like the Nile perch, but a seem-
ingly unimportant mussel less than two inches long. The tiny zebra mussel (Dreissena polymorpha) (shown at left) doesn’t seem large enough to cause serious problems. But its ability to reproduce and spread quickly is mak-ing it into a big issue.
Zebra mussels reproduce by releasing eggs and sperm into the water. The fertilized eggs grow into tiny larvae. Because of their small size, they are very hard to see at this stage.
1 Student Sheet 79.1, “Talking Drawing: Eating for Energy”
Materials
Zebra Mussels feeding.
Downloaded from ebooks.lab-aids.com
E-42
stoPPiNg to thiNk 1
Brainstorm ways in which zebra mussels might accidentally be spread from one lake to another.
Animals get energy by eating plants or eating other animals. Zebra mus-sels feed on some of the smallest members of the aquatic food chain: microscopic animals and plants known as plankton (PLANK-tun) (shown below). (When discussing them in more detail, biologists usually use the words zooplankton [zoe-uh-PLANK-tun] for microscopic animals and phy-toplankton [fietoePLANKtun] for microscopic plants.) Plankton are found throughout the water, from the very deepest part of a lake to the surface. They are the food for a variety of other organisms, including many kinds of fish. In addition, zooplankton eat phytoplankton. Thus, phytoplankton are at the base of many aquatic food chains.
Phytoplankton include microscopic plants and algae. These tiny organisms are especially important in aquatic ecosystems because they produce food for all the other living things in that ecosystem. You may know that plants and algae require sunlight in order to grow. They use sunlight as energy to convert carbon dioxide and water into food—a process known as photo-synthesis (foe-toe-SIN-thuh-sis). (You will learn more about photosynthesis in Activity 81, “A Producer’s Source of Energy.”) The food that the plant produces is stored within the plant as starch or sugar. The plant can then use its food for activities within its own cells—until the plant is eaten by another organism! Since most plants and algae do not eat other organisms for food but are able to produce their own food, they are called producers. Producers such as phytoplankton form the base of the food chain because
they have the ability to use the sun’s energy to make their own food.
All other organisms rely on this ability of producers to convert the energy from the sun into food energy. Orga nisms that get their energy by eating food are known as consumers. Some consumers eat plants for energy, while other con-sumers eat the animals that eat plants. Some consumers, such as zebra mussels and humans, eat both plants and animals.
Plankton
Activity 79 • Eating for Energy
Downloaded from ebooks.lab-aids.com
E-43
stoPPiNg to thiNk 2
Why are producers, such as plants, an essential part of any ecosystem?
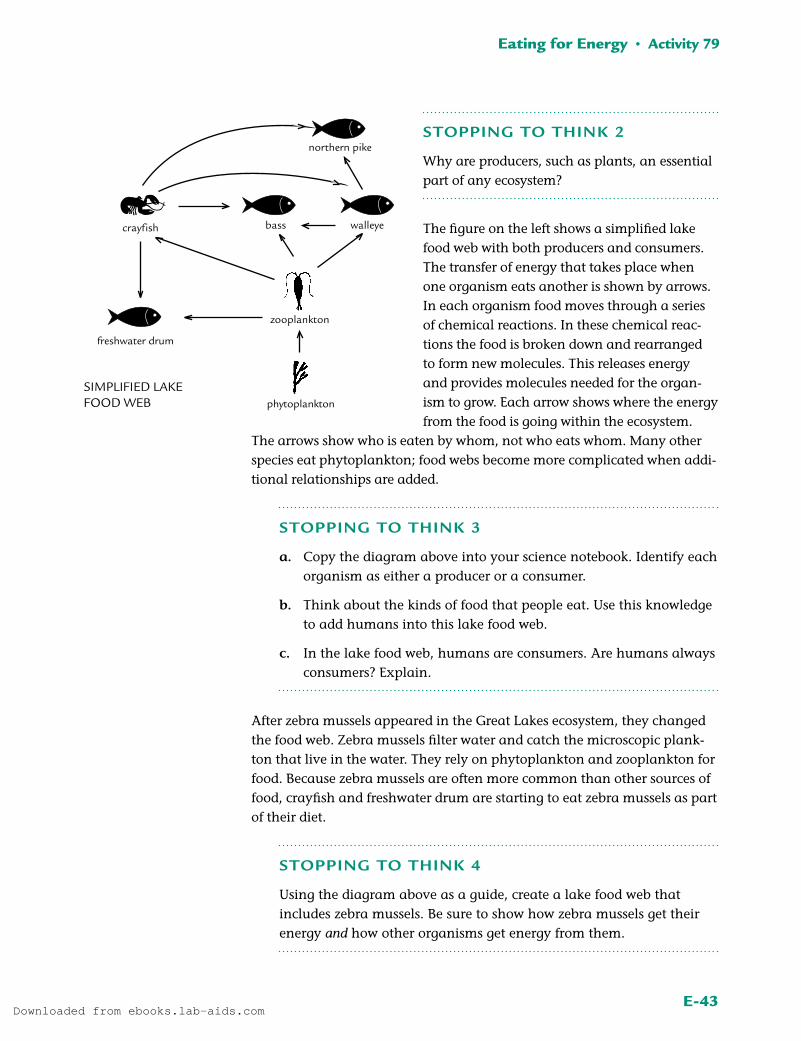
The figure on the left shows a simplified lake food web with both producers and consumers. The transfer of energy that takes place when one organism eats another is shown by arrows. In each organism food moves through a series of chemical reactions. In these chemical reac-tions the food is broken down and rearranged to form new molecules. This releases energy and provides molecules needed for the organ-ism to grow. Each arrow shows where the energy from the food is going within the ecosystem.
The arrows show who is eaten by whom, not who eats whom. Many other species eat phytoplankton; food webs become more complicated when addi-tional relationships are added.
stoPPiNg to thiNk 3
a. Copy the diagram above into your science notebook. Identify each organism as either a producer or a consumer.
b. Think about the kinds of food that people eat. Use this knowledge to add humans into this lake food web.
c. In the lake food web, humans are consumers. Are humans always consumers? Explain.
After zebra mussels appeared in the Great Lakes ecosystem, they changed the food web. Zebra mussels filter water and catch the microscopic plank-ton that live in the water. They rely on phytoplankton and zooplankton for food. Because zebra mussels are often more common than other sources of food, crayfish and freshwater drum are starting to eat zebra mussels as part of their diet.
stoPPiNg to thiNk 4
Using the diagram above as a guide, create a lake food web that includes zebra mussels. Be sure to show how zebra mussels get their energy and how other organisms get energy from them.
freshwater drum
crayfish bass
northern pike
walleye
zooplankton
phytoplankton
simPLified LAke food web
Eating for Energy • Activity 79
Downloaded from ebooks.lab-aids.com
E-44
At first, these changes don’t seem too important. After all, couldn’t the lake ecosystem support one more consumer? Adult zebra mussels filter about one liter of water per day. This means that a twoinch mussel can filter enough water to fill half of a large soft drink bottle every day. In some parts of the Great Lakes, the concentration of zebra mussels has reached as high as 70,000 mussels in a square meter. This means that just a small area of mussels would be able to filter 70,000 liters of lake water each day! As a result of zebra mussels, the clearness of the water has changed: it is now 600% clearer than it was before the introduction of the zebra mussels. Clear water sounds like a good thing, but biologically speaking, extremely clear water can mean that there is not much alive in the water. In fact, the zebra mussel population has been so effective at filtering plankton that the popu-lations of some types of phytoplankton have decreased by 80%.
Remember, phytoplankton are the base of this aquatic food chain. By remov-ing large amounts of phytoplankton from the water, zebra mussels remove the food for microscopic zooplankton. Many types of fish depend on zoo-plankton for food. In some cases, these fish are the food for other fish and for humans and other mammals. Some ecologists predict that zebra mussels will change the entire food web of the lake ecosystem. However, there is no evi-dence yet that zebra mussels have affected fish populations in the lake.
There is evidence, though, that the types of plants in the lake are changing. Because of the increased clearness, sunlight is now able to penetrate deeper into the lake. Plants such as algae are now growing along the lake bot-tom. This provides habitat and food for other organisms, such as sunfish, that are currently not common in the lake. Some scientists predict that the fish populations will change: populations of some fish, like walleye, will decrease, while populations of other fish, like sunfish, will increase.
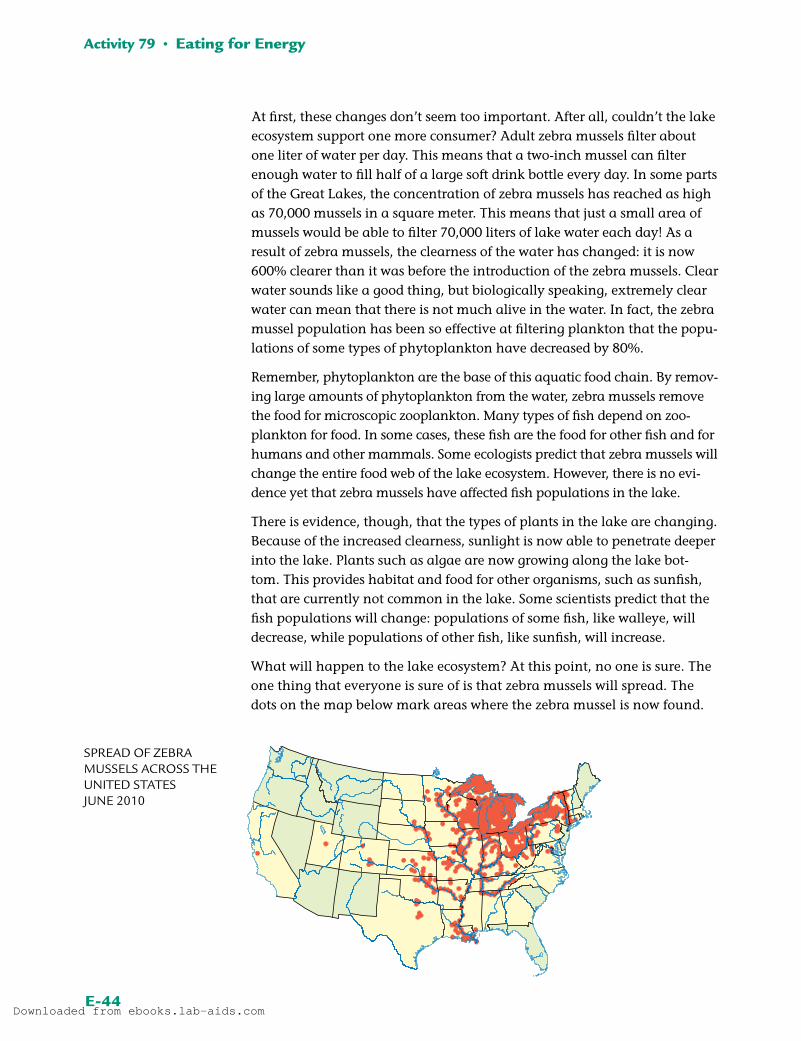
What will happen to the lake ecosystem? At this point, no one is sure. The one thing that everyone is sure of is that zebra mussels will spread. The dots on the map below mark areas where the zebra mussel is now found.
sPreAd of ZebrA musseLs ACross the united stAtes June 2010
Activity 79 • Eating for Energy
Downloaded from ebooks.lab-aids.com
E-45
stoPPiNg to thiNk 5
Look at the zebra mussel map. The lines across the U.S. represent large rivers. Where do you predict zebra mussels will be found in the next 10 years? The next 20 years? The next 50 years? Explain your predictions.
aNalysis 1. Fill in the “After” column for Statements 3–5 only on Sheet 77.2,
“Anticipation Guide: Introduced Species—Zebra Mussels.” Did your thinking change?
2. Complete steps 2 and 3 on Student Sheet 79.1, “Talking Drawing: Eating for Energy.” Has your thinking changed? Explain.
3. A volcano erupts 40 miles from the lake ecosystem whose food web you drew in Stopping to Think 4. Ash from the eruption blocks sunlight over your ecosystem for several months. Explain what happens to each pop-ulation within the lake food web in the weeks that follow the eruption.
4. The ash clears and several more months go by. Think about what is now happening to your lake ecosystem. Identify what factors will affect how quickly it recovers.
5. Reflection: Think about what you have learned about introduced spe-cies as well as ecosystems. What effect(s) can an introduced species have on an ecosystem?
exteNsioNGo the Issues and Life Science page of the SEPUP website to link to the website of the United States Geological Survey. Click on 1986 to see the first reported zebra mussel sightings. Then click every five years until the present. What do you notice about the spread of zebra mussels across the United States?
Eating for Energy • Activity 79
Downloaded from ebooks.lab-aids.com
E-46
You have learned about the roles of producers and consumers in a food web. But what about worms, bacteria, and fungi? What role do
they play within an ecosystem? Organisms that eat dead organisms and wastes from living organisms are known as decomposers. Worms, bacteria, and fungi are decomposers. You can think of decomposers as a special type of consumer: they consume dead organisms and waste material.
Decomposers like worms and bacteria can seem unimportant. The decay they cause can look (and smell) horrible. But decomposers are essential to the ability of ecosystems to recycle important nutrients like carbon and nitrogen. Decomposers, such as bacteria and fungi, break down dead mat-ter into carbon dioxide, nitrates, and other substances. These substances are released into the air, soil, and water. This cycles carbon, nitrogen, and other atoms between the living organisms and nonliving parts of the eco-system. Without decomposers, dead organisms would pile up and the nutri-ents they contain could not be re-used by plants. Eventually, the fertility of soil and aquatic ecosystems would be reduced to nothing. Imagine what the bottom of a lake would look like without any decomposers!
Where can you find some decomposers? What do these decomposers look like?
80 Nature’s Recyclers
laborato
ry
CHALLENGE
Fungi such as these decompose wood and other dead plant material.
Downloaded from ebooks.lab-aids.com
E-47
ProcedurePart A: Investigating Soil
1. Gather 1⁄2 cup of soil from outdoors by scraping or shaking moist soil from around the roots of a clump of grass or other plant or from an area of decomposing leaf litter.
2. Place the tubing on the spout of the funnel. Then attach the clamp onto the middle of the tubing, as shown at left. Make sure that the tubing is pushed as far as it can go into the clamp; otherwise the water can drip out.
3. Place the funnel in the stand and the perforated disc into the funnel.
4. Add water to the funnel to the level of the perforated disc.
5. Put a single layer of filter paper in the funnel. You may need to separate the layers. Add a layer of your soil sample, no more than 1 cm deep, onto the filter paper.
6. Fold the filter paper over the soil. Add just enough water to cover the soil and filter paper. Set aside for one day.
Part B: Searching for Nematodes
7. Carefully remove the clamp to release a small amount (less than 5 mL) of water into the cup. Share this sample in your group of four.
8. You might be able to see some small, white thread-like objects in the water. Try to suck up one of the thread-like objects into the dropper. Then squeeze a couple of drops from the dropper onto a microscope slide.
For each group of four students
1 soil sample
1 nematode extractor
1 clamp
1 piece of tubing
1 large piece of filter paper
1 cup of water
For each pair of two students
1 microscope
1 microscope slide
1 coverslip
1 dropper
Materials
nemAtode extrACtor
Nature’s Recyclers • Activity 80
Downloaded from ebooks.lab-aids.com
E-48
Activity 80 • Nature’s Recyclers
9. Carefully touch one edge of the coverslip, at an angle, to the mixture. Slowly allow the coverslip to drop into place.
10. Begin by observing the slide on low power (usually the 4× objective). Be sure that the sample is in the center of the field of view (you may need to move the slide slightly) and completely in focus before going on to the next step.
Hint: To check that you are focused on the sample, move the slide slightly while you look through the eyepiece—the sample that you are focused on should move as you move the slide.
11. Without moving the slide, switch to medium power (usually the 10× objective). Adjust the microscope settings as necessary.
Hint: If material on the slide is too dark to see, increase the amount of light on the slide: do this by slightly opening the diaphragm under the stage.
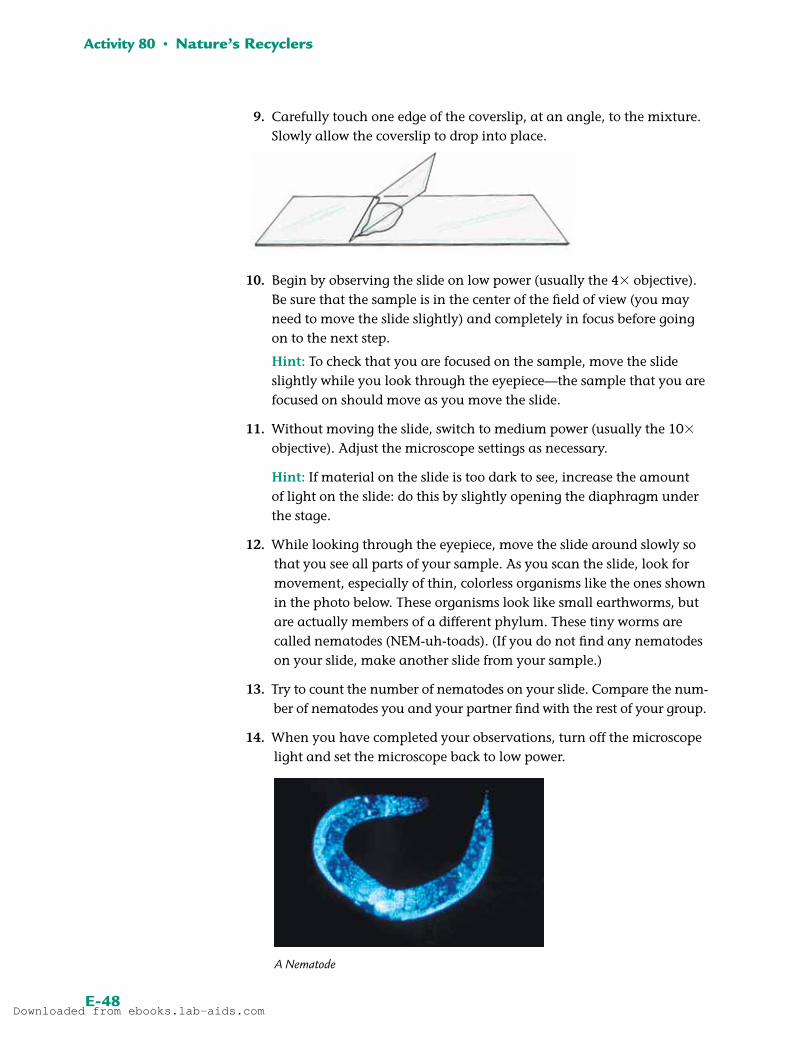
12. While looking through the eyepiece, move the slide around slowly so that you see all parts of your sample. As you scan the slide, look for movement, especially of thin, colorless organisms like the ones shown in the photo below. These organisms look like small earthworms, but are actually members of a different phylum. These tiny worms are called nematodes (NEMuhtoads). (If you do not find any nematodes on your slide, make another slide from your sample.)
13. Try to count the number of nematodes on your slide. Compare the num-ber of nematodes you and your partner find with the rest of your group.
14. When you have completed your observations, turn off the microscope light and set the microscope back to low power.
A Nematode
Downloaded from ebooks.lab-aids.com
E-49
aNalysis 1. Think about where some nematodes are found. What do you think they
eat? Describe the role of nematodes in the ecosystem.
2. a. A simplified food web is shown below. Which of the organisms in this ecosystem are producers? Which are consumers? Which are decomposers?
b. Use the food web to explain why decomposers could be considered a special type of consumer.
3. Like all organisms, birds like the egret need energy to live. Explain how the original source of energy for egrets, and all other consumers, is the sun.
4. Imagine that something kills most of the bacteria and other decom-posers in a lake. What are some possible effects of killing these decomposers?
exteNsioN To learn more about food webs and explore different food webs, go to the Issues and Life Science page of the SEPUP website.
Nature’s Recyclers • Activity 80
Downloaded from ebooks.lab-aids.com
E-50
O rganisms that use energy from the sun to make food are known as producers. These include plants that you are familiar with,
such as trees and grass, as well as organisms that live in the ocean, such as phytoplankton. Most phytoplankton are microscopic but they have a very big role in earth’s ecosystems. They produce oxygen and provide energy for all living creatures—for the consumers that eat plants, the consumers that eat animals that eat plants, and the decomposers that live off dead plants and animals. They do this by means of photosynthesis, a process by which plants use the energy from sunlight to convert carbon dioxide and water into food for themselves (and indirectly, for consumers). During this pro-cess, plants release oxygen gas into the atmosphere. Photosynthesis can be described by the following word equation:
sunlightcarbon dioxide 1 water ––––––––> food 1 oxygen
Is light necessary for photosynthesis? How important is sunlight to an eco-system? In this activity, you will use the indicator bromthymol blue (BTB) to collect evidence for the role of light in photosynthesis.
How do scientists study the role of light in photosynthesis?
Activity 60 • Mendel, First Geneticist
81 A Producer’s Source of Energy
laborato
ry
CHALLENGE
Downloaded from ebooks.lab-aids.com
E-51
ProcedurePart A: Collecting Evidence
1. If you have completed previous units of Issues and Life Science, review your notes from Activity 17, “Gas Exchange,” and Activity 39, “Cells Alive!” Use your notes to complete Tables 1 and 2 on Student Sheet 81.1, “Recording Results.” If you haven’t completed these activities, your teacher will help you fill in the tables.
2. Fill a plastic cup half-full of water. (Your teacher may have already done this.) Add 15 drops of BTB.
3. Have one person in your group use a straw to blow into the BTB solution until it stops changing color. Record this as the initial BTB color in Table 3 of Student Sheet 81.1.
4. Place a piece of Elodea into one of the vials. Carefully fill the rest of this vial with your BTB solution. Cap the vial tightly and place it in the light. Caution: Do not put your vial in a place that is extremely warm.
5. Fill a second vial with the same BTB solution only. Cap this vial tightly and place alongside the first vial.
6. With your group, discuss what you think might happen. Record your prediction in your science notebook.
A Producer’s Source of Energy • Activity 81
For the class
light source (such as lamps or windows that receive good natural light)
For each group of four students
2–5 pieces of Elodea (Anacharis) (about 6 cm in length)
1 cup of water
1 dropper bottle of bromthymol blue (BTB)
1 straw
4 clear plastic vials with caps
1–4 pieces of aluminum foil
1 30-mL graduated cup
1 metric ruler (optional)
For each student
1 Student Sheet 81.1, “Recording Results”
Materials
Downloaded from ebooks.lab-aids.com
E-52
7. After at least 45 minutes (or during your next class period), observe your vials. Use your observations to complete Table 3 of Student Sheet 81.1, as well as Analysis Questions 1 and 2.
Part B: The Role of Light
8. Design an experiment to investigate the role of light in plant photosynthesis.
Hint: Use the introduction to the activity and your results from Part A to help you.
When designing your experiment, think about the following questions:
• What is the purpose of your experiment?
• What variable are you testing?
• What variables will you keep the same?
• What is your hypothesis?
• How many trials will you conduct?
• Will you collect qualitative and/or quantitative data? How will these data help you to make a conclusion?
• How will you record these data?
9. Record your hypothesis and your planned experimental procedure in your science notebook.
10. Make a data table that has space for all the data you need to record. You will fill it in during your experiment.
11. Obtain your teacher’s approval of your experiment.
12. Conduct your experiment and record your results.
exteNsioN 1Observe a capped vial containing a plant in BTB solution at different times of the day. What color is the solution first thing in the morning? At lunchtime? Explain your observations. What process may be taking place in plants at night?
Activity 81 • A Producer’s Source of Energy
Downloaded from ebooks.lab-aids.com
E-53
A Producer’s Source of Energy • Activity 81
aNalysisPart A: Collecting Evidence
1. What was the purpose of the vial containing only BTB solution?
2. In the introduction to this activity, you were told that plants need car-bon dioxide during photosynthesis. What evidence do you have from Part A of your investigation to support this claim?
Part B: The Role of Light
3. Describe your experimental results. Use the word equation at the begin-ning of this activity to help explain your results.
4. Explain the role that light plays in photosynthesis. How do your results provide evidence for your explanation?
5. A second-grader comes up to you and says, “We just learned that the sun made all the stuff in my lunch. But my lunch was a tuna sandwich.” Using language a second-grader would understand, explain how the sun was the original source of the energy in the tuna sandwich. Then try out your explanation on a child you know!
6. Think back to how the lake ecosystem described in Activity 79, “Eating for Energy,” was affected by zebra mussels. Using your understanding of photosynthesis and ecosystems, explain why a decrease in phyto-plankton allows more aquatic plants to grow on the lake bottom.
exteNsioN 2Your experiment looked at the inputs needed by a plant for photosynthesis. Design another experiment to collect evidence for the outputs of photosyn-thesis. Describe what materials you would need to perform this experiment, and what data you would collect.
Downloaded from ebooks.lab-aids.com
E-54
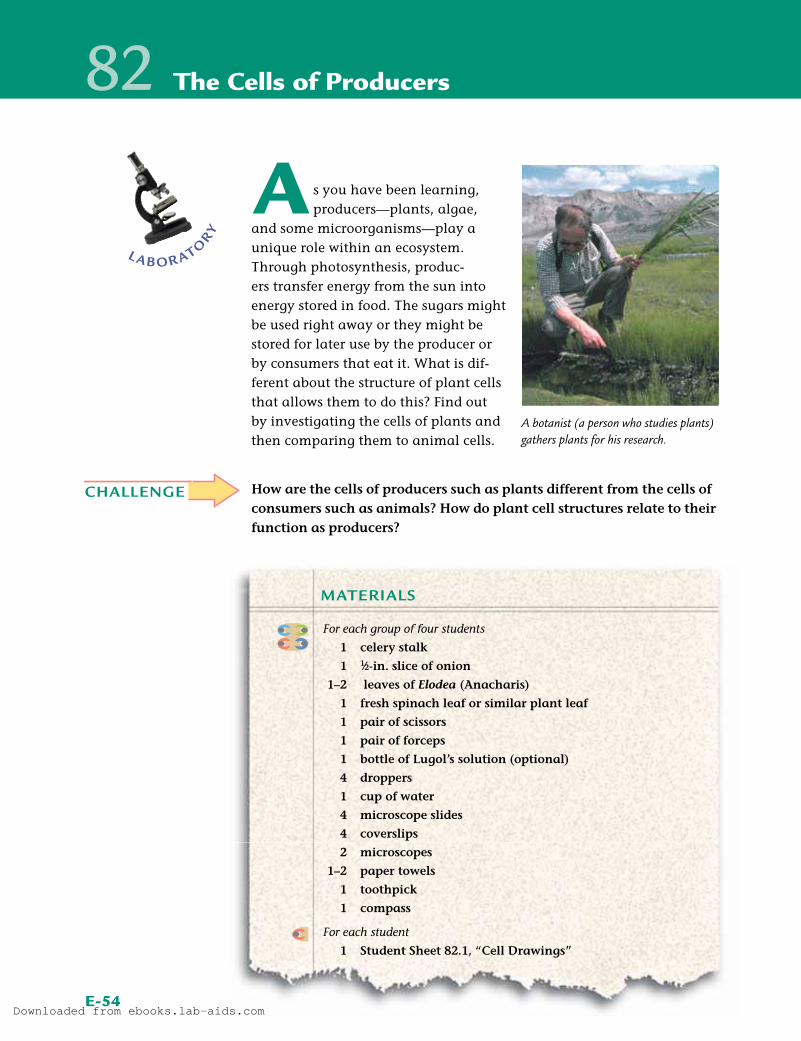
A s you have been learning, producers—plants, algae,
and some microorganisms—play a unique role within an ecosystem. Through photosynthesis, produc-ers transfer energy from the sun into energy stored in food. The sugars might be used right away or they might be stored for later use by the producer or by consumers that eat it. What is dif-ferent about the structure of plant cells that allows them to do this? Find out by investigating the cells of plants and then comparing them to animal cells.
How are the cells of producers such as plants different from the cells of consumers such as animals? How do plant cell structures relate to their function as producers?
laborato
ry
For each group of four students
1 celery stalk
1 1⁄2-in. slice of onion
1–2 leaves of Elodea (Anacharis)
1 fresh spinach leaf or similar plant leaf
1 pair of scissors
1 pair of forceps
1 bottle of Lugol’s solution (optional)
4 droppers
1 cup of water
4 microscope slides
4 coverslips
2 microscopes
1–2 paper towels
1 toothpick
1 compass
For each student
1 Student Sheet 82.1, “Cell Drawings”
Materials
82 The Cells of Producers
CHALLENGE
A botanist (a person who studies plants) gathers plants for his research.
Downloaded from ebooks.lab-aids.com
E-55
PLACing the CoVersLiP
Procedure 1. Have each person in your group complete one of the following four
steps. You will share all four slides within your group.
a. Pull a string of celery off the stalk. At the edge of the string, you will see a thin film. This is the outer layer of the celery stalk and the part where you will see plant cells most clearly. Use scissors to cut a short length of this outer film. Place this piece of celery on a micro-scope slide. Add a drop of water and slowly drop the coverslip, at an angle, into place (as shown in the figure below).
b. Get a small square of onion. Use your forceps to peel off a thin film of tissue from the inside layer of the onion square. Place this thin film on a microscope slide. Add a drop of water and slowly drop the coverslip, at an angle, into place (as shown in the figure below).
c. Get a piece of Elodea and break off a leaf. Place a piece of this leaf on a microscope slide. Add a drop of water and slowly drop the coverslip, at an angle, into place (as shown in the figure below).
d. Get a fresh spinach leaf or similar plant leaf. Use the toothpick to gently scrape some plant cells from the underside of the leaf. Place some of the scrapings on the slide. Add a drop of water and slowly drop the coverslip, at an angle, into place (as shown in the figure below).
2. With your partner, observe the cells of each plant. Begin by observing the slide on low power (usually the 4× objective). Be sure that the plant material is in the center of the field of view (you may need to move the slide slightly) and completely in focus before going on to Step 3.
Hint: When viewing celery, focus on the thinnest parts of the sample.
3. Without moving the slide (which can be secured with stage clips), switch to medium power (usually the 10× objective). Adjust the microscope set-tings as necessary.
Hint: If material on the slide is too dark to see, increase the amount of light on the slide: do this by slightly opening the diaphragm under the stage.
4. Turn the fine focus knob up and down just a little to reveal details of the plant cells at different levels of the slide.
The Cells of Producers • Activity 82
Downloaded from ebooks.lab-aids.com
E-56
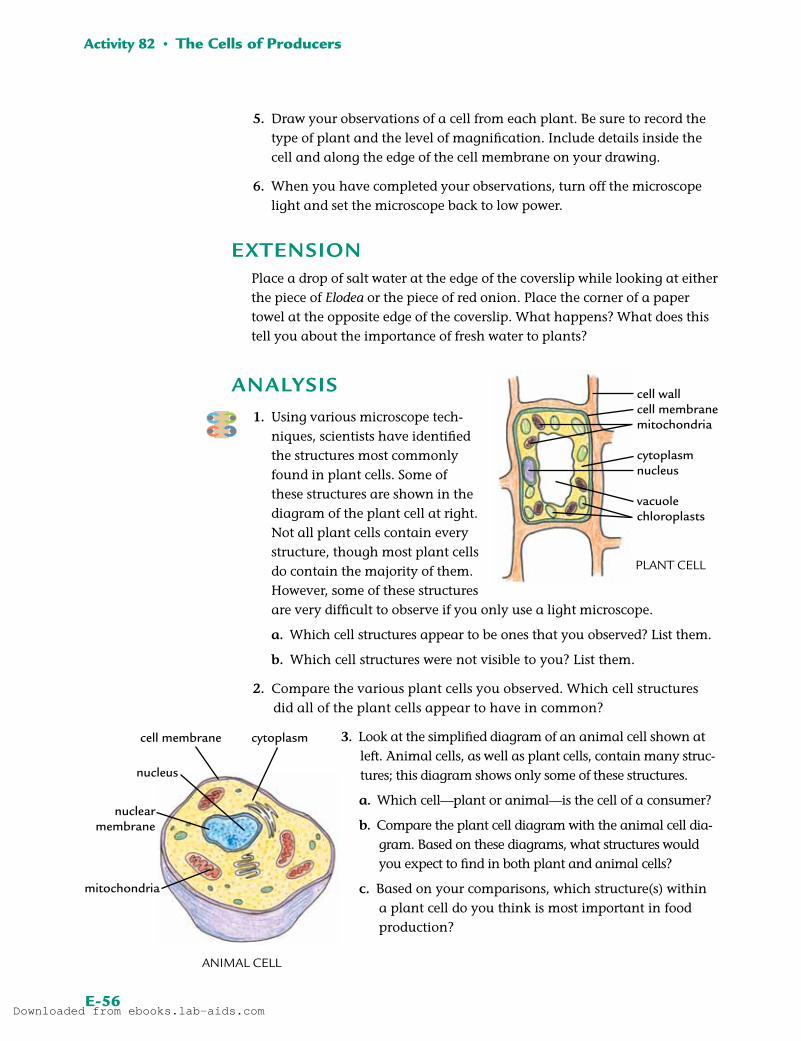
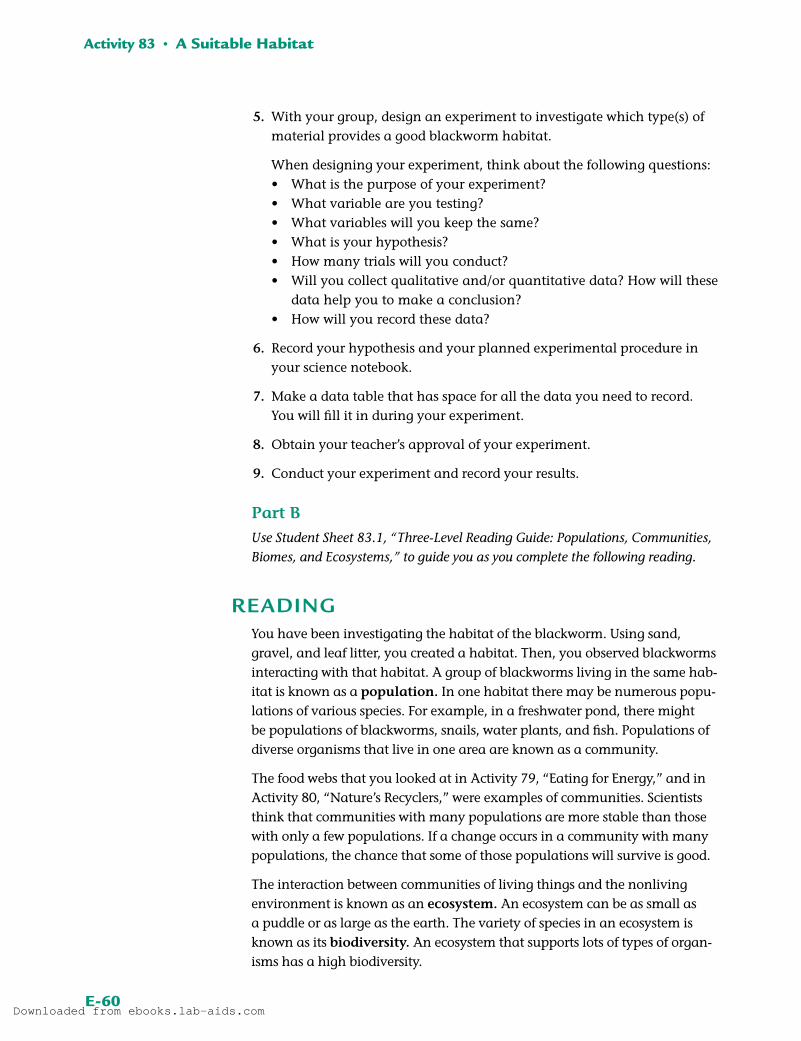
Activity 82 • The Cells of Producers
5. Draw your observations of a cell from each plant. Be sure to record the type of plant and the level of magnification. Include details inside the cell and along the edge of the cell membrane on your drawing.
6. When you have completed your observations, turn off the microscope light and set the microscope back to low power.
exteNsioNPlace a drop of salt water at the edge of the coverslip while looking at either the piece of Elodea or the piece of red onion. Place the corner of a paper towel at the opposite edge of the coverslip. What happens? What does this tell you about the importance of fresh water to plants?
aNalysis 1. Using various microscope tech-
niques, scientists have identified the structures most commonly found in plant cells. Some of these structures are shown in the diagram of the plant cell at right. Not all plant cells contain every structure, though most plant cells do contain the majority of them. However, some of these structures are very difficult to observe if you only use a light microscope.
a. Which cell structures appear to be ones that you observed? List them.
b. Which cell structures were not visible to you? List them.
2. Compare the various plant cells you observed. Which cell structures did all of the plant cells appear to have in common?
AnimAL CeLL
cell membrane cytoplasm
mitochondria
nucleus
nuclear membrane
3. Look at the simplified diagram of an animal cell shown at left. Animal cells, as well as plant cells, contain many struc-tures; this diagram shows only some of these structures.
a. Which cell—plant or animal—is the cell of a consumer?
b. Compare the plant cell diagram with the animal cell dia-gram. Based on these diagrams, what structures would you expect to find in both plant and animal cells?
c. Based on your comparisons, which structure(s) within a plant cell do you think is most important in food production?
cell wallcell membranemitochondria
cytoplasmnucleus
vacuolechloroplasts
PLAnt CeLL
Downloaded from ebooks.lab-aids.com
E-57
4. Copy a larger version of the Venn diagram shown here. Complete it by writing in the characteristics of animal cells, plant cells, and bac-terial cells (which you may have first studied in Activity 44, “Who’s Who?”). Record unique features of each type of cell in the individual spaces. Record common features among groups in the spaces that overlap.
5. a. Many plants have leaves, stems, roots, and—during the blooming season—flowers. Which of these parts are likely to absorb sunlight and carry out photosynthesis?
b. Of the cells you observed—celery stem, onion, Elodea leaf, and the other plant leaf—which would you expect to carry out photosynthesis?
c. What cell structures are seen only in cells that absorb sunlight and carry out photosynthesis?
6. Three of the introduced species described in Activity 73, “Introduced Species,” are plants: kudzu, purple loosestrife, and hydrilla. Each of these plants is growing successfully in different parts of the United States, partly because they are very well adapted to absorb sunlight and carry out photosynthesis.
a. What effect do you think the growth and spread of these introduced plants will have on native plants? Explain.
b. What effect do you think the growth and spread of these introduced plants will have on animals in the native ecosystems? Explain.
The Cells of Producers • Activity 82
AnimalCells
PlantCells
BacteriaCells
leaf
root
flower
stem
Downloaded from ebooks.lab-aids.com
E-58
Introduced species do not always survive in new environments. This is because all species have requirements for the place in which they can
live. These requirements define the species’ habitat (HAB-ih-tat). What makes up a habitat? Think about different aquatic ecosystems, such as a small pond or a coral reef. While both of these environments contain water, they have very different characteristics. Coral reefs are found in the ocean, which contains salt water, while most ponds are freshwater. An organism that lives in freshwater, like a zebra mussel, cannot survive in the coral reef environment. The photos below show several different habitats.
Producers, consumers, and decomposers are the living components of an ecosystem. Every ecosystem also has many non-living elements, such as rainfall, light, and temperature. The interaction of all these determines whether a habitat is suitable for a specific organism.
83 A Suitable Habitat
laborato
ry
Downloaded from ebooks.lab-aids.com
E-59
3. As a class, discuss what type of data you could collect on the blackworms in order to determine which type(s) of material provides a good habitat for them.
4. Compare the different materials you can use to create a blackworm habitat. Record any simi larities and differences in the physi-cal characteristics of the different habitat materials.
For each group of four students
5 blackworms (Lumbriculus variegatus)
1 150-mm petri dish
1 pipet
1 cup of treated tap water (or spring water)
1 dropper
sand
aquarium gravel
aquatic leaf litter (such as oak leaves in spring water)
1. Fill the base of a petri dish with treated tap water (or spring water) and place 5 blackworms in it.
2. Observe how the blackworms respond over the next few minutes. Discuss with your group any behaviors that seem to be true of all or most of the blackworms.
What are some of the important non-living characteristics of a habitat?
Numerous habitats make up a pond ecosystem.
Downloaded from ebooks.lab-aids.com
E-60
Activity 83 • A Suitable Habitat
5. With your group, design an experiment to investigate which type(s) of material provides a good blackworm habitat.
When designing your experiment, think about the following questions:• What is the purpose of your experiment? • What variable are you testing? • What variables will you keep the same?• What is your hypothesis?• How many trials will you conduct?• Will you collect qualitative and/or quantitative data? How will these
data help you to make a conclusion?• How will you record these data?
6. Record your hypothesis and your planned experimental procedure in your science notebook.
7. Make a data table that has space for all the data you need to record. You will fill it in during your experiment.
8. Obtain your teacher’s approval of your experiment.
9. Conduct your experiment and record your results.
Part B
Use Student Sheet 83.1, “Three-Level Reading Guide: Populations, Communities, Biomes, and Ecosystems,” to guide you as you complete the following reading.
readiNgYou have been investigating the habitat of the blackworm. Using sand, gravel, and leaf litter, you created a habitat. Then, you observed blackworms interacting with that habitat. A group of blackworms living in the same hab-itat is known as a population. In one habitat there may be numerous popu-lations of various species. For example, in a freshwater pond, there might be populations of blackworms, snails, water plants, and fish. Populations of diverse organisms that live in one area are known as a community.
The food webs that you looked at in Activity 79, “Eating for Energy,” and in Activity 80, “Nature’s Recyclers,” were examples of communities. Scientists think that communities with many populations are more stable than those with only a few populations. If a change occurs in a community with many populations, the chance that some of those populations will survive is good.
The interaction between communities of living things and the nonliving environment is known as an ecosystem. An ecosystem can be as small as a puddle or as large as the earth. The variety of species in an ecosystem is known as its biodiversity. An ecosystem that supports lots of types of organ-isms has a high biodiversity.
Downloaded from ebooks.lab-aids.com
E-61
Ecosystems are constantly changing. Take, for example, the effects on the ecosystem if a pond fills with sediment from erosion. If resources decrease, the populations that depend on them decrease. In this case, a decrease of water in the pond means that aquatic animals and water plants would die. Even birds and insects that depend on the pond for food would disappear. Eventually, a new ecosystem would develop based on the grasses that would sprout from the new sediments.
Organisms and populations of organisms depend on living and non-living resources in the environment. All organisms need food and water for growth and reproduction. The need for food leads to various interactions between organisms. The table below shows a few examples:
Organisms have adaptive characteristics that help them to survive in a par-ticular ecosystem. For instance, in the desert water is scarce. Cacti and other desert plants have thick, waxy surfaces that hold water inside the plant. Ani-mals have adaptive characteristics and behaviors as well. To avoid the heat, many desert animals only hunt at night.
Environments have varying temperatures, amounts of moisture, and amounts of light. These contribute to the climate of an area. In a particular area, the interaction of climate, geography, and plant and animal life is called a biome (BY-oam). While biomes that are similar to each other exist throughout the
world, the ecosystems that exist in each biome are not the same. Think about the rain forest biomes of the Amazon in South America and those of Australia. Although the physical characteristics are similar, the plant and animal life and the ecosystems they are part of make the biomes very different.
On the next page are the major types of biomes of the world. Think about the unique features of each one.
A Suitable Habitat • Activity 83
Type of Interaction Example of Animals Involved Result of Interaction
Competition Sharks and whales Sharks and whales compete for the same food, including seals, small fish, and dolphins.
Predator/prey Wolves and deer Wolves eat the deer.
Mutually beneficial Cleaner shrimp and large fish Shrimp eat parasites off larger fish, and fish are free of parasites.
This pond is filling with sediment and will eventually disappear. What will happen to the aquatic organisms that depend on the pond?
Downloaded from ebooks.lab-aids.com
E-62
DESERT• Dry, may be hot or cold
• Sandy soil
• Few plants and animals, mostly reptiles and small mammals
TUNDRA• Dry and cold
• Permafrost (frozen soil)
• Few plants and animals, mostly migrating mammals
Activity 83 • A Suitable Habitat
FREShwATER• Includes lakes, rivers, and wetlands
• Many types of animals
• Primary source of water for drinking and irrigation
MARINE (saltwater)
• Includes oceans, coral reefs, and estuaries
• Supports many forms of life
• Plays a role in regulating the earth’s temperature
Downloaded from ebooks.lab-aids.com
E-63
coNIFERoUS FoREST (taiga)
• Adequate water, cool year-round
• Poor and rocky soil
• Many mammals, birds, insects, and conifers (cone-bearing plants)
DEcIDUoUS FoREST• Adequate water, cool and warm season
• Fertile soil
• Many animals and deciduous plants (plants that lose their leaves yearly)
gRASSLAND• Both dry and wet season, warm to hot
• Fertile soil
• Many animals and grasses, with very few or no trees
TRopIcAL RAIN FoREST• Very wet and very warm
• Acidic soil with few nutrients
• Many animals and plants, with great diversity
A Suitable Habitat • Activity 83
Downloaded from ebooks.lab-aids.com
E-64
All of these biomes make up the earth’s ecosystem. Human activities pose threats to each of these biomes. Some of these threats are shown in the table below.
Another potential threat to earth’s biomes is global climate change. Con-sider the marine biome. Microscopic phytoplankton produce more than half of the oxygen in the atmosphere. Scientists have collected data that suggest that warmer oceans might reduce phytoplankton populations. This in turn could reduce the amount of oxygen and food available for other organisms.
aNalysisPart A
1. Based on your experiment, which type(s) of material provides a good habitat for blackworms? Explain how your experimental results support your conclusions.
2. Describe the non-living characteristics of a habitat.
Hint: What non-living factors could affect whether organisms will sur-vive and reproduce?
3. What could you do with your blackworms to investigate if a warm or cold habitat is better for them? Write a procedure that anyone in your class could follow to investigate this question.
Activity 83 • A Suitable Habitat
Biome Ecological Threat
Freshwater Farmland runoff and industrial pollution
Marine Overfishing and pollution
Desert Recreation and development
Tundra Hunting and pollution
Taiga (coniferous forest) Logging, commercial and private development
Deciduous forest Logging, commercial and private development
Grassland Development
Tropical rain forest Logging, slash-and-burn farm development
Examples of Threats to Biomes
Downloaded from ebooks.lab-aids.com
E-65
Part B
4. What are two common biomes in the United States? Where are they located?
5. Draw a diagram that shows the relationship among ecosystems, habi-tats, biomes, populations, and communities.
6. Choose one of the biomes, and explain how serious damage to this biome would affect ecosystems on earth.
7. Reflection: Do you think that introduced species are always successful in new environments? Explain.
exteNsioN Go to the Issues and Life Science page of the SEPUP website to find out more about relationships within an ecosystem and ecological threats to the world’s biomes.
A Suitable Habitat • Activity 83
Downloaded from ebooks.lab-aids.com
E-66
Ecosystems and the populations that live in them usually vary from season to season and year to year, often depending on non-living
factors such as rainfall or temperature variations. Populations of a species can also be affected by living factors, such as other species that may pro-vide food, compete for food, or provide shade or shelter.
When a new species is introduced into an area, it can compete with native species for food and other resources. Clams and zebra mussels are both mol-lusks that feed by filtering plankton from the water. What happens when zebra mussels are introduced into a habitat containing a clam population?
How might the introduction of a competing species, such as zebra mus-sels, affect a population of native clams?
1. As directed by your teacher, determine which students will initially repre-sent clams and which students will initially represent plankton.
2. If you represent a clam, stand inside a chalk circle. There should be only one clam per circle. The space between the clams represents the amount of space a clam needs to survive. As long as you represent a clam, you must stay inside the circle.
3. If you represent plankton, stand behind the safety line on one side of the clam bed.
4. Your teacher will instruct the plankton to run through the clam bed, from one safety zone to the other (see map below). A clam can use only one hand to tag its food. Each clam will try to “catch” (tag) plankton to survive; any plankton that is caught becomes a clam and has to find a home circle. Any clam that does not catch any plankton dies from lack of food; the student becomes plankton and must go to the safety zone.
5. Count and record the total population of clams.
6. Repeat Steps 4 and 5 at least ten times.
Clam Bed
SafetyZone
SafetyZone
Cla
ms
CLAm CAtCh gAme mAP
Clam Catch • Activity 84
Downloaded from ebooks.lab-aids.com
E-68
Part B: Competition
7. Zebra mussels have invaded the clam bed! As directed by your teacher, determine which students will initially represent clams, which students will initially represent plankton, and which students will initially repre-sent zebra mussels.
8. If you represent a zebra mussel, wear an arm band to identify yourself and then stand inside a chalk circle. Since zebra mussels grow very close together, a zebra mussel can grow in (i.e. share) the same circle as a clam. If no clams are present, two zebra mussels can occupy the same circle. As long as you represent a zebra mussel, you must stay inside a circle.
9. If you represent a clam, stand inside a chalk circle. There can still be only one clam per circle (although one zebra mussel can occupy the same circle). As long as you represent a clam, you must stay inside the circle.
10. If you represent plankton, stand behind the safety line on one side of the clam bed.
11. Your teacher will instruct the plankton to run through the clam bed, from one safety zone to the other (see the Clam Catch Game map). A clam can use only one hand to tag its food, while a zebra mussel can use both hands. Each clam and zebra mussel will try to catch plankton to survive; any plankton that is caught becomes a clam or a zebra mus-sel (depending on who catches it). If you become a zebra mussel, collect an arm band to wear.
Any clam or zebra mussel that does not catch any plankton dies from lack of food and becomes plankton. When a zebra mussel dies, the arm band should be removed.
12. Record and count the total population of clams and zebra mussels.
13. Repeat Steps 11 and 12 at least ten times.
14. Record the class data on Student Sheet 88.1, “Population Data.”
exteNsioNAre Introduced Species Always Successful?
Introduce a mobile predator that eats only clams. Figure out how to modify the game to include this predator. Predict what you think will happen to the predator population and the clam population over time. Then test your ideas by playing the game for at least ten rounds.
Activity 84 • Clam Catch
Downloaded from ebooks.lab-aids.com
E-69
Clam Catch • Activity 84
aNalysisPart A: Clam Population
1. a. Graph the population of clams over time from Part A of the Proce-dure. Decide which type of graph (bar or line) would best represent the data. Remember to label your axes and to title your graph.
b. Look at your graph and describe how this population of clams changed over time.
2. What factor limited the size of the clam population?
Part B: Competition
3. a. Graph the population of clams and zebra mussels over time from Part B of the Procedure. Use the same type of graph you used in Part A. Remember to label your axes and to title your graph. Use a key to show what represents the clam population and what represents the zebra mussel population.
b. Look at your graph and describe how the population of clams changed over time.
c. Look at your graph and describe how the population of zebra mus-sels changed over time.
4. a. What happened to the clam population after zebra mussels were introduced?
b. Why did zebra mussels have this effect on the clam population? Explain.
5. a. In a real lake, what non-living factors might affect the size of clam and zebra mussel populations? List them.
Hint: Go outside and look at an ecosystem around you. Observing an actual ecosystem may help you think of more factors.
b. In a real lake, what living factors might affect the size of clam and zebra mussel populations? List them.
6. Fill in the “After” column for Statements 6–8 only on Sheet 77.2, “Anticipation Guide: Introduced Species—Zebra Mussels.” Did your thinking change?
Downloaded from ebooks.lab-aids.com
E-70
In this unit, you’ve learned to interpret population graphs and to ana-lyze effects of factors such as competition, predators, and various envi-
ronmental conditions on population size. Can a population graph tell you how much room there is for a particular species in a habitat? What does it mean for a population to run out of space?
readiNgImagine that you are a field ecologist. You’ve been studying a small lake called Lake Ness for the past ten years. You first began work at the lake when you heard that zebra mussels had invaded a nearby river, one that connects to Lake Ness. After ten years of study, you feel satisfied that you have a good idea of how quickly the zebra mussel can populate a lake of this size. You’ve been keeping an ongoing count of the zebra mussels in the lake (in mussels per square meter). At this point, your graph of population size looks like Graph 1.
stoPPiNg to thiNk 1
Recall that zebra mussels get their food by filtering plankton out of the water. Look at Graph 1. What do you think is happening to the quantity of plankton at:
a. Point A? Explain your reasoning.
b. Point B? Explain your reasoning.
As a result of your analysis, you think you have identified the maximum number of zebra mussels that could live successfully in Lake Ness. You think this might be the carrying capacity of the lake for zebra mussels. This term suggests the amount a container can hold, or carry. But unlike the capacity of a container, the number of zebra mussels that the lake can successfully hold may change over time, based on both living and non-living factors.
A few days later, your friend Nadia comes to visit you from the city. She drove up to the lake in her new car. “It has a carrying capacity of five pas-sengers,” she brags. Since you’ve never seen her drive anyone but her best friend and her dog, you simply shrug.
stoPPiNg to thiNk 2
a. Look again at Graph 1. What is the carrying capacity of zebra mussels in Lake Ness? How did you determine this?
b. List some of the factors that might affect this carrying capacity.
Is There Room for One More? • Activity 85
Num
ber
of Z
ebra
Mus
sels
(pe
r m
2 )
0 5 100
1000
2000
3000
A
B
Time (years)
grAPh 1: ZebrA musseL PoPuLAtion of LAke ness oVer 10 yeArs
Downloaded from ebooks.lab-aids.com
E-72
After Nadia leaves, you spend a week organizing your data. You decide to stop studying Lake Ness so closely for a while. Instead, you’ll return to the lake once a year. During each visit, you’ll check on the zebra mussel popu-lation. Fifteen years pass. A graph of your data now looks like Graph 2.
Activity 85 • Is There Room for One More?
0 5 100
1000
2000
3000
15 20 25
Num
ber
of Z
ebra
Mus
sels
(pe
r m
2 )
Time (years)
grAPh 2: ZebrA musseL PoPuLAtion of LAke ness oVer 25 yeArs
stoPPiNg to thiNk 3
a. What is the carrying capacity for zebra mussels in Lake Ness between Years 13 and 25?
b. Identify at least three non-living factors that may have caused the carrying capacity to change. Explain how each factor could cause this change in carrying capacity.
c. Identify at least three living factors that may have caused the carrying capacity to change. Explain how each factor could cause this change in carrying capacity.
d. Do you think that the zebra mussel population will return to the level it had reached between Years 5 and 10? Why or why not?
For twelve years now, you’ve been puzzled by the change in the zebra mus-sel population. For example, in all your years of study, you’ve found no evidence of a new predator of zebra mussels appearing in the lake. You remain convinced that something about the zebra mussel’s habitat must have changed to cause this shift in the population level. Consulting public records, you discover that a new factory was built just three miles from the lake about fifteen years ago!
Energized, you decide to test your hypothesis. You set up two identical tanks. One tank contains water from Lake Ness. The other tank contains water from a similar lake that is higher up in the mountains and farther from the factory. You add exactly ten adult zebra mussels to each tank. Every day, you supply the two tanks with fresh plankton, which you cul-ture in a separate tank. Several months later, you are puzzled to find no difference at all in the zebra mussel populations of the two tanks.
Downloaded from ebooks.lab-aids.com
E-73
Is There Room for One More? • Activity 85
stoPPiNg to thiNk 4
Is this a good experiment to test the hypothesis that the factory was affecting the zebra mussel population? Explain.
aNalysis 1. Shown below is the population graph from the Analysis section of
Activity 78, “Coughing Up Clues.”
a. What is the carrying capacity for owls in this habitat?
b. How did the carrying capacity change during this 40-year period? Explain.
c. What living and non-living factors might explain this change in carrying capacity?
2. Fill in the “After” column for Statements 9 and 10 only on Sheet 77.2, “Anticipation Guide: Introduced Species—Zebra Mussels.” Did your thinking change?
3. Turn back to Activity 72, “The Miracle Fish?” and look at the graph showing the amount of fish caught in Lake Victoria. Can you deter-mine the carrying capacity of Nile perch in Lake Victoria based on this graph? Explain.
4. Reflection: Consider the introduced species you have been research-ing. Identify one ecosystem into which it has been introduced. Do you think this species has reached its carrying capacity in this ecosystem? Explain.
Time (years)
Num
ber
of o
wls
0 10 20 30 40
40
30
20
10
owL PoPuLAtion oVer time
Downloaded from ebooks.lab-aids.com
E-74
Activity 66 • Patterns in Pedigrees
86 Taking a Look Outside
Until now, you have focused on studying ecology in the laboratory. But ecology is the study of living organisms in the physical environment.
This means that a majority of ecological study is done in the natural habitat of organisms, which is usually outdoors. This type of outdoor investigation is known as field study. The scientist you read about in Activity 85, “Is There Room for One More?” performed a longterm field study of Lake Ness.
What do you observe when you conduct a field study?CHALLENGE
f ield s tudy
The “field” in field study can refer to any kind of ecosystem.
For each pair of students
1 metric ruler (optional)
1 magnifier (optional)
1 thermometer (optional)
Materials
Downloaded from ebooks.lab-aids.com
E-75
Procedure 1. Select an ecosystem on your school grounds or near your school. Think
about locations where you are most likely to observe interactions between living and non-living factors. Be sure to consider all of the possible habitats that are available in the area. For example, an over-hanging roof may be home to a population of birds. Long grasses may contain many small animals, such as insects. Streams or ponds are also excellent places for field study.
2. Spend some time carefully observing your ecosystem. Start by simply sit-ting quietly and watching. Then record all the different types of habitat found within your ecosystem. For example, if you chose a small pond, you might identify the pond edge, the shallow water, and the deep water as three different types of habitat.
3. Record the characteristics of each habitat found within your ecosystem. For example, how much light and oxygen are available? How much rainfall is your habitat likely to receive? What is the temperature within the habitat? Will the temperature change a lot over a 24-hour period? Over the entire year?
4. Look for the presence of living organisms within your ecosystem. You may observe living creatures by gently looking among the different habitats, such as under leaves and rocks, or you may observe signs, such as animal tracks or other disturbances, that show that living crea-tures have been through the habitat.
5. Study your habitat for the next few days:
a. Every day, observe your ecosystem for at least five minutes. Note any changes that occur. You may want to consider making your observations as an answer to a question, such as “Do I observe more species in the shady part of this ecosystem compared to the sunlit areas?”
b. Quantitatively investigate one physical factor, such as tempera-ture. Do this by taking measurements of this factor each time you observe your ecosystem.
6. If possible, create a food web for the organisms within your ecosystem. Identify the role (producer, consumer, or decomposer) that each organ-ism plays within the ecosystem.
Taking a Look Outside • Activity 86
Downloaded from ebooks.lab-aids.com
E-76
aNalysis 1. Summarize the results of your field study. What did you learn about
this ecosystem? How did the physical factor you measured change over time? Was there any relationship between your observations and the physical factor you measured?
2. Compare the advantages of field study to laboratory work in studying ecology. Explain your ideas.
3. You may have seen documentaries or read books on ecosystems around the world. How do you think the information presented in these sources is gathered?
4. Many ecologists spend their entire lives studying a single ecosystem or population of organisms. For example, Dian Fossey spent almost 19 years studying the mountain gorillas of central Africa. Jane Goodall spent many years studying chimpanzees in their natural environment. Today, ecologists study ecosystems and organisms in all different parts of the world. Why do you think people spend their lives studying such systems? What can such studies tell us about the natural environment?
5. Reflection: How did field study differ from your laboratory work on ecology?
Activity 86 • Taking a Look Outside
Downloaded from ebooks.lab-aids.com
E-77
Patterns in Pedigrees • Activity 66
87 Too Many Mussels?
talk ing it o
ve
r
CHALLENGE
Having completed his research project, Ondar has a dilemma. He wants to do something about the problem of introduced species.
He’s particularly concerned about zebra mussels, which have been found in rivers and lakes around his state. What, if anything, should he do?
What are the trade-offs of trying to control an introduced species?
In this photo, you can see zebra mussel shells piled along the beach in a stack more than a foot high.
For each student
1 Student Sheet 87.1, “Zebra Mussels: Problems and Proposals”
2. Complete Student Sheet 87.1, “Zebra Mussels: Problems and Proposals.”
3. Decide what you would do if you were Ondar.
Johnson Poole, Engineer, Mantee Water Treatment Plant
“Zebra mussels cause a lot of problems for us. We supply water to the city of Mantee. It’s our job to provide clean water for homes and businesses. To do that, large pipes bring water into the plant from Bear Lake. Here at the plant, we filter and treat the water before sending it on to the city.
“But we’ve had a hard time lately getting the water into the plant. Those zebra mussels grow on everything, including the insides of the pipes. We have seen up to 750,000 zebra mussels in a square meter of pipe! As you might imagine, all of these zebra mussels begin to block the flow of water.
“Right now, we shut down the plant every few months. Then we send someone into the pipes to physically remove all the mussels. This costs tons of money—the U.S. Fish and Wildlife Service reports that dealing with this problem in the Great Lakes area alone has cost billions of dollars!
“In the meantime, we’re looking at other solutions. For instance, we’re exploring ways to prevent zebra mussels from settling and growing on the pipes in the first place. Zebra mussels grow best on hard surfaces, such as rocks. That’s also why they sometimes grow on other animals with hard shells like clams. We’re trying to find out if we can coat the pipes with some type of paint or something else that would prevent the mussels from growing on them. You could say we’re try-ing to make the pipes a less suitable habitat for the mussels!”
Adrienne Vogel, Chemist, Bear Industrial Company
“Our company uses water from Bear Lake. Chemicals have been shown to kill both larval and adult zebra mussels. That’s one way we prevent zebra mussels from growing in our water supply. We can’t afford for zebra mus-sels to grow inside our water containment ponds. So, after the water comes into our plant, we treat it with a variety of chemicals. While this is very effective in dealing with the zebra mussels, the treated water does contain
A worker uses a hose to suction zebra mussels from inside a pipe at a power plant.
Activity 87 • Too Many Mussels?
Downloaded from ebooks.lab-aids.com
E-79
a lot of chemicals. This means that we can’t release the water back into the lake as is. Luckily for us, we are able to recycle and re-use the water within the company for several months. Before we release the water, we treat it to isolate the chemicals and dispose of them according to state regulations. But this all costs money.”
Talia Mercata, Biologist, State Fish and Wildlife Service
“I sympathize with the people at both plants. Humans are not the only ones that are affected by zebra mussels. Zebra mussels may be changing the native ecology of lakes and rivers. We know that Bear Lake is clearer as a result of zebra mussels. Pollution from a nearby industry had caused the algae to grow out of control, making visibility very poor. Fish were dying because of the lack of oxygen. One thing is certain—zebra mussels have filtered out most of that algae. Some people think that is a good thing. Now that the fish have come back, however, we are worried that the zebra mus-sels will change the food webs in the lake.
“Some scientists are investigating how predators may help control zebra mussel populations. In Europe, where zebra mussels first came from, there are a lot more native predators, such as fish that have teeth. Here in the U.S., the populations of fish that might be good predators aren’t that high.
“Ducks are one possible predator here in the U.S. But using predators to con-trol zebra mussels is complicated. How do you control where ducks and fish decide to search for food? How can you guarantee that they’ll eat zebra mus-sels and not some other food? How will they reduce populations in hard-to-reach areas, such as inside pipes? What happens if the introduction of the predator causes other imbalances in the ecosystem?
“Because of these difficulties, my research focuses on the use of parasites to control zebra mussels. If my research is successful, I may identify a para-site that could infect and kill zebra mussels. I’m not sure how quickly this would affect their populations, though.”
Henry Wai, Activist, People for Responsible Action
“It’s a shame that zebra mussels were ever introduced into the United States. We can only predict how they’ll affect the ecology of our lakes and rivers. We don’t know for sure.
Too Many Mussels? • Activity 87
Downloaded from ebooks.lab-aids.com
E-80
“People caused this problem in the first place and I think every person should take responsibility for trying to prevent further damage. It’s easy to forget that things we do every day might contribute to the problem of introduced species, but it’s true.
“For example, just carrying equipment like inner tubes and diving gear from one lake to another can introduce a species like the zebra mussel. After all, its larval stage is very small. That’s why it’s important for people to rinse and dry their equipment before going from one body of water to another. Think about it—if every boater, fisher, swimmer, and diver took care to clean off his or her equipment, we might prevent zebra mussels and other organisms from spreading across the U.S. so quickly!”
aNalysis1. What, if anything, do you think should be done about the growing pop-
ulation of zebra mussels in the United States? Support your answer with evidence and discuss the trade-offs of your decision.
Hint: To write a complete answer, first state your opinion. Provide two or more pieces of evidence that support your opinion. Then discuss the trade-offs of your decision.
exteNsioNGo to the Issues and Life Science page of the SEPUP website for links to sites with information about zebra mussels and management options.
Activity 87 • Too Many Mussels?
Downloaded from ebooks.lab-aids.com
E-81
Introduced species can have an enormous impact on the economy as well as on native ecosystems. Your research project and your study of ecology
have helped you to become an expert on one introduced species. Why are some introduced species more likely to be successful than others?
What, if anything, should be done about the introduction of a new species into an ecosystem?
88 Presenting the Facts
project
CHALLENGE
These workers are removing hydrilla and other aquatic plants from a lake.
Downloaded from ebooks.lab-aids.com
E-82
Procedure 1. In Activity 73, “Introduced Species,” you began a research project on
an introduced species. You will now present your research to the class. Use Student Sheet 73.1, “Introduced Species Research,” as you plan your presentation. Your presentation should help your audience make an informed decision about what, if anything, to do about this intro-duced species.
When planning your presentation, remember:
• All the members of your group must participate.
• Since any group member may be asked to answer questions from the class, all group members should fully understand the report.
• Your presentation time is limited.
• Many people learn best from a mix of visual, written, and spoken information. Include graphs and maps when possible.
• While you have your own opinions on this issue, it is important that you present unbiased and complete information. The members of your audience can then make their own decisions.
• You may want to roleplay different experts when presenting your information, such as the people who might present information at a city council meeting. The class would represent the community members who would be voting on a decision.
2. List all of the options that are available for dealing with your intro-duced species on Transparency 88.2, “Management Options.”
3. Begin by presenting general information about your introduced species to the class. Respond to any questions that other students may have.
For the class
1 overhead projector
For each group of four students
1 Transparency 88.2, “Management Options”
1 transparency pen
For each student
1 paper copy of Transparency 88.2, “Management Options” (optional)
Materials
Activity 88 • Presenting the Facts
Downloaded from ebooks.lab-aids.com
E-83
4. Ask the class what they think are the pros and cons of each of the options you presented. Record their responses on Transparency 88.2.
5. If you are aware of issues that were not brought up by the class, add them onto the transparency.
6. Have the class vote on what, if anything, should be done about the introduction of this species into new ecosystems.
7. Listen to and participate in other groups’ presentations.
aNalysis 1. Many species are accidentally introduced into North American ecosys-
tems from other countries each year. The opposite is also true: North American species are also introduced into other countries.
a. What other countries or other areas of the United States are most likely to exchange species with the area where you live?
b. Only a small fraction of species that are introduced are successful enough to create problems in their new environment. What features of a species do you think make it likely to be successful in a new environment? Use specific examples from the project presentations in your answer.
2. How do you think the number of introduced species in the United States will change over the next 50 years? Explain your reasoning.
3. Write a letter to the editor of a local newspaper describing the situation of an introduced species. Explain what, if anything, you think should be done about the species. Support your answer with evidence and discuss the trade-offs of your decision.
Hint: To write a complete answer, first state your opinion. Provide two or more pieces of evidence that support your opinion. Then discuss the trade-offs of your decision.