91
Econ 1000 Lecture 2 Mod2 C.L. Mattoli 1 (C) Red Hill Capital Corp. 2008
| Date post: | 25-Dec-2015 |
| Category: |
Documents |
| Upload: | domenic-wilson |
| View: | 215 times |
| Download: | 1 times |

Econ 1000 Lecture 2Mod2
C.L. Mattoli
1(C) Red Hill Capital Corp. 2008

This week
Mod 2, part1 Chapter 3
2(C) Red Hill Capital Corp. 2008

Learning objectives: Mod 2On successful completion of this module (3 lectures),
you should be able to: Explain the concepts of demand , supply , and
market equilibrium Use the market model to predict the direction of
change in prices and quantities caused by changes in the market-place, and by policy changes
Explain the concept of market failure and discuss causes of such failure
Explain the concept of elasticity Calculate and interpret price, income and
cross-price elasticity of demand Calculate and interpret price elasticity of supply .
3(C) Red Hill Capital Corp. 2008

This week
Supply Demand Market interaction of supply and
demand. Market equilibrium
4(C) Red Hill Capital Corp. 2008

Demand
5(C) Red Hill Capital Corp. 2008
Demand We refer to concepts in economics as tools:
demand is one of those tools. Demand for goods and services in a
capitalist economy displays a high degree of consumer sovereignty.
Consumer sovereignty means that consumers have freedom to choose without coercion from business or government.
The law of demand states that the quantity demanded has an inverse relation to price.
6(C) Red Hill Capital Corp. 2008

Behavior and demand The law of demand can be derived from
behavioral first principles. The economic word for satisfaction is utility. The behavioral starting point is the law of
decreasing marginal utility. The first piece of cake tastes so good, the second piece is pretty good, but you start to appreciate cake less by the third or fourth piece.
From decreasing marginal utility flows the law of demand: people will purchase more, only if the price is less, ceteris paribus.
7(C) Red Hill Capital Corp. 2008

Demand schedules (curves)
In order to find the total demand for a good or service, we begin at the bottom with individuals.
The whole is the sum of the parts, so we begin with individual demand schedules and sum them up to get total aggregate demand.
A demand schedule is a summary of buying intentions.
8(C) Red Hill Capital Corp. 2008

Demand schedules (curves) We can construct demand schedules only after
we introduce a price variable. Then, the demand schedule will show how many units of something that a buyer would be willing to purchase at a given price.
Contrary to mathematical convention, wherein the dependent variable is always on the vertical axis, in economics, the dependent variable is sometimes displayed on the horizontal axis, as in this case demand.
On the next slide we show Pete’s demand for burgers.
9(C) Red Hill Capital Corp. 2008

Peter’s Demand Schedule
•Pete’s demand is inversely related to price.•He will buy only 1 burger per week, if the price is $5.50 per burger.•He will buy 9, if the price drops to $1.50 •Note: ceteris paribus applies to the schedule. Other things can also affect demand, in addition to price.
10(C) Red Hill Capital Corp. 2008

Aggregate (Market) Demand An individual demand schedule is composed of prices
that a person thinks he or she would buy at given prices: they are buying intentions.
Then, to find total aggregated demand for the whole market, which is simply the aggregate of whatever aggregate we are looking at, we simply add up all of the intentions of the participants.
For example, a company might hire a market research firm to survey a large number of people in a particular area of the city or the country by having them fill out questionnaires that ask how many units of a product they would purchase at various prices.
11(C) Red Hill Capital Corp. 2008

Tabular Aggregate Demand: Add Columns
PricePetie’s
DemandDaisy’s
DemandDonald’sDemand
Total Demand
$6.00 0 1 0 1
5.50 1 2 0 3
5,00 2 3 0 5
4.50 3 4 1 8
4.00 4 5 2 11
3.50 5 6 3 14
3.00 6 7 4 17
2.50 7 8 5 20
2.00 8 10 6 24
1.50 9 12 7 28
Once we have demand schedules for all of the members of a society, we can find aggregate demand by adding up the individual demands.
12(C) Red Hill Capital Corp. 2008

Market aggregate demand: an example of graph addition We can also add the graphs, either by adding the graphical
information, itself, or by making a table, adding the table information, and, then, graphing that.
0.00
1.00
2.00
3.00
4.00
5.00
6.00
7.00
1 2 3 4 5 6 7 8 10 12
+ +
=
0.001.002.003.004.005.006.007.00
0 1 2 3 4 5 6 7 8 9
0.00
2.00
4.00
6.00
8.00
0 1 2 3 4 5 6 7 8 9
0.00
1.00
2.00
3.00
4.00
5.00
6.00
7.00
1 3 5 8 11 14 17 20 24 28
13(C) Red Hill Capital Corp. 2008

Other determinants of demand Although price is one variable in determining
demand, it is not the only variable. That is why we used the ceteris paribus phrase in describing Pete’s demand in the previous slide.
All other determinants of demand are referred to as non-price determinants.
Some major non-price determinants of demand (NPDD) include: 1) the number of market participants, 2) tastes and preferences, 3) incomes, 4)expectations about any number of things, and 5) prices of somehow-related goods.
14(C) Red Hill Capital Corp. 2008

A Lesson in Economic Language What we have been discussing, so
far, in the language of economics, is: changes in quantity demanded, which result solely from changes in price.
Thus, change in quantity demanded means moving along a stationary fixed demand curve, like those shown in previous slides, ceteris paribus.
15(C) Red Hill Capital Corp. 2008

Demand & Opportunity Costs
Demand involves opportunity costs. People can buy and use only so many
things. Thus, in choosing to buy some, they give
up buying others. What they give up is the opportunity cost
of what they buy.
(C) Red Hill Capital Corp. 2008 16

A Lesson in Economic Language A change in demand refers to a
change of the whole demand curve to a new demand curve. Such changes in demand come from changes in the non-price determinants of demand.
We illustrate these concepts in the next slide.
17(C) Red Hill Capital Corp. 2008
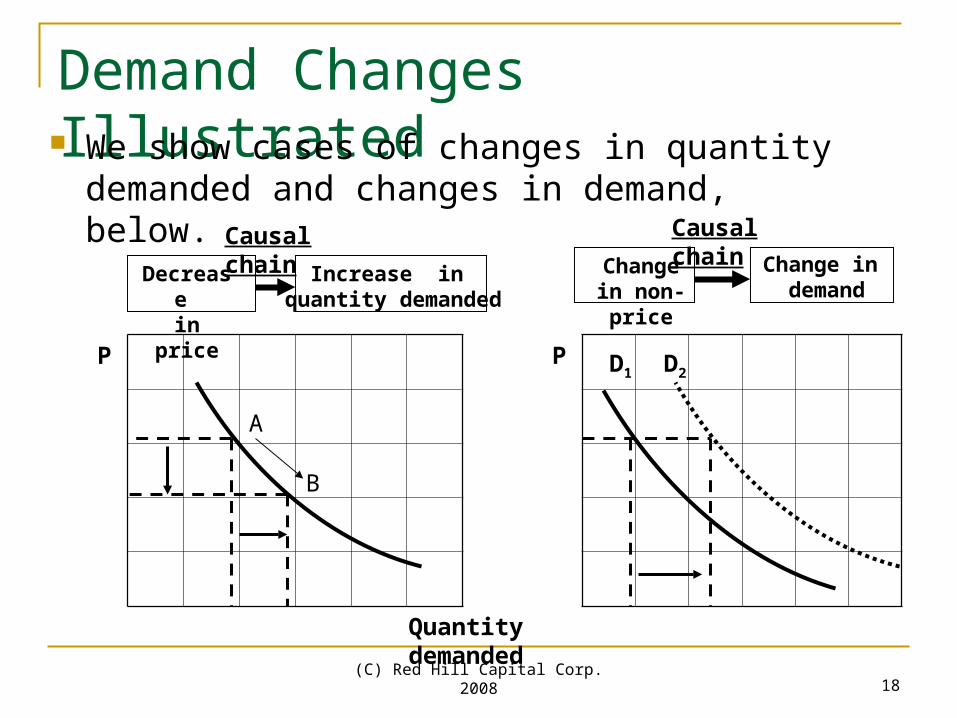
Demand Changes Illustrated We show cases of changes in quantity demanded and
changes in demand, below.Causal chain Causal chain
Decrease in price
Increase in quantity demanded
Change in non-price
Change in demand
A
B
D1 D2P P
Quantity demanded
18(C) Red Hill Capital Corp. 2008

Non-Price Determinants of Demand
19(C) Red Hill Capital Corp. 2008

Intro To get downward-sloping demand we
assumed everything else was held constant (ceteris paribus).
For example, if the price of Pepsi falls, but the price of coca cola falls faster, will demand for Pepsi really increase?
So, we take a look at what happens to the whole demand curve if other things, beyond the price of the good, change.
(C) Red Hill Capital Corp. 2008 20
Number of buyers
Looking back at our demand addition in previous slides, we understand that adding buyers to a market, e.g., an increase in population, will shift the demand curve to the right.
A decrease in buyers, e.g., a decrease in population, in the market will shift the demand curve to the left.
21(C) Red Hill Capital Corp. 2008

Number of buyers
The market for a good or service might include both domestic and foreign buyers.
Then, for example, if China had restrictions on CD’s imported from the US and suddenly removed the restrictions, the market (number of buyers) for US CD’s would increase and the demand curve would shift to the right.
22(C) Red Hill Capital Corp. 2008
Tastes and preferences Even though there is consumer
sovereignty, we understand that what people will demand (consumer preference) is affected by fads, fashions, new products, and advertising.
Scooters were very “in” with children in the 1950’s. Then, cool bicycles took over in the 1960’s thru the 1990’s.
23(C) Red Hill Capital Corp. 2008
Tastes and preferences Scooters became cool again in the early
2000’s when they became chrome-plated with break-down joints.
Pointy-toed women’s shoes were very “in” in the beginning of this century, but they have since become “out”.
Even though people have free choice, they are affected by advertising and other people’s opinions.
24(C) Red Hill Capital Corp. 2008
Income To look at the affect of income on demand,
economics, first, divides goods into 2 categories: 1) normal goods and 2) inferior goods.
Normal ‘goods’ are any good or service for which there is a direct relationship between changes in income and in demand. Thus, an increase in income causes demand to rise at all prices: demand curve shifts to the right. Examples are vacations, new cars, dinner at expensive restaurants.
25(C) Red Hill Capital Corp. 2008
Income Inferior goods are goods and services
for which there is an inverse relationship between changes in income and in demand. Examples are used cars, cheap jewelry, and rides on the bus. If you have a higher income, you will prefer a new car instead of a used one, gold jewelry instead of tin, and taxicabs instead of the bus.
Some textbooks use categories: luxuries and necessities.
26(C) Red Hill Capital Corp. 2008
Expectations of buyers What would happen to present demand, if
buyers expected future changes in: price, income, taxes, or other factors?
Suppose bad weather ruins the summer rice crop, will consumers expect to pay higher prices and bid up prices? They might increase quantity demanded at the same time because they expect a future shortage.
Suppose consumers expect prices to decrease? Expectations can increase or decrease demand.
27(C) Red Hill Capital Corp. 2008

Prices of related goods (or services) Demand for a particular good can be
affected by the prices of other goods in one of several possible ways, which are related to it in some way.
The first type of related good is called a substitute.
Substitute goods compete directly with a good for consumer purchases.
28(C) Red Hill Capital Corp. 2008

Prices of related goods (or services) For example, a rise in the price of Pepsi
might cause a rise in demand for Coca cola.
Complementary goods are jointly consumed.
For example, if the price of DVD players falls, there will be more DVD players purchased and the demand for DVD’s will increase.
29(C) Red Hill Capital Corp. 2008

Exercises
1. What will be the affect for demand of used cars, if, ceteris paribus, the price of new cars increases by $5,000.
2. If the price of popcorn at movie theaters decreases, what might you expect to happen to the demand for soft drinks?
3. Is Sprite a substitute or a complementary product for Coke?
30(C) Red Hill Capital Corp. 2008

Supply
31(C) Red Hill Capital Corp. 2008

Supply In economics supply is the relationship
between possible prices of goods and services and the quantity supplied in the law of supply.
The law of supply says that there is a direct relationship between the quantity of a good or service that a supplier is willing to supply, in a fixed time frame, and the price, ceteris paribus.
The relationship is underpinned by increasing opportunity costs.
32(C) Red Hill Capital Corp. 2008

Supply of one supplier
Supply is directly related to price.
The Supplier is willing to supply 220 burgers at $2/burger and 340 at $5/burger.
Note: ceteris paribus applies to the schedule. Other things can also affect supply, in addition to price.
0.00
1.00
2.00
3.00
4.00
5.00
6.00
360340320300280260240220200
33(C) Red Hill Capital Corp. 2008

Opportunity costs, Consumer Sovereignty, and the law of supply We looked at opportunity costs when we
studied the production possibilities frontier (PPF).
Therein, we learned that one good or service could be produced in higher quantities only by sacrificing the opportunity to produce the other, in the example of only two choices.
34(C) Red Hill Capital Corp. 2008

Opportunity costs, Consumer Sovereignty, and the law of supply Consider, then, a company that has a plant that
produces cloth goods, and that it has determined that its maximal mix of producing parachutes or towels is 70% towels and 30% parachutes.
To change their mix, one way or the other, they will incur opportunity costs equal to the amount of the one they sacrifice to produce more of the other.
Moreover, we have seen that opportunity costs are normally increasing.
35(C) Red Hill Capital Corp. 2008
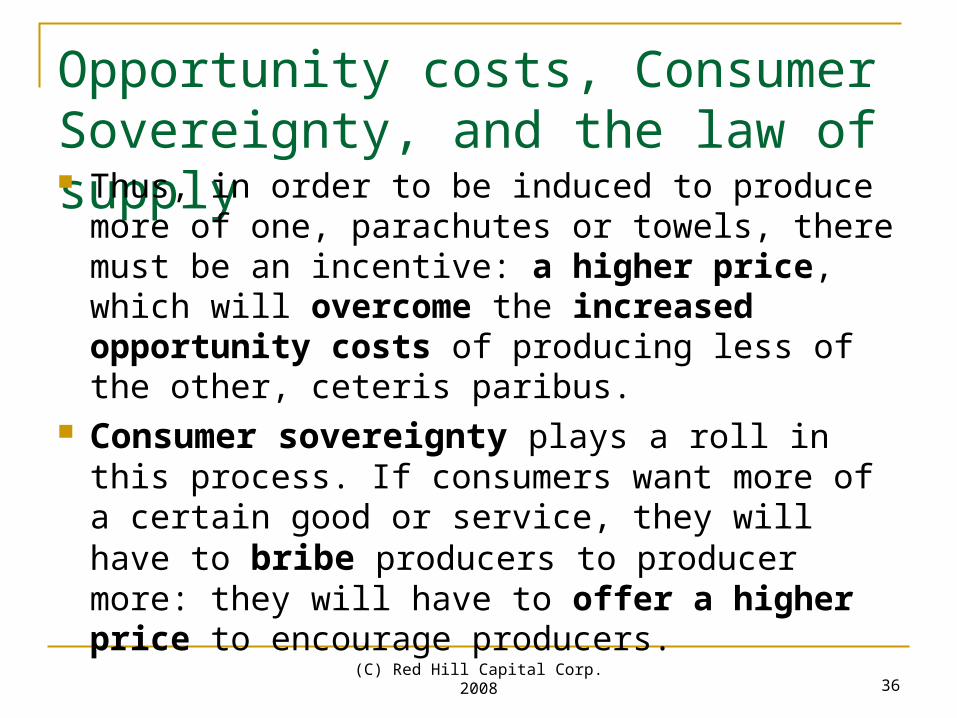
Opportunity costs, Consumer Sovereignty, and the law of supply Thus, in order to be induced to produce more of one,
parachutes or towels, there must be an incentive: a higher price, which will overcome the increased opportunity costs of producing less of the other, ceteris paribus.
Consumer sovereignty plays a roll in this process. If consumers want more of a certain good or service, they will have to bribe producers to producer more: they will have to offer a higher price to encourage producers.
36(C) Red Hill Capital Corp. 2008

Exercise: Law of supply & university degrees There was an increase in university applications
to study internet technology with the boom in IT in the 1990’s, and a decrease after the IT fad went bust.
Similar enrolment trends have been seen, for example, in earth sciences. Enrolments increase when there is a boom in the minerals industries and decline dramatically when the boom is over.
Can you use the law of supply to explain university enrolments as described above?
37(C) Red Hill Capital Corp. 2008
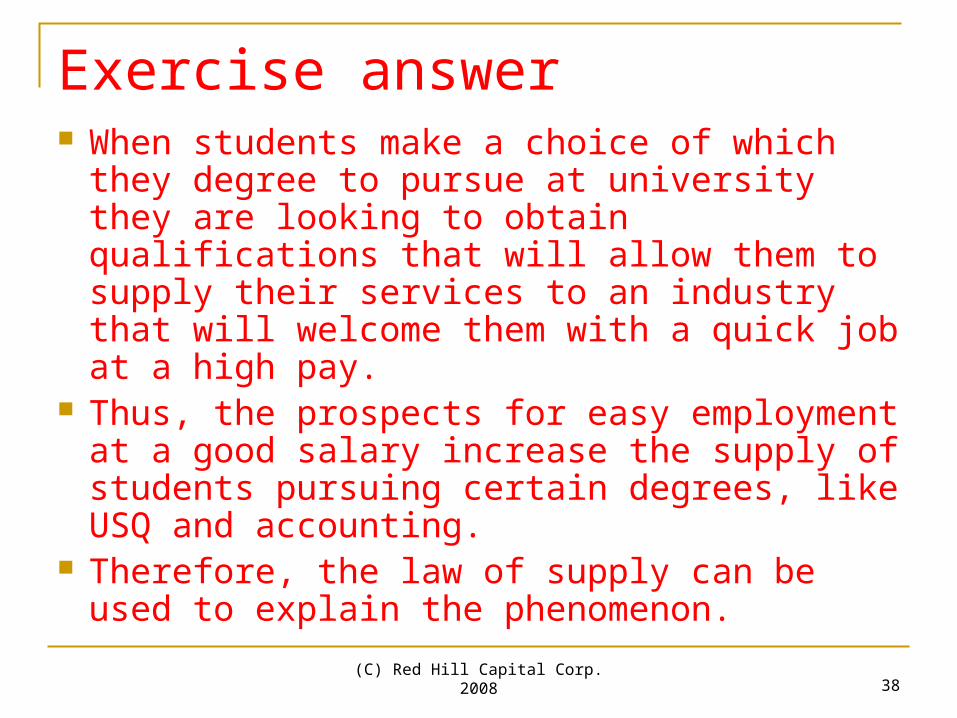
Exercise answer When students make a choice of which they
degree to pursue at university they are looking to obtain qualifications that will allow them to supply their services to an industry that will welcome them with a quick job at a high pay.
Thus, the prospects for easy employment at a good salary increase the supply of students pursuing certain degrees, like USQ and accounting.
Therefore, the law of supply can be used to explain the phenomenon.
38(C) Red Hill Capital Corp. 2008

Market supply We can find market supply in a similar manner as we
found market demand: by summing up the quantities that would be supplied (are willing to sell) by the various suppliers in the market, which is the totality of suppliers and demanders, at various prices.
We can define the market in any way we like. We simply must be careful to include all the suppliers that belong in what we are defining as “the market”, no more, no less.
“The market” might be a section of a city, a city, a state, a region, a country, or the whole world.
We show the supply curve for the city market of burgers, of which the single supplier in the preceding slide is a part, in the next slide.
39(C) Red Hill Capital Corp. 2008

Supply of hamburgers in one city
Quantities supplied each by each supplier are summed for each price.
Suppliers are willing to supply 700 burgers at $2 and 1400 at $5/burger.
Note: ceteris paribus applies to the schedule. Other things can also affect supply, in addition to price.
40(C) Red Hill Capital Corp. 2008

Graphical summed supply of hamburgers Like in the case of demand, we can sum the various quantities supplied
by suppliers in the market in table form and graph it or directly sum the graphs
0.001.002.003.004.005.006.00
360
320
280
240
200
0.001.002.003.004.005.006.00
10080604010
0.001.002.003.004.005.006.00
=
+ +0.001.002.003.004.005.006.00
104090
076
062
049
0
41(C) Red Hill Capital Corp. 2008

Again, a language lesson A change in quantity supplied is a move along a
given supply curve, like those shown in previous slides. At a higher price, suppliers will offer larger quantities for sale.
Cause and effect: effect of price rise is increase in quantity supplied.
In contradistinction, a change in supply is a shift of the whole supply curve. A decrease in supply is a shift to the left. An increase in supply is a shift to the right.
These happen when ceteris paribus is lifted and non-price factors come into play.
42(C) Red Hill Capital Corp. 2008

Pictorial Supply Changes We show cases of changes in quantity supplied and
changes in supply, below.
Causal chain
Increase in price
Increase in quantity supplied
Change in non-price
Increase in supply
A
B
S1 S2
P P
Causal chain
Quantity Supplied
43(C) Red Hill Capital Corp. 2008

Non-price factors of supply In addition to price, as was also the case
with demand, non-price factors can affect supply. Major factors include:
We cover each, in turn44
1. Number of suppliers (sellers)
4. Taxes and subsidies
2. Technological changes
5. Expectations of producers
3. Prices of inputs 6. Prices of other goods that could be produced
(C) Red Hill Capital Corp. 2008

1. Number of suppliers (sellers)
We have defined the market for supply as the sum of suppliers in the market, and we have demonstrated in our beginning study of supply that the quantity supplied will increase at every price as more sellers are added to the market.
Similarly, if suppliers exit the market for one reason or another, the supply curve will shift to the left.
45(C) Red Hill Capital Corp. 2008

1. Number of suppliers (sellers)
Addition and disappearance of suppliers can happen for obvious or subtle reasons.
A factory can shift its own production from one good to another.
Barriers to trade can be erected or taken down by a country.
Disease can destroy a farmer’s crop.
46(C) Red Hill Capital Corp. 2008

Technological changes Technological development has always made
it possible to produce more goods more efficiently and cheaply.
Horses and oxen tied to a plough made it easier for farmers to plant crops.
PC’s allow workers to design things and make calculations more quickly and accurately.
Robots make automobiles more quickly and with more precision than people.
Technological developments are continually allowing supply curves to be shifted out.
47(C) Red Hill Capital Corp. 2008

Prices of inputs Natural resources, raw materials, semi-finished
goods, labor, capital, and entrepreneurship are all required as input to produce the output of supply.
Increases and decreases of any price of inputs will affect the prices that suppliers need to charge for output, and supply curves will be shifted.
Suppose that automobile workers sign a contract to increase their hourly wages. Then, the price that automobile companies must charge for cars will increase and the supply curve will be shifted upward (in the convention of the book: left).
48(C) Red Hill Capital Corp. 2008

Taxes and subsidies Taxes are another type of expense that companies
have in their businesses. If a company is taxed more heavily, it will want to
pass that extra cost on to the consumer. Consequently, the supply curve will shift upward, and the same quantities supplied will all be at higher prices.
Subsidies to industries can have the opposite affect. If a government pays subsidies to farmers who produce corn, the supply of corn will increase.
49(C) Red Hill Capital Corp. 2008

Expectations of producers Producer expectations can also affect the
supply curve. Producers are doing business to make money,
and they will act in their own self-interest. For example, if a particularly cold winter is
expected, there will be a high expected demand for woolen sweater, scarves, and coats. The response from suppliers of wool may, therefore, be to restrict, not to increase, supply, in order to get higher prices.
50(C) Red Hill Capital Corp. 2008

Expectations of producers On the other hand, if producers know that new
technology is coming out that will make production cheaper, and also prices, they may increase supply and dump it ahead of the longer term price reduction from technological change.
In general, anticipation of high demand will cause them to restrict, and anticipation of low demand will cause them to increase supply.
51(C) Red Hill Capital Corp. 2008

Prices of other goods that could be produced by producers Since producers often have a choice
between diverting productive resources to producing a number of different outputs, the relative price of one good may cause them to redirect their production from one to the other.
Shifting production to the good with the relatively higher price will give them, higher profits.
52(C) Red Hill Capital Corp. 2008

Prices of other goods that could be produced by producers
For example, if the price of tomatoes rises relative to the price of lettuce, farmers will divert more acreage to growing more tomatoes and less lettuce .
The underlying economics reason is that the opportunity cost of producing lettuce, in terms of foregone production and profits from tomatoes, has increased
53(C) Red Hill Capital Corp. 2008

Another language lesson You can think of an increase in demand as
higher quantity demanded at every price, a shift of the curve to the right.
Alternatively, you can think of the increase as a higher price for every quantity, a shift upward.
For supply, a shift to the right is increase in supply: more quantity at every price.
Or, a shift down, lower price for every quantity. And vice versa.
(C) Red Hill Capital Corp. 2008 54
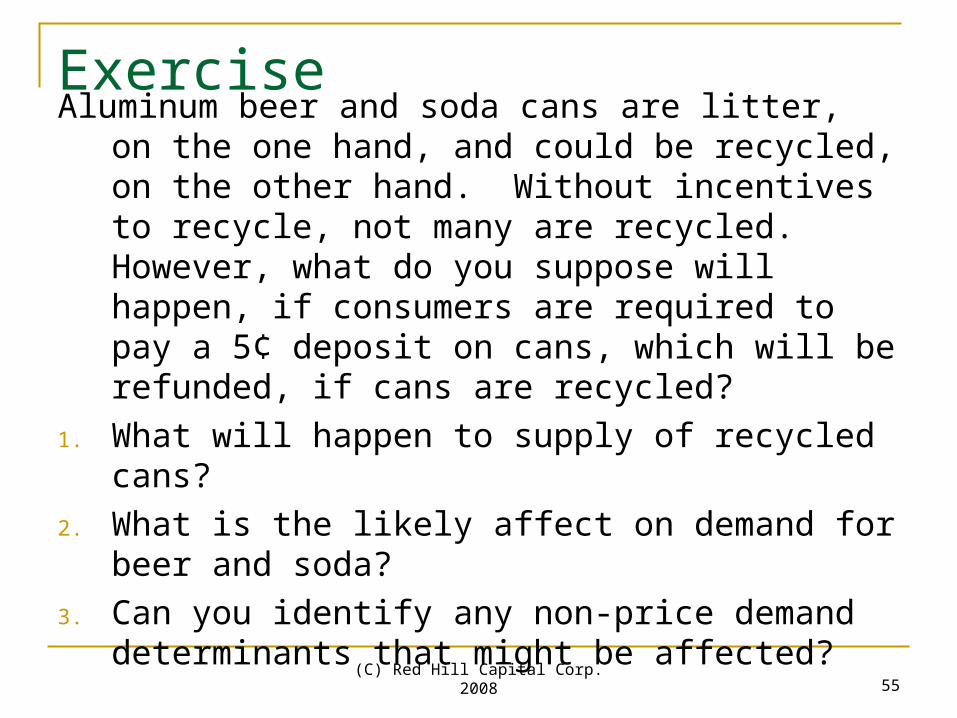
ExerciseAluminum beer and soda cans are litter, on the one
hand, and could be recycled, on the other hand. Without incentives to recycle, not many are recycled. However, what do you suppose will happen, if consumers are required to pay a 5¢ deposit on cans, which will be refunded, if cans are recycled?
1. What will happen to supply of recycled cans?
2. What is the likely affect on demand for beer and soda?
3. Can you identify any non-price demand determinants that might be affected?
55(C) Red Hill Capital Corp. 2008
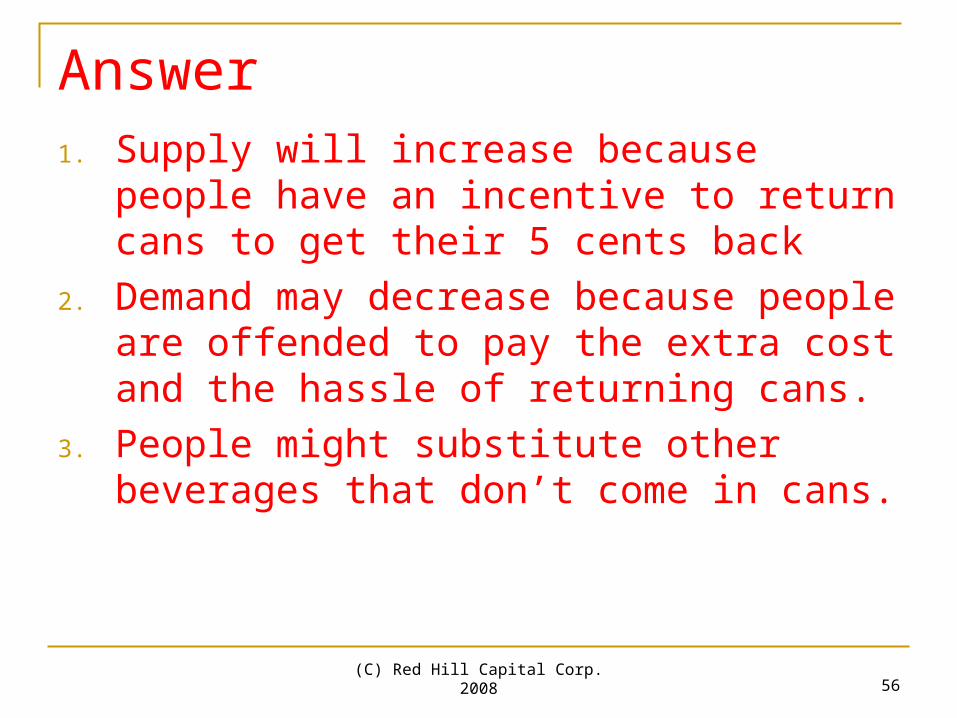
Answer1. Supply will increase because people have an
incentive to return cans to get their 5 cents back
2. Demand may decrease because people are offended to pay the extra cost and the hassle of returning cans.
3. People might substitute other beverages that don’t come in cans.
56(C) Red Hill Capital Corp. 2008

Exercise What will be the affect for supply of the
following:
1. A cheaper means is found for producing computer chips.
2. Farmers are paid not to plant wheat.
3. Frost destroys much of the orange crop.
57(C) Red Hill Capital Corp. 2008
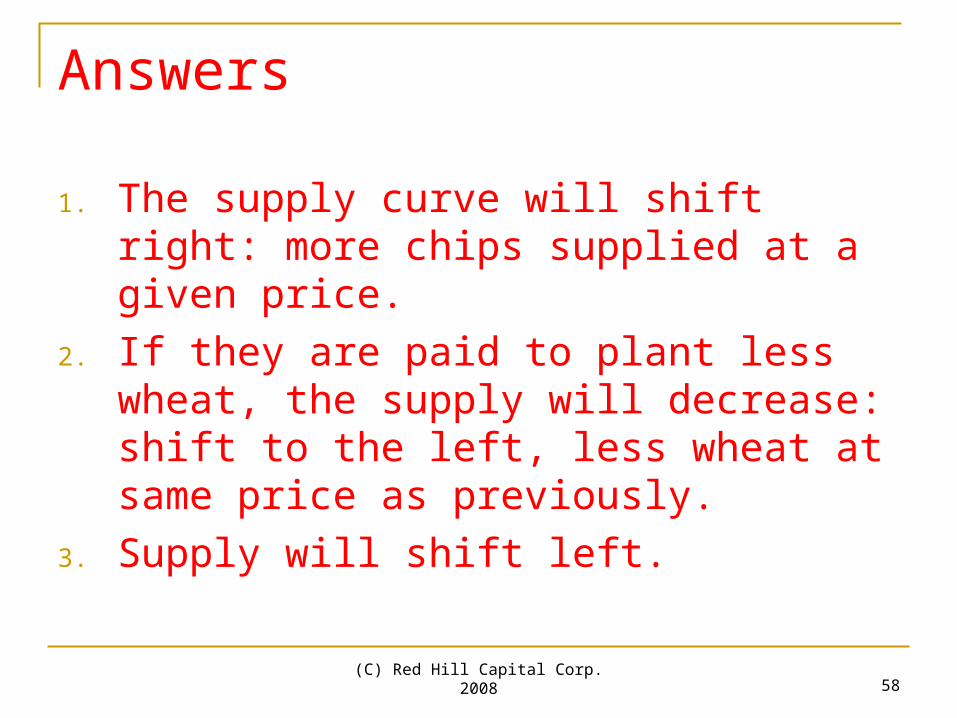
Answers
1. The supply curve will shift right: more chips supplied at a given price.
2. If they are paid to plant less wheat, the supply will decrease: shift to the left, less wheat at same price as previously.
3. Supply will shift left.
58(C) Red Hill Capital Corp. 2008
Market Analysis:Supply meets Demand
59(C) Red Hill Capital Corp. 2008
Markets Markets are one of the centerpieces of capitalist
economies. A market is any arrangement whereby interaction of
buyers and sellers determine prices and quantities of goods or services exchanged (traded).
A major aspect of this market interaction is competition. Because, in the end, there are limited quantities, on the one hand, and limited buyers, on the other hand, both groups will compete among themselves.
The big question for supply and demand is what selling price and quantity will prevail in the marketplace
60(C) Red Hill Capital Corp. 2008

Surplus or shortage Consider the city hamburger market for which we have
looked at supply and demand. We summarize the market in the table, below.
Assume that burger bars decide to supply 1400 at a price of $5. Then, according to the demand schedule, only 900 can be sold, and that would result in a surplus of 500 burgers per week, which would be thrown in the trash.
A surplus exists when the amount supplied is greater than the quantity demanded.
61(C) Red Hill Capital Corp. 2008

Dealing with surplus Especially, in a competitive market, there will be
downward pressure on prices. Suppliers will be left with excess supply that they will
want to get rid of. In the case of burgers, they will have to thrown away.
For other non-perishable goods, they must be stored somewhere as excess inventory, and the cost of storage space becomes an additional cost
The best way to do that is to sell the excess at a lower price. It is better to get paid something than nothing at all.
Thus, the price will begin to drop.
62(C) Red Hill Capital Corp. 2008

What if there is too little supply What if, instead, the market starts out with a price of $2
per burger? Then, demand will be 1500 burgers per week versus a
supply of only 800. Consumers will be left with their wants unsatisfied, and
suppliers will face lost opportunity of selling those extra burgers.
The market will have a shortage, the condition where demand exceeds supply.
63(C) Red Hill Capital Corp. 2008

Dealing with shortage When there is a shortage, at least some
people will try to get their wants satisfied by offering to pay a higher price for the good or service.
After all consumer sovereignty says the consumer is king, and he will use that to try to beat out other consumers: money, sometimes, talks.
64(C) Red Hill Capital Corp. 2008
Dealing with shortage
As he beats out his consumer competition, others will follow because they do not want to be left even shorter of the good.
As suppliers see that price is increasing, they will be willing to sacrifice opportunities elsewhere and apply more of their productive resources to burger production, and the supply will also increase.
65(C) Red Hill Capital Corp. 2008

The market processes
Suppliers probably do not know what the actual demand curve is, and demanders probably do not know what the supply curve is.
If there is a shortage, demanders will want to pay more to satisfy their needs, and suppliers will raise the price and supply more.
They might not get it right, the first time, and a shortage will still exists.
66(C) Red Hill Capital Corp. 2008

The market processes They will just have to keep adjusting until a
point is reached at which the market is exactly cleared: demand = supply.
Similarly, if a surplus exists, especially, if it is in an industry where the excess is kept in limited inventory storage space, sellers will drop their prices to try to get rid of excess inventories.
Producers will begin to produce less and lower prices, but it might also take a few rounds of adjustment before a proper point is reached at which supply=demand.
67(C) Red Hill Capital Corp. 2008

The market processes Indeed, suppliers might undershoot the proper point when
a surplus initially existed, and a slight shortage might ensue.
Suppliers might overshoot after an initial shortage and create a slight surplus.
In the end, because of this balancing act of interaction between supply and demand, because of consumer sovereignty, the decreasing marginal utility, and increasing opportunity costs, a final point of equilibrium will be reached in free markets, at which the market is exactly cleared of goods at the price at which they are offered where supply ≡ demand.
We show this in the next slide.
68(C) Red Hill Capital Corp. 2008
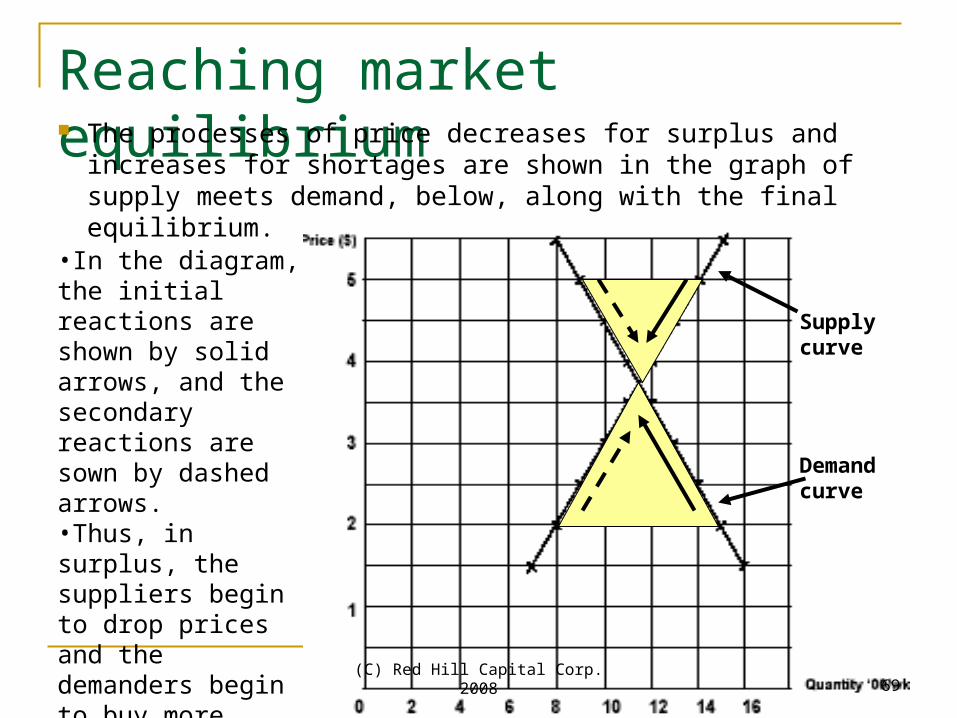
Reaching market equilibrium The processes of price decreases for surplus and increases for
shortages are shown in the graph of supply meets demand, below, along with the final equilibrium.
Demand curve
Supply curve
•In the diagram, the initial reactions are shown by solid arrows, and the secondary reactions are sown by dashed arrows.•Thus, in surplus, the suppliers begin to drop prices and the demanders begin to buy more.•In shortage, the consumers bids up the price, and suppliers begin to supply more. 69(C) Red Hill Capital Corp. 2008

Causal chains: shortage or surplus (famine or feast) We can show the processes that act in shortage
and surplus using causal chain diagrams, below:Causal Chains
Quantity supplied exceeds quantity demanded
Prices will be bid up until equilibrium is reached
Shortage Quantity supplied is less than quantity demanded
Prices will be offered down until equilibrium is reached
Surplus
70(C) Red Hill Capital Corp. 2008

Equilibrium price and quantity At any price except the proper one, there will be
no balance between supply and demand, and shortage or surplus will result until producers are in agreement with consumers in the market.
At the proper equilibrium, there will be agreement, and consumers will exactly clear the market of all goods at that price.
In that regard, any other point will be temporary, and only at the unique equilibrium point of price and quantity will there there be market stability.
71(C) Red Hill Capital Corp. 2008

Efficiency When the forces of supply and demand are exactly in
balance, we say that the outcome is efficient. Indeed, you might recall that when producers are
operating on their PPF’s they are also at efficient points. Now, when demand is balanced by supply, producers
have settled on only one of their PPF efficient points to produce what consumers want and get market clearing.
When supply balances with demand, we say that the markets are acting efficiently.
In economics, an efficient outcome is, in general, one in which society maximizes the benefits that it gets from the use of its scarce resources.
72(C) Red Hill Capital Corp. 2008

Cost versus benefit We can look at situations of surplus and
shortage another way. At a point in a market where there is a
shortage, the benefit to society, as measured by the demand curve, is greater than the cost, as measured by the supply curve, and consumers are willing to pay a price that is more than the seller’s cost.
73(C) Red Hill Capital Corp. 2008

Cost versus benefit If output expands to reach equilibrium, the
additional benefit to society will exceed the cost, and there will be a net gain to society.
Conversely, if there is shortage, the benefit to society is less than the cost. Consumers are not willing to pay suppliers’ costs. In reducing supply towards equilibrium, the net cost saving will be greater than the benefit foregone, and society will gain, again.
In the end, we can say that the equilibrium point is where marginal cost = marginal benefit.
74(C) Red Hill Capital Corp. 2008

The Price System We have seen how the forces of supply and
demand in a free market can result in an efficient outcome equilibrium at which price results in clearing the quantity offered in the market.
All other things equal, the price may be away from equilibrium, but the forces due to surplus and shortage will eventually push the price to its proper efficient equilibrium level.
75(C) Red Hill Capital Corp. 2008

The Price System
This is, in theory, how the so-called price system operates.
The price system is the mechanism that brings about equilibrium.
We say that price plays a rationing role
76(C) Red Hill Capital Corp. 2008

A Note on Curves
77(C) Red Hill Capital Corp. 2008
Curves We have studied a number of phenomena, so far,
like: production possibilities, supply and demand. In all of these cases, the graphically
representations were curves, except when we were looking to simplify models or explanations.
Indeed, we will discover that most things in economics are not represented by simple straight lines, and we need to understand some of the simple mathematics of curves and how to extract information from curved lines.
78(C) Red Hill Capital Corp. 2008
Curve Analysis: slope One of the most important basic tools for
analyzing curves or straight lines is the concept of slope, which simply represents the change of one variable with respect to change of the other: ΔY/ΔX.
It is the chancre of Y per unit change in X since we are dividing a finite change in Y by the corresponding change in X.
For example, if Y changes by 10, ΔY = 10, when X changes by 5, ΔX = 5, then, the change in Y per unit change in X is ΔY/ΔX = 10/5 = 2. So, Y changes by 2 for every change by one unit of X.
79(C) Red Hill Capital Corp. 2008

Curve analysis: reasons The simple slope calculation looks at pure
change, which is important to look at in any analysis.
In fact we will also soon look at percentage change per unit of percentage change when we look at things like elasticity in upcoming lectures, so you must get comfortable with these concepts, in order to keep up with the course.
Looking at changes, percentages, and percentage changes is a big part of a course in economics.
80(C) Red Hill Capital Corp. 2008
Curve Analysis: meaning When we looked at the PPF, we found that changing the
mix of outputs between two choices, e.g., producing towels or parachutes, involved sacrificing the opportunity to produce a certain amount of one to produce more of the other. So, our opportunity cost of producing less towels to produce more parachutes was – ΔP/ΔT, the minus sign is due to the decrease in towel production, a negative change, for increased parachute production, a positive change.
Similarly, we look at the change in quantity supplied per unit change in price as ΔS/ΔP in an analysis of supply.
81(C) Red Hill Capital Corp. 2008

The slopes of curves
The slopes of curves changes at each point, as we discussed in mod 1.
Indeed, that is the reason that most of the graphs that we look at in economics are curves instead of straight lines.
Fore example, the curved PPF has changing slope as we move from one point to the other.
The interpretation of that is that opportunity costs change as we sacrifice production of one good to produce more of another.
82(C) Red Hill Capital Corp. 2008

The slopes of curves It is the mathematical result of the law of
increasing opportunity costs. For a supply curve, for example, ΔS/ΔP gets
smaller and smaller as price increases because of increasing marginal costs to produce more and more output.
Again, there is a connection with increasing opportunity costs, and the concept of marginal analysis is important because the graph is a curve and the slope changes for curves.
83(C) Red Hill Capital Corp. 2008

Graphical Analysis of changing change Notice that to calculate slope, properly, for the supply curve, we had to
turn it around to have the supply axis as vertical, and price on the horizontal axis. Don’t let that confuse you, but get used to understanding what graphs mean and not just memorizing graphs.
P
G1
G2
Slope =ΔG1/ΔG2
S
Slope =ΔS/ΔP
84(C) Red Hill Capital Corp. 2008

Another look at estimating the slope of a curve You can try to find the exact tangent to a curve and
estimate the slope of the line. That is show by the dotted line in the figure, below
G1
G2
Slope =ΔG1/ΔG2An alternative is to use two sets of data points for the graph and calculate the slope of the line the line through those points, as an approximation to the tangent line, as shown in the figure, below.
ΔG1
ΔG2
85(C) Red Hill Capital Corp. 2008

Ask yourself1. How do opportunity costs enter the laws of
supply and demand?2. Why do we need to use ceteris paribus to get
the law of demand?3. If supply increases and demand decreases
what will happen to price and quantity (draw a picture to help you think about it)?
4. If there is a shortage, who will start the process to change the price to get to a new equilibrium? Who and how for surplus?
5. What is an efficient outcome, according to economics?
(C) Red Hill Capital Corp. 2008 86

Exam-caliber problemsQuestion 1: If the same dairy can produce
either whole milk or skim milk, an increase in the price of whole milk will results in a(n):
a) decrease in the quantity supplied of whole milk
b) increase in the supply of whole milkc) decrease in the supply of skim milkd) increase in the supply of skim milke) decrease in the quantity supplied of skim
milk
(C) Red Hill Capital Corp. 2008 87

Exam-caliber problemsQuestion 2: Assuming that hamburgers and hot
dogs are substitutes, an increase in the price of hamburgers, other things being equal, results in a:
a) movement up along the demand curve for hamburgers
b) leftward shift in the demand curve for hamburgers
c) rightward shift in the demand curve for hamburgers
d) leftward shift in the demand curve for hot dogse) movement up along the demand curve for hot
dogs
(C) Red Hill Capital Corp. 2008 88

Homework Chapter 3 MC 1-18 Questions 1-12
89(C) Red Hill Capital Corp. 2008

Homework
Homework is due each week in tutorials.
Do the homework before you come to tutorials!!!!!!!!!!!!!!
It should be handed in before the tutorial starts.
This is how attendance will be taken.
90(C) Red Hill Capital Corp. 2008

END
91(C) Red Hill Capital Corp. 2008


