EURASIA Journal of Mathematics, Science and Technology Education ISSN: 1305-8223 (online) 1305-8215 (print) 2017 13(12):8139-8147 DOI: 10.12973/ejmste/78633
Economic Analysis for Sustainable Renovation Yeng-Horng Perng 1*, Shih-Ming Chen 1, Shu-Cheng Lin 1
1 National Taiwan University of Science and Technology, Department of Architecture, Taipei, TAIWAN
Received 10 July 2017 ▪ Revised 2 September 2017 ▪ Accepted 15 October 2017
ABSTRACT The volume of existing buildings is much more than new buildings in developed countries. Applying new technology, new material and new equipment to renovate and make the existing buildings greener is crucial for sustainable development. An approach including current energy statistics survey, expert diagnosis, energy and economic simulation using eQUEST model is carried out in this research for an existing office building in Taipei City. A sustainable renovation scheme with a payback period of 5.75 years is proposed in this research. Lessons learned from this research can be further developed into a decision support system to assist existing office building diagnosis and sustainable renovation in a subtropical area.
INTRODUCTION Efforts as well as resources and technologies have been devoted to the research for developing a more sustainable environment for last few decades (Hartkopf and Loftness, 1999). Existing buildings are accounted for 95-97 percent of the total building volume in the developed countries. The costs for refurbishing an existing building are estimated about 50-80 percent of the costs for constructing a new building while the duration for an old building refurbishment is expected about 50-75 percent of the time for a new building construction (Hsu and Juan, 2016). In other words, refurbishment for existing buildings will be more sustainable and cost effective (Egbu, 1997).
Building energy consumption has been raised to a 20-40percent level of the total energy consumption in developed countries (Pérez-Lombard et al., 2008), about the levels of transport and industry due to growth in population, enhancement of building services and comfort levels. The aforementioned research also points out that energy consumption for the office buildings is about 18percent, 17percent and 33percent of the total energy consumption of the non-residential buildings in the US, UK and Span respectively (Pérez-Lombard et al., 2008). Heating, ventilation and air conditioning (HVAC) consumes about 50% of the energy in office buildings (Norford et al., 1994). In terms of energy use intensity (EUI), the energy consumption of office buildings is even greater than residential buildings in the US (Cole and Kernan, 1996). It is evident that improvement schemes for the energy conservation of office buildings could yield major financial benefits (Yohanis and Norton, 2002).
Research efforts have been largely devoted to energy conservation, simulation and assessment for both new and existing residential buildings (Brounen et al., 2012). Comparatively less research efforts have been committed to energy conservation for office buildings. A decision support system was proposed by Juanto assist the owner of an office building in evaluating the cost-benefit for renovation schemes (Juan et al., 2010). A case study carried out by Çakmanu (2007) for a Turkish office building renovation that could save 47percent of energy use. A multi-criteria assessment approach presented by Rey (2004) that may assist the owner in selecting different refurbishment strategies for office buildings in Swiss. Applying TOBUS (a decision-making tool for selecting office building upgrading solutions developed by EU), Caccavelli and Gugerli (2002) presented a research to help the owner in upgrading existing building performance. More efforts are required to systematically survey of current conditions, expert diagnosis, energy and economic simulation for an effective renovation.
The main purpose of this research is to explore and propose potential renovation strategies that may conserve energy and reduce the electric bill. An existing office building named Goldsun Building located in Taipei City, a subtropical area is studied in this research. There are four steps in this research. First, the basic data including electrical bills, architecture and mechanical plans of the office building are collected. Second, experts from nearby
Perng et al. / Economic and Sustainable Renovation
8140
universities and consulting firms were invited to assist in diagnosis and making suggestions for possible renovation schemes. Third, to explore possible energy saving for different renovation schemes, an eQUEST software is used to perform economic analyses and simulations. Finally, to measure cost-benefit and payback time, energy conserved by the renovation shall be transferred into electric bills.
CASE STUDY: CURRENT CONDITIONS OF THE OFFICE BUILDING
Architectural Specifications As depicted in Figure 1, the office (Goldsun) building studied in this research is located in Taipei, a subtropical
City that has a total floor area of 23,663m2 with 12 stories above ground and 4 stories underground. As shown in Figure 2, the typical floors from the second floor to the twelve floor are used as rental office, while the ground floor is used for rental shop area and lobby. The underground floors are used for parking garages and mechanical rooms. The chillers were set up in fourth floor underground and the cooling towers were fixed on the roof floor.
Contribution of this paper to the literature
• Upgrading comfortableness and energy efficiency, as well as extending usable life for existing buildings by renovation is not only more sustainable but also more cost effective than rebuilding a new one.
• The Goldsun building, case studied in this research is typical in Taipei, a subtropical city. In addition to active energy consumption concerning HVAC, passive energy conservation techniques are also worthwhile to be taken into account during the decision making process.
• Further research is required to propose a decision support system to assist owners and consultants in diagnosis and evaluation for sustainable renovation.
Figure 1. Photo for Goldsun Building
EURASIA J Math Sci and Tech Ed
8141
Climatic Design Conditions According to the Local Weather Bureau, the climate conditions are summarized as followed. The average
temperature for the summer, winter and year round is 28.8oC, 16.8oC and 23.8oC respectively while the sunshine hours are 1405.2 hrs, the average annual precipitation is 2405.1mm and the average relative humidity is 75.25 percent.
Annual Energy Consumption The Goldsun building was built in 1991. The statistics for the electricity used in 2015 are shown on Table 1. The
peak and the valley of electricity usage was during summer time (from June to August) and winter time (from December to February) respectively. The EUI for the whole building was 130.53kWh/m2year and the EUI for the area without basement floors was 170.74kWh/ m2year. Comparing with the office buildings with Green Building Labeling in Taiwan 2015, the EUI for this building is about 35-50% higher (Bureau of Energy, Ministry of Economic Affairs, 2015). The annual average unit price 11.71¢/kWh of the electricity is also about 11 percent higher than green office buildings in Taiwan at the aforementioned time. It is evident that there are potentials for energy conservations.
Existing Mechanical Systems The Goldsun office building was equipped with a central air conditioning system, as shown in Figure 3, which
consists of the following equipment:
Figure 2. Typical Floor Plan
Table 1. Statistics for Electric Quantity Used, Charge, Unit Price and EUI Month Monthly Q (kWh) E-Charge ($) Unit Price (¢/kWh) EUI (kWh/m2)
Jan. 207,600 23,357 11.26 9.24 Feb. 166,200 19,122 11.52 7.40 Mar. 232,400 28,721 12.35 10.34 April 228,000 26,397 11.58 10.15 May 247,600 27,796 11.23 11.02 June 272,600 33,376 12.26 12.13 July 292,800 35,661 12.19 13.03 Aug. 275,800 33,525 12.16 12.28 Sept. 260,200 32,243 12.39 11.58 Oct. 266,000 29,398 11.06 11.84 Nov. 251,600 28,015 11.13 11.20 Dec. 231,600 26,379 11.39 10.31 Sum 2,932,400 343,990 11.71 130.53
Electric Charge is converted into US dollars
Perng et al. / Economic and Sustainable Renovation
8142
(1) Screw Chiller A: capacity 1,200,000kcal/hr, power consumption 313.2Kw, COP4.45 W/W; (2) Screw Chiller B: capacity 1,088,700kcal/hr, power consumption, COP 4.43 W/W; (3) Screw Chiller C: capacity 604,800kcal/hr, power consumption, COP 5.4 W/W; (4) Cooling Tower A: capacity 3,024,000kcal/hr, fan motor 5.625kWx5; (5) Cooling Tower B: capacity 680,400kcal/hr, fan motor 5.625kWx1. Electric power supply system for the Goldsun building is described as followed. The primary substation (P/S)
receiving a three phase three wire 22KV electricity supplied by the Tai-power Company, potential transformers (P.T.) are then used to transform the power into three phase three wire 380V. Automatic power factor regulators were installed to maintain the average power factor in a level not less than 95%. According to Table 1, the peak electric demand, even in the month of July, was less than contract capacity due to overestimate of the electric consumption.
EXPERT’S DIAGNOSIS OF THE CURRENT OFFICE BUILDING Experts from nearby universities and consulting firms were invited to assist the owner to review current status
of the building and pinpoint possible factors that may affect the energy consumption and comfortableness.
Review of Annual Energy Consumption The EUI for the whole building was 130.53kWh/m2year and the EUI for the area without basement floors was
170.74kWh/ m2year. Comparing with the office buildings with Green Building Labeling in Taiwan 2015, the EUI for this building is about 35-50 percent higher (Bureau of Energy, Ministry of Economic Affairs, 2015). The annual average unit price 11.71¢/kWh of the electricity is also about 11 percent higher than green office buildings in Taiwan at the aforementioned time.
Review of HVAC Systems There was no data concerning the electricity consumption and equipment operation status due to the lack of
central monitoring system. A manual control by intuition was used to take turns in switching on/off the three chillers with the capacities of 200RT, 300RT and 400RT. Frequent on/off and inefficient operation in a very low capacity was often observed. Cooling tower on the roof cannot radiate effectively and may cumulate bacteria due to aging and dirty conditions. Cooling tower fan, cooling water pump and chilling water pump were old-type fixed frequency ones cannot automatically be adjusted according to the real time demands.
Figure 3. Air conditioning system layout for the typical floor
EURASIA J Math Sci and Tech Ed
8143
Review of Electricity Systems Detail records for different electric flows, real time consumption and accumulated energy used were not
available due to the lack of a total energy management system. The elevators were just renewed without an energy recovering system.
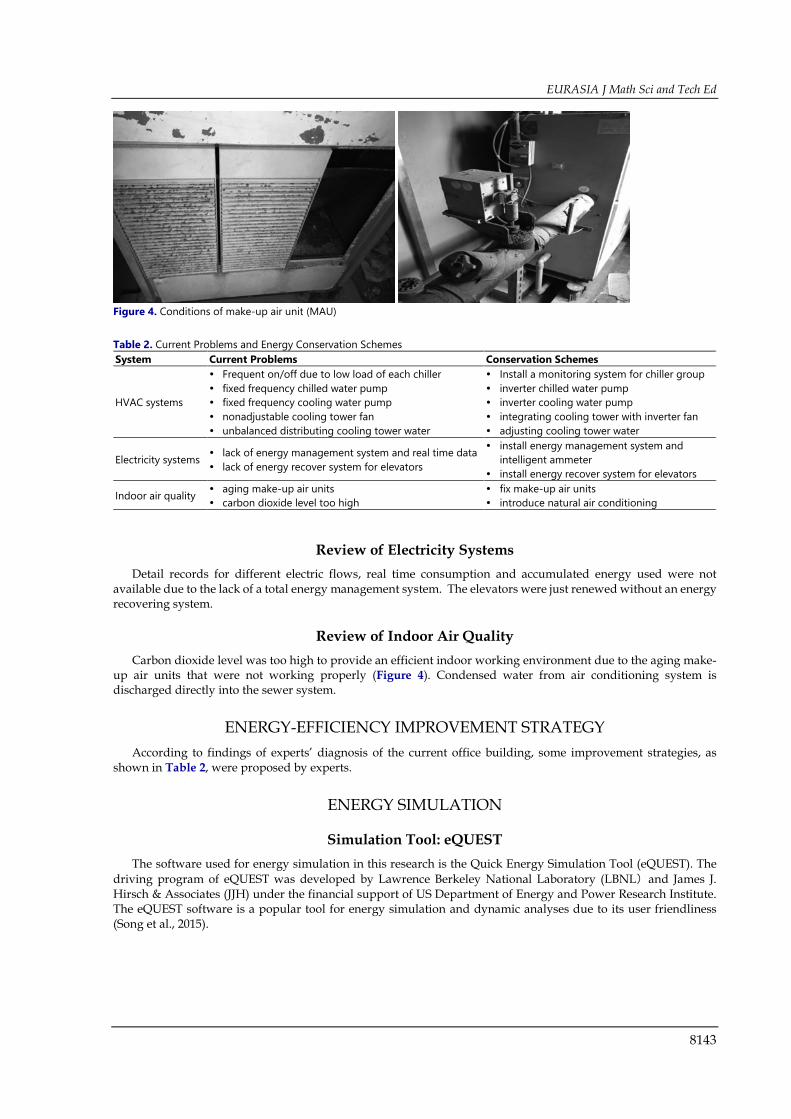
Review of Indoor Air Quality Carbon dioxide level was too high to provide an efficient indoor working environment due to the aging make-
up air units that were not working properly (Figure 4). Condensed water from air conditioning system is discharged directly into the sewer system.
ENERGY-EFFICIENCY IMPROVEMENT STRATEGY According to findings of experts’ diagnosis of the current office building, some improvement strategies, as
shown in Table 2, were proposed by experts.
ENERGY SIMULATION
Simulation Tool: eQUEST The software used for energy simulation in this research is the Quick Energy Simulation Tool (eQUEST). The
driving program of eQUEST was developed by Lawrence Berkeley National Laboratory (LBNL)and James J. Hirsch & Associates (JJH) under the financial support of US Department of Energy and Power Research Institute. The eQUEST software is a popular tool for energy simulation and dynamic analyses due to its user friendliness (Song et al., 2015).
Figure 4. Conditions of make-up air unit (MAU)
Table 2. Current Problems and Energy Conservation Schemes System Current Problems Conservation Schemes
HVAC systems
Frequent on/off due to low load of each chiller fixed frequency chilled water pump fixed frequency cooling water pump nonadjustable cooling tower fan unbalanced distributing cooling tower water
Install a monitoring system for chiller group inverter chilled water pump inverter cooling water pump integrating cooling tower with inverter fan adjusting cooling tower water
Electricity systems lack of energy management system and real time data lack of energy recover system for elevators
install energy management system and intelligent ammeter
install energy recover system for elevators
Indoor air quality aging make-up air units carbon dioxide level too high
fix make-up air units introduce natural air conditioning
Perng et al. / Economic and Sustainable Renovation
8144
Parameter Settings in eQUESTsimulation The exterior of Goldsun building can be animated as depicted in Figure 5. Parameters input for the eQUEST
system are summarized as followed: Location: Taipei, a subtropical city Building Orientation: face south, as shown in Figure 2 Building Summary: 12 stories above ground and 4 stories underground Typical Floor Area: 1,358.18m2 Total Floor Area: 22,466.74m2 Roof U Value: 0.514BTU/hr-ft2℉ Floor U Value: 0.043BTU/hr-ft2℉ Exterior Wall U Value: 0.008BTU/hr-ft2℉ Window U value: 0.227 BTU/hr-ft2℉ Average Occupants: 816 Human heat source(BTU/hr/person): sensible heat 249; latent heat202 Illumination heat source: 1.394W/ft2 Equipment heat source: 1.07W/ ft2 The internal loads mainly consist of occupancy density, lighting loads, and equipment loads, which should be
based on the as-built mechanical, electrical, and plumbing (MEP) drawings. Parameters for HVAC consist of both primary side and secondary side systems. As shown in Figure 6, the secondary side or air side system deals with performance coefficient of fans, coils and air ducts. Loads should be modified according to fresh air required, air conditioner operating loads, equipment operating time and the setting temperature. As shown in Figure 7, the primary side or water side system deals with the loads of chillers, cooling towers and boilers to satisfy the demand of the secondary side.
Figure 5. The exterior of Goldsun building
EURASIA J Math Sci and Tech Ed
8145
The operating hours and operating ratios of air conditioning system, lighting system and business machine for the office area are summarized as Table 3.
Figure 6. HVAC system: air side system configuration
Figure 7. HVAC system: water side system configuration
Table 3. Air conditioner, lighting and business machine operation time and ratio Time Ratio(%) Time Ratio(%) Time Ratio(%) 24-1 0 8-9 90 16-17 70.2 1-2 0 9-10 90 17-18 59.7 2-3 0 10-11 90 18-19 49.7 3-4 0 11-12 50.4 19-20 39.7 4-5 0 12-13 50.4 20-21 29.7 5-6 0 13-14 90 21-22 19.7 6-7 9.9 14-15 90 22-23 9.9 7-8 70 15-16 90 23-24 9.9
Perng et al. / Economic and Sustainable Renovation
8146
Estimated Energy Consumption before Renovation Results analyzed using eQUEST showed that the peak load occurred at PM17:00 July 20th as depicted in Figure
8 before renovation. According to the same analysis, the annual power consumption for air conditioning, lighting and business machine is 2,196,189kWh/year that is about 75percent of the actual annual total consumption (2,932,400kWh/year). The aforementioned results resemble the data presented by Pérez-Lombard et al., (2008), that revealed the annual energy consumption for air conditioning, lighting and business machine accounts for 77percent and 83percent of the total annual office building energy consumption in UK and US respectively.
Benefit Analysis after Renovation Results for potential benefits after sustainable renovation are calculated using eQUEST and shown on Table 4.
The annual power consumption for air conditioning, lighting and business machine is 1,972,267kWh/year after proposed sustainable renovation that represents about 10 percent saving in electric charges. Taking the renovation costs into account, the payback time is about 5.75years. The aforementioned payback time resembles the results presented by Çakmanu (2007) in Turkish office building renovation proposal that had a payback time of 5.9years. The EUI after renovation will be lowered down to 114 kWh/m2year that is about 20 percent below the average EUI (140 kWh/m2year) (Bureau of Energy, Ministry of Economic Affairs 2015) of the office buildings in Taipei City.
CONCLUSION AND SUGGESTIONS The volume of existing buildings is about twenty times larger than that of new buildings. The energy
consumption for the office buildings is the second largest one in building energy consumption. An approach including current energy consumption statistics survey, expert diagnosis and eQUEST model simulation for both before and after renovation is carried out in this research to study an office building in Taipei Taiwan, a subtropical city.
Figure 8. Air conditioning load simulation for the Goldsun office building
Table 4. Energy conservation schemes and cost-benefit analysis Energy conservation schemes Saving (kWh/year) Saving ($/year) Investment ($) Payback (year)
Chiller monitoring system 59,690 7,009 42,156 2.64 VFD chilled water pump
VFD cooling water pump 76,277 8,956
Integrated cooling tower and fan Cooling tower water adjust 18,030 2,117 32,837 15.5
Elevator energy recover 29,734 3,482 21,935 6.3 Natural air conditioning 40,191 4,704 54,145 11.5
Sum 223,922 26,268 151,074 5.75
EURASIA J Math Sci and Tech Ed
8147
Simulation results suggest that a set of sustainable renovation schemes with 5.75 years payback period of time that resembles world wild research outcomes. Upgrading comfortableness and energy efficiency, as well as extending usable life for existing buildings by renovation is not only more sustainable but also more cost effective than rebuilding a new one.
The Goldsun building, case studied in this research is typical in Taipei, a subtropical city. In addition to active energy consumption concerning HVAC, passive energy conservation techniques are also worthwhile to be taken into account during the decision making process. Further research is required to propose a decision support system to assist owners and consultants in diagnosis and evaluation for sustainable renovation.
REFERENCES Brounen, D., Kok, N., & Quigley, J. M. (2012). Residential energy use and conservation: Economics and
demographics. European Economic Review, 56(5), 931-945. Bureau of Energy, Ministry of Economic Affairs. (2015). Energy audit annual report for non-productive industries
(Chinese Version). Caccavelli, D., & Gugerli, H. (2002). TOBUS — a European diagnosis and decision-making tool for office building
upgrading. Energy and Buildings, 34(2), 113-119. Çakmanu, I. (2007). Renovation of existing office buildings in regard to energy economy: An example from Ankara,
Turkey. Building and Environment, 42(3), 1348-1357. Cole, R. J. & Kernan, P. C. (1996). Life-cycle energy use in office buildings. Building and Environment, 31(4), 307-317. Egbu, C. O. (1997). Refurbishment management: challenges and opportunities. Building Research and Information,
25(6), 338–347. Hartkopf, V., & Loftness, V. (1999). Global relevance of total building performance. Automation in Construction, 8(4),
377–393. Hsu, Y. H., & Juan, Y. K. (2016). ANN-based decision model for the reuse of vacant buildings in urban areas.
International Journal of Strategic Property Management, 20(1), 31-43. Juan Y. K., Peng, G., & Wang, J. (2010). A hybrid decision support system for sustainable office building renovation
and energy performance improvement. Energy and Buildings, 42(3), 290-297. Norford, L. K., Socolow, R. H., Hsieh, E. S., & Spadaro, G. V. (1994). Two-to-one discrepancy between measured
and predicted performance of a ‘low-energy’ office building: insights from a reconciliation based on the DOE-2 model. Energy and Buildings, 21(2), 121-131.
Pérez-Lombard, L., Ortiz, J., & Pout, C. (2008). A review on buildings energy consumption information. Energy and Buildings, 40(3), 394-398.
Rey, E. (2004). Office building retrofitting strategies: multicriteria approach of an architectural and technical issue. Energy and Buildings, 36(4), 367-372.
Song, J., Zhang, X., & Meng, X. (2015). Simulation and analysis of a university library energy consumption based on eQUEST. Procedia Engineering, 121, 1382-1388.
Yohanis, Y. G., & Norton, B. (2002). Life-cycle operational and embodied energy for a generic single-storey office building in the UK. Energy, 27(1), 77-92.