Dept of Agricultural and Forest Economics, Engineering, Sciences and Technologies ECONOMIC AND AGRONOMIC RESPONSE OF INDUSTRIAL CROPS TO DRIP AND HOSE-REEL SPRINKLER IRRIGATION: RESULTS OF A THREE YEAR RESEARCH PROJECT IN NORTH ITALY Graziano Ghinassi [email protected]Co-authors: L. Zammarchi and S. Cecchi 15 th meeting of the Working Group on ON-FARM IRRIGATION SYSTEMS (WG-ON-FARM) 24 June 2012, Adelaide-Australia
Transcript
Dept of Agricultural and Forest Economics, Engineering, Sciences and Technologies
ECONOMIC AND AGRONOMIC RESPONSE OF INDUSTRIAL CROPS TO DRIP AND HOSE-REEL
SPRINKLER IRRIGATION: RESULTS OF A THREE YEAR RESEARCH PROJECT IN NORTH ITALY
A triennial research project started in 2009 under the scientific supervision of the Department of Agricultural and Forest Economics, Engineering, Sciences and Technologies (DEISTAF) of the University of Florence;
Aim of the project was to compare agronomic and economic performance of some industrial crops, irrigated by drip and hosereel systems under the same agronomic and climatic conditions.
SELECTION OF THE FARMS
Field activity was carried out in 11 medium-sized farms, from 50 to 170 ha, normally using both drip and hose reel irrigation;
15 comparisons (=30 case studies);
Comparison refers to the use of drip and sprinkler irrigation on the same crop during the same season, according to the ordinary on-farm procedures.
CROPS
Sugar beet
Onion
Maize (forage)
Potato
Tomato
Tobacco
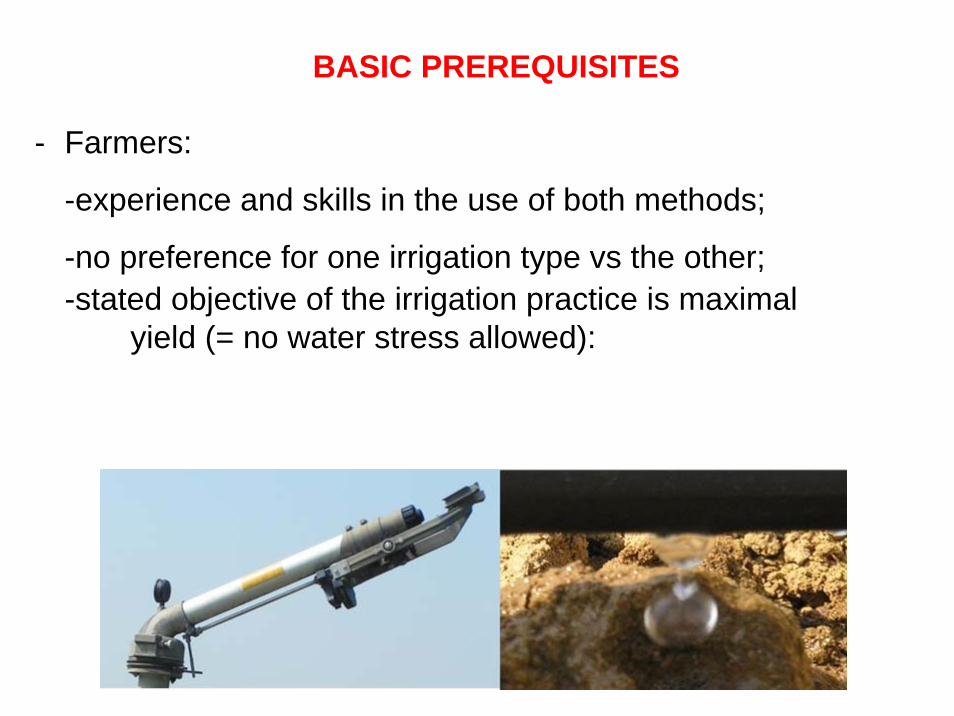
BASIC PREREQUISITES
- Farmers:
-experience and skills in the use of both methods;
-no preference for one irrigation type vs the other; -stated objective of the irrigation practice is maximal
yield (= no water stress allowed):
Hose-reel with guns and booms
Drip systems
Florence
Rome
Locations of the farms
AGRONOMY
ECONOMY
IRRIGATION
PROJECT OUTPUTS ON
Net Irrigation Requirement (evapotranspiration, effective rainfall, exposed and wetted soil area);
Gross Irrigation Requirement (=supplied water);
Market yield;
Other (i.e., yield quality parameters);
AGRONOMIC OUTPUTS
Evapotranspiration (Hargreaves + site specific kc):
Given as indexes in order to allow comparisons both within the individual case study and between case studies, regardless of the absolute value of each variable;
Production index
Cost index
Productivity index
Relative Water Surplus
other….
Each index is arranged as advantage (either positive or negative) of sprinkler irrigation, assuming drip irrigation as the benchmark.
ECONOMIC OUTPUTS
Production index - Gross Income (GI)
The index varies from -22% to 34%.
Negative in 10 cases out of 15, the mean value is -0.8%.
There is no evidence for the superiority of one method to the other (I.e., results can be opposite between two subsequent seasons).
-30% -20% -10% 0% 10% 20% 30% 40%
GIadv
Tomato.1
Tomato.2
Tomato.3
Tomato.4
Tomato.5
Onion.1
Onion.2
Maize.1
Maize.2
Tobacco.1
Tobacco.2
Tobacco.3
AVERAGE
Cost index – Specific Cost (SPC)
0% 20% 40% 60% 80% 100%
SPCadv
Tomato.1
Tomato.2
Tomato.3
Tomato.4
Tomato.5
Onion.1
Onion.2
Maize.1
Maize.2
Tobacco.1
Tobacco.2
Tobacco.3
AVERAGE
Great variability among farms.
The index ranges from 0.6% to 88%.
Sprinkler is less expensive than drip in all cases.
Advantage is about 48% on average.
Specific costs given by the sum of monetary and calculated costs
Cost index – Composition of SPC
Energy is the main cost of hose reel irrigation (54.5% of SPC).
Purchasing and disposal of drip lines is more the half of the drip SPC (52.5%).
11,1%
54,6%
34,3%
28,8%
16,1%
4,0%
51,1%
0%
20%
40%
60%
80%
100%
cost
com
posi
tion
Sprinkler Drip
manual labour energyamortization materials and services
Relative Water Surplus (RS)
RS can provide for comprehensive evaluation on equipment performance and professional skill.
Surplus is nil in four cases, in 10 cases out of 11 RS is lower under sprinkler irrigation.
Compares seasonal irrigation supply (SIS) to net irrigation requirement (NIR)
According to the economic evaluation, sprinkler hose reel irrigation performs better than drip irrigation in the farms under analysis.
This does not provide us with final assessment, due to the extent and nature of the sample.
Crop yields under the different irrigation types are equivalent in the case studies;
Conversely, operational limits of hose reel irrigation were detected at farm level under particular environmental and farmland characteristics.
CONCLUSIONS
These conditions (constraints) partially account for the spread of drip irrigation in the study areas.
Management of sprinkler irrigation seems easier than drip irrigation in the study farms.
Sprinkler and drip systems play a complementary role in actual farming system.
The question is not to establish which of the two methods is to be preferred, but to decide on what is the most suitable combination of them at farm level.