121
| Date post: | 06-Aug-2015 |
| Category: |
News & Politics |
| Upload: | united-pac-conservatives |
| View: | 88 times |
| Download: | 0 times |


NOTE /ACKNOWLEDGEMENT
The data contained in this Review have been arranged and classified to facilitate economic analysis, and may therefore not coincide exactly with the accounting systems from which they may have been derived. In addition, the figures for the
year under review, and in some cases for previous years, are preliminary.
The Government of Saint Lucia wishes to thank for their kind cooperation, all the individuals and institutions in both the public and private sectors (whether in Saint Lucia or abroad), who have supplied data or other information for this
Review.

TABLE OF CONTENTS
Chapter Page 1 External Economic Developments ............................................................................... 1 International ......................................................................................................... 1 Regional ................................................................................................................. 3 2 Summary of Domestic Economic Developments ...................................................... 7 3 The Real Sector .............................................................................................................. 11 Tourism ................................................................................................................ 11 Construction and Quarrying ............................................................................ 15 Manufacturing .................................................................................................... 20 Agriculture ........................................................................................................... 22 Transport ............................................................................................................. 25 Energy ................................................................................................................... 27 Prices .................................................................................................................... 30 4 Central Government Fiscal Operations .................................................................... 32 Central Government Fiscal Operations .......................................................... 32 Public Debt .......................................................................................................... 37 5 The Monetary & Financial Sector .............................................................................. 41 Monetary Developments ................................................................................... 41 6 The External Sector ....................................................................................................... 45 Trade & Balance of Payments .......................................................................... 45 7 Socio-Demographic Indicators ................................................................................... 49 Population & Demography .............................................................................. 49 Education ............................................................................................................. 51 8 Economic Outlook 2013 ................................................................................................ 59 Statistical Appendix

List of Tables Page
1. Selected Global Economic Indicators .............................................................................................. 1 2. Selected Regional Economic Indicators .......................................................................................... 4 3. Summary of Public Sector Construction (EC$ Million)……….. .................................................. 6 4. Central Government Construction Expenditure on Economic Infrastructure … ................... 16 5. Central Government Expenditure on Social Infrastructure… ................................................... 17 6. Value of Imports of Construction Materials (EC$ Million) ........................................................ 19 7. Value of Manufacturing Output (EC$ Million)… ...................................................................... 20 8. Central Government Capital Expenditure (Main projects) ....................................................... 37 9. Weighted Average Cost of Debt (WACD) ................................................................................... 38 10. Leading Cause of Death in Saint Lucia ......................................................................................... 50 11. Number of Students Benefiting from Various Student Support Services ............................... 52 12. National Mean Performance in Primary Level Examination .................................................... 54
List of Graphs Page 1. Real GDP Growth ............................................................................................................................... 7 2. Hotel and Restaurants Real Growth & Contribution to GDP .................................................... 11 3. Stay-over Arrivals by Main Markets .............................................................................................. 12 4. Other Tourist Arrivals ...................................................................................................................... 14 5. Construction: Real Growth & Contribution to GDP .................................................................... 15 6. Development Control Authority Applications and Approvals ................................................. 19 7. Manufacturing: Real Growth & Contribution to GDP ................................................................ 20 8. Agriculture: Real Growth & Contribution to GDP ..................................................................... 22 9. Saint Lucia Banana Exports to the UK ........................................................................................... 22 10. Fish Landings by Species ................................................................................................................. 24 11. Transport: Real Growth & Contribution to GDP ........................................................................ 25 12. Sea Cargo Traffic-Tonnes ................................................................................................................ 26 13. Oil Price Movements (WTI) ............................................................................................................ 27 14. Diesel Price and Fuel Surcharge .................................................................................................... 28 15. Composition of Electricity Sales ................................................................................................... 29 16. Consumer Price Inflation ................................................................................................................ 30 17. Central Government Fiscal Performance Indicators ................................................................... 32 18. Major Components of Current Revenue ..................................................................................... 33 19. Major Components of Current Expenditure ................................................................................ 35 20. Expenditure on Goods and Services ............................................................................................ 35 21. Public Debt ......................................................................................................................................... 38 22. External Debt by Currency Composition ...................................................................................... 40 23. Financial Sector Value Added Growth Rates ............................................................................... 41 24. Total Imports and Merchandise Trade Deficit.............................................................................. 45 25. Imports by Economic Classification ............................................................................................... 46 26. Birth, Death & Infant Mortality Rates .......................................................................................... 49 27. Number of New HIV and AIDS ..................................................................................................... 51 28. Education Expenditure ................................................................................................................... 52 29. Primary School Enrollment and Student Teacher Ratio .............................................................. 53 30. Primary Schools by Size ................................................................................................................... 53 31. Secondary School Enrollment and Teacher Ratio ....................................................................... .55 32. Secondary School Dropouts ............................................................................................................ 55 33. Secondary School Teachers and Trained Teachers ...................................................................... 56 34. Private Schools Enrollment ............................................................................................................. 57 35. Tertiary Education Enrollment ....................................................................................................... 57 36. Tertiary Education Pass Rates ......................................................................................................... 58

LIST OF ACRONYMS
AIDS Acquired Immune Deficiency Syndrome
APD Air Passenger Duty
BA British Airways
BOE Barrels of Oil Equivalent
CARE Centre for Adolescent Rehabilitation and Education
CARICOM Caribbean Community and Common Market
CDB Caribbean Development Bank
CEE Caribbean Entrance Examination
CFL Consolidated Foods Limited
CPI Consumer Price Index
CSEC Caribbean Secondary Education Certificate
CXC Caribbean Examinations Council
DCA Development Control Authority
DPT3 Diphtheria, Pertussis and Tetanus
ECCB Eastern Caribbean Central Bank
ECCU Eastern Caribbean Currency Union
ECFH East Caribbean Financial Holding
EU European Union
GCE General Certificate of Education
GDP Gross Domestic Product
HIA Hewanorra International Airport
HIV Human Immunodeficiency Virus
HOPE Holistic Opportunity for Personal Empowerment
IMF International Monetary Fund
KWh Kilowatts
LIAT Leeward Islands Air Transport
LPG Liquefied Propane Gas
LUCELEC Saint Lucia Electricity Services Limited
MMR Mumps, Measles, Rubella vaccine
MST Minimum Standards Test
NCOPT National Council on Public Transportation
NDC National Development Corporation
NELP National Enrichment Learning Programme
NHC National Housing Corporation
NICE National Initiative for Creating Employment

LIST OF ACRONYMS CONTINUED
NIPRO National Insurance Property Development and Management Company
NSDC National Skills Development Centre
OECS Organization of Eastern Caribbean States
PAYE Pay As You Earn
RGSM Regional Government Securities Market
SALCC Sir Arthur Lewis Community College
SDR Special Drawing Rights
SLTB Saint Lucia Tourist Board
SLASPA Saint Lucia Air and Sea Ports Authority
STEP Short Term Employment Programme
TQF Tropical Quality Fruit Company
VAT Value Added Tax
WACD Weighted Average Cost of Debt
WIBDECO Windward Island Banana Development and Exporting Company
WLBL Windward and Leeward Brewery Limited
WTI West Texas Intermediate
1 The population density is equal to the population divided by the habitable area.
2 Figures relate to fiscal years 2011/12 and 2012/13.
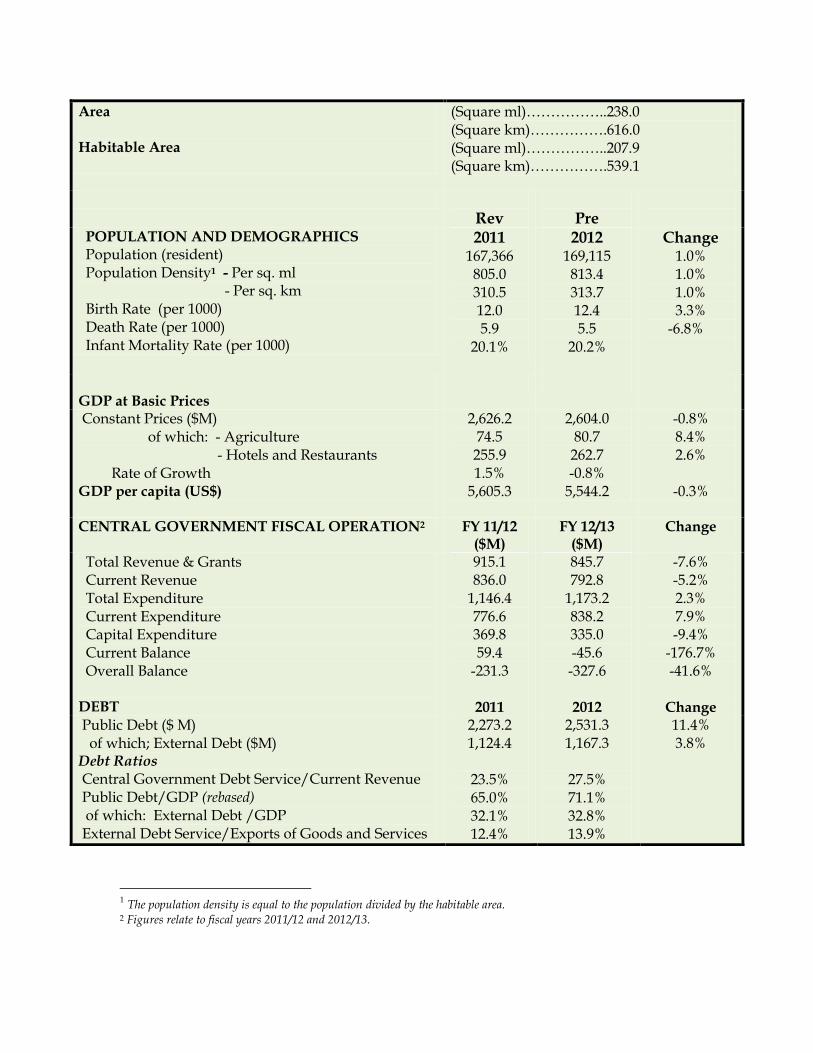
Area Habitable Area
(Square ml)……………..238.0 (Square km)…………….616.0 (Square ml)……………..207.9 (Square km)…………….539.1
Rev
Pre
POPULATION AND DEMOGRAPHICS Population (resident) Population Density1 - Per sq. ml - Per sq. km Birth Rate (per 1000) Death Rate (per 1000) Infant Mortality Rate (per 1000)
2011 167,366 805.0 310.5 12.0 5.9
20.1%
2012 169,115
813.4 313.7 12.4 5.5
20.2%
Change 1.0% 1.0% 1.0% 3.3%
-6.8%
GDP at Basic Prices
Constant Prices ($M) of which: - Agriculture - Hotels and Restaurants Rate of Growth GDP per capita (US$)
2,626.2 74.5
255.9 1.5%
5,605.3
2,604.0 80.7 262.7 -0.8%
5,544.2
-0.8% 8.4% 2.6%
-0.3%
CENTRAL GOVERNMENT FISCAL OPERATION2 FY 11/12 ($M)
FY 12/13 ($M)
Change
Total Revenue & Grants Current Revenue Total Expenditure Current Expenditure Capital Expenditure Current Balance Overall Balance
915.1 836.0
1,146.4 776.6 369.8 59.4
-231.3
845.7 792.8
1,173.2 838.2 335.0 -45.6
-327.6
-7.6% -5.2% 2.3% 7.9% -9.4%
-176.7% -41.6%
DEBT
2011
2012
Change
Public Debt ($ M) of which; External Debt ($M) Debt Ratios Central Government Debt Service/Current Revenue Public Debt/GDP (rebased) of which: External Debt /GDP External Debt Service/Exports of Goods and Services
2,273.2 1,124.4
23.5% 65.0% 32.1% 12.4%
2,531.3 1,167.3
27.5% 71.1% 32.8% 13.9%
11.4% 3.8%

MONEY AND CREDIT ($M)
2011
2012
Change
Total Deposits Money Supply (M1) Money Supply (M2) Bank Credit to Public Sector Bank Credit to Private Sector
3,560.3 675.4
2,729.8 286.9
3,887.5
3,721.5 701.0
2,798.5 404.9
4,084.6
4.5% 3.8% 2.5% 41.1% 5.1%
Bank Credit By Sector:
Agriculture Manufacturing, Mining and Quarrying Tourism Distributive Trades Personal Transport Public Utilities Construction and Land Development Public Administration (Gov’t Services) Professional and Other Services Total Credit
27.4 103.3 779.2 310.8
1,312.0 92.6 85.3
401.8 133.9 740.7
4,057.9
28.4 107.1 774.0 322.6
1,556.6 88.0 63.7
366.2 237.6 808.0
4,434.3
3.6% 3.7% -0.7% 3.8% 18.6% -5.0% -25.3% -8.9% 77.4% 9.1% 9.3%
AGRICULTURE
Banana Exports to UK (tonnes) Banana Revenue to UK($M)
6,556 13.2
12,126 21.1
85.0% 59.8%
TOURISM
Total Visitor Arrivals of which: - Stay-over Tourist
- Excursionists - Cruise Ship Arrivals - Yacht Passenger Arrivals
994,961 312,404 10,523 630,304 41,730
931,231 306,801 10,363 571,894 42,173
-6.4% -1.8% -1.5% -9.3% 1.1%
MERCHANDISE FOREIGN TRADE($M)
Imports (c.i.f. value) 1,889.9
1,782.8
-5.7%
PRICES AND UNEMPLOYMENT
Inflation Rate (period average) Unemployment Rate RATE OF EXCHANGE (US$)
2.8% 21.2%
EC$2.70
4.2% 20.6%
EC$2.70
2.8%

1
CHAPTER ONE
EXTERNAL ECONOMIC DEVELOPMENTS
International
The recovery in the global economy weakened further in 2012 as the ongoing fiscal and
banking crises in the euro area posed major challenges to both advanced and developing
economies. Nonetheless, world output continued to expand at a decelerated pace of 3.2
percent compared to 4.0 percent and 5.1 percent in 2011 and 2010 respectively. This was
led by growth of 5.1 percent in emerging market and developing economies which was
slower than in 2011. Growth in advanced economies, weighed down on economic
activity elsewhere, also slackened to 1.2 percent compared to 1.6 percent in 2011.
Large output gaps, downward pressure on wages together with lower commodity prices
resulted in subdued inflation in 2012 while unemployment remained very high.
Global financial conditions improved particularly in the second half of the year as a
result of implementation of several policy initiatives. Investor confidence improved with
the recapitalization of banks in Europe and the US coupled with accommodative
monetary policies.
Table 1: Selected Global Economic Indicators
Country
Growth % Inflation %
2008 2009 2010 2011 2012 2008 2009 2010 2011 2012
United States -0.3 -3.1 2.4 1.8 2.2 3.8 -0.3 1.6 3.1 2.1
Euro Area 0.4 -4.4 2.0 1.4 -0.6 3.3 0.3 1.6 2.7 2.5
United Kingdom -1.0 -4.0 1.8 0.9 0.2 3.6 2.1 3.3 4.5 2.8
Canada 1.1 -2.8 3.2 2.6 1.8 2.4 0.3 1.8 2.9 1.5
Japan -1.0 -5.5 4.7 -0.6 2.0 1.4 -1.3 -0.7 -0.3 0.0
China 9.6 9.2 10.4 9.3 7.8 5.9 -0.7 3.3 5.4 2.6
India 6.2 5.0 11.2 7.7 4.0 8.3 10.9 12.0 8.9 9.3
Source: IMF World Economic Outlook (April 2013)

2
The US economy recorded sluggish performance in 2012, owing partly to deteriorating
economic conditions in Europe and lingering uncertainties about the fiscal stance.
Prolonged negotiations over the continuation of previously approved fiscal measures
(“fiscal cliff”) restrained growth of business investment and private spending. The
unemployment rate remained above 8.0 percent before falling in the last quarter of the
year. The US budget deficit improved but remained large at 8.2 percent of GDP in 2012
from 9.5 percent in the previous year. Inflation moderated in 2012 due to lower imports
and energy prices.
After rebounding in 2010 and 2011, economic growth in Canada slowed in 2012,
reflecting lower growth of private domestic demand, ongoing fiscal adjustment and
lower exports due to flagging external demand and a strong currency. Slower growth of
disposable income and consumer credit dampened consumption while a slowdown in
the housing sector and the uncertain external environment weighed down on business
investment.
Growth in the UK economy slowed to 0.2 percent in 2012 as the economy continued to
grapple with the effects of fiscal consolidation, problems in the financial system and a
weak global economy. As a result unemployment remained high at over 8.0 percent
while consumer price inflation receded on account of lower energy and food costs.
Financial stress continued as banks faced increased risks related to exposure to private
sector borrowers from the ailing countries such as Greece, Ireland, Spain and Portugal.
Output contracted in the euro area due to the ongoing sovereign debt crisis,
unsustainable fiscal imbalances and widespread austerity measures in Greece, Ireland
Portugal and Spain. These culminated in loss of confidence and extra-ordinarily high
levels of unemployment of 11 percent with some member countries such as Spain and
Greece experiencing unemployment levels as high as 25.0 percent. For much of 2012,
bank lending fell markedly as banks sought to strengthen their balance sheets to avert
public intervention. However, a strengthened EU-wide policy response to the crisis

3
improved financial conditions. Increases in consumer prices in the euro area, although
above the target, were tempered in 2012 due to falling commodity prices.
Notwithstanding robust growth in the last quarter, there was a considerable slowdown
of economic activity in China in the first nine months of 2012 which resulted in the
lowest growth since 1999. This was attributed to spillovers from the euro area which
resulted in notably lower exports to the US and Europe. Weakened investment demand,
structural challenges and policy tightening geared towards cooling the overheating real
estate market and inflation also hampered growth. Notwithstanding, private
consumption remained buoyant. Growth also slowed in India, dampened by softer
external demand and domestic factors. Activity was also affected by higher interest rates
which were aimed at containing inflation.
Activity in Japan rebounded from a year ago, occasioned by reconstruction works and
recovery from the earthquake-related disasters of 2011 as well as policy measures to
stimulate private consumption. However, exports were undermined by the setbacks in
the global economy and the appreciation of the yen. Growth was also affected by
domestic energy supply issues. Unemployment retreated to around 4.5 percent while
prices inched up.
Regional
Uncertainties surrounding the fragile global recovery continued to pose challenges for
Caribbean economies, most of which experienced rising and high unemployment. In
keeping with the slowdown in the global economy, growth in most countries slowed in
2012, following the momentum gained in 2011. Foreign direct investment inflows
remained soft compared to pre-crisis levels and contributed to a weakening of private
sector activity. In light of unsustainable fiscal deficits and rising public debt levels,
several regional governments were constrained in their ability to provide further
economic stimulus and implement desired job creation initiatives.

4
While the ECCU registered its fourth consecutive year of contraction, there were some
positive signs that some other Caribbean countries are gradually recovering from the
protracted effects of the recession, as output in the region grew by approximately 1.0
percent in 2012. This was led by solid growth of 5.0 percent in Belize and increases in
output in Guyana.
Real GDP growth in Guyana grew steadily for a seventh consecutive year, mirroring
expansions in most sectors, particularly a strong performance in the mining sector and
gains in rice and rum production. Activity in the economy was supported by a robust
expansion in private sector credit induced by a 60.0 basis point reduction in the cost of
borrowing. Inflationary pressures abated in 2012 through direct interventions while the
fiscal deficit increased slightly to 4.6 percent of GDP. On the external account, Guyana
recorded a balance of payments surplus of US$12.4 million, compared to a deficit of
US$15 million in 2011 due mainly to larger inflows from foreign direct investments.
Total external reserves of US$862.2 million (4 months of imports) were recorded by the
end of 2012, the highest end of year position in Guyana’s history.
Economic growth in Trinidad & Tobago expanded in 2012, supported by
accommodative monetary policy. This reflected a recovery in the non-energy sector,
while output in the energy sector was hampered by technical disruptions associated
with maintenance operations. The inflation rate increased due to elevated food prices,
notwithstanding the removal of the value added tax (VAT) on additional food items in
November. Meanwhile, the unemployment rate rose to an estimated average of 5.6
percent in 2012 compared to 5.3 percent in 2011. The central bank reduced the repo rate
Table 2: Selected Regional Economic Indicators Country Real Growth % Inflation% (Period Average)
2009 2010 2011r 2012p 2009 2010 2011r 2012p
Barbados -4.1 0.3 0.8 0.0 3.1 5.5 9.4 4.5
ECCU -5.2 -2.6 -0.5 -0.1 1.2 2.7 4.3 2.6
Guyana 3.3 4.4 5.4 4.8 3.0 3.7 5.0 3.0
Jamaica -3.1 -1.4 1.3 -0.3 9.6 12.6 7.5 6.9
Trinidad and Tobago -3.3 0.0 -2.6 1.2 7.0 10.6 7.1 7.2
Source: Country and IMF Reports r=revised p=preliminary

5
from 3.0 percent to 2.75 percent in September to boost domestic economic activity.
Although several commercial banks cut their prime rate to 7.5 percent by November,
private credit was sluggish. Lower revenue from the energy sector resulted in a
widening of the fiscal deficit to 2.5 percent of GDP in 2012/13 from 1.1 percent of GDP
in 2011/12 compared to a near balance in the previous fiscal year.
Output growth remained flat in Barbados in 2012 due to weak performances in tourism,
construction, manufacturing and agriculture, accompanied by low growth in the non-
traded sectors. Value added in the tourism sector contracted by an estimated 3.7 percent
reflecting a 5.5 percent decline in visitor arrivals. Growth was constrained by the
cutbacks in government’s capital outlay and lower foreign investments. The fiscal deficit
in 2012/13 widened to 7.3 percent of GDP from 4.6 percent in 2011/12. Unemployment
rose to 11.6 percent in 2012, the highest level in over a decade. However, inflation
subsided as international commodity prices retreated. The external current account
deficit fell from 11.6 percent of GDP to 4.7 percent of GDP in 2012, partly reflecting
reduced imports due to lower commodity prices and suppressed domestic demand.
Jamaica recorded a marginal decline in output in 2012, influenced by weak demand and
a fall in private sector investment. Tourism expanded with growth in both stay-over and
cruise visitors. Mechanical and electrical interruptions led to lower output in the mining
sector while weather related factors such as hurricane Sandy in the last quarter
negatively affected agricultural production. Inflation, though more tempered than in
2011, was partly driven by a gradual depreciation of the exchange rate. The fiscal deficit
widened to 8.3 percent of GDP in 2012/13 from 6.5 percent in 2011/12, leading to an
increase in the ratio of public sector debt to GDP to 145.9 percent in 2012/13 from 139.0
percent.
Economic activity in the ECCU declined further, albeit by 0.1 percent in 2012 compared
to an average of 2.8 percent over the past three years. This performance was primarily
reflective of lower output in tourism due to declines in visitor expenditure and cruise
arrivals. In addition, output in the construction sector contracted, influenced by

6
reductions in foreign direct investments and notable cuts in capital expenditure.
However, increased value added was recorded in manufacturing and agriculture. Of the
eight member states, five countries recorded contractions in output while Antigua &
Barbuda, Montserrat and St. Vincent & the Grenadines realised growth of 2.3 percent,
1.4 percent and 1.5 percent respectively.
Reflecting the moderation in import prices, inflationary pressures were eased in 2012,
with the exception of Saint Lucia where consumer prices increased notably, following
the introduction of VAT in October. The fiscal constraints faced by member states
remained in 2012 despite the narrowing of the overall deficit to 3.0 percent of GDP from
3.3 percent of GDP in 2011. The larger fiscal deficit was reflected in an increase in the
debt to GDP ratio of the ECCU from 87.9 percent to 89.5 percent. Wider financial sector
reform progressed while the banking system was characterized by high non-performing
loans, impaired capital and excess liquidity.

7
CHAPTER TWO
SUMMARY OF DOMESTIC
ECONOMIC DEVELOPMENTS
Against the backdrop of slower recovery in the global economy, output growth in the
domestic economy lost momentum in 2012. Preliminary estimates suggest that Saint
Lucia’s economy contracted by 0.8 percent in 2012, following a revised growth rate of 1.5
percent in 2011. This was associated with restrained domestic demand and lower private
investment. The broad-based decline in economic activity was mainly attributable to
significant downturns in the distributive trades, construction, transport and
communications sectors.
Provisional data indicate that
activity in the construction
sector fell by 5.0 percent in 2012.
Significant declines in activity
were recorded by both the
public and private sectors. In
the private sector, activity remained weak due to the completion of major projects and
delays in commencement of others. Expenditure on public sector construction activity
declined by 28.7 percent in 2012 largely as a result of lower outlays on road
infrastructure, community works and the winding down of work on the national
hospital as well as hurricane Tomas-related rehabilitation works.
During the review period, the tourism sector in Saint Lucia fared better than most of its
ECCU neighbours with increased visitor expenditure and a comparatively smaller
contraction in the number of visitors. Total arrivals fell by 6.4 percent to 931,239 in 2012
as stay-over and cruise arrivals decreased by 1.8 percent to 306,801 and by 9.3 percent to
571,894 respectively. The decline in stay-over arrivals was largely occasioned by loss of
airlift, particularly the main US market, higher airfares and the slow pace of recovery in

8
advanced economies. This included cessation of some services by American Airlines and
all flights by American Eagle from Puerto Rico. Hotels recorded increased occupancy
levels owing to longer stays by visitors from some markets. There were tentative signs of
partial recovery at some high end properties, which contributed to an increase in visitor
expenditure by almost 2.0 percent to an estimated $1.6 billion.
The performance of the manufacturing sector continued to be constrained by weak
domestic demand and issues of competitiveness, including rising input costs. Value
added in the sector is estimated to have remained broadly flat in 2012. Increases in the
value of production of food items, non-alcoholic beverages and chemicals were offset by
declines in other key sub-sectors.
Output in the agriculture sector expanded in 2012, reflecting the continued recovery in
the banana industry, from the damage caused by hurricane Tomas. Notwithstanding
challenges of diseases and the rising costs of inputs, banana production increased
significantly reflecting the recovery from the effects of the hurricane. Exports to the UK
grew by 85.0 percent to 12,126 tonnes with correspondingly higher earnings, by 40.1
percent to $21.2 million. Preliminary data suggest a moderate increase in supermarket
purchases of agricultural produce due to an expansion in the CFL certification
programme. Data on chicken and pork production show increased output by 2.9 percent
while egg production declined by 7.0 percent to 1.17 million dozens. Fish landings rose
by 1.0 percent to 1,709 tonnes as a result of repaired fish aggregating devices.
The rate of inflation increased to 4.2 percent in 2012 compared with 2.8 percent in 2011
driven by higher import prices and due in part to the introduction of VAT in October
2012. The main categories of the consumer basket affected by higher prices were clothing
and footwear, recreation & culture, and food & beverages.
Reflecting the sluggishness of economic activity, developments in the financial sector
were characterized by weak demand for credit and moderate growth in deposits. This

9
led to increased liquidity in the banking system amid a continued increase in non-
performing loans.
Preliminary data indicate a deterioration in the central government’s fiscal position in
2012/13, mainly influenced by a reduction in revenue and grants. The overall fiscal
deficit increased to $327.6 million representing 8.9 percent of GDP, up from the revised
$231.3 million or 6.6 percent of GDP in 2011/12. Total expenditure amounted to $1,173.2
million while revenue and grants totaled $845.5 million. The current account balance fell
from a surplus of $59.4 million in 2011/12 to a deficit of $45.6 million in 2012/13, owing
to increases in current expenditure while current revenue declined. The increase in
current expenditure was mainly driven by higher spending on goods and services,
interest payments and current transfers, including subsidies and transfers to
governmental bodies.
The increase in the fiscal deficit has resulted in an 11.4 percent rise in total public debt to
$2,531.2 million, equivalent to 71.1 percent of GDP at the end of 2012 compared with a
revised 65.0 of GDP in 2011. Much of the increase in the central government debt
represents purchases of central government debt instruments by domestic investors on
the Regional Government Securities Market and private placements.
Owing to continued external borrowing by banks and the government, the balance of
payments registered an overall surplus of $44.1 million, reflected in an increase in Saint
Lucia’s share of imputed reserves at the central bank. The current account deficit
narrowed to 15.3 percent of GDP and was fully financed by the surplus on the capital
and financial account which fell to an estimated 19.9 percent of GDP.
Preliminary data indicate that the average employed labour force in St Lucia increased
by 4.7 percent to 74,784. The expansion in the employed labour force coupled with a
slowdown in the rate of increase of the total number of unemployed have resulted in a
moderate reduction in the average unemployment rate to 20.6 percent in 2012 from 21.2
percent in 2011. The lower rate of unemployment was driven solely by increases in

10
public sector employment reflecting the impact of the job creating programmes
implemented by the government during 2012.
Short-Term Prospects
The expected pick-up in the global economy, particularly in Saint Lucia’s key tourism
source markets, is likely to enhance the growth prospects for the domestic economy in
2013 and 2014. The tourism sector is expected to benefit from increased airlift from the
US market, the impact of which may be partially offset by reduced air seats from the UK
and the Caribbean. The imminent launch of a major tourism project is likely to boost
construction activity in 2013 coupled with the ongoing stimulus package. Growth is
expected in the agriculture sector, supported by the continued recovery in the banana
industry. Inflationary pressures are likely to be tempered in 2013, following the
introduction of VAT in October 2012, while the rate of unemployment is expected to
moderate somewhat but remain high. While a modest increase in revenue is forecasted
the fiscal outturn in 2013/14 is contingent on expenditure reducing measures. The
current account on the balance of payments is projected to widen moderately in tandem
with the anticipated increase in economic activity.
11
CHAPTER THREE
REAL SECTOR DEVELOPMENTS
TOURISM
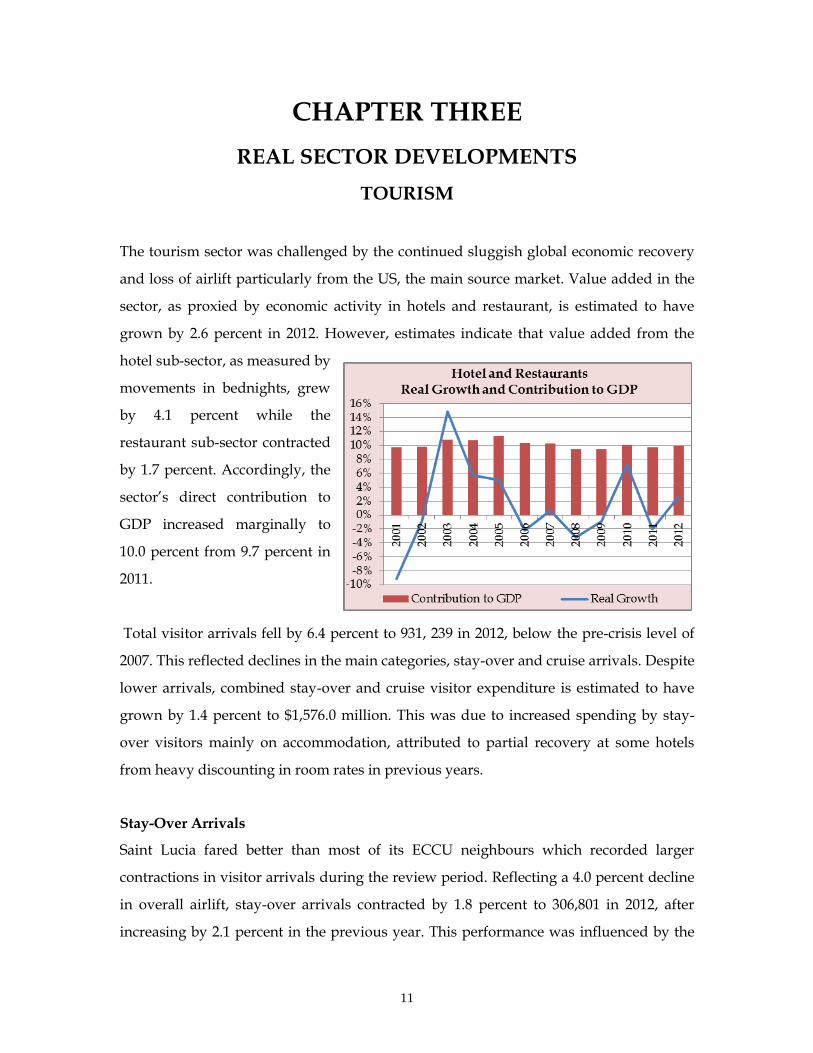
The tourism sector was challenged by the continued sluggish global economic recovery
and loss of airlift particularly from the US, the main source market. Value added in the
sector, as proxied by economic activity in hotels and restaurant, is estimated to have
grown by 2.6 percent in 2012. However, estimates indicate that value added from the
hotel sub-sector, as measured by
movements in bednights, grew
by 4.1 percent while the
restaurant sub-sector contracted
by 1.7 percent. Accordingly, the
sector’s direct contribution to
GDP increased marginally to
10.0 percent from 9.7 percent in
2011.
Total visitor arrivals fell by 6.4 percent to 931, 239 in 2012, below the pre-crisis level of
2007. This reflected declines in the main categories, stay-over and cruise arrivals. Despite
lower arrivals, combined stay-over and cruise visitor expenditure is estimated to have
grown by 1.4 percent to $1,576.0 million. This was due to increased spending by stay-
over visitors mainly on accommodation, attributed to partial recovery at some hotels
from heavy discounting in room rates in previous years.
Stay-Over Arrivals
Saint Lucia fared better than most of its ECCU neighbours which recorded larger
contractions in visitor arrivals during the review period. Reflecting a 4.0 percent decline
in overall airlift, stay-over arrivals contracted by 1.8 percent to 306,801 in 2012, after
increasing by 2.1 percent in the previous year. This performance was influenced by the

12
difficulties experienced in the advanced economies, increased competition and increases
in air fares. Following a 3.3 percent improvement in the first quarter, declines were
posted in the subsequent quarters, coinciding with decreases in air seat capacity.
Influenced by the slow recovery of the US economy, arrivals from the US fell by 6.0
percent to 115,065 in 2012. The fall in arrivals was in keeping with a reduction of 21.5
percent in airlift. This was largely occasioned by the losses from American Airlines
including the direct flight from New York and one direct flight from Miami.
Compounding this situation was a cessation of flights by American Eagle in August and
lower air seats by Delta due to reduced frequency which was partially offset by a 14.0
percent increase in seats by
Jet Blue Airlines during the
summer period. Increasing
and comparatively higher1
airfares also softened
demand for travel to Saint
Lucia. Other inhibiting
factors, particularly in the last
quarter, were the US
presidential elections and
severe weather-related events such as the passage of Hurricane Sandy and snowstorms
which interrupted travel plans and unseasonal warmer weather in the US in December.
However, the US remained the largest source market commanding a share of 37.5
percent of stay-over arrivals.
Despite the contraction in the UK economy and the dampening effects of the increase in
the Air Passenger Duty (APD) on flights out of the UK coupled with the 2012 Olympics
Games in London, arrivals from the UK performed favourably. UK arrivals grew by 3.6
percent to 75,677, following an increase of 8.4 percent in 2011. This was attributed to a
3.0 percent increase in seating capacity owing in part to the late configuration of the 2011
1 On average, airfares are higher than that to other competitor Caribbean destinations by approximately US$150.

13
daily service from British Airways (BA). Notwithstanding more air seats from the UK
compared with the US, UK arrivals were lower than that of the US by 52.0 percent,
remaining Saint Lucia’s second largest source market.
Economic recession and uncertainty in the euro zone alongside a loss of airlift
adversely impacted arrivals from other European countries. Arrivals from France
contracted by 26.4 percent in 2012 as the direct flights by the chartered XL Airways
which boosted arrivals during January to March of 2011 were discontinued in 2012.
Arrivals from Germany and rest of Europe rose by 4.1 percent and 10.4 percent
respectively, due to a 17.2 percent increase in air seats by Condor Airways during an
extended period of service.
The Caribbean market contracted, amidst an increase of 4.1 percent in air seats, with its
market share declining from 25.6 percent in 2006 to 18.3 percent in 2012. Led by an
almost 20.0 percent decline in arrivals from the French West Indies, arrivals from the
region fell by 4.8 percent to 56,067. This was principally due to high and rising cost of
intra-regional air travel. While the introduction of Caribbean Airlines, year round
service by Air Antilles and the short-lived service from Red Jet enhanced airlift in the
first quarter of 2012, this was partially offset by a steep decline in air seats from LIAT
and Air Caraibes from November 2012.
Arrivals from Canada continued on an upward path, registering its 10th consecutive year
of growth with an annual average increase of 11.2 percent since 2002. Arrivals from this
source market accounted for 12.3 percent of stay-over visitors in 2012, totaling 37,709
and representing an increase of 6.5 percent from the previous year. This was driven by a
5.3 percent expansion in airlift primarily from Transat Tours which offset the losses from
Sunwing charters and other air service providers. The performance of the market was
also attributable to increased marketing efforts by the Saint Lucia Tourist Board (SLTB)
but displays strong seasonality with arrivals peaking in winter months. However, there
were reductions in spending by Canadian visitors in 2012.

14
0
10,000
20,000
30,000
40,000
50,000
0
200,000
400,000
600,000
800,000
200
1
200
2
200
3
200
4
200
5
200
6
200
7
200
8
200
9
201
0
201
1
201
2
Other Tourist Arrivals
Yacht (R.H.S) Cruise
Visitor Expenditure
Despite the decline in arrivals, preliminary estimates indicate that expenditure by land-
based visitors in 2012 increased by 1.8 percent to EC$1,527.0 million. This was on
account of an 8.9 percent increase in the average daily expenditure and longer stays by
visitors from some markets. This was led by a 9.3 percent increase in UK visitor
expenditure and reflect increases in total spending by all other markets with the
exception of the US and Canada. Decreases in the average daily spend and length of stay
resulted in a 1.0 percent decline in expenditure by Canadian visitors. Despite a higher
average daily spend, expenditure by US arrivals fell by 3.1 percent due to lower arrivals
and shorter length of stay.
There were increases in most categories of spending in 2012. Average daily spending on
the dominant component of expenditure, accommodation, grew by 1.1 percent,
suggesting some recovery in hotel room rates at some properties. Marginal decreases
were recorded in food & beverage outside hotels, rentals, groceries, souvenirs and other
shopping.
Cruise & Other Arrivals
The cruise sub-sector continued to be
adversely affected by the
redeployment of some major cruise
lines such as Celebrity, Royal, Princess,
P&O and Holland American away
from the southern Caribbean. As a
result, cruise arrivals declined for the
third consecutive year, falling by 9.3
percent in 2012 to 571,894. The number
of cruise ship calls also fell by 2.9
percent, reflecting significant reductions in the period March to December. It is
estimated that cruise visitor expenditure fell by 9.3 percent to $49.0 million in 2012.
15
Total yacht passenger arrivals at Rodney Bay and Marigot marinas grew by 1.1 percent
to 42,173 in 2012. This was due to substantial increases in November and December
attributed to additional charters from Martinique and hosting of Love Fest in December
2012. Ferry arrivals declined by 29.6 percent as a result of reduced scheduled trips by
Express Des Isles while excursionist fell by 1.4 percent.
CONSTRUCTION AND QUARRYING
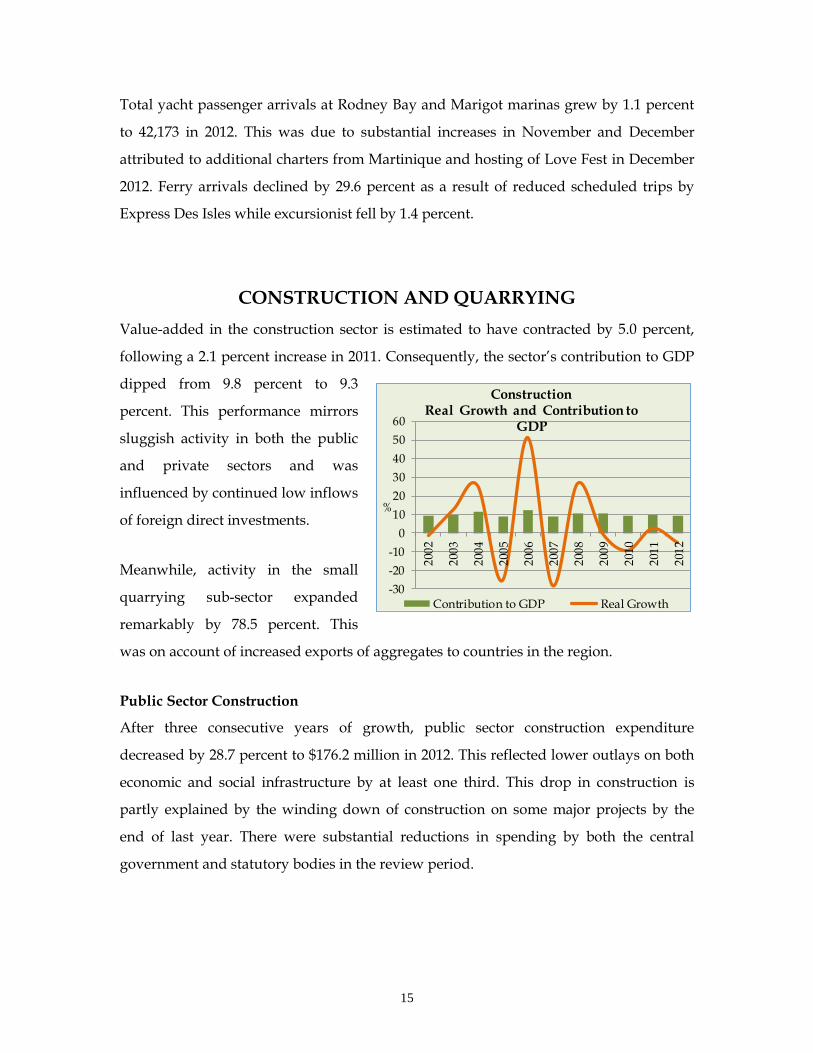
Value-added in the construction sector is estimated to have contracted by 5.0 percent,
following a 2.1 percent increase in 2011. Consequently, the sector’s contribution to GDP
dipped from 9.8 percent to 9.3
percent. This performance mirrors
sluggish activity in both the public
and private sectors and was
influenced by continued low inflows
of foreign direct investments.
Meanwhile, activity in the small
quarrying sub-sector expanded
remarkably by 78.5 percent. This
was on account of increased exports of aggregates to countries in the region.
Public Sector Construction
After three consecutive years of growth, public sector construction expenditure
decreased by 28.7 percent to $176.2 million in 2012. This reflected lower outlays on both
economic and social infrastructure by at least one third. This drop in construction is
partly explained by the winding down of construction on some major projects by the
end of last year. There were substantial reductions in spending by both the central
government and statutory bodies in the review period.
-30
-20
-10
0
10
20
30
40
50
602
002
200
3
200
4
200
5
200
6
200
7
200
8
200
9
201
0
201
1
201
2
%
ConstructionReal Growth and Contribution to
GDP
Contribution to GDP Real Growth

16
Table 3: Summary of Public Sector Construction (EC$ Million)
2008 2009 2010 2011 2012
Economic Infrastructure2
Central Government 45.8 40.8 49.7 122.9 83.8
Statutory Bodies 2.6 3.3 1.9 4.4 5.4
Sub-Total 48.4 44.1 51.6 127.3 89.2
Social Infrastructure
Central Government 20.7 60.6 87.5 111.4 83.8
Statutory Bodies 5.8 5.0 1.3 8.4 3.1
Sub-Total 26.5 65.6 88.8 119.8 86.9
Total Central Government 66.5 101.4 137.2 234.3 167.6
Total Statutory Bodies 8.4 8.3 3.3 12.8 8.5
Grand Total 74.9 109.7 140.4 247.1 176.1
Economic Infrastructure
Public sector spending on economic infrastructure, largely comprising activity by the
central government, fell by 29.9 percent to EC$89.2 million. This was led by reduced
spending on roads and community works. Road and infrastructural development
accounted for the largest share (42.7 percent) of central government construction
expenditure, totaling $71.6 million, albeit 25.3 percent less than in 2011. A sizeable
proportion of this expenditure
represented continued and
completion works on various
projects associated with the
hurricane Tomas recovery
programme such as
rehabilitation of roads, slope
stabilization particularly in the
Barre D’isle and repairs to
damaged bridges and culverts.
Additionally, phase one of the
2 Refers to basic facilities that enable growth.
Table 4: Central Government Construction
Expenditure on Economic Infrastructure 2012
(EC$ Millions)
Central Government, of which: $83.8
Reconstruction and Rehabilitation of Roads $14.5
Community and Agriculture Feeder Roads $9.4
Disaster Recovery Programme $8.5
Slope Stabilization $7.6
Hurricane Tomas Emergency Recovery $6.4
Desilting of Rivers and Drains $5.2
Bridges and Culverts $4.6

17
Kuwaiti-funded Community & Agri-Feeder Roads project was completed, with works
concentrated in the Dennery, Babonneau and Jacmel areas. Rehabilitation of the Anse
Ger/Deruisseaux road and on urban roads continued in 2012.
Meanwhile, capital spending on the agriculture sector fell by almost half and accounted
for 3.6 percent or $6.1 million of the central government’s construction budget. This
mainly included the continuation of works on the meat processing facility at Beausejour
and post hurricane Tomas rehabilitation projects.
In addition, construction of the Finance Administration building by NIPRO commenced
in January with spending up to December amounting to $19.4 million. Other
construction expenditure by statutory bodies increased by $1.0 million due to the
refurbishment by SLASPA of the old WIBDECO building for rented accommodation of
the new VAT unit.
Social Infrastructure
Occasioned by a noticeable reduction in spending on community works, and health to a
lesser extent, total public
expenditure on social infrastructure
fell by 27.4 percent to $86.9 million.
Of this, the central government’s
outlay fell by a similar magnitude
to $83.8 million. This was
dominated by spending on the
health sector which decreased by
9.6 percent to $51.3 million. In 2012,
construction activity continued on
both the New National Hospital
and at the St. Jude Hospital.
Expenditure on community works
declined by $22.3 million to $15.3
million associated with social programs focused on job creation with a construction
Table 5: Central Government Expenditure on
Social Infrastructure in 2012
(EC$ Millions)
Central Government, of which:
$83.8
New National Hospital $34.0
St. Jude Hospital Reconstruction Project $15.2
Labour Absorption Programme (HOPE) $3.4
Disaster Mitigation $2.7
Constituency Development Programme $2.3
Establishment of Human Resource Centres
$2.3
Conway Relocation Phase 2
$1.7
Basic Needs Trust Fund $1.6

18
component such as the labour absorption programme and NICE. There was also lower
spending on capital projects in other areas such as sports, housing and upkeep with the
exception of education.
During the review period, capital expenditure on social infrastructure by statutory
bodies fell to $3.1 million from $8.4 million in 2011/12. Notwithstanding increased
expenditure by NIPRO for the continuation of work on the Babonneau Police Station,
the lower expenditure was attributed to declines in spending by both the National
Housing Corporation and Invest Saint Lucia (formerly NDC).
Private Sector Construction
Preliminary indications suggest that private sector construction remained weak during
2012, as a number of major projects was delayed or failed to commence. As a result,
activity was constrained by construction-related foreign direct investments, which
continued to decline since the start of the global financial crisis.
The majority of the private sector construction activity in 2012 was concentrated mainly
on finishing works on the projects nearing completion. This included the winding down
of works on the Bank of Saint Lucia Building and the Johnson Super Store. New
construction undertaken during the year included works on the S & S Plaza and the
LUCELEC Sub-Station in Cul-de-Sac. Tourism-related construction was dominated by
work on the Sugar Beach Viceroy Hotels and Resort.
Indicators of Overall Construction Activity
Imports of Construction Materials
The total value of imports of construction materials decreased by 12.8 percent in 2012
reflecting the weakness in construction activity. This outturn was associated with a
decline in spending on imports of steel and other construction materials by 17.9 percent
and 23.6 percent respectively. By contrast, the value of cement imports rose by 5.0
percent to $23.4 million compared to a year earlier, partly reflecting higher imported
prices. Similarly, the value of imports of wood and wood products grew by 29.6 percent
to $26.1 million.
19
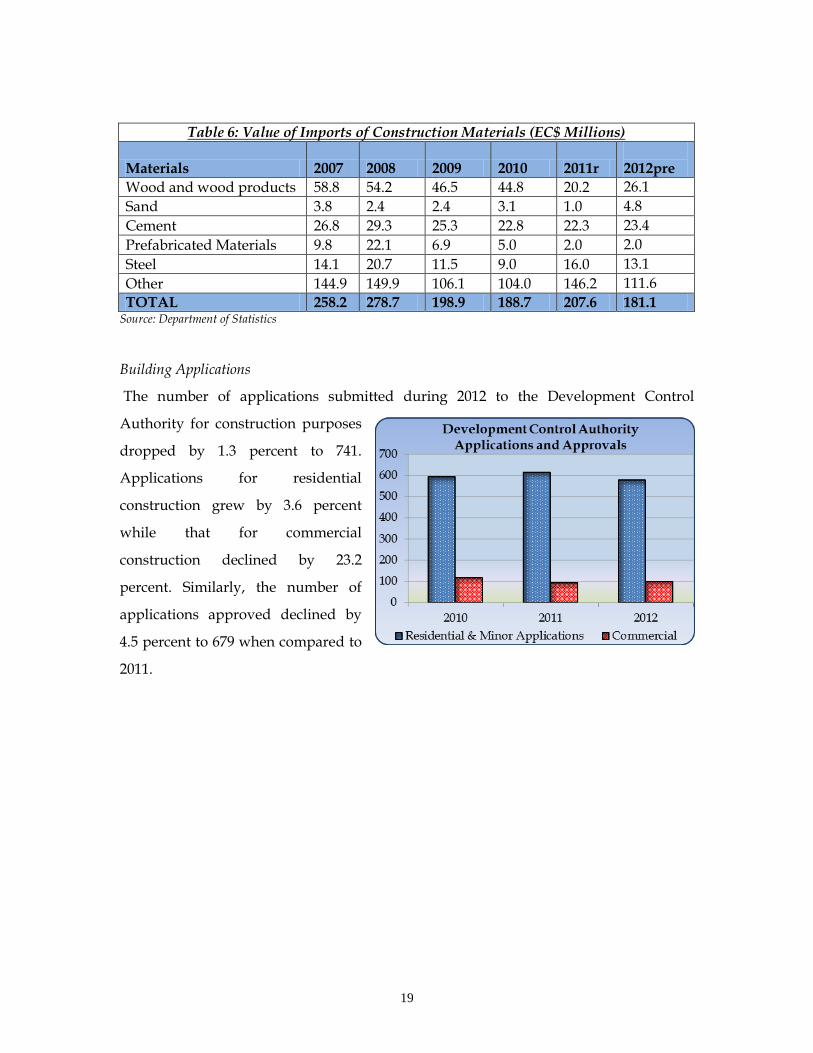
Table 6: Value of Imports of Construction Materials (EC$ Millions)
Materials 2007 2008 2009 2010 2011r 2012pre
Wood and wood products 58.8 54.2 46.5 44.8 20.2 26.1
Sand 3.8 2.4 2.4 3.1 1.0 4.8
Cement 26.8 29.3 25.3 22.8 22.3 23.4
Prefabricated Materials 9.8 22.1 6.9 5.0 2.0 2.0
Steel 14.1 20.7 11.5 9.0 16.0 13.1
Other 144.9 149.9 106.1 104.0 146.2 111.6
TOTAL 258.2 278.7 198.9 188.7 207.6 181.1 Source: Department of Statistics
Building Applications
The number of applications submitted during 2012 to the Development Control
Authority for construction purposes
dropped by 1.3 percent to 741.
Applications for residential
construction grew by 3.6 percent
while that for commercial
construction declined by 23.2
percent. Similarly, the number of
applications approved declined by
4.5 percent to 679 when compared to
2011.

20
MANUFACTURING
Saint Lucia’s manufacturing sector continued to be adversely impacted by the lingering
effects of the global economic crisis and competitiveness issues, manifested in sluggish
domestic and external demand. In addition, the performance of the sector was restrained
by high operating costs, particularly energy, labour and rising imported prices of inputs.
This led to increases in retail prices during 2012. In addition, the closure of the coconut
oil factory in 2011 contributed to
the sector’s outturn in 2012.
Value added is estimated to
remain flat in 2012 after growing
by 4.0 percent in the previous
year.
Production
Preliminary data show that total value of manufacturing production remained relatively
flat, falling by 0.2 percent to $328.2 million in 2012. This performance was attributed to
lower levels of activity in the beverages and paper & paperboard products which
accounted for 50.1 percent of the total value of output in 2012. These were partially offset
by increases in the food and chemicals sub-sectors.
Table 7: Value of Manufacturing Output
Sub-Sectors 2008 2009 2010 2011 2012
Beverages 165.6 140.1 129.91 144.9 142.7
Alcoholic 134.8 109.2 98.2 114.1 104.8
Non-Alcoholic 30.7 30.9 31.7 30.8 37.9
Food 49.8 51.7 52.8 56.8 59.3
Fabricated Metals 34.4 31.2 26.2 27.7 27.1
Chemical Products 26.3 25.4 24.5 25.3 27
Paper and Paper Products 24.1 29.4 24.9 22.3 21.8
Electrical Products 5.6 3.7 5 4.8 4.1
Other 43.1 39.8 47.6 47.2 46.1
Total 348.8 321.4 310.9 328.6 328.2

21
Beverages
The value of production of beverages declined by 1.5 percent in 2012, due to the
unfavourable performance of alcoholic beverages. Owing to significant declines in
distilled and brewed products, the value of output of alcoholic beverages fell by 8.2
percent. This reflected softer domestic demand from the tourism sector as well as a shift
in demand towards cheaper alcoholic beverages in response to price increases. During
the review period, the output of non-alcoholic beverages expanded with an increase in
value by 23.1 percent as output grew in both the water and soft drinks industries. Sales
of mineral water almost doubled, reflecting the stellar performance of an established
enterprise due to increased demand and an improvement in its range of products and
services.
Food
Amidst the challenging environment, the food sub-sector performed creditably in 2012
with a 5.0 percent increase in the value of production. This resulted from growth mainly
in bakery products and to a lesser extent, dairy products. Despite these developments,
growth in the sub-sector was hampered by the closure of the coconut oil factory in the
last quarter of 2011 and higher prices.
Paper and Paperboards
During the review period, there was a 2.6 percent drop in output of paper and paperboards
products, despite the boost in activity stemming from the recovery in the banana
industry. The slowdown in domestic and regional businesses impacted the sub-sector,
evident by the further decline of 10.7 percent in the value of commercial boxes
produced. However, expanded banana production led to a 49.7 percent increase in the
value of banana boxes produced. Similarly, other paper and paperboards grew by 2.4
percent in 2012.
Electrical and Other Products
The closure of a major company in 2011 reduced the total value of electrical items
produced in 2012 by 14.8 percent to $4.1 million. The value of chemicals produced
expanded by 6.7 percent while the value of furniture rose negligibly. Reflective of the

22
downturn in the construction sector, the value of output in the fabricated metal sub-sector
decreased by 2.2 percent. The value of output in the printing & publishing sub-sector
dipped by 0.3 percent. Rubber and plastic products also contracted by 20.3 and 8.5 percent
respectively.
AGRICULTURE
During the review period, the agriculture sector registered strong growth of 8.4 percent,
primarily mirroring post-hurricane
Tomas recovery in the banana industry
and other crops. Value added in the
banana sub-sector expanded by 52.8
percent in 2012, while declines were
recorded in the livestock and other
crops sub-sectors. Government’s
subsidy on critical inputs and its
intervention in disease control contributed positively to the performance of the sector.
Consequently, the sector’s contribution to GDP inched up from 2.9 percent to 3.2 percent
in 2012. The number of persons employed in the sector however declined in the review
period to 7,451 from 7,684.
Bananas
Reflecting the gains from the
replanting efforts following the
passage of hurricane Tomas,
banana production grew by 25.2
percent to 14,984 tonnes. Of this,
banana exports to the United
Kingdom increased by 85.0
percent to 12,126 tonnes,
generating revenue of $21.1 million compared to $13.2 million in 2011.

23
Notwithstanding ongoing challenges, this performance was supported by government’s
assistance to farmers. In an attempt to restore farmers’ confidence in the sector and to
boost production, the government subsidized the price of spray oils, fungicides and
fertilizers to farmers at a total cost of $2.2 million in 2012. In addition, production was
less affected by the black sigatoka disease which was better controlled with the
establishment of the Management Unit in 2012. It is estimated that 950 banana farmers
traded in 2012 down from 1,290 in 2011 while the number of acres under banana
cultivation is estimated at 4,000 down from 4,500 in the previous year.
Supermarket purchases of bananas grew by 2.2 percent to 963 tonnes while the revenue
generated increased by 5.5 percent to $2.0 million.
Other Crops
Preliminary data indicate that in the review period supermarkets purchases of non-
banana crops grew by 4.2 percent to 2,925.2 tonnes. This increase in supply led to a
reduction in unit prices of most crops purchased resulting in revenue generated inching
up by 2.1 percent to $9.2 million from $9.0 million in 2011. Building on the recovery
underway, there were 219 additional farmers who supplied produce to the
supermarkets reflecting the expansion of the CFL certification programme. Increases
were recorded in the purchases of fruit and tree crops (21.0 percent), condiments (19.0
percent), vegetables (15.0 percent), roots and tubers (7.0 percent).
Fisheries
Available data on fish landings indicate an increase in the volume of fish landings by 1.0
percent to 1,709.0 tonnes compared to a decline of 5.9 percent in the previous year.
Accordingly, the estimated value of receipts generated grew by 2.0 percent to $25.3
million. Dolphin, which accounted for 25.9 percent of the total landing, recorded a 5.0
percent increase in the unit price while the unit price of all the other species of fish
dipped.

24
An analysis of the fish landings by species revealed declines in the volume of tuna (18.4
percent), king fish (23.1 percent) and flying fish (83.7 percent). On the other hand,
increases were recorded in the
volume of dolphin, black fish and
other species landed. The volume of
flying fish landed has been declining
steadily in the last five years and in
2012 dropped further to 4.0 tonnes
from a 22.0 tonnes in 2011. This trend
is partly attributable to climatic
conditions which have influenced the
migration patterns of flying fish.
Vieux Fort and Dennery remained the two largest fish landing sites on the island,
accounting for 22.9 percent and 17.9 percent of total fish landings respectively. Fish
landings at Vieux –Fort declined by 1.4 percent to 530.9 tonnes while fish landings at
Dennery grew by 8.9 percent to 306.4 tonnes. Landings at Gros-Islet which comprise
roughly 6.2 percent of the total fish landings, recorded an increase of 44.0 percent to
110.5 tonnes. Declines were recorded at all of the smaller landing sites in 2012.
Livestock
Preliminary estimates show a contraction of 7.0 percent in the livestock sub-sector in
2012. Amidst increasing costs of production, the sector recorded mixed performances as
growth in the broiler and pork industries was offset by a decline in egg production.
Chicken production increased by 2.9 percent to 1,449 tonnes attributable to the
establishment of an additional processing plant as well as improved organization by
broiler producers. During the year, the government guaranteed market share for local
poultry increased to 25.0 percent in October from 20.0 percent, and this expected to
impact positively on output in 2013.

25
Pork production expanded by 2.9 percent to 181.6 tonnes while revenue grew by 1.6
percent to $2.3 million. This outturn was driven by new initiatives undertaken by the
Ministry of Agriculture to increase the stock of pigs and blood line of swine. Building on
these initiatives, CFL increased purchase of pork from local farmers.
Egg production fell by 7.0 percent to 1.2 million dozen eggs. This was partly attributed
to the increase in the price of chicks and feed. The average price of chicks increased to
$3.50 in 2012 from $2.85 in 2011 due to the high air freight associated with the
transportation of the hatchlings. The price of feed continued to increase, reaching $48.00
per 50 pound bag at the end of the year compared to $40.00 in December 2011. In
response to the rising prices, the government subsidized the price of every bag of feed
purchased by farmers in the last quarter of 2012 by $5.00, costing approximately $0.5
million. Notwithstanding these subsidies, the retail price of egg increased to $7.50 per
dozen from $7.00 at the supermarkets.
TRANSPORT
In 2012, value added in the transport sector contracted by 2.5 percent in real terms. This
performance is broadly in line with the developments in the wider economy.
Air Transport
Developments in air transport
were closely linked to the
performance of the tourism
industry.
The total number of aircraft
movements, as measured by
landings and departures, at Saint Lucia’s two airports rose marginally by 0.3 percent to
36,673. This was due to increased aircraft traffic at the G. F.L. Charles Airport which was
0.7 percent higher than in 2011 and accounted for 63.2 percent of total aircraft
26
movements in 2012. The introduction of daily flights by Caribbean Airlines to Trinidad
in February and year round flights from Air Antilles contributed to the increased aircraft
activity, notwithstanding the cessation of services by American Eagle in August and
reduced flights by LIAT and Air Caraibes.
In contrast, aircraft movements at the Hewanorra International Airport (HIA) dipped by
0.2 percent to 13,492. This was mainly on account of the loss of flights from New York
and a reduction in the number of weekly scheduled flights from Miami by American
Airlines. There were also losses of flights from Sunwing out of Canada and XL Airways
out of Europe. These were partly offset by increased aircraft movements from some
other service providers, such as Jet Blue, British Airways and Transat Tours out of
Canada.
Consequently, the number of passengers handled at both airports grew by 0.4 percent to
783,193. This was as a result of a 1.9 percent increase in passenger traffic at the HIA to
557,051. However, passenger throughput at the G. F.L. Charles Airport decreased by 3.0
percent to 226,142 in 2012.
Combined air cargo handled at the two airports fell by 2.5 percent to 2.7 million
kilograms. Cargo handled at G.F.L. Charles Airport rose by 4.3 percent to 1.4 million
kilograms whereas HIA posted a reduction of 8.7 percent to 1.3 million kilograms.
Sea Transport
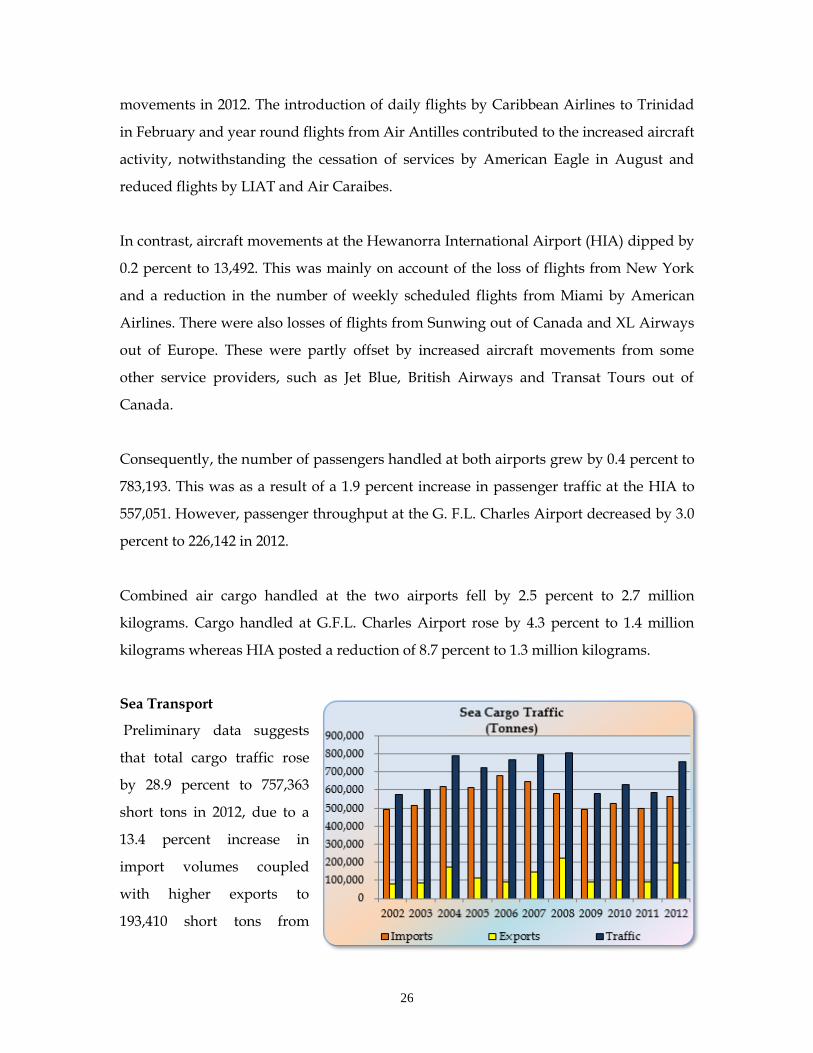
Preliminary data suggests
that total cargo traffic rose
by 28.9 percent to 757,363
short tons in 2012, due to a
13.4 percent increase in
import volumes coupled
with higher exports to
193,410 short tons from

27
90,606 tons in 2011. This uptick in both import and export cargo is associated with
increased transshipment activity, particularly at Port Castries. However, total cargo
traffic related to domestic activity (excluding transshipments) remained flat at 580,529
short tons in 2012. The volume of domestic imports fell by 3.6 percent to 475,446 short
tons while exports grew by 21.1 percent to 105,083 short tons.
Shipping activity during the review period remained concentrated at Port Castries,
which handled on average 78.3 percent of total cargo throughput. Total cargo handled at
Port Castries grew by 31.1 percent to 593,176 short tons, led by an almost three-fold
increase in export volumes. This was due to a considerable increase in the quantity of
transshipped container cargo, from 7,034 to 172,833 short tons, as some goods were
diverted to Port Castries due to technical difficulties encountered at Port Vieux-Fort
during some months of the year. Domestic cargo landed at Port Castries fell by 6.4
percent while domestic exports loaded grew by 5.0 percent to 1,272 short tons.
ENERGY
Global Developments
During 2012, oil prices fluctuated but remained high with dampening effects on oil
importing economies such as Saint Lucia. In 2012, the annual average international oil
prices, as captured by the West Texas Intermediate (WTI), fell by 1.0 percent to US$94.21
per barrel. This resulted from an expansion in supply which outpaced the decelerated
pace of growth in oil demand from both advanced and developing countries.
Notwithstanding, in the first
quarter of 2012, oil prices went up
by 9.4 percent to US$102.90 per
barrel, occasioned by concerns
about potential supply
disruptions due to the shutdown
in South Sudan and sanctions
imposed by the EU and the US on

28
Syrian and Iranian exports. However, weak demand coupled with increased output
from Saudi Arabia and the resumption of Libya’s production, weighed down on prices
at levels below US$95 per barrel.
Domestic Developments
In 2012, the Government of Saint Lucia implemented policy measures to cushion the
adverse impact of high and volatile fuel prices on consumers. In order to smooth the
variations in prices, as of May 2012, domestic fuel prices were adjusted every three
months under the modified market-pass-through system rather than monthly. The
excise tax rates on fuel products varied throughout the year, averaging $1.63 and $2.29
per imperial gallon of unleaded gasoline and diesel respectively.
Moreover, government continued to subsidize the 20 pound cylinder of cooking gas
(liquefied petroleum gasoline, LPG), with the subsidy averaging $17.64 per cylinder in
2012 compared to $13.68 in the previous year. However, as of September, the subsidy on
kerosene was eliminated.
Electricity
In accordance with the trends in international oil prices, the average price of diesel paid
by the Saint Lucia Electricity Services Ltd (LUCELEC) in 2012 for its generation of
electricity went up by 4.3
percent to $10.59 per imperial
gallon, albeit lower than the
35.5 percent increase in 2011.
Conversely, reflective of
LUCELEC’s price hedging
programme, the average fuel
surcharge3 moved to 6.63
cents in 2012 from 11.31 cents
in 2011.
3 The fuel surcharge is the difference between the current world market prices and the base price (which is equal to the
average of the preceding 12 months) expressed over the total sales of a given month (in cents per KWh).
29
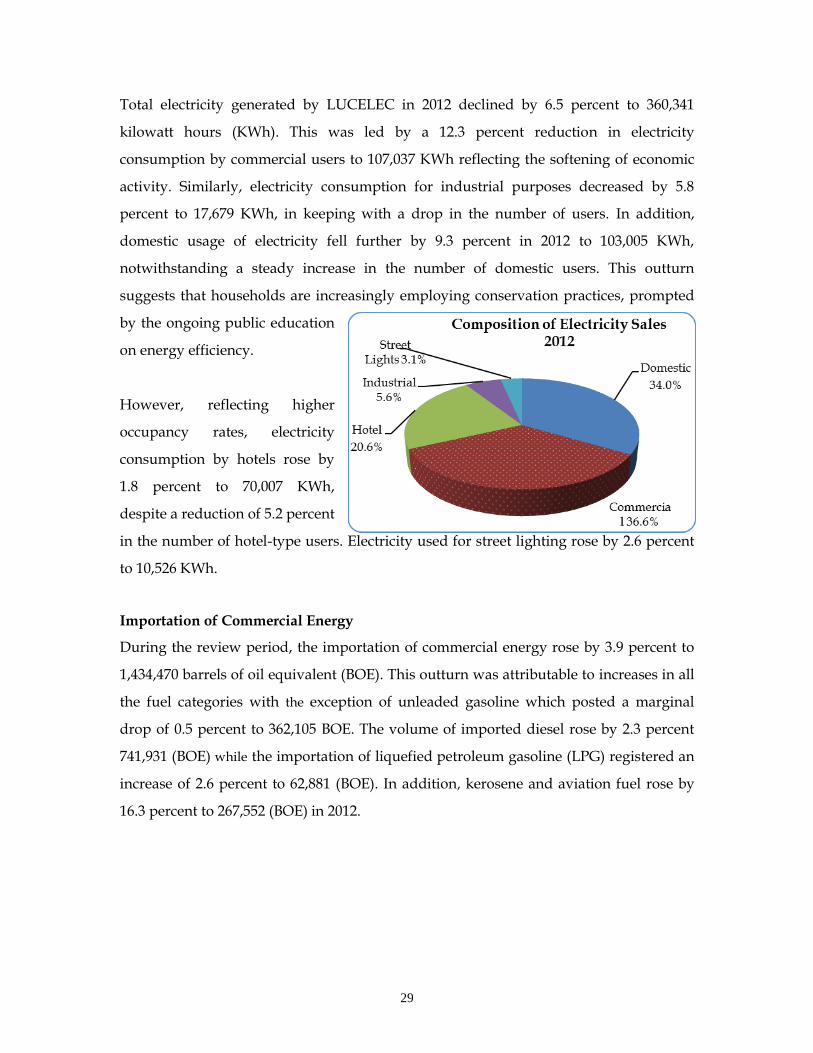
Total electricity generated by LUCELEC in 2012 declined by 6.5 percent to 360,341
kilowatt hours (KWh). This was led by a 12.3 percent reduction in electricity
consumption by commercial users to 107,037 KWh reflecting the softening of economic
activity. Similarly, electricity consumption for industrial purposes decreased by 5.8
percent to 17,679 KWh, in keeping with a drop in the number of users. In addition,
domestic usage of electricity fell further by 9.3 percent in 2012 to 103,005 KWh,
notwithstanding a steady increase in the number of domestic users. This outturn
suggests that households are increasingly employing conservation practices, prompted
by the ongoing public education
on energy efficiency.
However, reflecting higher
occupancy rates, electricity
consumption by hotels rose by
1.8 percent to 70,007 KWh,
despite a reduction of 5.2 percent
in the number of hotel-type users. Electricity used for street lighting rose by 2.6 percent
to 10,526 KWh.
Importation of Commercial Energy
During the review period, the importation of commercial energy rose by 3.9 percent to
1,434,470 barrels of oil equivalent (BOE). This outturn was attributable to increases in all
the fuel categories with the exception of unleaded gasoline which posted a marginal
drop of 0.5 percent to 362,105 BOE. The volume of imported diesel rose by 2.3 percent
741,931 (BOE) while the importation of liquefied petroleum gasoline (LPG) registered an
increase of 2.6 percent to 62,881 (BOE). In addition, kerosene and aviation fuel rose by
16.3 percent to 267,552 (BOE) in 2012.

30
PRICES
Despite moderation in the rate of increase in consumer prices in the global economy,
inflationary pressures in the domestic economy were elevated during the review period.
The rate of inflation in Saint
Lucia increased to 4.2 percent in
2012, as measured by the twelve
month moving average, up
from a rate of 2.8 percent in
2011. The point-to-point rate of
inflation at the end of December
increased to 5.0 percent in 2012,
up from 4.8 percent one year earlier.
The inflation outturn was influenced by a confluence of external and domestic factors.
This included higher international food prices in the first half of 2012 partly off-set by a
1.1 percent decline in world oil prices which filtered into the domestic economy through
higher import prices. The rate of inflation in trading partner countries subsided to 2.0
percent in 2012 from 2.7 percent in 2011. Domestically, the implementation of VAT in
October 2012 exerted temporary upward pressure on prices in the last quarter of 2012.
Increases were registered in all sub-indices with the exception of education. Food prices
which grew by 6.5 percent, contributed most significantly to the overall increase in the
consumer price index in 2012. Reflective of increases in import prices, increases were
recorded in the cost of all sub-categories of food except vegetables, coffee and tea.
Notwithstanding the exemption of over one hundred food items from the value added
tax, there were notable increases in the prices of meats, oils and fats (8.6 percent), milk,
cheese and egg (8.1percent) and fish and sea food (7.8 percent).
Other notable contributors to the overall increase in inflation were the transport and
alcoholic beverages, tobacco & narcotics sub-indices. Continuing on an upward path, the
cost of transport grew by 3.9 percent, resulting from increases in the prices of spare

31
parts, maintenance and repair of personal transport equipment or trucking equipment.
The price index for furnishings, household equipment and maintenance also increased
by 3.9 percent after declining by 6.3 percent in the previous year.
Despite government’s attempt to maintain the effective tax rate after the introduction of
the VAT, the price of alcoholic beverages rose by 6.5 percent due to higher inputs costs
of production. The steep increase in the prices of tobacco products was driven by
increased excise taxes on cigarettes which moved to $176 per 1,000 sticks from $125.60
per kilogram in the last quarter of the year. These developments pushed up the price
index for alcoholic beverages, tobacco & narcotics by 6.9 percent.
The most pronounced increase (13.0 percent) was recorded for the clothing & footwear
sub-index due to higher import prices of clothing items. The recreation & culture sub-
index grew by 10.8 percent on account of notable increases in information processing
and audio-visual equipment, partly due to tax rate changes as a result of the VAT and
the implementation of HS 2007 in October 2012. This also reflected increases in the cost
of cinema tickets and other entertainment services which were previously untaxed.
Moderate increases were recorded for housing, water, electricity, gas &other fuels (1.3
percent), restaurant and hotel (2.1 percent) and communication (2.4 percent) while the
education sub-index recorded a decline of 1.9 percent.
32
CHAPTER FOUR
CENTRAL GOVERNMENT FISCAL OPERATIONS
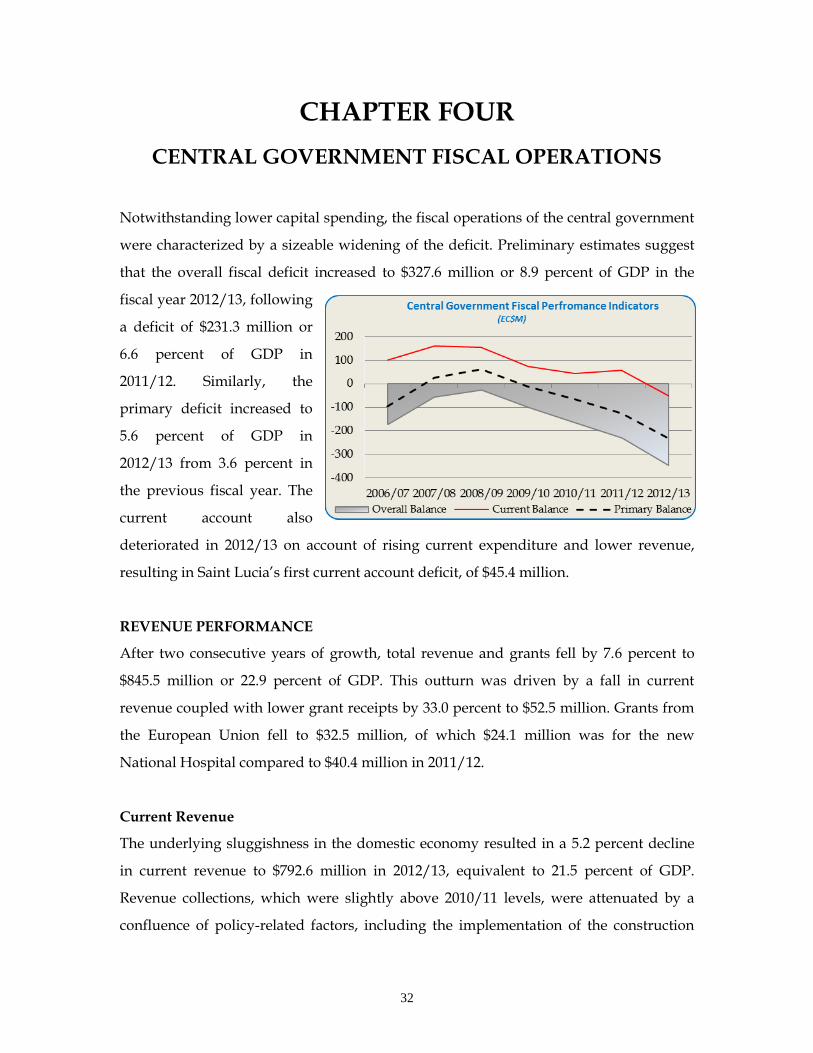
Notwithstanding lower capital spending, the fiscal operations of the central government
were characterized by a sizeable widening of the deficit. Preliminary estimates suggest
that the overall fiscal deficit increased to $327.6 million or 8.9 percent of GDP in the
fiscal year 2012/13, following
a deficit of $231.3 million or
6.6 percent of GDP in
2011/12. Similarly, the
primary deficit increased to
5.6 percent of GDP in
2012/13 from 3.6 percent in
the previous fiscal year. The
current account also
deteriorated in 2012/13 on account of rising current expenditure and lower revenue,
resulting in Saint Lucia’s first current account deficit, of $45.4 million.
REVENUE PERFORMANCE
After two consecutive years of growth, total revenue and grants fell by 7.6 percent to
$845.5 million or 22.9 percent of GDP. This outturn was driven by a fall in current
revenue coupled with lower grant receipts by 33.0 percent to $52.5 million. Grants from
the European Union fell to $32.5 million, of which $24.1 million was for the new
National Hospital compared to $40.4 million in 2011/12.
Current Revenue
The underlying sluggishness in the domestic economy resulted in a 5.2 percent decline
in current revenue to $792.6 million in 2012/13, equivalent to 21.5 percent of GDP.
Revenue collections, which were slightly above 2010/11 levels, were attenuated by a
confluence of policy-related factors, including the implementation of the construction

33
stimulus package, VAT and downward adjustments to the excise tax rates. While this
performance was led by a significant decline in non-tax revenue, there was also a
noticeable decrease in tax revenue in the review period.
Taxes on Income and Property
Tax revenue on income and profits which accounted for 28.1 percent of current revenue
in 2012/13, fell by 7.6 percent to
$222.6 million. This outturn was
primarily due to considerably
lower collections of corporate
income taxes. Reflecting weak
business profits, particularly in
the banking sector, corporate
income tax receipts declined by
17.2 percent to $76.6 million.
Despite the amnesty effected in January 2012, collections of tax arrears decreased by $3.6
million to $37.2 million. There were reduced receipts of tax arrears arising out of the
forensic audits conducted by the Inland Revenue Department. During the 2012/13 fiscal
year, the rate of increase in tax receipts on individuals (PAYE) slowed to 0.3 percent to
$91.2 million, partly due to an increase in the personal income tax threshold in the last
quarter by $1,000 to $18,000, effective January 2013. Revenue from withholding taxes
grew by 3.6 percent to $26.2 million. Property tax continued to under-perform,
notwithstanding an uptick in collections to $4.9 million from $4.4 million in 2011/12.
Taxes on Goods and Services
Tax receipts from goods and services rose further by 24.4 percent to $164.8 million in
2012/13 driven mainly by collections from VAT. Following the introduction of VAT on
October 1, 2012, gross VAT revenue from domestic goods and services totaled $63.6
million, during the period November 2012 to March 2013. Correspondingly, collections

34
from the taxes replaced by VAT fell, reflecting collections predominantly in the first half
of the fiscal year.
Taxes on International Trade and Transactions
In keeping with the decline in the value of imports, tax revenue on international trade
fell to $355.0 million from $386.7 million in 2011/12. Revenue from VAT, which replaced
the environmental protection levy and consumption tax on imports in October, totaled
$65.9 million, net of refunds, in the second half of 2012/13. Net excise tax receipts from
petroleum products fell by $10.0 million due to lower rates on gasoline and diesel
alongside an increase in the subsidy on the 20 pound cylinder of cooking gas. The
average excise tax rate on gasoline was reduced to $1.53 from $2.39 per imperial gallon
while that for diesel fell to $2.21 per gallon from $2.67.
Tax waivers on selected building materials associated with the construction stimulus
package, which became effective in August 2012, notably reduced collections of revenue
from import duty and service charge. Import duty receipts, also affected by the
migration to the HS 2007 customs tariff classification and suspensions of the tariff on a
list of pharmaceutical items, declined by 6.9 percent to $98.7 million. Revenue from
service charge also fell by 1.4 percent to $68.2 million reflecting the underlying decline in
imports.
Non-Tax Revenue
The intake from non-tax revenue in 2012/13 totaled $45.5 million compared to $71.4
million in the previous fiscal year, mainly due to a one-off receipt from interest received
in 2011/12. Receipts from ECCB profits also decreased to $0.7 million in 2012/13 from
$2.0 million in 2011/12.
EXPENDITURE PERFORMANCE
Preliminary data indicates that total expenditure by the central government continued
on an upward path, increasing by 2.3 percent to $1,173.2 million or 31.8 percent of GDP
in 2012/13. This was occasioned by an expansion in current expenditure which was
partially offset by a decline in capital expenditure by almost $35.0 million.

35
Current Expenditure
Current expenditure is estimated to have increased by 7.9 percent to $838.2 million or
22.7 percent of GDP, driven by higher spending in all sub-categories, led by the
increased outlay on goods and services.
Goods and Services
As a result of notable increases
in most expenditure heads,
spending on goods and services
rose by 15.6 percent to $171.1
million in 2012/13. Most
significantly and partly
reflecting outstanding prior
year’s bills, expenditure on utilities grew by 24.3 percent to $32.3 million and
communications increased to $14.9 million from $9.6 million. Additional office spaces
for new government offices, resulted in an increase in rental expenses by 14.8 percent to
$34.8 million.
Interest Payments
Reflecting the increase in the
central government’s outstanding
debt, interest payments rose by
17.1 percent in 2012/13 to $121.2
million. Interest on foreign and
domestic debt grew by 14.2
percent and 19.0 percent
respectively.
Current Transfers
The increase in current transfers of 7.7 percent to $189.0 million was principally due to
larger contributions to public institutions which rose by 13.0 percent. The increase in
subventions largely includes supplementary transfers to the Castries City Council and
36
St. Jude Hospital. In addition, spending on subsidies increased by $6.5 million in
2012/13 to $30.2 million. Subsidies on bulk food items sold by the government’s Supply
Department continued to escalate, costing $19.0 million in 2012/13, owing to rising
import prices and unchanged selling prices. In addition, $2.0 million was paid to the
National Council on Public Transportation (NCOPT) as rebates for higher fuel prices.
Salaries and Wages
In keeping with additional persons employed, total salaries and wages, which accounted
for 42.9 percent of current expenditure, increased by 2.1 percent to $356.9 million in the
2012/13 fiscal year. The increase in employment includes the establishment of new units
such as the VAT office and the judiciary unit, set up for the protection of judges, as well
as new police recruits and nurses. The rise in spending on salaries and wages was also
driven by a $7.2 million retroactive payment up from the $4.8 million in 2011/12, mainly
reflecting outstanding balances paid to top management.
CAPITAL EXPENDITURE
Spending on capital programmes declined to $335.0 million in 2012/13 from $369.0
million, representing 9.1 percent of GDP. Expenditure was concentrated on
infrastructural rehabilitation and expansion as well as increased spending on social
programs aimed at reducing unemployment.
Capital expenditure comprised largely of projects and investment programmes
undertaken by the Ministry of Infrastructure, the Ministry of Health and Ministry of
Tourism, as shown below. Hurricane Tomas-related expenditure accounted for
approximately $45.5 million of total capital expenditure.

37
Table 8: Central Government Capital Expenditure
Main Projects/Programmes – 2012/13
Project Title EC$ Millions
Tourism Marketing Promotion $45.0
National Hospital $29.2
St. Jude Hospital Reconstruction Project $20.4
NICE $18.7
Reconstruction and Rehabilitation of Roads $15.9
Community and Agriculture Feeder Roads $11.3
Constituency Development Program $8.2
Slope Stabilization $7.7
Bridges & Culverts $7.1
Disaster Recovery Programme $6.7
Desilting of Rivers & Drains $7.1
STEP $6.0
Hurricane Tomas Emergency Recovery Project $5.0
Of the total capital expenditure, $52.5 million was financed by grants, largely from the
European Union for the continuation of works on the new National Hospital. Proceeds
from bonds remained the dominant source of capital expenditure, accounting for almost
80.0 percent of the total. Bond financing is estimated at $264.8 million mainly to finance
the capital budget.
PUBLIC DEBT
Saint Lucia’s public debt increased by 11.4 percent to $2,531.3 million at the end of 2012
equivalent to 71.1 percent of GDP, owing to a steady increase in central government
debt. On the other hand, government guaranteed debt and non-guaranteed debt
continued to decline, falling by 12.0 percent to $106.1 million and by 16.4 percent to
$58.3 million respectively.

38
In keeping with its widening
overall fiscal deficit, the central
government’s debt grew by 13.6
percent to $2,366.8 million,
representing 68.4 percent of GDP.
The increase of $283.9 million in
2012 was sourced mainly by
borrowing from domestic investors,
largely to fund on-going projects. This resulted in a larger stock of domestic debt by 22.3
percent to $1,266.8 million, which accounted for 53.5 percent of total central government
outstanding debt. During the review period, the central government’s external debt also
increased, albeit at a slower pace of 5.1 percent to $1,100.0 million. The maturity profile
of the central government’s debt indicates that 53.4 percent of the outstanding debt has
short to medium term maturities of less than five (5) years while 22.6 percent have
maturities of over ten (10) years.
In the review period, the composition of debt by financial instrument was relatively
unchanged compared to 2011. Bonds, including treasury notes, represented the largest
source of debt financing, accounting for 52.4 percent of the central government’s debt
portfolio. The stock of debt in the form of loans grew by 7.0 percent and comprised 43.1
percent of the central’s government debt while the share of treasury bills in the portfolio
remained unchanged at 10.9 percent.
Table 9: Weighted Average Cost of Debt
2006 2007 2008 2009 2010 2011 2012
Bonds 7.28% 7.25% 7.17% 7.26% 7.20% 7.26% 7.00%
Loans 5.26% 4.85% 4.24% 3.86% 3.49% 2.79% 3.46%
Treasury Bills 4.18% 4.30% 5.73% 5.04% 5.48% 5.45% 5.05%
WACD 5.87% 5.74% 5.77% 5.55% 5.54% 5.48% 5.50%
39
The weighted average cost (WACD) of the central government’s debt increased by two
basis points in 2012 to 5.50 percent, pushed up by larger borrowings from domestic
commercial banks. The average market interest rates on both bonds and treasury bills
fell in the review period when compared to 2011. This reflected government’s debt
management strategy of minimizing its cost of financing by issuing multi tranche
treasury bills and notes with varying interest rates and maturities.
Debt Servicing
The central government’s total debt service payments increased by 13.5 percent to $218.0
million in 2012. Interest payments grew from $100.2 million in 2011 to $124.5 million in
2012 and accounted for 57.1 percent of the debt service payments. This was driven by
increase in the stock of bonds by $73.4 million to $886.5 million. Principal repayments
grew by 1.7 percent to $93.5 million, attributed to the payment on non RGSM external
bonds. At the end of the year, the ratio of debt service to current revenue increased to
27.5 percent from 23.5 percent in the previous year. The ratio of external debt servicing
to exports of goods and services also increased to 13.9 percent from 12.4 percent
Domestic Debt
The domestic debt of the public sector increased by 18.7 percent to $1,363.9 million in
2012. This reflected the $230.8 million increase in the domestic debt of the central
government which accounted for 92.9 percent of total domestic debt. The central
government issued a combination of bonds, treasury notes and bills on the RGSM as
well as in private placements with a local commercial bank. In contrast, domestic
government guaranteed and non-guaranteed debt both fell, by 9.8 percent and 16.4
percent respectively.
External Debt
The stock of the public sector’s external debt grew by 3.8 percent to $1,167.3 million and
accounted for 46.1 percent of the official public debt. This was driven by a 5.1 percent
increase in the central government’s external debt to $1,100.0 million which offset the
13.2 percent decline in the stock of government guaranteed external debt.

40
External Debt by Creditor
The majority of the increase in the outstanding external public debt in 2012 was issued
in the form of market instruments by the central government. The stock of treasury bills
and notes grew by $61.9 million to $104.3 million while there was little movement in the
stock of bonds held by external creditors. As a result the share of Treasury bills
increased markedly to 5.8 percent of central government external debt in 2012, from 1.4
percent in 2011.
At the end of 2012, concessional debt from multi-lateral institutions declined by 1.3
percent to $654.4 million and accounted for 56.1 percent of the outstanding public
external debt. Of this, $325.2 million is owed to the Caribbean Development Bank, Saint
Lucia’s single largest creditor.
Outstanding debt to the World Bank
dipped by 2.4 percent to $215.0 million
while outstanding amounts to the IMF
remained unchanged at $51.2 million.
However, the stock of bilateral debt
increased by $12.4 million to $61.3
million as a result of additional
borrowing from Kuwait. This reflected
disbursements from Kuwait of $20.0
million for the continuation of the agricultural feeder roads project.
External Debt by Currency
Reflective of government’s continued attempt to minimise exchange rate risks, the
currency composition of the government’s external debt remained relatively unchanged
compared to 2011. A significant proportion (77.5 percent) of total external public debt,
influenced by the structure of central government debt, was denominated in currencies
with fixed exchange rates, namely the US dollar and the Barbados dollar. The remainder
was largely contracted in SDRs, followed by Kuwaiti dinars and euros.

41
CHAPTER FIVE
MONETARY DEVELOPMENTS
The monetary and financial system, though remaining sound, exhibited some signs of
continued weakness and stress. The banking system was characterized by weak demand
for new credit, moderate growth in deposits and rising loan delinquencies reflecting the
sluggishness of economic activity. However, generally, financial conditions remained
healthy and stable with adequate levels of liquidity and capitalization well within
prudential norms.
Value added in the financial sector grew moderately by 1.4 percent in 2012, after posting
growth of 2.3 percent in the
previous year. It is estimated that
value added in the banking sub-
sector increased by 2.2 percent
while a contraction of 1.7 percent
was registered for the insurance
services during the year.
Foreign Assets
Notwithstanding a moderate
increase in imputed reserves, the net foreign liability position of the banking system in
Saint Lucia increased by 17.8 percent to $582.6 million during 2012, reflecting a higher
liability position of commercial banks. Commercial banks net external liabilities rose by
13.1 percent to $1,139.1 million as they continued to borrow from their overseas head
offices and from other branches within the ECCU region. However, reflecting increases
in Saint Lucia’s imputed share of foreign assets accumulated by the Eastern Caribbean
Central Bank, foreign reserves rose by 8.6 percent to $556.4 million at the end of 2012.

42
Money Supply
After increasing by 6.7 percent in 2011, growth in total monetary liabilities, M2 (also
known as broad money) slowed to 2.5 percent in 2012 to $2,798.5 million. This was on
account of smaller expansions in both quasi money and narrow money (M1). Quasi
money grew at a decelerated pace of 2.1 percent to $2,097.5 million, slowed down by a
reduction in the stock of time deposits. The fall in time deposits may have reflected
reductions in interest rates on time deposits. However, private sector savings deposit
was up by 3.9 percent as persons may have switched from time to savings deposits.
Domestic Credit
Following a 6.0 percent increase in the previous year, net domestic credit expanded by a
further 8.5 percent to $3,903.5 million mainly reflecting a 16.4 percent increase in
household credit The increase reflects a reclassification of the loan portfolio of ECFH’s
Mortgage and Finance Company to that of Bank of St Lucia in mid-2012. However, the
underlying increase in household credit was about 3.0 percent, in line with that of the
previous year. Business credit also expanded, growing by 2.3 percent.
Net credit to the government increased considerably as the central government moved
from a net deposit position of $0.8 million in December 2011 to a net credit position of
$167.3 million at the end of 2012. This resulted from the financing of the central
government’s budget deficit through a combination of a drawdown on its deposits from
the banking system by $49.9 million and investment by commercial banks of $118.0
million of its newly issued government securities.
Commercial Bank Credit by Economic Activity
The stock of personal loans, which accounted for 35.1 percent of outstanding credit at
the end of 2012, grew by 18.6 percent to $1,556.6 million reflecting the large increase in
household credit. This was on account of a 37.9 percent increase in credit for acquisition
of property, primarily reflecting the inclusion of the portfolio of ECFH’s Mortgage
Finance Company into that of Bank of St. Lucia. However, when discounted, credit for
acquisition of property grew by 3.3 percent in 2012, partly spurred by mortgage subsidy
associated with the recently launched construction stimulus package.

43
During the review period, there was a marked increase of $103.7 million in lending to
the public sector, reflecting bank financing of part of the central government’s fiscal
deficit. Loans to the professional & other services sector rose by 9.1 percent. Other
notable expansions were recorded in credit to the distributive trades and manufacturing
sectors which grew by 3.8 percent and 6.6 percent respectively.
Consistent with other indicators suggesting a contraction in the sector, credit for
construction and land development contracted by 8.8 percent. Outstanding credit to the
tourism sector decreased by 0.7 percent to $773.98 million as no new major investment
was undertaken in the sector in 2012.
Liquidity and Interest Rates
Despite large impaired assets, there was ample liquidity within the banking system
during the review period. One measure of liquidity, the loans to deposit ratio, increased
by 5.2 percentage points to 119.2 percent, as reported growth in loans and advances
outpaced growth of 4.5 percent in deposit liabilities to $3,721.5 million. While this ratio
suggests a tightening of liquidity, this was distorted by strong growth of 9.3 percent in
total loans and advances by commercial banks due to an expansion in coverage of loans.
However, another measure of liquidity, liquid assets to total deposits, showed an
increase by 0.5 percentage points to 20.1 percent. Similarly, cash reserves to total
deposits increased from 8.38 percent to 9.55 percent in 2012, indicative of increased
liquidity in the banking system. The excess cash reserves/liquidity ratio also increased
by 18.6 percent to $70.9 million in 2012.
Interest rates on both deposits and credit declined marginally during the year, in April
and October, resulting in slightly smaller spreads. The weighted average deposits rate
dipped by 0.14 percentage points to 2.93 percent, reflecting a decline in rates on time
deposits to 3.98 percent from 4.25 percent at the end of 2011. Similarly, the weighted
average rates on savings deposits moved down to 3.24 percent at the end of 2012 from
3.31 percent. At the end of 2012, the weighted average lending interest rates was lower
by 0.54 percentage points to 8.51 percent, as banks sought to attract bankable projects by

44
lowering their rates. The rates on residential mortgages was as low as 6.99 percent,
reflecting the subsidized rates on mortgages for new construction which came into effect
in the second half of 2012. Other rates remained largely unchanged.
Commercial Bank Performance
During the review period, the domestic banking system continued to experience a
myriad of challenges, given the sluggishness of economic activity. These include
elevated credit risks, declining asset quality in their loan portfolios, particularly for
indigenous banks, and the underlying slow credit growth. The ratio of non-performing
loans to total loans continued to increase, reaching 15.3 percent at the end of 2012
compared to 13.2 percent in December 2011, among the highest in the ECCU.
Consequently in 2012, banks increased their provisioning for bad debt by 32.7 percent to
$256.8 million. These factors resulted in a further dampening of bank profitability in
2012.

45
CHAPTER SIX
EXTERNAL SECTOR
TRADE AND BALANCE OF PAYMENTS
Overall Balance
The balance of payments is estimated to have recorded an overall surplus of $44.1
million in 2012, representing 1.3 percent of GDP. This outturn largely reflected an
improvement in the current account deficit which was fully financed by the surplus on
the capital and financial account, albeit lower than in 2011. As a result, Saint Lucia’s
share of imputed reserves at the ECCB increased further by 8.6 percent to $556.4 million
at the end of 2012.
Current Account
After rising to $657.9 million or 18.8 percent of GDP in 2011, the external current account
registered a smaller deficit of $545.2 million in 2012, equivalent to 15.3 percent of GDP.
This performance was led primarily by improvements in the goods and services account
due to weaker import demand and increased visitor expenditure respectively. On the
contrary, the deficit on the income account widened while the surplus on the transfers
account was lower in the review period.
Merchandise Trade
Preliminary data suggest that
Saint Lucia’s merchandise trade
deficit narrowed to $1,140.9
million from $1,226.7 million.
This represented a drop to 32.1
percent of GDP in 2012 from 35.1
percent of GDP in 2011. This
outturn was principally

46
occasioned by a decline in the value of total imports. Notwithstanding, the total value of
exports is estimated to have fallen due to a sharp fall in re-exports.
Imports
In the review period, the total value of imports contracted by 5.6 percent to $1,782.7
million, reflecting the contraction in the domestic economy. Declines were recorded in
both consumer and capital goods while the value of intermediate goods remained
relatively flat.
The value of consumer goods, which on average accounts for approximately half of total
imports, fell by 9.1 percent to $878.8 million in 2012. There were decreases in all sub-
categories with the exception of food and live animals, the value of which increased by 1.3
percent to $360.2 million. This was largely due to higher international prices particularly
of cereals, corn and soybeans associated with weather-related events. Payments for
imports of miscellaneous manufactured articles contracted by 18.8 percent, partly driven by
a drop in imports of
construction materials,
furniture and clothing. As
a result of weaker demand,
manufactured goods classified
chiefly by material dropped
by 9.9 percent to $233.5
million while imports of
beverages and tobacco
contracted for the third consecutive year, falling by 19.3 percent to $65.1 million.
The value of imports of intermediate goods rose by 0.7 percent to $461.8 million. This
was driven by an increase in imports of mineral fuels, lubricants and related materials
owing to increases in oil prices. However, the cost of imports of crude materials, inedible
except fuels and chemicals and related products fell by 12.7 percent and 6.9 percent
respectively associated with reductions of imports of some items of building materials.

47
Imports of capital goods fell by 4.7 percent to $442.1 million, as outlays on machinery and
transport equipment as well as miscellaneous articles dropped. This was attributed to lower
spending on imports of motor vehicles, electrical and telecommunications items.
Other Current Account Developments
The surplus on the services account grew by 9.0 percent to $518.8 million (14.6 percent of
GDP) following a 6.0 percent contraction in 2011. This was attributed to a substantially
reduced deficit on business services and a recovery in tourism receipts by 1.8 percent in
2012. Net payments for transportation and insurance services were also lower, reflecting
in part lower economic activity during the year.
However, increased outflows of investment income as a result of higher interest
payments on government foreign debt led to a wider deficit on the incomes account by a
third to $56.2 million (1.6 percent of GDP). Negligible current receipts by government
contributed to a smaller surplus on the current transfers account to 1.3 percent of GDP in
2012 from 1.5 percent in 2011.
Capital and Financial Account
Estimates indicate a smaller combined surplus on the capital and financial accounts
from 19.9 percent of GDP in 2011 to 15.4 percent of GDP. This reflected a significantly
lower surplus on the financial account by 19.0 percent. In addition, reflective of lower
grant receipts from other governments, the capital account surplus contracted by 34.9
percent to 1.6 percent of GDP.
Continued external borrowing, albeit at a slower pace, by commercial banks and the
government contributed to a drop in the surplus on the financial account to 13.8 percent
of GDP in 2012 from 17.3 percent of GDP in 2011. There was also a considerable
reduction in the net inflows of commercial banks to $132.0 million from $210.1 million.
Nonetheless, these inflows in 2012 represented an increase in their foreign liabilities,
reflecting the borrowing by commercial banks from both within and outside the ECCU

48
area. During the review period, disbursements of foreign loans to the government fell as
the central government financed its deficit mainly from domestic sources. However, the
decrease in outflows outweighed the continued decline in foreign direct investment
inflows, leading to higher net inflows of $288.7 million or 8.1 percent of GDP.

49
4
6
8
10
12
14
16
18
20
22
24
2001 2002 2003 2004 2005 2006 2007 2008 2009 2010 2011 2012
per
thou
sand
Birth, Death & Infant Mortality Rates
Birth Rate Death Rate Infant Mortality Rate
CHAPTER SEVEN
SOCIO-DEMOGRAPHIC INDICATORS
POPULATION AND DEMOGRAPHY
Preliminary estimates suggest that Saint Lucia’s resident population grew by 1.0 percent
to 169,115 in 2012, reflecting the highest population growth rate over the last decade.
Saint Lucia’s population distribution by age reveals that the largest proportion of
population falls within the age groups 10-14, 15-19 and 20-24 years. These age groups
account for 26.3 percent of the total population, and indicate that Saint Lucia has a
youthful population. Nonetheless, the smallest proportion of persons falls within the age
group 80 and over and 75-79 categories which accounted for 3.7 percent of the total
population.
During the review period, the age groups 50-54 and 55-59 registered the highest growth
rates of 4.4 and 6.1 percent respectively. In keeping with the demographic trend of a
contracting base of the population pyramid, the age groups 10-14 and 5-9 years reflected
the largest declines of 2.7 percent and 2.4 percent respectively.
It is estimated that the number of
live births grew by 4.7 percent
while the number of deaths
declined by 6.2 percent during
the review period. The rise in
total population is evident by the
number of live births exceeding
the number of deaths by 1,181.
The birth rate in 2012 grew moderately to 12.4 per thousand from 12.0 per thousand in
2011. The number of male births, 1,062, exceeded the number of female births by 21,

50
reflecting a 6.9 percent increase in male births. However, the number of female births
grew by 2.5 percent to 1,041 in 2012.
In the year under review, the death rate declined to 5.5 per thousand from 5.9 per
thousand in 2011. The total number of deaths fell by 6.2 percent to 922, with male deaths
amounted to 520. The trend of higher male to female deaths continued in 2012, with the
number of male deaths exceeding female deaths by 118. Nonetheless female deaths
contracted by 7.6 percent as compared to 5.1 percent reduction in male deaths.
The infant mortality rate which captures death among infants, remained largely
unchanged in 2012, increased by 0.5 percent to 20.2 per thousand.
Epidemiological Profile of the Population
Non-communicable diseases remain the most prevalent cause of mortality in St. Lucia,
with the top five disease being hypertension, diabetes, heart disease, cerebrovascular
diseases and cancer.
Table 10: Top Five Leading Causes of Death in Saint Lucia (2009 to 2011)
Rank 2009 2010 2011
1 Malignant neoplasm Malignant neoplasm Malignant neoplasm
2 Cerebrovascular disease Heart disease Diabetes mellitus
3 Diabetes mellitus Diabetes mellitus Heart disease
4 Heart disease Hypertensive disease Cerebrovascular disease
5 Hypertensive disease Cerebrovascular disease Hypertensive disease
Source: Ministry of Health, Wellness, Human Services & Gender Relations
The number of new HIV cases moved from 63 in 2011 to 58 in 2012. Similarly, the
number of new AIDS cases declined by 28.6 percent to 25 with a significant reduction in
the number of AIDS deaths of 60.0 percent to 10 persons in 2012. This decline is
primarily attributed to widespread testing, more specifically in communities and the
reinstatment of government funding of social support to HIV patients.
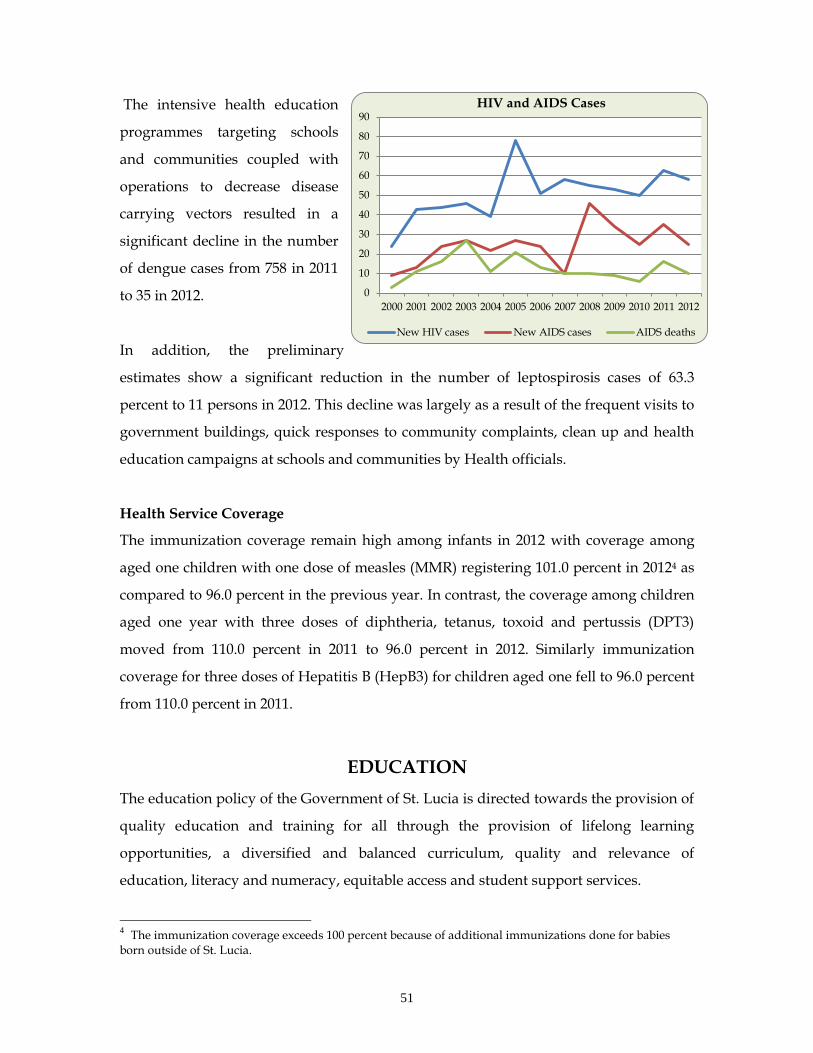
51
0
10
20
30
40
50
60
70
80
90
2000 2001 2002 2003 2004 2005 2006 2007 2008 2009 2010 2011 2012
HIV and AIDS Cases
New HIV cases New AIDS cases AIDS deaths
The intensive health education
programmes targeting schools
and communities coupled with
operations to decrease disease
carrying vectors resulted in a
significant decline in the number
of dengue cases from 758 in 2011
to 35 in 2012.
In addition, the preliminary
estimates show a significant reduction in the number of leptospirosis cases of 63.3
percent to 11 persons in 2012. This decline was largely as a result of the frequent visits to
government buildings, quick responses to community complaints, clean up and health
education campaigns at schools and communities by Health officials.
Health Service Coverage
The immunization coverage remain high among infants in 2012 with coverage among
aged one children with one dose of measles (MMR) registering 101.0 percent in 20124 as
compared to 96.0 percent in the previous year. In contrast, the coverage among children
aged one year with three doses of diphtheria, tetanus, toxoid and pertussis (DPT3)
moved from 110.0 percent in 2011 to 96.0 percent in 2012. Similarly immunization
coverage for three doses of Hepatitis B (HepB3) for children aged one fell to 96.0 percent
from 110.0 percent in 2011.
EDUCATION
The education policy of the Government of St. Lucia is directed towards the provision of
quality education and training for all through the provision of lifelong learning
opportunities, a diversified and balanced curriculum, quality and relevance of
education, literacy and numeracy, equitable access and student support services.
4 The immunization coverage exceeds 100 percent because of additional immunizations done for babies
born outside of St. Lucia.

52
0
20
40
60
80
100
120
140
160
180
0
10
20
30
40
50
60
70
2003
/04
2004
/05
2005
/06
2006
/07
2007
/08
2008
/09
2009
/10
2010
/11
2011
/12
2012
/13
Education Expenditure (EC$M)
Primary Education Secondary EducationOther Programs Total (r.h.s)
Government’s allocation to the
education sector increased by 7.4
percent in 2011/12 to $195.1
million, compared to the last fiscal
year. This represented the second
largest share of the budget,
consistent with the trend of the
previous six years. Of this amount,
$161.01 million was recurrent
expenditure representing an increase of 4.1 percent. Capital expenditure increased by
26.3 percent to $34.1 million in 2011/2012.
Student Support Services and Welfare Programmes
Government provides assistance to primary and secondary school students in the form
of Bursaries, School Feeding Programme, Transportation Subsidy, and the Book Rental
Programme. In 2011/12, 12,062 students were beneficiaries to the various programmes.
Table 11: Number of Students Benefiting from Various Student Support Services
School
Feeding
Programme
Transportation
Subsidy
Programme
Text Book
Rental
Programme
Bursaries Programme
Primary Secondary
2007/08 6,557 1,082 1,182 725 406
2008/09 7,149 2,019 1,118 875 253
2009/10 7,058 2,542 651 979 417
2010/11 7,106 2,645 554 931 411
2011/12 7,366 2,558 287 1,446 405
Early Childhood5
The child to caregiver ratio for day-care centres and pre-school centres remained
unchanged at 1:9 and 1:10 respectively, in keeping with the trend for the past six years.
5 Early childhood refers to children aged 1-4 years.

53
0
5
10
15
20
25
30
0
5,000
10,000
15,000
20,000
25,000
30,000
35,000
1996
/97
1997
/98
1998
/99
1999
/00
2000
/01
2001
/02
2002
/03
2003
/04
2004
/05
2005
/06
2006
/07
2007
/08
2008
/09
2009
/10
2010
/11
2011
/12
Primary School Enrolment and Student Teacher ratio
Enrolment Student Teacher Ratio (r.h.s)
Primary Schools by Size
<100
100-199
200-299
Other
The number of pre-school centres increased from 92 to 94 in 2011/2012 while the
number of day-care centres remains unchanged at 41. The total enrolment at pre-schools
and day-cares increased by 1.8 percent and 0.7 percent respectively to 3,483 and 1,504
children in the academic year 2011/12.
Public Primary Education
Access
The student population enrolled
at primary schools has declined
steadily for the past 15 years as
the intake of students continues
to be less than the numbers
graduating from primary
schools. Total student enrolment
in 2011/12 declined by 3.9
percent to 17,276, representing a 36.6 percent decline from the academic year 1997/98.
The stock of public primary school in 2011/12 remained unchanged at 75, maintaining
the trend over the past five years.
Surplus physical capacity was 36.6 percent in
primary schools in 2011/12, an increase of 7.6
percent over 2010/11. Of the 75 public primary
schools on island, 71 schools are operating at
surplus capacity ranging from 88.4 percent to 1.6
percent with 41 schools operating at above 40.0
percent of surplus capacity.
The gross enrolment ratio, which compares the population aged 5 to 11 with total primary
enrolment, decreased from 96.0 percent to 94.0 percent in 2011/12 as the number of
under-aged and over-aged students in primary schools remain significant. The under-
aged and over-aged student percentage were 3.0 percent and 3.2 percent of the public
primary population respectively. The net enrolment ratio at the primary level, that is, the

54
ratio of the population aged 5 to 11 in relation to the 5 to 11 enrolment, fell from 90.0
percent in the previous year to 88.0 percent in 2011/12. This is attributable in part to a
2.0 percentage point decrease in 5–11 year olds enrolled in public primary schools as 110
five year old students were enrolled in Early Childhood institutions and 246 ten and
eleven year old students enrolled in secondary schools in 2011/12. The transition rate6
from primary to secondary school was 93.6 percent.
Efficiency and Quality
There were 6 dropouts in 2010/117 and 393 repeaters (62.0 percent male) in 2011/12.
The number of primary school teachers decreased from 998 to 989 in 2011/12 with the
profession being dominated by 86.0 percent female teachers. Of the total, 89.0 percent of
teachers were trained, that is, completed a recognized programme in teacher education
methods and teaching techniques.
Two national examinations are written at the primary school level annually; the
Minimum Standards Test (MST) in Grades 2 and 4 and the Common Entrance
Examination (CEE) in Grade 6. In 2012, 2,423 candidates (55.0 percent of total
candidates) scored at or above the minimum standard of 60.0 percent at the Grade 2
level while 1,643 or 65.0 percent of the Grade 4 students scored at or above the minimum
standard of 60.0 percent. The national mean performances for all examinations declined
in 2012.
Table 12: National Mean Performances in Primary Level Examinations
Test/Subject
Mathematics English Language
2010 2011 2012 2010 2011 2012
MST (Grade 2) 59.9% 57.7% 48.1% 59.7% 64.6% 62.6%
MST (Grade 4) 53.4% 57.7% 56.6% 52.3% 55.7% 54.4%
CEE (Grade 6) 59.4% 60.9% 60.1% 58.0% 58.2% 55.5%
6 This relates to the number of graduates who enters the next level of education in a given year to those who graduated from the last formal grade of the previous level. 7 Data for the 2011/12 academic year is not yet available.

55
0
5
10
15
20
25
0
2,000
4,000
6,000
8,000
10,000
12,000
14,000
16,000
18,000
199
7/9
8
199
8/9
9
199
9/0
0
200
0/0
1
200
1/0
2
200
2/0
3
200
3/0
4
200
4/0
5
200
5/0
6
200
6/0
7
200
7/0
8
200
8/0
9
200
9/1
0
2010
/11
201
1/1
2
Stu
den
t T
each
er R
atio
Stu
den
t E
nro
lmen
t
Secondary School Enrolment and Teacher Ratio
Student Enrolment Student Teacher Ratio
0
50
100
150
200
250
300Secondary School Dropouts
The Common Entrance Examinations were written by 2,831 students in 2012, an increase
of 16.0 percent over 2011, reversing the trend of declining numbers over the past five
years. The national mean dropped from 61.7 percent to 59.0 percent in 2012 with 52.9
percent of the students scoring at or above the national mean and 90.8 percent of
students being assigned to secondary schools.
Public Secondary Education
Access
The number of secondary schools remains unchanged in 2011/12 at 23 albeit an increase
in surplus capacity by 8.5 percent to 11.2 percent due mainly to a 5.7 percent decline in
enrolment from by 2.8 percent to
14,381 students. The gross
enrolment ratio dropped from
96.0 percent to 93.0 percent in
2011/12 while the net enrolment
ratio remained unchanged at 85.0
percent. There were 545 12-16
year olds (formal age for public
secondary education) enrolled in
primary schools which affected the secondary school net enrolment ratio.
Efficiency and Quality
The trend in number of dropouts
continues with a 2.0 percent
increase to 273 students in
2010/11, dominated by males
(66.0 percent) and predominant
mainly in Forms 4 and 5 (78.0
percent of total dropouts).
The number of secondary school teachers increased from 963 to 968 in 2011/12. Of this,
65 percent were trained, while 62 percent of which were graduate teachers. A total of 91

56
0
200
400
600
800
1,000
1,200
199
4/
95
199
5/
96
199
6/
97
199
7/
98
199
8/
99
199
9/
00
200
0/
01
200
1/
02
200
2/
03
200
3/
04
200
4/
05
200
5/
06
200
6/
07
200
7/
08
200
8/
09
200
9/
10
201
0/
11
201
1/
12
Secondary School Teachers and Trained Teachers
Number of Teachers Number Trained
teachers were on study leave in the year 2011/12 of which 67 were on study leave with
pay for the year.
The overall pass rate for
secondary schools at the
General and Technical
Proficiency Level of the 2012
Caribbean Secondary Education
Certificate (CSEC) Examinations
was 63.8 percent. This
represented a decline of 3.9 percent, compared to the previous academic year.
Pass rates of public secondary schools at the General and Technical Proficiency Level
ranged from 19.0 percent to 99.0 percent. Of the 23 public schools which wrote the
examination, 5 attained an overall pass rate of above 80.0 percent. The pass rate for
Mathematics remained the same at 30.0 percent in 2012, while the pass rate for English
Language fell by 17.0 percentage points to 52.0 percent.
Special Education
Total enrolment at the five Special Education Centres increased by 18.8 percent to 360 in
2011/12, compared to the previous year with female students accounting for 41.0
percent of total enrolment. The total number of teachers at these centres increased from
58 in 2010/11 to 63 in 2011/12 resulting in an uptick in the teacher to student ratio from
1:5 to 1:6. The number of trained teachers declined from 39 to 29 in 2011/12 while only
23.8 percent were trained in various areas of specialization such as Deaf and Blind
Education, Multiple Handicaps, Dyslexia and Speech Therapy. This accounts for a
significant decrease of 37.2 percent, compared to 2010/11.
Private Primary and Secondary Education
Total enrolment at the six private primary schools increased marginally by 0.6 percent to
896 in the academic year 2011/12. The total number of teachers at the private primary
schools was 65, resulting in a teacher to student ratio of 1:14. The population of
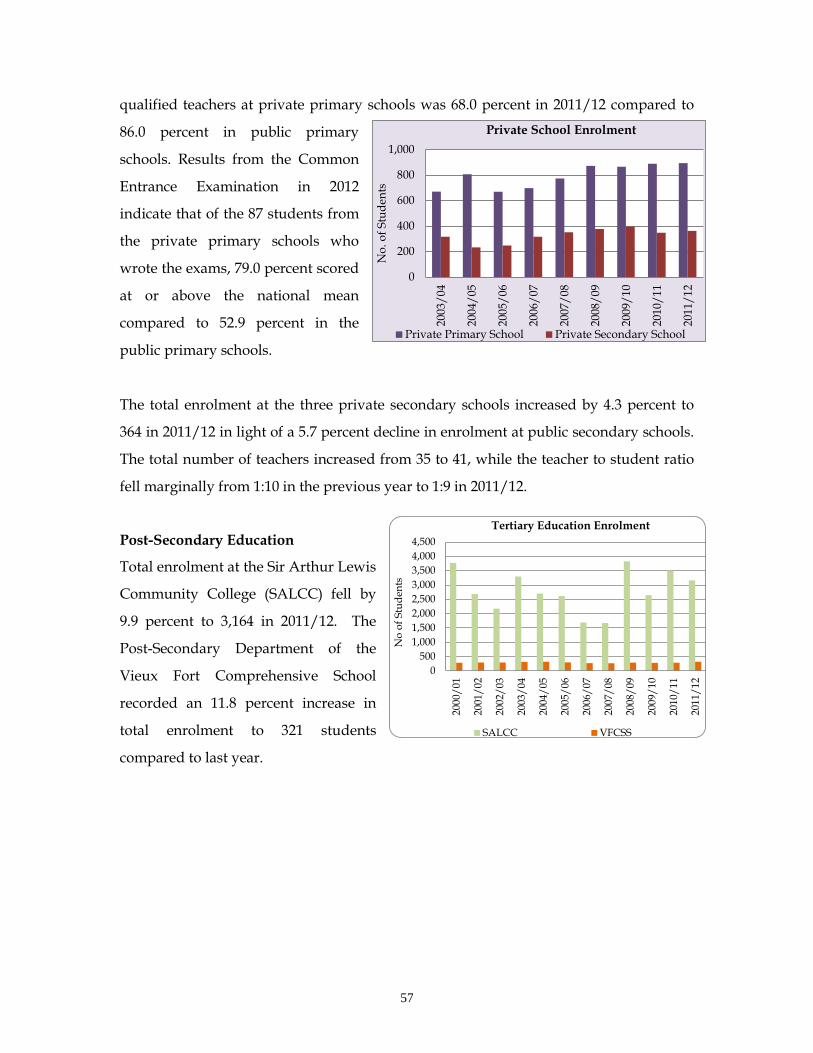
57
0
500
1,000
1,500
2,000
2,500
3,000
3,500
4,000
4,500
200
0/0
1
200
1/0
2
200
2/0
3
200
3/0
4
200
4/0
5
200
5/0
6
200
6/0
7
200
7/0
8
2008
/09
2009
/10
201
0/1
1
201
1/1
2
No
of
Stu
den
ts
Tertiary Education Enrolment
SALCC VFCSS
0
200
400
600
800
1,000
200
3/0
4
200
4/0
5
200
5/0
6
200
6/0
7
200
7/0
8
2008
/09
2009
/10
201
0/1
1
201
1/1
2
No
. of
Stu
den
ts
Private School Enrolment
Private Primary School Private Secondary School
qualified teachers at private primary schools was 68.0 percent in 2011/12 compared to
86.0 percent in public primary
schools. Results from the Common
Entrance Examination in 2012
indicate that of the 87 students from
the private primary schools who
wrote the exams, 79.0 percent scored
at or above the national mean
compared to 52.9 percent in the
public primary schools.
The total enrolment at the three private secondary schools increased by 4.3 percent to
364 in 2011/12 in light of a 5.7 percent decline in enrolment at public secondary schools.
The total number of teachers increased from 35 to 41, while the teacher to student ratio
fell marginally from 1:10 in the previous year to 1:9 in 2011/12.
Post-Secondary Education
Total enrolment at the Sir Arthur Lewis
Community College (SALCC) fell by
9.9 percent to 3,164 in 2011/12. The
Post-Secondary Department of the
Vieux Fort Comprehensive School
recorded an 11.8 percent increase in
total enrolment to 321 students
compared to last year.

58
0
20
40
60
80
100
120
2003 2004 2005 2006 2007 2008 2009 2010 2011 2012
Per
cen
tag
e P
ass
Ra
te A
-E
Tertiary Education Pass Rates
SALCC VFCSS
The teacher to student ratio at SALCC was 1:14 in 2011/12.8 The overall GCE Advanced
Level pass rate at SALCC and the Vieux
Fort Comprehensive Advanced Level
Department was 97.6 percent and 79.9
percent, respectively in the 2012
examinations.
Skills Training
In 2011/2012, the average number of
learners enrolled with NELP increased
by 29.3 percent to 1,616 spread over sixteen centres. Trainees participating in this
program are predominantly female and accounted for 73.0 percent of the learners. In the
academic year 2011/12, 38.9 percent of the trainees did courses in CXC Mathematics and
English, whilst 23.5 percent pursued courses in Basic Literacy.
Other Government financed skills training programs are administered through the
National Skills Development Centre (NSDC). In 2011/12, the number of trainees
enrolled in various areas of training under the Special Framework of Assistance (2004)
Program9 increased by 14.8 percent to 629 due to the provision of the program at the
Patience and Choiseul Training Centres, in addition to the Bisee Training Centre. In
2011/12, a total of 252 and 139 students were enrolled at the NSDC under the Caribbean
Youth Empowerment Project and OECS Skills for Inclusive Growth Project, respectively.
A total of 629 students graduated from the NSDC in the year under review, 72.5 percent
of which were female. Total enrolment at the CARE Centres (Centre for Adolescent
Renewal and Education) declined marginally by 1.9 percent to 156 in 2011/2012.
8 This ratio is for the full time programmes; therefore it does not include data from the Department of Continuing Education.
9Areas of training include; beauty therapy, bartending, hair design, electrical installation, office administration, gourmet cooking, pastry, auto
mechanics, a/c refrigeration, culinary arts.
59
CHAPTER EIGHT
ECONOMIC OUTLOOK
The recovery in the global economy is expected to gather pace as the underlying causes
of slower activity in 2012 are likely to subside in the near term as the effects of policy
actions take hold. Notwithstanding a decelerated pace of growth in the US, global
output is forecasted to pick-up to 3.3 percent in 2013 and 4.0 percent in 201410 with
gradual upturns in both advanced and emerging market and developing economies.
However, the prospects for a firmer recovery can be dampened by the uncertainty about
the resolution of the fiscal and financial crisis in the EU, potential delays in structural
reforms and the pace of fiscal consolidation in the US.
The domestic economy is therefore expected to benefit from stronger consumption
growth in Saint Lucia’s key tourism source markets. While activity is projected to
expand in tourism and agriculture, the medium term growth prospects remain generally
subdued.
Developments in airlift and marketing will play a critical role in the performance of the
tourism sector in 2013. The introduction of United Airlines in July 2013 as well as
increased airlift capacity from Jet Blue and Delta is anticipated to increase stay-over
arrivals from the US market. However, this may be partially offset by the impact of
reduced air seats from the UK and the Caribbean.
The launch of the Freedom Bay Hotel development and the phased multi-million dollar
upgrade of Windjammer Landing Resort are expected to contribute to a recovery in
private sector construction activity in 2013. In addition, the continuation of the
construction stimulus package is expected to contribute to private construction activity.
Public sector construction will involve the intensification of works on the Finance
Administration Building and completion of post hurricane Tomas infrastructural
rehabilitation works.
10
Source: IMF World Economic Outlook (April 2013).

60
A marginal but positive outturn is projected for the manufacturing sector amidst
challenging macro-economic environment. However, the performance of the sector is
dependent on increased domestic and external demand and output from new producers
which have recently started production.
Gains are expected from the agriculture sector due to ongoing recovery in the banana
industry supported by continued efforts at pest and disease management, coinciding
with the resumption of trading by TQF. The operationalization of the clearing house will
enhance the marketing and distribution of crops while the completion of the abattoir
and the increase in the guaranteed market share for broiler is expected to boost
production of local livestock.
A lower rate of domestic inflation is projected due to the annualized effect of VAT with
a tapering off in the last quarter of 2013.
A faster recovery may be held back by tight credit conditions, weakening commercial
bank balance sheets and increasing stress in the financial system. Reform of the
regulatory framework and close monitoring of the financial sector will be essential in
managing emerging risks.
Positive economic growth is expected in 2013 but is likely to remain weak. Given the
limited fiscal space and government’s inability to continue providing fiscal stimulus to
the economy, efforts will be focused on structural reforms to lay the platform for
improved productivity and competitiveness aimed at more sustainable growth.

61
STATISTICAL
APPENDIX

STATISTICAL APPENDIX
TITLE PAGE
GROSS DOMESTIC PRODUCT
Table 1: G.D.P. Factor Cost - Current Prices ...............................................................................................................................................................1
Table 2: G.D.P. Factor Cost - Constant Prices ...............................................................................................................................................................2
Table 3: Growth of G.D.P. Factor Cost - Constant Prices .............................................................................................................................................3
Table 4: Sectoral Percentage Share of G.D.P. Factor Cost - Constant Prices ......................................................................................................4
TOURISM
Table 5: Selected Visitor Statistics ...................................................................................................................................................................................5
Table 6: Monthly Arrivals By Category..................................................................................................................................6
Table 7: Stayover Tourist Arrivals by Country of Origin..................................................................................................................................................................7
AGRICULTURE
Table 8: St. Lucia Banana Exports to the UK .................................................................................................................................................................................................8
Table 9: St. Lucia Banana Exports Revenue................................................................................................................................................................................9
Table 10: Supermarket Purchases of "Other Crops" by Category……………………….……………………………………………………………10
Table 11: Domestic Purchase of "Other Crops" by Category…………………………………..…………………………………………………………………... 10
Table 12: Egg Production………………………………..………………………………………………………………………………………………………………………………………………..11
Table 13: Livestock Purchases………………….…………………………………………………………………………………………………………………………………………………..11
Table 14: Summary of Estimated Value of Fish Landings………………………………….…………………………………...…………………………………………12
Table 15: Fish Landings by Species and Quantity………………………………………...……………………………………………………………………………………………. …..12
Table 16: Estimated Quantity of Fish Landings by Site……………………………………….………………………………………….………………………………………12
MANUFACTURING
Table 17: Manufacturing Production....................................................................................................................................................................................13
TRANSPORT
Table 18: Sea Cargo.................................................................................................................................................................................14
Table 19: Airport Traffic Statistics......................................................................................................................................................................................15
Table 20: Aircraft Movements by Activity..................................................................................................................................................................................................................16
ENERGY
Table 21: Electricity Consumption and Output..................................................................................................................................................................17
Table 22: Fuel Surcharge........................................................................................................................................................................................................18
Table 23: Prices of Diesel Purchased by LUCELEC………………………………………………….……. 18
PRICES
Table 24: Consumer Price Index - Annual Inflation Rates...........................................................................................................................................................................................19
Table 25: Consumer Price Index .............................................................................................................................................................................................20
Table 26: Consumer Price Index - Percentage Change.................................................................................................................................................20
CENTRAL GOVERNMENT FISCAL OPERATIONS
Table 27: Summary of Central Government Fiscal Operations....................................................................................................................................21
Table 28: Summary of Central Government Fiscal Operations as a Ratio to GDP........................................................................................22
Table 29: Central Government Revenue....................................................................................................................................23
Table 30: Central Government Expenditure......................................................................................................................................................................24

PUBLIC DEBT
Table 31: Total Public Sector Outstanding Liabilities......................................................................................................................................25
Table 32: Distribution of Outstanding Liabilities by Class Holder and Type of Liability......................................................................................................................................26
Table 33: Distribution of Outstanding Liabilities by Class of Holder and Term of Instrument .................. 27
Table 34: Listing of Official Debt........................................................................................................................................................28
Table 38: Distribution of Public Sector External Loans by Creditor...................................................................................................32
Table 39: Composition of External Public Debt by Economic Sector……………………………….………………….. 33
FINANCIAL SECTOR
BANKING
Table 40: Detailed Monetary Survey .......................................................................................................................................................................................................34
Table 41: Commercial Banks Total Deposits by Depositors..................................................................................................................35
Table 42: Commercial Banks Total Deposits by Category………...…………………………………………….. 35
Table 43: Commercial Banks - Assets and Liabilities...................................................................................................................................................36
Table 44: Commercial Bank Liquidity ......................................................................................................................................................37
Table 45: Commercial Banks Structure of Interest Rates ......................................................................................................................................................38
Table 46: Commercial Banks' Credit by Sector ......................................................................................................................................................39
Table 47: ECCB Operations with St. Lucia......................................................................................................................................................................40
Table 48: St. Lucia External Reserves......................................................................................................................................................................40
TRADE AND BALANCE OF PAYMENTS
Table 49: Imports by Standard International Trade Classification - at C.I.F. Prices.....................................................................................................................................41
Table 50: Imports by Standard International Trade Classification - at F.O.B. Prices.....................................................................................................................................41
Table 51: Imports by Standard International Trade Classification - Percentage of Total......................................................................................................................................42
Table 52: Imports by Standard International Trade Classification - Percentage Change……..................................................................................…42
Table 53: Balance of Payments .................................................................................................................................................................................................43
POPULATION
Table 54: Estimated Mid-year Population and Vital Statistics.......................................................................................44
Table 55: Estimated Mid-year Population by Sex and Age Group..........................................................................................45
EDUCATION
Table 56: St. Lucia Public Schools………………………………….....………………...……………………………………………………………….…46
Table 57: Analysis of Schools, Pupils and Teachers by Primary Schools............................................................................................47
Table 58: Analysis of Schools, Pupils and Teachers by Secondary Schools............................................................................................48
Table 59: Cambridge A' level Education Pass Rate...........................................................................................................................49
Table 60: Government Recurrent Expenditure on Education.............................................................................................................................................................49

Economic Activity 2001r 2002r 2003r 2004r 2005r 2006r 2007r 2008r 2009r 2010r 2011r 2012pre
Agriculture, Livestock, Forestry, Fishing 84.93 94.75 88.80 91.99 76.25 88.66 88.25 121.09 116.11 94.52 84.01 92.90
Bananas 36.04 54.32 40.13 51.97 38.58 44.23 37.33 58.45 51.96 29.15 15.01 22.16
Other Crops 22.70 19.10 18.70 18.03 16.34 20.09 24.55 31.30 32.05 32.80 35.57 37.20
Livestock 9.10 7.45 7.23 6.82 6.61 8.17 8.55 9.95 10.50 10.78 11.24 11.13
Fishing 15.83 12.66 21.57 14.02 13.59 15.07 16.68 20.28 20.52 20.73 21.15 21.57
Forestry 1.26 1.22 1.17 1.16 1.13 1.10 1.13 1.11 1.07 1.06 1.04 0.84
Mining and Quarrying 6.08 6.05 6.03 5.91 5.68 6.82 7.63 7.22 7.06 6.99 6.95 7.18
Manufacturing 73.25 74.26 82.14 95.75 113.71 121.26 133.03 120.46 108.30 103.53 110.89 109.63
Construction 119.66 114.96 129.42 162.20 197.81 300.81 222.69 255.53 249.77 231.98 238.32 228.74
Electricity and Water 88.27 83.95 87.41 97.84 92.60 94.89 98.03 103.00 115.82 118.11 113.44 117.02
Electricity 72.86 68.39 71.21 80.14 76.66 81.61 86.74 90.22 98.49 104.02 101.89 104.65
Water 15.41 15.56 16.19 17.70 15.93 13.28 11.29 12.78 17.33 14.09 11.55 12.37
Distributive Trade Services 130.94 132.79 154.56 162.24 194.02 227.16 241.87 249.63 218.97 219.38 263.67 259.22
Hotels and Restaurants 183.31 167.00 215.86 245.42 241.15 252.50 363.82 337.79 334.50 458.18 449.16 479.18
Hotels 141.03 125.42 170.85 196.97 192.25 202.86 296.99 279.16 268.34 391.15 374.87 404.59
Restaurants 42.28 41.57 45.01 48.45 48.90 49.64 66.83 58.63 66.16 67.03 74.28 74.59
Transport 216.59 207.70 236.50 263.49 268.68 290.56 328.78 314.03 294.99 367.70 391.92 398.97
Road Transport 110.18 108.00 129.23 140.88 150.24 167.02 189.53 187.06 177.19 244.30 264.26 265.57
Air Transport 18.24 17.86 17.24 19.92 17.96 16.01 16.51 17.69 15.24 17.44 18.02 18.02
Sea Transport 32.06 30.48 35.52 39.41 42.03 40.59 47.35 43.56 39.69 43.26 44.24 45.27
Auxiliary Transport Activities 56.12 51.35 54.51 63.28 58.45 66.94 75.39 65.71 62.87 62.71 65.41 70.12
Communication 126.27 136.48 144.16 151.44 164.98 157.55 178.62 184.51 190.79 195.22 182.10 180.58
Postal Activity 2.45 2.59 2.54 2.57 2.60 2.73 2.77 2.77 2.86 2.97 2.99 2.98
Courier 1.42 1.94 1.25 1.16 1.37 1.25 1.27 1.29 1.11 1.13 1.18 1.18
Telecommunication 122.40 131.96 140.37 147.71 161.01 153.57 174.58 180.45 186.82 191.12 177.93 176.42
Financial Intermediation 122.87 118.77 115.39 133.07 148.02 169.98 218.09 231.18 218.56 186.95 177.42 178.10
Banking and Auxiliary Financial Services 94.54 87.52 86.03 102.68 116.45 134.08 180.16 192.87 179.87 155.44 145.18 145.54
Insurance 28.33 31.25 29.36 30.39 31.58 35.90 37.93 38.31 38.69 31.50 32.24 32.56
Real Estate, Renting and Business Activities 303.06 310.54 323.92 338.15 361.90 394.21 432.18 454.51 472.98 494.84 523.96 538.84
Owner Occupied Dwellings 213.98 220.23 227.86 241.63 257.79 270.78 297.51 307.24 320.10 317.87 340.28 346.68
Real Estate 28.63 30.27 34.11 33.88 36.73 45.77 50.69 58.76 61.66 72.73 75.42 81.29
Renting of Machinery and Equipment 13.67 13.34 14.11 12.55 14.36 16.30 19.30 19.94 19.97 22.34 25.58 24.12
Computer and Related Services 2.15 2.21 2.24 2.71 2.62 2.74 3.27 3.01 3.15 3.62 4.15 4.92
Business Services 44.63 44.49 45.60 47.38 50.40 58.62 61.41 65.56 68.10 78.28 78.53 81.83
Public Administration & Compulsory Social Services 140.46 135.82 138.27 128.15 127.95 146.97 154.37 166.97 173.52 187.26 201.97 211.96
Education 83.02 83.14 83.20 85.88 83.41 95.97 101.94 107.76 118.24 126.99 130.34 130.86
Public 79.11 79.19 79.23 81.88 79.03 91.09 95.70 102.17 112.48 120.80 123.87 123.98
Private 3.91 3.95 3.97 4.00 4.38 4.88 6.24 5.59 5.76 6.19 6.47 6.88
Health 39.88 39.76 39.62 40.24 41.26 45.67 47.96 49.84 52.15 54.00 57.79 63.59
Public 31.41 31.72 31.52 31.76 31.36 35.37 36.03 38.55 40.25 41.45 44.66 49.37
Private 8.47 8.04 8.10 8.48 9.90 10.30 11.93 11.29 11.90 12.55 13.13 14.22
Other Community, Social and Personal Services 59.85 58.34 60.52 62.22 71.64 82.83 96.73 109.72 128.88 141.29 155.81 155.36
Public 6.04 6.83 6.02 5.95 6.74 7.32 4.26 3.77 3.94 9.56 11.22 11.49
Private 50.95 48.58 51.57 53.25 61.82 72.24 89.03 102.39 121.25 127.92 140.42 139.77
Private Households with Employed Persons 2.86 2.93 2.93 3.02 3.08 3.27 3.43 3.56 3.69 3.81 4.17 4.10
Less FISIM (28.37) (29.37) (28.94) (30.35) (33.74) (44.18) (64.67) (72.72) (73.60) (67.07) (63.63) (62.52)
Gross Value Added @ Basic Prices 1,750.07 1,734.92 1,876.85 2,033.63 2,155.31 2,431.67 2,649.32 2,740.51 2,727.04 2,919.88 3,024.12 3,089.62
Plus: Net Taxes on Production and Imports 242.85 268.06 298.25 336.70 373.27 415.75 444.02 456.15 458.89 461.49 475.62 469.91
Gross Domestic Product @ Market Prices 1,992.92 2,002.98 2,175.10 2,370.33 2,528.58 2,847.42 3,093.35 3,196.66 3,185.93 3,381.37 3,499.73 3,559.52
Rate of GDP Growth % -5.6% 0.5% 8.6% 9.0% 6.7% 12.6% 8.6% 3.3% -0.3% 6.1% 3.5% 1.7%
Source:Government Statistics Department
pre= preliminary
r = revised
(Rebased) Gross Domestic ProductProduction Approach
In Nominal PricesIn EC$ Millions
TABLE 1
1

Economic Activity 2000r 2001r 2002r 2003r 2004r 2005r 2006r 2007r 2008r 2009r 2010r 2011r 2012pre
Agriculture, Livestock, Forestry, Fishing 137.02 105.78 115.37 102.78 105.32 81.33 88.66 88.47 113.27 109.13 85.81 74.51 80.74
Bananas 79.68 49.22 69.80 50.53 59.61 41.71 44.23 38.80 56.81 52.29 27.92 14.53 22.19
Other Crops 24.22 25.79 21.85 21.24 20.33 17.09 20.09 23.20 27.31 27.09 28.02 29.64 28.94
Livestock 9.83 8.98 8.53 8.12 7.59 6.89 8.17 8.12 8.75 8.96 9.22 9.35 8.70
Fishing 22.02 20.54 13.97 21.70 16.63 14.51 15.07 17.28 19.36 19.79 19.66 20.06 20.14
Forestry 1.26 1.25 1.22 1.19 1.16 1.13 1.10 1.07 1.04 1.00 0.98 0.94 0.77
Mining and Quarrying 1.89 1.95 1.95 0.64 0.65 1.46 6.82 10.92 8.31 6.86 7.58 7.29 13.01
Manufacturing 104.94 104.76 99.76 100.21 113.15 117.78 121.26 136.98 129.71 136.98 132.93 138.20 138.26
Construction 238.17 192.52 189.50 213.03 266.91 198.79 300.81 215.78 273.49 272.18 246.64 251.76 239.11
Electricity and Water 81.35 84.72 81.65 85.13 89.39 92.62 94.89 99.25 101.04 105.09 107.55 108.79 109.48
Electricity 67.17 69.85 68.70 72.35 76.45 79.60 81.61 85.47 86.66 90.42 94.91 95.67 95.65
Water 14.17 14.87 12.95 12.79 12.94 13.02 13.28 13.78 14.38 14.67 12.64 13.12 13.83
Distributive Trade Services 157.43 142.50 143.88 166.44 169.73 198.50 227.16 234.11 236.39 199.56 194.00 232.38 211.63
Hotels and Restaurants 224.49 203.89 202.24 232.37 245.68 258.16 252.50 254.04 245.81 243.60 261.16 255.91 262.65
Hotels 178.65 159.80 158.83 185.25 196.15 208.56 202.86 187.86 192.08 187.11 202.47 190.96 198.78
Restaurants 45.84 44.08 43.41 47.13 49.53 49.60 49.64 66.17 53.74 56.49 58.69 64.94 63.86
Transport 265.34 289.86 265.05 279.30 317.60 299.93 290.56 345.51 353.17 354.17 361.68 347.02 338.23
Road Transport 153.28 175.61 159.30 167.15 187.47 174.94 167.02 208.56 213.00 220.28 222.99 218.28 210.48
Air Transport 13.02 12.31 11.87 12.88 14.29 15.80 16.01 14.80 15.22 14.44 16.07 13.60 13.01
Sea Transport 38.52 43.16 39.65 41.85 47.29 44.18 40.59 49.24 50.48 51.26 50.60 49.01 46.28
Auxiliary Transport Activities 60.52 58.77 54.24 57.43 68.56 65.02 66.94 72.90 74.48 68.19 72.02 66.14 68.46
Communication 129.80 142.68 151.91 159.03 161.24 169.63 157.55 166.84 170.67 173.47 171.41 163.89 155.16
Postal Activity 2.56 2.56 2.49 2.45 2.63 2.73 2.73 2.73 2.73 2.76 2.73 2.76 2.76
Courier 1.30 1.29 1.28 1.26 1.32 1.34 1.25 1.22 1.17 0.97 1.11 1.08 1.10
Telecommunication 125.95 138.84 148.15 155.32 157.30 165.57 153.57 162.89 166.77 169.74 167.57 160.05 151.30
Financial Intermediation 138.66 132.87 132.94 133.26 139.51 150.13 169.98 183.98 195.91 191.61 190.19 194.46 197.27
Banking and Auxiliary Financial Services 95.82 96.52 97.79 100.59 107.10 118.01 134.08 145.95 156.17 150.83 150.93 154.71 158.18
Insurance 42.84 36.35 35.15 32.67 32.41 32.12 35.90 38.03 39.74 40.78 39.26 39.75 39.08
Real Estate, Renting and Business Activities 339.03 347.07 351.52 360.93 363.01 372.61 394.21 403.79 418.93 426.60 450.74 455.62 459.62
Owner Occupied Dwellings 243.00 245.96 250.50 255.36 260.35 265.49 270.78 276.22 281.82 287.59 293.86 296.68 299.78
Real Estate 29.61 32.53 33.62 37.03 35.95 37.84 45.77 49.22 55.31 56.13 65.49 64.13 65.28
Renting of Machinery and Equipment 14.87 15.50 14.97 15.61 13.37 14.76 16.30 18.00 18.43 18.15 19.59 22.35 20.29
Computer and Related Services 2.38 2.44 2.48 2.48 2.88 2.69 2.74 3.05 2.78 2.86 3.18 3.63 4.14
Business Services 49.17 50.63 49.94 50.46 50.46 51.82 58.62 57.30 60.59 61.87 68.63 68.83 70.13
Public Administration & Compulsory Social Services 153.05 153.71 144.85 140.44 142.34 145.18 146.97 147.70 151.04 155.08 160.05 164.72 168.42
Education 99.55 100.93 95.10 92.13 93.31 94.41 95.97 99.12 100.66 103.23 106.53 109.46 112.00
Public 96.06 96.50 90.67 87.73 89.05 89.91 91.09 93.30 95.50 98.00 101.10 103.81 106.21
Private 3.49 4.43 4.43 4.39 4.26 4.50 4.88 5.82 5.16 5.23 5.42 5.65 5.79
Health 45.57 47.07 44.24 43.03 43.61 45.09 45.67 47.36 47.51 48.86 50.27 51.78 53.20
Public 37.30 37.47 35.21 34.07 34.58 34.91 35.37 36.23 37.08 38.05 39.26 40.31 41.24
Private 8.27 9.60 9.03 8.97 9.03 10.18 10.30 11.13 10.43 10.81 11.01 11.47 11.96
Other Community, Social and Personal Services 58.46 68.65 64.96 67.28 67.06 74.03 82.83 93.88 105.61 121.81 123.75 134.58 129.47
Public 7.72 7.75 7.29 7.05 7.16 7.23 7.32 7.50 7.67 7.88 8.12 8.34 8.54
Private 47.68 57.79 54.54 57.07 56.71 63.57 72.24 83.07 94.63 110.16 112.16 122.71 117.56
Private Households with Employed Persons 3.07 3.11 3.13 3.16 3.20 3.23 3.27 3.31 3.30 3.77 3.47 3.53 3.37
Less FISIM (26.44) (29.29) (29.89) (28.42) (29.09) (35.01) (44.18) (55.61) (61.45) (64.23) (62.69) (64.22) (64.26)
Gross Value Added @ Basic Prices 2,148.31 2,089.69 2,055.04 2,147.59 2,289.42 2,264.64 2,431.67 2,472.10 2,590.06 2,584.02 2,587.59 2,626.16 2,603.98
Rate of Growth % -2.7% -1.7% 4.5% 6.6% -1.1% 7.4% 1.7% 4.8% -0.2% 0.1% 1.5% -0.8%
Source:Government Statistics Department
pre= preliminary
r = revised
TABLE 2
(Rebased) Gross Domestic ProductProduction Approach
In Constant Prices, 2006 = 100
In EC$ Millions
2

Economic Activity 2001r 2002r 2003r 2004r 2005r 2006r 2007r 2008r 2009r 2010r 2011r 2012pre
Agriculture, Livestock, Forestry, Fishing -22.8% 9.1% -10.9% 2.5% -22.8% 9.0% -0.2% 28.0% -3.6% -21.4% -13.2% 8.4%
Bananas -38.2% 41.8% -27.6% 18.0% -30.0% 6.0% -12.3% 46.4% -8.0% -46.6% -48.0% 52.8%
Other Crops 6.5% -15.3% -2.8% -4.3% -15.9% 17.6% 15.5% 17.7% -0.8% 3.4% 5.8% -2.4%
Livestock -8.6% -5.0% -4.8% -6.5% -9.3% 18.6% -0.6% 7.8% 2.4% 2.9% 1.4% -7.0%
Fishing -6.7% -32.0% 55.3% -23.4% -12.7% 3.9% 14.7% 12.0% 2.2% -0.7% 2.0% 0.4%
Forestry -0.8% -2.4% -2.5% -2.5% -2.6% -2.7% -2.7% -2.8% -3.8% -2.0% -4.1% -18.0%
Mining and Quarrying 3.0% 0.1% -67.2% 0.9% 125.4% 368.0% 60.1% -23.9% -17.4% 10.5% -3.9% 78.5%
Manufacturing -0.2% -4.8% 0.4% 12.9% 4.1% 3.0% 13.0% -5.3% 5.6% -3.0% 4.0% 0.0%
Construction -19.2% -1.6% 12.4% 25.3% -25.5% 51.3% -28.3% 26.7% -0.5% -9.4% 2.1% -5.0%
Electricity and Water 4.2% -3.6% 4.3% 5.0% 3.6% 2.4% 4.6% 1.8% 4.0% 2.3% 1.2% 0.6%
Electricity 4.0% -1.7% 5.3% 5.7% 4.1% 2.5% 4.7% 1.4% 4.3% 5.0% 0.8% 0.0%
Water 4.9% -12.9% -1.3% 1.2% 0.6% 2.0% 3.8% 4.4% 2.0% -13.9% 3.8% 5.4%
Distributive Trade Services -9.5% 1.0% 15.7% 2.0% 16.9% 14.4% 3.1% 1.0% -15.6% -2.8% 19.8% -8.9%
Hotels and Restaurants -9.2% -0.8% 14.9% 5.7% 5.1% -2.2% 0.6% -3.2% -0.9% 7.2% -2.0% 2.6%
Hotels -10.5% -0.6% 16.6% 5.9% 6.3% -2.7% -7.4% 2.2% -2.6% 8.2% -5.7% 4.1%
Restaurants -3.8% -1.5% 8.6% 5.1% 0.1% 0.1% 33.3% -18.8% 5.1% 3.9% 10.7% -1.7%
Transport 9.2% -8.6% 5.4% 13.7% -5.6% -3.1% 18.9% 2.2% 0.3% 2.1% -4.1% -2.5%
Road Transport 14.6% -9.3% 4.9% 12.2% -6.7% -4.5% 24.9% 2.1% 3.4% 1.2% -2.1% -3.6%
Air Transport -5.4% -3.6% 8.5% 10.9% 10.6% 1.3% -7.5% 2.8% -5.1% 11.3% -15.4% -4.4%
Sea Transport 12.0% -8.1% 5.5% 13.0% -6.6% -8.1% 21.3% 2.5% 1.5% -1.3% -3.1% -5.6%
Auxiliary Transport Activities -2.9% -7.7% 5.9% 19.4% -5.2% 3.0% 8.9% 2.2% -8.4% 5.6% -8.2% 3.5%
Communication 9.9% 6.5% 4.7% 1.4% 5.2% -7.1% 5.9% 2.3% 1.6% -1.2% -4.4% -5.3%
Postal Activity 0.0% -2.7% -1.4% 7.0% 3.9% 0.0% 0.0% 0.0% 1.3% -1.3% 1.3% -0.2%
Courier -0.6% -0.9% -1.3% 4.7% 1.6% -6.9% -2.3% -3.9% -16.9% 14.2% -2.8% 1.9%
Telecommunication 10.2% 6.7% 4.8% 1.3% 5.3% -7.2% 6.1% 2.4% 1.8% -1.3% -4.5% -5.5%
Financial Intermediation -4.2% 0.1% 0.2% 4.7% 7.6% 13.2% 8.2% 6.5% -2.2% -0.7% 2.2% 1.4%
Banking and Auxiliary Financial Services 0.7% 1.3% 2.9% 6.5% 10.2% 13.6% 8.9% 7.0% -3.4% 0.1% 2.5% 2.2%
Insurance -15.1% -3.3% -7.1% -0.8% -0.9% 11.8% 5.9% 4.5% 2.6% -3.7% 1.3% -1.7%
Real Estate, Renting and Business Activities 2.4% 1.3% 2.7% 0.6% 2.6% 5.8% 2.4% 3.7% 1.8% 5.7% 1.1% 0.9%
Owner Occupied Dwellings 1.2% 1.8% 1.9% 2.0% 2.0% 2.0% 2.0% 2.0% 2.0% 2.2% 1.0% 1.0%
Real Estate 9.9% 3.3% 10.1% -2.9% 5.3% 21.0% 7.5% 12.4% 1.5% 16.7% -2.1% 1.8%
Renting of Machinery and Equipment 4.2% -3.4% 4.2% -14.4% 10.4% 10.4% 10.4% 2.4% -1.5% 7.9% 14.1% -9.2%
Computer and Related Services 2.7% 1.7% 0.0% 16.2% -6.6% 1.6% 11.6% -9.0% 3.1% 10.9% 14.3% 14.0%
Business Services 3.0% -1.4% 1.0% 0.0% 2.7% 13.1% -2.3% 5.7% 2.1% 10.9% 0.3% 1.9%
Public Administration & Compulsory Social Services 0.4% -5.8% -3.0% 1.4% 2.0% 1.2% 0.5% 2.3% 2.7% 3.2% 2.9% 2.2%
Education 1.4% -5.8% -3.1% 1.3% 1.2% 1.7% 3.3% 1.5% 2.6% 3.2% 2.8% 2.3%
Public 0.5% -6.0% -3.2% 1.5% 1.0% 1.3% 2.4% 2.4% 2.6% 3.2% 2.7% 2.3%
Private 27.0% 0.0% -0.8% -3.2% 5.7% 8.5% 19.3% -11.4% 1.4% 3.7% 4.2% 2.5%
Health 3.3% -6.0% -2.7% 1.3% 3.4% 1.3% 3.7% 0.3% 2.8% 2.9% 3.0% 2.7%
Public 0.5% -6.0% -3.2% 1.5% 1.0% 1.3% 2.4% 2.4% 2.6% 3.2% 2.7% 2.3%
Private 16.2% -6.0% -0.7% 0.7% 12.7% 1.3% 8.0% -6.3% 3.7% 1.8% 4.2% 4.3%
Other Community, Social and Personal Services 17.4% -5.4% 3.6% -0.3% 10.4% 11.9% 13.3% 12.5% 15.3% 1.6% 8.8% -3.8%
Public 0.5% -6.0% -3.2% 1.5% 1.0% 1.3% 2.4% 2.4% 2.6% 3.2% 2.7% 2.4%
Private 21.2% -5.6% 4.6% -0.6% 12.1% 13.6% 15.0% 13.9% 16.4% 1.8% 9.4% -4.2%
Private Households with Employed Persons 1.2% 0.8% 0.9% 1.2% 1.2% 1.3% 1.2% -0.3% 14.2% -8.0% 1.7% -4.5%
Less FISIM 10.8% 2.1% -4.9% 2.4% 20.3% 26.2% 25.9% 10.5% 4.5% -2.4% 2.4% 0.1%
Gross Value Added @ Basic Prices (Growth Rate) -2.7% -1.7% 4.5% 6.6% -1.1% 7.4% 1.7% 4.8% -0.2% 0.1% 1.5% -0.8%
Source:Government Statistics Department
pre= preliminary
r = revised
TABLE 3
(Rebased) Gross Domestic ProductProduction Approach
In Constant Prices, 2006 = 100
Rate of Growth (%)
3

Economic Activity 2000r 2001r 2002r 2003r 2004r 2005r 2006r 2007r 2008r 2009r 2010r 2011r 2012pre
Agriculture, Livestock, Forestry, Fishing 6.4% 5.1% 5.6% 4.8% 4.6% 3.6% 3.6% 3.6% 4.4% 4.2% 3.3% 2.8% 3.1%
Bananas 3.7% 2.4% 3.4% 2.4% 2.6% 1.8% 1.8% 1.6% 2.2% 2.0% 1.1% 0.6% 0.9%
Other Crops 1.1% 1.2% 1.1% 1.0% 0.9% 0.8% 0.8% 0.9% 1.1% 1.0% 1.1% 1.1% 1.1%
Livestock 0.5% 0.4% 0.4% 0.4% 0.3% 0.3% 0.3% 0.3% 0.3% 0.3% 0.4% 0.4% 0.3%
Fishing 1.0% 1.0% 0.7% 1.0% 0.7% 0.6% 0.6% 0.7% 0.7% 0.8% 0.8% 0.8% 0.8%
Forestry 0.1% 0.1% 0.1% 0.1% 0.1% 0.0% 0.0% 0.0% 0.0% 0.0% 0.0% 0.0% 0.0%
Mining and Quarrying 0.1% 0.1% 0.1% 0.0% 0.0% 0.1% 0.3% 0.4% 0.3% 0.3% 0.3% 0.3% 0.5%
Manufacturing 4.9% 5.0% 4.9% 4.7% 4.9% 5.2% 5.0% 5.5% 5.0% 5.3% 5.1% 5.3% 5.3%
Construction 11.1% 9.2% 9.2% 9.9% 11.7% 8.8% 12.4% 8.7% 10.6% 10.5% 9.5% 9.6% 9.2%
Electricity and Water 3.8% 4.1% 4.0% 4.0% 3.9% 4.1% 3.9% 4.0% 3.9% 4.1% 4.2% 4.1% 4.2%
Electricity 3.1% 3.3% 3.3% 3.4% 3.3% 3.5% 3.4% 3.5% 3.3% 3.5% 3.7% 3.6% 3.7%
Water 0.7% 0.7% 0.6% 0.6% 0.6% 0.6% 0.5% 0.6% 0.6% 0.6% 0.5% 0.5% 0.5%
Distributive Trade Services 7.3% 6.8% 7.0% 7.8% 7.4% 8.8% 9.3% 9.5% 9.1% 7.7% 7.5% 8.8% 8.1%
Hotels and Restaurants 10.4% 9.8% 9.8% 10.8% 10.7% 11.4% 10.4% 10.3% 9.5% 9.4% 10.1% 9.7% 10.1%
Hotels 8.3% 7.6% 7.7% 8.6% 8.6% 9.2% 8.3% 7.6% 7.4% 7.2% 7.8% 7.3% 7.6%
Restaurants 2.1% 2.1% 2.1% 2.2% 2.2% 2.2% 2.0% 2.7% 2.1% 2.2% 2.3% 2.5% 2.5%
Transport 12.4% 13.9% 12.9% 13.0% 13.9% 13.2% 11.9% 14.0% 13.6% 13.7% 14.0% 13.2% 13.0%
Road Transport 7.1% 8.4% 7.8% 7.8% 8.2% 7.7% 6.9% 8.4% 8.2% 8.5% 8.6% 8.3% 8.1%
Air Transport 0.6% 0.6% 0.6% 0.6% 0.6% 0.7% 0.7% 0.6% 0.6% 0.6% 0.6% 0.5% 0.5%
Sea Transport 1.8% 2.1% 1.9% 1.9% 2.1% 2.0% 1.7% 2.0% 1.9% 2.0% 2.0% 1.9% 1.8%
Auxiliary Transport Activities 2.8% 2.8% 2.6% 2.7% 3.0% 2.9% 2.8% 2.9% 2.9% 2.6% 2.8% 2.5% 2.6%
Communication 6.0% 6.8% 7.4% 7.4% 7.0% 7.5% 6.5% 6.7% 6.6% 6.7% 6.6% 6.2% 6.0%
Postal Activity 0.1% 0.1% 0.1% 0.1% 0.1% 0.1% 0.1% 0.1% 0.1% 0.1% 0.1% 0.1% 0.1%
Courier 0.1% 0.1% 0.1% 0.1% 0.1% 0.1% 0.1% 0.0% 0.0% 0.0% 0.0% 0.0% 0.0%
Telecommunication 5.9% 6.6% 7.2% 7.2% 6.9% 7.3% 6.3% 6.6% 6.4% 6.6% 6.5% 6.1% 5.8%
Financial Intermediation 6.5% 6.4% 6.5% 6.2% 6.1% 6.6% 7.0% 7.4% 7.6% 7.4% 7.4% 7.4% 7.6%
Banking and Auxiliary Financial Services 4.5% 4.6% 4.8% 4.7% 4.7% 5.2% 5.5% 5.9% 6.0% 5.8% 5.8% 5.9% 6.1%
Insurance 2.0% 1.7% 1.7% 1.5% 1.4% 1.4% 1.5% 1.5% 1.5% 1.6% 1.5% 1.5% 1.5%
Real Estate, Renting and Business Activities 15.8% 16.6% 17.1% 16.8% 15.9% 16.5% 16.2% 16.3% 16.2% 16.5% 17.4% 17.3% 17.7%
Owner Occupied Dwellings 11.3% 11.8% 12.2% 11.9% 11.4% 11.7% 11.1% 11.2% 10.9% 11.1% 11.4% 11.3% 11.5%
Real Estate 1.4% 1.6% 1.6% 1.7% 1.6% 1.7% 1.9% 2.0% 2.1% 2.2% 2.5% 2.4% 2.5%
Renting of Machinery and Equipment 0.7% 0.7% 0.7% 0.7% 0.6% 0.7% 0.7% 0.7% 0.7% 0.7% 0.8% 0.9% 0.8%
Computer and Related Services 0.1% 0.1% 0.1% 0.1% 0.1% 0.1% 0.1% 0.1% 0.1% 0.1% 0.1% 0.1% 0.2%
Business Services 2.3% 2.4% 2.4% 2.3% 2.2% 2.3% 2.4% 2.3% 2.3% 2.4% 2.7% 2.6% 2.7%
Public Administration & Compulsory Social Services 7.1% 7.4% 7.0% 6.5% 6.2% 6.4% 6.0% 6.0% 5.8% 6.0% 6.2% 6.3% 6.5%
Education 4.6% 4.8% 4.6% 4.3% 4.1% 4.2% 3.9% 4.0% 3.9% 4.0% 4.1% 4.2% 4.3%
Public 4.5% 4.6% 4.4% 4.1% 3.9% 4.0% 3.7% 3.8% 3.7% 3.8% 3.9% 4.0% 4.1%
Private 0.2% 0.2% 0.2% 0.2% 0.2% 0.2% 0.2% 0.2% 0.2% 0.2% 0.2% 0.2% 0.2%
Health 2.1% 2.3% 2.2% 2.0% 1.9% 2.0% 1.9% 1.9% 1.8% 1.9% 1.9% 2.0% 2.0%
Public 1.7% 1.8% 1.7% 1.6% 1.5% 1.5% 1.5% 1.5% 1.4% 1.5% 1.5% 1.5% 1.6%
Private 0.4% 0.5% 0.4% 0.4% 0.4% 0.4% 0.4% 0.5% 0.4% 0.4% 0.4% 0.4% 0.5%
Other Community, Social and Personal Services 2.7% 3.3% 3.2% 3.1% 2.9% 3.3% 3.4% 3.8% 4.1% 4.7% 4.8% 5.1% 5.0%
Public 0.4% 0.4% 0.4% 0.3% 0.3% 0.3% 0.3% 0.3% 0.3% 0.3% 0.3% 0.3% 0.3%
Private 2.2% 2.8% 2.7% 2.7% 2.5% 2.8% 3.0% 3.4% 3.7% 4.3% 4.3% 4.7% 4.5%
Private Households with Employed Persons 0.1% 0.1% 0.2% 0.1% 0.1% 0.1% 0.1% 0.1% 0.1% 0.1% 0.1% 0.1% 0.1%
Less FISIM -1.2% -1.4% -1.5% -1.3% -1.3% -1.5% -1.8% -2.2% -2.4% -2.5% -2.4% -2.4% -2.5%
Gross Value Added @ Basic Prices 100.0% 100.0% 100.0% 100.0% 100.0% 100.0% 100.0% 100.0% 100.0% 100.0% 100.0% 100.0% 100.0%
Source:Government Statistics Department
pre= preliminary
r = revised
TABLE 4
(Rebased) Gross Domestic Product
Production Approach
In Constant Prices, 2005 = 100
Industry Contribution to the Economy (%)
4

2001 2002 2003 2004 2005 2006 2007 2008 2009 2010 2011r 2012pre Change in 2012
Total Visitor Arrivals 766,283 673,880 700,998 815,963 725,571 695,299 931,803 946,743 1,014,761 1,025,904 994,961 931,231 -6.4%
of which:
Cruise Passengers 489,912 387,180 393,240 481,279 394,364 359,593 610,345 619,680 699,306 670,043 630,304 571,894 -9.3%
Stay-Over Arrivals 250,132 253,463 276,948 298,431 296,678 302,510 287,518 295,761 278,491 305,937 312,404 306,801 -1.8%
Yacht Arrivals 19,817 25,516 17,993 24,812 26,988 26,145 26,163 22,422 31,997 42,311 41,730 42,173 1.1%
Excursionists 6,422 7,721 12,817 11,441 7,541 7,051 7,777 8,880 4,967 7,613 10,523 10,363 -1.5%
Paid Bednights (in millions)* 1.78 1.77 2.07 2.19 2.33 2.26 2.10 2.14 2.09 2.26 2.13 2.22 4.2%
Tourist Expenditure ($EC Millions)1 629.0 567.0 761.0 879.0 919.0 768.0 1,439.0 1,233.0 1,122.0 1,500.0 1,554.0 1,576.0 1.4%
Stay-over 560.0 522.0 706.0 817.0 864.0 724.0 1,364.0 1,175.0 1,059.0 1,442.0 1,500.0 1,527.0 1.8%
Cruise 69.0 45.0 55.0 62.0 55.0 44.0 75.0 58.0 63.0 58.0 54.0 49.0 -9.3%
Average Hotel Occupancy 57.0 56.1 62.7 61.9 68.7 64.9 64.9 61.6 53.3 58.7 57.3 62.3 8.7%
All Inclusives 79.2 72.5 73.8 73.6 74.0 67.4 62.8 67.2 54.0 67.0 63.0 74.0 17.5%
European Plan 48.8 45.4 54.7 51.8 66.0 61.8 59.9 60.2 55.0 55.0 55.0 59.0 7.3%
Small Properties 50.4 50.4 59.6 60.4 66.2 65.6 72.1 57.4 51.0 54.0 54.0 54.0 0.0%
Average Length of Stay 9.7 9.4 10.0 9.3 10.1 10.5 9.0 8.9 8.9 8.6 8.9 8.7 -2.2%
Cruise Ship Calls 378 245 262 328 258 267 314 315 397 380 351 336 -4.3%
Source: St. Lucia Tourist Board
*Source:Government Statistics Department
pre=preliminary
r=revised
1. For 2000 - 2003, the cruise component of total expenditure was revised downwards to reflect an average disembrakation ratio of 80.5% while a ratio of 82.34% was applied for 2004; cruise excluded in 2008 and 2009
TABLE 5
SELECTED VISITOR STATISTICS
5
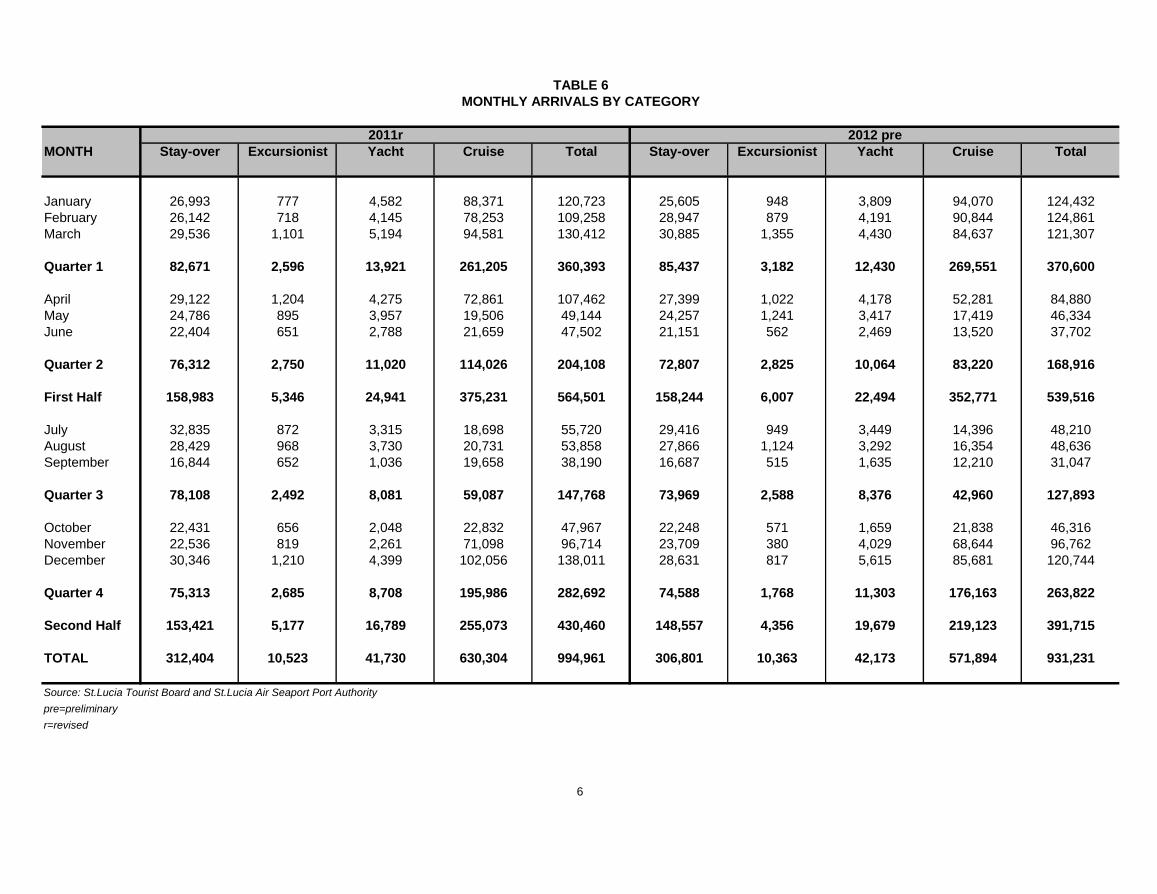
MONTH Stay-over Excursionist Yacht Cruise Total Stay-over Excursionist Yacht Cruise Total
January 26,993 777 4,582 88,371 120,723 25,605 948 3,809 94,070 124,432
February 26,142 718 4,145 78,253 109,258 28,947 879 4,191 90,844 124,861
March 29,536 1,101 5,194 94,581 130,412 30,885 1,355 4,430 84,637 121,307
Quarter 1 82,671 2,596 13,921 261,205 360,393 85,437 3,182 12,430 269,551 370,600
April 29,122 1,204 4,275 72,861 107,462 27,399 1,022 4,178 52,281 84,880
May 24,786 895 3,957 19,506 49,144 24,257 1,241 3,417 17,419 46,334
June 22,404 651 2,788 21,659 47,502 21,151 562 2,469 13,520 37,702
Quarter 2 76,312 2,750 11,020 114,026 204,108 72,807 2,825 10,064 83,220 168,916
First Half 158,983 5,346 24,941 375,231 564,501 158,244 6,007 22,494 352,771 539,516
July 32,835 872 3,315 18,698 55,720 29,416 949 3,449 14,396 48,210
August 28,429 968 3,730 20,731 53,858 27,866 1,124 3,292 16,354 48,636
September 16,844 652 1,036 19,658 38,190 16,687 515 1,635 12,210 31,047
Quarter 3 78,108 2,492 8,081 59,087 147,768 73,969 2,588 8,376 42,960 127,893
October 22,431 656 2,048 22,832 47,967 22,248 571 1,659 21,838 46,316
November 22,536 819 2,261 71,098 96,714 23,709 380 4,029 68,644 96,762
December 30,346 1,210 4,399 102,056 138,011 28,631 817 5,615 85,681 120,744
Quarter 4 75,313 2,685 8,708 195,986 282,692 74,588 1,768 11,303 176,163 263,822
Second Half 153,421 5,177 16,789 255,073 430,460 148,557 4,356 19,679 219,123 391,715
TOTAL 312,404 10,523 41,730 630,304 994,961 306,801 10,363 42,173 571,894 931,231
Source: St.Lucia Tourist Board and St.Lucia Air Seaport Port Authority
pre=preliminary
r=revised
TABLE 6
MONTHLY ARRIVALS BY CATEGORY
2011r 2012 pre
6

Country of Origin 2003 2004 2005 2006 2007 2008 2009 2010 2011r 2012pre
USA 98,078 107,089 108,589 117,450 113,433 108,596 98,685 129,085 122,356 115,065
CANADA 13,494 15,315 16,311 17,491 18,640 26,279 28,563 32,154 35,393 37,709
EUROPE 90,193 97,862 99,131 85,565 89,649 96,871 86,819 85,695 91,759 93,400
of which:
United Kingdom 75,426 81,370 84,196 73,312 79,180 83,693 71,853 67,417 73,059 75,677
Germany 3,582 3,289 3,338 2,569 1,592 1,823 2,416 4,142 3,041 3,165
France 6,017 7,682 6,366 3,764 3,642 4,271 5,356 5,822 7,428 5,467
Rest of Europe 5,168 5,521 5,231 5,920 5,235 7,084 7,194 8,314 8,231 9,091
CARIBBEAN 70,543 74,242 68,521 78,464 59,047 59,757 60,132 53,998 58,876 56,067
of which:
Caricom 52,316 48,478 54,885 49,802 37,789 35,791 34,389 30,919 30,923 32,400
French West Indies 13,449 22,313 10,532 25,830 18,962 21,157 22,721 20,232 26,117 21,180
OTHER 4,640 3,923 4,126 3,540 6,749 4,258 4,241 5,005 4,020 4,560
TOTAL 276,948 298,431 296,678 302,510 287,518 295,761 278,440 305,937 312,404 306,801
Source: St. Lucia Tourist Board
pre= preliminary
r= revised
TABLE 7
STAY-OVER TOURIST ARRIVALS BY COUNTRY OF ORIGIN
7

Month 2001 2002 2003 2004 2005 2006 2007 2008 2009 2010 2011 2012
JANUARY 4,417 3,945 2,903 4,923 2,400 2,280 4,121 2,247 3,906 2,955 0 762
FEBRUARY 3,973 3,963 2,843 4,045 2,321 2,146 3,329 2,476 2,605 2,602 0 739
MARCH 3,994 5,015 3,546 4,416 2,763 2,645 3,814 2,912 2,169 2,796 0 927
1st Quarter 12,384 12,923 9,292 13,385 7,485 7,071 11,264 7,634 8,680 8,353 0 2,427
APRIL 2,584 4,365 2,755 3,096 2,357 2,370 2,987 2,732 2,904 1,748 0 944
MAY 2,434 4,355 2,951 3,027 2,381 2,605 2,935 3,183 2,280 1,774 206 1,084
JUNE 2,432 5,159 3,516 3,828 2,781 3,176 3,329 3,952 2,314 1,824 874 1,553
2nd Quarter 7,450 13,879 9,222 9,981 7,520 8,151 9,251 9,868 7,498 5,346 1,080 3,581
1st Half Total 19,834 26,802 18,514 23,366 15,005 15,222 20,515 17,502 16,178 13,699 1,080 6,008
JULY 1,711 3,609 2,252 2,934 1,648 2,318 2,500 3,102 2,961 1,477 620 942
AUGUST 1,686 3,654 1,951 3,116 1,717 2,552 2,023 3,037 2,481 1,548 597 939
SEPTEMBER 2,288 4,265 2,371 3,818 2,702 3,432 1,277 3,933 2,492 2,499 1,289 1,322
3rd Quarter 5,685 11,528 6,574 9,869 6,067 8,302 5,800 10,072 7,934 5,524 2,506 3,202
OCTOBER 2,267 3,126 2,390 3,104 2,486 2,869 1,234 3,482 3,341 2,478 1,192 1,044
NOVEMBER 2,771 3,235 2,654 2,848 3,006 3,055 1,085 3,340 2,849 0 806 969
DECEMBER 3,487 3,469 3,839 3,139 3,443 4,534 1,684 3,963 3,624 0 973 903
4th Quarter 8,525 9,830 8,883 9,091 8,935 10,458 4,003 10,785 9,814 2,478 2,971 2,915
2nd Half Total 14,210 21,358 15,457 18,960 15,002 18,760 9,803 20,857 17,748 8,002 5,477 6,118
Annual Total 34,044 48,160 33,971 42,326 30,007 33,982 30,318 38,359 33,925 21,701 6,556 12,126
Growth -51.6% 41.5% -29.5% 24.6% -29.1% 13.3% -10.8% 26.5% -11.6% -36.0% -69.8% 85.0%
Source: WINFRESH
TABLE 8
ST.LUCIA BANANA EXPORTS TO THE UK
(Tonnes)
8

MONTH 2001 2002 2003 2004 2005 2006 2007 2008 2009 2010 2011 2012
January 4.17 4.38 3.71 5.96 3.20 4.00 5.90 3.55 6.61 5.49 0.00 1.32
February 4.15 4.39 3.22 5.06 3.18 2.96 4.81 3.84 4.52 4.88 0.00 1.28
March 4.49 5.96 4.65 5.56 3.72 3.68 5.48 4.60 3.90 5.40 0.00 1.62
1st Quarter 12.80 14.74 11.57 16.59 10.09 10.64 16.19 11.99 15.03 15.76 0.00 4.22
April 3.49 5.22 3.59 4.00 3.17 3.31 4.35 4.30 5.08 3.50 0.00 1.65
May 3.38 5.47 3.92 3.95 3.22 3.58 4.22 4.85 4.02 3.57 0.40 1.89
June 3.36 6.45 4.63 5.04 3.93 4.35 4.82 6.05 4.02 3.61 1.53 2.67
2nd Quarter 10.23 17.15 12.14 12.99 10.31 11.24 13.4 15.20 13.12 10.67 1.93 6.21
1st Half 23.02 31.89 23.71 29.58 20.41 21.88 29.59 27.19 28.15 26.43 1.93 10.43
July 2.25 4.49 3.01 3.85 2.24 3.24 3.55 4.76 5.08 2.94 1.58 1.64
August 2.22 4.61 2.63 4.01 2.34 3.61 3.00 4.68 4.12 3.10 1.47 1.64
September 3.16 5.39 3.21 4.78 3.80 4.85 1.83 6.03 4.24 4.92 2.47 2.30
3rd Quarter 7.63 14.49 8.85 12.64 8.38 11.70 8.38 15.47 13.44 10.96 5.52 5.58
October 2.89 3.97 3.25 3.91 3.56 4.04 1.71 5.27 5.63 4.48 2.29 1.85
November 3.44 4.12 3.43 3.66 4.29 4.25 1.56 5.10 4.26 0.00 1.55 1.66
December 4.18 4.26 4.33 4.05 4.84 6.20 2.41 5.88 4.91 0.00 1.87 1.60
4th Quarter 10.51 12.35 11.01 11.63 12.69 14.49 5.68 16.25 14.80 4.48 5.71 5.11
2nd Half 18.14 26.72 19.86 24.26 21.07 26.19 14.06 31.72 28.24 15.45 11.23 10.69
TOTAL 41.16 58.61 43.57 53.84 41.48 48.07 43.65 58.91 56.39 41.88 13.16 21.12
Growth -52.1% 42.4% -25.7% 23.6% -23.0% 15.9% -9.2% 35.0% -4.3% -25.7% -68.6% 60.5%
Source: WINFRESH
TABLE 9
ST.LUCIA BANANA EXPORTS REVENUE
($EC Millions)
9

Quantity Value $EC Quantity Value $EC Quantity Value $EC Quantity Value $EC Quantity Value $EC Quantity Value $EC Quantity Value $EC Quantity Value $EC Quantity Value $EC
Tonnes Tonnes Tonnes Tonnes Tonnes Tonnes Tonnes Tonnes Tonnes
Fruit & Tree Crops 497.2 669,598 409.8 683,939 478.4 836,940 517.7 972,065 1,009.5 2,069,722 440.1 894,779 359.0 815,299 428.4 981,221 520.2 1,178,204
Musa 351.4 308,673 342.7 329,317 348.2 435,821 395.1 447,259 488.4 622,241 1,270.9 2,328,540 915.7 2,264,082 1,270.5 2,435,282 1,213.0 2,450,179
Traditional Vegetables 197.3 928,486 174.8 1,029,274 289.3 1,445,767 318.0 1,725,395 384.4 1,836,584 366.7 2,092,950 239.6 1,673,443 327.5 2,096,300 322.8 2,051,729
Non Traditional Vegetables 285.1 843,936 287.1 1,015,054 358.5 1,261,126 373.1 1,464,277 362.1 1,390,235 401.2 1,696,426 384.8 1,577,311 423.9 1,739,286 488.6 1,817,598
Roots & Tubers 280.4 723,472 211.9 616,920 252.6 901,380 260.9 944,852 288.1 1,039,189 301.5 1,069,478 187.1 763,928 290.8 1,191,252 309.9 1,080,816
Condiments 32.9 230,728 30.8 276,736 35.2 272,227 42.9 400,871 45.5 363,605 50.4 446,386 41.9 429,243 55.3 490,345 66.1 553,660
Miscellaneous 0.2 1,793 0.3 2,495 2.7 15,016 0.2 1,341 1.2 9,161 3.0 16,516 0.1 219 10.4 30,142 4.6 22,873
Total 1,644.6 3,706,686 1,457.4 3,953,736 1,764.8 5,168,277 1,907.8 5,956,061 2,579.2 7,330,738 2,833.7 8,545,075 2,128.0 7,523,524 2,806.8 8,963,828 2,925.2 9,155,059
Growth -11.0% -5.5% -12.4% 6.7% 21.1% 30.7% 8.1% 15.2% 35.2% 23.1% 9.9% 16.6% -24.9% -12.0% 31.9% 19.1% 4.2% 2.1%
Source: Ministry of Agriculture, Food Production, Fisheries, Rural Development
Quantity Value $EC Quantity Value $EC Quantity Value $EC Quantity Value $EC Quantity Value $EC Quantity Value $EC Quantity Value $EC Quantity Value $EC Quantity Value $EC
(Tonnes) (Tonnes) (Tonnes) (Tonnes) (Tonnes) (Tonnes) (Tonnes) Tonnes Tonnes
Fruit & Tree Crops 966.0 1,855,593 825.1 1,709,930 966.0 2,201,744 1,060.2 2,709,615 1,508.2 3,838,258 765.8 2,183,805 655.3 2,189,114.7 717.6 2,274,506.9 520.2 1,178,203.9
Musa 435.9 449,011 407.2 502,071 436.9 596,531 504.1 657,510 592.5 859,653 1,570.2 2,921,411 1,182.5 2,883,515.1 1,558.3 3,100,945.7 1,213.0 2,450,179.0
Traditional Vegetables 313.0 1,739,755 255.0 1,605,639 394.1 2,182,385 442.2 2,751,037 527.8 2,974,165 511.4 3,197,847 334.8 2,573,016.2 443.7 3,203,916.0 322.8 2,051,729.5
Non Traditional Vegetables 411.9 1,394,581 388.5 1,481,314 479.7 1,814,185 510.6 2,136,346 495.7 2,068,129 538.3 2,216,189 496.0 2,206,362.8 551.2 2,489,463.6 488.6 1,817,597.7
Roots & Tubers 387.6 1,093,241 295.8 935,231 367.4 1,378,696 392.5 1,529,039 446.4 1,712,055 425.4 1,627,652 267.9 1,214,615.1 439.4 1,985,758.5 309.9 1,080,816.3
Condiments 45.6 375,874 38.7 370,326 47.8 424,376 58.9 621,744 63.4 577,600 66.6 623,434 56.4 607,272.2 76.3 745,251.9 66.1 553,659.5
Total 2,560.1 6,908,055 2,210.1 6,602,511 2,691.9 8,597,917 2,969 10,405,291 3,634.0 12,029,861 3,878 12,770,338 2,993 11,673,896 3,787 13,799,843 2,921 9,132,186
Growth -8.0% -4.9% -13.7% -4.4% 20.9% 30.2% 10.3% 21.0% 21.7% 16.5% 11.3% 6.2% 111.3% -8.6% 26.5% 18.2% -22.9% -33.8%
Source: Ministry of Agriculture, Food Production, Fisheries, Rural Development
*Other crops refers to non-banana crops
TABLE 10
SUPERMARKET PURCHASES OF OTHER CROPS BY CATEGORY*
CROP CATEGORY
2004 2005 2006 2007 2008 2009 2010 2011
TABLE 11
DOMESTIC PURCHASES OF OTHER CROPS BY CATEGORY
2012
201220112004 2005 2006 2007 2008 2009 2010
CROP CATEGORY
10

2004 2005 2006 2007 2008 2009 2010 2011r 2012pre
889 368 744 1,030 922 1,190 1,152 1,263 1,174
-58.6% 102.2% 38.4% -10.5% 29.0% -3.2% 9.7% -7.0%
5,418 1,838 3,720 5,150 4,610 6,543 6,334 7,578 7,046
-66.1% 102.4% 38.4% -10.5% 41.9% -3.2% 19.6% -7.0%
Source: Ministry of Agriculture, Food Production, Fisheries, Rural Development
pre=preliminary
Livestock Category
Quantity Quantity Quantity Quantity Quantity Quantity Quantity Quantity
(Tonnes) Value $'000 (Tonnes) Value $'000 (Tonnes) Value $'000 (Tonnes) Value $'000 (Tonnes) Value $'000 (Tonnes) Value $'000 (Tonnes) Value $'000 (Tonnes) Value $'000
Chicken 1,077.0 8,137.3 894.4 6,865.7 827.3 7,348.9 1,163.5 11,835.8 1,107.4 11,886.4 1,394.7 15,105.4 1,408.0 16,475.9 1,449.1 16,489.5
Pork 145.1 1,480.7 143.1 1,402.5 159.3 1,640.6 147.2 1,656.0 160.1 1,846.1 212.1 2,442.4 176.5 2,279.4 181.6 2,316.0
Total 1,222.1 9,618.0 1,037.5 8,268.2 986.6 8,989.5 1,310.7 13,491.8 1,267.4 13,732.5 1,606.7 17,547.8 1,584.5 18,755.3 1,630.7 18,805.5
Growth 50.4% 54.2% -15.1% -14.0% -4.9% 8.7% 32.8% 50.1% -3.3% 1.8% 26.8% 27.8% -1.4% 6.9% 2.9% 0.3%
Source: Ministry of Agriculture, Food Production, Fisheries, Rural Development
pre=preliminary
r=revised
2012pre2011r20102005 2006 2007 2008 2009
TABLE 12
EGG PRODUCTION
TABLE 13
LIVESTOCK PURCHASES
Value ( $'000)
Growth
Quantity ('000 dozens)
Growth
11

SITE TUNAS DOLPHIN WAHOO SNAPPER FLYING FISH SHARK LOBSTER CONCH OTHER TOTAL
ANSE LA RAYE 211,992 0 0 1,688 0 0 0 0 109,458 323,138
CASTRIES 667,404 403,051 8,426 85,788 2,061 11,552 0 0 211,277 1,389,559
CHOISEUL 586,137 273,009 94,054 62,434 1,158 749 58,916 0 256,805 1,333,262
DENNERY 978,008 1,747,212 721,016 119,328 0 8,418 52,732 54,991 380,770 4,062,475
GROS ISLET 103,140 58,904 4,222 31,868 2,275 14,665 444,350 1,865,356 504,392 3,029,172
MICOUD 354,596 713,180 151,533 48,505 0 11,120 3,858 0 379,491 1,662,283
SOUFRIERE 179,683 44,127 5,438 26,506 2,308 0 0 0 626,096 884,158
VIEUX FORT 1,579,882 3,103,760 681,459 423,353 0 10,938 102,568 88,603 1,298,451 7,289,014
OTHERSITES 1,354,007 1,229,776 254,889 169,988 14,320 54,264 515,640 36,578 1,680,510 5,309,971
TOTAL 2012 6,014,849 7,573,019 1,921,037 969,458 22,122 111,706 1,178,064 2,045,528 5,447,250 25,283,032
TOTAL 2011 7,015,237 7,136,845 2,496,862 574,908 147,061 32,890 984,990 1,293,409 5,115,915 24,798,116
TOTAL 2010 8,064,717 5,383,338 2,471,760 1,384,284 603,840 84,065 770,150 892,985 4,642,626 24,297,765
TOTAL 2009 6,398,459 6,748,470 2,488,587 1,266,190 1,214,890 88,874 389,094 1,044,156 4,423,561 24,062,281
TOTAL 2008 5,141,801 2,266,607 1,473,963 1,173,876 432,475 793,019 95,115 6,410,690 3,907,599 21,695,146
TOTAL 2007 6,696,701 2,451,812 260,735 1,071,677 497,728 855,116 49,580 4,266,969 3,409,779 19,560,097
Source: Ministry of Agriculture, Food Production, Fisheries, Rural Development
Flying Shark/
Tuna Dolphin King Fish Fish Black Fish Others Total
2005 466 198 169 71 12 470 1,386
2006 410 382 187 30 7 425 1,440
2007 328 512 211 46 5 407 1,509
2008 492 341 180 249 9 424 1,695
2009 486 465 195 220 9 483 1,858
2010 613 352 199 109 9 518 1,800
2011 541 473 197 22 3 457 1,693
2012 p 442 504 151 4 11 598 1,709
Source: Ministry of Agriculture, Food Production, Fisheries, Rural Development
p - provisional
Landing
Site
2005 2006 2007 2008 2009 2010r 2011r 2012pre
Gros Islet 141.4 109.6 121.3 189.3 173.5 126.6 76.8 110.5
Castries 108.6 60.7 72.1 66.6 75.4 71.2 88.4 85.1
Soufriere 103.0 99.5 77.9 73.3 120.2 155.7 114.7 82.0
Choiseul* 74.6 65.3 69.7 123.3 97.5 98.5 104.2 84.8
Laborie* 46.6 76.9 83.9 115.5 49.7 45.0 N/A 81.6
Vieux - Fort 1/ 310.6 366.4 366.4 372.0 406.9 476.0 538.7 530.9
Micoud 64.8 83.4 83.5 92.7 98.8 109.1 101.2 115.8
Dennery 282.7 307.0 370.6 307.2 431.3 376.1 281.6 306.6
Others 2/ 253.9 271.4 263.7 354.9 403.5 341.5 387.2 311.5
Total 1,386 1,440 1,509 1,695 1,857 1,799.6 1,693 1,709
Source: Ministry of Agriculture, Food Production, Fisheries, Rural Development
pre=preliminary
1/ - Note that the data for the Landing Site Vieux Fort includes data from the Landing Site at Savannes Bay
2/ -* includes all none sample sites
T O N N E S
TABLE 14
SUMMARY OF ESTIMATED VALUE OF FISH LANDINGS - 2012
(ex-vessel price, EC$)
TABLE 15
Fish Landings by Species and Quantity
Year
Type of Fish (Tonnes)
TABLE 16
Estimated Quantity of Fish Landed at Landing Site (2005-2012)
12

COMMODITIES MANUFACTURED 2000r 2001r 2002r 2003r 2004r 2005r 2006r 2007r 2008r 2009r 2010r 2011r 2012pre
FOOD 35.39 33.34 32.12 32.82 41.33 43.88 45.44 48.13 49.83 51.73 52.78 56.48 59.27
BEVERAGE MAKING 88.58 91.85 93.78 107.48 110.29 143.81 167.68 193.25 165.56 140.10 129.91 144.91 142.71
WEARING APPAREL 9.00 5.82 4.97 4.50 4.57 4.32 4.31 4.27 4.26 4.16 3.87 3.89 3.89
TEXTILES (includes Drapes) 2.36 1.88 2.82 5.96 9.33 10.24 0.91 0.91 0.91 0.91 0.91 0.91 0.91
FURNITURE 10.03 8.60 8.51 9.39 10.01 9.61 10.56 11.74 10.84 9.08 17.59 16.92 17.01
PAPER & PAPER PRODUCTS 29.38 24.43 26.03 24.30 23.81 23.71 25.44 25.22 24.07 29.37 24.89 22.33 21.75
PRINTING & PUBLISHING 13.47 12.81 13.62 13.58 14.78 14.56 14.10 14.10 14.03 13.88 13.96 13.97 13.92
CHEMICALS, ETC. 11.99 10.01 10.96 11.65 14.81 24.14 27.51 26.54 26.25 25.44 24.53 25.27 26.96
PLASTIC PRODUCTS 4.79 4.20 3.83 3.58 3.71 3.89 4.74 5.76 4.58 3.97 4.03 4.51 4.12
RUBBER PRODUCTS 1.97 4.05 3.52 3.10 3.94 3.96 4.71 5.23 4.64 4.50 3.91 3.65 2.91
FABRICATED METAL PRODUCTS 15.85 14.43 13.67 17.92 21.77 25.57 28.94 34.35 34.36 31.22 26.18 27.69 27.10
MACHINERY & EQUIPMENT 4.46 3.02 2.84 2.62 1.79 1.80 1.79 1.79 1.79 1.25 1.25 1.25 1.25
ELECTRICAL PRODUCTS 4.56 3.51 4.13 3.13 5.24 7.27 7.31 5.96 5.58 3.69 5.01 4.81 4.10
OTHER 2.96 2.24 2.09 2.09 2.09 2.07 2.07 2.07 2.07 2.07 2.07 2.05 2.05
TOTAL MANUFACTURING 234.78 220.19 222.90 242.11 267.46 318.82 345.51 379.32 348.76 321.36 310.90 328.64 327.96
Growth -6.2% 1.2% 8.6% 10.5% 19.2% 8.4% 9.8% -8.1% -7.9% -3.3% 5.7% -0.2%
Source: Government Statistics Department
pre = preliminary
r = revised
TABLE 17
ESTIMATED MANUFACTURING OUPUT (in EC$ Million)
13

LANDED YEAR QUANTITY LOADED YEAR QUANTITY
(1) Break Bulk Domestic 2003 139,363 Domestic 2003 70,554
(in Tons) Imports 2004 156,523 Exports 2004 160,179
2005 159,982 2005 98,312
2006 194,235 2006 79,133
2007 178,872 2007 129,616
2008 154,840 2008 202,366
2009 128,837 2009 69,244
2010 109,644 2010 72,661
2011 102,002 2011 63,477
2012 103,645 2012 79,876
Transhipment 2003 20 Transhipment 2003 24
(In) 2004 59 (Out) 2004 39
2005 544 2005 46
2006 11 2006 33
2007 44 2007 30
2008 899 2008 1140
2009 145 2009 542
2010 350 2010 350
2011 4 2011 4
2012 2,293 2012 1,708
Sub-Total 2003 139,383 Sub-Total 2003 70,578
2004 156,582 2004 160,218
2005 160,526 2005 98,358
2006 194,246 2006 79,166
2007 178,916 2007 129,646
2008 155,739 2008 203,506
2009 128,982 2009 69,786
2010 109,994 2010 73,011
2011 102,006 2011 63,481
2012 105,938 2012 81,584
(2) Dry/Liquid Bulk Domestic 2003 127,090 Domestic 2003 1,654
(in Tons) Imports 2004 181,350 Exports 2004 20
2005 129,096 2005 1,654
2006 119,342 2006 0
2007 60,172 2007 455
2008 40,753 2008 126
2009 51,428 2009 35
2010 59,968 2010 0
2011 41,272 2011 0
2012 38,291 2012 0
Transhipment 2003 Nil Transhipment 2003 Nil
(In) 2004 Nil (Out) 2004 Nil
2005 Nil 2005 Nil
2006 Nil 2006 Nil
2007 Nil 2007 Nil
2008 Nil 2008 Nil
2009 Nil 2009 Nil
2010 Nil 2010 Nil
2011 Nil 2011 Nil
2012 Nil 2012 Nil
Sub-Total 2003 127,090 Sub-Total 2003 1,654
2004 181,350 2004 20
2005 129,096 2005 1,654
2006 119,342 2006 0
2007 60,172 2007 455
2008 40,753 2008 126
2009 51,428 2009 35
2010 59,968 2010 0
2011 41,272 2011 0
2012 38,291 2012 0
(3) Containers Domestic 2003 14,255 Domestic 2003 3,143
(in TEUs) Imports 2004 16,370 Exports 2004 3,566
2005 18,918 2005 4,438
2006 15,344 2006 4,022
2007 20,895 2007 2,841
2008 20,156 2008 2,690
2009 17,991 2009 2,680
2010 17,878 2010 2,722
2011 17,356 2011 2,712
2012 16,382 2012 2,694
Transhipment 2003 3,654 Transhipment 2003 3,538
(In) 2004 5,042 (Out) 2004 4,746
2005 5,031 2005 7,425
2006 5,403 2006 5,235
2007 4,621 2007 4,474
2008 9,920 2008 9,739
2009 4,191 2009 4027
2010 5,511 2010 5233
2011 9,725 2011 9406
2012 17,652 2012 17,166
Sub-Total 2003 17,909 Sub-Total 2003 6,681
2004 21,412 2004 8,312
2005 23,949 2005 11,863
2006 20,746 2006 9,257
2007 25,515 2007 7,315
2008 30,076 2008 12,428
2009 22,182 2009 6,707
2010 23,388 2010 7,955
2011 27,081 2011 12,118
2012 34,034 2012 19,860
SEA CARGO
Source : St.Lucia Air and Sea Ports Authority
TABLE 18
14

Year Arrivals Departures Movements Disembarked Embarked Total Handled*
2000 16,093 16,099 32,192 193,222 201,086 394,308
2001 16,432 16,352 32,784 198,682 204,979 403,661
2002 16,231 16,259 32,490 199,287 205,190 404,477
2003 16,374 16,404 32,778 210,561 216,919 427,480
2004 17,290 17,254 34,544 227,866 236,584 464,450
2005 16,260 16,260 32,520 206,468 212,628 419,096
2006 17,430 17,430 34,860 200,404 211,738 412,142
2007 14,119 14,084 28,203 185,322 191,420 376,742
2008 13,417 13,274 26,691 153,926 167,970 321,896
2009 11,158 11,056 22,214 119,602 129,405 249,007
2010 11,088 12,104 23,192 112,794 126,587 239,381
2011 11,512 11,444 22,956 110,068 123,094 233,162
2012 11,595 11,571 23,166 105,930 120,212 226,142
Arrivals Departures Movements Disembarked Embarked Total Handled*
2000 5,012 4,966 9,978 178,112 173,566 351,678
2001 4,318 4,653 8,971 153,973 148,242 302,215
2002 4,098 4,100 8,198 138,586 137,072 275,658
2003 4,518 4,518 9,036 157,186 153,421 310,607
2004 4,978 5,033 10,011 180,875 173,240 354,115
2005 5,970 5,969 11,939 199,617 194,732 394,349
2006 6,492 6,477 12,969 209,085 204,876 413,961
2007 6,111 6,113 12,224 213,527 205,251 418,778
2008 6,079 6,062 12,141 233,024 233,205 466,229
2009 5,047 5,033 10,080 229,819 229,446 459,265
2010 6,380 6,361 12,741 276,444 275,653 552,097
2011 6,761 6,750 13,511 272,529 274,054 546,583
2012 6,746 6,746 13,492 278,232 278,819 557,051
Source : St. Lucia Air & Sea Ports Authority
* Excludes intransit passengers
TABLE 19
Hewanorra
AIRPORT TRAFFIC STATISTICS
AIRCRAFT LANDINGS PASSENGERS
G.F.L. Charles
15

AIRCRAFT MOVEMENTS 2004 2005 2006 2007 2008 2009 2010 2011 2012
Scheduled
Service Landings* 24,232 21,930 24,429 16,373 15,423 13,323 14,921 14,814 14,319
Non-scheduled
Service Landings* 18,003 20,048 20,718 20,857 20,448 16,184 19,224 19,403 20,413
Other
Service Landings* 2,320 2,483 2,682 3,197 2,962 2,785 2,738 2,329 1,941
TOTAL 44,555 44,461 47,829 40,427 38,833 32,292 36,883 36,546 36,673
2004 2005 2006 2007 2008 2009 2010 2011 2012
Scheduled
Service Landings* 21,284 19,146 21,184 13,329 12,409 10,206 10,674 10,604 10,139
Non-scheduled
Service Landings* 11,698 11,866 12,214 13,024 12,460 10,186 11,745 11,024 11,927
Other
Service Landings* 1,562 1,510 1,462 1,850 1,822 1,820 1,723 1,393 1,115
TOTAL 34,544 32,522 34,860 28,203 26,691 22,212 24,142 23,021 23,181
2004 2005 2006 2007 2008 2009 2010 2011 2012
Scheduled
Service Landings* 2,948 2,784 3,245 3,044 3,014 3,117 4,247 4,210 4,180
Non-scheduled
Service Landings* 6,305 8,182 8,504 7,833 7,988 5,998 7,479 8,379 8,486
Other
Service Landings* 758 973 1,220 1,347 1,140 965 1,015 936 826
TOTAL 10,011 11,939 12,969 12,224 12,142 10,080 12,741 13,525 13,492
Source: St.Lucia Air & Sea Ports Authority
* Landings, as used in this table, mean arrivals & departures.
TOTAL
HEWANORRA AIRPORT
TABLE 20
AIRCRAFT MOVEMENTS BY ACTIVITY
G. F. L. CHARLES AIRPORT
16

Share of Total
Category 2003 2004 2005 2006 2007 2008 2009 2010 2011 2012 Sales (2012)
Domestic Use 93,329 95,877 98,917 101,635 104,784 103,214 107,820 113,757 113,506 103,005 -9.3% 33.4%
Ave. No. of Consumers 44,980 46,347 47,417 48,697 49,199 51,444 52,748 53,566 54,415 55,110 1.3%
Commercial Use 91,779 95,697 101,597 103,431 106,924 105,374 111,388 116,836 122,098 107,037 -12.3% 34.7%
Ave. No. of Consumers 5,134 5,259 5,423 5,663 5,693 6,104 6,365 6,493 6,583 6,574 -0.1%
Hotel Use 53,109 55,446 56,884 57,485 61,227 65,250 67,130 71,804 68,749 70,007 1.8% 22.7%
Ave. No of Hotels 48 48 52 54 61 65 64 64 58 55 -5.2%
Industrial Use 13,221 13,031 12,522 12,982 15,789 18,626 19,002 18,372 18,761 17,679 -5.8% 5.7%
Ave. No. of Ind Consumers 112 96 98 112 101 98 100 100 101 100 -1.0%
Streetlighting 4,720 6,513 7,480 8,865 9,117 9,511 9,741 9,959 10,263 10,526 2.6% 3.4%
Total Sales 256,158 266,564 277,400 284,398 297,841 301,975 315,081 330,728 333,377 308,254 -7.5% 100.0%
Internal use 11,973 12,134 13,407 13,071 13,185 14,256 14,313 14,127 14,599 14,488 -0.8%
Loss in transmission 37,362 30,439 33,115 34,423 34,672 36,106 33,957 36,033 37,234 37,299 0.2%
Total Generated 305,493 309,137 323,922 331,892 345,698 352,337 363,351 380,888 385,210 360,041 -7%
Line Loss Rate 12.23 9.85 10.22 10.37 10.03 10.25 9.35 9.46 9.67 10.36
ELECTRICITY CONSUMPTION AND OUTPUT
Kilowatt hours (KWh)
Source: LUCELEC
TABLE 21
% Change
(2012/2011)
17

2002 2003 2004 2005 2006 2007 2008 2009 2010 2011 2012
January 12.6 18.8 19.4 26.4 35.9 18.0 13.8 -13.8 -19.2 13.8 17.2
February 12.4 18.8 20.2 26.2 35.4 -5.5 10.7 -26.7 7.9 2.5 4.0
March 12.0 22.4 18.6 25.9 31.5 -3.2 12.3 -28.6 6.0 2.1 4.8
April 15.6 21.5 19.8 32.2 3.7 -2.4 19.8 -31.2 7.2 4.4 6.2
May 15.0 16.5 19.7 32.7 7.4 0.3 22.3 -28 9.2 9.7 6.6
June 15.6 17.8 21.9 29.6 8.0 2.2 32.6 18.8 8.4 10.4 5.7
July 14.3 16.5 20.6 32.4 6.7 3.2 34.6 -18.8 8.3 10.0 4.8
August 16.3 17.7 23.5 34.0 7.5 4.6 34.4 -22.7 9.6 9.7 6.5
September 15.7 18.1 26.3 37.3 8.6 2.8 23.2 -19.6 9.9 19.1 6.6
October 15.9 16.3 24.3 36.5 3.6 6.7 17.1 -19.9 9.7 18.6 7.2
November 17.2 18.3 30.6 35.9 18.0 9.1 4.4 -19.3 11.4 17.5 5.6
December 15.4 17.8 26.3 36.0 3.6 14.9 -3.5 -19.2 10.1 17.9 4.3
Average 14.83 18.38 22.60 32.10 14.15 4.23 18.48 -19.08 6.54 11.31 6.63
Source: LUCELEC
2002 2003 2004 2005 2006 2007 2008 2009 2010 2011 2012
January 2.33 3.19 3.19 4.75 6.73 6.61 8.27 5.22 7.27 9.00 10.17
February 2.59 2.59 3.60 4.90 6.64 6.34 8.35 4.57 7.01 9.59 10.35
March 2.72 3.58 3.00 5.47 6.29 6.57 8.51 4.65 7.10 10.43 10.51
April 2.75 3.42 3.92 5.49 6.80 6.65 9.26 4.87 7.52 10.93 10.64
May 2.70 2.52 3.20 5.24 7.17 6.92 9.51 5.47 7.32 10.26 10.42
June 2.81 2.96 3.63 5.76 7.23 7.11 10.54 6.46 7.35 10.27 10.30
July 2.89 2.63 3.42 5.93 7.10 7.21 10.74 6.46 7.50 10.53 10.53
August 3.07 2.83 3.76 6.42 7.18 7.35 10.72 6.24 7.57 10.14 10.60
September 3.09 3.00 4.17 6.43 7.29 7.17 9.60 6.52 7.62 10.15 10.73
October 2.99 2.64 4.21 6.31 6.79 7.56 8.99 6.56 7.87 10.14 10.41
November 3.19 3.03 5.14 6.75 8.23 7.80 7.72 6.56 7.76 10.50 12.22
December 3.19 2.94 4.59 6.96 6.56 8.38 6.33 6.60 8.06 9.93 10.24
Average 2.86 2.94 3.82 5.87 7.00 7.14 9.05 5.85 7.50 10.16 10.59
Source : LUCELEC
*This represents the fuel price paid by LUCELEC to Hess, the main supplier.
TABLE 22
FUEL SURCHARGE (CENTS/UNIT)
TABLE 23
PRICES OF DIESEL PURCHASED BY LUCELEC ($/IMP. GALS.)*
18

2003 2004 2005 2006 2007 2008 2009 2010 2011r 2012pre
January 86.16 86.21 88.45 94.40 95.32 100.00 103.08 105.19 106.86 111.44
February 86.60 85.96 89.33 94.15 94.15 101.37 102.87 105.13 106.21 111.11
March 86.79 86.35 89.91 94.05 94.83 101.97 102.49 105.15 107.09 111.36
April 86.55 86.60 90.74 94.79 94.35 102.55 102.63 105.72 107.31 111.39
May 87.09 87.91 91.33 94.88 95.81 102.76 101.90 105.40 108.40 111.38
June 86.89 88.21 91.37 95.18 96.54 104.39 102.20 105.86 108.91 112.36
July 86.70 88.99 92.54 94.64 97.17 105.70 102.67 105.94 109.62 112.24
August 86.26 88.84 91.37 95.08 96.44 105.75 102.40 106.18 109.17 112.49
September 85.96 87.96 90.89 93.52 98.49 106.32 102.46 106.14 108.90 112.26
October 86.35 87.57 91.28 93.62 100.19 106.82 101.90 105.91 109.78 117.72
November 86.11 88.99 92.93 94.20 100.78 106.22 101.99 105.60 110.03 117.42
December 86.35 89.38 94.01 94.64 101.07 104.90 101.28 105.56 110.61 116.15
Annual Average 86.48 87.75 91.18 94.43 97.10 104.06 102.32 105.65 108.57 113.11
Inflation Rates as at December:
(Moving Average) 1.0% 1.5% 3.9% 3.6% 2.8% 7.2% -1.7% 3.3% 2.8% 4.2%
(Point to Point) 0.5% 3.5% 5.2% 0.7% 6.8% 3.8% -3.4% 4.2% 4.8% 5.0%
Source: Government Statistics Department
pre = preliminary
r=revised
TABLE 24
CONSUMER PRICE INDEX
Annual Inflation Rates
Base Year January 2008 = 100
19
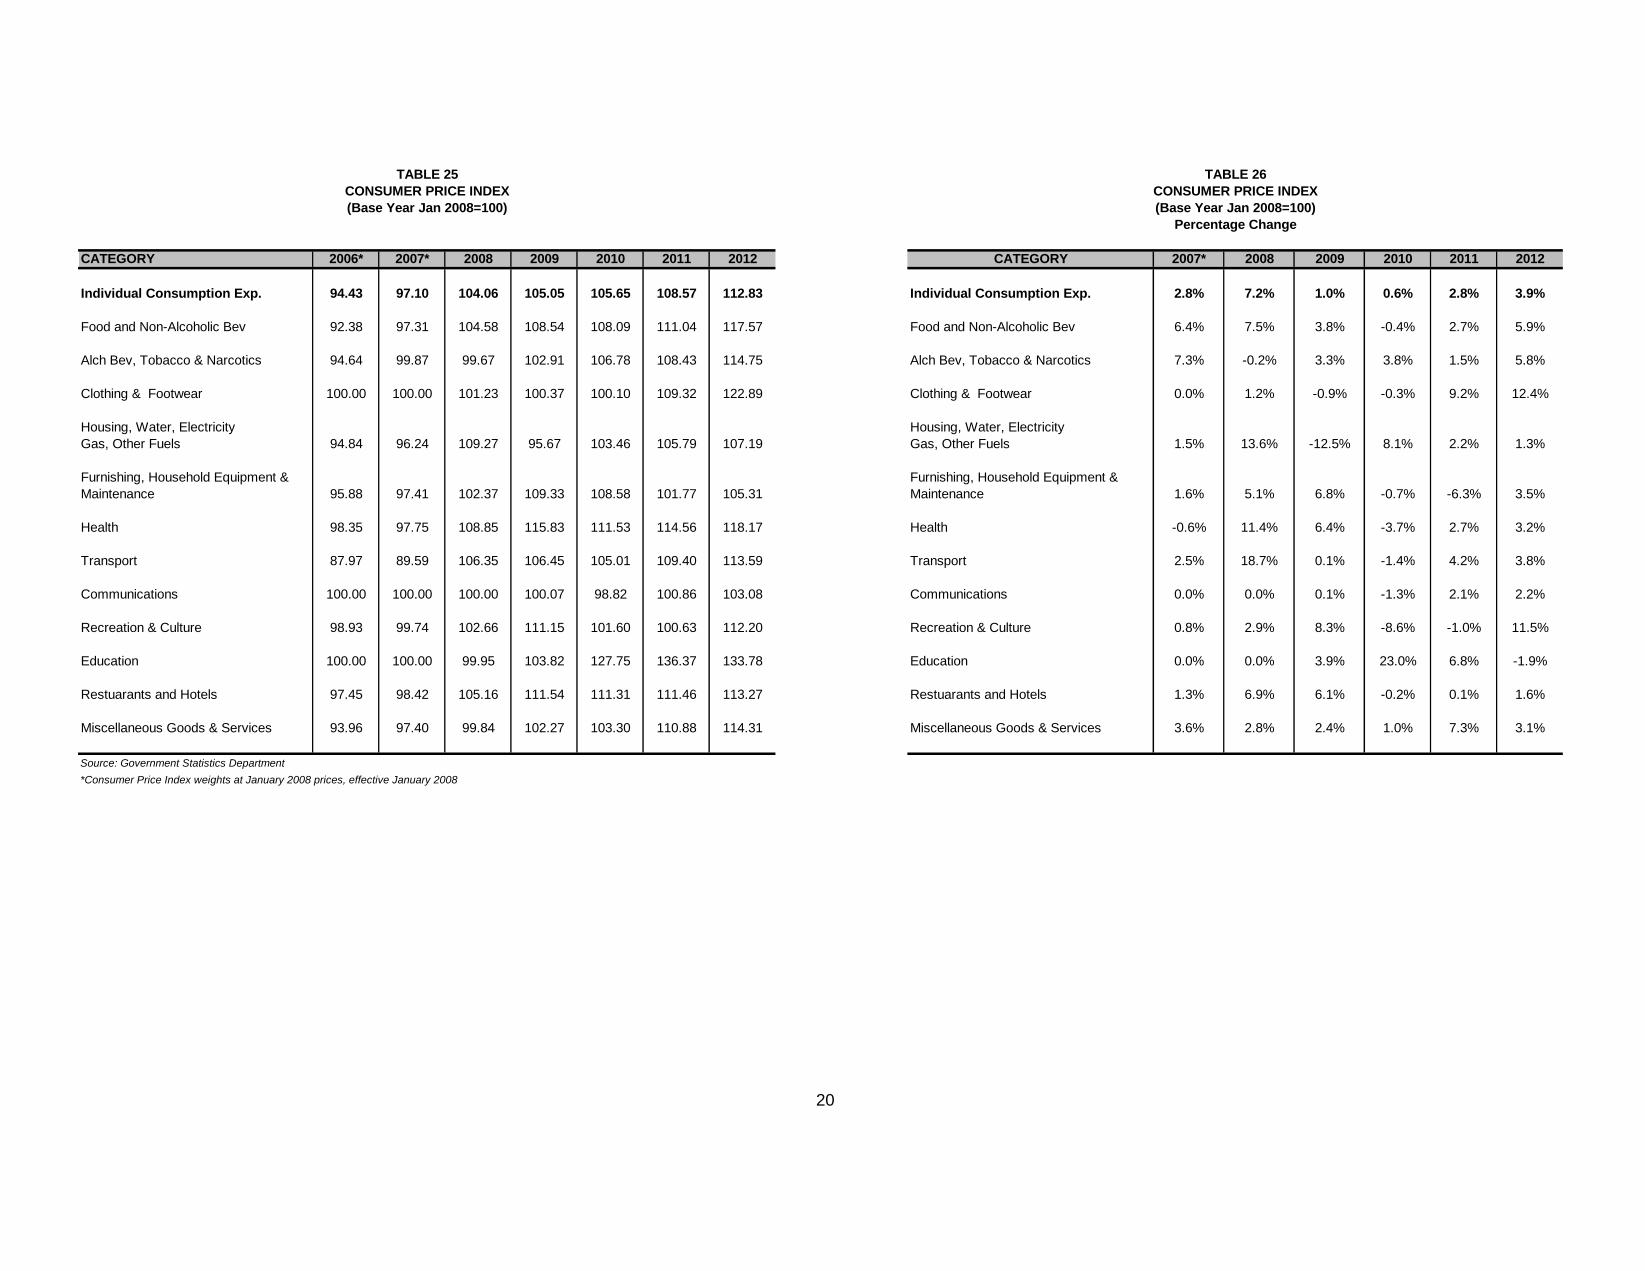
CATEGORY 2006* 2007* 2008 2009 2010 2011 2012 CATEGORY 2007* 2008 2009 2010 2011 2012
Individual Consumption Exp. 94.43 97.10 104.06 105.05 105.65 108.57 112.83 Individual Consumption Exp. 2.8% 7.2% 1.0% 0.6% 2.8% 3.9%
Food and Non-Alcoholic Bev 92.38 97.31 104.58 108.54 108.09 111.04 117.57 Food and Non-Alcoholic Bev 6.4% 7.5% 3.8% -0.4% 2.7% 5.9%
Alch Bev, Tobacco & Narcotics 94.64 99.87 99.67 102.91 106.78 108.43 114.75 Alch Bev, Tobacco & Narcotics 7.3% -0.2% 3.3% 3.8% 1.5% 5.8%
Clothing & Footwear 100.00 100.00 101.23 100.37 100.10 109.32 122.89 Clothing & Footwear 0.0% 1.2% -0.9% -0.3% 9.2% 12.4%
Housing, Water, Electricity Housing, Water, Electricity
Gas, Other Fuels 94.84 96.24 109.27 95.67 103.46 105.79 107.19 Gas, Other Fuels 1.5% 13.6% -12.5% 8.1% 2.2% 1.3%
Furnishing, Household Equipment & Furnishing, Household Equipment &
Maintenance 95.88 97.41 102.37 109.33 108.58 101.77 105.31 Maintenance 1.6% 5.1% 6.8% -0.7% -6.3% 3.5%
Health 98.35 97.75 108.85 115.83 111.53 114.56 118.17 Health -0.6% 11.4% 6.4% -3.7% 2.7% 3.2%
Transport 87.97 89.59 106.35 106.45 105.01 109.40 113.59 Transport 2.5% 18.7% 0.1% -1.4% 4.2% 3.8%
Communications 100.00 100.00 100.00 100.07 98.82 100.86 103.08 Communications 0.0% 0.0% 0.1% -1.3% 2.1% 2.2%
Recreation & Culture 98.93 99.74 102.66 111.15 101.60 100.63 112.20 Recreation & Culture 0.8% 2.9% 8.3% -8.6% -1.0% 11.5%
Education 100.00 100.00 99.95 103.82 127.75 136.37 133.78 Education 0.0% 0.0% 3.9% 23.0% 6.8% -1.9%
Restuarants and Hotels 97.45 98.42 105.16 111.54 111.31 111.46 113.27 Restuarants and Hotels 1.3% 6.9% 6.1% -0.2% 0.1% 1.6%
Miscellaneous Goods & Services 93.96 97.40 99.84 102.27 103.30 110.88 114.31 Miscellaneous Goods & Services 3.6% 2.8% 2.4% 1.0% 7.3% 3.1%
Source: Government Statistics Department
*Consumer Price Index weights at January 2008 prices, effective January 2008
Percentage Change
TABLE 25
CONSUMER PRICE INDEX
(Base Year Jan 2008=100)
TABLE 26
CONSUMER PRICE INDEX
(Base Year Jan 2008=100)
20
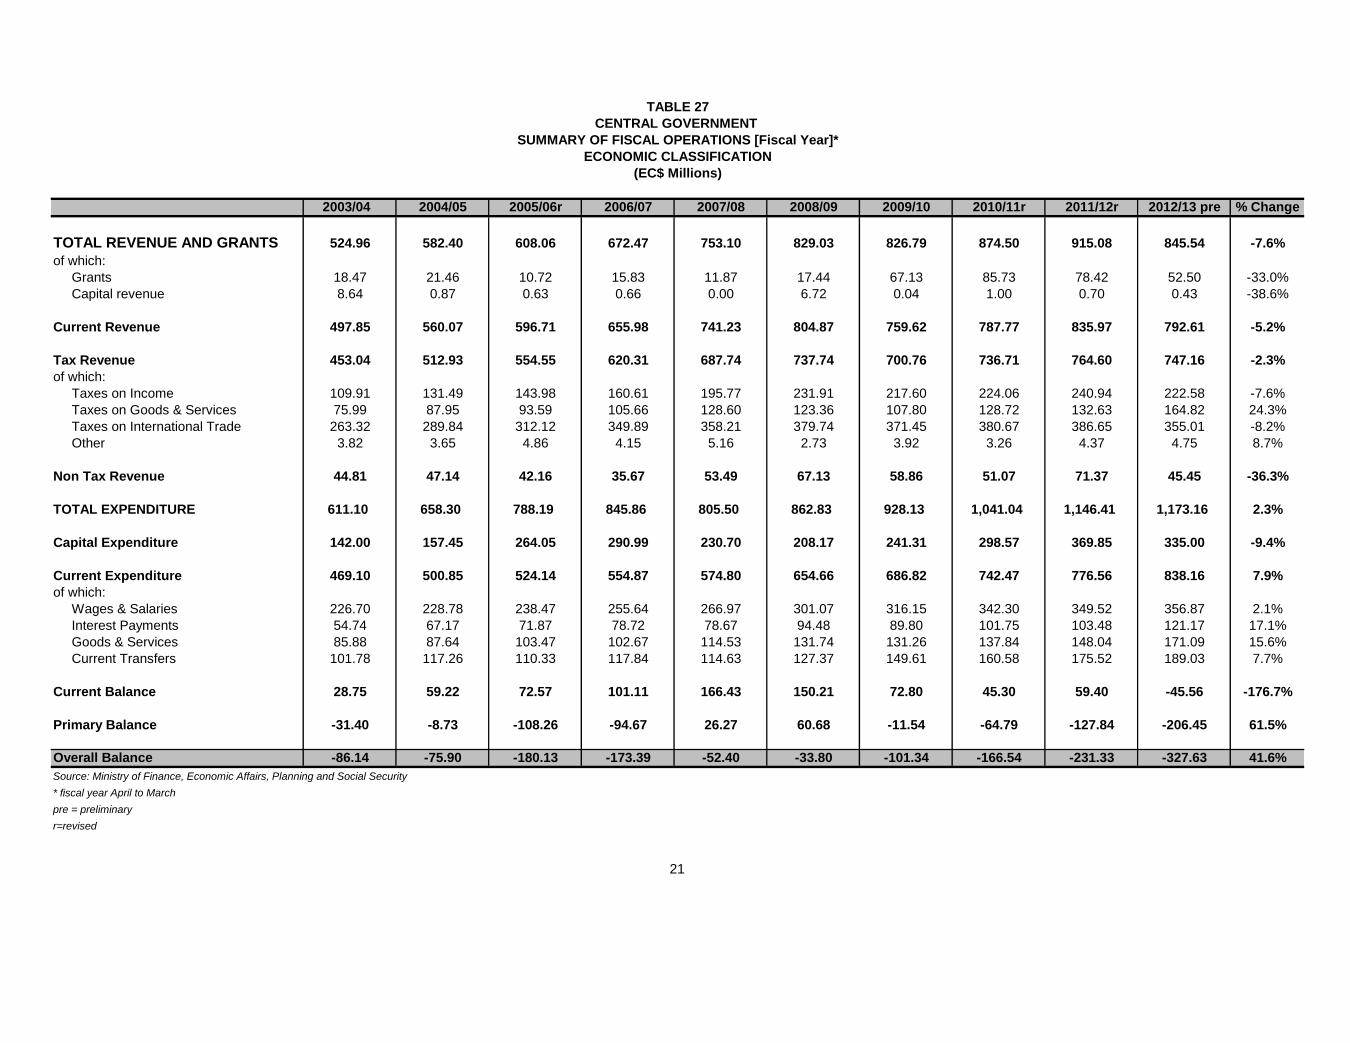
2003/04 2004/05 2005/06r 2006/07 2007/08 2008/09 2009/10 2010/11r 2011/12r 2012/13 pre % Change
TOTAL REVENUE AND GRANTS 524.96 582.40 608.06 672.47 753.10 829.03 826.79 874.50 915.08 845.54 -7.6%
of which:
Grants 18.47 21.46 10.72 15.83 11.87 17.44 67.13 85.73 78.42 52.50 -33.0%
Capital revenue 8.64 0.87 0.63 0.66 0.00 6.72 0.04 1.00 0.70 0.43 -38.6%
Current Revenue 497.85 560.07 596.71 655.98 741.23 804.87 759.62 787.77 835.97 792.61 -5.2%
Tax Revenue 453.04 512.93 554.55 620.31 687.74 737.74 700.76 736.71 764.60 747.16 -2.3%
of which:
Taxes on Income 109.91 131.49 143.98 160.61 195.77 231.91 217.60 224.06 240.94 222.58 -7.6%
Taxes on Goods & Services 75.99 87.95 93.59 105.66 128.60 123.36 107.80 128.72 132.63 164.82 24.3%
Taxes on International Trade 263.32 289.84 312.12 349.89 358.21 379.74 371.45 380.67 386.65 355.01 -8.2%
Other 3.82 3.65 4.86 4.15 5.16 2.73 3.92 3.26 4.37 4.75 8.7%
Non Tax Revenue 44.81 47.14 42.16 35.67 53.49 67.13 58.86 51.07 71.37 45.45 -36.3%
TOTAL EXPENDITURE 611.10 658.30 788.19 845.86 805.50 862.83 928.13 1,041.04 1,146.41 1,173.16 2.3%
Capital Expenditure 142.00 157.45 264.05 290.99 230.70 208.17 241.31 298.57 369.85 335.00 -9.4%
Current Expenditure 469.10 500.85 524.14 554.87 574.80 654.66 686.82 742.47 776.56 838.16 7.9%
of which:
Wages & Salaries 226.70 228.78 238.47 255.64 266.97 301.07 316.15 342.30 349.52 356.87 2.1%
Interest Payments 54.74 67.17 71.87 78.72 78.67 94.48 89.80 101.75 103.48 121.17 17.1%
Goods & Services 85.88 87.64 103.47 102.67 114.53 131.74 131.26 137.84 148.04 171.09 15.6%
Current Transfers 101.78 117.26 110.33 117.84 114.63 127.37 149.61 160.58 175.52 189.03 7.7%
Current Balance 28.75 59.22 72.57 101.11 166.43 150.21 72.80 45.30 59.40 -45.56 -176.7%
Primary Balance -31.40 -8.73 -108.26 -94.67 26.27 60.68 -11.54 -64.79 -127.84 -206.45 61.5%
Overall Balance -86.14 -75.90 -180.13 -173.39 -52.40 -33.80 -101.34 -166.54 -231.33 -327.63 41.6%
Source: Ministry of Finance, Economic Affairs, Planning and Social Security
* fiscal year April to March
pre = preliminary
r=revised
TABLE 27
CENTRAL GOVERNMENT
SUMMARY OF FISCAL OPERATIONS [Fiscal Year]*
ECONOMIC CLASSIFICATION
(EC$ Millions)
21

2003/04 2004/05 2005/06 2006/07 2007/08 223.11 200.90 2010/11r 2011/12 r 2012/13 pre
TOTAL REVENUE AND GRANTS 23.6% 24.2% 23.3% 23.1% 24.1% 26.0% 25.6% 25.6% 26.0% 22.9%
of which:
Grants 0.8% 0.9% 0.4% 0.5% 0.4% 0.5% 2.1% 2.5% 2.2% 1.4%
Capital revenue 0.4% 0.0% 0.0% 0.0% 0.0% 0.2% 0.0% 0.0% 0.0% 0.0%
Current Revenue 22.4% 23.2% 22.9% 22.6% 23.8% 25.2% 23.5% 23.1% 23.8% 21.5%
Tax Revenue 20.4% 21.3% 21.3% 21.3% 22.0% 23.1% 21.7% 21.6% 21.8% 20.2%
of which:
Taxes on Income 4.9% 5.5% 5.5% 5.5% 6.3% 7.3% 6.7% 6.6% 6.9% 6.0%
Taxes on Property 0.2% 0.2% 0.2% 0.1% 0.2% 0.1% 0.1% 0.1% 0.1% 0.1%
Taxes on Goods & Services 3.4% 3.6% 3.6% 3.6% 4.1% 3.9% 3.3% 3.8% 3.8% 4.5%
Taxes on International Trade 11.8% 12.0% 12.0% 12.0% 11.5% 11.9% 11.5% 11.2% 11.0% 9.6%
Non Tax Revenue 2.0% 2.0% 1.6% 1.2% 1.7% 2.1% 1.8% 1.5% 2.0% 1.2%
TOTAL EXPENDITURE 27.5% 27.3% 30.2% 29.1% 25.8% 27.0% 28.7% 30.5% 32.6% 31.8%
Capital Expenditure 6.4% 6.5% 10.1% 10.0% 7.4% 6.5% 7.5% 8.8% 10.5% 9.1%
Current Expenditure 21.1% 20.8% 20.1% 19.1% 18.4% 20.5% 21.2% 21.8% 22.1% 22.7%
of which:
Wages & Salaries 10.2% 9.5% 9.1% 8.8% 8.6% 9.4% 9.8% 10.0% 9.9% 9.7%
Interest Payments 2.5% 2.8% 2.8% 2.7% 2.5% 3.0% 2.8% 3.0% 2.9% 3.3%
Goods & Services 3.9% 3.6% 4.0% 3.5% 3.7% 4.1% 4.1% 4.0% 4.2% 4.6%
Current Transfers 4.6% 4.9% 4.2% 4.1% 3.7% 4.0% 4.6% 4.7% 5.0% 5.1%
Current Balance 1.3% 2.5% 2.8% 3.5% 5.3% 4.7% 2.3% 1.3% 1.7% -1.2%
Primary Balance -1.4% -0.4% -4.2% -3.3% 0.8% 1.9% -0.4% -1.9% -3.6% -5.6%
Overall Balance -3.9% -3.1% -6.9% -6.0% -1.7% -1.1% -3.1% -4.9% -6.6% -8.9%
GDP at market prices 2,223.91 2,409.90 2,608.29 2,908.90 3,119.18 3,193.98 3,234.79 3,410.96 3,514.68 3,690.41
Source: Ministry of Finance, Economic Affairs, Planning and Social Security
pre = preliminary
r = revised
TABLE 28
SUMMARY OF CENTRAL GOVERNMENT FISCAL OPERATIONS
AS A RATIO OF GDP
ECONOMIC CLASSIFICATION
22

2003/04 2004/05 2005/06 2006/07 2007/08 223.11 200.90 2010/11r 2011/12r 2012/13pre Change
TOTAL REVENUE AND GRANTS 524.96 582.40 608.06 672.47 753.10 829.03 826.79 874.50 915.08 845.70 -7.6%
Capital Grants 18.47 21.46 10.72 15.83 11.87 17.44 67.13 85.73 78.42 52.50 -33.0%
Capital Revenue 8.64 0.87 0.63 0.66 0.00 6.72 0.04 1.00 0.70 0.43 -38.6%
CURRENT REVENUE 497.85 560.07 596.71 655.98 741.23 804.87 759.62 787.77 835.97 792.77 -5.2%
Tax Revenue 453.04 512.93 554.55 620.31 687.74 737.74 700.76 736.71 764.60 747.32 -2.3%
Tax on Income 109.91 131.49 143.98 160.61 195.77 231.91 217.60 224.06 240.94 222.58 -7.6%
Individuals 43.75 49.69 58.36 63.82 71.33 75.97 77.43 83.27 90.95 91.18 0.3%
Withholdings 3.86 3.73 5.05 12.50 5.22 12.26 11.58 14.33 25.29 26.20 3.6%
Corporations 44.80 54.65 60.59 65.24 91.95 113.70 94.18 94.64 92.45 76.56 -17.2%
Arrears 24.89 31.62 29.43 27.20 34.91 37.52 42.22 41.45 40.76 37.15 -8.9%
LessTax Refunds -7.40 -8.21 -9.45 -8.14 -7.63 -7.55 -7.81 -9.63 -8.51 -8.51 0.0%
Tax on Property** 3.82 3.65 4.86 4.15 5.16 2.73 3.92 3.26 4.37 4.91 12.4%
Tax On Goods And Services 75.99 87.95 93.59 105.66 128.60 123.36 107.80 128.72 132.63 164.82 24.3%
Consumption tax (domestic) 6.57 6.31 8.32 8.05 9.85 6.38 6.35 5.67 6.11 4.22 -31.0%
Excise tax (domestic) 7.17 7.57 7.47 3.89 2.59 6.61 9.73 13.51 12.83 7.40 -42.3%
Hotel Accommodation tax 22.17 26.26 28.69 29.53 33.45 35.02 24.50 34.25 39.62 22.40 -43.5%
Insurance Premium Tax 4.11 4.52 5.03 5.90 7.17 7.41 6.83 7.04 8.21 7.31 -11.0%
Licences 16.63 18.82 15.11 15.49 25.39 19.91 20.04 25.66 23.87 23.46 -1.7%
Fuel Surcharge 3.11 3.21 3.33 3.44 3.57 3.63 4.06 3.92 3.95 3.87 -1.9%
Stamp Duties (Inland Revenue) 11.48 15.21 16.47 25.96 31.49 25.70 20.12 16.13 15.51 18.90 21.9%
Cellular Tax 4.75 6.04 7.63 9.05 11.95 12.81 12.56 17.74 18.63 10.47 -43.8%
Passenger Facility Fee 0.00 0.00 1.54 4.35 3.14 5.89 3.61 4.80 3.90 3.17 -18.8%
Value-Added Tax 63.62
Tax on International Trade and Transactions 263.32 289.84 312.12 349.89 358.21 379.74 371.45 380.67 386.65 355.01 -8.2%
Consumption Tax (Imports) 114.43 117.16 104.67 111.54 112.24 136.28 140.17 113.70 111.93 48.30 -56.9%
Import Duty 69.45 75.25 87.22 98.35 107.01 103.65 93.25 101.35 106.07 98.72 -6.9%
Thruput Charges 0.4 0.53 5.92 1.12 3.11 6.52 7.88 5.63 4.05 2.56 -36.7%
Travel Tax 4.91 5.50 4.05 3.95 3.30 4.41 3.60 3.85 4.03 3.08 -23.5%
Service Charge (imports) 39.31 46.44 53.78 65.38 64.76 67.93 58.99 62.95 69.17 68.18 -1.4%
Environmental Levy 11.74 13.46 17.45 21.56 18.03 15.97 14.35 16.18 16.19 8.17 -49.6%
Airport Tax 4.39 5.98 4.91 6.87 5.90 11.81 10.05 8.70 8.91 9.22 3.5%
Security Charge 0.15 0.82 0.84 2.00 0.88 0.93 1.51 0.64 1.05 1.23 17.1%
Excise tax (imports) 18.53 24.69 33.28 39.12 42.98 32.23 41.65 67.67 65.22 49.61 -23.9%
National Security Levy - - - - - - - - 0.04 0.00
Value-Added Tax (net of refunds) 65.94
Non-Tax Revenue 44.81 47.14 42.16 35.67 53.49 67.13 58.86 51.07 71.37 45.45 -36.3%
E.C.C.B. Profits 1.79 0.00 0.00 0.00 3.32 6.96 4.53 5.29 1.95 0.68 -65.0%
Interest and rents 10.37 14.95 12.15 8.95 13.63 16.15 13.85 10.61 31.47 7.15 -77.3%
Fees, Fines and Sales 20.22 20.52 20.07 19.29 27.71 33.57 30.49 21.12 24.70 24.79 0.4%
Other Non Tax Revenues 7.00 7.91 6.92 7.43 8.83 10.45 9.99 14.05 13.25 12.83 -3.2%
Memo item :Property tax (CCC collections) 1.62 1.20 n/a 2.00 2.48 2.04 2.54 2.10 -17.3%
Source: Ministry of Finance, Economic Affairs, Planning and Social Security
* April to March
**Does not include property tax collections by the CCC
pre = preliminary
r = revised
TABLE 29
CENTRAL GOVERNMENT REVENUE*
ECONOMIC CLASSIFICATION
(EC$ Millions)
23

2004/05 2005/06 2006/07 2007/08 2008/09 2009/10 2010/11r 2011/12r 2012/13pre Change
Wages and Salaries 228.78 238.47 255.64 266.97 301.07 316.15 342.30 349.52 356.87 2.1% Wages 29.43 30.08 34.70 35.53 38.22 39.53 41.20 42.14 42.74 1.4% Salaries 193.81 195.76 219.21 231.44 246.51 276.62 292.50 302.63 306.95 1.4% Retro-active 5.54 12.63 1.74 0.00 16.33 0.00 8.60 4.75 7.18 51.0%
Interest Payments 67.17 71.87 78.72 78.67 94.48 89.80 101.75 103.48 121.17 17.1% Domestic 22.08 21.82 27.68 30.66 44.06 46.24 58.17 62.94 74.88 19.0% Foreign 44.78 59.29 51.04 48.01 50.42 43.56 43.58 40.54 46.30 14.2%
Goods and Services 87.64 103.47 102.67 114.53 131.74 131.26 137.84 148.04 171.09 15.6% Travel & Subsistence 8.45 8.62 9.29 9.52 10.74 10.43 10.25 10.08 10.44 3.6% Utilities 13.87 19.16 17.96 19.39 23.18 20.29 21.94 26.01 32.32 24.3% Supplies & Materials 11.98 16.15 15.04 16.03 20.17 21.08 20.79 24.88 25.32 1.8% Operating & Maintenance 9.73 11.43 12.57 15.96 18.17 18.56 20.05 21.49 23.18 7.8% Rental 18.49 21.35 19.85 23.39 28.12 28.20 30.68 30.33 34.80 14.8% Communications 7.70 7.59 7.64 9.09 9.51 9.80 8.92 9.64 14.91 54.6% Other 17.43 19.17 20.33 21.15 21.85 22.90 25.21 25.61 30.12 17.6%
Current Transfers 117.26 110.33 117.84 114.63 127.37 149.61 160.58 175.52 189.03 7.7% Public sector 66.38 61.70 62.04 58.92 62.04 72.86 69.12 70.08 79.19 13.0% Private sector 4.04 5.31 8.61 6.49 12.76 19.40 27.01 32.91 39.59 20.3% Subsidies 1.17 0.90 4.68 2.53 6.97 14.30 18.36 23.49 30.20 28.6% Other 2.87 4.41 3.93 3.96 5.79 5.10 8.65 9.42 9.39 -0.3% N.I.C 5.23 4.00 6.20 5.60 6.79 7.25 8.02 9.10 9.92 9.1% Retiring Benefits 41.61 39.32 40.99 43.62 45.78 50.11 56.43 63.43 60.32 -4.9%
Current Expenditure 500.85 524.14 554.87 574.80 654.66 686.82 742.47 776.56 838.16 7.9%
Capital Expenditure 157.45 264.05 290.99 230.70 208.17 241.31 298.57 369.85 335.00 -9.4% Local Revenue 4.38 19.86 13.07 88.51 50.72 1.22 10.61 0.43 0.70 61.8% Grants 21.46 10.72 15.83 11.87 17.44 67.13 85.73 78.42 52.50 -33.0% Loans 77.97 113.07 111.58 38.75 29.61 54.66 86.06 71.00 17.80 -74.9% Bonds 53.64 120.40 150.51 91.57 110.40 118.30 116.17 220.00 264.00 20.0%
TOTAL EXPENDITURE 658.30 788.19 845.86 805.50 862.83 928.13 1,041.04 1,146.41 1,173.16 2.3%
Memo: Principal Repayments 49.63 53.87 78.42 78.07 77.32 79.19 85.11 92.61 82.21
Source: Ministry of Finance, Economic Affairs, Planning and Social Security
pre = preliminary
r = revised
TABLE 30CENTRAL GOVERNMENT EXPENDITURE
ECONOMIC CLASSIFICATION (EC$ Millions)
24

2001 2002 2003 2004 2005 2006 2007 2008 2009 2010 2011 2012 pre 2012/2011 Change
1. TOTAL OUTSTANDING
LIABILITIES 974.3 1,092.5 1,239.1 1,440.3 1,528.2 1,641.9 1,768.7 1,789.4 1,843.6 2,057.4 2,298.2 2,560.3 11.4%
2. OFFICIAL PUBLIC DEBT 947.8 1,076.6 1,213.2 1,420.2 1,510.9 1,624.7 1,754.0 1,770.9 1,828.9 2,036.6 2,273.2 2,531.3 11.4%
A. Central Government
Outstanding Debt 695.9 826.1 968.2 1,175.9 1,296.3 1,427.4 1,575.7 1,595.8 1,639.1 1,832.1 2,082.9 2,366.8 13.6%
- Domestic 310.6 318.5 231.2 345.9 395.3 470.1 594.5 706.9 708.2 858.5 1,035.9 1,266.8 22.3%
- External 385.4 507.6 737.0 830.0 900.9 957.3 981.2 888.9 930.9 973.6 1,046.9 1,100.0 5.1%
- Treasury Bills/Notes 18.6 22.6 13.1 19.5 58.2 42.7 104.3 144.3%
- Bonds 359.5 329.3 299.3 274.3 253.7 341.1 341.3 0.1%
- Loans 579.1 629.4 576.5 637.2 661.8 663.2 654.4 -1.3%
- Bilateral 70.3 83.2 78.7 69.7 57.3 48.9 61.3 25.3%
- Multilateral 508.8 546.2 497.8 567.5 604.5 614.3 593.2 -3.4%
B. Government Guaranteed
Outstanding Debt 212.5 197.1 187.9 167.9 160.1 143.7 125.5 131.8 117.1 133.0 120.5 106.1 -12.0%
- Domestic 42.8 45.6 74.4 39.2 47.5 45.4 40.2 41.6 41.1 43.2 43.0 38.8 -9.8%
- External 169.7 151.5 140.5 128.7 112.6 98.3 85.3 90.2 75.9 89.8 77.5 67.3 -13.2%
C. Public Non-Guaranteed
Outstanding Debt 39.3 53.4 57.2 56.2 54.5 53.7 52.8 43.3 72.7 71.5 69.8 58.3 -16.4%
- Domestic 16.9 23.0 24.5 23.2 22.0 20.8 19.5 39.5 71.5 71.5 69.8 58.3 -16.4%
- External 22.4 30.4 32.7 33.0 32.6 32.9 33.3 3.8 1.2 0.0 0.0 0.0
3. Outstanding Payables 26.6 15.8 25.9 20.2 17.3 17.2 14.6 18.5 14.7 20.8 25.0 29.0 16.1%
TOTAL (Domestic) 370.3 387.1 330.0 408.2 464.9 536.3 654.2 788.0 820.9 973.1 1,148.8 1,363.9 18.7%
TOTAL (External) 577.5 689.6 910.2 991.7 1,046.1 1,088.5 1,099.9 982.8 1,008.0 1,063.4 1,124.4 1,167.3 3.8%
Memo Item: Official Public Debt/GDP (Revised) 47.6% 53.8% 55.8% 59.9% 59.8% 57.1% 56.7% 55.4% 57.4% 60.2% 65.0% 71.1% 9.5%
Source: Debt & Investment Unit, Ministry of Finance, Economic Affairs, Planning and Social Security
pre = preliminary
r = revised
TABLE 31
TOTAL PUBLIC SECTOR OUTSTANDING LIABILITIES
As at December 31
(EC$ Millions)
25

GRAND TOTAL
(e) CURR. (f) TOTAL (g) ARREARS (h) CURR. (i) TOTAL (j) ARREARS (k) CURR. (l) TOTAL
PRIN. INT. SUB TOTAL d + e PRIN. INT. g + h PRIN. INT. j + k
1. DOMESTIC
A. Monetary Authorities
1. ECCB 0.0 0.0 3.1 3.1 0.0 0.0 3.1
B. Financial Institutions
1. Commercial Banks 0.0 580.4 580.4 38.8 38.8 0.0 58.3 58.3 677.6
2. Insurance Companies 87.4 87.4 0.0 0.0 87.4
3. Other 0.0 397.1 397.1 0.0 0.0 0.0 397.1
C. Non-Financial Private Sector 0.4 0.4 0.0 0.0 0.4
D. Non-Financial Public Sector 0.0 175.6 175.6 0.0 0.0 175.6
E. Other (Private Individuals & Agencies included) 22.9 22.9 0.0 0.0 22.9
F. Short term credits 0.0 0.0 0.0 0.0 0.0 0.0
Sub-Total 0.0 0.0 0.0 1,266.8 1,266.8 0.0 0.0 38.8 38.8 0.0 0.0 58.3 58.3 1,363.9
11. EXTERNAL
A. Monetary Authorities
1. ECCB 0.0 0.0 0.0 0.0 0.0 0.0
2. IMF 51.2 51.2 51.2
B. Int'l Development Institutions
1. C.D.B. 325.2 325.2 56.6 56.6 0.0 381.8
2. E.I.B. 0.7 0.7 7.3 7.3 0.0 0.0 8.0
3. I.F.A.D. 1.1 1.1 0.0 0.0 1.1
4. OPEC 0.0 0.0 0.0 0.0 0.0
5. IDA 173.2 173.2 0.0 0.0 173.2
6. IBRD 41.8 41.8 0.0 0.0 41.8
C. Foreign Governments
1. France 26.3 26.3 0.0 0.0 26.3
2. Kuwait 35.0 35.0 0.0 0.0 0.0 35.0
D. Other Foreign Institutions
1. Regional 25.7 25.7 0.0 0.0 0.0 25.7
2. Other Regional 0.0 0.0 0.0 0.0 0.0 0.0
3. Extra Regional 0.0 0.0 0.0 0.0 0.0 0.0
E. OTHER
1. Royal Merchant Bank 71.4 71.4 0.0 0.0 71.4
2. Citibank 14.0 14.0 0.0 0.0 0.0 14.0
3. FINCOR 0.0 0.0 0.0 0.0 0.0 0.0 0.0 0.0 0.0
4. Other 213.0 213.0 0.0 0.0 0.0 213.0
5. T & T Stock Exchange 121.5 121.5 121.5
6. CDF 3.4 3.4 3.4
Sub-Total 0.0 0.0 0.0 1,100.0 1,100.0 0.0 0.0 67.3 67.3 0.0 0.0 0.0 0.0 1,167.3
Payables 0.0 0.0 0.0 0.0 0.0 0.0 0.0 0.0
GRAND TOTAL 0.0 0.0 0.0 2,366.8 2,366.8 0.0 0.0 106.1 106.1 0.0 0.0 58.3 58.3 2,531.3
Source: Debt & Investment Unit, Ministry of Finance, Economic Affairs, Planning and Social Security
(a) CENTRAL GOV'T.(b) GOVERNMENT GUARANTEED (c) NON-GUARANTEED
(d) ARREARS
TABLE 32
DISTRIBUTION OF OUTSTANDING LIABILITIES
BY CLASS OF HOLDER & TYPE OF LIABILITY
as at December 31, 2012
(EC$ Millions)
OFFICIAL DEBT
26
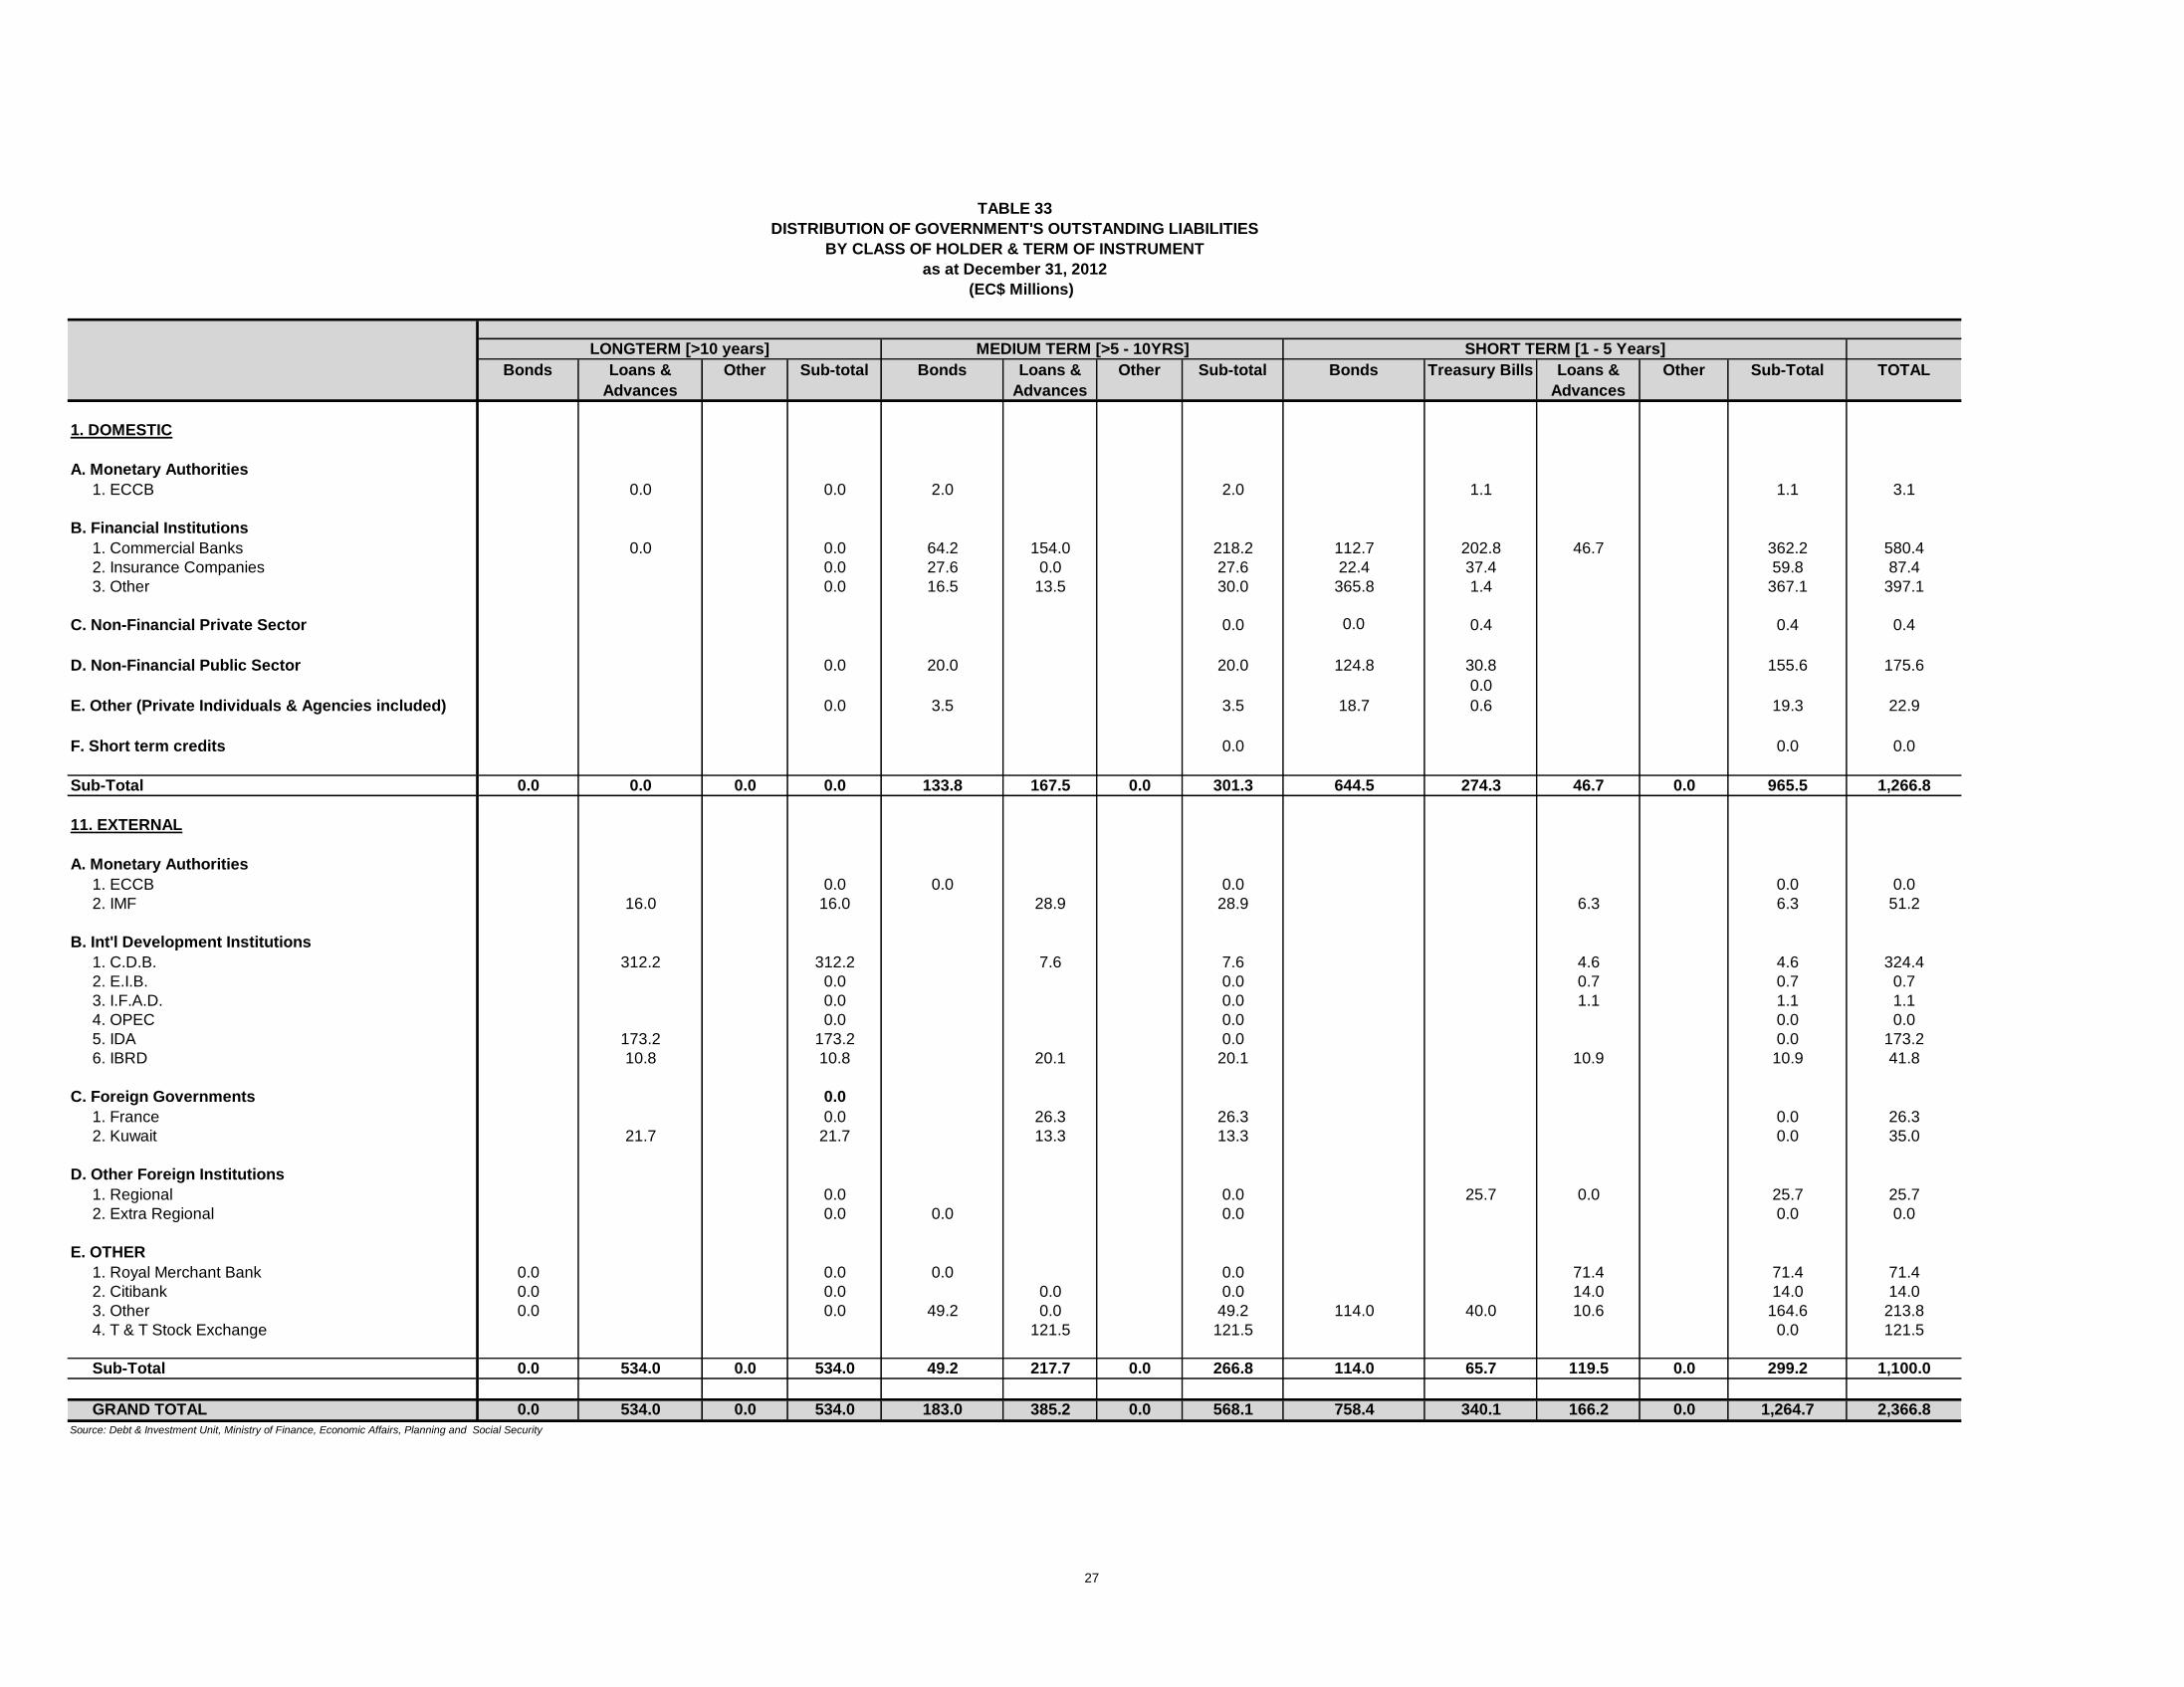
Bonds Loans &
Advances
Other Sub-total Bonds Loans &
Advances
Other Sub-total Bonds Treasury Bills Loans &
Advances
Other Sub-Total TOTAL
1. DOMESTIC
A. Monetary Authorities
1. ECCB 0.0 0.0 2.0 2.0 1.1 1.1 3.1
B. Financial Institutions
1. Commercial Banks 0.0 0.0 64.2 154.0 218.2 112.7 202.8 46.7 362.2 580.4
2. Insurance Companies 0.0 27.6 0.0 27.6 22.4 37.4 59.8 87.4
3. Other 0.0 16.5 13.5 30.0 365.8 1.4 367.1 397.1
C. Non-Financial Private Sector 0.0 0.0 0.4 0.4 0.4
D. Non-Financial Public Sector 0.0 20.0 20.0 124.8 30.8 155.6 175.6
0.0
E. Other (Private Individuals & Agencies included) 0.0 3.5 3.5 18.7 0.6 19.3 22.9
F. Short term credits 0.0 0.0 0.0
Sub-Total 0.0 0.0 0.0 0.0 133.8 167.5 0.0 301.3 644.5 274.3 46.7 0.0 965.5 1,266.8
11. EXTERNAL
A. Monetary Authorities
1. ECCB 0.0 0.0 0.0 0.0 0.0
2. IMF 16.0 16.0 28.9 28.9 6.3 6.3 51.2
B. Int'l Development Institutions
1. C.D.B. 312.2 312.2 7.6 7.6 4.6 4.6 324.4
2. E.I.B. 0.0 0.0 0.7 0.7 0.7
3. I.F.A.D. 0.0 0.0 1.1 1.1 1.1
4. OPEC 0.0 0.0 0.0 0.0
5. IDA 173.2 173.2 0.0 0.0 173.2
6. IBRD 10.8 10.8 20.1 20.1 10.9 10.9 41.8
C. Foreign Governments 0.0
1. France 0.0 26.3 26.3 0.0 26.3
2. Kuwait 21.7 21.7 13.3 13.3 0.0 35.0
D. Other Foreign Institutions
1. Regional 0.0 0.0 25.7 0.0 25.7 25.7
2. Extra Regional 0.0 0.0 0.0 0.0 0.0
E. OTHER
1. Royal Merchant Bank 0.0 0.0 0.0 0.0 71.4 71.4 71.4
2. Citibank 0.0 0.0 0.0 0.0 14.0 14.0 14.0
3. Other 0.0 0.0 49.2 0.0 49.2 114.0 40.0 10.6 164.6 213.8
4. T & T Stock Exchange 121.5 121.5 0.0 121.5
Sub-Total 0.0 534.0 0.0 534.0 49.2 217.7 0.0 266.8 114.0 65.7 119.5 0.0 299.2 1,100.0
GRAND TOTAL 0.0 534.0 0.0 534.0 183.0 385.2 0.0 568.1 758.4 340.1 166.2 0.0 1,264.7 2,366.8
Source: Debt & Investment Unit, Ministry of Finance, Economic Affairs, Planning and Social Security
TABLE 33
DISTRIBUTION OF GOVERNMENT'S OUTSTANDING LIABILITIES
BY CLASS OF HOLDER & TERM OF INSTRUMENT
as at December 31, 2012
LONGTERM [>10 years] MEDIUM TERM [>5 - 10YRS] SHORT TERM [1 - 5 Years]
(EC$ Millions)
27

INTEREST EXCHANGE FOREIGN EC$
LOAN REFERENCE CURRENCY RATE RATE CURRENCY EQUIVALENT
DOMESTIC
1. Central Government
COMMERCIAL BANKS
First Caribbean International Bank
Loan #1 EC$81.0 M)- FCIB Refinanced EC 5.50% 1.0 81,000,000.00
Loan #2 EC$73.0 M)- FCIB Refinanced EC 5.95% 1.0 73,000,000.00
Scotia Bank $US12Million (CSDRMS 2007001) US 7.50% 2.7 5,300,000.00 14,310,000.00
BOSL US$12 Million (CSDRMS 2007006) US 7.50% 1.0 32,400,000.00
Bonds
2004/2014 LCG100714 (ECD50M) (CSDRMS 2004603) EC 7.00% 1.0 39,989,000.00
2004/2014 LCG101114 (ECD30M) (CSDRMS 2004606) EC 7.00% 1.0 27,375,000.00
2009/2015 FLG061215 (USD8.621) US 7.25% 2.7 16,248,600.00
2005/2015 LCG101015 (ECD25M) (CSDRMS 2005005) EC 6.50% 1.0 18,923,000.00
2006/2016 LCG100116 (ECD25M) (CSDRMS 2006003) EC 6.50% 1.0 18,355,000.00
2006/2016 LCG100816 (ECD50M) (CSDRMS 2006010) EC 7.40% 1.0 44,598,000.00
2010/2016 FLG060216 (US$16.379) US 7.25% 2.7 10,481,000.00 28,298,700.00
2007/2017 LCG101017 (ECD31M) (CSDRMS 2007007) EC 7.50% 1.0 28,100,000.00
2007/2017 FLG101017 (USD7M) (CSDRMS 2007008) US 7.75% 2.7 1,666,008.00
2007/2017 LCG101117 (ECD30M) (CSDRMS 2007009) EC 7.50% 1.0 26,990,000.00
2008/2018 LCG100118 (EC$16M) (CSDRMS 2008005) EC 7.50% 1.0 16,000,000.00
2008/2018 LCG100718 (EC$70M) EC 7.50% 1.0 67,860,000.00
2010/2018 LCG0318AA (EC$31.335M) EC 7.50% 1.0 29,815,000.00
2010/2018 LCG080718 (ECD47.711M) EC 7.50% 1.0 40,761,000.00
2012/2020 LCG080320 (ECD$50M) EC 7.10% 1.0 42,475,000.00
2012/2022 LCG100322 (ECD20M) EC 7.40% 1.0 13,390,000.00
2012/2019 LCG071019 (ECD40M) EC 7.00% 1.0 31,565,000.00
2012/2022 LCG101222 (ECD25M) EC 7.50% 1.0 5,480,000.00
2012/20219 EC Global Investments Tranch 4 (7 yrs) 20/07/2019 US 6.95% 2.7 6,324,444.44 17,075,999.99
2012/2022 EC Global Investments Tranch 5 (10 yrs) 20/07/2022 US 7.50% 2.7 6,200,000.00 16,740,000.00
T&T Stock Exchange USD 7.50% 5,000,000.00 13,500,000.00
Treasury Note
2009/2015 LCG060715 (EC$40 Million) (CSDRMS 2004604) EC 7.15% 1.0 37,862,000.00
2009/2014 LCN210814 (ECD 20 Million) EC 7.00% 1.0 11,285,000.00
2008/2013 LCN090713(ECD30M) EC 6.80% 1.0 28,796,000.00
2010/2013 FLN151013 (US$7 M) USD 6.25% 2.7 7,000,000.00 18,900,000.00
2010/2013 LCN151013 (ECD39.526 M) ECD 6.25% 1.0 39,016,000.00
2010/2015 FLN 291115 (USD3.3 M) USD 6.80% 2.7 3,020,000.00 8,154,000.00
2010/2015 LCN 291115 (ECD48.522 M) ECD 6.80% 1.0 33,255,000.00
2011/2013 EC Global Investments Pri. USD20M 16/03/2013 USD 6.25% 2.7 20,000,000.00 54,000,000.00
2012/2014 EC Global Investments Tranche 2 (2 yrs) 20/07/2014 USD 5.45% 2.7 5,074,074.07 13,699,999.99
2012/2017 EC Global Investments Tranche 3 (5 yrs) 20/07/2017 USD 6.50% 2.7 3,197,571.00 8,633,441.70
2012/2016 LCN291016 (ECD60.0M) ECD 6.00% 1.0 58,630,000.00
Treasury Bills
Special Issue EC 4% & 5% 1.0 32,668,582.55
EC Global Investments Tranche 1 (1 year) 20/07/2013 US 5.00% 2.7 3,188,768.93 8,609,676.11
EC Global Investments OTC (ECD40M) (1year) 06/06/12-05/06/13 EC 5.20% 1.0 42,080,000.00
EC Global Investments Pri. USD15M (1 year) 24/02/12-24/02/13 US 5.20% 2.7 15,000,000.00 40,500,000.00
EC Global Investments Pri. ECD25M (1 year) 27/09/12-28/09/13 EC 5.00% 1.0 26,250,000.00
NIC OTC (ECD25M) (1 year) 28/06/12-28/06/13 EC 5.00% 1.0 26,250,000.00
NIC OTC (ECD4.010M) (1 year) 24/12/12 - 24/12/13 EC 4.75% 1.0 4,010,000.00
LCB160113 (EC$25 Million) (180 days) 16/01/12 -16/01/13 EC 6.00% 1.0 11,235,000.00
LCB150113 (EC$16Million) (91 days) 16/10/12 - 15/01/13 EC 6.00% 1.0 8,699,000.00
LCB240113 (EC$11Million) (91 days) 25/10/12 - 24/01/13 EC 4.00% 1.0 8,342,000.00
SUB - TOTAL (Central Gov't) 1,266,791,008.34
2. Government Guaranteed
Bank of Saint Lucia
(a) Dennery Farmco EC 6.00% 1.0 1,304,291.00
(b) Freezone Management Authority EC 1.0 0.00
(c) Soufriere Regional Development Foundation EC 9.00% 1.0 25,227.00
(d) St. Lucia Air & Sea Ports Authority EC 7.75% 1.0 5,206,607.00
(e) St Lucia Fish Marketing Corporation EC 8.50% 1.0 6,385,857.00
(f) St Lucia Marketing Board EC 11.00% 1.0 468,555.00
(g) St. Lucia National Housing Corp. EC 8.00% 1.0 14,190,572.00
(h) St Lucia Tourist Board EC 10.50% 1.0 645,642.00
(i) Water and Sewerage Authority EC 9.00% 1.0 5,108,143.00
(j) Coconut Growers EC 8.00% 1.0 2,500,000.00
1st National Bank
(a) Radio St Lucia EC 8.00% 1.0 1,344,191.00
(b) St Lucia National Housing Corporation EC 1.0 74,221.00
Scotia Bank
(a) St Lucia Air & Sea Ports Authority EC 1.0 1,358,450.00
(b) Radio Saint Lucia Ltd. EC 1.0 23,549.00
First Caribbean International Bank (FCIB)
(a) St Lucia Marketing Board (Current Account) EC 1.0 192,868.00
SUB - TOTAL (Gov't Guaranteed) 38,828,173.00
.
3. Public Non-Guarnateed
Bank of Nova Scotia
-Ferry Terminal and LPC Extension+ Letter of Credit+CC (CSDRMS 2003521) EC$ 4.75% 1.0 5,299,963.00
-Upgrading of Terminal & Rehab. Of Runway of Hewanorra Airport (CSDRMS 1991720) EC$ 3.75% 1.0 8,095,722.00
- National Stadium, Beausejour Cricket Ground (CSDRMS 2007005) EC$ 9.00% 1.0 15,854,471.00
-Castries City Council EC$ 1.0 2,209,558.00
-National Development Corporation EC$ 1.0 21,767,741.00
First Caribbean International Bank (FCIB)
-National Development Corporation (CC / Indemnities) EC 1.0 5,820.00
Bank of St. Lucia Ltd.
SLASPA- Purchase of Equipment & Financing of Capital Projects 5,090,755.00
EC 7.75% 1.0
SUB - TOTAL (Gov't Non-Guaranteed) 58,324,030.00
TOTAL (Domestic) 1,363,943,211.34
LISTING OF OFFICIAL DEBT
as at December 31 2012
TABLE 34
CURRENT BALANCE
28

INTEREST EXCHANGE FOREIGN EC$
LOAN REFERENCE CURRENCY RATE RATE CURRENCY EQUIVALENT
B. EXTERNAL
Bonds
-Royal Merchant Bank
EC$63.5 M CSDRMS 2000071 EC$ 8.95% 1.0 63,500,000.00 63,500,000.00
US$41M CSDRMS 2003090 USD 7.75% 2.7 2,928,571.43 7,907,142.86
-CITIBANK
US$25M CSDRM 2002080-81 USD 7.75% 2.7 0.00 0.00
BDS$10M CSDRMS 2002082 BDS 7.25% 1.4 4,166,666.62 5,624,999.94
EC$20M CSDRMS 2001060 EC$ 9.90% 1.0 5,833,332.67 5,833,332.67
US$15M CSDRMS 2003030 USD 7.75% 2.7 937,500.00 2,531,250.00
T&T Stock Exchange USD 7.50% 2.7 45,000,000.00 121,500,000.00
-Other: RGSM, NSDB
2004/2014 LCG100714 EC$ 7.00% 1.0 10,011,000.00
2004/2014 LCG101114 EC$ 7.00% 1.0 2,625,000.00
2005/2015 LCG101015 EC$ 6.50% 1.0 6,077,000.00
2009/2015 FLG061215 US$ 7.25% 2.7 7,028,100.00
2010/2016 FLG060216 (US$16.379) US$ 7.25% 2.7 5,898,000.00 15,924,600.00
2006/2016 LCG100116 EC$ 6.50% 1.0 6,645,000.00
2006/2016 LCG100816 EC$ 7.40% 1.0 5,402,000.00
2007/2017 LCG101017 EC$ 7.50% 1.0 2,900,000.00
2007/2017 FLG101017 EC$ 7.75% 1.0 17,233,992.00
2007/2017 LCG101117 EC$ 7.50% 1.0 3,010,000.00
2008/2018 LCG100718 (EC$70M) EC$ 7.50% 1.0 2,140,000.00
2010/2018 LCG0318AA (EC$31.335M) EC$ 7.50% 1.0 1,520,000.00
2010/2018 LCG080718 (ECD47.711M) EC$ 7.50% 1.0 6,950,000.00
2012/2020 LCG080320 (ECD$50M) EC$ 7.10% 1.0 7,525,000.00
2012/2022 LCG100322 (ECD20M) EC$ 7.40% 1.0 6,610,000.00
2012/2016 LCG071019 (ECD40M) 1.0 8,435,000.00
2012/2016 LCN101222 (ECD25.0M) 7.50% 1.0 19,520,000.00
2012/20219 EC Global Investments Tranch 4 (7 yrs) 20/07/2019 US 6.95% 2.7 1,000,000.00 2,700,000.00
2012/2022 EC Global Investments Tranch 5 (10 yrs) 20/07/2022 US 7.50% 2.7 800,000.00 2,160,000.00
Treasury Note
2009/2015 LCG060715 (ECD40 Million) EC 7.15% 1.0 2,138,000.00
2009/2014 LCN210814 (ECD 20 Million) EC 7.00% 1.0 8,715,000.00
2008/2013 LCN090713 EC 1.0 1,204,000.00
2010/2013 FLN151013 (US$7 M) US$ 6.25% 2.7 0.00 0.00
2010/2013 LCN151013 (ECD39.526 M) EC$ 6.25% 1.0 510,000.00
2010/2015 FLN 291115 (USD3.3M) US$ 6.80% 2.7 756,000.00
2010/2015 LCN 291115 (ECD48.522M) EC$ 6.80% 1.0 15,267,000.00
2012/2016 LCN291016 (ECD60.0M) EC$ 6.00% 1.0 1,370,000.00
2012/2014 EC Global Investments Tranche 2 (2 yrs) 20/07/2014 USD 5.45% 2.7 1,925,925.93 5,200,000.01
2012/2017 EC Global Investments Tranche 3 (5 yrs) 20/07/2017 USD 6.50% 2.7 2,000,000.00 5,400,000.00
Treasury Bills
LCB160113 (EC$25 Million) (180 days) EC 6.00% 1.0 13,765,000.00
LCB150113 (EC$16Million) (91 days) 16/10/12 - 15/01/13 EC 6.00% 1.0 7,301,000.00
LCB240113 (EC$11Million) (91 days) 25/10/12 - 24/01/13 EC 4.00% 1.0 2,658,000.00
EC Global Investments Tranche 1 (1 year) 20/07/2013 US 5.00% 2.7 14,811,231.07 39,990,323.89
LOANS
Bilateral:
(i) Rodney Bay Sewerage (CSDRMS 2001040) C LC 0006 01 C EUR 5.00% 3.6 0.00 0.00
(ii) Castries Cul-De Sac Highway (CSDRMS 1995051) C LC 1005 01 C USD 3.50% 2.7 0.00 0.00
(iii) Northern Water Supply (CSDRMS 2001020) C LC 1009 01G EUR 5.00% 3.6 0.00 0.00
(iv) Rehabilitation of Tertiary Roads (CSDRMS 2003050) CLC 3000 01 Z EUR 3.50% 3.6 7,375,490.76 26,265,597.69
Kuwait Fund for Arab Economic Development
(i) Castries Cul-De Sac Highway (CSDRMS 1995040) 470 KWD 4.00% 9.6 0.00 0.00
(ii) Castries/Choc Bay Junction Hwy.Imp. (CSDRMS 2002020) 646 KWD 4.00% 9.6 1,382,043.27 13,269,964.87
(iii) Agriculture Feeder Roads (CSDRMS 2009019) 759 KWD 3.50% 9.6 2,263,086.11 21,729,473.90
Multilateral:
Caribbean Development Bank:
West Indies Shipping Corporation (CSDRMS19992030) 6/SFR-R-ST.L EUR 2.00% 3.6 33,525.59 119,391.33
Purchase of Equity - SLDB (CSDRMS1982020) 27/SFR-ST.L USD 0.75% 2.7 207,058.16 559,057.03
Construction of Water Supply Schemes (CSDRMS1986015) 37/SFR-ST.L SDR 4.00% 4.1 685,094.59 2,842,923.32
Technical Vocational Education (CSDRMS 1987020) 39/SFR-ST.L SDR 0.75% 4.1 1,253,490.15 5,201,583.01
(CSDRMS 1987010) 39/SFR-ST.L USD 2.00% 2.7 516,543.72 1,394,668.04
Water Supply (4th Loan) (CSDRMS 1990012) 8/SFR-OR-STL USD 2.00% 2.7 2,778,067.03 7,500,780.98
(CSDRMS 2008015) USD 3.84% 2.7 0.00 0.00
Road Improvement and Maintenance (CSDRMS 2008027) 13/SFR-OR-ST.L USD 3.84% 2.7 0.00 0.00
(CSDRMS 19920012) USD 2.00% 2.7 266,598.80 719,816.76
Road Improvement & Maintenance (supp) 43/SFR-ST.L SDR 0.75% 4.1 804,349.10 3,337,791.37
Road Improvement & Maintenance # 2 (CSDRMS 1994011) 15/SFR-OR-ST.L USD 2.00% 2.7 752,500.00 2,031,750.00
(CSDRMS 2008021) 15/SFR-OR-ST.L USD 3.84% 2.7 533,307.92 1,439,931.38
Caribbean Court of Justice (CSDRMS 2003070) 15/OR-STL USD 3.84% 2.7 440,000.00 1,188,000.00
Economic Reconstruction Programme (CSDRMS 2003081) 28/SFR-OR-St.L USD 2.50% 2.7 2,890,385.81 7,804,041.69
(Schools & Health) (CSDRMS 2008017) USD 3.84% 2.7 1,777,401.31 4,798,983.54
Banana Recovery Project (CSDRMS 2003011) 27/SFR-OR USD 2.50% 2.7 2,213,134.64 5,975,463.53
Rehabilitation of Storm Damages (CSDRMS 1995011) 45/SFR-STL USD 2.00% 2.7 2,988,506.04 8,068,966.31
OECS Waste Management Project (CSDRMS 1995044) 18/SFR-OR-ST.L USD 3.84% 2.7 1,005,882.32 2,715,882.26
(CSDRMS 1995043) 2.00% 2.7 1,036,000.00 2,797,200.00
(CSDRMS 2000020) 18/SFR-OR-ST.L (ADD) 2.00% 2.7 1,763,071.08 4,760,291.92
Basic Education Reform Project (CSDRMS 1995092) 16/SFR-OR-ST.L USD 2.00% 2.7 2,305,065.82 6,223,677.71
LISTING OF OFFICIAL DEBT
as at December 31 2012
CURRENT BALANCE
TABLE 35
29
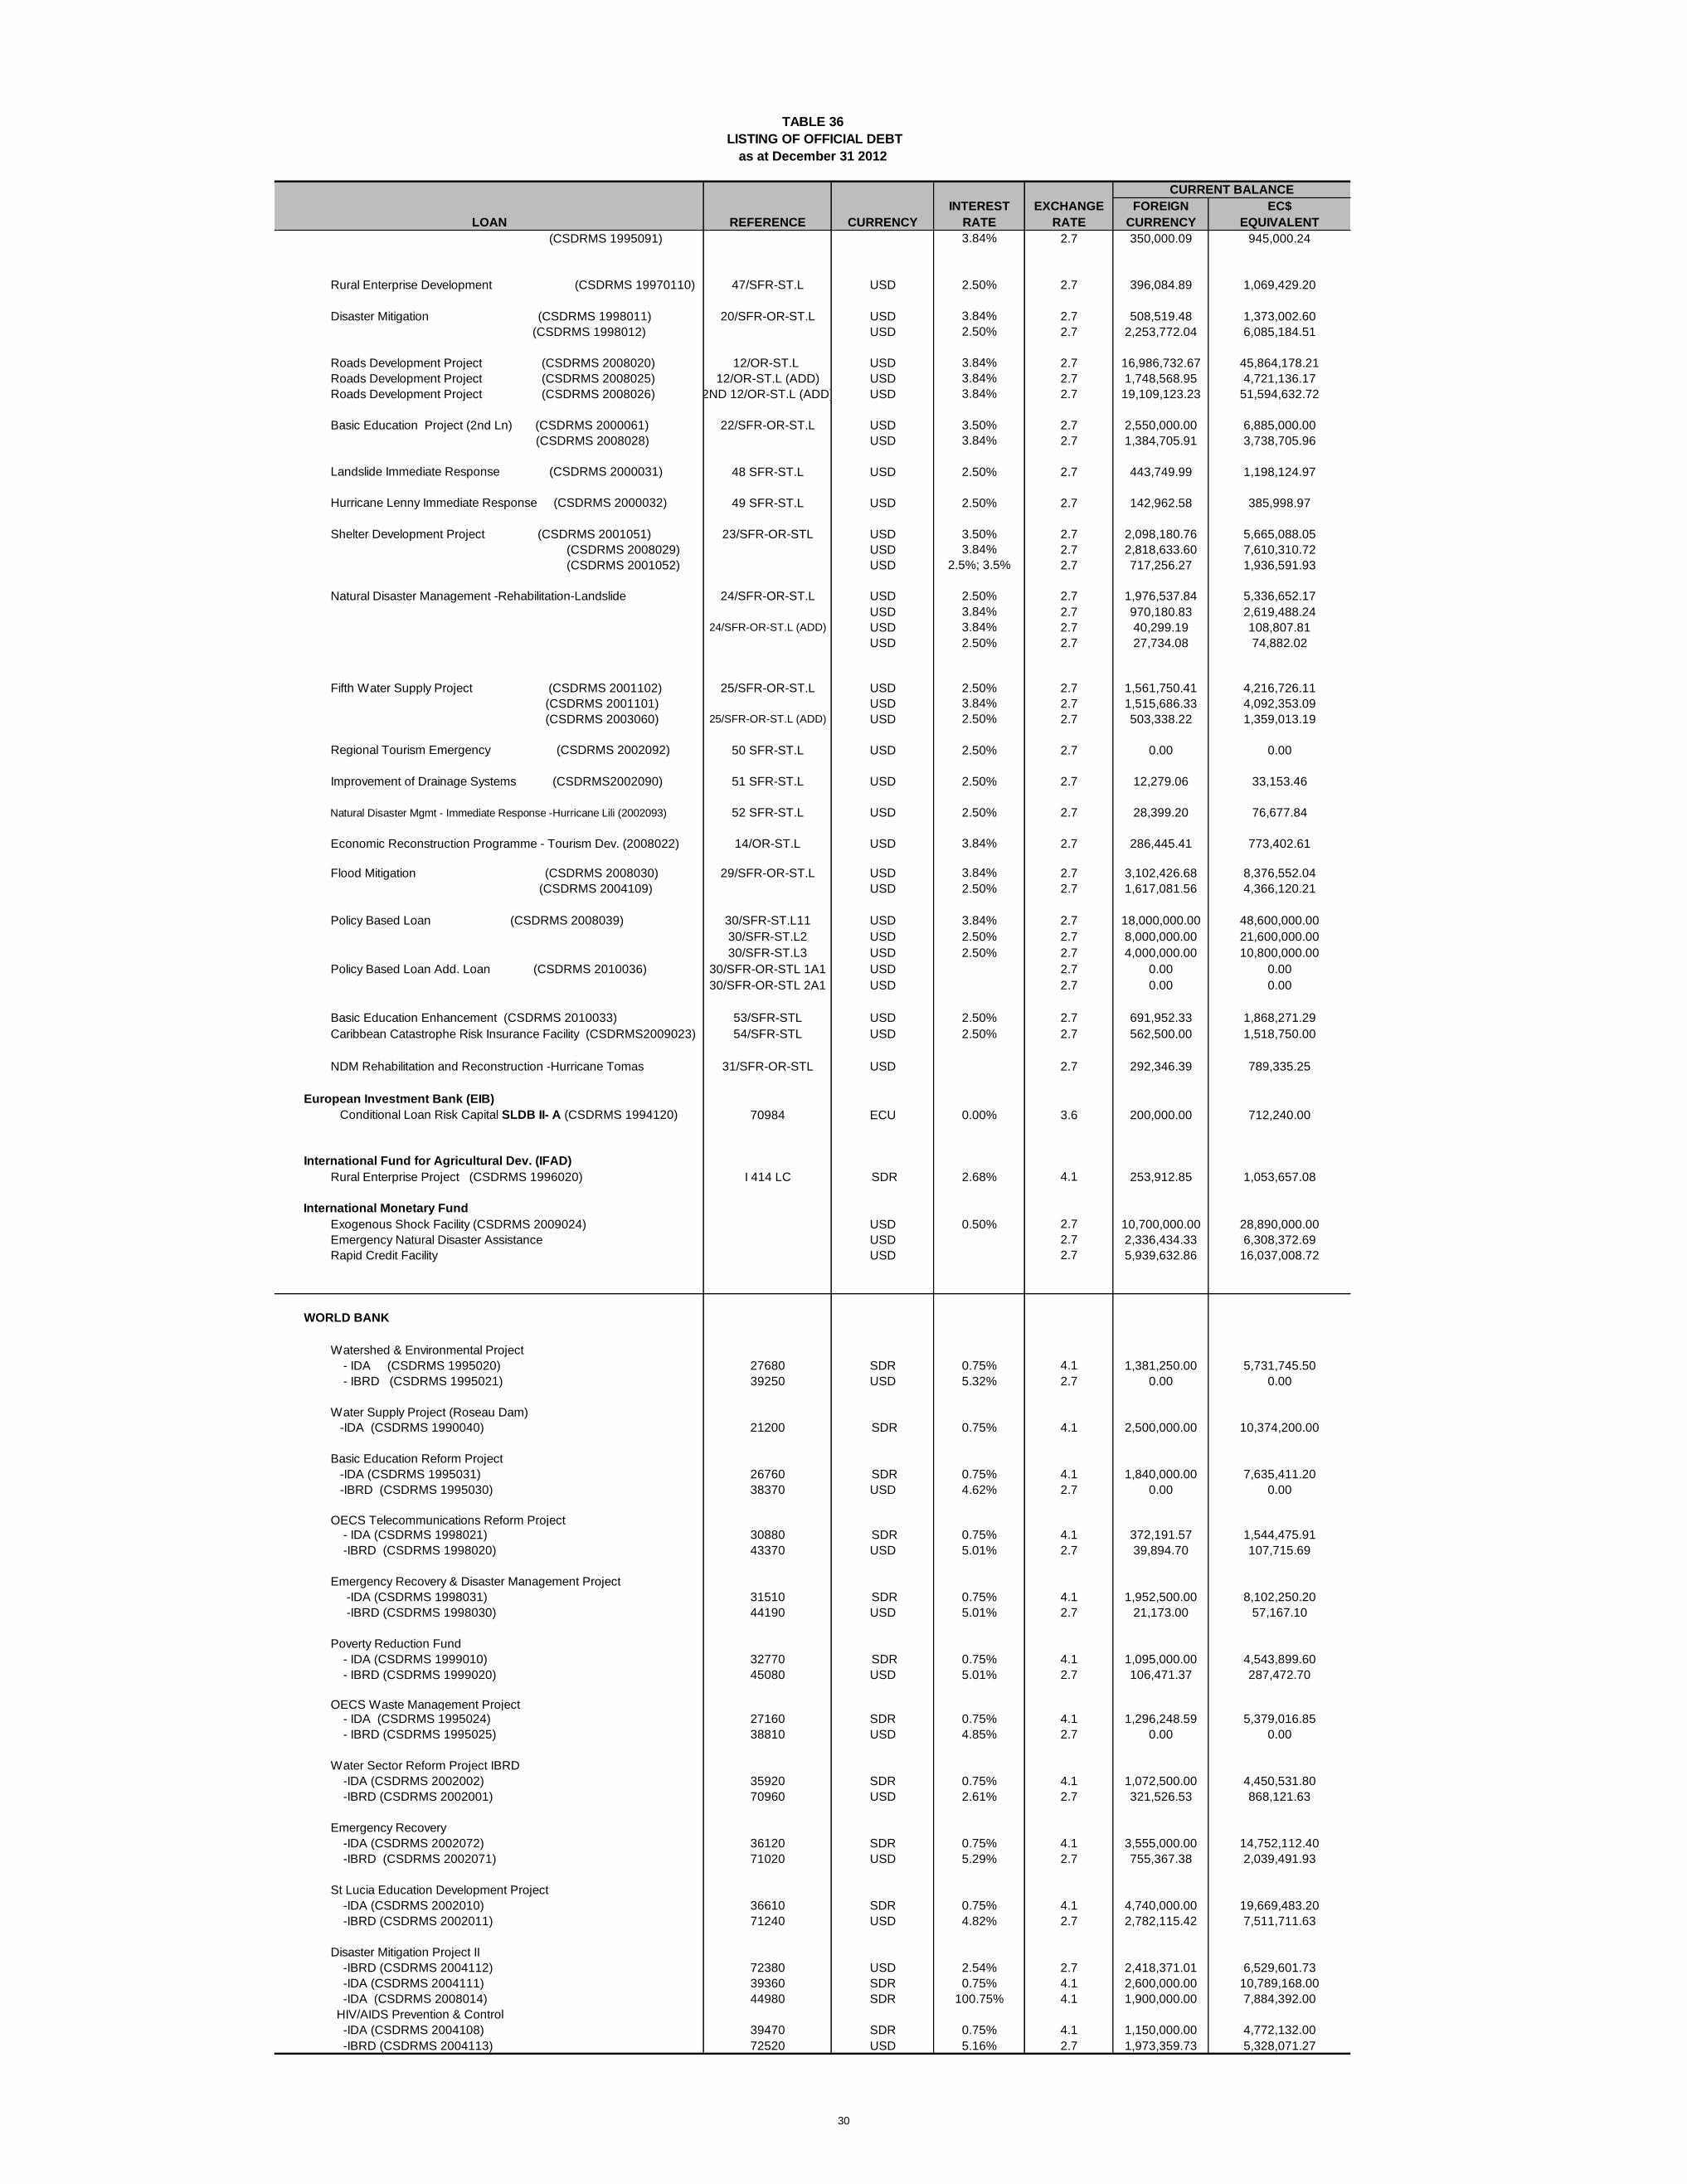
INTEREST EXCHANGE FOREIGN EC$
LOAN REFERENCE CURRENCY RATE RATE CURRENCY EQUIVALENT
(CSDRMS 1995091) 3.84% 2.7 350,000.09 945,000.24
Rural Enterprise Development (CSDRMS 19970110) 47/SFR-ST.L USD 2.50% 2.7 396,084.89 1,069,429.20
Disaster Mitigation (CSDRMS 1998011) 20/SFR-OR-ST.L USD 3.84% 2.7 508,519.48 1,373,002.60
(CSDRMS 1998012) USD 2.50% 2.7 2,253,772.04 6,085,184.51
Roads Development Project (CSDRMS 2008020) 12/OR-ST.L USD 3.84% 2.7 16,986,732.67 45,864,178.21
Roads Development Project (CSDRMS 2008025) 12/OR-ST.L (ADD) USD 3.84% 2.7 1,748,568.95 4,721,136.17
Roads Development Project (CSDRMS 2008026) 2ND 12/OR-ST.L (ADD) USD 3.84% 2.7 19,109,123.23 51,594,632.72
Basic Education Project (2nd Ln) (CSDRMS 2000061) 22/SFR-OR-ST.L USD 3.50% 2.7 2,550,000.00 6,885,000.00
(CSDRMS 2008028) USD 3.84% 2.7 1,384,705.91 3,738,705.96
Landslide Immediate Response (CSDRMS 2000031) 48 SFR-ST.L USD 2.50% 2.7 443,749.99 1,198,124.97
Hurricane Lenny Immediate Response (CSDRMS 2000032) 49 SFR-ST.L USD 2.50% 2.7 142,962.58 385,998.97
Shelter Development Project (CSDRMS 2001051) 23/SFR-OR-STL USD 3.50% 2.7 2,098,180.76 5,665,088.05
(CSDRMS 2008029) USD 3.84% 2.7 2,818,633.60 7,610,310.72
(CSDRMS 2001052) USD 2.5%; 3.5% 2.7 717,256.27 1,936,591.93
Natural Disaster Management -Rehabilitation-Landslide 24/SFR-OR-ST.L USD 2.50% 2.7 1,976,537.84 5,336,652.17
USD 3.84% 2.7 970,180.83 2,619,488.24
24/SFR-OR-ST.L (ADD) USD 3.84% 2.7 40,299.19 108,807.81
USD 2.50% 2.7 27,734.08 74,882.02
Fifth Water Supply Project (CSDRMS 2001102) 25/SFR-OR-ST.L USD 2.50% 2.7 1,561,750.41 4,216,726.11
(CSDRMS 2001101) USD 3.84% 2.7 1,515,686.33 4,092,353.09
(CSDRMS 2003060) 25/SFR-OR-ST.L (ADD) USD 2.50% 2.7 503,338.22 1,359,013.19
Regional Tourism Emergency (CSDRMS 2002092) 50 SFR-ST.L USD 2.50% 2.7 0.00 0.00
Improvement of Drainage Systems (CSDRMS2002090) 51 SFR-ST.L USD 2.50% 2.7 12,279.06 33,153.46
Natural Disaster Mgmt - Immediate Response -Hurricane Lili (2002093) 52 SFR-ST.L USD 2.50% 2.7 28,399.20 76,677.84
Economic Reconstruction Programme - Tourism Dev. (2008022) 14/OR-ST.L USD 3.84% 2.7 286,445.41 773,402.61
Flood Mitigation (CSDRMS 2008030) 29/SFR-OR-ST.L USD 3.84% 2.7 3,102,426.68 8,376,552.04
(CSDRMS 2004109) USD 2.50% 2.7 1,617,081.56 4,366,120.21
Policy Based Loan (CSDRMS 2008039) 30/SFR-ST.L11 USD 3.84% 2.7 18,000,000.00 48,600,000.00
30/SFR-ST.L2 USD 2.50% 2.7 8,000,000.00 21,600,000.00
30/SFR-ST.L3 USD 2.50% 2.7 4,000,000.00 10,800,000.00
Policy Based Loan Add. Loan (CSDRMS 2010036) 30/SFR-OR-STL 1A1 USD 2.7 0.00 0.00
30/SFR-OR-STL 2A1 USD 2.7 0.00 0.00
Basic Education Enhancement (CSDRMS 2010033) 53/SFR-STL USD 2.50% 2.7 691,952.33 1,868,271.29
Caribbean Catastrophe Risk Insurance Facility (CSDRMS2009023) 54/SFR-STL USD 2.50% 2.7 562,500.00 1,518,750.00
NDM Rehabilitation and Reconstruction -Hurricane Tomas 31/SFR-OR-STL USD 2.7 292,346.39 789,335.25
European Investment Bank (EIB)
Conditional Loan Risk Capital SLDB II- A (CSDRMS 1994120) 70984 ECU 0.00% 3.6 200,000.00 712,240.00
International Fund for Agricultural Dev. (IFAD)
Rural Enterprise Project (CSDRMS 1996020) I 414 LC SDR 2.68% 4.1 253,912.85 1,053,657.08
International Monetary Fund
Exogenous Shock Facility (CSDRMS 2009024) USD 0.50% 2.7 10,700,000.00 28,890,000.00
Emergency Natural Disaster Assistance USD 2.7 2,336,434.33 6,308,372.69
Rapid Credit Facility USD 2.7 5,939,632.86 16,037,008.72
WORLD BANK
Watershed & Environmental Project
- IDA (CSDRMS 1995020) 27680 SDR 0.75% 4.1 1,381,250.00 5,731,745.50
- IBRD (CSDRMS 1995021) 39250 USD 5.32% 2.7 0.00 0.00
Water Supply Project (Roseau Dam)
-IDA (CSDRMS 1990040) 21200 SDR 0.75% 4.1 2,500,000.00 10,374,200.00
Basic Education Reform Project
-IDA (CSDRMS 1995031) 26760 SDR 0.75% 4.1 1,840,000.00 7,635,411.20
-IBRD (CSDRMS 1995030) 38370 USD 4.62% 2.7 0.00 0.00
OECS Telecommunications Reform Project
- IDA (CSDRMS 1998021) 30880 SDR 0.75% 4.1 372,191.57 1,544,475.91
-IBRD (CSDRMS 1998020) 43370 USD 5.01% 2.7 39,894.70 107,715.69
Emergency Recovery & Disaster Management Project
-IDA (CSDRMS 1998031) 31510 SDR 0.75% 4.1 1,952,500.00 8,102,250.20
-IBRD (CSDRMS 1998030) 44190 USD 5.01% 2.7 21,173.00 57,167.10
Poverty Reduction Fund
- IDA (CSDRMS 1999010) 32770 SDR 0.75% 4.1 1,095,000.00 4,543,899.60
- IBRD (CSDRMS 1999020) 45080 USD 5.01% 2.7 106,471.37 287,472.70
OECS Waste Management Project - IDA (CSDRMS 1995024) 27160 SDR 0.75% 4.1 1,296,248.59 5,379,016.85
- IBRD (CSDRMS 1995025) 38810 USD 4.85% 2.7 0.00 0.00
Water Sector Reform Project IBRD
-IDA (CSDRMS 2002002) 35920 SDR 0.75% 4.1 1,072,500.00 4,450,531.80
-IBRD (CSDRMS 2002001) 70960 USD 2.61% 2.7 321,526.53 868,121.63
Emergency Recovery
-IDA (CSDRMS 2002072) 36120 SDR 0.75% 4.1 3,555,000.00 14,752,112.40
-IBRD (CSDRMS 2002071) 71020 USD 5.29% 2.7 755,367.38 2,039,491.93
St Lucia Education Development Project
-IDA (CSDRMS 2002010) 36610 SDR 0.75% 4.1 4,740,000.00 19,669,483.20
-IBRD (CSDRMS 2002011) 71240 USD 4.82% 2.7 2,782,115.42 7,511,711.63
Disaster Mitigation Project II
-IBRD (CSDRMS 2004112) 72380 USD 2.54% 2.7 2,418,371.01 6,529,601.73
-IDA (CSDRMS 2004111) 39360 SDR 0.75% 4.1 2,600,000.00 10,789,168.00
-IDA (CSDRMS 2008014) 44980 SDR 100.75% 4.1 1,900,000.00 7,884,392.00
HIV/AIDS Prevention & Control
-IDA (CSDRMS 2004108) 39470 SDR 0.75% 4.1 1,150,000.00 4,772,132.00
-IBRD (CSDRMS 2004113) 72520 USD 5.16% 2.7 1,973,359.73 5,328,071.27
LISTING OF OFFICIAL DEBT
as at December 31 2012
CURRENT BALANCE
TABLE 36
30

INTEREST EXCHANGE FOREIGN EC$
LOAN REFERENCE CURRENCY RATE RATE CURRENCY EQUIVALENT
Water Supply Infrastructure Improvement Project
-IDA (CSDRMS 2005002) 40650 SDR 0.80% 4.1 2,600,000.00 10,789,168.00
-IBRD (CSDRMS 2005001) 72970 USD 4.61% 2.7 2,887,500.05 7,796,250.14
-IDA (CSDRMS) Addl Financing (CSDRMS 2007018) 40651 SDR 4.1 1,298,597.03 5,388,762.12
Telecom & Information & Communication Tech. Dev Project
-IDA (CSDRMS 2005005) 40570 SDR 0.50% 4.1 199,286.95 826,977.07
-IBRD (CSDRMS 2005004) 47770 USD 4.61% 2.7 160,162.99 432,440.07
OECS Catastrophe Insurance Project
-IDA (CSDRMS 2007001) 42710 SDR 0.75% 4.1 2,950,128.11 12,242,087.62
OECS Skills for Inclusive Growth
-IDA (CSDRMS 2007022) 43000 SDR 0.75% 4.1 1,263,961.58 5,245,036.09
OECS E-Gov't for Regional Integration Programme
-IDA (CSDRMS 2008013) 44510 SDR 0.75% 4.1 583,850.00 2,422,790.67
Economic and Social Development Policy Loan
-IDA (CSDRMS 2010030) 47520 SDR 0.50% 4.1 5,300,000.00 21,993,304.00
-IBRD (CSDRMS 2010029) 79190 IBRD 1.78% 2.7 4,000,000.00 10,800,000.00
Caribbean Regional Communications Infrastructure Program
- IDA Q7840 SDR 4.1 78,248.00 324,704.16
-IDA 51170 SDR 4.1 0.00 0.00
Saint Lucia Hurrican Tomas Emergency Recovery Loan
-IDA 48710 48710 SDR 0.75% 4.1 1,692,313.78 7,022,560.65
Eastern Caribbean Energy Regulatory Authority (ECERA)
-IDA 49360 SDR 0.75% 4.1 327,605.00 1,359,455.92
SUB - TOTAL (Central Gov't) 1,100,018,534.91
2. GOVERNMENT GUARANTEED
(a) National Development Corporation (N.D.C.)
CDB Loans:
Industrial Estate VIII (CSDRMS 2008019) 11/SFR-OR USD 5.32% 2.7 0.00 0.00
(CSDRMS 1991033) USD 2.00% 2.7 474,446.08 1,281,004.42
(CSDRMS 1991032) TTD 5.42% 0.0 0.00 0.00
(b) CDF
On-lent loan- Private Sector USD 3.00% 2.7 1,244,000.00 3,358,800.00
(c) BANK OF ST. LUCIA (SLDB).
CDB Loans:
Student Loan Scheme # 6 (CSDRMS 2002052) 26/SFR-OR-ST.L USD 2.50% 2.7 2,586,089.95 6,982,442.87
(CSDRMS 2002051) USD 3.84% 2.7 5,158,818.21 13,928,809.17
Consolidated Line of Credit II (CSDRMS 1988011) 40/SFR-STL USD 3.00% 2.7 366,050.41 988,336.11
Consolidated Line of Credit III (CSDRMS 1991052) 12/SFR-OR USD 2.00% 2.7 0.00 0.00
(CSDRMS 1991051) 3.84% 2.7 0.00 0.00
Consolidated Line of Credit IV (CSDRMS 1993011) 14/SFR-OR-St.L USD 2.00% 2.7 187,979.06 507,543.46
(CSDRMS 1993012) 3.84% 2.7 380,031.68 1,026,085.54
Consolidated Line of Credit V (CSDRMS 1995071) 17/SFR-OR-STL USD 2.00% 2.7 288,517.43 778,997.06
(CSDRMS 1995072) 3.84% 2.7 1,475,880.19 3,984,876.51
Consolidated Line of Credit VI (CSDRMS 1998041) 19/SFR-OR.STL USD 2.00% 2.7 527,692.36 1,424,769.37
(CSDRMS 1998042) 3.84% 2.7 2,214,659.18 5,979,579.79
Consolidated Line of Credit VII (CSDRMS 2000011) 21/SFR-OR-STL USD 2.00% 2.7 1,192,173.44 3,218,868.29
(CSDRMS 2000012) 3.84% 2.7 2,955,210.27 7,979,067.73
European Investment Bank:
Bank of St Lucia Global Loan (CSDRMS 2007026) 21435 USD 3.28% 2.7 2,700,813.48 7,292,196.40
Agence Francaise De Developpement:
Refinancing Industry & Tourism BOSL (CSDRMS 1993091) CLC 1001 01 Y USD 4.00% 2.7 0.00 0.00
(d) Air & Sea Ports Authority
CDB:
Fourth Airport Project (CSDRMS 1991022) 10/SFR-OR-ST.L USD 2.00% 2.7 1,138,628.27 3,074,296.33
Upgrading Cruiseship facilities (CSDRMS 1995081) 11/OR USD 3.84% 2.7 2,031,667.30 5,485,501.71
Sub-Total CDB 56,640,178.34
SUB - TOTAL (Gov't Guaranteed) 67,291,174.74
SUB - TOTAL (Non-Guaranteed)
TOTAL (External) 1,167,309,709.65
TOTAL (Gov't Guaranteed) 106,119,347.74
TOTAL (Non-guaranteed) 58,324,030.00
TOTAL (Central Gov't) 2,366,809,543.25
GRAND TOTAL 2,531,252,920.99
Source: Debt & Investment Unit, Ministry of Finance, Economic Affairs, Planning and Social Security
LISTING OF OFFICIAL DEBT
as at December 31 2012
CURRENT BALANCE
TABLE 37
31

CDB: 325,162,770 29.56%
E.I.B.: 712,240 0.06%
I.F.A.D.: 1,053,657 0.10%
IMF 51,235,381 4.66%
IDA 173,243,665 15.75%
IBRD 41,758,044 3.80%
AGENCE FRANCAISSE 26,265,598 2.39%
KUWAIT FUND 34,999,439 3.18%
CITIBANK 13,989,583 1.27%
ROYAL MERCHANT BANK 71,407,143 6.49%
OTHER NSDB 0 0.00%
RGSM 174,976,692 15.91%
T&T Stock Exchange 121,500,000 11.05%
T.BILLS 63,714,324 5.79%
SUB TOTAL 1,100,018,535 100.0%
CDB 56,640,178 84.17%
CDF 3,358,800 4.99%
EIB 7,292,196 10.84%
SUB TOTAL 67,291,175 100.0%
SUB TOTAL 0 0.00%
GRAND TOTAL 1,167,309,710
Source: Debt & Investment Unit, Ministry of Finance, Economic Affairs and National Development
NON-GUARANTEED
TABLE 38
DISTRIBUTION OF PUBLIC SECTOR EXTERNAL LOANS BY CREDITOR
EC$
CENTRAL GOVERNMENT
GOVERNMENT GUARANTEED
as at December 31 2012
32

Economic Sector Disbursed
Outstanding
Debt
Percentage of
DOD
Disbursed
Outstanding
Debt
Percentage of
DOD
Disbursed
Outstanding
Debt
Percentage of
DOD
Agriculture, Fishing & Forestry 10.0 0.9% 9.1 0.8% 28.8 2.5%
Communications & Works
Roads & Bridges 159.7 14.9% 145.6 13.0% 149.2 12.8%
Telecommunications 0.7 0.1% 0.9 0.1% 3.2 0.3%
Other 81.5 7.6% 77.9 6.9% 3.1 0.3%
Education & Training 105.6 9.9% 104.3 9.3% 125.7 10.8%
Foreign Affairs 0.0 0.0% 0.0% 0.0%
Computer Technology 2.6 0.2% 3.7 0.3% 2.4 0.2%
Finance, Insurance, Etc. 204.0 19.1% 274.7 24.4% 618.6 53.0%
Housing & Urban Development 16.3 1.5% 16.0 1.4% 60.6 5.2%
Industrial Development 6.0 0.6% 4.9 0.4% 1.3 0.1%
Health & Social Welfare 11.7 1.1% 11.1 1.0% 71.9 6.2%
Hotel & Tourism Industry 67.8 6.3% 50.1 4.5% 6.3 0.5%
Utilities 83.3 7.8% 80.2 7.1% 81.1 6.9%
Multi-sector 101.3 9.5% 94.9 8.4% 12.4 1.1%
Other 218.0 20.4% 250.9 22.3% 2.7 0.2%
TOTAL 1,068 100.0% 1,124 100.0% 1,167 100.0%
Source: Debt & Investment Unit, Ministry of Finance, Economic Affairs and National Development
TABLE 39
Composition of External Public Debt by Economic Sector
2010 2011 2012
(EC$ Millions)
33

2002 2003 2004 2005 2006 2007 2008 2009 2010 2011 2012
1. NET FOREIGN ASSETS 106.8 337.8 352.7 243.0 117.6 -47.7 -543.3 -536.2 -303.8 -494.7 -582.6
1.1 Central Bank (Imputed Reserves) 248.1 282.6 351.5 308.3 356.9 408.2 378.8 406.6 492.3 512.4 556.4 Imputed Assets 258.9 291.9 360.8 317.6 363.9 419.4 385.8 409.1 493.9 514.4 558.6 Imputed Liabilities 10.8 9.3 9.2 9.2 7.0 11.2 7.0 2.5 1.6 2.0 2.2 1.2 Commercial Banks (Net) -141.3 55.2 1.2 -65.3 -239.3 -455.9 -922.1 -942.8 -796.1 -1,007.1 -1,139.1 External (Net) -191.2 -143.6 -69.4 -82.7 -224.7 -292.1 -525.6 -605.2 -410.1 -592.0 -480.3 Assets 108.3 199.7 299.9 350.5 427.0 486.2 396.9 436.1 421.0 368.4 563.1 Liabilities 299.5 343.3 369.3 433.3 651.7 778.4 922.5 1,041.3 831.1 960.3 1,043.5 Other ECCB Territories (Net) 49.9 198.8 70.6 17.4 -14.6 -163.8 -396.5 -337.6 -386.0 -415.1 -658.7 Assets 124.3 229.2 182.9 284.9 388.1 584.4 306.7 367.7 416.1 454.5 309.5 Liabilities 74.4 30.4 112.3 267.5 402.7 748.2 703.2 705.3 802.1 869.6 968.3
2. NET DOMESTIC ASSETS 1,166.5 1,032.6 1,156.4 1,468.7 1,938.6 2,230.9 2,867.5 3,014.4 2,863.0 3,224.5 3,381.1
2.1 Domestic Credit 1,428.0 1,323.3 1,465.3 1,860.9 2,379.1 3,112.3 3,453.4 3,456.1 3,395.2 3,597.6 3,903.5
2.1.1 Private Sector 1,553.5 1,498.2 1,650.4 2,136.8 2,625.9 3,338.5 3,680.6 3,745.4 3,787.6 3,887.5 4,084.6 Households Credit 730.7 762.0 839.5 951.0 1,068.7 1,191.8 1,273.8 1,240.9 1,307.7 1,349.3 1,570.8 Business Credit 822.8 736.2 810.9 966.3 1,318.1 1,899.0 2,176.1 2,297.7 2,329.7 2,384.4 2,438.3 Loans 810.0 723.3 791.4 951.8 1,301.7 1,881.3 2,133.1 2,288.2 2,324.1 2,379.2 2,434.5 Investments 12.8 12.9 19.5 14.5 16.4 17.7 43.0 9.5 5.6 5.3 3.7 Non-Bank Financial Institutions (NBFI) Credit 28.3 31.6 30.8 36.8 37.2 38.1 57.9 41.3 30.4 22.5 34.3 Loans 13.3 16.3 12.4 18.2 17.8 16.6 21.7 14.9 15.6 5.0 17.2 Investments 14.9 15.3 18.5 18.6 19.4 21.5 36.3 26.3 14.9 17.5 17.1 Subsidiaries & Affiliates Credit 170.1 165.4 180.5 182.8 201.9 209.6 172.8 165.6 119.7 131.3 41.2 Loans 7.5 7.8 8.0 16.0 26.0 24.7 4.2 5.4 11.2 11.4 11.2 Investments 162.7 157.6 172.6 166.7 175.9 184.9 168.6 160.2 108.5 119.9 30.0 2.1.2 Non Financial Public Enterprises (Net) -158.9 -186.4 -194.2 -185.2 -214.8 -243.4 -296.3 -337.0 -340.3 -288.9 -344.8 Credit 65.3 96.0 99.5 120.0 116.2 112.4 115.3 135.6 139.7 134.1 102.7 Loans 65.3 96.0 99.5 120.0 116.2 112.4 115.3 135.6 139.7 134.1 102.7 Investments 0.0 0.0 0.0 0.0 0.0 0.0 0.0 0.0 0.0 0.0 0.0 Deposits 224.2 282.4 293.7 305.2 330.9 355.8 411.6 472.7 480.0 423.0 447.5 2.1.3 Net Credit to General Government (A) + (B) -96.3 -104.4 -130.3 -90.7 -32.0 17.2 69.0 47.7 -52.0 -1.0 163.7
(A) Central Government (Net) -93.8 -100.9 -128.0 -78.7 -26.9 43.5 96.1 55.8 -45.7 -0.8 167.3 (B) Local Government (Net) -2.5 -3.5 -2.3 -11.9 -5.1 -26.2 -27.1 -8.2 -6.3 -0.2 -3.6 Credit to General Government 153.4 140.3 187.3 279.1 290.6 350.5 338.2 287.3 270.9 293.6 409.4 Central Bank Credit 10.8 9.2 9.2 9.2 7.0 11.2 7.0 2.5 1.6 2.0 2.1 Central Bank Loans and Advances 5.5 4.0 3.9 4.2 7.0 11.2 7.0 2.5 1.6 2.0 2.1 Central Bank Advances 3.3 2.9 3.9 4.2 7.0 11.2 7.0 2.5 1.6 2.0 2.1 Advances to Government 0.0 0.0 0.0 0.0 0.0 0.0 0.0 0.0 0.0 0.0 0.0 Gov'ts Operating Accounts 3.3 2.9 3.9 4.2 7.0 11.2 7.0 2.5 1.6 2.0 2.1 Central Bank Loans 2.2 1.1 0.0 0.0 0.0 0.0 0.0 0.0 0.0 0.0 0.0 Central Bank Treasury Bills Holdings 0.2 0.2 0.2 0.0 0.0 0.0 0.0 0.0 0.0 0.0 0.0 Central Bank Debentures 5.0 5.0 5.0 5.0 0.0 0.0 0.0 0.0 0.0 0.0 0.0 Central Bank Interest Due on Securities 0.0 0.0 0.0 0.0 0.0 0.0 0.0 0.0 0.0 0.0 0.0 Central Bank Special Deposit Arrears 0.0 0.0 0.0 0.0 0.0 0.0 0.0 0.0 0.0 0.0 0.0 Commercial Bank Credit 142.6 131.0 178.1 269.9 283.6 339.4 331.2 284.8 269.4 291.6 407.2 To Central Government 142.3 130.7 177.9 269.9 283.5 339.0 330.2 284.7 267.7 286.9 404.9 Commercial Banks Loans & Advances 69.8 31.6 34.5 58.4 87.4 151.9 139.2 107.5 87.5 86.1 180.9 Commercial Banks Treasury Bills Holdings 20.3 18.3 5.5 27.6 23.8 12.8 39.7 46.6 51.2 68.5 44.5 Commercial Banks Debentures 52.2 80.9 137.9 183.9 172.4 174.2 151.3 130.5 129.1 132.3 179.5 To Local Government 0.4 0.3 0.2 0.0 0.1 0.4 1.0 0.1 1.6 4.7 2.3 Commercial Banks Loans & Advances 0.4 0.3 0.2 0.0 0.1 0.4 1.0 0.1 1.6 4.7 2.3 Deposits of General Government (-) 249.7 244.7 317.6 369.7 322.6 333.3 269.2 239.6 322.9 294.6 245.7
Of Central Government 246.9 240.9 315.1 357.8 317.4 306.6 241.1 231.4 315.0 289.7 239.8 Commercial Banks Deposits 239.2 231.1 292.1 338.5 290.6 252.3 240.0 225.6 263.6 235.2 206.9 Central Bank Deposits 7.7 9.8 22.9 19.2 26.8 54.3 1.1 5.7 51.4 54.5 33.0 Of Local Government 2.9 3.7 2.5 12.0 5.2 26.6 28.1 8.3 7.9 4.9 5.9 Commercial Banks Deposits 2.9 3.7 2.5 12.0 5.2 26.6 28.1 8.3 7.9 4.9 5.9 2.2 Other Items (Net) -261.5 -290.7 -308.9 -303.4 -341.9 -759.6 -443.4 -441.7 -532.2 -373.2 -522.4
3. MONETARY LIABILITIES (M2) 1,273.3 1,370.4 1,509.1 1,711.8 2,056.2 2,183.2 2,466.6 2,553.6 2,559.2 2,729.8 2,798.5
3.1 MONEY SUPPLY (M1) 287.6 343.1 481.3 547.3 560.7 639.0 661.4 702.4 644.5 675.4 701.0 Currency with the Public 83.6 91.3 99.2 106.4 126.6 128.0 142.6 198.1 151.5 165.2 163.0 Currency in Circulation 124.4 132.3 140.5 161.7 179.3 187.1 211.8 198.1 212.2 237.6 246.7 Cash at Commercial Banks 40.8 41.0 41.3 55.3 52.7 59.1 69.3 0.0 60.6 72.4 83.6 Private Sector Demand Deposits 204.0 251.8 382.1 440.9 434.1 510.9 518.8 504.2 481.8 496.5 528.8 EC$ cheques and Drafts Issued 0.0 0.0 0.0 0.0 0.0 0.0 0.0 0.0 11.2 13.6 9.2 3.2 QUASI MONEY 985.7 1,027.3 1,027.8 1,164.5 1,495.5 1,544.2 1,805.2 1,851.2 1,914.7 2,054.4 2,097.5 Private Sector Savings Deposits 652.3 755.2 810.4 916.3 1,064.9 1,150.8 1,226.6 1,301.7 1,319.0 1,393.5 1,448.3 Private Sector Time Deposits 309.6 240.2 178.7 185.9 222.7 283.3 420.1 405.4 443.7 491.0 486.9 Private Sector Foreign Currency Deposits 23.8 31.9 38.7 62.2 207.9 110.2 158.5 144.1 152.0 169.9 162.3
Source: Eastern Caribbean Central Bank
pre= preliminary
TABLE 40
DETAILED MONETARY SURVEY
As at December 31st
(EC$ Millions)
34

DEPOSITS 2003 2004 2005 2006 2007 2008 2009 2010 2011 2012 % Change
RESIDENTS 1,877.45 2,070.35 2,349.91 2654.99 2811.83 3,003.69 3,062.01 3,147.97 3,214.02 3,286.08 2.2%
Central and Local Government 233.96 292.14 345.33 290.12 276.35 283.96 228.95 266.28 236.55 212.74 -10.1%
Statutory Bodies and Gov't Corps 282.39 293.26 304.92 329.31 354.78 353.22 464.74 474.95 412.23 447.45 8.5%
of which NIS 229.54 240.93 248.19 264.21 290.70 339.70 400.11 410.21 339.79 329.34 -3.1%
Business Firms 214.75 250.83 343.51 395.00 442.04 474.47 487.47 466.41 483.71 528.99 9.4%
Private Individuals 1,032.49 1,120.41 1,199.66 1,326.69 1,502.94 1,596.11 1,621.32 1,666.30 1,762.76 1,792.38 1.7%
Non-Bank Financial Institutions 70.04 64.34 73.28 67.64 78.46 85.50 96.18 102.71 123.41 138.23 12.0%
Subsidiaries & Affliaites 10.12 5.83 12.86 18.40 4.33 9.09 6.41 9.02 6.15 4.39 -28.7%
Foreign Currency 33.70 43.54 70.36 227.85 152.93 165.37 156.94 162.31 191.14 210.35 10.0%
NON-RESIDENTS 145.31 169.44 187.59 264.37 290.91 315.24 276.63 310.83 346.23 435.38 25.7%
TOTAL DEPOSITS 2,022.76 2,239.79 2,537.50 2,919.37 3,102.74 3,318.93 3,338.64 3,458.80 3,560.25 3,721.46 4.5%
Growth 8.1% 10.7% 13.3% 15.0% 6.3% 7.0% 0.6% 3.6% 2.9% 4.5%
Source: Eastern Caribbean Central Bank
CATEGORY 2003 2004 2005 2006 2007 2008 2009 2010 2011 2012 % Change
DEMAND 372.3 516.4 621.3 610.7 704.2 690.9 654.5 652.2 650.1 687.8 5.8%
TIME 750.6 753.5 797.5 837.0 907.4 1,037.1 1,054.2 1,122.1 1,095.1 1,094.4 -0.1%
SAVINGS 863.3 923.3 1,041.4 1,208.7 1,317.1 1,383.2 1,457.5 1,493.8 1,583.9 1,666.9 5.2%
FOREIGN CURRENCY 36.5 46.6 77.2 263.0 174.1 207.7 172.4 190.8 231.2 272.4 17.9%
TOTAL DEPOSITS 2,023 2,240 2,537 2,919 3,103 3,319 3,339 3,459 3,560 3,721 4.5%
Growth 8.1% 10.7% 13.3% 15.0% 6.3% 7.0% 0.6% 3.6% 2.9% 4.5%
Source: Eastern Caribbean Central Bank
COMMERCIAL BANKS
TOTAL DEPOSITS BY CATEGORY
[In EC$ millions]
As at December 31st
TABLE 41
COMMERCIAL BANKS
TOTAL DEPOSITS BY DEPOSITORS
[In EC$ millions]
As at December 31st
TABLE 42
35
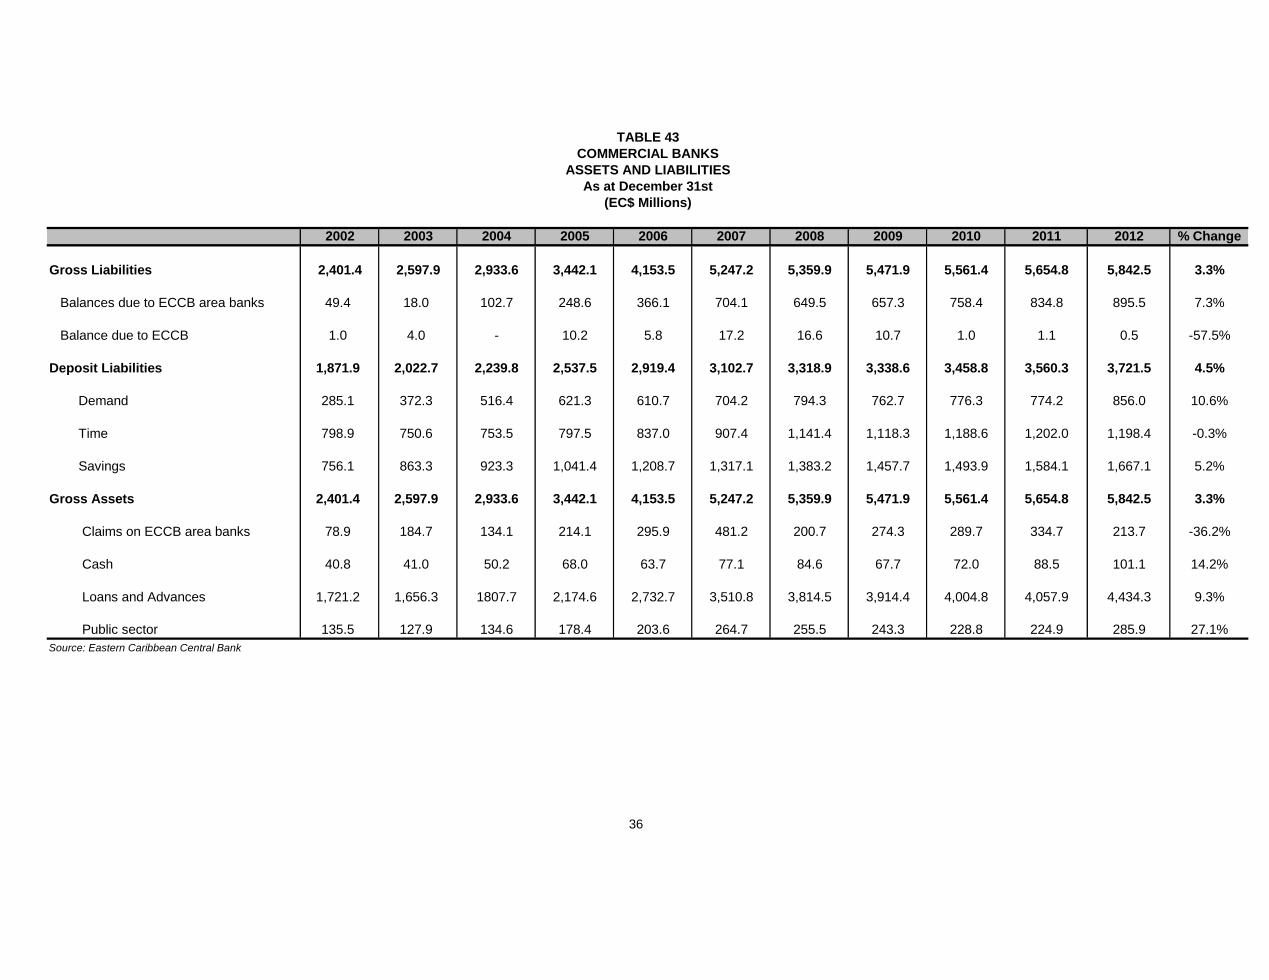
2002 2003 2004 2005 2006 2007 2008 2009 2010 2011 2012 % Change
Gross Liabilities 2,401.4 2,597.9 2,933.6 3,442.1 4,153.5 5,247.2 5,359.9 5,471.9 5,561.4 5,654.8 5,842.5 3.3%
Balances due to ECCB area banks 49.4 18.0 102.7 248.6 366.1 704.1 649.5 657.3 758.4 834.8 895.5 7.3%
Balance due to ECCB 1.0 4.0 - 10.2 5.8 17.2 16.6 10.7 1.0 1.1 0.5 -57.5%
Deposit Liabilities 1,871.9 2,022.7 2,239.8 2,537.5 2,919.4 3,102.7 3,318.9 3,338.6 3,458.8 3,560.3 3,721.5 4.5%
Demand 285.1 372.3 516.4 621.3 610.7 704.2 794.3 762.7 776.3 774.2 856.0 10.6%
Time 798.9 750.6 753.5 797.5 837.0 907.4 1,141.4 1,118.3 1,188.6 1,202.0 1,198.4 -0.3%
Savings 756.1 863.3 923.3 1,041.4 1,208.7 1,317.1 1,383.2 1,457.7 1,493.9 1,584.1 1,667.1 5.2%
Gross Assets 2,401.4 2,597.9 2,933.6 3,442.1 4,153.5 5,247.2 5,359.9 5,471.9 5,561.4 5,654.8 5,842.5 3.3%
Claims on ECCB area banks 78.9 184.7 134.1 214.1 295.9 481.2 200.7 274.3 289.7 334.7 213.7 -36.2%
Cash 40.8 41.0 50.2 68.0 63.7 77.1 84.6 67.7 72.0 88.5 101.1 14.2%
Loans and Advances 1,721.2 1,656.3 1807.7 2,174.6 2,732.7 3,510.8 3,814.5 3,914.4 4,004.8 4,057.9 4,434.3 9.3%
Public sector 135.5 127.9 134.6 178.4 203.6 264.7 255.5 243.3 228.8 224.9 285.9 27.1%
Source: Eastern Caribbean Central Bank
TABLE 43
COMMERCIAL BANKS
ASSETS AND LIABILITIES
As at December 31st
(EC$ Millions)
36

2004 2005 2006 2007 2008 2009 2010 2011 2012
(1) CASH 50.2 68.0 63.7 77.1 84.6 67.7 72.0 88.5 101.1
(2) DEPOSITS AT ECCB 199.3 143.3 151.7 148.2 189.7 208.3 230.0 227.1 272.2
TOTAL 249.5 211.3 215.4 225.4 274.2 276.0 302.0 315.6 373.3
(3) Less STAT.REQ'D RESRVS. 202.1 171.2 174.5 182.6 222.1 223.6 244.6 255.7 302.3
(4) EXCESS RESERVES (LIQUIDITY) 47.4 40.2 40.9 42.8 52.1 52.4 57.4 60.0 70.9
Less Borrowings from Deposits
HELD FOR ECCB 0.0 0.0 0.0 0.0 0.0 0.0 0.0 0.0 0.0
ADJUSTED LIQUIDITY 47.4 40.2 40.9 42.8 52.1 52.4 57.4 60.0 70.9
LOANS AND ADVANCES 1,807.7 2,174.6 2,732.7 3,510.8 3,814.5 3,914.4 4,004.8 4,057.9 4,434.3
DEPOSIT LIABILITIES 2,240 2,537 2,919 3,103 3,319 3,339 3,459 3,560 3,721
of which:
(i) Demand 516.4 621.3 610.7 704.2 690.9 654.5 652.2 650.1 687.8
(ii) Savings 923.3 1,041.4 1,208.7 1,317.1 1,383.2 1,457.5 1,493.8 1,583.9 1,666.9
(iii) Time 753.5 797.5 837.0 907.4 1,037.1 1,054.2 1,122.1 1,095.1 1,094.4
(iv) Foreign Currency 46.6 77.2 263.0 174.1 207.7 172.4 190.8 231.2 272.4
EXCESS RESERVES/DEPOSIT LIAB. (%) 2.12 1.58 1.40 1.38 1.57 1.57 1.66 1.68 1.91
Source: Eastern Caribbean Central Bank
TABLE 44
COMMERCIAL BANK LIQUIDITY
As at December 31st
(EC$ Millions)
37

Deposit/Lending Rates for various maturities 2003 2004 2005 2006 2007 2008 2009 2010 2011 2012
Demand Deposits 0.0 - 4.5 0.0 - 3.5 0.0 - 3.0 0.0 - 3.0 0.0 - 3.0 0.0 - 3.0 0.0 - 3.0 0.0 - 3.0 0.0 - 3.0 0.0 - 3.0
Savings Deposits 3.0 - 4.75 3.0 - 4.75 3.0 - 4.75 3.0 - 4.00 3.0 - 4.25 3.0 - 4.25 3.0 - 4.25 3.0 - 4.25 3.0 - 4.00 3.0 - 4.00
Special Rates (if any) 3.5 - 8.75 1.5 - 8.75 1.5 - 8.00 1.5 - 8.00 1.5 - 8.00 1.5 - 8.0 1.5 - 8.0 4.0- 8.0 4.0- 8.0 4.0- 8.0
Time Deposits
- Up to 3 months 2.0 - 5.5 1.0 - 4.5 1.0 - 3.0 1.0 - 3.0 1.0 - 3.5 1.0 - 3.5 2.0 - 3.5 2.0 - 3.5 2.0 - 3.5 1.0 - 3.5
- Over 3 months to 6 months 2.0 - 5.75 1.0 - 5.5 1.0 - 3.0 1.0 - 3.0 1.0 - 3.75 1.0 - 3.75 2.25- 3.75 2.25- 3.75 2.25- 3.75 1.0 - 3.75
- Over 6 months to 12 months 2.0 - 6.0 1.0 - 5.5 1.0 - 4.0 1.0 - 4.0 1.0 - 4.0 1.0 - 4.0 2.0- 4.0 2.0- 4.0 2.0- 4.0 1.0- 4.0
- Over 1 year to 2 years 2.0 - 7.5 1.0 - 4.5 1.0 - 4.0 1.0 - 4.0 1.0 - 4.0 1.0 - 4.0 2.75 - 4.0 2.75 - 4.0 2.75 - 3.85 1.0 - 3.25
- Over 2 years 2.0 - 7.0 1.0 - 4.5 1.0 - 3.75 1.0 - 4.0 1.0 - 4.0 1.0 - 4.0 3.0 - 4.0 3.0 - 4.0 3.0 - 4.0 1.0 - 3.5
Lending Rates
- Prime Rate 9.5 - 10.0 9.5 - 10.0 9.5 - 10.0 9.5 - 10.0 9.5 - 10.0 9.5 - 10.0 9.5 - 13.0 9.5 - 13.0 9.5 - 13.0 9.0 - 13.0
- Other Rates, Range 6.0 - 18.5 5.5 - 18.0 6.0 - 17.0 6.0 - 17.0 6.0 - 17.0 6.0 - 19.0 6.0 - 19.0 6.0 - 19.0 6.0 - 25.0 6.0 - 25.0
Add-on Loans, Range
- Nominal Interest Rate 7.0 - 18.00 6.0 - 18.00 7.0 - 18.00 7.0 - 13.5 7.0 - 13.5 7.0 - 13.5 7.0 - 13.5 7.0 - 13.5 7.0 - 13.5 7.0 - 13.0
- Effective Interest Rates 8.50 - 23.0 10.50 - 23.50 10.50 - 23.50 10.5 - 24.0 10.5 - 24.0 10.5 - 24.0 10.5 - 23.0 10.5 - 23.0 10.5 - 23.0 10.5 - 23.0
Weighted Deposit Rate 2.84 2.69 2.91 2.96 3.18 3.14 3.25 3.07 2.93
Weighted Credit Rate 10.68 10.52 10.20 9.40 9.59 9.73 9.48 9.05 8.51
Length of Loan Period, Range 6 mnths - 35 years 7mths - 35 years 7mths - 35 years 7mths - 35 years 7mths - 35 years 7mths - 35 years 1yr - 35 years 1yr - 35 years 1yr - 35 years 1yr - 35 years
Source: Eastern Caribbean Central Bank
TABLE 45
COMMERCIAL BANKS STRUCTURE OF INTEREST RATES
(In percent per annum)
38

2003 2004 2005 2006 2007 2008 2009 2010 2011 2012 Growth 2012 Share 2012
Agriculture 29.35 28.50 26.52 25.94 30.67 36.79 36.75 33.06 27.35 28.36 3.7% 0.6%
Fisheries 5.16 4.87 5.01 4.52 5.22 6.29 7.71 8.27 7.51 8.08 7.6% 0.2%
Mining and Quarrying 3.92 3.67 4.96 8.48 7.56 12.92 24.41 25.80 25.64 24.32 -5.2% 0.5%
Manufacturing 50.32 46.90 54.94 58.81 54.71 72.75 70.15 72.09 77.62 82.76 6.6% 1.9%
Public Utilites 22.34 21.71 20.66 42.50 114.35 122.28 122.68 105.15 85.29 63.65 -25.4% 1.4%
Construction & Land Dev. 101.42 108.48 121.77 166.39 243.97 310.64 429.60 371.25 401.79 366.25 -8.8% 8.3%
Distributive Trades 197.79 195.16 227.72 236.19 239.38 253.60 290.65 314.99 310.79 322.63 3.8% 7.3%
Tourism 176.03 204.09 270.90 473.69 756.04 851.70 737.20 761.80 779.15 773.98 -0.7% 17.5%
Entertainment & Catering 22.74 19.26 22.87 32.34 37.88 31.85 29.08 33.92 38.05 33.98 -10.7% 0.8%
Transport 22.97 24.03 50.15 88.82 112.37 116.67 113.01 105.68 92.64 87.98 -5.0% 2.0%
Financial Institutions 26.90 17.20 43.09 42.00 37.77 38.25 78.06 70.63 25.46 40.14 57.7% 0.9%
Professional & Other Services 124.98 168.22 218.54 370.00 505.73 594.19 705.72 705.30 740.74 807.96 9.1% 18.2%
Gov't Services/Public Admin. 67.48 102.49 149.92 154.85 215.73 202.47 158.42 136.11 133.94 237.60 77.4% 5.4%
Personal 799.92 863.15 957.55 1,028.21 1,149.44 1,164.11 1,110.99 1,260.76 1,312.00 1,556.64 18.6% 35.1%
Acquisition of Property 343.83 413.38 464.95 503.29 513.10 575.83 602.40 619.70 649.89 896.25 37.9% 20.2%
Home Const. & Renovation 179.84 219.17 220.03 237.61 294.46 313.99 334.11 333.35 350.52 528.03 50.6% 11.9%
House & Land Purchase 163.99 194.22 244.92 265.68 218.64 261.84 268.28 286.35 299.36 368.22 23.0% 8.3%
Durable Consumer Goods 64.76 80.51 109.67 138.90 187.89 199.20 168.30 153.17 137.17 128.14 -6.6% 2.9%
Other Personal 391.34 369.25 382.93 386.02 448.45 389.08 340.29 487.90 524.94 532.25 1.4% 12.0%
TOTAL 1,651.31 1,807.72 2,174.58 2,732.73 3,510.80 3,814.51 3,914.43 4,004.78 4,057.94 4,434.33 9.3% 100.0%
Growth -4.06% 9.47% 20.29% 25.67% 28.47% 8.65% 2.62% 2.31% 1.33% 9.28%
Source: Eastern Caribben Central Bank
pre= preliminary
r= revised
TABLE 46
COMMERCIAL BANKS' CREDIT BY SECTOR
(In EC$ Millions)
As as December 31
39

2003 2004 2005 2006 2007 2008 2009 2010 2011 2012
Net imputed international reserves 282.63 351.52 308.34 356.92 408.25 378.76 406.63 492.29 512.37 556.44
Net claims on commercial banks -190.74 -238.62 -191.92 -210.52 -237.00 -242.12 -260.95 -290.92 -294.59 -362.59
Claims 0.04 0.05 0.04 0.05 0.02 0.02 0.009 0.04 0.03 0.04
Liabilities -190.77 -238.66 -191.96 -210.57 -237.02 -242.14 -260.96 -290.57 -294.62 -362.63
Currency -41.02 -41.31 -55.34 -52.69 -59.09 -69.28 -55.67 -60.64 -72.40 -83.65
Current deposits -149.75 -197.35 -136.62 -157.88 -177.93 -172.86 -205.82 -230.32 -222.22 -278.99
of which Fixed Deposits -0.68 -0.68 -0.68 -0.68 -0.68 0.00 0.00 0.00 0.00 0.00
Net claims on Statutory Bodies 0.00 0.00 0.00 0.00 -4.00 -4.00 -4.00 -4.00 -4.00 0.00
Net Domestic Assets -191.33 -252.36 -201.96 -230.34 -280.20 -236.19 -264.16 -340.76 -347.13 -393.43
Net Credit to Central Government 0.59 -13.75 -10.04 -19.82 -43.19 5.93 -3.21 -49.84 -52.53 -30.83
Treasury bills 0.25 0.25 0.00 0.00 0.00 0.00 0.00 0.00 0.00 0.00
Debentures 5.00 5.00 5.00 0.00 0.00 0.00 0.00 0.00 0.00 0.00
Temporary advances 2.90 3.94 4.20 6.97 11.16 7.01 2.50 1.57 1.98 2.12
Other Claims 1.08 0.00 0.00 0.00 0.00 0.00 0.00 0.00 0.00 0.00
Central Government Deposits -9.83 -22.94 -19.24 -26.78 -54.35 -1.08 -5.71 -51.41 -54.51 -32.96
Liabilities to the Private Sector 91.28 99.16 106.38 126.58 128.05 142.57 142.46 151.53 165.24 163.01
Total currency issued 132.32 140.47 161.72 179.27 187.13 211.85 198.13 212.17 237.64 246.66
Currency held by banks -41.02 -41.31 -55.34 -52.69 -59.09 -69.28 -55.67 -60.64 -72.40 -83.65
Source: Eastern Caribbean Central Bank
2003 2004 2005 2006 2007 2008 2009 2010 r 2011 2012
CENTRAL BANK:
Net (Imputed) Share of Reserves 282.63 351.52 308.34 356.92 408.25 378.76 406.63 492.29 512.37 0.56
Percentage Change 13.7% 24.4% -12.3% 15.8% 14.4% -7.2% 7.0% 21.1% 4.1% -99.9%
Comm. Banks Net Foreign Assets (liabilities) 55.17 1.20 (65.30) (239.31) (455.91) (922.10) (910.21) (796.14) (1,007.06) (1.14)
Percentage Change -139.1% -97.8% -5555.6% 266.5% 90.5% 102.3% -1.3% -12.5% 26.5% -99.9%
TOTAL NET FOREIGN
ASSETS(LIABILITIES) 337.79 352.72 243.04 117.62 (47.66) (543.34) (503.58) (303.85) (494.69) (0.58)
Percentage Change 216.2% 4.4% -31.1% -51.6% -140.5% 1040.0% -7.3% -39.7% 62.8% -99.9%
Source: Eastern Caribbean Central Bank
pre=preliminary
r = revised
ST LUCIA
EXTERNAL RESERVES
(In EC$ millions)
As as December 31st
TABLE 47
ECCB OPERATIONS WITH ST. LUCIA
(In EC$ millions)
As as December 31
TABLE 48
40

COMMODITY GROUP 2009r 2010r 2011r 2012pre
CONSUMER GOODS 577.08 642.25 758.06 640.27 839.10 831.41 740.17 1,004.40 966.24 878.76
0. Food & Live Animals 205.40 226.17 259.24 244.09 262.81 293.40 293.99 355.67 355.48 360.17
1. Beverage & Tobacco 41.31 47.94 60.06 58.03 71.50 74.98 66.37 84.13 80.55 64.99
6. Manufactured Goods Classified Chiefly by Material 167.58 183.54 220.65 162.91 216.20 240.48 194.67 261.21 259.32 233.53
8. Miscellaneous Manufactured Articles 162.79 184.60 218.11 175.24 288.59 222.55 185.14 303.39 270.89 220.08
INTERMEDIATE GOODS 218.76 267.86 339.68 325.06 489.92 603.95 371.52 383.50 458.72 461.81
2. Crude Materials, Inedible Except Fuels 24.03 27.31 41.09 31.59 33.63 29.36 26.58 29.63 32.51 28.38
3. Mineral Fuel, Lubricants and Related Materials 113.36 148.11 191.53 199.78 352.63 458.70 234.09 229.31 293.61 308.39
4. Animal and Vegetable Oils & Fats 2.07 89.71 5.14 3.88 4.20 5.64 7.61 4.86 7.62 8.65
5. Chemicals and Related Products 79.30 2.73 101.92 89.81 99.46 110.25 103.24 119.70 124.98 116.40
CAPITAL GOODS 284.63 228.35 295.28 317.35 416.25 356.03 293.41 401.17 464.14 442.19
7. Machinery and Transport Equipment 284.37 228.16 294.93 316.65 415.50 352.05 282.55 380.76 372.66 352.34
9. Miscellaneous 0.26 0.19 0.35 0.70 0.75 3.98 10.86 20.41 91.48 89.84
TOTAL 1,080.47 1,138.46 1,393.02 1,282.68 1,745.27 1,791.39 1,405.10 1,789.07 1,889.10 1,782.75
Source: Government Statistics Department
pre=preliminary data
r=revised data
COMMODITY GROUP 2003 2009r 2010r 2011r 2012pre
CONSUMER GOODS 507.83 565.18 667.09 563.44 738.41 731.64 651.35 883.87 850.29 773.31
0. Food & Live Animals 180.75 199.03 228.13 214.80 231.27 258.19 258.71 312.99 312.82 316.95
1. Beverage & Tobacco 36.35 42.19 52.85 51.07 62.92 65.98 58.41 74.03 70.88 57.19
6. Manufactured Goods Classified Chiefly by Material 147.47 161.52 194.17 143.36 190.26 211.62 171.31 229.86 228.20 205.50
8. Miscellaneous Manufactured Articles 143.26 162.45 191.94 154.21 253.96 195.84 162.92 266.98 238.38 193.67
INTERMEDIATE GOODS 192.51 235.72 298.92 286.05 431.13 531.48 326.94 337.48 403.67 406.40
2. Crude Materials, Inedible Except Fuels 21.15 24.03 36.16 27.80 29.59 25.84 23.39 26.07 28.61 24.97
3. Mineral Fuel, Lubricants and Related Materials 99.76 130.34 168.55 175.81 310.31 403.66 206.00 201.79 258.38 271.38
4. Animal and Vegetable Oils & Fats 1.82 78.94 4.52 3.41 3.70 4.96 6.70 4.28 6.71 7.61
5. Chemicals and Related Products 69.78 2.40 89.69 79.03 87.52 97.02 90.85 105.34 109.98 102.43
CAPITAL GOODS 250.47 200.95 259.84 279.27 366.30 313.31 258.20 353.03 408.44 389.12
7. Machinery and Transport Equipment 250.25 200.78 259.54 278.65 365.64 309.80 248.64 335.07 327.94 310.06
9. Miscellaneous 0.23 0.17 0.30 0.62 0.66 3.50 9.56 17.96 80.50 79.06
TOTAL 950.81 1,001.84 1,225.85 1,128.76 1,535.84 1,576.42 1,236.49 1,574.38 1,662.41 1,568.82
Source: Government Statistics Department
pre=preliminary
r=revised
2004r
2005r
2006r 2008r
2008r
2005r
2004r
2007r
2006r 2007r
IMPORTS BY STANDARD INTERNATIONAL TRADE CLASSIFICATION
(At F.O.B Prices)
(EC$Millions)
TABLE 49
IMPORTS BY STANDARD INTERNATIONAL TRADE CLASSIFICATION
(At C.I.F Prices)
(EC$Millions)
TABLE 50
2003
41

COMMODITY GROUP
CONSUMER GOODS 53.41% 56.41% 54.42% 49.92% 48.08% 46.41% 52.68% 56.14% 51.15% 49.4%
0. Food & Live Animals 19.01% 19.87% 18.61% 19.03% 15.06% 16.38% 20.92% 19.88% 18.82% 19.7%
1. Beverage & Tobacco 3.82% 4.21% 4.31% 4.52% 4.10% 4.19% 4.72% 4.70% 4.26% 3.5%
6. Manufactured Goods Classified Chiefly by Material 15.51% 16.12% 15.84% 12.70% 12.39% 13.42% 13.85% 14.60% 13.73% 13.3%
8. Miscellaneous Manufactured Articles 15.07% 16.21% 15.66% 13.66% 16.54% 12.42% 13.18% 16.96% 14.34% 13.0%
INTERMEDIATE GOODS 20.25% 23.53% 24.38% 25.34% 28.07% 33.71% 26.44% 21.44% 24.28% 25.5%
2. Crude Materials, Inedible Except Fuels 2.22% 2.40% 2.95% 2.46% 1.93% 1.64% 1.89% 1.66% 1.72% 1.5%
3. Mineral Fuel, Lubricants and Related Materials 10.49% 13.01% 13.75% 15.58% 20.20% 25.61% 16.66% 12.82% 15.54% 17.1%
4. Animal and Vegetable Oils & Fats 0.19% 7.88% 0.37% 0.30% 0.24% 0.31% 0.54% 0.27% 0.40% 0.4%
5. Chemicals and Related Products 7.34% 0.24% 7.32% 7.00% 5.70% 6.15% 7.35% 6.69% 6.62% 6.4%
CAPITAL GOODS 26.34% 20.06% 21.20% 24.74% 23.85% 19.87% 20.88% 22.42% 24.57% 25.1%
7. Machinery and Transport Equipment 26.32% 20.04% 21.17% 24.69% 23.81% 19.65% 20.11% 21.28% 19.73% 21.3%
9. Miscellaneous 0.02% 0.02% 0.02% 0.05% 0.04% 0.22% 0.77% 1.14% 4.84% 3.9%
TOTAL 100.0% 100.0% 100.0% 100.0% 100.0% 100.0% 100.0% 100.0% 100.0% 100.0%
Source: Government Statistics Department
pre=preliminary
r=revised data
COMMODITY GROUP
CONSUMER GOODS 21.0% 11.3% 18.0% -15.5% 31.1% -0.9% -11.0% 35.7% -3.8% -9.1%
0. Food & Live Animals 21.6% 10.1% 14.6% -5.8% 7.7% 11.6% 0.2% 21.0% -0.1% 1.3%
1. Beverage & Tobacco 27.9% 16.0% 25.3% -3.4% 23.2% 4.9% -11.5% 26.8% -4.3% -19.3%
6. Manufactured Goods Classified Chiefly by Material 16.8% 9.5% 20.2% -26.2% 32.7% 11.2% -19.0% 34.2% -0.7% -9.9%
8. Miscellaneous Manufactured Articles 23.0% 13.4% 18.2% -19.7% 64.7% -22.9% -16.8% 63.9% -10.7% -18.8%
INTERMEDIATE GOODS 23.2% 22.4% 26.8% -4.3% 50.7% 23.3% -38.5% 3.2% 19.6% 0.7%
2. Crude Materials, Inedible Except Fuels 10.9% 13.6% 50.5% -23.1% 6.5% -12.7% -9.5% 11.5% 9.7% -12.7%
3. Mineral Fuel, Lubricants and Related Materials 35.4% 30.7% 29.3% 4.3% 76.5% 30.1% -49.0% -2.0% 28.0% 5.0%
4. Animal and Vegetable Oils & Fats 118.7% 4233.8% -94.3% -24.5% 8.2% 34.3% 34.9% -36.1% 56.8% 13.5%
5. Chemicals and Related Products 11.3% -96.6% 3633.3% -11.9% 10.7% 10.8% -6.4% 15.9% 4.4% -6.9%
CAPITAL GOODS 45.7% -19.8% 29.3% 7.5% 31.2% -14.5% -17.6% 36.7% 15.7% -4.7%
7. Machinery and Transport Equipment 45.7% -19.8% 29.3% 7.4% 31.2% -15.3% -19.7% 34.8% -2.1% -5.5%
9. Miscellaneous 90.7% -26.9% 81.7% 102.8% 7.1% 430.7% 172.9% 87.9% 348.2% -1.8%
TOTAL 27.1% 5.4% 22.4% -7.9% 36.1% 2.6% -21.6% 27.3% 5.6% -5.6%
Source: Government Statistics Department
pre=preliminary
r=revised
2003 2010r2006r
TABLE 52
IMPORTS BY STANDARD INTERNATIONAL TRADE CLASSIFICATION
Percentage Change
2012pre2011r2007r2004r 2005r 2008r 2009r
TABLE 51
IMPORTS BY STANDARD INTERNATIONAL TRADE CLASSIFICATION
Percentage of Total
2004r2003 2008r2006r 2011r2007r 2009r 2012pre2005r 2010r
42

CURRENT ACCOUNT -349.6 -834.3 -930.6 -918.0 -369.2 -547.4 -657.9 -545.2
Goods -889.3 -1,145.7 -1,189.3 -1,167.3 -719.9 -929.1 -1,145.5 -1,055.6
Merchandise -955.7 -1,211.4 -1,257.1 -1,241.3 -788.4 -994.9 -1,226.7 -1,140.9
Repair on goods 0.0 0.0 0.0 0.0 0.0 0.0 0.0 0.0
Goods procured in ports by carriers 66.4 65.7 67.8 74.0 68.5 65.8 81.2 85.3
Services 700.4 426.2 405.6 399.9 439.1 447.0 475.8 518.8
Transportation -140.0 -158.9 -171.2 -205.1 -151.7 -168.8 -191.4 -180.2
Travel 925.4 687.5 700.4 717.4 673.6 703.5 736.1 749.1
Insurance Services -20.8 -26.4 -22.2 -31.4 -16.4 -24.1 -27.1 -24.1
Other Business Services -61.5 -71.3 -88.7 -68.7 -58.5 -57.4 -32.9 -16.4
Government Services -2.7 -4.6 -12.7 -12.3 -7.9 -6.2 -8.9 -9.6
Income -195.8 -147.1 -183.5 -194.5 -121.9 -106.8 -42.0 -56.2
Compensation of Employees 0.5 0.3 0.5 0.5 0.5 1.0 1.0 1.0
Investment Income -196.2 -147.4 -184.0 -195.0 -122.5 -107.8 -43.0 -57.2
Current Transfers 35.0 32.4 36.6 43.8 33.6 41.5 53.8 47.7
General Government -3.3 -1.2 7.5 10.5 1.4 4.5 1.6 -7.0
Other Sectors 38.4 33.6 29.1 33.3 32.1 37.0 52.3 54.8
CAPITAL AND FINANCIAL ACCOUNT 345.6 866.3 984.3 914.8 500.7 571.3 694.8 548.3
CAPITAL ACCOUNT 14.4 30.7 23.4 29.4 69.8 118.4 89.7 58.4
Capital Transfers 14.4 30.7 23.4 29.4 69.8 118.4 89.7 58.4
Acquisition & Disposition of
Non-Produced, Non-Financial Assets 0.0 0.0 0.0 0.0 0.0 0.0 0.0 0.0
FINANCIAL ACCOUNT 331.2 835.6 960.9 885.4 430.9 452.9 605.1 489.8
Direct Investment 211.2 631.6 734.1 435.3 395.3 327.5 261.5 288.7
Portfolio Investment 64.9 -8.0 1.3 -25.8 -78.7 82.6 112.9 143.2
Other Investments 55.0 212.0 225.5 475.9 114.3 42.8 230.7 57.9
Public Sector Loans 20.2 64.0 54.7 -25.5 46.6 79.7 1.0 -38.0
Commercial Banks 66.5 174.0 216.6 466.2 -11.9 -114.1 210.9 132.0
Other Assets -90.3 -46.9 -78.7 19.6 55.8 13.0 -28.3 -98.5
Other Liabilities 58.6 20.9 32.9 15.6 23.8 64.2 47.0 62.5
ERRORS AND OMISSIONS -40.9 4.2 -3.7 -26.2 -41.9 61.8 -17.3 41.0
OVERALL BALANCE -44.9 36.3 50.0 -29.5 89.5 85.7 19.7 44.1
FINANCING 44.9 -36.3 -50.0 29.5 -89.5 -85.7 -19.7 -44.1
Change in SDR Holdings 0.0 0.0 0.0 0.0 0.0 0.0 0.0 0.0
Special Drawing Rights 0.0 0.0 0.0 0.0 -61.7 0.0 0.4 0.0
Change in Reserve Position with IMF 0.0 0.0 0.0 0.0 0.0 0.0 0.0 0.0
Change in Government Foreign Assets 1.7 12.3 1.3 0.0 0.0 0.0 0.0 0.0
Change in Imputed Reserves 43.2 -48.6 -51.3 29.5 -27.9 -85.7 -20.1 -44.1
Source: Eastern Caribbean Central Bank and Ministry of Finance
e = estimate
r = revised
2012 e
TABLE 53
BALANCE OF PAYMENTS
(EC$Millions)
2005r 2006r 2007r 2008r 2009r 2010r 2011r
43

POPULATION ESTIMATES 2001 2002 2003 2004 2005 2006 2007 2008 2009 2010 2011r 2012e
ESTIMATES* 157,775 158,644 159,513 160,382 161,250 162,119 162,988 163,857 164,726 165,595 167,366 169,115
LIVE BIRTHS
Male 1,405 1,330 1,270 1,243 1,137 1,203 1,163 1,074 1,111 960 993 1062
Female 1,383 1,268 1,216 1,141 1,161 1,058 1,028 1,136 1,081 922 1016 1041
Total 2,788 2,598 2,486 2,384 2,298 2,261 2,191 2,210 2,192 1,882 2,009 2,103
Birth rate (per 1000 of pop.) 17.7 16.4 15.6 14.9 14.3 13.9 13.4 13.5 13.3 11.4 12.0 12.4
DEATHS
Male 531 512 584 598 627 550 541 556 540 420 548 520
Female 467 448 462 516 483 441 386 466 414 317 435 402
Total 998 960 1,046 1,114 1,110 991 927 1,022 954 737 983 922
Death Rate (per 1,000 of pop.) 6.3 6.1 6.6 6.9 6.9 6.3 6.3 6.2 7.6 7.6 5.9 5.5
Infant Mortality Rate 13.3 13.9 14.9 18.9 21.3 21.7 16.4 21.9 20.5 20.1 20.1 20.2
Source: Government Statistics Department
* Resident Population
e = estimate
r = revised
TABLE 54
ESTIMATED MID-YEAR POPULATION AND VITAL STATISTICS
44

GROUP Male Female Total Male Female Total Male Female Total
0-4 6,052 5,761 11,813 5,694 5,549 11,243 5,637 5,596 11,233
5-9 6,709 6,437 13,146 6,341 6,063 12,404 6,187 5,920 12,107
10-14 7,524 7,394 14,918 7,130 7,006 14,136 6,943 6,813 13,756
15-19 8,163 7,755 15,918 8,151 7,781 15,932 8,102 7,763 15,865
20-24 6,763 6,858 13,621 7,232 7,158 14,390 7,473 7,333 14,806
25-29 6,565 6,722 13,287 6,633 6,832 13,465 6,752 6,946 13,698
30-34 6,171 6,081 12,252 6,309 6,225 12,534 6,401 6,334 12,735
35-39 5,968 6,319 12,287 5,985 6,198 12,183 6,042 6,182 12,224
40-44 6,043 6,177 12,220 6,028 6,267 12,295 6,035 6,293 12,328
45-49 5,507 5,461 10,968 5,748 5,758 11,506 5,847 5,901 11,748
50-54 4,452 4,469 8,921 4,886 4,878 9,764 5,104 5,094 10,198
55-59 3,187 3,305 6,492 3,554 3,669 7,223 3,775 3,887 7,662
60-64 2,689 2,790 5,479 2,802 2,931 5,733 2,894 3,043 5,937
65-69 2,084 2,293 4,377 2,188 2,421 4,609 2,246 2,497 4,743
70-74 1,727 1,865 3,592 1,746 1,954 3,700 1,768 2,015 3,783
75-79 1,149 1,425 2,574 1,185 1,481 2,666 1,204 1,524 2,728
80+ 1,474 2,256 3,730 1,313 2,270 3,583 1,259 2,305 3,564
TOTAL 82,227 83,368 165,595 82,925 84,441 167,366 83,669 85,446 169,115
e= estimate
Data Source For 2010: -2010 Population and Housing Census Results
Data source for 2011 is based on vital registration
Source: Government Statistics Department
Table 55
ESTIMATED MID-YEAR POPULATION BY SEX AND AGE GROUP
2012 e2010 2011
45
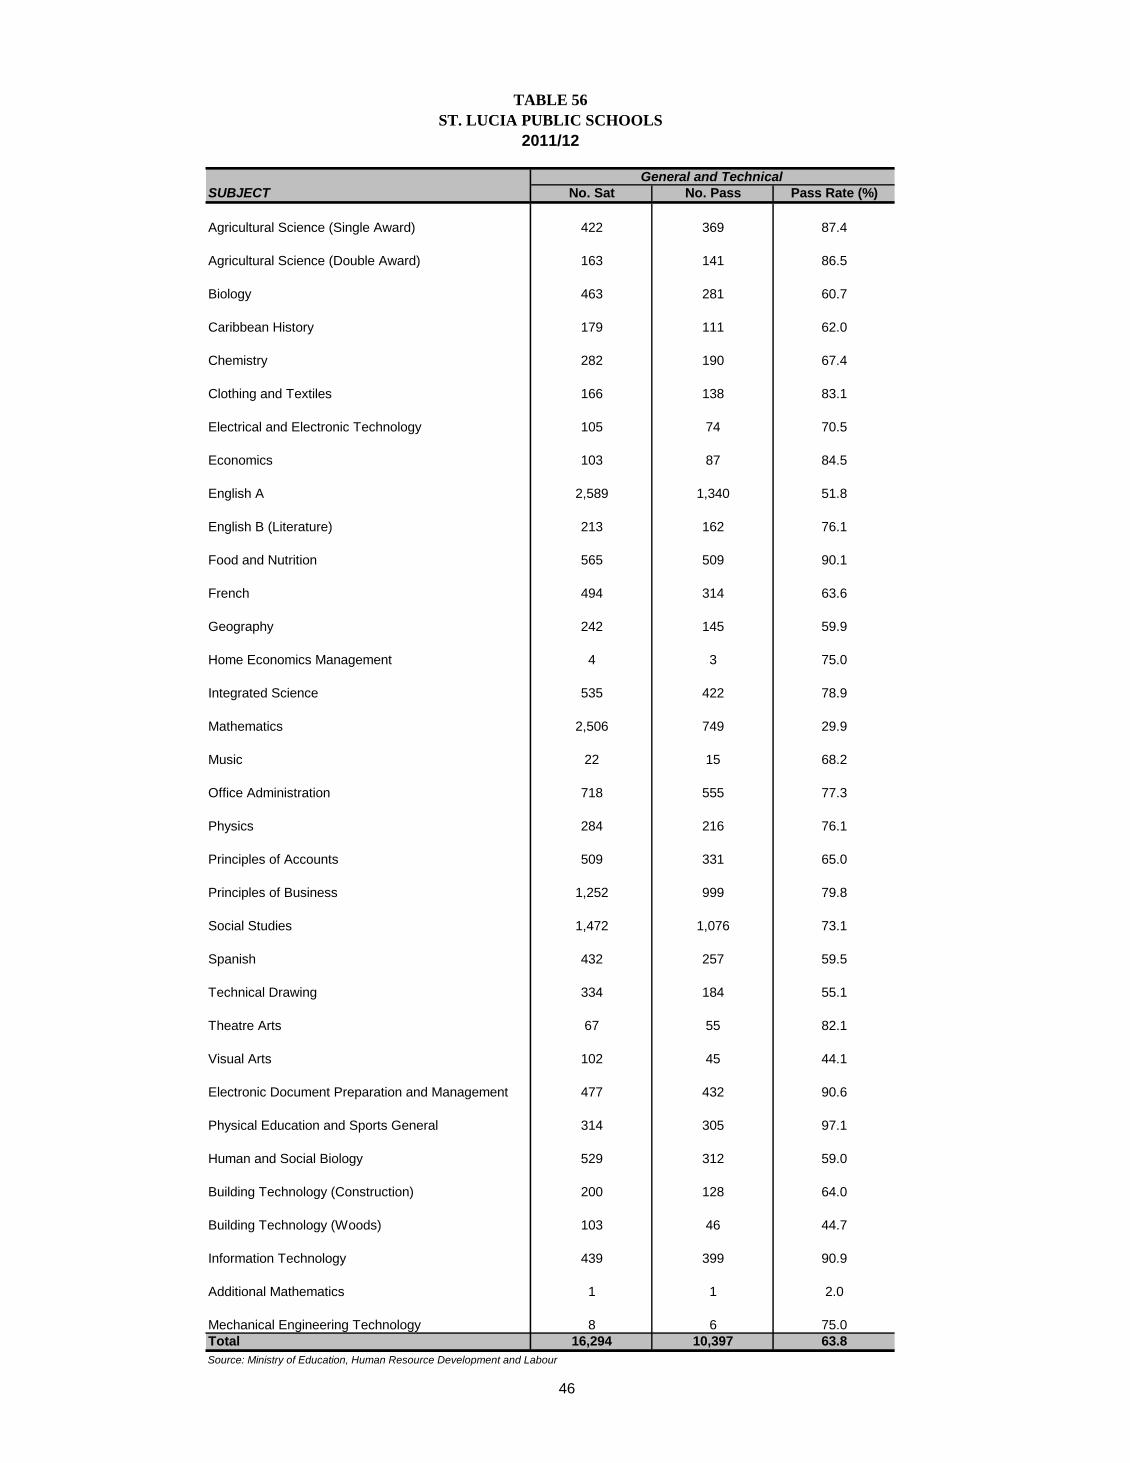
General and Technical
SUBJECT No. Sat No. Pass Pass Rate (%)
Agricultural Science (Single Award) 422 369 87.4
Agricultural Science (Double Award) 163 141 86.5
Biology 463 281 60.7
Caribbean History 179 111 62.0
Chemistry 282 190 67.4
Clothing and Textiles 166 138 83.1
Electrical and Electronic Technology 105 74 70.5
Economics 103 87 84.5
English A 2,589 1,340 51.8
English B (Literature) 213 162 76.1
Food and Nutrition 565 509 90.1
French 494 314 63.6
Geography 242 145 59.9
Home Economics Management 4 3 75.0
Integrated Science 535 422 78.9
Mathematics 2,506 749 29.9
Music 22 15 68.2
Office Administration 718 555 77.3
Physics 284 216 76.1
Principles of Accounts 509 331 65.0
Principles of Business 1,252 999 79.8
Social Studies 1,472 1,076 73.1
Spanish 432 257 59.5
Technical Drawing 334 184 55.1
Theatre Arts 67 55 82.1
Visual Arts 102 45 44.1
Electronic Document Preparation and Management 477 432 90.6
Physical Education and Sports General 314 305 97.1
Human and Social Biology 529 312 59.0
Building Technology (Construction) 200 128 64.0
Building Technology (Woods) 103 46 44.7
Information Technology 439 399 90.9
Additional Mathematics 1 1 2.0
Mechanical Engineering Technology 8 6 75.0
Total 16,294 10,397 63.8
Source: Ministry of Education, Human Resource Development and Labour
ST. LUCIA PUBLIC SCHOOLS
TABLE 56
2011/12
46

ACADEMIC Number of Number of Pupils Number of Teachers
YEAR Schools Male Female TOTAL Male Female TOTAL
1994/95 84 15,986 15,208 31,194 195 985 1,180
1995/96 86 16,004 15,368 31,372 195 944 1,139
1996/97 84 16,159 15,389 31,548 213 962 1,175
1997/98 84 16,111 15,326 31,437 220 948 1,168
1998/99 82 15,399 14,232 29,631 176 959 1,135
1999/00 82 14,991 13,984 28,975 171 910 1,081
2000/01 82 14,991 13,627 28,618 180 872 1,052
2001/02 82 14,588 13,367 27,955 170 892 1,062
2002/03 81 14,323 12,852 27,175 158 899 1,057
2003/04 78 13,522 12,151 25,673 153 886 1,039
2004/05 78 13,193 11,816 25,009 151 873 1,024
2005/06 78 12,559 11,410 23,969 154 853 1,007
2006/07 75 10,947 10,382 21,329 118 801 919
2007/08 75 10,255 9,909 20,164 118 804 922
2008/09 75 9,833 9,454 19,287 123 828 951
2009/10 75 9,529 9,065 18,594 134 847 981
2010/11 75 9,148 8,834 17,982 139 859 998
2011/12 75 8,832 8,444 17,276 136 853 989
Source: Ministry of Education, Human Resource Development and Labour
PRIMARY SCHOOLS
ANALYSIS OF SCHOOLS, PUPILS AND TEACHERS
TABLE 57
47
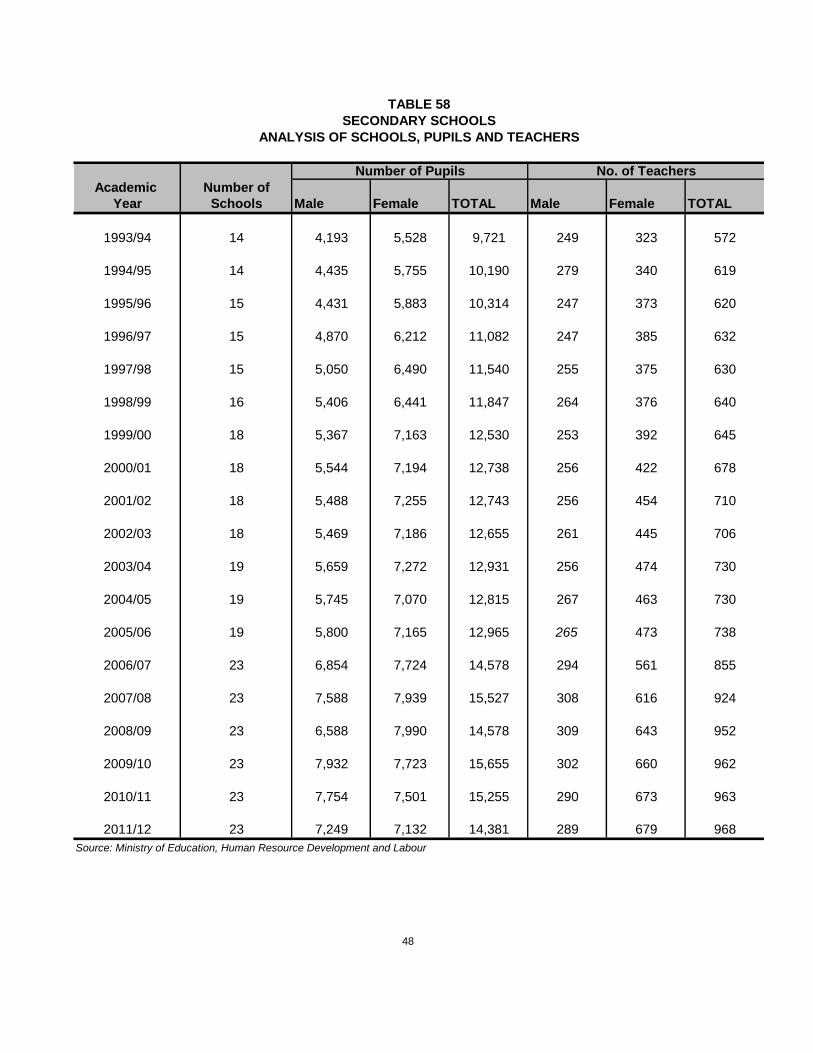
Number of Pupils No. of Teachers
Academic Number of
Year Schools Male Female TOTAL Male Female TOTAL
1993/94 14 4,193 5,528 9,721 249 323 572
1994/95 14 4,435 5,755 10,190 279 340 619
1995/96 15 4,431 5,883 10,314 247 373 620
1996/97 15 4,870 6,212 11,082 247 385 632
1997/98 15 5,050 6,490 11,540 255 375 630
1998/99 16 5,406 6,441 11,847 264 376 640
1999/00 18 5,367 7,163 12,530 253 392 645
2000/01 18 5,544 7,194 12,738 256 422 678
2001/02 18 5,488 7,255 12,743 256 454 710
2002/03 18 5,469 7,186 12,655 261 445 706
2003/04 19 5,659 7,272 12,931 256 474 730
2004/05 19 5,745 7,070 12,815 267 463 730
2005/06 19 5,800 7,165 12,965 265 473 738
2006/07 23 6,854 7,724 14,578 294 561 855
2007/08 23 7,588 7,939 15,527 308 616 924
2008/09 23 6,588 7,990 14,578 309 643 952
2009/10 23 7,932 7,723 15,655 302 660 962
2010/11 23 7,754 7,501 15,255 290 673 963
2011/12 23 7,249 7,132 14,381 289 679 968
Source: Ministry of Education, Human Resource Development and Labour
SECONDARY SCHOOLS
ANALYSIS OF SCHOOLS, PUPILS AND TEACHERS
TABLE 58
48

2004 2005 2006 2007 2008 2009 2010 2011 2012
Sir Arthur Lewis Community College 79.76 79.31 80.41 81.72 84.36 79.96 78.37 72.02 97.60
Vieux Fort Comprehensive Sec. Sch. 65.8 69.5 83.14 67.52 66.12 61.7 79.17 74.34 79.87
Source: Ministry of Education, Human Resource Development and Labour
Head Title 2003/04 2004/05 2005/06 2006/07 2007/08 2008/09 2009/10 2010/11 2011/12
Early Childhood Education 0.45 0.45 0.53 1.91 1.82 1.83 2.22 2.21 2.19
Special Education 1.52 1.65 1.64 1.79 1.83 2.26 2.47 2.93 2.79
Primary Education 44.4 46.2 46.12 49.59 49.39 49.46 53.81 54.78 57.26
Secondary Education 32.13 34.29 35.81 39.25 43.77 50.66 56.11 61.03 63.27
Tertiary Education 12.65 12.5 14.09 13.56 13.56 13.86 14.86 15.8 15.8
Adult Education 0.85 0.8 0.66 0.65 0.67 0.62 0.71 0.74 0.78
Education Services 6.18 6.31 6.74 8.74 7.77 8.95 9.48 10.25 9.56
Agency Administration 3.6 3.71 4.34 4.33 3.76 5.45 3.92 5.11 4.95
Library Services 1.34 1.33 1.4 1.47 1.46 1.39 1.3 1.64 1.61
UNESCO 0.18 0.16 0.24 0.28 0.25 0.22 0.16 0.26 0.27
TOTAL 103.3 107.4 111.57 121.57 124.28 134.7 145.04 154.75 158.48
Source: Annual Budgets, Ministry of Education, Human Resource Development and Labour
TABLE 59
CAMBRIDGE ADVANCED LEVEL EDUCATION PASS RATE
TABLE 60
(EC $Millions)
GOVERNMENT RECURRENT EXPENDITURE ON EDUCATION
% Pass Rate (Grades A-E)
49

COPYRIGHT 2013- Ministry of Finance, Economic Affairs, Planning and Social Security
All rights reserved. No part of this publication may be reproduced or transmitted in any form or
by any means, electronic or mechanical, including photocopy, recording, or any information storage and retrieval system, without permission in writing from the producer.
www.stlucia.gov.lc
www.finance.gov.lc
PRINTED BY RESEARCH AND POLICY UNIT
SAINT LUCIA
2013


