44
Report to GIZ by F. Rösner June 2016 Economic assessment of agricultural production systems under Potato Initiative Africa in Kenya and Nigeria
Report to GIZ
by F. Rösner
June 2016
Economic assessment of
agricultural production systems under
Potato Initiative Africa in Kenya and Nigeria

I
Table of Contents
1 Introduction 1
1.1 Scope and framework of this report 1
1.2 Inclusion of national experts in production economics and capacity building 2
2 Kenya 4
2.1 Typical farm data Kenya 4
2.2 Production systems 6
2.2.1 Typical farm KE5KI 6
2.2.2 Individual farm KE1OL 7
2.2.3 Individual farm KE5NY 9
2.3 Inputs (fertilizer, plant protection, machinery, labor) 11
2.4 Value chain for potatoes in Nyandarua 12
3 Nigeria 15
3.1 Typical farm data 15
3.2 Production system 17
3.3 Inputs (fertilizer, plant protection, machinery, labor) 19
3.4 Value chain for potatoes 19
4 Economics of production systems implemented under PIA 22
4.1 Yields 22
4.2 Establishment costs 24
4.3 Operating costs 28
4.4 Gross Revenue and Profitability 31
4.5 Case Study: Importance of Market Linkage in Nigeria 34
4.6 Case study: Kenya with adjusted price for Jelly 35
5 Conclusions/Outlook 37
II
List of Figures
Figure 1: Map of t pi al far lo atio s i Ke a “our e: Google aps, ith author s alterations) 5
Table 2: Production System of Potato for 2014 in KE1OL (Baseline) 8
Figure 2: Map of Nigeria with typical farm locations (Source: googlemaps, own
alteration) 16
Figure 3: Value Chain of Potato in Plateau State (agri benchmark, 2015) 20
Figure 4: Yields of all farms and varieties in tons per hectare (Source: agri benchmark
2015) 22
Figure 5: Establishment costs in USD per ha (Source: agri benchmark 2015) 24
Figure 6: Seed productivity in kg potatoes per kg seed (Source: agri benchmark
2015). *Note: Grey bars indicate farming practices without intervention 25
Figure 7: Productivity of nutrients in granular fertilizers applied in
kg output/kg input. (Source: agri benchmark 2015) *Note: Grey striped
bars indicate traditional farming practices. 27
Figure 8: Establishment costs in USD per t (Source: agri benchmark 2015) 28
Figure 9: Operating costs in USD per ha (Source: agri benchmark 2015) 29
Figure 10: Operating costs in USD per t (Source: agri benchmark 2015) 30
Figure 11: Total Cost and Gross Revenue per ha (Source: agri benchmark 2015) 31
Figure 12: Total cost and gross revenue per t (Source: agri benchmark 2015) 33
Figure 15: Total cost and gross revenue for Nigerian farmers with different prices
(Source: agri benchmark 2015) 34
Figure 16: Gross revenue per ha for Jelly variety at different farm gate prices
(Source: agri benchmark 2015) 35

III
List of Pictures
Picture 1: Fo us group Kipospa i Ki a gop. “our e: NPCK 4
Picture 2: Backyard potato field of KIPOSPA farmers group. (Source: NPCK) 6
Picture 3: Manual planting of potatoes in Nyandarua County. (Source: NPCK) 7
Picture 4: Typical Kenyan potato bags in a storage in Nairobi. (Source: F.Rösner) 12
Picture 5: Peeled Shangi potatoes with eye-formation. (Source: F. Rösner) 14
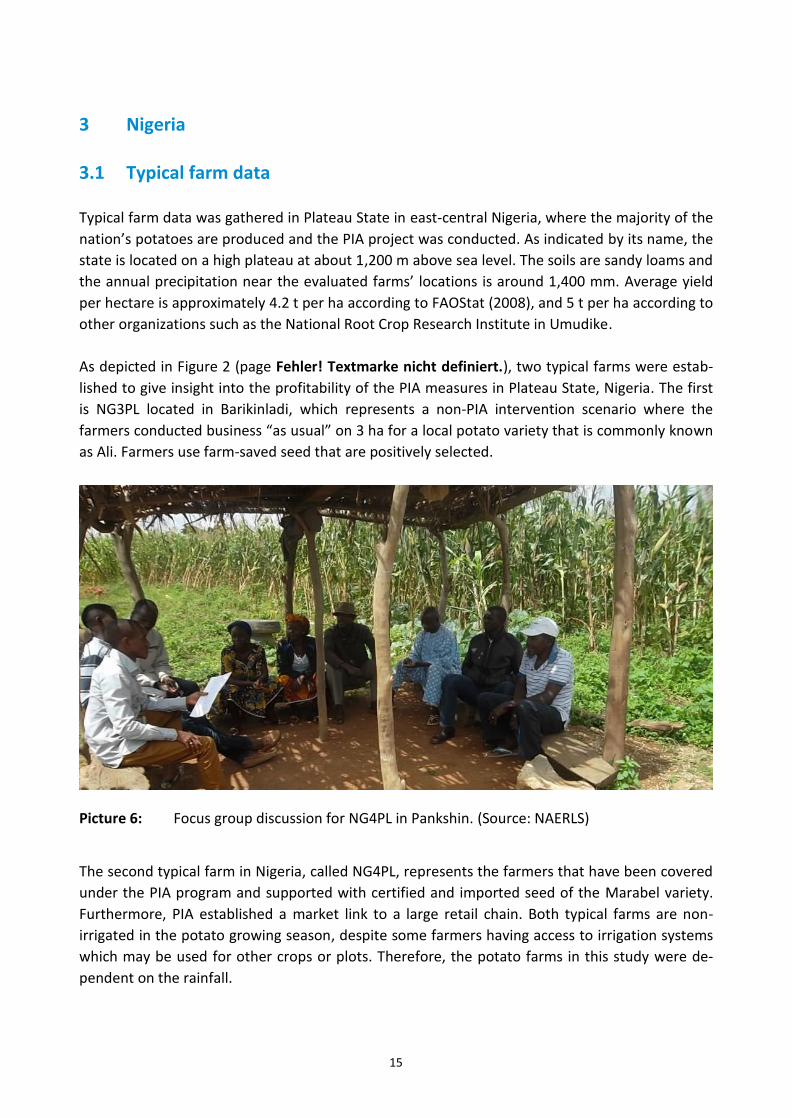
Picture 6: Focus group discussion for NG4PL in Pankshin. (Source: NAERLS) 15
Picture 7: Backyard potato farm in Pankshin. (Source NAERLS) 16

IV
List of Tables
Table 1: Production System of Potato for 2014 in KE5KI 7
Table 3: Production System of Potato for 2015 in KE1OL (with PIA intervention) 9
Table 4: Production System of Potato for 2014 in KE5NY (Baseline) 10
Table 5: Production System of Potato for 2015 in KE5NY (with PIA intervention) 11
Table 6: Production System of Potato in NG3PL in 2015 (without PIA intervention) 18
Table 7: Production System of Potato in NG4PL in 2015 (with PIA intervention) 18

1
1 Introduction
The following report outlines the results of the agri benchmark economic studies conducted
within the Potato Initiative Africa (PIA) project, as well as explains the findings and conclusions
that are relevant to the PIA project coordinators and potential follow-up projects.
agri benchmark is a global, non-profit network of agricultural economists, advisors, producers
and specialists in key sectors of agricultural and horticultural value chains coordinated at and
hosted by the Thünen Institute for Farm Economics in Braunschweig.
In order to achieve the aforementioned aims, it is first necessary to explain how the data was
collected and draw the framework of these activities. Second, the typical farm data is presented,
followed by an economic analysis of potato production on the various typical farms. Finally, the
main findings and conclusions are outlined.
1.1 Scope and framework of this report
According to FAOstat (2015), 5.3% of the global potato production was attributed to the African
continent between 1993 and 2013, while Europe and Asia each contributed approximately 40%.
Africa is the continent with the second lowest contribution to global production of potato tubers,
with Oceania being the lowest.
In Kenia, potato is ranked as the third most produced agricultural commodity after sugar cane
and maize (FAOstat 2015), is the second most important food crop after maize (NPCK 2015).
Nyandarua county produces the single largest share of the national output annually (ca. 30%),
with 12 other counties contributing significantly to the national potato production, namely Bom-
et, Bungoma, Elgeiyo-Marakwet, Kiambu, Meru, Nakuru, NarokNyeri, Taita-Taveta, Trans-Nzoia,
Uasin Gishu and West Pokot (NPCK 2015).
In Nigeria, however, potato plays an inferior role in overall agricultural production and does not
rank among the ou tr s top 5 agricultural commodities (FAOstat 2015). Nevertheless, national
potato production increased dramatically from 80,000 t in 2003 to 1,200,000 t in 2013, with 80%
of that production taking place in Plateau State (NAERLS 2015), where potato constitutes a major
part of local food consumption. Furthermore, the average yield decreased from 7 t per ha in 2003
to 4.6 t per ha in 2013 (FAOstat), which implies that the total area harvested grew significantly
during this time.
2
Deutsche Gesellschaft für Internationale Zusammenarbeit (GIZ) PIA 1activities in 2014/15 targeted
potato production hot spots: The county of Nyandarua in Kenya and Plateau State in Nigeria
serve as significant hot spots, where the majority of potato tonnage is produced. agri bench-
mark s task a d o je ti e ithi the ultifold a tio s o du ted u der the GIZ PIA was to identi-
f a aseli e or efore s e ario for potato produ tio a d alue hai s, as well as to quantify
the economic profitability of farmers with the implemented measures, e.g., intensification of in-
put use. A more detailed description of the various interventions conducted within the frame-
work of the PIA project will be given below.
In order to meet the aforementioned objective, data was collected using the agri benchmark
Standard Operating Procedure (SOP)2 in Kenya for a baseline scenario (farm name KE5KI) in a full-
panel farm, while two other individual farm data (KE1OL and KE5NY) were acquired from farmers
that were covered under PIA measures. In Nigeria, a full-panel typical farm was established for
farmers covered by PIA measures (NG4PL) and a pre-panel farm was established for comparison
ith a o PIA s e ario.
These farms and their economic data serve as a representation of how potato farming is typically
done in those regions. It will therefore be possible to draw some initial conclusions regarding the
question of whether the intensification and interventions taking place through PIA would be prof-
itable for the farmers in the event that they would have to pay market prices for applied inputs.
Since PIA intervention in both countries was only recorded for one year in this study, caution
must be applied in assessing its effects. It is necessary to be cautious not only because of possible
one-year effects, but also because the project assisted farmers with inputs and even operations
in the field. For demonstration purposes, the selected farms were given access to information,
inputs and services through PIA which would likely not have been available in the current natural
e o o i a d so ial fra e ork.
1.2 Inclusion of national experts in production economics and capacity
building
In order to match the GIZs overall aim, as well as PIAs specific target of improving local capacity
regarding economic analysis of policy interventions, national research partners have been identi-
fied, trained and involved in the data collection process. In both Kenya and Nigeria, a search was
conducted to find a partner that would be equally suitable for the potato project, along with
long-term cooperation within the agri benchmark Cash Crop network.
1 For more information on PIA, see http://www.germanfoodpartnership.de/en/potatoes-for-africa/
2 For complete SOP, see http://www.agribenchmark.org/fileadmin/Dateiablage/B-Cash-Crop/Misc/SOP-cashcrop-0512.pdf

3
Given its prior involvement with PIA and its focus on potatoes, the National Potato Council of
Kenya (NPCK) was chosen as the Kenyan collaboration partner. NPCK officially became an agri
benchmark partner in May 2015 Within the agri benchmark network, their portfolio is a good
match with the potato partners from South Africa, further inspiring strong mutual interest.
Moreover, agri benchmark focused on connecting NPCK with the rest of the network and increas-
ing its young scientists apa ilities to use databases for farm analysis. Two members of NPCK
have been trained to conduct data collection using the agri benchmark method, while another
expert received training to work with the resulting agri benchmark database to maximize utiliza-
tion of the expertise that agri benchmark can offer its partners.. For the second round of data
collection, a new scientist with NPCK was trained for data collection with agri benchmark tools
and completed data collection in August 2015.
In Nigeria, previous collaborations with the National Agricultural Extension and Research Liaison
Service (NAERLS) under Competitive African Rice Initiative (CARI)– a sister program to PIA - had
yielded good results. In order to build a sustainable relationship and enhance the skills of experts
within NAERLS, agri benchmark began collaborating with the NAERLS department that primarily
deals with potatoes in Plateau State for data collection and analysis of the results. A training ses-
sion including local PIA partner, Folarin Oguntolu, took place in Abuja from the 28th
- 30th
August,
2015 with the friendly facilitation of GIZ Nigeria. In the scope of that session, suitable locations
for data collection were jointly identified with Mr. Oguntolu and contact with local lead farmers
was subsequently established. NAERLS researchers Muhammad Ibrahim and Musa Yusuf con-
ducted data collection in the field starting on the 14th
September, 2015 with sele ted far ers groups in Plateau State in the locations of Mangu and Pankshin. A third focus group with farmers
not included in the PIA programme had been scheduled to take place in Barikinladi; however, due
to local security issues, the interviews had to be conducted via telephone since researchers could
not access the location at the time.
A joint training session for both partnering organizations was conducted in November 2015 in
Nairobi, Kenya, following the presentation of the results to GIZ PIA and relevant stakeholders.
Additionally, colleagues from both institutes were invited to the annual agri benchmark Cash
Crop training in Braunschweig in February 2016, where they received in-depth training related to
data collection, data processing and economic analysis using agri benchmark data.
Hoping to provide long-term perspective for both partners and further develop capacities with
the partners, the agri benchmark Center is exploring the option to apply for donor projects that
can be utilized to deploy a joint research programme with both partners.
4
2 Kenya
2.1 Typical farm data Kenya
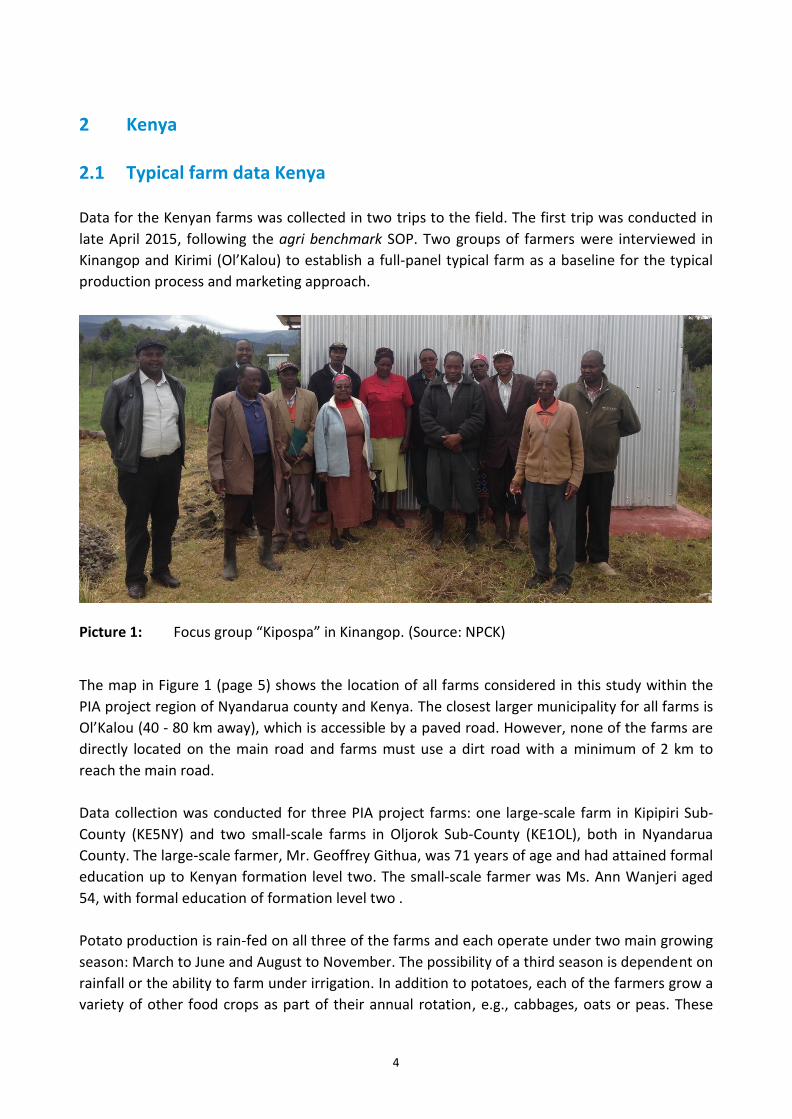
Data for the Kenyan farms was collected in two trips to the field. The first trip was conducted in
late April 2015, following the agri benchmark SOP. Two groups of farmers were interviewed in
Kinangop and Kiri i Ol Kalou to esta lish a full-panel typical farm as a baseline for the typical
production process and marketing approach.
Picture 1: Fo us group Kipospa i Ki a gop. (Source: NPCK)
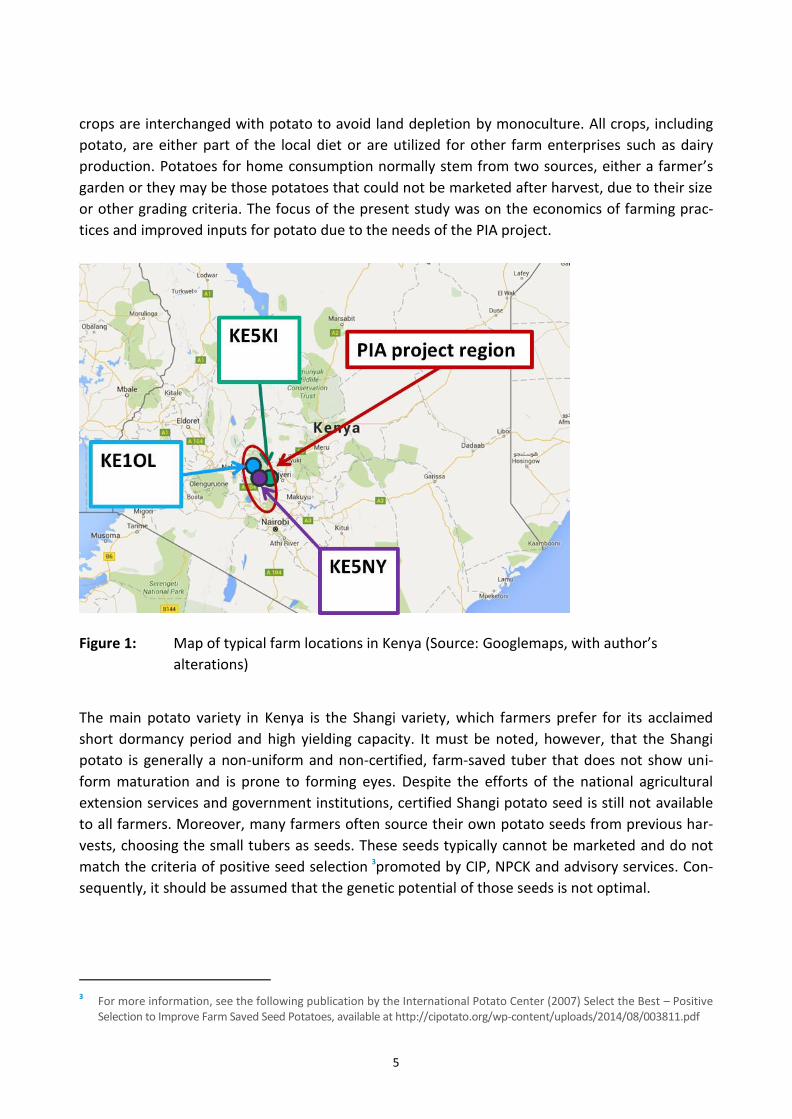
The map in Figure 1 (page 5) shows the location of all farms considered in this study within the
PIA project region of Nyandarua county and Kenya. The closest larger municipality for all farms is
Ol Kalou (40 - 80 km away), which is accessible by a paved road. However, none of the farms are
directly located on the main road and farms must use a dirt road with a minimum of 2 km to
reach the main road.
Data collection was conducted for three PIA project farms: one large-scale farm in Kipipiri Sub-
County (KE5NY) and two small-scale farms in Oljorok Sub-County (KE1OL), both in Nyandarua
County. The large-scale farmer, Mr. Geoffrey Githua, was 71 years of age and had attained formal
education up to Kenyan formation level two. The small-scale farmer was Ms. Ann Wanjeri aged
54, with formal education of formation level two .
Potato production is rain-fed on all three of the farms and each operate under two main growing
season: March to June and August to November. The possibility of a third season is dependent on
rainfall or the ability to farm under irrigation. In addition to potatoes, each of the farmers grow a
variety of other food crops as part of their annual rotation, e.g., cabbages, oats or peas. These
5
crops are interchanged with potato to avoid land depletion by monoculture. All crops, including
potato, are either part of the local diet or are utilized for other farm enterprises such as dairy
production. Potatoes for home consumption normally stem from two sources, either a farmer s
garden or they may be those potatoes that could not be marketed after harvest, due to their size
or other grading criteria. The focus of the present study was on the economics of farming prac-
tices and improved inputs for potato due to the needs of the PIA project.
Figure 1: Map of typical farm locations in Kenya (Source: Googlemaps, ith author s
alterations)
The main potato variety in Kenya is the Shangi variety, which farmers prefer for its acclaimed
short dormancy period and high yielding capacity. It must be noted, however, that the Shangi
potato is generally a non-uniform and non-certified, farm-saved tuber that does not show uni-
form maturation and is prone to forming eyes. Despite the efforts of the national agricultural
extension services and government institutions, certified Shangi potato seed is still not available
to all farmers. Moreover, many farmers often source their own potato seeds from previous har-
vests, choosing the small tubers as seeds. These seeds typically cannot be marketed and do not
match the criteria of positive seed selection 3promoted by CIP, NPCK and advisory services. Con-
sequently, it should be assumed that the genetic potential of those seeds is not optimal.
3 For more information, see the following publication by the International Potato Center (2007) Select the Best – Positive
Selection to Improve Farm Saved Seed Potatoes, available at http://cipotato.org/wp-content/uploads/2014/08/003811.pdf

6
Picture 2: Backyard potato field of KIPOSPA farmers group. (Source: NPCK)
2.2 Production systems
The individual potato production systems varied slightly between the three farms, as will be fur-
ther explained in the following pages. However, all of the farmers start their farming operations
in February in order to benefit from the long rains that occur in Nyandarua county between
March and May. All three of the farms are more than 2,000 m above sea level and may experi-
ence frost occasionally due to the temperature range of 5 to 21°C, with the lower temperatures
only being reached in the colder months of June and July. Average annual precipitation is about
1,500 mm and the soil is dominated by clay loam. The average potato yield in Nyandarua county
is 10 t per hectare (Muchoki 2015).
Oddly, most farmers in the area still refer to fertilizer as NPK even though the potassium compo-
nent is actually zero percent (23% N, 23% P2O5, 0% K20). Furthermore, it is only through the PIA
intervention that the farmers have gained access to fertilizer containing potassium, as will be
further explained in the section related to the production systems.
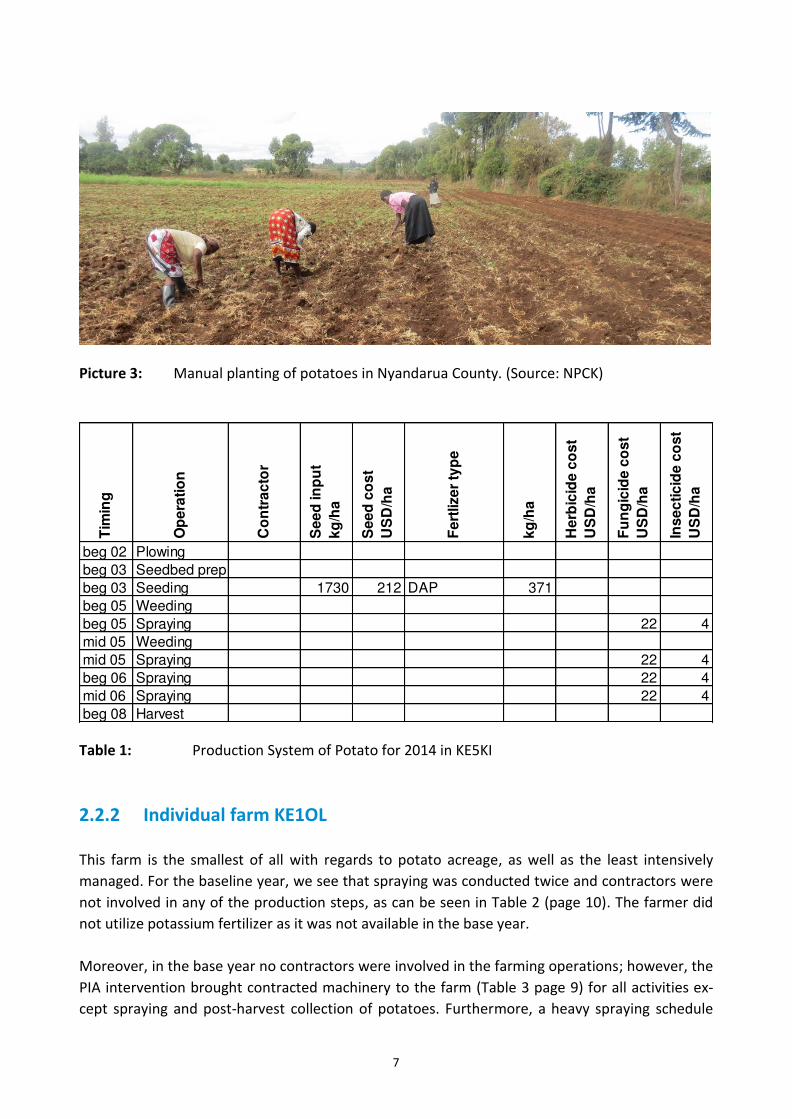
2.2.1 Typical farm KE5KI
In the full-panel typical farm, all operational steps are conducted by manual labor which may ei-
ther be hired or family labor, with a larger share of hired labor. Field operations are detailed in
Table 1 (page 87), with tillage before seeding being included. When the potatoes are successfully
planted in a furrow, they are covered with a heap of soil that includes a topping of DAP fertilizer.
After weeding in early May, a spraying of fungicides and insecticides is followed by another man-
ual weeding and three more sprayings. Harvest takes place in early August.
7
Picture 3: Manual planting of potatoes in Nyandarua County. (Source: NPCK)
Table 1: Production System of Potato for 2014 in KE5KI
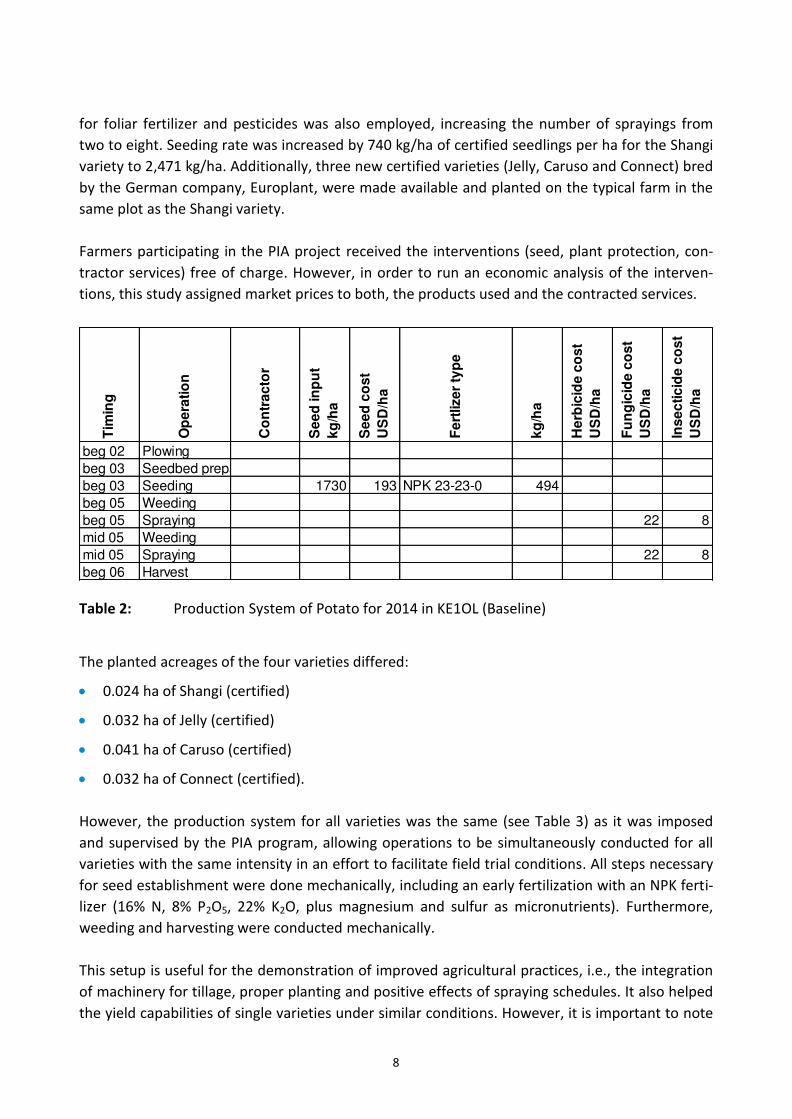
2.2.2 Individual farm KE1OL
This farm is the smallest of all with regards to potato acreage, as well as the least intensively
managed. For the baseline year, we see that spraying was conducted twice and contractors were
not involved in any of the production steps, as can be seen in Table 2 (page 10). The farmer did
not utilize potassium fertilizer as it was not available in the base year.
Moreover, in the base year no contractors were involved in the farming operations; however, the
PIA intervention brought contracted machinery to the farm (Table 3 page 9) for all activities ex-
cept spraying and post-harvest collection of potatoes. Furthermore, a heavy spraying schedule
Tim
ing
Op
era
tio
n
Co
ntr
ac
tor
Se
ed
in
pu
t
kg
/ha
Se
ed
co
st
US
D/h
a
Fe
rtlize
r ty
pe
kg
/ha
He
rbic
ide
co
st
US
D/h
a
Fu
ng
icid
e c
os
t
US
D/h
a
Ins
ec
tic
ide
co
st
US
D/h
a
beg 02 Plowing --- --- 0 0 --- 0 0 0 0
beg 03 Seedbed prepa--- --- 0 0 --- 0 0 0 0
beg 03 Seeding --- --- 1730 212 DAP 371 0 0 0
beg 05 Weeding --- --- 0 0 --- 0 0 0 0
beg 05 Spraying --- --- 0 0 --- 0 0 22 4
mid 05 Weeding --- --- 0 0 --- 0 0 0 0
mid 05 Spraying --- --- 0 0 --- 0 0 22 4
beg 06 Spraying --- --- 0 0 --- 0 0 22 4
mid 06 Spraying --- --- 0 0 --- 0 0 22 4
beg 08 Harvest --- --- 0 0 --- 0 0 0 0
8
for foliar fertilizer and pesticides was also employed, increasing the number of sprayings from
two to eight. Seeding rate was increased by 740 kg/ha of certified seedlings per ha for the Shangi
variety to 2,471 kg/ha. Additionally, three new certified varieties (Jelly, Caruso and Connect) bred
by the German company, Europlant, were made available and planted on the typical farm in the
same plot as the Shangi variety.
Farmers participating in the PIA project received the interventions (seed, plant protection, con-
tractor services) free of charge. However, in order to run an economic analysis of the interven-
tions, this study assigned market prices to both, the products used and the contracted services.
Table 2: Production System of Potato for 2014 in KE1OL (Baseline)
The planted acreages of the four varieties differed:
0.024 ha of Shangi (certified)
0.032 ha of Jelly (certified)
0.041 ha of Caruso (certified)
0.032 ha of Connect (certified).
However, the production system for all varieties was the same (see Table 3) as it was imposed
and supervised by the PIA program, allowing operations to be simultaneously conducted for all
varieties with the same intensity in an effort to facilitate field trial conditions. All steps necessary
for seed establishment were done mechanically, including an early fertilization with an NPK ferti-
lizer (16% N, 8% P2O5, 22% K2O, plus magnesium and sulfur as micronutrients). Furthermore,
weeding and harvesting were conducted mechanically.
This setup is useful for the demonstration of improved agricultural practices, i.e., the integration
of machinery for tillage, proper planting and positive effects of spraying schedules. It also helped
the yield capabilities of single varieties under similar conditions. However, it is important to note
Tim
ing
Op
era
tio
n
Co
ntr
ac
tor
Se
ed
in
pu
t
kg
/ha
Se
ed
co
st
US
D/h
a
Fe
rtlize
r ty
pe
kg
/ha
He
rbic
ide
co
st
US
D/h
a
Fu
ng
icid
e c
os
t
US
D/h
a
Ins
ec
tic
ide
co
st
US
D/h
a
beg 02 Plowing --- --- 0 0 --- 0 0 0 0
beg 03 Seedbed prepa--- --- 0 0 --- 0 0 0 0
beg 03 Seeding --- --- 1730 193 NPK 23-23-0 494 0 0 0
beg 05 Weeding --- --- 0 0 --- 0 0 0 0
beg 05 Spraying --- --- 0 0 --- 0 0 22 8
mid 05 Weeding --- --- 0 0 --- 0 0 0 0
mid 05 Spraying --- --- 0 0 --- 0 0 22 8
beg 06 Harvest --- --- 0 0 --- 0 0 0 0
9
that the genetic potential, along with the required conditions of these varieties usually vary;
therefore, the applied schedules may favor one variety while inhibiting another. Moreover, in
both individual farms (i.e., KE1OL and KE5NY) the seed density for each variety differed, thereby
likely distorting the results at harvest further.
Table 3: Production System of Potato for 2015 in KE1OL (with PIA intervention)
2.2.3 Individual farm KE5NY
Regarding farm KE5NY, we can see from the baseline year of 2014 (Table 4 page 11) that this
farmer is more advanced in his practices than the farmers from the typical farms, KE1OL and
KE5KI. Specifically, he already applied fungicide in the baseline year with a rather intensive spray-
ing schedule for blight control, as well as having hired a contractor for tillage operations. Shangi
variety seedlings of farm-saved origin were planted on 2 ha in 2014 and grown according to the
following production system:
Tim
ing
Op
era
tio
n
Co
ntr
ac
tor
Se
ed
in
pu
t
kg
/ha
Se
ed
co
st
US
D/h
a
Fe
rtlize
r ty
pe
kg
/ha
He
rbic
ide
co
st
US
D/h
a
Fu
ng
icid
e c
os
t
US
D/h
a
Ins
ec
tic
ide
co
st
US
D/h
a
end 02 Seedbed prepaContractor 0 0 --- 0 0 0 0
beg 04 Fertilizer Contractor 0 0 NPK 16:8:22mgS 494 0 0 0
beg 04 Other tillage Contractor 0 0 --- 0 0 0 0
beg 04 Seeding Contractor 2471 253 --- 0 0 0 0
mid 05 Weeding Contractor 0 0 --- 0 0 0 0
beg 05 Spraying --- --- 0 0 --- 0 0 49 16
mid 05 Spraying --- --- 0 0 --- 0 0 49 23
end 05 Spraying --- --- 0 0 --- 0 0 47 4
beg 06 Spraying --- --- 0 0 --- 0 0 51 4
mid 06 Spraying --- --- 0 0 --- 0 0 37 19
end 06 Spraying --- --- 0 0 --- 0 0 40 4
beg 07 Spraying --- --- 0 0 --- 0 0 34 13
mid 07 Spraying --- --- 0 0 --- 0 0 37 0
beg 08 Harvest Contractor 0 0 --- 0 0 0 0
beg 08 Other --- --- 0 0 --- 0 0 0 0

10
Table 4: Production System of Potato for 2014 in KE5NY (Baseline)
In 2015 under the PIA program, however, the farmer planted four varieties: Shangi (certified
seed) and three new certified varieties bred by Europlant, namely Jelly, Caruso and Connect. The
planted acreages of the four varieties differed:
0.03 ha of Shangi (certified)
0.1 ha of Jelly (certified)
0.13 ha of Caruso (certified)
0.10 ha of Connect (certified).
The production system for all varieties was the same as it was imposed and supervised by the PIA
programme; moreover, all varieties were planted on the same plot so that operations could be
simultaneously conducted for all varieties with the same intensity. The full production system is
shown in Table 5 (page 11). All steps for seed establishment were done mechanically, including
an early fertilization with an NPK fertilizer (16% N, 8% P2O5, 22% K2O, plus magnesium and sulfur
as micronutrients). Furthermore, weeding and harvesting were also conducted mechanically.
Tim
ing
Op
era
tio
n
Co
ntr
ac
tor
Se
ed
in
pu
t
kg
/ha
Se
ed
co
st
US
D/h
a
Fe
rtlize
r ty
pe
kg
/ha
He
rbic
ide
co
st
US
D/h
a
Fu
ng
icid
e c
os
t
US
D/h
a
Ins
ec
tic
ide
co
st
US
D/h
a
end 02 Plowing Contractor 0 0 --- 0 0 0 0
end 02 Other tillage Contractor 0 0 --- 0 0 0 0
beg 03 Seeding --- --- 1730 193 DAP 17-17-0 494 0 0 0
beg 04 Weeding --- --- 0 0 --- 0 52 0 0
beg 04 Other --- --- 0 0 --- 0 0 0 0
beg 04 Spraying --- --- 0 0 --- 0 0 22 0
mid 04 Spraying --- --- 0 0 --- 0 0 22 0
end 04 Spraying --- --- 0 0 --- 0 0 22 0
beg 05 Spraying --- --- 0 0 --- 0 0 22 0
mid 05 Spraying --- --- 0 0 --- 0 0 22 0
end 05 Spraying --- --- 0 0 --- 0 0 22 0
beg 06 Spraying --- --- 0 0 --- 0 0 22 0
mid 06 Spraying --- --- 0 0 --- 0 0 22 0
beg 07 Harvest --- --- 0 0 --- 0 0 0 0

11
Table 5: Production System of Potato for 2015 in KE5NY (with PIA intervention)
2.3 Inputs (fertilizer, plant protection, machinery, labor) None of the farms applied fertilizer with a potassium component in 2014. It was only through the
PIA interventions that a local fertilizer supplier made potassium fertilizer for seed establishment
available to the farmers. Prior to the intervention, farmers commonly applied DAP with 17% N
and 17% P2O5 or 23% N and 23%P2O5, which is often isleadi gl alled NPK – . The pa el of the typical farm lowered their fertilization intensity to 371 kg/ha, while their counterparts in
the PIA project reported using 494 kg/ha in both 2014 and 2015. After planting, farmers did not
apply additional fertilizers; in the PIA trials, however, small amounts of foliar fertilizer were ap-
plied during some of the pesticide sprayings. The profitability of these measures will be elaborat-
ed on in Chapter 0,
Tim
ing
Op
era
tio
n
Co
ntr
ac
tor
Se
ed
in
pu
t
kg
/ha
Se
ed
co
st
US
D/h
a
Fe
rtlize
r ty
pe
kg
/ha
He
rbic
ide
co
st
US
D/h
a
Fu
ng
icid
e c
os
t
US
D/h
a
Ins
ec
tic
ide
co
st
US
D/h
a
beg 02 Seedbed prepaContractor 0 0 --- 0 0 0 0
mid 02 Seedbed prepaContractor 0 0 --- 0 0 0 0
end 02 Seedbed prepaContractor 0 0 --- 0 0 0 0
beg 04 Plant Prot. Contractor 0 0 NPK 16-8-22mgS 494 0 0 0
beg 04 Other tillage Contractor 0 0 --- 0 0 0 0
beg 04 Seeding Contractor 4633 473 --- 0 0 0 0
beg 05 Spraying --- --- 0 0 --- 0 0 27 2
mid 05 Weeding Contractor 0 0 --- 0 0 0 0
mid 05 Spraying --- --- 0 0 --- 0 0 36 13
end 05 Spraying --- --- 0 0 --- 0 0 25 2
beg 06 Spraying --- --- 0 0 --- 0 0 41 0
mid 06 Spraying --- --- 0 0 --- 0 0 29 0
end 06 Spraying --- --- 0 0 --- 0 0 24 0
beg 07 Spraying --- --- 0 0 --- 0 0 51 0
mid 07 Spraying --- --- 0 0 --- 0 0 67 0
beg 08 Harvest Contractor 0 0 --- 0 0 0 0
beg 08 Other --- --- 0 0 --- 0 0 0 0

12
4Economics of .
The application of plant protection and the related costs increased drastically with the number of
sprayings. Initially, only the KE5NY farmer had implemented a heavy spraying schedule in the
base year of 2014. Typically, the spraying intensity would be much lower, spraying only 4 times
per season with between 10 and 12 knapsacks per acre (ca. 50 liters per hectare)
In the base year 2014, contractors were not involved except for the more KE5NY farmer, as the
availability of machinery for plowing is limited according to both the other two farmers and the
local extension offices. Manual labor is much more abundant, especially in the locations that
have no direct access to the main road. Depending on the task, manual laborers earn between
1.94 - 2.91 USD (200 - 300 KES) per acre.
2.4 Value chain for potatoes in Nyandarua
In 2014, the price for potatoes ranged between about 14.50 USD and 29 USD per 110 kg bag (ca.
14 KES/kg and 27 KES/kg, respectively) at the farm gate. However, it should be noted that the so-
alled sta dard potato ags referred to in this case are not standard in weight. Farmers have
sophisticated ways of adding net structures to the bags which lead to greater overall weights.
Picture 4: Typical Kenyan potato bags in a storage in Nairobi. (Source: F.Rösner)
Moreover, traders do not weigh bags when collecting from the farm. NPCK conducted sampling
harvest time in 2014, where bags were being weighed at the farm gate as they were sold, ulti-
mately recommending a standard bag weight of 110 kg to be used for calculations and price vali-

13
dations in the typical farm. Prices are low during glut season (August-September) and high in
scarcity season (March-April).
The products of the new varieties were priced according to negotiations between GIZ and the
processors involved in the project. The Connect variety costed 0.15 USD/kg (15 KES/kg) at the
farm gate, while Caruso was 0.20 USD/kg (20 KES/kg) and Jelly was 0.10 USD/kg (10 KES/kg), re-
spectively. In the intervention year, the PIA farmers received 0.21 USD/kg (21 KES/kg) at the farm
gate for Shangi potatoes.
The farmers market their produce at the farm gate and the traders incur all transportation costs,
due in large part to the fact that farms are far from the main paved road and farmers often do
not own vehicles. Therefore, they depend on the traders or middle men who come to buy and
transport the potatoes.
The smaller the amount of potatoes produced, the higher the likelihood of marketing the entire
harvest immediately. In case the famer does not manage to sell all the produce immediately after
harvest, remaining product is temporarily stored for a few days before being sold to traders. Giv-
en the short dormancy of conventional varieties, such as Shangi, at ambient temperatures, stora-
bility is short without cooled facilities which are generally not available at the household level.
When asked what interventions could help improve the value chain post-harvest, the farmers
indicated the need for a direct connection to the market or processors to help reduce exploita-
tion by middlemen. The farmers also suggested that organizations and the government should
jointly lobby for standardized packaging to secure more uniform pricing by the traders. Further-
more, it remains unclear as to why farmers do not sell by the kilogram since scales are widely
available in input supply stores in the countryside.
Regional traders sell the potatoes to vendors at the market at about 34 USD (3,500 KES) per bag.
Vendors then take products to be used either for household consumption or to be resold at
44 USD (4,500 KES) per bag. Larger retailers and processors normally buy by the kilogram and pay
between 0.16 – 0.29 USD (16 – 30 KES) per kg in-season and up to 0.58 USD (60 KES) per kilogram
off-season. The buying price is a result of several aspects, primarily quality of the product, yet it
may also be affected by the existence of established contracts with farmers or vendors and long-
standing trade relations. Since market linkage was a major objective of PIA in Kenya, processors
for potato chips that had been involved with PIA or with NPCK have been interviewed to better
understand constraints from the u er s perspe ti e. The processors interviewed are Propack,
Sereni Fries and Panagro.
A major challenge for the processor side is the non-uniformity of potatoes delivered both from
traders and contract farmers. Different tuber sizes and the tendency of Shangi to have deep eyes
pose problems for processors and make peeling losses unpredictable. Contract farming has been
tried by all three processors interviewed without major success, since farmers reportedly did not

14
stick to the contractual arrangements. However, Sereni Fries was in the process of launching an-
other contract farming project in Meru at the time of the interview.
Picture 5: Peeled Shangi potatoes with eye-formation. (Source: F. Rösner)
15
3 Nigeria
3.1 Typical farm data
Typical farm data was gathered in Plateau State in east-central Nigeria, where the majority of the
atio s potatoes are produced and the PIA project was conducted. As indicated by its name, the
state is located on a high plateau at about 1,200 m above sea level. The soils are sandy loams and
the annual precipitation near the evaluated far s lo atio s is arou d ,400 mm. Average yield
per hectare is approximately 4.2 t per ha according to FAOStat (2008), and 5 t per ha according to
other organizations such as the National Root Crop Research Institute in Umudike.
As depicted in Figure 2 (page Fehler! Textmarke nicht definiert.), two typical farms were estab-
lished to give insight into the profitability of the PIA measures in Plateau State, Nigeria. The first
is NG3PL located in Barikinladi, which represents a non-PIA intervention scenario where the
farmers conducted busi ess as usual o ha for a local potato variety that is commonly known
as Ali. Farmers use farm-saved seed that are positively selected.
Picture 6: Focus group discussion for NG4PL in Pankshin. (Source: NAERLS)
The second typical farm in Nigeria, called NG4PL, represents the farmers that have been covered
under the PIA program and supported with certified and imported seed of the Marabel variety.
Furthermore, PIA established a market link to a large retail chain. Both typical farms are non-
irrigated in the potato growing season, despite some farmers having access to irrigation systems
which may be used for other crops or plots. Therefore, the potato farms in this study were de-
pendent on the rainfall.

16
Picture 7: Backyard potato farm in Pankshin. (Source NAERLS)
Besides potato, both typical farmers plant other field crops off-season which were not evaluated
in the scope of this report. Another on-farm contribution to the farmers incomes comes through
cattle and poultry operations which contribute to potato farming through dung that is used as
fertilizer. Potatoes are grown in a monoculture system on the same plot for both farms. From an
agronomic point of view, an initial recommendation to farmers is to change this practice and in-
clude other crops into the rotation in order to reduce problems stemming from potato specific
pests.
Figure 2: Map of Nigeria with typical farm locations (Source: googlemaps, own alteration)
17
The financial means of both typical farmers are limited; therefore, access to fertilizer is limited by
cash constraints and likely varies between years. No credit schemes or official money lending
institutions are accessible for the farmers. The figures at hand represent an average harvest year
when the farmers have moderate access to cash and can therefore afford to purchase fertilizer.
In addition to the provision of certified Marabel seed at affordable rates, the NG4PL farmer had
already benefited from the PIA project, as the program had built a storage facility for their pro-
duce.
3.2 Production system
The major difference in the two Nigerian farms was the seed available to the farmers. In the
NG3PL (non-PIA) farm, the farmers use farm-saved seeds that had been derived from the Nicola
variety and regrown at the farm for an unspecified number of production cycles. On the other
hand, the NG4PL farmers (part of PIA) had access to a new certified variety named Marabel. Ad-
ditionally, farmers not involved with PIA reported using more contracted labor in tillage opera-
tions. The production systems for the NG3PL farm are depicted in Table 6, while those of the
NG4PL farm are shown in Table 7 (both on page 18).
Before describing the production systems of each farm, the following should be taken into con-
sideration with regards to fertilizer use and usefulness: Both the focus groups and the PIA coordi-
nator in Nigeria indicated that one cannot be certain of the actual amount of active ingredients
and nutrients in any given bag of fertilizer purchased through the frequent marketing channels in
Nigeria. In many cases, dealers repackage fertilizer into smaller quantities that farmers actually
demand in order to allow space for additional ingredients (e.g., sand) that increase the weight of
the mixture, but compromise the composition.
Another issue is the traditional understanding that farmers have regarding fungicide application
for blight control. In most cases, farmers reported only using the fungicide after the blight infes-
tation emerged. In order for the fungicide to be effective, however, it must be applied as a pre-
ventive measure. Getting the farmers to understand this fact is an essential component of any
training efforts that are made to improve their livelihoods.

18
Table 6: Production System of Potato in NG3PL in 2015 (without PIA intervention)
Table 7: Production System of Potato in NG4PL in 2015 (with PIA intervention)
Tim
ing
Op
era
tio
n
Co
ntr
ac
tor
Se
ed
in
pu
t
kg
/ha
Se
ed
co
st
US
D/h
a
Fe
rtlize
r ty
pe
kg
/ha
He
rbic
ide
co
st
US
D/h
a
Fu
ng
icid
e c
os
t
US
D/h
a
Ins
ec
tic
ide
co
st
US
D/h
a
mid 04 Plowing Contractor 0 0 --- 0 0 0 0
beg 05 Other tillage Contractor 0 0 --- 0 0 0 0
mid 05 Other Contractor 0 0 --- 0 0 0 0
mid 05 Seeding --- --- 1500 1229 --- 0 0 0 0
beg 06 Weeding --- --- 0 0 --- 0 0 0 0
beg 06 Other --- --- 0 0 --- 0 0 0 0
beg 06 Fertilizer --- --- 0 0 Poultry manure 1000 0 0 0
beg 06 Fertilizer Contractor 0 0 NPK 150 0 0 0
mid 06 Spraying --- --- 0 0 --- 0 0 83 0
mid 08 Harvest --- --- 0 0 --- 0 0 0 0
mid 08 Other --- --- 0 0 --- 0 0 0 0
mid 08 Other --- --- 0 0 --- 0 0 0 0
Tim
ing
Op
era
tio
n
Co
ntr
ac
tor
Se
ed
in
pu
t
kg
/ha
Se
ed
co
st
US
D/h
a
Fe
rtlize
r ty
pe
kg
/ha
He
rbic
ide
co
st
US
D/h
a
Fu
ng
icid
e c
os
t
US
D/h
a
Ins
ec
tic
ide
co
st
US
D/h
a
mid 04 Plowing Contractor 0 0 --- 0 0 0 0
mid 05 Seeding --- --- 2500 2832 --- 0 0 0 0
beg 06 Weeding --- --- 0 0 --- 0 0 0 0
beg 06 Other --- --- 0 0 --- 0 0 0 0
beg 04 Fertilizer --- --- 0 0 NPK 15 15 15 150 0 0 0
beg 04 Fertilizer Contractor 0 0 Poultry manure 1000 0 0 0
mid 06 Spraying --- --- 0 0 --- 0 0 83 0
mid 08 Harvest --- --- 0 0 --- 0 0 0 0
mid 08 Other --- --- 0 0 --- 0 0 0 0
mid 08 Other --- --- 0 0 --- 0 0 0 0

19
3.3 Inputs (fertilizer, plant protection, machinery, labor)
The inputs used for both farms were modelled equally since PIA in Nigeria did not intervene with
respect to fertilizer and pesticide use, but focused on marketing channels and providing adequate
storage facilities for farmers. Both of the typical farmers reported following similar fertilizing
practices of applying 150 kg of NPK 15-15-15.
Concerning plant protection, farmers did not report different practices. Generally, plant protec-
tion and the respective education seemed to be a problem for these farms because fungicides
against blight infestations - the biggest problem for potato cultivation for the two typical farms -
was only applied after the infestation was detected. This neglects the fact that fungicide applica-
tion to protect against blight must be used as a preventative measure in order to be effective. It
is possible that farmers avoid purchasing fungicides since they have to carefully allocate their
limited financial resources to activities that are actually present, rather than just a potential
threat. However, at the point when necessity becomes evident, it is too late to act.
A contractor was hired on both farms for plowing and spreading fertilizer, since these operations
are conducted mechanically and farmers do not possess the required machinery. Farmers report-
ed, however, that contractors are not always available and activities need to be scheduled ac-
cording to the contractor s timetable.
Manual labor in the field is used in all operations that do not involve a contractor. For both farms,
the cost for manual labor was considered to be equal for hired and family labor, as farmers
claimed to pay relatives on an equal scale as hired workers, while the only real labor opportunity
was working on any nearby farm.
3.4 Value chain for potatoes
The marketing chain for potatoes in Plateau State involves a number of stakeholders which varies
according to location and markets. The majority of these actors have formal secondary educa-
tion. The various channels through which the commodity follows, from the point of production to
the final consumer, are indicated in Figure 3 on page 20.
Buying is the process that normally follows the simple marketing channel from farm gate to rural
assembler to wholesaler to retailer and, finally, to the consumer irrespective of the season. Pota-
toes are usually transported to the markets via hired vehicles by the rural assemblers, with the
marketers (i.e., wholesalers and retailers) being charged for the transport cost which is usually
negotiable depending on the distance and number of transported bags. The transport price per
bag (approx. 50 kg) ranges from 1.25 – 1.49 USD (250-300 NGN) to be taken from the typical farm
locations to the state capital of Jos.

20
Figure 3: Value Chain of Potato in Plateau State (agri benchmark, 2015)
Wholesalers and retailers typically own small shop buildings made of blocks and cement (total
construction costs ca. 800,000 NGN) which are arranged as booths at the markets. The majority
of the marketers, particularly the wholesalers, are involved in the marketing of potato especially
during glut periods, while some retailers also sell other tuber crops beside potato, e.g., yam and
sweet potato. Potato varieties sold (and consequently demanded by marketers) include Marabel,
Nicola, Diamand, Batista, Crystal Lady, and Ali which is one of the local variety.
When interviewed, marketers indicated quality and the size of tubers as being very important
criteria for marketing success. Generally, the higher the quality and the bigger the tuber size, the
better is the price. Marketers normally measure quality according to the physical appearance of
the commodity, but did not specify which criteria the potatoes had to fulfil. Given that farmers do
not clean their potatoes prior to selling, it is likel that o old - o da age is the prevailing
criterion. There are only two grades involved, selected and medium grades. However, no stand-
ardized measurement of quality was identified to differentiate between the two.
There are no restrictions related to the selling of the commodity, i.e., the marketers sell their
products to anybody that is interested; this includes restaurants, eateries and households. Both
categories of marketers (wholesalers and retailers) do not own any equipment such as trucks,
scales, trolleys or carts for moving products from one place to another; rather, they depend en-
tirely on commercial vehicles for transporting commodities. Since the marketers do not own any
equipment, no financial credit institutions of any type is involved in marketing activities. Labor is
21
a very important aspect of potato marketing due to the produ t s bulkiness, as most of the mar-
keters cannot easily move the bags from one location to another, ultimately requiring the use of
hired labor. None of the interviewed marketers used family labor and no seasonal employees
were involved. Moreover, the price and number of laborers is dependent on the given operation,
but at the most, 4 people are involved in each operation.
No contractual agreements of any sort exist between growers and marketers. The price of a 50kg
potato bag normally depends on the season (glut and off-season). During the glut season, around
August/September, prices were reported as being very poor and selling as low as 1,500 NGN per
50kg bag or 0.15 USD/kg (30 NGN/kg). On the other hand, prices during off-season, which is be-
tween April and June, go as high as 21,000 NGN per 50kg bag or 2.12 USD/kg (420 NGN/kg). Still,
marketers only store the produce for a week or less due to their lack of storage space. Conse-
quently, the off-season price is extremely high, but does not benefit farmers as they are also un-
able to store large amounts of produce themselves. In consideration of this, the storage building
provided by PIA provides a great opportunity for farmers to take advantage of the off-season
price peak.
Marketers indicated the following major challenges during the interviews:
(1) Fluctuating market prices,
(2) Lack of storage facilities, and
(3) High transportation costs.
Obviously, there is a strong link between points 1 and 2. If sufficient storage space were available
to the marketers, they would buy potatoes at glut season and store for off-season to achieve
higher, more consistent prices. Theoretically, however, growers would also benefit from storage
in the long run because marketers would not be forced to sell during peak season and would
therefore be able to pay higher prices.
For this study, the farm gate price for NG3PL was assumed to be 0.65 USD/kg (130 NGN/kg),
while the farm gate price of NG4PLs Marabel was known to be 1 USD/kg (200 NGN/kg), as nego-
tiated by PIA. In the case of NG3PL, the focus group agreed that this would be an average price
that could be achieved at market, regardless of the individual selling patterns and cash needs.

22
4 Economics of production systems implemented under PIA
In the following chapter, the economic results for the new varieties introduced by PIA will be pre-
sented and discussed. Comparisons will be made (according to USD pricing) to facilitate the un-
derstanding and comparability between countries. The utilized exchange rates were the annual
average exchange rate, as provided by www.oanda.com currency converter: For 2014, the aver-
age annual exchange rates used were 1 USD = 162.63 NGN and 1 USD = 88.08 KES. For 2015, the
average exchange rates for the period between 1st
January, 2015 and 1st
November, 2015 of 1
USD = 198 NGN and 1 USD = 101 KES were used.
4.1 Yields
The yields for all farms, years and varieties are shown in Figure 4 on page 22; included are five
farms from two countries. Two of these farms are the Nigerian farms NG3PL (baseline) and
NG4PL (PIA) on the right side of the figure, with data from the 2015 harvesting season for a local
potato ariet a ed Ali a d the ariet i trodu ed through PIA a ed Mara el . Additional-
ly, there are three Kenyan farms: KE1OL representing data from a single-interviewee smallholder
for 2014 (baseline) and 2015 (PIA). Another farm in the middle, KE5KI, represents the typical farm
data for the region obtained in focus group discussions for the 2014 harvesting season. Finally,
the data for KE5NY represents data from a more advanced smallholder, with an above average
farm-size for 2014 (baseline) and 2015 (PIA).
Figure 4: Yields of all farms and varieties in tons per hectare (Source: agri benchmark 2015)
23
“ha gi a d Ali are lo al arieties, hile Mara el, Jell , Caruso a d Co e t are ertified arie-
ties by Europlant. As a visual aid, the bars in Figure 4 were colored orange to indicate the results
if farms impacted by the PIA intervention.
The two countries performed very differently in terms of yield: Figure 4 (page 22) shows that the
two Nigerian farms are far behind their Kenyan competitors. The farmers included in PIA per-
formed slightly better with 8 t per hectare while their counterparts without the improved variety
only harvested 6 t per hectare. Both yields are far behind the lowest yield in Kenya, which is 11.9
t/ha for KE1OL in the baseline year of 2014. However, the yields for both of the Nigerian farms
are above the expected average yield of 5 t/ha. Here, it is also important to note that a reported
blight infestation negatively affected yields for almost all farmers on the Jos Plateau in 2015.
Yields in Kenia were highest on the KE5NY farm, which achieved the best performance when
comparing yields on an annual basis, as well as for each variety. Under the PIA scheme in 2015,
the yields for KE5NY were best for the certified Shangi variety (27.3 t/ha), followed by the Jelly
variety at 26.3 t per ha. Moreover, Connect performed better in this farm (22.3 t/ha) than the
local Shangi variety did in the previous year (19 t/ha). Only the results for the Caruso variety
(16.6 t/ha) were lower than in the year prior to intervention.
In the smallest Kenyan farm investigated, KE1OL, the results under the PIA measures are convinc-
ing of the positive impact of the intervention, particularly for the Shangi (19.5 t/ha) and Jelly
(17.6 t/ha) varieties. Again, the local variety performed better than in the previous year
(11.9 t/ha).
Compared with the typical farm, KE5KI (13.8 t/ha for Shangi), it can be seen that without PIA,
KE1OL performs slightly below expectations, while KE5NY was already achieving much higher
yields in the baseline year.
The data from Kenya suggests that the local variety, which is already accustomed to climate and
soil conditions, performs best in the farm trials established for the PIA intervention and ultimate-
ly benefits from input intensification. For KE5NY, we see a yield increase for Shangi of 43%, while
the smaller KE1OL increased yields substantially by 63%, suggesting that the combination of certi-
fied seed, increased inputs and mechanization was a success. An initial recommendation could be
to improve the availability of those certified seeds to farmers at affordable prices in order to in-
crease the yields, even prior to assessing the profitability of the measures as a whole.
Based on the yields, the Jell ariet see s to e the stro gest ri al for the lo al “ha gi i Ken-
ya. Increased storability and uniform processing features are a positive aspect that may lead
farmers to invest in this new variety if the price of seed and produce are appropriate. Moreover,
the Marabel variety introduced in Nigeria by PIA yielded promising results on the first try.

24
4.2 Establishment costs
With the PIA intervention, the seed density was increased in all participating Kenyan farms, while
for the Nigerian trial, the same seed density was assumed for PIA and non-PIA farmers. The larg-
est portion of establishment costs in the intervention was for seed costs in both countries, as
shown in Figure 5 (page 24). In the traditional setups, the farmers used seed densities below the
recommendation set by PIA. Furthermore, they used their non-marketable produce as seedlings
for the next season, while the project required growers to use either certified local seed (in the
Kenyan PIA) or new certified varieties (both countries), thereby dramatically increasing seed
costs. Additionally, the seed density in Kenya was further increased, leading to an even greater
increase in seed costs.
Figure 5: Establishment costs in USD per ha (Source: agri benchmark 2015)
The baselines for both countries (KE 2014 and NG3PL) show that although seed costs were signif-
icantly lower in farmers operations prior to intervention, they increased significantly with the
project, and even doubled in the Kenyan farms, for all varieties in 2015. For the new varieties,
this can be attributed to higher seed cost per kg and increased seed density. The latter also af-
fected the seed cost in local Kenyan varieties, e.g., in KE1OL in 2015, the seeding rate increased
from 1.7 t per ha by almost 50% to 2.4 t for Shangi. In KE5NY for 2015, the seeding density for
Shangi almost tripled at 4.6 t4 per ha. Despite those increases, it is apparent that seed costs for
4 Information received from CIP for the demonstration plots.

25
the local varieties were lower in all scenarios and countries when compared to imported varie-
ties.
In the Nigerian farms, the seed costs more than doubled for the PIA farm (NG4PL)with Marabel
reaching 2,832 USD/ha, while the local variety (Ali) reached 1,229 USD/ha which can be attribut-
ed to a higher seed density of 2,500 kg per ha, while the local variety is typically established with
1,500 kg of seed per ha. Additionally, the price for local uncertified seed is much lower at
0.81 USD per kg (Marabel: 1.13 USD per kg). Therefore, it is not surprising that seed costs for
Marabel in the PIA farm are more than 200% than those of the typical Plateau farmer.
Figure 6 (below) gives an overview of seed productivity by showing the kg of potato produced per
kg of potato seedlings. The local varieties in both countries were more productive than the intro-
duced ones, with the best result being 11 kg/kg seed for KE5NY in 2014, the year without PIA
interference. However, the second most productive seed was the newly introduced Connect,
yielding 8.6 kg/kg seed. When interpreting the productivity figures, one must bear in mind that
the seed density for the Kenyan farms was not equal for all varieties. It is even possible that a
high density, as for KE5NY in 2015, may even reduce the productivity as tubers need space to
develop. It is therefore recommended to run additional field trials or demonstrations in Kenya,
where the varieties are grown under the same conditions and with the same seeding rate.
Figure 6: Seed productivity in kg potatoes per kg seed (Source: agri benchmark 2015).
*Note: Grey bars indicate farming practices without intervention
Fertilizer costs per ha (Figure 4 on page 22) in Nigeria are slightly lower than in the Kenyan PIA
farms at 272 USD/ha, but still higher than the typical Kenyan farm, KE5KI, for 2014 (264 USD/ha).
26
A major reason for this is the low price of poultry manure that Nigerian farmers applied as organ-
ic fertilizer which costs around 0.15 USD per kg (30 NGN). The price for manure was calculated by
using the prevailing market price of 15 USD (3,000 NGN) per 100kg bucket and assuming that the
nutrient composition in poultry manure is 3% N, 0.99% P and 1.16% K (pure nutrient content).
Looking at Figure 5 (page 24), however, it can be seen that the distribution of fertilizer costs is
quite similar across the farms and countries. In the baseline year of 2014, KE1OL incurred slightly
higher fertilizer costs (364 USD/ha) than its fellow PIA farmer, KE5NY (353 USD/ha), because the
fertilizer (DAP) applied by the latter farmer is slightly cheaper.
With PIA intervention, fertilizer costs (granulate) of both Kenyan farmers decreased to
323 USD/ha; it is noteworthy, that the new fertilizer included potassium and was applied at the
same rate as in 2014 (494 kg per ha). The introduction of this fertilizer to potato farming could be
considered a major achievement of the PIA project should this fertilizer remain available to the
farmers in Nyandarua, as potassium is an important nutrient in potato production. Including foli-
ar (or liquid) fertilizers that were applied during PIA intervention in Kenya into the total fertilizer
costs, KE1OL (2015) had the highest fertilization costs at 400 USD/ha. KE5NY had much lower
fertilizer costs (340 USD/ha) in the same year, as the amount of foliar feed applied was lower.
Therefore, establishment costs with this fertilization scheme are comparable to those costs in-
curred with the traditional practices of both farmers, but is still 76 USD/ha more expensive than
that of typical farmers (KE5KI).
Figure 7 (page 27) shows the productivity of granulate fertilizers and manure applied by indicat-
ing the kg of potato produced per kg of nutrient applied. The striped grey bars highlight tradi-
tional (non-PIA) scenarios. Foliar fertilizers were not considered in this calculation, as the exact
composition of the fertilizer was not made available to agri benchmark and the dosages were low
enough to consider the impact on the crop negligible.
The average nitrogen productivity across all farms was 218 kg of potatoes per kg nitrogen input,
while each kg of potassium produced 173 kg of potatoes on average. As yields were much higher
in the PIA scenario for Nigeria (NG4PL), and the fertilization was equal, fertilizer productivity was
better (264kg/kg K and 152kg/kg N) than in the traditional setup which contained only
114 kg/kg N and 198 kg/kg K. Furthermore, traditional fertilizer practices for the Kenyan farms
were less productive than for those under PIA intervention. For KE1OL, the baseline year has the
lowest recorded N productivity across all farms at 104 kg/kg N, while other traditional scenarios
in Kenya yielded at least double the kg of potato per kg nitrogen: KE5KI at 207 kg/kg N and KE5NY
at 228 kg/kg N.

27
Figure 7: Productivity of nutrients in granular fertilizers applied in kg output/kg input.
(Source: agri benchmark 2015) *Note: Grey striped bars indicate traditional farm-
ing practices.
For both Kenyan PIA farms, the yield increase is mirrored by an increased N productivity in the
Shangi variety: KE1OL at 247 kg/kg N (+137%) and KE5NY at 346 kg/kg N (+ 53%), given that the
amount of granulate fertilizer was equal in 2014 and 2015.
All farms applied fungicides, the costs of which varied significantly between Kenyan farms, while
those in Nigeria assumed equal application fungicide rates at 83 USD/ha. The highest fungicide
costs occurred for KE1OL in 2015, with 400 USD/ha across all varieties. For comparison, typical
potato cultivating farms in South Africa and Germany spend around 260 USD/ha on fungicides,
which suggests that the spraying scheme chosen for KE1OL under PIA can be considered overly
expensive for a farm of that size and degree of mechanization. In 2014, the same farm paid
44 USD/ha, as the application rate of fungicide was much lower.
A similar increase of fungicide costs is observable for KE5NY, even though this farm was already
facing much higher costs (177 USD/ha) in the baseline year than KE1OL and the typical farm,
KE5KI (88 USD/ha). Still, the guideline implemented by PIA led to an increase in fungicide costs by
68%, at 299 USD/ha for KE5NY. Herbicides were only used in 2014 by the KE5NY farmer
(52 USD/ha), but not for any other farm.
Though fungicides play the most important role within pesticide costs (Figure 5 on page 24) all
Kenyan farms except KE5NY in 2014 incurred insecticide costs ranging from 15 USD/ha for KE1OL
and KE5KI in 2014, to 84 USD/ha for KE1OL under PIA in 2015.

28
When establishment costs are compared on a per ton of produce basis, as depicted in Figure 8
(page 28), the local Shangi (KE) and Ali (NG) varieties seem to have an advantage over the im-
ported varieties.
Figure 8: Establishment costs in USD per t (Source: agri benchmark 2015)
For the Shangi variety, establishment costs range between 41 USD/ha (KE5KI and KE5NY in 2014
and 2015) and 55 USD/ha (KE1OL in 2015), yet remain far below those of Connect (88 USD/ha for
KE5NY and 148 USD/ha for KE1OL in 2015), which is the cheapest of the imported varieties on a
per ton basis. Due to the low yields of the Nigerian farms, crop establishment costs are signifi-
cantly higher per ton at 264 USD/ha for Ali and 398 USD/ha for Marabel.
4.3 Operating costs
In the context of this study, operating costs are composed of five elements: machinery, diesel,
hired labor, family labor and contractor costs. As none of the farmers owned machinery or re-
quired diesel to perform operations, both items were not taken into consideration. Hired labor
includes all laborers that are not part of the farmer s family and are employed either on seasonal
or long-term contracts. Family labor cost, on the other hand, is meant to reflect the economic
value of unpaid family members. This value is derived by estimating the opportunity costs for the
family labor input; i.e., what family members be able to earn outside the family farm. Given the
underdeveloped labor markets in the two countries, it is assumed that the most realistic scenario
is that these family members would work as hired labor on other farms. Hence, opportunity costs

29
are assumed to be equal to the wage rates for hired workers. Contractors, by agri e h ark’s
definition, operate machinery and are paid a lump sum for machinery and operating staff.
When analyzing operating costs per ha (Figure 9 on page 29), all varieties on the same plot show
the same operating costs since operations were conducted on the plot simultaneously for all va-
rieties and, consequently, had the same cost. In Kenya, the PIA intervention led to an increase in
operating costs which are mainly related to the increased use of labor during spraying operations
and the inclusion of contracted machinery for tillage operations, seed establishment (planting
and ridging) and harvest. For KE1OL, the total operating costs more than doubled under PIA from
569 USD/ha to 1,349 USD/ha. Aside from the new contractor costs in 2015 (391 USD/ha), the
total labor hours also dramatically increased as more operations were conducted than in the
baseline year. This is reflected in the cost increase for hired labor from 436 USD/ha to
481 USD/ha, but even more so in the cost increase of family labor from 132 USD/ha to
474 USD/ha.
A similar but even more impressive increase occurred for KE5NY, where total operating costs in
2014 at 362 USD/ha were very similar to those of the typical farm, KE5KI, at 377 USD/ha, even
though a contractor (152 USD/ha) was added to the labor mix for KE5NY, while only hired and
family labor were used for the more traditional typical farm. Under PIA intervention, the operat-
ing costs of 1,419 USD/ha for KE5NY was nearly four times the initial operating costs.
Figure 9: Operating costs in USD per ha (Source: agri benchmark 2015)
In Nigeria, there is also a visible difference between non-PIA operating costs and those incurred
by farmers operating under PIA intervention. While NG3PL incurred 430 USD/ha in total operat-
ing costs, its PIA counterparts (NG4PL) paid ca. 25% less at 337 USD/ha. A key reason for this dif-
30
ference is that NG4PL had less contracted operations and, thereby, lower contractor costs of
61 USD/ha (NG3PL: 157 USD/ha). However, it is possible that in an expansion of PIA with a larger
sample of farmers, the traditional practices of more tillage operations would also be reflected.
Costs for hired labour were similar at 251 USD/ha for NG3PL and 255 USD/ha for NG4PL.
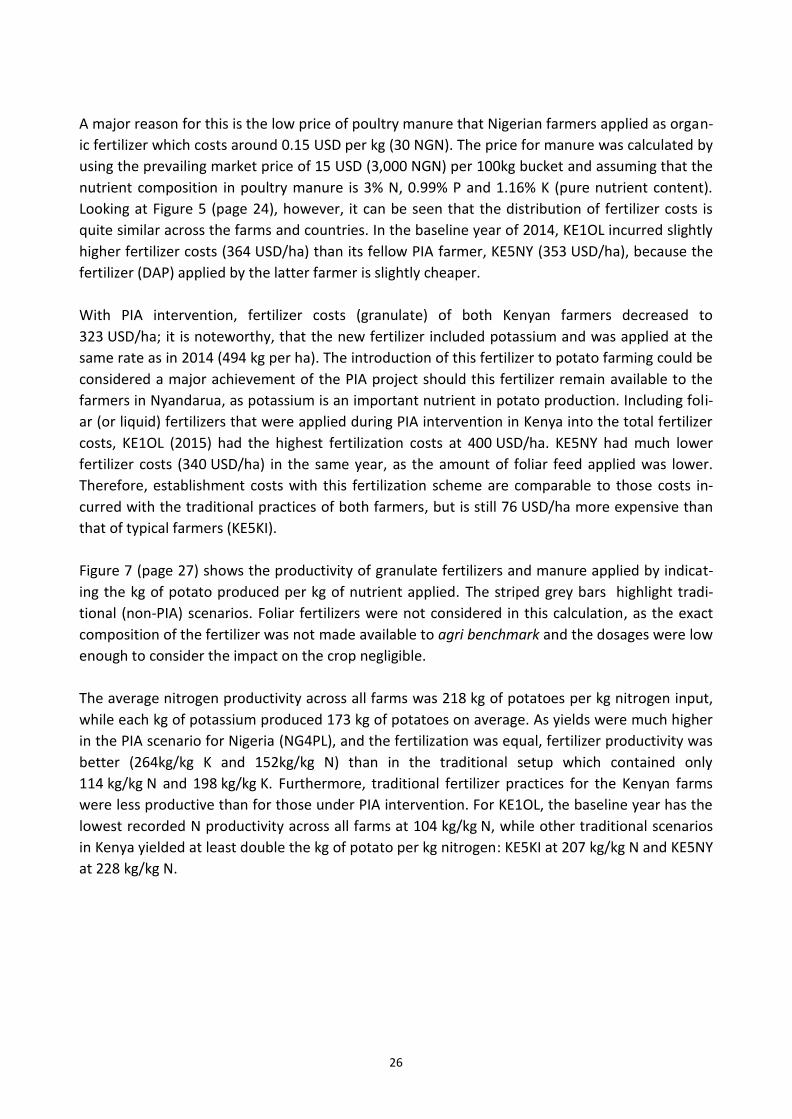
On a per ton basis, the difference in operating costs across farms becomes more tangible through
the obvious differences in yields (Figure 10 page 29). NG4PL (42 USD/t) has nearly 50% lower
operating costs than NG3PL (71 USD/t) as a result of the better yield in the Marabel trial.
In Kenya, the distribution of different operating cost components between the different varieties
and years is more heterogenous on a per ton basis: Most strikingly, costs for hired labor on a per
ton basis for Shangi for KE1OL decreased by 12 USD per t under PIA, even though the number of
sprayings increased by six. It is remarkable that when hired labor is concerned, KE5NY had nearly
the same cost for Shangi (25 USD/t) and Jelly (26 USD/t) in 2015; thus, the operating costs per
ton were lower for KE5NY than for KE1OL in 2015. The lowest operating cost of all was KE5NY in
the year without intervention (2014) at 19 USD per t, followed by the baseline typical farm at
27 USD per t.
Figure 10: Operating costs in USD per t (Source: agri benchmark 2015)
31
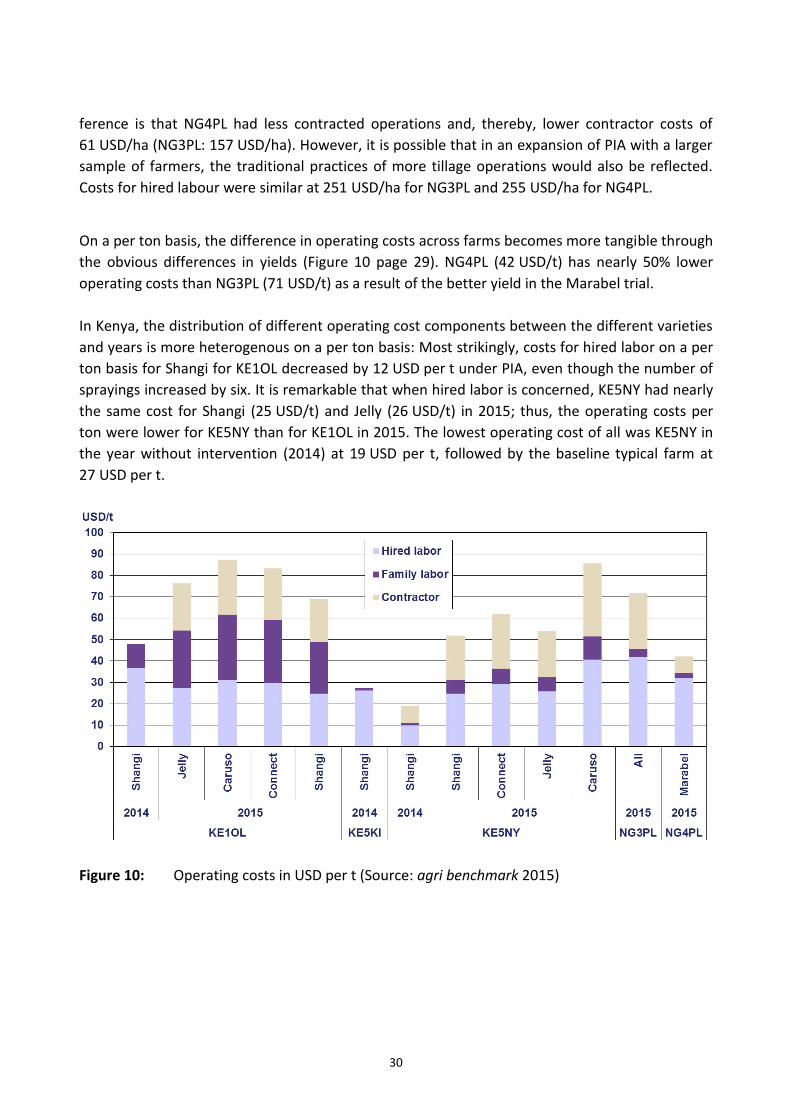
4.4 Gross Revenue and Profitability
Looking at the overall profitability per ha of potato production in this study (Figure 11 page 31), it
is apparent that not all varieties were profitable under the applied farming scheme. The Jelly va-
riety especially did not generate profit in either farming scenario. Chapter 0 4.6 Case study: Ken-
ya with adjusted price for Jelly ill e plore hether Jell ould e profita le at a other arket price in consideration of the discussion with stakeholders regarding the higher prices brought by
Jelly by the same processor who acted as an off-taker for PIA. Meanwhile, this chapter will dis-
cuss overall profitability under the actual trial conditions.
Another significant reservation regarding the cost side of the calculation is as follows: Currently,
the analyzed data is based on the fact that growers bought certified seed. In the long run, how-
ever, it is rather unlikely that growers will purchase certified seeds for the entire acreage every
year. Rather, they would use at least some farm-saved seedlings; hence, planting costs would
decrease significantly. However, since neither the cornerstones of future cropping strategies in-
cluding the use of farm-saved seedlings, nor respective yields and revenues (one would have to
assume that using farm-saved seedlings will result in a yield loss) are known, it is only currently
possible to consider the available data on seed cost.
Figure 11: Total Cost and Gross Revenue per ha (Source: agri benchmark 2015)
As shown in Figure 11 (above), the newly introduced variety in Nigeria performed much better
than the local variety as the space between gross revenue (red dot) and the cost bar (cast cost,
depreciation and opportunity cost) is larger than in NG3PL. The generated profit was
1,844 USD/ha for NG3PL and 4,516 USD/ha in NG4PL. Two major reasons for the success of the
Nigerian PIA farmers was the higher yield generated by the Marabel variety and the better farm
gate price farmers obtained through market linkage with a large retailer. This can be considered a

32
major achievement of the PIA intervention in Nigeria. Even if the PIA farmers had included more
intensive tillage operations as their counterparts in NG3PL, their result would still be
2,576 USD/ha higher.
In Kenya, however, the profitability analysis for the new varieties is less convincing: In KE1OL
none of the newly introduced varieties were able to successfully cover the cash costs. With the
production system applied under PIA for KE1OL, planting Caruso led to a loss of -1,011 USD/ha,
followed by Connect at -1,380 USD/ha and Jelly at -3,632 USD/ha. Shangi, however, yielded a gain
of 1,737 USD/ha under similar trial conditions. Furthermore, planting Shangi under the PIA inter-
vention was much more profitable than without intervention in the previous year (690 USD/ha).
Therefore, it can be said that the production system applied by PIA for KE1OL in 2015 was an
economic improvement for the farmer for the local variety, but not for the new varieties. Again,
one would need to look more carefully at the results in future scenarios, taking into account the
use of farm-saved seed.
Furthermore, it is possible that a reduction of the seed density for Caruso and Connect, and a
better price for Jelly could make those varieties profitable in the same production system. As-
suming that the traditional seeding rate of 1,730 kg for Shangi (see KE1OL, KE5KI and KE5NY in
2014) was applied for the new varieties, it is expected that seed costs would significantly de-
crease, ultimately resulting in lower total costs. The effect of reducing seed density could not be
quantified in this study, though. One would assume that at a seeding rate of approximately
2 t/ha, the tubers would have more space to develop and, thus, yields would increase. A new
field trial is necessary, however, to prove this hypothesis.
The typical farm, KE5KI, generated the lowest positive profit at 226 USD/ha. Both farmers partici-
pating in PIA had higher profits in the baseline year. Since the typical farm was established with
focus group discussions in two rural communities that grow potato, it represents a large share of
the smallholders in northern Nyandarua county. Thus, the yield differences in the baseline year
suggests that both individual PIA farmers were already performing above average prior to PIA
intervention.
For the typical farm, KE5NY, and the corresponding production system, Shangi outperformed all
other varieties with a profit generation of 3,165 USD/ha, which was 411 USD/ha more than in
2014 without PIA (2,753 USD/ha). Here, by growing Caruso (gross revenue 3,417 USD/ha) and
Connect (gross revenue 3,385 USD/ha), it was possible to cover cash cost but not total cost,
which led to an economic loss of -27 USD/ha and -127 USD/ha, respectively. Yet it is important to
note, that in this production system Connect and Caruso successfully covered cash cost.
Overall, Figure 11 (page 31) reflects that the opportunity costs (own land and family labor) are
rather low for all farm, which means that potato farming can be considered a cash business for
those farms. For Kenya, discussions with NPCK yielded that farmers likely use a ratio of 40% fami-
ly labor and 60% hired labor, which would reduce cash costs slightly and increase opportunity

33
costs. However, the question remains as to why Nigerian farmers do not rely more on family la-
bor, especially since opportunities on the labor market are scarce in the rural areas.
When looking at the profitability on a per ton basis, the potential of Connect and Caruso be-
comes more apparent: For KE5NY, Connect was only 4 USD/t from breaking even and Caruso was
closer yet at less than 2 USD/t (Figure 12 page 33). Results indicate that per ha and per t, Shangi
was the best option for the Kenyan farmers. The demo farms had the best results for the certified
Shangi variety and the highest profits in Kenya were realized with Shangi. In order to facilitate
adoption of the new varieties by Kenyan farmers, it is imperative that they are competitive with
Shangi. In the PIA scenarios, the farm gate price would have to be higher for at least a portion of
the harvest. For example, if Caruso still had the same price (0.2 USD/kg or 20 KES/kg) in glut sea-
son, but farmers were able to store a third of the harvest for sale during scarcity season and real-
ize 0.25 USD/kg (25 KES/kg), the smaller KE1OL farm (in 2015) would still lose 841 USD/ha, but
KE5NY would have made a profit of 174 USD per ha. This underlines the importance of adequate
storage capabilities at the farm level, as well as proper pricing for new varieties. Another example
regarding pricing consult can be seen on page 37 in the section, 4.6Case study: Kenya with ad-
justed price for Jelly .
Figure 12: Total cost and gross revenue per t (Source: agri benchmark 2015)
Though it is hardly visible in Figure 12 (above), the gross revenue and profitability for the Shangi
variety varied between the Kenyan farms: In the baseline year, KE5NY had a much higher gross
revenue at 213 USD/t than KE1OL (168 USD/t) and KE5KI (112 USD/t), as it had lower operating
costs per ha, along with a higher yield. Thereby, KE5NY also made the largest profit per t in the
baseline year with 144 USD/t, while the typical farm generated only 16 USD/t. Although the prof-

34
it per ton of the Shangi variety decreased for KE5NY through PIA to 115 USD/t, the overall profit-
ability increased due to the increase in tonnage. At the same time, KE1OL benefited from PIA by
an increase in profitability of 31 USD/t.
4.5 Case Study: Importance of Market Linkage in Nigeria
Farmers in Plateau State face fluctuating prices, along with ever other market in the world; dur-
ing the harvesting season, prices are lower than during the scarcity season. The lack of adequate
on-site storage facilities increases far s vulnerability to middlemen who collect the produce at
the farm gate, since they do not have the option of storing the produce and waiting for a better
price. Moreover, far ers financial liquidity is limited resulting in the necessary marketing of their
potato as quickly as possible, which is another constraint that hinders their negotiating power
with the middlemen.
To underline the importance of PIA market linkage for farmers producing Marabel (NG4PL) which
led to a price increase of 0.35 USD/kg (70 NGN/kg), calculations were run to simulate a price in-
crease for the NG3PL farmers to the same price of 1 USD/kg (200 NGN/kg); see 4.5Case Study:
Importance of Market Linkage in Nigeria page 34).
Figure 15: Total cost and gross revenue for Nigerian farmers with different prices
(Source: agri benchmark 2015)
Furthermore, the results in Figure 15 (above) show what would have been had NG4PK potatoes
received the same price as NG3PL potatoes at 0.65 USD/kg (130 NGN/kg) under the presumption
that Ali potatoes have the same marketable qualities (graded, homogeneous) as Marabel.
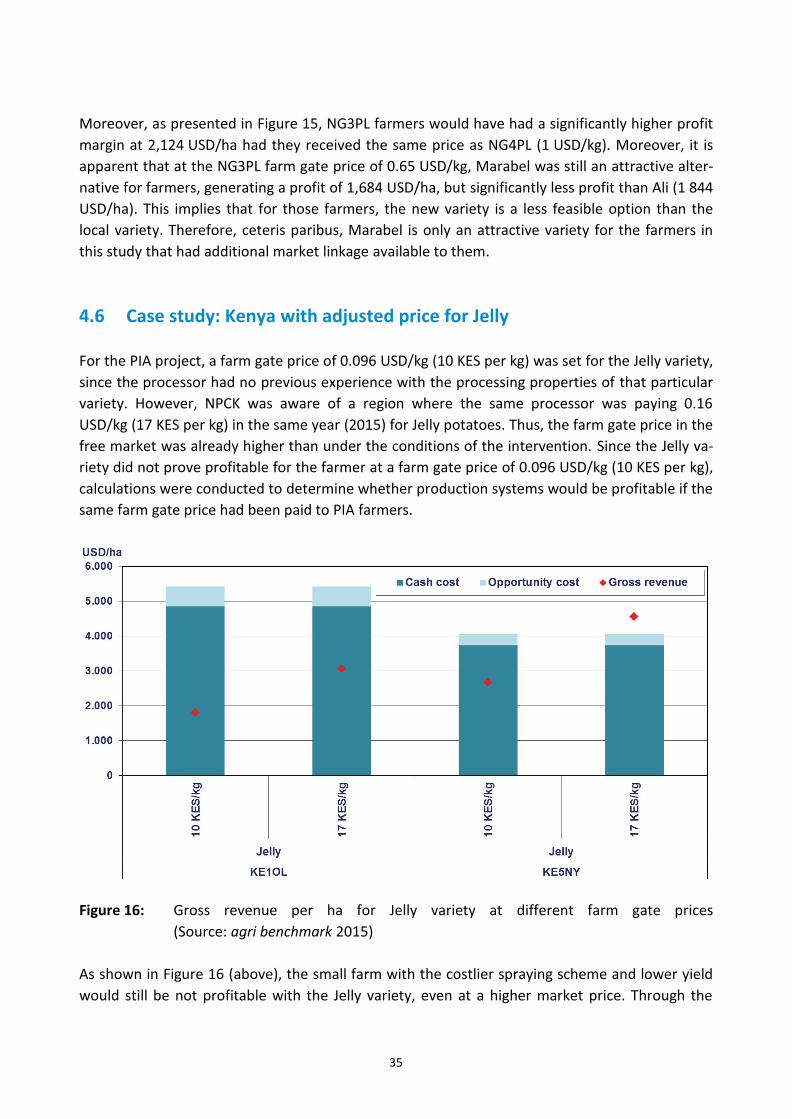
35
Moreover, as presented in Figure 15, NG3PL farmers would have had a significantly higher profit
margin at 2,124 USD/ha had they received the same price as NG4PL (1 USD/kg). Moreover, it is
apparent that at the NG3PL farm gate price of 0.65 USD/kg, Marabel was still an attractive alter-
native for farmers, generating a profit of 1,684 USD/ha, but significantly less profit than Ali (1 844
USD/ha). This implies that for those farmers, the new variety is a less feasible option than the
local variety. Therefore, ceteris paribus, Marabel is only an attractive variety for the farmers in
this study that had additional market linkage available to them.
4.6 Case study: Kenya with adjusted price for Jelly
For the PIA project, a farm gate price of 0.096 USD/kg (10 KES per kg) was set for the Jelly variety,
since the processor had no previous experience with the processing properties of that particular
variety. However, NPCK was aware of a region where the same processor was paying 0.16
USD/kg (17 KES per kg) in the same year (2015) for Jelly potatoes. Thus, the farm gate price in the
free market was already higher than under the conditions of the intervention. Since the Jelly va-
riety did not prove profitable for the farmer at a farm gate price of 0.096 USD/kg (10 KES per kg),
calculations were conducted to determine whether production systems would be profitable if the
same farm gate price had been paid to PIA farmers.
Figure 16: Gross revenue per ha for Jelly variety at different farm gate prices
(Source: agri benchmark 2015)
As shown in Figure 16 (above), the small farm with the costlier spraying scheme and lower yield
would still be not profitable with the Jelly variety, even at a higher market price. Through the

36
intervention, measures taken for KE5NY Jelly production would be profitable provided 17 KES/kg
were paid at the farm gate. At 492 USD/ha, the profit for the farmer would still be lower than for
Shangi (3,165 USD/ha), yet higher than the profits generated by KE5KI in the baseline year
(226 USD/ha).
Given the good storage properties of Jelly, it remains an interesting variety for farmers and pro-
cessors with storage capacity because seasonal price highs and lows can be utilized when they
are able to store the produce. Additionally, processors and seed providers alike claimed the ex-
cellent processing properties of Jelly for being processed into potato chips. In conclusion, it is
likely that the slightly higher farm gate price of 0.16 USD/kg for Jelly is realistic. The variety there-
fore remains a profitable alternative for farmers in the event that the KE5NY production system
under the intervention is duplicated, provided that storage facilities are either available or can be
built at minimal costs.

37
5 Conclusions/Outlook
Overall, the economic results obtained through the PIA demo plots have been a success. In Ken-
ya, the profitability of local varieties has been improved and the project has numeric proof that
intensification measures paid off at the farm level when cultivating the Shangi variety. Given the
good yields and the commercial interest of processors in the Jelly variety, it is also a good option
for farmers, especially when the prolonged storage time is taken into consideration. However,
the market price must be compared to the price for Shangi and a competitive stage must be set
to convince farmers that purchasing the relatively more expensive seeds is a good investment.
Looking at the overall profitability of the farms, the measures established for KE5NY yielded bet-
ter results than KE1OL. At the current price and yield levels, Caruso and Connect still need to be
improved and undergo more farm trials before they can be recommended for farmers.
For the Kenyan, farmers PIA increased the profitability of the local variety; despite the increased
operating and direct costs that are acquired under PIA for more inputs and machinery, the farm-
ers generated higher profits (gross revenue – all costs) per ha than in the baseline year (2014) for
the typical farm. For the new PIA introduced varieties in Kenya, the results were mixed. However,
pricing may play a role here as both varieties were previously unknown to processers and the
market, and prices were fixed within the project based on processors willingness to pay. There-
fore, it can be assumed that in proper market conditions and with the knowledge gained from
processing trials of all varieties, prices would increase, leading to increased profitability for the
farmer. In Nigeria, both farms performed well; however, the farm that received the intervention
had a better overall profitability. The Marabel variety in this study is competitive with the local
variety if farmers receive a farm gate price of 200 NGN/kg. The market linkage introduced by PIA
helped the farmers to realize higher profits.
Bearing in mind that
a) the results from the PIA intervention only reflect one production year, which may or may not
be reproducible,
b) performance of varieties and production systems under the PIA intervention may increase as
growers become more experienced, and
c) future use of farm-saved seedlings and its impact on profits still needs to be analyzed,
the following recommendations are made.
Recommendations
(1) Conduct trials at sites 100% under control of potato experts in order to illustrate the full
yield potential of improved varieties.
(2) Continue monitoring yields and the economic situation of potato production in order to
determine whether the one year results are stable or can be further improved.

38
(3) Expand the coverage of typical farms in the project regions in order to further validate the
preliminary findings presented in this report.
(4) Improve the understanding as to why growers frequently use hired labor. This question is
crucial because (a) it makes the production systems economically more vulnerable since the
cost needs to be financed and paid in regardless of outcome, and (b) the limited use of fam-
ily labor raises the question of whether family members actually have higher opportunity
costs.
(5) Initiate trials with farm-saved seed in order to understand the long-term profitability of
their use.
In general, it appeared that storability of potatoes and adequate storage facilities as well as ac-
cess to credit for purchase of inputs are limitations that significantly influence farmers marketing
choices in both countries that might be of interest in future interventions regarding improvement
of livelihoods.
Regarding the individual countries included in this report, the following conclusions can be made:
Nigeria
(1) Extend rotation on potato plots and ideally change the plot every year to reduce problems
stemming from soil born pests and diseases.
(2) Utilize focus groups containing retailers and middlemen to determine under which condi-
tions the pricing of Marabel, as in the intervention, can be permanent.
(3) Explore whether or not increased use of fungicides – similar to the strategies pursued in
Kenya – would allow for an increase in yields.
(4) Improve fertilizer that is available at farm level. A valid contribution by the GIZ could be
connecting German fertilizer companies to the market and its potential users.
(5) Accessibility of credit for inputs or other pre-financing schemes could help farmers afford
blight pesticides and reduce the cash needed at harvest. If farmers can pay their post-
harvest, they are able to wait for better prices.
(6) It is recommended to improve the agronomic knowledge of farmers, specifically with re-
gard to blight control measures.

39
Kenya
(1) Reevaluate the raised issues regarding the prices paid for the new varieties, as well as pro-
essors willingness to pay.
(2) Monitor market prices of farm-saved seed for Shangi and the new varieties, along with gain
an understanding of the distribution channels and bottlenecks.
(3) Improve availability of certified Shangi seedlings in rural areas.
(4) Storage facilities and assistance in building adequate storage can reduce vulnerability to
middlemen.


