64
OECD Economic Surveys Economic Assessment Bulgaria January 2021 OVERVIEW http://www.oecd.org/economy/bulgaria-economic-snapshot/

OECD Economic Surveys
Economic Assessment
Bulgaria
January 2021
OVERVIEW
http://www.oecd.org/economy/bulgaria-economic-snapshot/

Bulgaria
This document, as well as any data and any map included herein, are without prejudice to the
status of or sovereignty over any territory, to the delimitation of international frontiers and
boundaries and to the name of any territory, city or area.
The statistical data for Israel is supplied by and under the responsibility of the relevant Israeli
authorities. The use of such data by the OECD is without prejudice to the status of the Golan
Heights, East Jerusalem and Israeli settlements in the West Bank under the terms of international
law.
OECD Economic Surveys: Bulgaria© OECD 2021
You can copy, download or print OECD content for your own use, and you can include excerpts
from OECD publications, databases and multimedia products in your own documents,
presentations, blogs, websites and teaching materials, provided that suitable acknowledgement
of OECD as source and copyright owner is given. All requests for public or commercial use and
translation rights should be submitted to [email protected]. Requests for permission to photocopy
portions of this material for public or commercial use shall be addressed directly to the Copyright
Clearance Center (CCC) at [email protected] or the Centre français d’exploitation du droit de
copie (CFC) at [email protected] of or sovereignty over any territory, to the
delimitation of international frontiers and boundaries and to the name of any territory, city or
area.

3
OECD ECONOMIC SURVEYS: BULGARIA 2021 © OECD 2021
Table of contents
Executive summary 7
1 Key Policy Insights 15
The COVID-19 crisis has hit the economy 16
The economy requires continued macroeconomic policy support 19
Considerable uncertainty surrounds the recovery 23
Fiscal space permits a large pandemic response 24
Ensuring access to health care is a priority during the pandemic 25 A wage subsidy scheme has prevented a large rise in unemployment 26 Long-term public finances are sound but subject to uncertainties from ageing 29
The currency board is a cornerstone for macroeconomic stability 32
The financial sector has been fortified, but non-performing loans remain high 34
Strengthening the recovery 37
Making the most of the export sector 37 Public investment should be increased 39 Removing barriers to competition 40 Decarbonising the economy 43 Ageing demographics will influence future growth 45
Ensuring equal opportunities for all 47
Improving labour market policies for higher participation and better jobs 49 Making the tax and benefit system work for all 52
Promoting public integrity and succeeding in the fight against corruption 57
References 61
Tables
Table 1. The recovery will be gradual 8 Table 1.1. Macroeconomic indicators and projections 23 Table 1.2. Low probability vulnerabilities 24 Table 1.3. Illustrative GDP impact of recommended reforms 42 Table 1.4. Illustrative fiscal impact of post-recovery recommended reforms 42 Table 1.5. Tax allowances in flat tax countries 54 Table 1.6. Spending on social protection benefits is low 55 Table 1.7. Recommendations on macroeconomic and selected structural policies 60
Figures
Figure 1. GDP growth abruptly interrupted 8 Figure 2. Convergence had increased 9 Figure 3. PISA education scores are low 9 Figure 4. Relative poverty is high 10 Figure 5. Depopulation and urbanisation 10 Figure 1.1. Income convergence had increased from 2014 16

4
OECD ECONOMIC SURVEYS: BULGARIA 2021 © OECD 2021
Figure 1.2. The economy was doing well before the COVID-19 pandemic 21 Figure 1.3. After a low initial outbreak, COVID-19 infections began to increase in October 2020 22 Figure 1.4. Sound public finances leave room for fiscal stimulus 25 Figure 1.5. Access to general practitioners is unequal across regions 26 Figure 1.6. Employment situation of the young most negatively affected 27 Figure 1.7. The informal economy amounts to almost one-third of (official) GDP 28 Figure 1.8. Ageing-related spending pressures could push up public debt 29 Figure 1.9. Revenues are low and rely on indirect taxation 31 Figure 1.10. Inflation was stabilising prior to the COVID-19 shock 32 Figure 1.11. Current account surpluses have been driven by a reduction in the trade deficit 33 Figure 1.12. Net international investment has fallen substantially 33 Figure 1.13. Credit growth had picked up 34 Figure 1.14. Financial sector health had improved 35 Figure 1.15. Household indebtedness is low, while non-financial corporation debt had been falling 36 Figure 1.16. Exports by destination and commodity 38 Figure 1.17. Integration in global value chains is high 38 Figure 1.18. Foreign direct investment is close to the CEEC average 39 Figure 1.19. Public investment has fallen below CEEC peers 40 Figure 1.20. Barriers to competition are high 41 Figure 1.21. Energy intensity and reliance on coal remain high 44 Figure 1.22. The working-age population is shrinking and ageing quickly 46 Figure 1.23. Higher educated people work more and longer 46 Figure 1.24. A large proportion of Bulgarian nationals are living abroad 47 Figure 1.25. Income inequality and poverty are high 48 Figure 1.26. Income inequality has risen fast because growth mainly benefitted top incomes 48 Figure 1.27. Poverty has remained at a high level, notably among children and elderly 49 Figure 1.28. Labour market participation is low for youth and Roma 50 Figure 1.29. Use of active labour market policies is low 51 Figure 1.30. No basic tax allowance results in tax rates for low incomes close to the OECD average 53 Figure 1.31. Taxes and transfers do little to reduce high market income inequality 54 Figure 1.32. Minimum-income benefits are low 56 Figure 1.33. Corruption is perceived as high 58
Boxes Box 1.1. Fiscal policy responses to the COVID-19 pandemic 18 Box 1.2. From the currency board to adopting the euro 20 Box 1.3. The informal economy is sizeable 28 Box 1.4. Composition of government revenues 31 Box 1.5. Quantifying the impact of selected policy recommendations 42

5
OECD ECONOMIC SURVEYS: BULGARIA 2021 © OECD 2021
This Economic Assessment is published under the responsibility of the
Secretary-General of the OECD. The economic situation and policies of
Bulgaria were reviewed by the Economic and Development Review
Committee on 23 November 2020, with participation of representatives of
the Bulgarian authorities. The draft report was then revised in the light of
the discussions.
The Secretariat’s draft report was prepared for the Committee by Emily
Sinnott and Mikkel Hermansen under the supervision of Patrick Lenain.
Isabelle Luong provided statistical assistance and Stephanie Henry
provided editorial support. The Economic Assessment benefitted from
contributions by Emilie Cazenave, Carissa Munro and Giulio Nessi of the
OECD Public Governance Directorate and by consultant Natia Mosiashvili.
Other valuable inputs and comments were received from OECD’s Centre
for Entrepreneurship, SMEs, Regions and Cities; the Centre for Tax Policy
and Administration; the Directorate for Employment, Labour and Social
Affairs; the Directorate for Education and Skills; and the Directorate for
Financial and Enterprise Affairs.
The previous Economic Assessment of Bulgaria was issued in April 1999.
Information about other Surveys and more information about how Surveys
are prepared is available at http://www.oecd.org/eco/surveys.

6
OECD ECONOMIC SURVEYS: BULGARIA 2021 © OECD 2021
Basic statistics of Bulgaria, 2019*
(Numbers in parentheses refer to the OECD average)**
LAND, PEOPLE AND ELECTORAL CYCLE
Population (million) 7.0 Population density per km2 (2018) 64.7 (38.0)
Under 15 (%) 14.7 (17.9) Life expectancy (years, 2018) 75.0 (80.1)
Over 65 (%) 21.3 (17.1) Men (2018) 71.5 (77.5)
International migrant stock (% of population) 2.4 (13.3) Women (2018) 78.6 (82.8)
Latest 5-year average growth (%) 0.7 (0.6) Latest general election March 2017
ECONOMY
Gross domestic product (GDP)
Value added shares (%)
In current prices (billion USD) 67.9 Agriculture, forestry and fishing 3.7 (2.6)
In current prices (billion BGN) 118.7 Industry including construction 25.9 (26.8)
Latest 5-year average real growth (%) 3.5 (2.2) Services 70.4 (70.5)
Per capita (000 USD PPP) 24.6 (49.1)
GENERAL GOVERNMENT
Per cent of GDP
Expenditure 36.6 (40.6) Gross financial debt (OECD: 2018) 30.2 (107.7)
Revenue 38.6 (37.5) Net financial debt (OECD: 2018) 0.6 (68.0)
EXTERNAL ACCOUNTS
Exchange rate (BGN per USD) 1.75
Main exports (% of total merchandise exports)
PPP exchange rate (USA = 1) 0.69
Machinery and transport equipment 22.9
In per cent of GDP Manufactured goods. 20.1
Exports of goods and services 63.6 (54.2) Miscellaneous manufactured articles 13.8
Imports of goods and services 60.1 (50.6) Main imports (% of total merchandise imports) Current account balance 3.0 (0.4) Machinery and transport equipment 26.2
Net international investment position -30.6 Manufactured goods 16.7
Chemicals and related products, n.e.s. 13.9
LABOUR MARKET, SKILLS AND INNOVATION
Employment rate (aged 15 and over, %) 54.2 (57.6) Unemployment rate, Labour Force Survey (aged 15 and over, %) 4.2 (5.4)
Men 60.5 (65.6) Youth (aged 15-24, %) 8.9 (11.7)
Women 48.3 (50.0) Long-term unemployed (1 year and over, %) 2.4 (1.4)
Participation rate (aged 15 and over, %) 56.6 (61.1) Tertiary educational attainment (aged 25-64, %, 2017, OECD: 2019)*** 24.7 (38.0)
Average hours worked per year 1 645 (1 659) Gross domestic expenditure on R&D (% of GDP, 2018) 0.8 (2.6)
ENVIRONMENT
Total primary energy supply per capita (toe, 2018, OECD: 2019) 2.6 (4.1) CO2 emissions from fuel combustion per capita (tonnes, 2018, OECD: 2019) 5.7 (8.3)
Renewables (%, 2018, OECD: 2019) 13.1 (10.8) Renewable internal freshwater resources per capita (1 000 m³, 2014) 2.9
Exposure to air pollution (more than 10 μg/m³ of PM 2.5, % of population, 2017) 99.8 (58.7)
SOCIETY
Income inequality (Gini coefficient, 2018, OECD: latest) 0.408 (0.316) Education outcomes (PISA score, 2018)
Relative poverty rate (%, 2018, OECD: latest) 16.7 (11.7) Reading 420 (487)
Median disposable household income (000 USD PPP, 2018, OECD: latest) 12.4 (25.4) Mathematics 436 (489)
Public and private spending (% of GDP) Science 424 (489)
Health care (2017) 8.1 (8.8) Share of women in parliament (%) 25.8 (30.7)
Education (% of GNI, 2018) 3.9 (4.5) Net official development assistance (% of GNI, 2017) 0.1 (0.4)
* The year is indicated in parenthesis if it deviates from the year in the main title of this table. ** Where the OECD aggregate is not provided in the source database, a simple OECD average of latest available data is calculated where data exist for at least 80% of member countries. *** For Bulgaria, data refer to aged 25 and over. Source: Calculations based on data extracted from databases of the following organisations: OECD, International Energy Agency, International Labour Organisation, International Monetary Fund, United Nations and World Bank.

7
OECD ECONOMIC SURVEYS: BULGARIA 2021 © OECD 2021
Executive summary

8
OECD ECONOMIC SURVEYS: BULGARIA 2021 © OECD 2021
The COVID-19 pandemic has
interrupted an impressive progress
An open economy with a large manufacturing
sector integrated in global value chains,
Bulgaria has made strong income gains in the
past two decades. A sound macroeconomic
framework and deepening integration with the
European Union have allowed progress towards
euro area entry. Prior to the pandemic,
unemployment had reached historical lows, and
wages had grown substantially. Impressive
structural reforms were made to boost productivity,
increase income convergence and address social
challenges. The COVID-19 pandemic has
interrupted this progress, with an output fall not
seen since the 1996-97 banking crisis (Figure 1).
Figure 1. GDP growth abruptly interrupted
Source: OECD, Economic Outlook 108 database.
StatLink 2 https://stat.link/lyg6hk
Economic activity contracted sharply when
confinement measures were first introduced to
contain the pandemic. Travel, accommodation
and food services suffered a large contraction.
Manufacturing is mostly export-oriented and was
hit by initial large volume and price declines. The
scarring effects of the COVID-19 shock could be
long lived. This makes it essential to press on with
reforms facilitating the reallocation of factors of
production, which is typical after large shocks.
Employment fell, eroding recent gains. Men and
youth were affected the most by job losses. While
the government’s wage subsidy scheme protected
a high share of jobs, the recovery of employment
will require more active labour market policies. The
workforce is ageing and the economy can little
afford large-scale withdrawals from labour market
participation.
A recovery is underway, but uncertainty is high.
The re-opening of businesses and relaxation of
containment measures over May-June was
accompanied by a recovery of activity that gained
momentum in July. Business and consumer
confidence began to increase. Industrial production
has started to recover though it remains below
February 2020 levels. However, service and retail
sector activity has been held back by consumer
income losses, the rise in precautionary savings
and continued restrictions on some activity. A
continued high COVID-19 caseload could constrain
the normalisation of domestic demand.
A sluggish recovery in the global economy is a
downside risk. A highly open economy that is
dependent on exports, particularly related to the
processing and assembly of foreign inputs into
manufacturing export goods, Bulgaria’s recovery is
vulnerable to further shocks to external demand.
Table 1. The recovery will be gradual
2019 2020 2021 2022
Gross domestic product 3.7 -4.1 3.3 3.7
Private consumption 5.5 -0.7 2.7 3.1
Gross fixed capital formation 4.5 -8.4 5.8 4.4
Exports 3.9 -10.7 6.0 5.7
Imports 5.2 -9.9 6.1 5.3
Unemployment rate 4.2 6.4 6.1 5.1
Consumer price index 3.1 1.6 1.4 1.8
Current account (% of GDP) 3.0 3.1 2.9 3.1
Fiscal balance (% of GDP) 1.9 -4.4 -4.5 -2.6
Note: CPI data are period averages.
Source: OECD, Economic Outlook 108 database.
The government has put in place a fiscal
stimulus estimated at 3% of GDP. This has
reduced job losses, increased the resources for
health care and eased financial pressures for the
most impacted firms and households. Prudent
budget execution prior to the pandemic has
provided Bulgaria with ample fiscal space to
respond to the crisis. In 2019, a budget surplus was
recorded and public debt was lower than in most
OECD economies. Fiscal support measures should
not be withdrawn prematurely. Increasing
investment related to transport infrastructure,
energy efficiency, the digital economy and
innovation could make for a more robust economic
recovery, and are likely to receive substantial
resources from the European Union Recovery and
Resilience Facility.
-20
-15
-10
-5
0
5
10
15
1996 2000 2004 2008 2012 2016 2020
%Real GDP growth
Year-on-year percentage change

9
OECD ECONOMIC SURVEYS: BULGARIA 2021 © OECD 2021
Bulgaria is in a strong position to benefit from
joining the euro area. Bulgaria joined the
European Exchange Rate Mechanism II in July
2020 and the European Central Bank and the
Bulgarian National Bank have established
cooperation over banking supervision. For over
twenty years, it has maintained a currency board
with a fixed exchange rate to the euro. Supervision
of the financial sector has improved and the sector
is well capitalised. Given that the long-term interest
rate differential with the euro has fallen to zero, it
seems unlikely that euro entry will attract large
inflows of speculative funds. The challenge is that
wages, which are currently much lower than
elsewhere, will rise as Bulgaria converges towards
the euro area. To ensure competitiveness and
avoid macroeconomic imbalances, labour
productivity will have to keep up with real wage
pressures.
The business environment needs
improving
Boosting income convergence will require
ambitious reforms. Several years of robust
economic growth has lifted income per capita
above half of the OECD average (Figure 2), but
productivity had trailed that of faster-converging
Central and Eastern European peers. Recovery
plans from the pandemic should focus on
modernizing the business environment.
Figure 2. Convergence had increased
Note: CEEC is the average of the Czech Republic, Estonia, Hungary,
Latvia, Lithuania, Poland, Romania, the Slovak Republic and
Slovenia.
Source: World Bank, World Development Indicators database.
StatLink 2 https://stat.link/xway02
Barriers to competition are high. Reducing
regulatory barriers and improving competition
policy would stimulate business dynamism and
support a more efficient allocation of resources in
the economy. Public policies should make sure to
level the playing field among different stakeholders,
particularly by building on significant action to
modernise and improve public procurement in
recent years.
Insolvency reform has become all the more
pressing. The government has identified gaps in
the insolvency framework and has set up a
roadmap for reforms. A more rapid and effective
bankruptcy framework would help non-viable firms
in financial difficulties to shut down and avoid
zombie firms from holding back resources and
impairing banking system credit. Easing access to
firm rehabilitation and debt forgiveness
proceedings would allow more businesses that
face solvency problems to exercise the option of
restructuring their financial obligations with
creditors outside of a full formal insolvency
process. Like in other countries, measures should
be put in place to help firms in financial difficulties
due to the pandemic, including out-of-court
settlements with creditors.
Skills need to be improved. The effectiveness
and provision of education and training throughout
the lifecycle should be increased. Poor PISA
scores (Figure 3), high dropout rates in secondary
education, and the large proportion of NEETs
(young people neither in employment nor in
education or training) are worrying indicators for a
country facing ever-shrinking younger cohorts.
Figure 3. PISA education scores are low
Source: OECD (2019), PISA 2018 Results (Volume I): What Students
Know and Can Do.
StatLink https://stat.link/h45xzf
0
15
30
45
60
75
90
1995 2000 2005 2010 2015
%Bulgaria's income per capita
As a share of OECD and CEEC countries
OECD
CEEC
350
375
400
425
450
475
500
525
BGR ROU SVK LVA OECD POL EST
2018 PISA mean scores
Reading
Mathematics
Science

10
OECD ECONOMIC SURVEYS: BULGARIA 2021 © OECD 2021
The economy is carbon- and energy-intensive.
Coal continues to account for almost half of energy
production, though the share of renewables has
increased above the OECD average. The potential
to improve energy efficiency is large. The COVID-
19 recovery presents an opportunity to decarbonise
the economy, especially the energy mix and
housing stock, which could benefit from abundant
EU green funds.
Efforts made to fight corruption and organised
crime should continue. Important steps have
been taken to reform the judiciary, but more is
needed to strengthen accountability and safeguard
judicial independence, and to establish a coherent
public integrity system.
Reducing poverty and raising regional
development require more reforms
The booming economy translated into robust
household disposable income growth.
However, income inequality exceeds almost all
OECD countries. Regions with large cities are
driving growth in Bulgaria, while many rural regions
suffer from depopulation and rapid ageing.
Poverty remains elevated, particularly among
ethnic minorities, the elderly and children, and
in rural areas. Cash transfers to protect the most
vulnerable from income shocks are low and
restricted. The combined average income tax and
social contribution rate for lower-wage workers is
comparatively high and does little to reduce income
inequality.
Figure 4. Relative poverty is high
Source: OECD, Income Distribution database.
StatLink 2 https://stat.link/6po4tl
Investments in infrastructure and housing
reform would help to boost mobility and
strengthen linkages to national and
international supply chains. Regional income
differences in Bulgaria are larger than in most
OECD countries and growth has been lower in
regions without larger cities. Increasing the long-
term value-added of tourism and agricultural
activities can assist in local economic development.
Improving living standards for all regions will
require better coverage and access to public
services, notably in health and long-term care.
Figure 5. Depopulation and urbanisation
Note: A large city has at least 250 000 inhabitants.
Source: Bulgarian National Statistical Institute.
StatLink https://stat.link/2540ik
The Roma, making up one-tenth of Bulgarians,
live in socially excluded neighbourhoods.
Improving their economic integration is important
as the Roma are an increasing share of the
working-age population. Most Roma lack proper
housing and almost 25% of houses in segregated
Roma neighbourhoods remain illegal. Roma face
difficulties also in accessing healthcare services
and social benefits, and are likely to have weaker
education outcomes, often dropping out before
finishing school. This is a particular concern among
young Roma women.
Health care needs to be strengthened. Hospital
capacity is high, but primary care is
underdeveloped due to significant gaps in health
insurance coverage and large out-of-pocket
payments. To address the pandemic, the
government made treatment of COVID-19
available to all. Yet, access to health care is
restricted in many regions, due to low numbers of
general practitioners, which results in frequent
hospital visits.
0
5
10
15
20
25
30
Total population Elderly (65+)
%Population below 50% of median household
disposable income, 2018 or latest
BGR CEEC OECD
80
85
90
95
100
105
2002 2004 2006 2008 2010 2012 2014 2016 2018
Population by type of regionIndex 2002 = 100
Total
Regions with a large city
Other regions

11
OECD ECONOMIC SURVEYS: BULGARIA 2021 © OECD 2021
Residential mobility is very low in comparison
with OECD countries. While Bulgaria has a high
number of dwellings per capita, overcrowding is
common and a large share of young adults live with
their parents. High homeownership and low
affordability are the main obstacles to residential
mobility and resolving housing market imbalances.
Housing allowances and social housing are
underdeveloped. The targeted heating allowance
increased substantially in 2019, but is the only
support programme of significant size and distorts
incentives for energy renovation.

12
OECD ECONOMIC SURVEYS: BULGARIA 2021 © OECD 2021
MAIN FINDINGS KEY RECOMMENDATIONS
Fiscal and financial policy to mitigating the impact of COVID-19
Bulgaria entered the pandemic in a strong fiscal position and has put in place a fiscal support package during the pandemic.
Extend duration of fiscal support measures to families and firms, and expand them in case of a resurgence of the pandemic.
Ensure an effective and rapid use of the available European Union funding to support the recovery.
Once the recovery is well underway, move back towards a balanced budget by increasing revenues and improving spending efficiency, and longer term continue ensuring fiscal sustainability.
The 60:40 wage subsidy scheme has protected jobs and household
incomes from the impact of the COVID-19 shock.
Establish additional benefit and employment programmes to protect those
not covered by the social safety net and help people move to new jobs.
Non-performing loans have been reduced, but remain well above OECD average levels. Deteriorating economic prospects are
expected to adversely affect asset quality in view of the potential worsening of the financial situation of firms and households as a result
of COVID-19 pandemic.
Deepen liquidity support to firms and households through the financial
sector, if warranted.
Improving the business environment and governance for a stronger post-COVID-19 recovery
Competition in product markets is low, with regulatory barriers to
competition that are higher than in nearly all OECD countries.
Put in place the implementing arrangements for the 2019 Law on Public Enterprises for the relevant public agencies, including municipal bodies.
Increase the Competition Authority’s detection and enforcement of sanctions on cartels and firms abusing monopoly/market dominant
positions.
Increasing the availability of skilled workers is a key priority for enterprises. Basic education is not providing a firm foundation for skills
The VET system could better respond to labour demand.
Provide universal access for four-year olds to early childhood education.
Increase secondary school teacher training for teaching special needs
students.
Deepen the role of workplace training in vocational education and training
provision.
Invest more in coverage and quality of active labour market policies.
In spite of significant governance reforms, key integrity and anti-corruption institutions are not forming a coherent public integrity
system, resulting in fragmented action and limited impact.
Provide the integrity and anti-corruption institutions with the necessary
responsibilities, coordination mechanisms and resources to fulfil their role.
Judicial reform has made substantial progress, but accountability needs further strengthening and judicial independence needs to be
safeguarded.
Implement an effective and transparent accountability mechanism for the
Prosecutor General in line with international standards.
Enhance judicial independence in relation to the probation period in
appointing judges and the composition of the Supreme Judicial Council.
Several cases of vested interests between businesses and political elites have been identified in recent years. There is no regulation of lobbying activities and international rankings suggest challenges in
ensuring media freedom.
Introduce lobbying regulation, including a code of conduct for the
engagement of lobbyists with members of Parliament.
Protect the independence of media to ensure the integrity of public decision-
making processes.
Whistle-blowing mechanisms and protections are comparatively
weak.
Implement the EU whistle-blower Directive and launch a campaign to
enhance officials and the public’s acceptance of whistle blowing.
Supporting decarbonisation of the economy
Coal accounts for almost half of energy production and is an important source of high air pollution and greenhouse gas emissions. Pricing of
the environmental costs of fossil fuels is uneven across sectors.
Gradually remove support for fossil fuels and align carbon prices for sectors outside of the EU Emissions Trading System (ETS), while protecting poorer
households.
Support reskilling and relocation of displaced workers in coal regions.
Energy efficiency is lower than in most OECD countries, notably in the
residential building sector.
Continue to support housing renovation and improve targeting to low-
income groups.
Provide information about the benefits of energy saving investments to
households.
Promoting regional development and improving inclusiveness
Transport infrastructure is underdeveloped and lacks maintenance.
The number of traffic fatalities is high.
Promote the connection of remote regions to national and international supply chains with investment in transport infrastructure and digital
connectivity.
Municipalities have limited opportunities and incentives to collaborate
on efficiency-improving service delivery.
Improve the system for inter-municipal co-operation by reducing regulatory
barriers and enhancing fiscal incentives for efficiency improvements.
The flat personal income tax of 10% with no basic tax allowance combined with social security contributions places a high tax burden on lower-income households compared to other countries.
Nonetheless, potential gains from a reform need to be weighed
against the advantages of the current tax system.
Consideration should be given to reducing the tax burden for lower-income
individuals in the medium or longer term.

13
OECD ECONOMIC SURVEYS: BULGARIA 2021 © OECD 2021
Spending on social protection benefits is comparatively low and benefits are poorly targeted to the lowest income households, reflecting high non-take up combined with limited and ineffective
means testing.
Relax entitlement criteria and increase generosity of social benefits.
Streamline and simplify multiple and complex means-tested social benefit
schemes, notably for families with children.
Up to 14% of the population, and almost half the Roma, lacks health insurance coverage, while out-of-pocket payments, mainly on
medicine, are among the highest in the European Union. Hospital capacity is high, while some regions have an acute need for more
general practitioners.
Increase effectiveness of public healthcare spending to improve coverage
and reduce out-of-pocket payments for low-income and vulnerable groups.
Gradually consolidate the hospital sector and shift focus from inpatient to
outpatient care.
Roma face a high risk of poverty and social exclusion. Coordination of Roma policies across line ministries is weak and projects are highly dependent on European Union-funding. Many Roma households live
in illegal housing and local authorities often resort to demolitions.
Enhance the governance and capacities of the National Council in coordinating policies for integration of Roma and involve all relevant
stakeholders.
Provide technical, legal and financial support to municipalities and Roma
households to resolve property rights.


15
OECD ECONOMIC SURVEYS: BULGARIA 2021 © OECD 2021
1 Key Policy Insights
The coronavirus outbreak abruptly stopped several years of robust economic
growth, which had lifted income per capita above half of the OECD average.
Although cases were fewer and containment measures less severe than in
other countries, the economy contracted strongly in the second quarter of
2020. Public finances are sound and the government took rapid action to
support firms and households. Coping with the pandemic and strengthening
the recovery will require continued fiscal support, public investment and the
advancement of priority reforms. Bulgaria also faces the challenge of how to
sustain and ultimately enhance improvements in living standards for all to
tackle rising inequality and persistently high poverty. Tackling obstacles to
business sector growth will be key to attract investment, boost productivity
and provide people with skills to take advantage of new job opportunities.
16
OECD ECONOMIC SURVEYS: BULGARIA 2021 © OECD 2021
The COVID-19 crisis has hit the economy
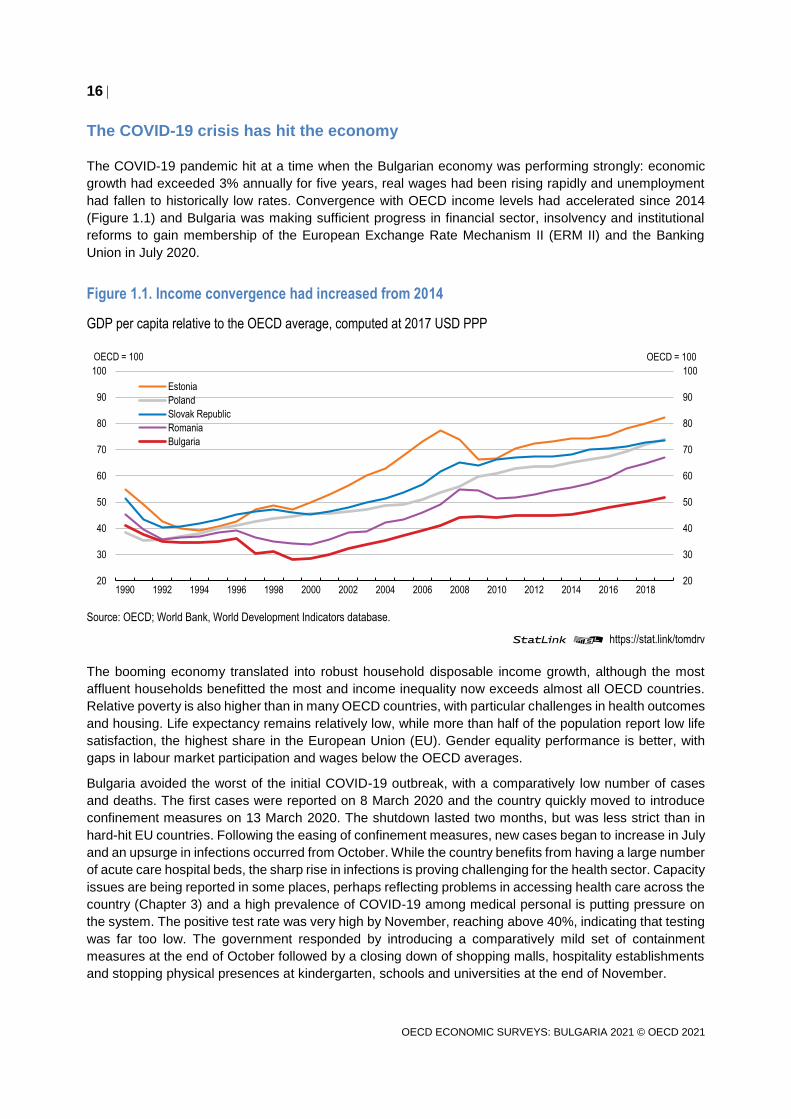
The COVID-19 pandemic hit at a time when the Bulgarian economy was performing strongly: economic
growth had exceeded 3% annually for five years, real wages had been rising rapidly and unemployment
had fallen to historically low rates. Convergence with OECD income levels had accelerated since 2014
(Figure 1.1) and Bulgaria was making sufficient progress in financial sector, insolvency and institutional
reforms to gain membership of the European Exchange Rate Mechanism II (ERM II) and the Banking
Union in July 2020.
Figure 1.1. Income convergence had increased from 2014
GDP per capita relative to the OECD average, computed at 2017 USD PPP
Source: OECD; World Bank, World Development Indicators database.
StatLink 2 https://stat.link/tomdrv
The booming economy translated into robust household disposable income growth, although the most
affluent households benefitted the most and income inequality now exceeds almost all OECD countries.
Relative poverty is also higher than in many OECD countries, with particular challenges in health outcomes
and housing. Life expectancy remains relatively low, while more than half of the population report low life
satisfaction, the highest share in the European Union (EU). Gender equality performance is better, with
gaps in labour market participation and wages below the OECD averages.
Bulgaria avoided the worst of the initial COVID-19 outbreak, with a comparatively low number of cases
and deaths. The first cases were reported on 8 March 2020 and the country quickly moved to introduce
confinement measures on 13 March 2020. The shutdown lasted two months, but was less strict than in
hard-hit EU countries. Following the easing of confinement measures, new cases began to increase in July
and an upsurge in infections occurred from October. While the country benefits from having a large number
of acute care hospital beds, the sharp rise in infections is proving challenging for the health sector. Capacity
issues are being reported in some places, perhaps reflecting problems in accessing health care across the
country (Chapter 3) and a high prevalence of COVID-19 among medical personal is putting pressure on
the system. The positive test rate was very high by November, reaching above 40%, indicating that testing
was far too low. The government responded by introducing a comparatively mild set of containment
measures at the end of October followed by a closing down of shopping malls, hospitality establishments
and stopping physical presences at kindergarten, schools and universities at the end of November.
20
30
40
50
60
70
80
90
100
20
30
40
50
60
70
80
90
100
1990 1992 1994 1996 1998 2000 2002 2004 2006 2008 2010 2012 2014 2016 2018
OECD = 100OECD = 100
Estonia
Poland
Slovak Republic
Romania
Bulgaria
17
OECD ECONOMIC SURVEYS: BULGARIA 2021 © OECD 2021
A sharp drop in economic activity occurred in Bulgaria as the COVID-19 pandemic hit Europe in March
2020. The economic consequences of the pandemic impacted severely service sectors most exposed to
disruption from containment measures, especially hospitality and transportation and storage, and had wide
implications for the economy given the curtailment of economic activities and a weakening in external
demand. The large uptick in cases that began in October has dampened the recovery and if not suppressed
could lead to a prolonged negative impact on growth.
The government moved quickly to put in place fiscal measures to support firms and households when it
declared a state of emergency in March and has progressively increased and extended support as the
enduring impact of the pandemic became clear (Box 1.1). Huge uncertainty surrounds the future course of
the virus and, therefore, policy support should not be withdrawn too early. Bulgaria has ample fiscal space
to extend the duration of its stimulus package in response to the crisis and to expand the response if
required. Poverty and social exclusion remain high and the most vulnerable in the economy will require
continued support in the face of such a large income shock.
In their support to the recovery, policymakers will have to balance the need to protect workers and firms
and the risk of hindering the reallocation of resources that is always needed after a large shock. Helping
workers to find new jobs should prioritise their retraining and upskilling, with a focus on reducing skills
mismatches and providing fast-growing sectors with needed talent, for instance Bulgaria’s successful
digital sector. Improving access to insolvency and rehabilitation for firms impacted by the crisis is also a
priority given the slowness of bankruptcy proceedings and lack of debt restructuring options available to
viable, but overly indebted, firms. In addition, boosting support to energy conservation and renewable
energy would not only hasten the country’s decarbonisation, but it would also foster innovation. The country
should ensure an effective and rapid use of the substantial European Union funding that is available to
support the recovery. Once the recovery is well underway, the country should move back towards a
balanced budget through a combination of increased revenues and improved spending efficiency, and
longer term, continue to ensure fiscal sustainability

18
OECD ECONOMIC SURVEYS: BULGARIA 2021 © OECD 2021
Box 1.1. Fiscal policy responses to the COVID-19 pandemic
The government put in place a comprehensive package of measures designed to protect households
and firms and to ensure adequate health and other services are in place to respond to the pandemic.
The main policy measures are:
The 60:40 salary support scheme is the most important tool to support businesses and
employees during the crisis. Introduced in March 2020, the government pays 60% of salaries
and the employer’s social security and healthcare contributions for employees who face being
laid off, with employers covering the remaining 40%. The scheme covers companies engaged
in retail, transportation, hotels, restaurants and bars, cinemas, tourism operators and trade fair
organisers, private education, human health services, cultural activities, sports and other
recreational activities. Companies should have experienced a 20% fall in sales in March 2020,
compared to the same month of 2019, to be eligible. Firms need to retain all their staff to qualify.
It is expected that the scheme will be applied until the end of March 2021. (cost of 0.6% of 2019
GDP in 2020 and 0.3% of 2019 GDP in 2021)
Additional remuneration costs for staff in the ministries of health, interior and social protection
for pandemic-related activities, and expenditures on health, social care, education, tourism and
other sectors. The measure is due to remain in place until 2021. (cost of 0.6% of 2019 GDP).
A monthly pension supplement of BGN 50 (about EUR 25) to all pensioners from August until
December 2020 and for the first quarter of 2021. (cost of 0.4% of 2019 GDP in 2020 and 0.3%
of 2019 GDP in 2021)
The standard 20% VAT rate was reduced to 9% on 1 July 2020 for printed and digital books
and textbooks, restaurant and catering services (excluding alcohol) as well as food and hygiene
products for babies and small children. On 1 August, the reduced rate of 9% was extended to
fees for gyms and other sports facilities, tour holidays and wine and beer served in restaurants
and cafes. The reduced rates are due to be in place until 31 December 2021. (cost of 0.1% of
2019 GDP in 2020 and 0.2% of 2019 GDP in 2021).
Deferral of tax return and payments for corporate income taxes and personal income taxes for
sole traders from April 2020 until end-June 2020.
The government has provided liquidity support to firms and households through a capital
increase of BGN 700 million (0.6% of 2019 GDP) for the Bulgarian Development Bank. Of this,
BGN 500 million is destined for the issuance of portfolio guarantees to commercial banks to
allow more flexible conditions for business loans and BGN 200 million to guarantee non-interest
consumer loans up to BGN 4500 (about EUR 2300) for employees who have gone on unpaid
leave as well as for self-employed. The capital injection is expected to increase the availability
of credit to firms and households by up to BGN 2.2 billion (EUR 1.25 billion).
Although Bulgaria was performing strongly before the pandemic, it was nonetheless facing a number of
structural changes, which will need to be tackled once the economy recovers from the current crisis. Two
key long-term challenges are discussed in this Economic Assessment. With an ageing and one of the
world’s fastest-shrinking population, Bulgaria will need to put a strong emphasis on increasing productivity
growth to generate future growth in living standards; productivity would be stimulated by reforms that
improve the business environment (Chapter 2). Demographic decline is having a striking impact on rural
regions, with large areas suffering from depopulation due to migration and a rapid ageing of remaining
inhabitants. Regional income differences are larger than in most OECD countries and they have increased
more across regions with differences in access to larger cities. Future recovery plans should ensure that

19
OECD ECONOMIC SURVEYS: BULGARIA 2021 © OECD 2021
lagging regions are not left behind. Improving their connection to supply chains through better transport
and ensuring that there is enough affordable housing, especially in cities, for workers taking up new jobs,
will be essential (Chapter 3).
Against this background, the main messages of this Economic Assessment are:
Macroeconomic support should not be withdrawn too early. The government plans to extend
COVID-19 response measures to 2021, by continuing support programmes, and providing
enhanced social benefits. There is fiscal space to expand further the stimulus package, if needed.
Large flows of European Union resources are expected to fund substantial public investment. Like
in other countries, future recovery plans should be well targeted, with a focus on measures to
modernise the economy, make it more productive, and accelerate its decarbonisation.
The government should facilitate the reallocation of production factors, which is inherent to post-
crisis recoveries. Access to retraining and upskilling will help workers migrate to new jobs and
reduce the pervasive problem of skills mismatches. Improving the regimes for insolvency and firm
restructuring is also important after a large crisis. Improving competition, fighting corruption,
reducing red tape and improving state-owned enterprises (SOE) governance will also help the
reallocation of resources across sectors.
The government’s recovery plan should avoid that large groups are left further behind, in particular
regions already suffering from ageing, depopulation, and poor connectedness. Policy action is
needed to integrate vulnerable populations, such as the Roma, who make up around one-tenth of
the population. New approaches to tourism and agriculture provide an opportunity to spur on long-
term growth in lagging regions.
The economy requires continued macroeconomic policy support
Hit by considerable economic volatility in the 1990s, the economy stabilised in the 2000s and proved
resilient to a number of domestic and external shocks. A Currency Board arrangement has been in place
since 1997, with the BGN initially fixed to German mark and subsequently to the euro, following the
introduction of the euro as the single currency for the euro area. The Currency Board supported by prudent
fiscal policy, has led to a stable exchange rate, low inflation and moderate public debt (Box 1.2). Bulgaria
joined the European Union in 2007, the Bulgarian lev was included to ERM II in July 2020, and the
European Central Bank (ECB) and the Bulgarian National Bank have established a close cooperation over
bank supervision as of 1 October 2020, an important policy goal of the government.
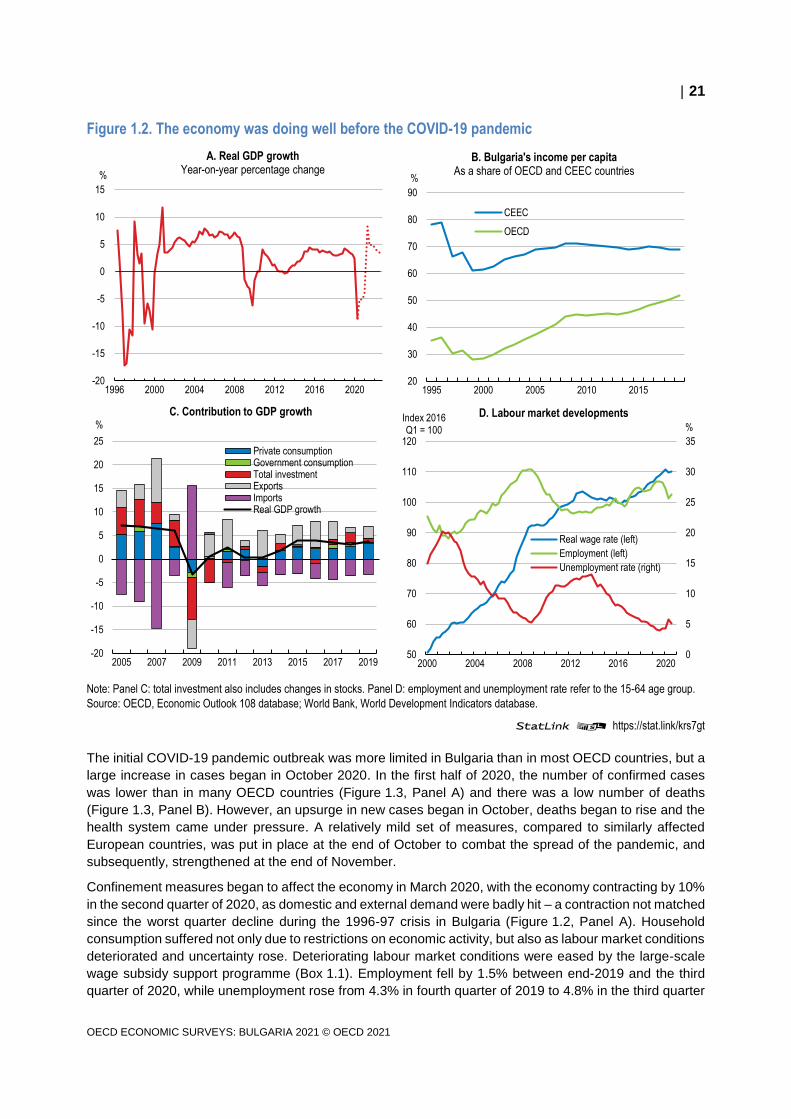
Prior to the COVID-19 pandemic, the economy was growing robustly; employment was high and
unemployment was at historical lows. Economic growth had been above 3% since 2015 and convergence
with OECD incomes had accelerated (Figure 1.2, Panel A and Panel B). Growth became increasingly
driven by domestic demand (Figure 1.2, Panel C) as private consumption grew strongly driven by the rise
in employment and the substantial rise in real wages that had occurred due to tight labour market
conditions and a large hike in public sector pay (Figure 1.2, Panel D). Consumer and mortgage credit
growth has been strong given high wage rises and historically low interest rates. Inflation had begun to
moderate due to a deceleration in food prices and lower rises in regulated energy tariffs. The external
position remained positive, with the country running continuous current account surpluses over the past
seven years. However, export performance had declined, hit by the slowdown in the country's main trading
partners.

20
OECD ECONOMIC SURVEYS: BULGARIA 2021 © OECD 2021
Box 1.2. From the currency board to adopting the euro
The currency board was introduced in 1997 as part of a stabilisation package, following a period of
output volatility, macroeconomic imbalances, and very high inflation. Under this arrangement, the
central bank holds only foreign assets and commits to buying and selling domestic currency against the
reserve currency (the Euro) at the fixed exchange rate. The central bank does not regulate the money
supply through open market operations or the extension of domestic credit as it holds no domestic
assets. The ability of the central bank to act as lender of last resort to commercial banks is constrained
to the excess foreign exchange reserves.
The currency board proved to be a valuable tool. Inflation was quickly reduced and there was a sharp
fall in interest rates following its introduction. The government has generally maintained a fiscal surplus
and gross public debt has decreased from 63% to 30% of GDP over 2000-2019. There was no deviation
from the fixed exchange rate and the currency board has weathered a series of external and domestic
shocks. The Bulgarian Lev was included in the European Exchange Rate Mechanism (ERM II) in July
2020, and, as of 1 October 2020, Bulgaria joined the Banking Union following the implementation of
reforms to strengthen financial sector supervision and the macroprudential framework, and to improve
the legal frameworks for the governance of state-owned enterprises and anti-money laundering. The
central rate of the BGN is set as the rate fixed by the currency board, with a standard fluctuation band
of plus or minus 15 percent. Bulgaria has chosen to join ERM II with its existing currency board
arrangement remaining in place, as a unilateral commitment, implying no additional obligations on
behalf of the European Central Bank.
Preparations for euro area entry will entail continued implementation of institutional reforms, including
putting in place a new insolvency framework, as well as maintaining sound economic policies. Real
wage and price pressures are likely to re-emerge following the recovery from the COVID-19 crisis given
the large differentials in incomes and the price level between Bulgaria and the euro area. To make the
convergence process sustainable, increasing productivity, particularly in the non-tradeable sector will
therefore be of paramount importance for Bulgaria.
21
OECD ECONOMIC SURVEYS: BULGARIA 2021 © OECD 2021
Figure 1.2. The economy was doing well before the COVID-19 pandemic
Note: Panel C: total investment also includes changes in stocks. Panel D: employment and unemployment rate refer to the 15-64 age group.
Source: OECD, Economic Outlook 108 database; World Bank, World Development Indicators database.
StatLink 2 https://stat.link/krs7gt
The initial COVID-19 pandemic outbreak was more limited in Bulgaria than in most OECD countries, but a
large increase in cases began in October 2020. In the first half of 2020, the number of confirmed cases
was lower than in many OECD countries (Figure 1.3, Panel A) and there was a low number of deaths
(Figure 1.3, Panel B). However, an upsurge in new cases began in October, deaths began to rise and the
health system came under pressure. A relatively mild set of measures, compared to similarly affected
European countries, was put in place at the end of October to combat the spread of the pandemic, and
subsequently, strengthened at the end of November.
Confinement measures began to affect the economy in March 2020, with the economy contracting by 10%
in the second quarter of 2020, as domestic and external demand were badly hit – a contraction not matched
since the worst quarter decline during the 1996-97 crisis in Bulgaria (Figure 1.2, Panel A). Household
consumption suffered not only due to restrictions on economic activity, but also as labour market conditions
deteriorated and uncertainty rose. Deteriorating labour market conditions were eased by the large-scale
wage subsidy support programme (Box 1.1). Employment fell by 1.5% between end-2019 and the third
quarter of 2020, while unemployment rose from 4.3% in fourth quarter of 2019 to 4.8% in the third quarter
-20
-15
-10
-5
0
5
10
15
1996 2000 2004 2008 2012 2016 2020
%
A. Real GDP growthYear-on-year percentage change
20
30
40
50
60
70
80
90
1995 2000 2005 2010 2015
%
B. Bulgaria's income per capitaAs a share of OECD and CEEC countries
CEEC
OECD
-20
-15
-10
-5
0
5
10
15
20
25
2005 2007 2009 2011 2013 2015 2017 2019
%
C. Contribution to GDP growth
Private consumptionGovernment consumptionTotal investmentExportsImportsReal GDP growth
0
5
10
15
20
25
30
35
50
60
70
80
90
100
110
120
2000 2004 2008 2012 2016 2020
%Index 2016 Q1 = 100
D. Labour market developments
Real wage rate (left)
Employment (left)
Unemployment rate (right)

22
OECD ECONOMIC SURVEYS: BULGARIA 2021 © OECD 2021
of 2020 (Figure 1.2, Panel D). Inflation fell, driven by the fall in international energy prices, the slowdown
in core inflation and the cut in regulated natural gas and heating prices.
Figure 1.3. After a low initial outbreak, COVID-19 infections began to increase in October 2020
Source: OECD, Main Economic Indicators database; CEIC; https://ourworldindata.org/coronavirus-source-data.
StatLink 2 https://stat.link/3g5wku
Service activity fell by 10% in April 2020 compared to the previous month. Manufacturing activity, mainly
oriented at export markets, declined across the board in April and May, with the exception of some niche
subsectors, such as pharmaceuticals. Declining industrial turnover occurred due to both lower volumes
and prices. Exports were hit hard by the fall in production and external demand, but the decrease in imports
was larger in the first seven months of the year, narrowing the trade deficit. Private investment fell sharply
as enterprises dealt with an abrupt decline in activity and a high degree of uncertainty. This was somewhat
compensated for by the increase in public investment fuelled by EU funds.
-30
-25
-20
-15
-10
-5
0
5
10
15
-60
-50
-40
-30
-20
-10
0
10
20
30
2000 2004 2008 2012 2016 2020
% point%
C. Consumer and industrial confidence in Bulgaria
Consumer confidence (left)
Industrial confidence (right)
0
50
100
150
200
250
300
350
400
450
500
0.0
0.5
1.0
1.5
2.0
2.5
3.0
3.5
4.0
4.5
5.0
Mar
-20
Apr
-20
May
-20
Jun-
20
Jul-2
0
Aug
-20
Sep
-20
Oct
-20
Nov
-20
Dec
-20
ThousandThousand
A. Daily new COVID19 cases
Bulgaria (left)
OECD (right)
0.0
0.5
1.0
1.5
2.0
2.5
3.0
3.5
4.0
Mar
-20
Apr
-20
May
-20
Jun-
20
Jul-2
0
Aug
-20
Sep
-20
Oct
-20
Nov
-20
Dec
-20
Thousand
B. Cumulative COVID19 deaths
80
85
90
95
100
105
110
115
Jan-
18
Apr
-18
Jul-1
8
Oct
-18
Jan-
19
Apr
-19
Jul-1
9
Oct
-19
Jan-
20
Apr
-20
Jul-2
0
Oct
-20
D. Industrial productionIndex 2005 = 100
Bulgaria
OECD

23
OECD ECONOMIC SURVEYS: BULGARIA 2021 © OECD 2021
Considerable uncertainty surrounds the recovery
A recovery is underway, but its path remains highly uncertain given the rise in COVID-19 infections and
the revival in confidence remains vulnerable. The re-opening of businesses and the relaxation of
containment measures was accompanied by a recovery of activity that took on momentum in July 2020.
Business confidence sharply increased in June and consumer confidence also started to rebound, even
though the fear of unemployment went up (Figure 1.3, Panel C). Industrial production increased, though it
remains below February 2020 levels (Figure 1.3, Panel D). Service sector activity, particularly restaurant
and accommodation activity, likely will be slow to rebound substantially until the pandemic eases. The
economy had contracted by 5.2% by the third quarter of 2020 compared to the same quarter in 2019 based
on seasonally adjusted data, a contraction slightly higher than the European Union average of 4.3%. The
decline in activity was driven by a fall in the investment and exports, with private consumption contracting
by less than in many European Countries given the milder initial pandemic and containment measures.
A recovery is underway, but its path remains uncertain, particularly given the current large rise in COVID-
19 infections. The economy is expected to shrink by 4.1% in 2020 (Table 1.1), but is projected to recover
to its pre-crisis level in 2022. Fiscal support will determine the strength of the recovery, with a large shift
from pre-crisis fiscal surpluses to projected deficits of about 4% of GDP in 2020 and 2021. The surging
pandemic will weigh on business confidence and private investment, and sporadic outbreaks will hold down
growth until vaccination against the virus becomes general. Strong public investment, financed by
European Union resources, will then drive the revival of investment. Trade is set to recover gradually,
contributing positively to growth in 2021 and 2022. The prolongation and deepening of containment
measures is a significant downside risk that would constrain the normalisation of domestic demand.
Table 1.1. Macroeconomic indicators and projections
2017 2018 2019 2020 2021 2022
Current prices
BGN billion
Percentage changes, volume
(2015 prices)
GDP at market prices 102.3 3.1 3.7 -4.1 3.3 3.7
Private consumption 61.6 4.4 5.5 -0.7 2.7 3.1
Government consumption 16.0 5.3 2.0 4.1 3.7 3.0
Gross fixed capital formation 18.8 5.4 4.5 -8.4 5.8 4.4
Final domestic demand 96.4 4.8 4.6 -1.4 3.5 3.4
Stockbuilding1 1.6 1.1 0.0 -2.6 -0.3 0.0
Total domestic demand 97.9 5.8 4.6 -4.2 3.1 3.4
Exports of goods and services 68.9 1.7 3.9 -10.7 6.0 5.7
Imports of goods and services 64.4 5.7 5.2 -9.9 6.1 5.3
Net exports1 4.4 -2.5 -0.7 -0.8 0.2 0.5
Memorandum items
GDP deflator - 4.0 5.3 1.6 1.5 1.9
Consumer price index2 - 2.8 3.1 1.6 1.4 1.8
Core consumer price index2 - 2.1 1.8 1.2 1.4 1.8
Unemployment rate (% of labour force) - 5.2 4.2 6.4 6.1 5.1
Household saving ratio, net (% of disposable income) - 1.2 1.0 1.6 -2.6 -4.3
General government financial balance (% of GDP) - 2.0 1.9 -4.4 -4.5 -2.6
General government gross debt (% of GDP)3 - 31.8 29.9 34.4 38.6 40.7
General government debt, Maastricht definition (% of GDP) - 22.3 20.2 24.6 28.9 31.0
Current account balance (% of GDP) - 1.0 3.0 3.1 2.9 3.1
1. Contributions to changes in real GDP, actual amount in the first column.
2. Period averages, the core consumer price index excludes food and energy.
3. Consolidated gross financial liabilities of the general government sector.
Source: OECD Economic Outlook 108 database.

24
OECD ECONOMIC SURVEYS: BULGARIA 2021 © OECD 2021
The global economy faces an uncertain outlook, its recovery depending on the size and length of new
COVID-19 outbreaks, the extent of containment measures put in place, the time it takes to provide vaccines
and/or attain more effective treatments (OECD, 2020a). The main downside risks facing the economy are
a protracted global slowdown due to COVID-19 and a continued high COVID-19 caseload that would
constrain the normalisation of domestic demand. Aside from these bigger risks facing the economy, there
are additional potential vulnerabilities, with low probabilities, that could have large implications for the
economy (Table 1.2).
Table 1.2. Low probability vulnerabilities
Shock Possible impact
Health pandemics The coronavirus outbreak stressed the risks and economic costs from future pandemics. Even if Bulgaria would contain a new outbreak, the shock to tourism and supply chains could be huge.
Political instability Absent a resolution, the current political conflict and social unrests could lead to a prolonged period of political instability and pause the structural reform agenda.
Disruptions to international trade due to a growth in regional and global trade tensions
A small, open economy, which is deeply integrated in global values chains, Bulgaria would suffer from a decrease in trade due to increased tensions.
An extreme natural disaster Areas of the country are vulnerable to earthquakes, flooding and forest fires. A severe natural disaster would require large disaster relief, putting pressure on government finances, and could negatively impact on regional long-term growth.
Fiscal space permits a large pandemic response
Bulgaria has reduced its vulnerability to shocks through prudent fiscal policy that has decreased public
debt significantly and minimised sovereign financing risks. Fiscal rules put in place from the early 2000s
onwards restricted deficits and brought down public debt. In addition to complying with the limits set by
EU’s Growth and Stability Pact, with the latest amendments in the Public Finance Act the country has a
deficit ceiling of 3% of GDP for the cash-based deficit under the consolidated fiscal programme and an
expenditure ceiling of 40% of GDP for spending under the consolidated fiscal programme excluding
expenditures made from EU funds accounts as well as expenditures under other international programmes
and treaties with a regime of EU funds accounts and the national co-financing related to them. Gross public
debt fell from 63% to 30% of GDP over 2000-2019; only one OECD country has lower public debt levels
(Figure 1.4, Panel A). The country entered the COVID-19 pandemic in a strong fiscal position, having run
a general government surplus of 2% of GDP in 2019 (Figure 1.4, Panel B). Fiscal reserves provide an
additional buffer and stood at EUR 7 billion or 11% of GDP at end-September 2020 based on Ministry of
Finance data.
The government’s fiscal support in response to COVID-19 was rapidly enacted: measures to protect
households and firms were introduced in March 2020, subsequently increased in summer 2020 and
extended into 2021 in November 2020 (Box 1.1). The budgetary constraints established by fiscal rules at
the EU level have been lifted for all countries to allow them to respond to the pandemic. Financing for the
overall stimulus package, which is estimated to have a budget cost of about 3% of GDP in 2020 and 2.5%
of GDP in 2021, has come from national and EU resources. A fiscal deficit of about 4% of GDP is expected
in both 2020 and 2021. The government intends to avoid removing temporary support too quickly.

25
OECD ECONOMIC SURVEYS: BULGARIA 2021 © OECD 2021
Figure 1.4. Sound public finances leave room for fiscal stimulus
Source: OECD, Economic Outlook 108 database.
StatLink 2 https://stat.link/4c5n9e
Bulgaria is set to receive substantial support from EU funds. Resources from the EU are expected to total
EUR 24.1 billion or 39% of 2019 GDP over 2021-2027. Under the Multiannual Financial Framework,
Bulgaria is expected to receive EUR 16.6 billion or 27% of 2019 GDP, with the biggest components being
resources for Cohesion Policy and the Common Agricultural Policy. The new recovery instrument
NextGenerationEU is expected to provide an additional EUR 7.5 billion in grants, with further potential
lending of EUR 4.5 billion. Of this, the European Union Recovery and Resilience Facility is to provide
resources of about 10% of pre-crisis GDP. A draft national plan has been drawn up for using the Recovery
and Resilience Facility resources and is due to be submitted to the European Commission following public
consultations. The draft plan foresees a substantial amount of resources going to make the economy
greener, large investments in innovation and regional connectivity, such as improving transport and digital
connectivity, and substantial assistance to increase the inclusion of disadvantaged groups and individuals
in the economy.
Ensuring access to health care is a priority during the pandemic
Spending on health is relatively low and further funding may be necessary to deal with the pandemic as it
unfolds. Increased health and related sector spending (0.6% of 2019 GDP) has allowed the government
to extend free access to primary care services related to COVID-19, introduced early on during the
pandemic. Supporting the population to access COVID-19 related health services is important given that
out-of-pocket payments are high, accounting for almost 40% of current healthcare expenditures in 2018,
among the highest shares in the EU (Chapter 3).
Accessing primary care can be difficult, with a low number of general practitioners, particularly in rural
areas. The population per general practitioner varies from almost 3 000 in the southern Kardzhali region
to 1 200 in Pleven (Figure 1.5). General practitioners play an important role in managing COVID-19, given
that it is either they or an emergency care unit that has to prescribe a test for the state budget to cover it.
The lack of primary care carries with it the risk that those impacted by COVID-19 may go straight to
emergency facilities, a concern should the number of cases increase substantially. During the first wave,
the health system was able to cope with a comparatively low number of hospitalisations. Hospital capacity
is high, with 7.6 beds per 1 000 population, well above the OECD average of 4.7. However, several
hospitals came under pressure as the number of cases increases rapidly during the second wave of the
pandemic.
0
20
40
60
80
100
120
140
160
180
200
220
ES
TB
GR
TU
RC
HL
CZ
EC
HE
KO
RR
OU
LTU
LVA
DN
KC
EE
CN
LDP
OL
SV
KD
EU
IRL
FIN
HU
NS
VN
CO
LA
UT
OE
CD
US
AG
RC
% of GDPA. Gross public debt
2019 or latest 2010
-6
-5
-4
-3
-2
-1
0
1
2
3
2007 2009 2011 2013 2015 2017 2019 2021
% of GDPB. Government fiscal balance

26
OECD ECONOMIC SURVEYS: BULGARIA 2021 © OECD 2021
Figure 1.5. Access to general practitioners is unequal across regions
Population per general practitioner, 2019
Source: OECD calculations based on Bulgarian National Statistical Institute.
A wage subsidy scheme has prevented a large rise in unemployment
The government’s wage subsidy scheme (Box 1.1) has prevented a much sharper rise in unemployment
and a larger deterioration in household incomes, while supporting the most impacted firms with their costs.
It protected 7% of workplaces in 2020 Q2. The programme is due to be applied until the end of March
2021. For the tourism industry, the compensation rate was increased to 80% (Chapter 3).
Employment of men and youth has been hit hardest by the economic contraction. Employment of 15 to 64
year olds fell by 1.5% by the third quarter of 2020 compared to the last quarter 2019. The fall in employment
is on the lower side compared to OECD countries (Figure 1.6, Panel A). In contrast to many other OECD
countries, men’s employment has fallen by more than that of women between the last quarter of 2019 and
the third quarter of 2020 (Figure 1.6, Panel B). As with many OECD countries, youth are losing out: the
employment of those aged 15-24 has fallen by more than five times the national average (Figure 1.6, Panel
B).

27
OECD ECONOMIC SURVEYS: BULGARIA 2021 © OECD 2021
Figure 1.6. Employment situation of the young most negatively affected
Percentage change between 2019 Q4 and 2020 Q3
Note: 2020 Q3 data for Austria, Denmark, Greece, Ireland, Mexico, Romania, Slovak Republic, Turkey and CEEC are estimates.
Source: OECD, Economic Outlook database; National Statistical Institute.
StatLink 2 https://stat.link/h3eqrm
The pattern of informality in the economy limits the income replacement rate of the 60:40 wage subsidy
scheme for many workers. Informal employment is mainly due to an additional payment not included in a
worker’s contract on which taxes, health and social insurance contributions is not paid (“envelope wages”
or “under declared work”) (Box 1.3). Many workers in the hard-hit sectors are reported as earning only the
minimum wage, despite usually receiving top-up payments and thus now have to survive on lower incomes.
This presents a dilemma for policymakers. It is important to offer appropriate protection, but a strong
incentive for formality in Bulgaria is the link between the amount of social contributions paid and the
benefits received.
The discretionary 60:40 wage subsidy scheme is critical for the protection of the population given that there
are limited automatic schemes that kick in for those who suffer income loss in downturns. The size of
automatic income stabilisation has been found to be the lowest in the EU (European Commission, 2017).
Many do not qualify for unemployment schemes; means-tested benefits are low with a small share of the
population benefitting. There is a high risk of poverty in the economy and so the retention of some type of
discretionary scheme will be important, particularly to protect low-income households.
Across OECD countries, direct and indirect support for wage costs has been the key intervention to provide
liquidity support to firms. If demand takes a long time to re-emerge in some hard-hit sectors, the challenge
will be for policy to strike the right balance between supporting viable jobs and enterprises and not inhibiting
re-allocation of workers into new jobs.
-18
-16
-14
-12
-10
-8
-6
-4
-2
0
2
CH
L
CR
I
CO
L
US
A
TU
R
IRL
ME
X
RO
U
OE
CD
ES
T
BG
R
AU
T
LTU
GR
C
SV
K
LVA
FIN
CE
EC
KO
R
CZ
E
DN
K
NLD
HU
N
DE
U
SV
N
PO
L
CH
E
%A. Employment change across countries
-10
-8
-6
-4
-2
0
2
Mal
e
Fem
ale
15-2
4
25-3
4
35-4
4
45-5
4
55-6
4
65 +
%B. Employment change in Bulgaria
by category
28
OECD ECONOMIC SURVEYS: BULGARIA 2021 © OECD 2021
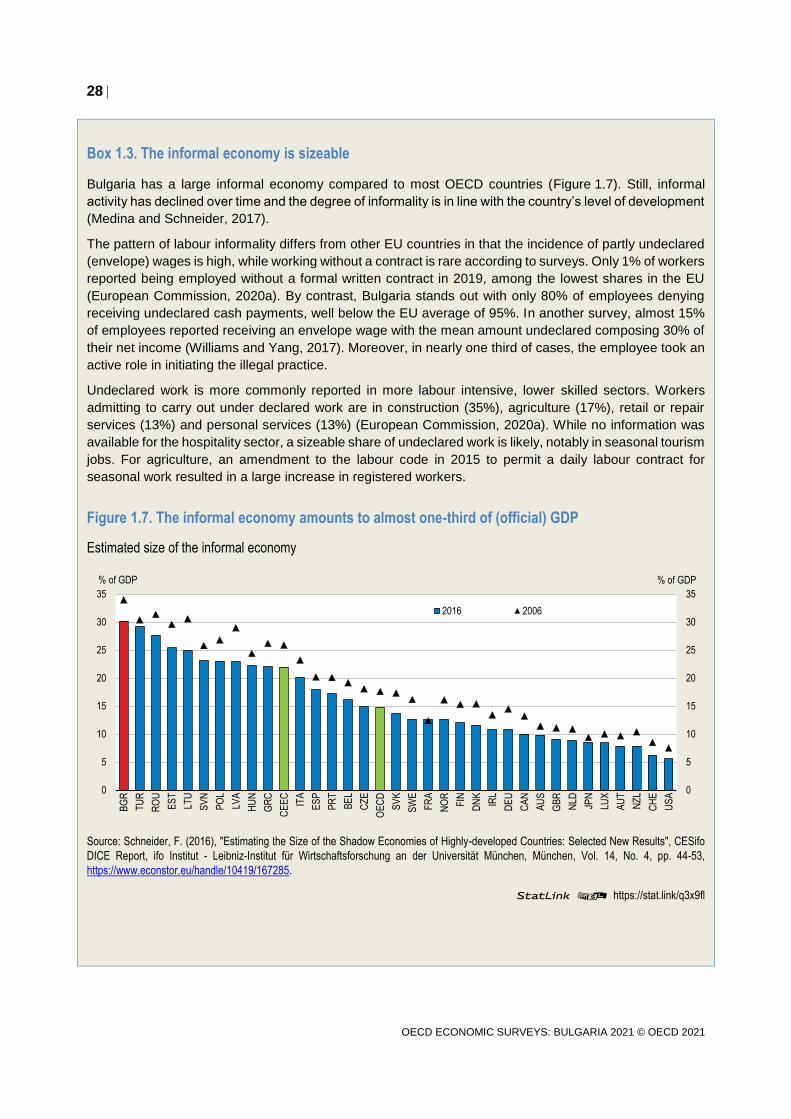
Box 1.3. The informal economy is sizeable
Bulgaria has a large informal economy compared to most OECD countries (Figure 1.7). Still, informal
activity has declined over time and the degree of informality is in line with the country’s level of development
(Medina and Schneider, 2017).
The pattern of labour informality differs from other EU countries in that the incidence of partly undeclared
(envelope) wages is high, while working without a contract is rare according to surveys. Only 1% of workers
reported being employed without a formal written contract in 2019, among the lowest shares in the EU
(European Commission, 2020a). By contrast, Bulgaria stands out with only 80% of employees denying
receiving undeclared cash payments, well below the EU average of 95%. In another survey, almost 15%
of employees reported receiving an envelope wage with the mean amount undeclared composing 30% of
their net income (Williams and Yang, 2017). Moreover, in nearly one third of cases, the employee took an
active role in initiating the illegal practice.
Undeclared work is more commonly reported in more labour intensive, lower skilled sectors. Workers
admitting to carry out under declared work are in construction (35%), agriculture (17%), retail or repair
services (13%) and personal services (13%) (European Commission, 2020a). While no information was
available for the hospitality sector, a sizeable share of undeclared work is likely, notably in seasonal tourism
jobs. For agriculture, an amendment to the labour code in 2015 to permit a daily labour contract for
seasonal work resulted in a large increase in registered workers.
Figure 1.7. The informal economy amounts to almost one-third of (official) GDP
Estimated size of the informal economy
Source: Schneider, F. (2016), "Estimating the Size of the Shadow Economies of Highly-developed Countries: Selected New Results", CESifo
DICE Report, ifo Institut - Leibniz-Institut für Wirtschaftsforschung an der Universität München, München, Vol. 14, No. 4, pp. 44-53,
https://www.econstor.eu/handle/10419/167285.
StatLink 2 https://stat.link/q3x9fl
0
5
10
15
20
25
30
35
0
5
10
15
20
25
30
35
BG
R
TU
R
RO
U
ES
T
LTU
SV
N
PO
L
LVA
HU
N
GR
C
CE
EC
ITA
ES
P
PR
T
BE
L
CZ
E
OE
CD
SV
K
SW
E
FR
A
NO
R
FIN
DN
K
IRL
DE
U
CA
N
AU
S
GB
R
NLD
JPN
LUX
AU
T
NZ
L
CH
E
US
A
% of GDP% of GDP
2016 2006

29
OECD ECONOMIC SURVEYS: BULGARIA 2021 © OECD 2021
Long-term public finances are sound but subject to uncertainties from ageing
Public debt is projected to remain low in the medium-term despite the sizable fiscal response to COVID-
19, though rising ageing costs are likely to lead to higher spending pressures going forward. Lower output
and fiscal deficits of 4% of GDP in 2020 and 2021 lead to a rise in public debt. The projections incorporate
an increase over time in pension and healthcare spending due to ageing and a rise in the demand for
public services based on the OECD long-term model (Guillemette et al., 2017). In the scenario showing
the debt trajectory under current fiscal rules, the ageing-related spending rise is offset by revenue
increases and/or spending reduction measures. Under this scenario, the structural primary deficit is
projected to be eliminated by 2024 and gross government debt is then expected to follow a declining path
(Figure 1.8). To illustrate the large potential impact of ageing-related spending pressures, a scenario is
included showing the effect of an increase in ageing-related spending occurring without compensating
increases in revenues and/or expenditure savings. This would push the public debt trajectory higher. A
large degree of uncertainty must be attached to any long-term simulations at this point in the pandemic
and so the long-term debt path is subject to risks. Certain public monopolies or SOEs established by a
special law are legally protected from insolvency and so their liability is a contingent liability to the state
(OECD, 2019a). The aggregate debt of SOEs was 13% of GDP in 2016 (OECD, 2019a).
Figure 1.8. Ageing-related spending pressures could push up public debt
Gross government debt
Note: The projections incorporate actual outcomes until 2019, OECD projections until 2022 and from 2023 are based on the OECD long-term
model estimates (Guillemette et al., 2017). Ageing-related costs for pensions and health care are expected to rise in both scenarios. The
difference between the two scenarios is that in the scenario simulating the public debt path, “under current fiscal rules” assumes that offsetting
revenue increases and/or spending reduction measures are put in place to compensate for the rise in expenditures due to ageing.
Source: OECD calculations based on OECD Economic Outlook 108 database.
StatLink 2 https://stat.link/4kcel8
Population ageing is likely to pose a large longer-term fiscal challenge. Despite having a population that is
rapidly growing older, Bulgaria is projected to remain at the lower end of ageing spenders under the latest
EU ageing fiscal cost projections (European Commission, 2018a). However, greater spending pressures
are likely to emerge than projected in the EU ageing exercise for long-term care, health and pensions.
Long-term care services are provided informally, often by family members, and formal provision is low
(Chapter 3; European Commission, 2018a). Long-term care is excluded currently from the health benefits’
package. Spending on long-term care is not projected to rise much above the current 0.4% of GDP in the
0
10
20
30
40
50
60
70
80
0
10
20
30
40
50
60
70
80
2000 2004 2008 2012 2016 2020 2024 2028 2032 2036 2040 2044 2048
% of GDP% of GDP
Scenario under current fiscal rules
Scenario without fiscal measures to offset the rise in ageing-related spending

30
OECD ECONOMIC SURVEYS: BULGARIA 2021 © OECD 2021
EU ageing scenario, which remains well below the EU average of 1.6% in 2016. Pressure to increase the
public provision and financing of long-term care services may grow by more than expected in coming
decades as the country becomes richer and the opportunity cost in terms of foregone formal employment
increases for the large proportion of female informal carers. In addition, the costs of providing long-term
care services may increase towards those of the EU average as living standards increase in Bulgaria.
Pension spending will face additional pressures as an increasing share of the population reaches
retirement age in the coming decades. The three-pillar pension system consists of a pay-as-you-go,
statutory state pension, a mandatory supplementary scheme based on individual retirement savings
accounts, and supplementary voluntary pension insurance, funded personal and occupational schemes.
The statutory pension age is 61 years and six months for women and 64 years and three months for men
in 2020. A pension reform in 2015 increased the contribution rate and determined the statutory retirement
ages for men and women to gradually rise and equalise to 65 years of age by 2037. The increase in the
retirement age put in place in 2015 was more gradual than the 2011 reform it replaced. The retirement age
is due to be linked to increases in life expectancy after it reaches 65 in 2037. Participants under the second
pillar were given the possibility under the reform to opt out and transfer their individual savings from
management by private pension funds to the State Pension Fund (first pillar). Given that the ageing
population and shrinking workforce are set to result in a growing social security deficit, a faster equalisation
of the male and female retirement age, an immediate linkage of the retirement age and life expectancy
rises, and further reforms, such as rises in contribution rates, would increase the sustainability of the
pension system.
The difficult circumstances faced by many older people due to low incomes could increase social pressures
to increase the adequacy of retirement incomes. Total public pension benefits compared to the last average
wage earned, i.e. the replacement rate, are relatively low at 29% compared to 43% on average in the EU
in 2016 (European Commission, 2018a). Current pension benefits are insufficient to protect the population
from poverty. Nearly half of those over 65 years of age are at risk of poverty or social exclusion and a high
share live in households that suffer from severe material deprivation. The government has made efforts to
increase the basic pension to raise living standards for the most vulnerable old-age groups in recent years
(European Commission, 2018b). However, pension rises have lagged behind the high wage increases
seen in recent years given that indexation is based on 50% of the increase in the consumer price index
and 50% of insurable income growth. A return to strong wage growth as the economy recovers from
COVID-19 would further increase the gap between the incomes of the most vulnerable pensioners and the
average worker. The EU ageing baseline projections assume that the benefit ratio will decrease over time,
i.e. that pensions will fall relative to the average wage. However, given that a large share of the population
faces low incomes on retiring, pressure is likely to mount to increase the living standards of the growing
older population.

31
OECD ECONOMIC SURVEYS: BULGARIA 2021 © OECD 2021
Box 1.4. Composition of government revenues
Tax pressure is relatively low compared to the OECD and EU, with a tax-to-GDP ratio of 30% in 2018
(Figure 1.9, Panel A). Indirect taxes such as VAT and excise taxes contribute more to tax revenues than
on average in the OECD (Figure 1.9, Panels A and B). Taxes from income and property are relatively low
(Figure 1.9, Panels A and C). A flat tax of 10% on personal and corporate incomes was put in place in
2008. It puts Bulgaria among the most competitive corporate tax regimes (Figure 1.9, Panel D), but results
in much lower corporate tax revenues that on average in the OECD. The flat tax combined with having no
personal allowances available to reduce taxable income results in a lack of progressivity in income taxes.
In its Medium-term Budget Framework, the government has committed to continuing to reduce tax fraud
and evasion, an important priority given growing spending needs.
Figure 1.9. Revenues are low and rely on indirect taxation
Note: CEEC is an unweighted average of the Czech Republic, Estonia, Hungary, Latvia, Lithuania, Poland, the Slovak Republic and Slovenia.
Source: OECD, Global Revenue Statistics and Corporate Tax Statistics databases.
StatLink 2 https://stat.link/7hlcdn
0
5
10
15
20
25
30
35
40
45
BGR CEEC OECD
% of GDP
A. Tax revenue2018
Personal Corporate
Social security VAT
Excise tax Other
0
1
2
3
4
5
6
7
8
9
10
BGR CEEC OECD
% of GDP
B. Value-added tax2018
0.0
0.2
0.4
0.6
0.8
1.0
1.2
1.4
1.6
1.8
2.0
BGR CEEC OECD
% of GDP
C. Property tax2018
Recurrent tax onimmovable propertyOther
0
5
10
15
20
25
30
35
40
0
5
10
15
20
25
30
35
40
CH
E
HU
N
BG
R
IRL
CA
N
LTU
DE
U
CE
EC
LUX
CZ
E
GB
R
PO
L
SV
N
ES
T
FIN ISL
LVA
SV
K
US
A
SW
E
OE
CD
DN
K
NO
R
TU
R
ISR
JPN
GR
C
ITA
AU
T
CH
L
ES
P
KO
R
NLD
NZ
L
BE
L
AU
S
CR
I
ME
X
PR
T
CO
L
FR
A%%
D. Corporate tax rate2019
Statutory corporate income tax rate Effective average tax rate

32
OECD ECONOMIC SURVEYS: BULGARIA 2021 © OECD 2021
The currency board is a cornerstone for macroeconomic stability
A currency board arrangement, put in place in July 1997 in the aftermath of the banking crisis and period
of very high inflation, fixes the national currency to the euro. Backed by prudent fiscal policy and low public
debt, it has endured several crisis and proved to be an important anchor for macroeconomic stability. The
Bulgarian lev was included in the European Exchange Rate Mechanism II (ERM II) in July 2020 and the
ECB and the Bulgarian National Bank have established a close cooperation over bank supervision. By
mutual agreement, the finance ministers of the euro area countries, the President of the ECB, and the
finance ministers and central bank governors of Denmark, Bulgaria and Croatia decided to include the
Bulgarian lev in ERM II. The Bulgarian National Bank unilaterally commits to keep in place its currency
board arrangement without imposing any additional obligations on the ECB or the other participants in the
mechanism.
Prior to COVID-19, inflationary pressures had emerged from strong domestic demand driven by high real
wage growth, and hikes in the prices of food and services. Price dynamics for inflation have been volatile
in recent years driven by energy and food prices (Figure 1.10). Core inflation has tended to be below
headline values in recent years, even though the gap between the two measures was narrowing as energy
prices fell. Annual inflation has moderated from 3.4% at the beginning of 2020 to 0.6% in October 2020,
driven not only by the fall in international energy prices, but also by the slowdown in core inflation and the
cut in regulated natural gas and heating prices.
Figure 1.10. Inflation was stabilising prior to the COVID-19 shock
Harmonised index of consumer price
Source: Eurostat.
StatLink 2 https://stat.link/bcfzh5
The recovery from COVID-19 is likely to bring renewed price pressures resulting in higher inflation than
the euro area given that income per capita and price levels are substantially lower in Bulgaria. The
monetary inflexibility implied by the currency board will require continued prudent fiscal and sound macro
prudential policies. To avoid the accumulation of excessive price pressures and macroeconomic
imbalances, appropriate structural reforms will be needed to boost productivity convergence (Chapter 2)
and ensure wage growth is matched by productivity improvements, particularly for non-tradable goods.
The economy has been running current account surpluses for nearly ten years. The current and capital
account position of the country has substantially improved in the last decade. A reduction in the trade
-3
-2
-1
0
1
2
3
4
-3
-2
-1
0
1
2
3
4
Jan-
15
Apr
-15
Jul-1
5
Oct
-15
Jan-
16
Apr
-16
Jul-1
6
Oct
-16
Jan-
17
Apr
-17
Jul-1
7
Oct
-17
Jan-
18
Apr
-18
Jul-1
8
Oct
-18
Jan-
19
Apr
-19
Jul-1
9
Oct
-19
Jan-
20
Apr
-20
Jul-2
0
Oct
-20
%%
Core, contributions
Energy, contributions
Food, alcohol & tobacco, contributions
Headline, y-o-y

33
OECD ECONOMIC SURVEYS: BULGARIA 2021 © OECD 2021
deficit helped drive current account surpluses based on export-led growth and constrained import demand
in the recovery year following the 2008 global financial crisis. Current account surpluses of 1% and 3% of
GDP were recorded in 2018 and 2019, respectively (Figure 1.11). At the same time, there has been a large
drop in net financial inflows (Figure 1.12). Net direct investment inflows have fallen significantly from 2007,
when there were substantial foreign investment inflows for real estate, financial and insurance services.
The external debt of the banking sector has fallen since 2007/2008 contributing to a large drop in gross
external debt to 58% of GDP in 2019.
Figure 1.11. Current account surpluses have been driven by a reduction in the trade deficit
Source: OECD, Economic Outlook database.
StatLink 2 https://stat.link/nua7zg
Figure 1.12. Net international investment has fallen substantially
Source: IMF, International Financial Statistics database.
StatLink 2 https://stat.link/j3berz
Bulgaria is in a good position to make the most of the opportunities offered by joining the euro zone. The
country has maintained through its currency board a fixed exchange rate, initially to the German mark, and
then the euro, since 1997. There has been no deviation from the fixed exchange rate. In this period, the
-35
-30
-25
-20
-15
-10
-5
0
5
10
15
-35
-30
-25
-20
-15
-10
-5
0
5
10
15
2007 2008 2009 2010 2011 2012 2013 2014 2015 2016 2017 2018 2019
% of GDP% of GDP
Balance of goods
Balance of services
Primary income
Secondary income
Current account balance
-30
-20
-10
0
10
20
30
40
50
-30
-20
-10
0
10
20
30
40
50
2007 2008 2009 2010 2011 2012 2013 2014 2015 2016 2017 2018 2019
% of GDP% of GDP
Direct investment
Portfolio investment
Other (Fnancial derivatives + Other investment)
Current account (excl. exceptional financing)
Financial account
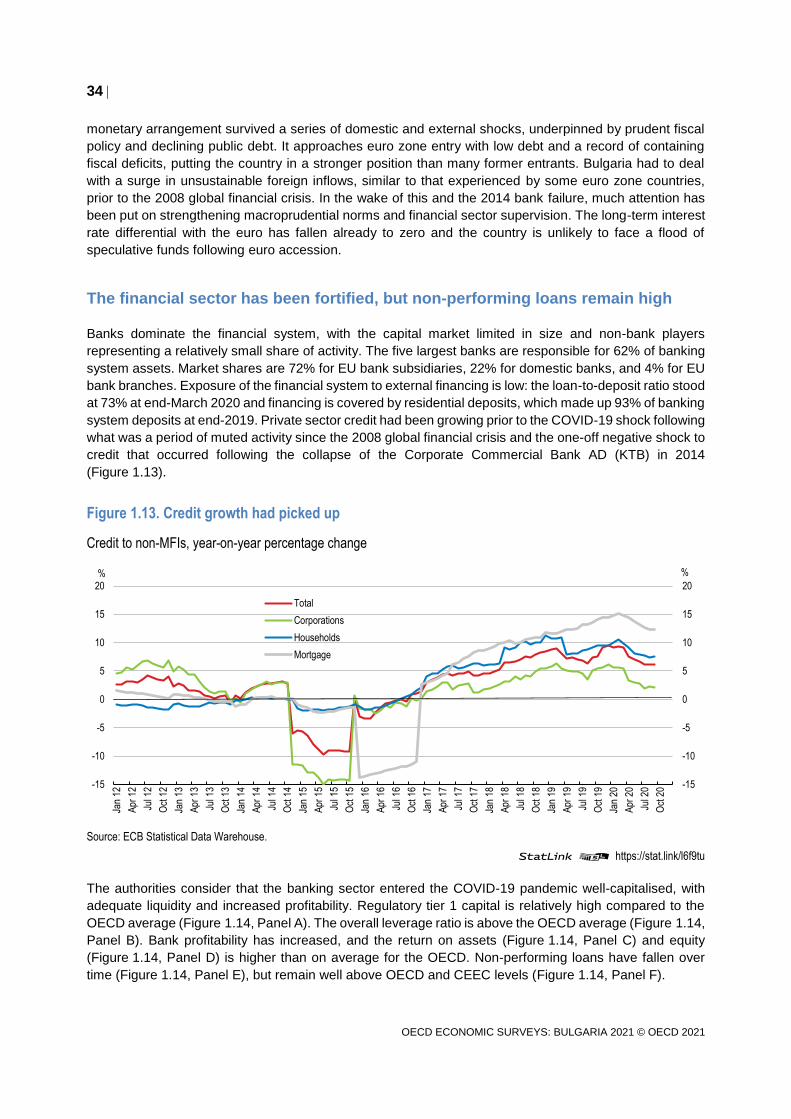
34
OECD ECONOMIC SURVEYS: BULGARIA 2021 © OECD 2021
monetary arrangement survived a series of domestic and external shocks, underpinned by prudent fiscal
policy and declining public debt. It approaches euro zone entry with low debt and a record of containing
fiscal deficits, putting the country in a stronger position than many former entrants. Bulgaria had to deal
with a surge in unsustainable foreign inflows, similar to that experienced by some euro zone countries,
prior to the 2008 global financial crisis. In the wake of this and the 2014 bank failure, much attention has
been put on strengthening macroprudential norms and financial sector supervision. The long-term interest
rate differential with the euro has fallen already to zero and the country is unlikely to face a flood of
speculative funds following euro accession.
The financial sector has been fortified, but non-performing loans remain high
Banks dominate the financial system, with the capital market limited in size and non-bank players
representing a relatively small share of activity. The five largest banks are responsible for 62% of banking
system assets. Market shares are 72% for EU bank subsidiaries, 22% for domestic banks, and 4% for EU
bank branches. Exposure of the financial system to external financing is low: the loan-to-deposit ratio stood
at 73% at end-March 2020 and financing is covered by residential deposits, which made up 93% of banking
system deposits at end-2019. Private sector credit had been growing prior to the COVID-19 shock following
what was a period of muted activity since the 2008 global financial crisis and the one-off negative shock to
credit that occurred following the collapse of the Corporate Commercial Bank AD (KTB) in 2014
(Figure 1.13).
Figure 1.13. Credit growth had picked up
Credit to non-MFIs, year-on-year percentage change
Source: ECB Statistical Data Warehouse.
StatLink 2 https://stat.link/l6f9tu
The authorities consider that the banking sector entered the COVID-19 pandemic well-capitalised, with
adequate liquidity and increased profitability. Regulatory tier 1 capital is relatively high compared to the
OECD average (Figure 1.14, Panel A). The overall leverage ratio is above the OECD average (Figure 1.14,
Panel B). Bank profitability has increased, and the return on assets (Figure 1.14, Panel C) and equity
(Figure 1.14, Panel D) is higher than on average for the OECD. Non-performing loans have fallen over
time (Figure 1.14, Panel E), but remain well above OECD and CEEC levels (Figure 1.14, Panel F).
-15
-10
-5
0
5
10
15
20
-15
-10
-5
0
5
10
15
20
Jan
12
Apr
12
Jul 1
2
Oct
12
Jan
13
Apr
13
Jul 1
3
Oct
13
Jan
14
Apr
14
Jul 1
4
Oct
14
Jan
15
Apr
15
Jul 1
5
Oct
15
Jan
16
Apr
16
Jul 1
6
Oct
16
Jan
17
Apr
17
Jul 1
7
Oct
17
Jan
18
Apr
18
Jul 1
8
Oct
18
Jan
19
Apr
19
Jul 1
9
Oct
19
Jan
20
Apr
20
Jul 2
0
Oct
20
%%
Total
Corporations
Households
Mortgage

35
OECD ECONOMIC SURVEYS: BULGARIA 2021 © OECD 2021
Figure 1.14. Financial sector health had improved
2019 or latest available year
Note: CEEC is the unweighted average of the Czech Republic, Estonia, Hungary, Latvia, Lithuania, Poland, Romania, the Slovak Republic and
Slovenia, except in panel B where Hungary data is unavailable.
Source: IMF, Financial Soundness Indicators database.
StatLink 2 https://stat.link/wb1vg2
0
5
10
15
20
25
CH
LC
OL
KO
RU
SA
CR
IM
EX
TU
RA
UT
GR
CH
UN
PO
LD
EU
SV
KO
EC
DS
VN
FIN
NLD
CE
EC
CZ
ELT
UB
GR
DN
KR
OU
LVA
IRL
ES
T
%A. Regulatory tier 1 capital to risk-weighted assets
0
2
4
6
8
10
12
14
16
18
NLD
DE
UC
ZE
FIN
LTU
DN
KC
HL
AU
TK
OR
OE
CD
CE
EC
PO
LLV
AC
RI
RO
US
VK
SV
NG
RC
ME
XB
GR
TU
RU
SA
ES
TIR
LC
OL
%B. Total capital to unweighted assets
0.0
0.5
1.0
1.5
2.0
2.5
3.0
GR
CD
EU
US
ALV
AD
NK
NLD FIN
PO
LIR
LA
UT
KO
RO
EC
DS
VK
CR
IC
ZE
CE
EC
ES
TC
HL
RO
ULT
UT
UR
BG
RS
VN
HU
NM
EX
CO
L
%C. Return on assets
0
3
6
9
12
15
18
21
GR
CU
SA
DE
UIR
LLV
AC
RI
PO
LE
ST
AU
TD
NK
FIN
SV
KK
OR
OE
CD
NLD
BG
RS
VN
RO
UC
EE
CT
UR
CH
LLT
UC
OL
CZ
EH
UN
ME
X
%D. Return on equity
0
1
2
3
4
5
6
7
KO
RE
ST
US
ALT
UD
EU
FIN
HU
NA
UT
DN
KN
LDC
HL
ME
XC
RI
CZ
EC
EE
CS
VK
OE
CD
IRL
SV
NP
OL
RO
UC
OL
LVA
TU
RP
RT
BG
RIT
AG
RC
%E. Non-performing loand to total gross loans
36.5
0
2
4
6
8
10
12
14
16
18
2010 2012 2014 2016 2018
%F. Evolution of non-performing loans to total
gross loans
Bulgaria
CEEC
OECD

36
OECD ECONOMIC SURVEYS: BULGARIA 2021 © OECD 2021
Prior to the pandemic, measures had been put in place to further improve capital adequacy and asset
quality of the banking sectors. The ECB carried out an asset quality review and stress test of the six banks
based on a point-in-time assessment as of end-2018, publishing the results in 2019 (European Central
Bank, 2019). Four of the assessed banks were found not to have any capital shortfalls. Two domestically-
owned banks had capital needs, as revealed by the adverse scenario in the stress tests, and as a result
were further recapitalised in 2020.
Credit risk from loans to households is likely to be lower than that from non-financial corporations. Non-
financial corporation debt to GDP had fallen to just above the EU average (Figure 1.15 Panel A). Service
sectors impacted by COVID-19 are among those with the lowest liquidity buffers, namely real estate
activities and accommodation and food service activities that have loan to deposit ratios of 313% and
210%, respectively (Bulgarian National Bank, 2020). Indicators at the sectoral level only give a general
indication of the level of indebtedness and liquidity position of firms due to the heterogeneity of individual
firms within the sectors. Faced with a decline in activity, firms in the sectors most impacted by COVID-19
may begin to feel pressure with making loan repayments when the current debt moratorium runs out.
Household debt is one of the lowest in the EU at 23% of GDP and mostly comprises bank loans
(Figure 1.15, Panel B). Households’ bank deposits have grown over December 2019-July 2020 as in most
EU countries, but the increase is on the lower end (OECD, 2020b). Non-financial corporations have not
experienced the rise in bank deposits seen in many other EU countries (OECD, 2020b). Government
support for households and the business sector diminishes default risks as long as measures remain in
place.
Figure 1.15. Household indebtedness is low, while non-financial corporation debt had been falling
Debt in per cent of GDP
Note: Consolidated data. Panel B also includes non-profit institutions serving households.
Source: Eurostat (online code nasa_10_f_bs).
StatLink 2 https://stat.link/r9qz1e
The COVID-19 crisis presents the banking system with the challenge of keeping credit flowing, often with
the support of government programmes to the corporate sector, while managing rising risks. The view of
the Bulgarian authorities is that the banking sector is facing these challenges in good condition, with a solid
capital and liquidity position allowing the management of the rising risks. At the onset of the COVID-19
confinement, the Bulgarian National Bank took measures aimed at preserving the stability of the banking
system and strengthening its flexibility. These include an increase in banking system liquidity by EUR 3.6
billion (BGN 7 billion) through a reduction in foreign exposure of commercial banks, full capitalisation of
0
40
80
120
160
200
240
280
RO
ULT
UP
OL
SV
NC
EE
CLV
AS
VK
HU
NC
ZE
DE
UG
RC
ES
TIT
AT
UR
BG
RA
UT
ES
PF
INN
OR
DN
KN
LD IRL
LUX
%A. Non-financial corporations
2019 or latest year available
2007
0
20
40
60
80
100
120
140
TU
RR
OU
HU
NLV
ALT
UB
GR
SV
NC
EE
CC
ZE
PO
LIR
LE
ST
ITA
SV
KA
UT
GR
CD
EU
ES
PLU
XF
INN
LDN
OR
DN
K
%B. Households
2019 or latest year available
2007
37
OECD ECONOMIC SURVEYS: BULGARIA 2021 © OECD 2021
profits in the banking system, the cancellation of the increase in the counter cyclical capital buffer planned
for 2020 and 2021 (totalling 0.6% of 2019 GDP). Depending on how the COVID-19 crisis unfolds, further
measures may have to be considered if there is a rise in non-performing loans. The ECB and the Bulgarian
National Bank put in place a precautionary swap line of EUR 2 billion to provide euro liquidity in April. A
moratorium on loan repayments for debtors hit by COVID-19 has been put in place. The scheme is set to
run until March 2021 allowing borrowers to submit loan deferral requests until end-September 2020. Over
80 000 loans totalling about EUR 3 billion (BGN 6 billion) benefitted from the programme in the first three
months of its implementation (Association of Banks in Bulgaria, 2020). Additional firm and household credit
support has been put in place, using commercial banks as intermediaries, but with the Bulgarian
Development Bank providing 80% guarantees in the case of firms and 100% guarantees for household
credit (Box 1.1).
Under the action plan to prepare for ERM II, the authorities have carried out impressive reforms to
strengthen financial sector supervision and the macroprudential framework, and to improve the legal
frameworks for the governance of state-owned enterprises and anti-money laundering. The government
has identified gaps in the insolvency framework and put together a roadmap to address them and revise
legislation (Chapter 2). Achieving membership of the European Banking Union should reinforce the
resilience of the financial system given that a large share of foreign-owned subsidiaries come from Banking
Union countries and that being part of the Banking Union supervisory and resolution arrangements should
assist to maintain confidence in the financial system. The ECB will be responsible for the direct supervision
of the significant financial institutions, oversight of less significant institutions and procedures for all
supervised entities from October 2020.
Strengthening the recovery
Making the most of the export sector
A small, highly open economy, the degree of robustness of external demand will be an important driver of
the speed of the recovery from COVID-19. Trade grew strongly from the early 2000s through EU
membership and beyond: exports and imports of goods and services increased from 78% to 124% of GDP
over 2000-2019. However, at 64% of GDP, exports of goods and services remain lower than for many
faster converging CEEC peers. About two-thirds of exported goods are destined for the EU with Germany,
Romania, Italy, Turkey and Greece being the most important markets (Figure 1.16, Panel B). Services
make up around a quarter of exports, with about 38% of total service exports consisting of travel services
– hard hit by the current pandemic – and a fifth by transportation and storage services. Business services
have become increasingly important, including a dynamic computer and information services sector.
Goods exports rely on a high share of primary exports, including copper, iron and other metals, and
petroleum products, and a lower share of higher value-added goods (Figure 1.16, Panel B). Boosting
growth of the more dynamic exports sectors, not only in services activities, but also in higher value-added
manufacturing (see Chapter 3 on the agricultural sector), will be important to increase convergence.
Bulgaria has successfully integrated into regional and global value chains and now faces the challenge of
boosting the domestic value added of gross exports generated through this activity. Participation in global
value chains is at a similar level to CEEC countries. The importing of foreign inputs to produce exported
goods and services, i.e. “backward participation”, features more strongly than the exportation of
domestically-produced inputs to foreign downstream producers (“forward participation”) (Figure 1.17).
There are some niche fast-growing service sectors involved in global value chain activities, but they far
from dominate. In general, this activity results in low value added content as the country participates in
highly-fragmented global value chains, frequently involving processing and assembly of foreign inputs in
manufacturing activities like the refinement of petroleum products, production of basic metals and
machinery, electrical and transport machinery (Ivanova and Ivanov, 2017). Local subsidiaries of

38
OECD ECONOMIC SURVEYS: BULGARIA 2021 © OECD 2021
multinationals dominate in the export of inputs to producers abroad, with a low share for domestic firms
participating in exports (Taglioni and Winkler, 2016).
Figure 1.16. Exports by destination and commodity
Share of total exports, 2019
Source: National Statistical Institute and UN Comtrade database.
StatLink 2 https://stat.link/py1ume
Figure 1.17. Integration in global value chains is high
Percentage share in total gross exports, 2015
Note: Forward participation is the domestic value added in foreign exports as a share of gross exports, and backward participation is the foreign
value added share in gross exports.
Source: OECD, Trade in Value Added (TiVA) database.
StatLink 2 https://stat.link/csohzk
While increased global value chain integration has been correlated with value-added gains (Taglioni and
Winkler, 2016), the contribution to convergence would be increased by moving up the value chain and
Germany15%
Romania9%
Italy7%
Turkey7%
Greece7%
Other OECD Europe
27%
Other OECD5%
Rest of the world23%
A. Main export destinations
Food & live animals, beverages & tobacco
16%
Copper7%
Iron and other non-ferrous
metals7%
Crude materials
except fuels & metal ores
4%
Mineral fuels10%Chemicals
13%
Apparel & footwear
6%
Nuclear reactors
8%
Electrical machinery &
transport equipment
15%
Other14%
B. Main export commodities
0
10
20
30
40
50
60
70
0
10
20
30
40
50
60
70
OE
CD
CR
I
US
A
TU
R
CO
L
GR
C
LVA
DE
U
CH
L
RO
U
ME
X
FIN
DN
K
AU
T
PO
L
LTU
NLD
ES
T
KO
R
CE
EC
BG
R
SV
N
IRL
CZ
E
HU
N
SV
K
%%
Backward participation Forward participation

39
OECD ECONOMIC SURVEYS: BULGARIA 2021 © OECD 2021
increasing the spillovers to domestic firms. Boosting the domestic value-added from exports and further
increasing global value chain insertion involves putting in place complementary business environment
reforms. Kummritz et al. (2017) point out the economy-wide reforms that would assist Bulgaria in
maximising benefits from global insertion. These encompass reforms from increasing innovation to
improving logistics performance and reducing red tape to enhancing skills (Chapter 2). There is evidence
from Ireland that supplying inputs to multinationals can be an important pathway for knowledge and
technology transfers. Domestic firm productivity is negatively associated with purchases from foreign firms
for downstream activities (Di Ubaldo et al., 2018). R&D investment is found to be an important channel for
productivity spillovers. This suggests that Bulgaria should focus innovation support on domestic firms
engaging in the supply of inputs to multinational/foreign firms rather than companies that concentrate on
processing and assembling foreign inputs.
Foreign direct investment had a big role in expanding the exports sector, but spillovers to domestic
enterprises could be increased. Continuing to attract foreign investment that is directed at increasing value-
added in the manufacturing and services sector will be important to increase capital investment in firms
and to contribute to raise business sector productivity (IMF, 2019a). Foreign direct investment averaged
about 3.1% of GDP over 2012-2018, similar to the levels seen on average in CEEC and OECD countries
(Figure 1.18, Panels A and B). However, the nature of foreign investment has been very different to that
seen in many CEEC countries. Rather than being destined to a large degree for the manufacturing sector,
the stock of foreign direct investment has been concentrated in real estate and, financial and insurance
activities sectors. These non-manufacturing sector investment surged in pre-2008 global financial crisis
years, driving up overall investment but abruptly falling after 2007. There has been some positive shift in
the structure of FDI flows towards more trade-related sectors, as these inflows proved more resilient after
2008. The share of investment in manufacturing and other tradeable sectors has increased in recent years.
Figure 1.18. Foreign direct investment is close to the CEEC average
Source: World Bank, World Development Indicators database; Eurostat (online code bop_iip6_q).
StatLink 2 https://stat.link/i1gh8s
Public investment should be increased
Public investment has been volatile and has fallen below CEEC peers. Protecting public investment during
the COVID-19 downturn will be important for the recovery and to improve key housing and transport
infrastructure and innovation to increase potential growth. Capital spending has been found to have the
200
400
600
800
1 000
1 200
1 400
1 600
1 800
2 000
RO
U
PO
L
LTU
BG
R
SV
K
CE
EC
SV
N
LVA
GR
C
CZ
E
ES
T
HU
N
AU
T
DE
U
FIN
DN
K
CH
E
NLD IR
L
% of GDP
B. Inward FDI stocks2019
-4
0
4
8
12
16
20
24
28
32
1995 2000 2005 2010 2015
% of GDP
A. Inward FDI flows
Bulgaria
CEEC
OECD

40
OECD ECONOMIC SURVEYS: BULGARIA 2021 © OECD 2021
largest multiplier of any government spending component for Bulgaria (Muir and Weber, 2013). In the
aftermath of the 2008 global financial crisis, public investment fell and in recent years has remained well-
below pre-crisis levels (Figure 1.19, Panel B). Troughs and peaks in public investment can be largely
explained by the EU funding cycle, with strong peaks at the beginning of the 2014-2020 programming
period (Figure 1.19, Panel B). Bulgaria is one of the largest beneficiaries of EU support (European
Commission, 2020b). European Union funding is to continue to be high with strong investments expected
at the beginning of the next programming period in 2021 and substantial resources to come from the
European Union Recovery and Resilience Facility (about 10% of pre-crisis GDP). It will be important to
strengthen public investment management to ensure an effective and rapid use of the large available
European Union resources.
Figure 1.19. Public investment has fallen below CEEC peers
Note: Forecast for the 2020 data in panel B.
Source: OECD, Economic Outlook database; Ministry of Finance, Bulgaria.
StatLink 2 https://stat.link/o4z06k
The economy has investment gaps in infrastructure, the housing stock and innovation that will need to be
closed to support greater economic convergence. Transport infrastructure needs to be improved to allow
the country to have better connectivity with its neighbours, to increase its attractiveness as a transit zone
and to better connect its regions (Chapter 3). The road and rail network require substantial investment,
and there remain gaps in the broadband network in some regions. Limited access to affordable housing
creates a barrier to mobility of workers within the country. The housing stock also is of poor quality and
suffers from low energy efficiency. Investment also would need to focus on continued support for the
growing digital economy, including improving access in lagging regions, assisting further digitalisation for
firms and the government, and developing digital skills. Innovation in the economy is low, and publicly-
financed research and innovation is underfunded and its efficiency could be improved (Chapter 2). A large-
scale public investment programme in these areas would be timely to boost the recovery from COVID-19
and potential growth.
Removing barriers to competition
Reducing the high regulatory barriers to competition could give a substantial boost to productivity by
supporting a more efficient allocation of resources in the economy. The OECD’s product market regulation
indicators show that the regulatory barriers to competition in Bulgaria are higher than for all OECD
countries, with the exception of Colombia and Turkey, based on the economy-wide 2018 product market
regulation measure (Figure 1.20) (Chapter 2). This measure examines the alignment of a country’s
regulatory framework with international best practice. There are high administrative requirements and an
0
1
2
3
4
5
6
7
2000 2002 2004 2006 2008 2010 2012 2014 2016 2018
% of GDPA. Public investment
CEEC
OECD
Bulgaria
0
1
2
3
4
5
6
7
2014 2015 2016 2017 2018 2019 2020
% of GDPB. EU funds

41
OECD ECONOMIC SURVEYS: BULGARIA 2021 © OECD 2021
onerous licensing regime for new businesses, which if eased would encourage the creation of new
businesses and the entry of competitors into new business areas. There is extensive public ownership of
large operators in key network sectors, with incumbent companies completely owned by the state in sectors
such as electricity generation, gas import and retail supply, and rail transport. The large presence of the
state in these sectors, even though they are open to competition, can generate distortions and affect the
incentives for private firms to enter and expand their presence in the sector. The barriers to entering legal
professions (lawyers and notaries) are higher than in any OECD or CEEC country.
Figure 1.20. Barriers to competition are high
Overall Product Market Regulation indicator, index scale of 0-6 from least to most restrictive, 2018
Note: Information refers to laws and regulation in force on 1 January 2019. The OECD average does not include the United States.
Source: OECD, 2018 Product Market Regulation Indicators database.
StatLink 2 https://stat.link/ke92y7
Increased public investment as well as structural reforms to improve the business environment and
governance have a large potential to boost incomes. If the main reforms presented in this Assessment are
adopted, the boost to GDP per capita would be substantial and with limited fiscal impact (Box 1.5).
0.0
0.4
0.8
1.2
1.6
2.0
2.4
0.0
0.4
0.8
1.2
1.6
2.0
2.4
GB
R
DN
K
ES
P
DE
U
NLD
SW
E
NO
R
AU
S
LTU
NZ
L
LVA
ES
T
SV
N
CZ
E
HU
N
ITA
PR
T
FIN IRL
CE
EC
OE
CD
CH
L
ISR
AU
T
JPN
ISL
PO
L
SV
K
CH
E
GR
C
FR
A
ME
X
LUX
BE
L
KO
R
CA
N
RO
U
BG
R
CO
L
TU
R
CR
I

42
OECD ECONOMIC SURVEYS: BULGARIA 2021 © OECD 2021
Box 1.5. Quantifying the impact of selected policy recommendations
The following estimates roughly quantify the growth and fiscal impact of selected structural reform
recommendations. The fiscal estimates give a costing for longer-term structural reforms that are likely
to be delayed until the post-crisis recovery period. The estimated fiscal effects include only the direct
impact and exclude behavioural responses that occur due to a policy change.
Table 1.3. Illustrative GDP impact of recommended reforms
Difference in GDP per capita level, %
Measure Description Effect after 10 years
Business environment
Lower regulatory barriers (PMR) Closing half of the gap to the OECD average 2.3
Increased spending on public investment and innovation Move to CEEC average 0.5
Improvement of public integrity and institutional quality Closing half of the gap to the OECD average for the
control of corruption indicator
4.7
Labour market inclusion
Increased spending on active labour market policies Closing half of the gap to the OECD average 1.0
Increased female legal retirement age Acceleration of equalising the legal retirement
age of women and men (+0.5 year in average age)
0.5
Note: Model simulations based on the framework of Égert and Gal (2017). Scenarios depict the effect on the level of GDP per capita as
compared to a baseline scenario with no policy changes. Not all recommended reforms, including some included in the fiscal quantification,
can be quantified based on available cross-country evidence.
Source: OECD staff estimates.
Table 1.4. Illustrative fiscal impact of post-recovery recommended reforms
Annual fiscal balance effect of selected reforms, % of GDP
Measure Description Effect after 10 years
Deficit-increasing measures 2.7
Business environment
Increased spending on public investment and innovation Move to CEEC average 0.6
Strengthened capacity for insolvency and rehabilitation framework 0.1
Increased resources for integrity and anti-corruption institutions 0.1
Labour market inclusion and social reforms
Provide universal access for 4-year olds to early childhood
education 0.2
Increased spending on active labour market policies Closing half of the gap to the OECD average 0.2
Increased spending on social safety net Move to CEEC average 0.5
Increased spending on health and long-term care Closing half of the gap to the OECD average 1.0
Deficit-reducing measures 2.0-2.1
Tax and subsidy reforms
Improved tax compliance and higher taxation after recovery Move towards CEEC average 1.5
Phasing out subsidies for fossil fuels 0.3
Labour market inclusion
Increased female legal retirement age 0.2-0.3
Note: Estimations for selected reforms showing only direct budget impacts.
Source: OECD calculations.

43
OECD ECONOMIC SURVEYS: BULGARIA 2021 © OECD 2021
Decarbonising the economy
Environmental performance has improved, but the economy remains more carbon- and energy-intensive
than most OECD countries (Figure 1.21). Renewable energy from hydro, wind and solar increased
substantially upon EU accession, but since 2013 expansion has almost stopped. By contrast, policy
initiatives have accelerated biofuels supply in recent years and contributed to bring the share of renewables
in energy supply above the OECD average (Panel C). Nonetheless, coal continues to account for almost
half of energy production and generates large greenhouse gas emissions. The coal-fired power plants are
also an important source of poor air quality, along with high use of solid fuels for heating and the transport
sector. Bulgaria has more pollution-related deaths than any OECD country with 827 deaths per 1 million
inhabitants in 2017, well above the OECD average of 326.
As an EU Member State, Bulgaria’s emissions from the energy sector is regulated through the EU
Emissions Trading System (ETS). For the sectors outside ETS, Bulgaria has a national 2030 target of
keeping emissions no higher than their 2005 level (0% reduction). According to the national energy and
climate plan for 2021-2030 submitted to the EU (BME and BMEW, 2020), the economy is on track to reach
its 2030 emission and energy targets. However, the new ambitious EU emission target agreed in December
2020 will be a serious challenge to Bulgaria’s long-term strategy that does not yet include a phase-out plan
for coal.
The recovery from COVID-19 presents an opportunity to accelerate the transition to low-carbon energy
sources (OECD, 2020c) and tap into abundant financial resources for green infrastructure investments,
including EU Green Deal funds. The transition will be a challenge as Bulgaria accounts for 7% of total EU
coal production. The mining of coal and lignite sector directly employed 15 700 people in 2019 (LFS,
Eurostat), representing less than 0.5% of the labour force but strongly concentrated in two regions (Stara
Zagora and Kyustendil). Measures will thus be needed for reskilling and reallocating these workers (JRC,
2018; SE3Tnet, 2020). Although Bulgaria intends to continue using coal, it has requested to participate in
the EU programme for Coal Regions in Transition, which is welcome.
Coal-fired power plants are already becoming unprofitable (European Commission, 2020b; SE3Tnet,
2020) and renewables are now often more cost-competitive in advanced countries (IEA, 2019). Market
forces and a rise in the price of ETS allowances will thus eventually force Bulgaria’s coal industry to close
(SE3Tnet, 2020). It already benefits from substantial state-aid, which should be removed gradually to not
obstruct decarbonisation. As a low-income EU Member State, Bulgaria is allowed to distribute free ETS
allowances to existing power plants under the condition that similar amounts are invested in modernising
the electricity sector (54 million allowances were allocated during 2013-2020, BME and BMEW, 2020). Ten
countries will maintain this right until 2030, but only Bulgaria, Hungary and Romania have decided to use
it. Bulgaria also supports coal power plants through payments for cold reserve capacity for times of peak
demand (rarely activated) and by preferential electricity prices for plants producing district heating as well
(EU-approved state-aid scheme for efficient cogeneration). Removing all this public support would free
estimated EUR 450 million annually (0.7% of GDP), which could be used to invest in renewables and for
compensating consumers for temporarily higher electricity prices during the transition (SE3Tnet, 2020).

44
OECD ECONOMIC SURVEYS: BULGARIA 2021 © OECD 2021
Figure 1.21. Energy intensity and reliance on coal remain high
Source: OECD (2020), OECD Environment Statistics database (Green Growth Indicators; Patents); OECD National Accounts database; IEA
(2020), IEA Energy Prices and Taxes database; World Bank, World Development Indicators database.
StatLink 2 https://stat.link/5914ps
0.0
0.1
0.2
0.3
0.4
0.5
0.6
0.7
2000 2004 2008 2012 2016
A. CO2 intensityCO2 per GDP, kg/2015 USD
Bulgaria (production-based)
OECD (production-based)
Bulgaria (demand-based)
OECD (demand-based)
0.00
0.04
0.08
0.12
0.16
0.20
0.24
0.28
2000 2004 2008 2012 2016
B. Energy intensityPrimary energy supply per GDP
ktoe/USD (2015 PPP)
Bulgaria
OECD
0
2
4
6
8
10
12
14
2000 2004 2008 2012 2016
C. Renewable energy share% of primary energy supply
Bulgaria
OECD
0
20
40
60
80
100
2000 2019 2000 2019
E. Population exposure to PM2.5
µg/m³
[>35]
[25<35]
[15<25]
[10<15
[0<10]
Bulgaria OECD
0
40
80
120
160
200
240
280
320
Bulgaria OECD
F. Built-up area per capitam2 per capita
2014 2000
0.0
0.5
1.0
1.5
2.0
2.5
3.0
3.5
4.0
Bulgaria OECD
G. Environment-related taxes% of GDP
Energy, 2019 Transport, 2019
Pollution, 2019 Resources, 2019
Total, 2000
0
2
4
6
8
10
12
14
16
18
20
22
Bulgaria OECD
H. Environment-related inventions% of all technologies
2016-18 average
2000-02 average
0
10
20
30
40
50
60
70
80
90
100
2000 2019 2000 2019
D. Sources of energy production
Coal
Nuclear
Renewables
Other
Bulgaria OECD

45
OECD ECONOMIC SURVEYS: BULGARIA 2021 © OECD 2021
Cost-benefit analysis should be applied to plan the phase-out of support, taking into account reduced
energy security. Bulgaria is currently a large net exporter of electricity and maximum use of its (lignite) coal
reserves would ensure energy supply for many years. At the same time, the government plans to develop
its nuclear power programme with the construction of two new units (BME and BMEW, 2020) that would
help ensure energy security and achieve cost-efficient decarbonisation (NEA, 2020). The use of a new
generation of nuclear installations is also being considered, which is welcome since this would improve
security of energy supplies. The two operating reactors are around 30 years old, but an upgrade and
extension of operating lifetime to 60 years were completed in 2019. Having institutions and procedures in
place to ensure the highest safety standards and vigilance is vital, including e.g. regular risk assessment
of seismic hazards and measures to secure a high safety culture. In this respect, Bulgaria will benefit from
best practice sharing by joining the Nuclear Energy Agency from January 2021.
Reducing energy demand through efficiency improvements would also alleviate decarbonisation. The
potential to improve energy efficiency is huge and stronger action could deliver large cost-savings in
addition to the environmental gains. Large subsidies for energy renovation has helped to improve efficiency
in residential buildings, but targeting to low-income households could be improved (Chapter 3). The
government should also step up the use of information campaigns to inform households about the benefits
of energy saving investments as a means to improve efficiency. Although the tax revenue from
environmental taxes is above the OECD average, it mainly reflects the high energy consumption relative
to GDP. In fact, the implicit tax rate on energy use (the energy tax revenue relative to energy consumption)
was the lowest in the EU in 2018. Using fiscal incentives, notably through well-designed energy taxes,
could thus be considered to enhance efficiency when the economy is well into a post-COVID-19 recovery.
Aligning pricing of greenhouse gas emissions from sectors outside the EU ETS, notably buildings,
transport, agriculture and waste, should also be a priority to achieve cost-efficient decarbonisation.
Bulgaria overachieved its target for 2020 under the Effort Sharing Regulation (ESR), but further efforts will
be needed to reach the 2030 zero reduction target. Carbon pricing of e.g. transportation and waste is the
most efficient way to achieve emission reductions and a surplus under ESR can be traded with other EU
countries and generate additional revenue. For instance, vehicle taxes are comparatively low and recycling
of municipal waste is lower than in most EU countries, with municipal waste collection fees not based on
the amount of waste generation (European Commission, 2020b). Implementation of carbon pricing should
be complemented by social measures to protect poorer households.
Ageing demographics will influence future growth
The population is ageing and shrinking rapidly. After losing more than one fifth of its population since the
late 1980s due to high emigration and declining fertility, Bulgaria is set to see its population fall by further
30% by 2060 – the highest population decrease in the world according to the latest UN Population Division
projections. The ageing and shrinking of the population is due to high emigration and a fall in fertility leaving
the age structure increasingly top heavy compared to OECD countries. The working-age population (aged
15 to 64) is set to decline by one fifth in the next 20 years. The decline already has begun (Figure 1.22,
Panel A) and the workforce will become older as younger age groups shrink dramatically in the next decade
(Figure 1.22, Panel B).

46
OECD ECONOMIC SURVEYS: BULGARIA 2021 © OECD 2021
Figure 1.22. The working-age population is shrinking and ageing quickly
Source: United Nations, Department of Economic and Social Affairs, Population Division (2019), World Population Prospects 2019, Online
Edition. Rev. 1.
StatLink 2 https://stat.link/2l3t9f
An economy facing such a stark ageing and shrinking of the workforce needs to maximise the population’s
benefits from education and training throughout the lifecycle from early childhood education onwards
(Chapter 2). Participation in lifelong learning is low, which is of concern for productivity given the shrinking
and ageing workforce. On-the-job and formal training can stop the erosion of skills over the lifecycle
(OECD, 2017a) and prepares workers for changing skills needs. The education level achieved early in life
can determine whether you work more and longer (Figure 1.23).
Figure 1.23. Higher educated people work more and longer
Labour force participation rate by gender, age and educational attainment, 2019
Source: Eurostat, EU-LFS database.
StatLink 2 https://stat.link/pgirdy
65
70
75
80
85
90
95
100
105
2020 2025 2030 2035 2040 2045 2050
Index 2020 = 100
A. Projected working-age (15-64) population
OECD
CEEC
Bulgaria
-20
-15
-10
-5
0
5
20-34 35-49 50-64 15-64
%
B. Projected change in population age groups between 2020-2030
Bulgaria OECD
0
10
20
30
40
50
60
70
80
90
100
15-1
9
20-2
4
25-2
9
30-3
4
35-3
9
40-4
4
45-4
9
50-5
4
55-5
9
60-6
4
65-6
9
70-7
4
% A. Men
Tertiary
Upper secondary and post-sec. non-tertiary
Less than upper secondary
0
10
20
30
40
50
60
70
80
90
100
15-1
9
20-2
4
25-2
9
30-3
4
35-3
9
40-4
4
45-4
9
50-5
4
55-5
9
60-6
4
65-6
9
70-7
4
% B. Women
Tertiary
Upper secondary and post-sec. non-tertiary
Less than upper secondary

47
OECD ECONOMIC SURVEYS: BULGARIA 2021 © OECD 2021
Rising wages have contributed towards a substantial rise in participation in recent years, especially among
older age groups. Nevertheless, accelerating the closure of the three-year gap in statutory retirement ages
for men and women would not only bolster public finances, but also help to boost long-term growth.
Supporting the continued return of Bulgarians from abroad and attracting skilled immigrants also provides
an opportunity to alleviate skill shortages. Emigration has slowed from the high rates seen in the 1990s to
the early 2000s and there are a growing number of Bulgarians returning to the country as economic
opportunities have improved. With just over 13% of Bulgarian immigrants in OECD countries having tertiary
education (ISCED 5 and 6) (OECD, Migration Statistics database), Bulgarians abroad are an important
asset for the country (Figure 1.24). Policies should be deepened to attract and smooth the transition of
return migrants into the labour market.
Figure 1.24. A large proportion of Bulgarian nationals are living abroad
Numbers of Bulgarian nationals living in another EU country
Source: OECD, International Migration database.
StatLink 2 https://stat.link/ovhwbz
Non-Bulgarian immigrants are few and, according to National Statistical Institute data, just over 13 000
non-EU nationals entered the country in 2019 – a year when there was substantial skills shortages. While
progress was made in the 2016 Labour Migration and Labour Mobility Act, further could be done to reduce
employment restrictions, the administrative burden for immigrants and employers, and to smooth the
accreditation process for vocational and educational qualifications.
Ensuring equal opportunities for all
Income inequality, measured by the Gini coefficient, is higher than in almost all OECD countries
(Figure 1.25) and stands out as the highest in the EU. Incomes of the top 20% of the population was 8.1
times higher than the bottom 20% in 2018, well above the OECD average of 5.4. While estimates suggest
that Bulgaria entered the post-communist transition period with higher inequality than most other Eastern
European countries (Solt, 2020), continued increasing inequality is worrying for people’s wellbeing and for
retaining young people in the country. Over the latest decade, the Gini coefficient has increased by almost
eight points (Figure 1.26, Panel A), contrasting with slightly declining inequality in OECD and peer
countries.
0
50
100
150
200
250
300
350
0
50
100
150
200
250
300
350
2000 2002 2004 2006 2008 2010 2012 2014 2016 2018
Thousand personsThousand persons
Germany
Spain
United Kingdom
Italy
Belgium
Netherlands

48
OECD ECONOMIC SURVEYS: BULGARIA 2021 © OECD 2021
Figure 1.25. Income inequality and poverty are high
Household disposable income, 2018 or latest year available
Note: The Gini coefficient has a range from zero (when everybody has identical income) to 100 (when all income goes to only one person).
Relative poverty refers to the proportion below 50% of median household disposable income.
Source: OECD, Income Distribution database.
StatLink 2 https://stat.link/yvp9fc
The lowest incomes in Bulgaria have still converged as income growth for the bottom 20% exceeded
average real income growth across OECD countries during 2013-2018 (Figure 1.26, Panel B).
Nevertheless, Bulgarian top 20% incomes grew almost twice as fast, thus capturing the bulk of economic
development. Making growth more inclusive will require policy measures to address inequalities in
education (Chapter 2), include more people in the labour market and boost earnings for lower income
earners as well as improving the tax and transfer system to work for all. In this respect, addressing
undeclared work, mainly by the widespread use of envelope payments, remains a key challenge (Box 1.3).
Figure 1.26. Income inequality has risen fast because growth mainly benefitted top incomes
Note: Panel B shows annualised real growth of equivalised household disposable incomes for the bottom 20%, the mean and the top 20% of
the income distribution. GDP refers to average annual growth in GDP per capita. OECD is an unweighted average across 31 countries with
available data.
Source: OECD, Income Distribution and National Accounts databases.
StatLink 2 https://stat.link/snip75
0
5
10
15
20
25
30
35
40
45
50
SV
KC
ZE
SV
ND
NK
FIN
AU
TP
OL
NLD
DE
UIR
LC
HE
CE
EC
ES
TG
RC
HU
NO
EC
DK
OR
RO
ULV
ALT
UU
SA
TU
RB
GR
ME
XC
HL
CR
I
Gini (0-100)A. Income inequality
0
2
4
6
8
10
12
14
16
18
20
22
CZ
ED
NK
FIN
SV
NS
VK
NLD IR
LC
HE
AU
TP
OL
DE
UO
EC
DG
RC
CE
EC
LTU
ES
TC
HL
ME
XB
GR
KO
RT
UR
RO
ULV
AU
SA
HU
NC
RI
%B. Relative poverty
28
30
32
34
36
38
40
42
2006 2008 2010 2012 2014 2016 2018
A. Gini coefficientScale from 0 to 100
BulgariaUnited StatesOECDCEEC
0
1
2
3
4
5
6
7
8
9
10
BGR CEEC OECD
%
B. Household disposable income growth2013-2018
Bottom 20% Mean Top 20% GDP

49
OECD ECONOMIC SURVEYS: BULGARIA 2021 © OECD 2021
Poverty remains worryingly high according to all available measures (Figure 1.27, Panel A). While relative
poverty is slightly lower than in Hungary, Latvia and Romania (Figure 1.25), it has stayed close to 16% of
the population since the late 2000s. More than a quarter of the elderly and one fifth of children live in
relative poverty (Figure 1.27, Panel B). Although the persistently high levels partly reflects strong growth
in median disposable income that lifts the poverty threshold, more proactive measures are urgent to help
the most vulnerable. Poverty is particularly high among the Roma population, the low educated, the elderly,
and people with disabilities and in rural areas (World Bank, 2019; National Statistical Institute, 2018).
Figure 1.27. Poverty has remained at a high level, notably among children and elderly
Note: Absolute poverty refers to the proportion below the World Bank’s upper middle-income poverty line of USD 5.5 a day in 2011 PPP. Relative
poverty (respectively at-risk-of-poverty) refers to proportion below 50% (respectively 60%) of median household disposable income.
Source: OECD, Income Distribution database; World Bank, World Development Indicators database.
StatLink 2 https://stat.link/be7ohr
The high levels of poverty and soaring top incomes hold back the Bulgarian middle class from expanding
and thriving (Stoilova and Staneva, 2018). The presence of a strong and prosperous middle class is vital
for a healthy economy and society (OECD, 2019b), since their investment in education and support for
quality public services, trust and intolerance of corruption are key drivers of inclusive growth. Opportunities
for social advancement in Bulgaria are weak according to a range of social mobility measures and available
studies point to declining intergenerational mobility (Eurofound, 2017). The severe economic depression
in the late 1990s led to a sharp decline in educational performance of children from less well-off families
(Hertz et al., 2009) and high negative correlation between educational attainment and poverty, labour force
inactivity and social exclusion persist (European Commission, 2020b).
The government recently set ambitious policy goals to reduce inequality by more than seven Gini points
(to 33) and to reduce the share at-risk-of-poverty by more than five percentage points (to 18%) by 2030
(Bulgarian Government, 2019). Such targets can be useful for policy-making, yet back in 2010, the former
government set similar ambitious poverty goals for 2020 that were far from accomplished (Bulgarian
Government, 2013). This suggest a need for more focus on implementation and evaluation of measures
taken.
Improving labour market policies for higher participation and better jobs
A well-functioning labour market is key to deliver inclusive growth (OECD, 2018a). Total labour market
participation (age 15+) is almost 5 percentage points below the OECD average (Figure 1.28, Panel A),
mainly reflecting low participation of youth and the compositional impact of an ageing population. A strong
0
5
10
15
20
25
30
35
2006 2008 2010 2012 2014 2016 2018
%A. Poverty measures
At-risk-of-poverty
Relative poverty
Absolute poverty
0
5
10
15
20
25
30
35
2006 2008 2010 2012 2014 2016 2018
%B. Relative poverty for selected groups
Elderly poverty
Child poverty
Youth poverty
In-work poverty

50
OECD ECONOMIC SURVEYS: BULGARIA 2021 © OECD 2021
culture of full-time work, with less than 2% working part-time, may be an obstacle for certain groups’ labour
market participation, such as youth combining studying and part-time work as in many OECD countries or
seniors prolonging work life through a gradual withdrawal. While prime age women (age 25-54) and seniors
(age 55-64) have participation rates above the OECD and EU averages, there is still a gap to the upper
half of OECD countries across all sex and age groups. Women’s participation is held back by a
comparatively long maternity leave and insufficient access to childcare (World Bank, 2019). Specific
measures are needed to address very low participation of Roma, composing around 10% of the population,
especially Roma women facing multiple entry barriers (Chapter 3).
Figure 1.28. Labour market participation is low for youth and Roma
Note: Panel B refers to age 15-34.
Source: OECD, Labour Force Statistics database; Institute for Market Economics (IME) (2019), "Assessment of the People not in Employment,
Education and Training (NEETs) in Bulgaria and Policy Measures to Effectively Address their Integration", European Commission, VC/2019/017.
StatLink 2 https://stat.link/fi54le
Particularly concerning are extremely high rates of youth not in education, (formal) employment or training
(NEETs) among the Turkish and Roma populations (Figure 1.28, Panel B), whereas the share of NEETs
among ethnic Bulgarians is close to the EU average. Strong labour demand prior to the COVID-19 outbreak
helped to bring the overall share of NEETs down by more than 8 percentage points from 2013 to 2019.
However, the share of early school leavers remains high at 14% and it has not improved towards the
government’s target of 11% by 2020 set out in the national strategy to reduce early school leaving (BMES,
2013). The government has appointed youth and Roma mediators to promote labour market participation
and implemented mobile labour offices to reach rural and remote areas. Such targeted measures are
welcome and have a positive impact on employment according to available reviews (IME, 2019). The Youth
Guarantee programme initiated by the European Commission has also had some success in fostering
employment or training for youth, but since it targets unemployed, it only reached around 10% of NEETs
who are vastly inactive (European Commission, 2020c). Outreach of current support should be
strengthened and consideration given to extend the Youth Guarantee to cover all young adults with only
secondary education or less.
Overall coverage and spending on active labour market policies lag behind other countries (Figure 1.29).
Improving design and access to support would not only help to boost participation, but is also needed to
strengthen opportunities for upskilling and lifelong learning. Unemployment and inactivity are strongly
concentrated among low skilled, while people with disabilities have one of the lowest employment rates in
the EU.
0
10
20
30
40
50
60
70
80
Youth (15-24) Females Seniors (55-64) Total (15+)
%A. Labour force participation rate, 2019
Bulgaria CEEC OECD
0
10
20
30
40
50
60
70
80
Total Bulgarianethnicity
Turkishethnicity
Romaethnicity
%B. Not in education, employment or training, 2017

51
OECD ECONOMIC SURVEYS: BULGARIA 2021 © OECD 2021
Figure 1.29. Use of active labour market policies is low
Note: Covers activation measures in category 20-70.
Source: OECD Labour Force Statistics; European Commission.
StatLink https://stat.link/tmh0b3
The current patchwork of many small activation programmes and evaluations based on surveys of self-
reported outcomes (BMLSP, 2019) should be streamlined to make better use of resources. First, there is
a need for better monitoring as workers move through the stages of inactivity, unemployment and
employment to provide appropriate follow up with programme participants and perform proper quantitative
evaluations. For instance, the Nordic countries use digital tools to track worker status from social benefit
and tax records. Second, systematic evaluations of activation measures should be implemented to align
programmes with labour market needs and ensure efficient allocation of resources. In this respect,
reducing red tape and strengthening coordination across public services units and with employers are
essential for successful employment outcomes. Estonia and Lithuania have reformed and increased
spending on active labour market measures in recent years, helping to increase participation of more
disadvantaged groups.
Quality jobs with high earnings and low insecurity is a key aspect of the new OECD Jobs Strategy (OECD,
2018a), in addition to raising employment and inclusion. Job quality in Bulgaria is low due to high earnings
inequality and strict entitlement criteria for unemployment insurance, partly reflecting the widespread use
of envelope payments (Box 1.3). The real minimum wage has increased by more than 8% per year on
average since 2010, but at EUR 312 per month in 2020, it is still the lowest minimum wage in the EU and
lower than in most OECD countries, also when taking into account lower living costs. Available estimates
suggest that almost 9% of workers earned the minimum wage or less in 2014. Bulgaria has no legislation
to set criteria or targets for updating the minimum wage. A welcome decision was reached with social
partners in June 2020 to resume ongoing work to establish a transparent minimum wage setting
mechanism.
Improving educational outcomes and adult learning to boost skills for all is the prime tool to foster more
quality jobs and reduce earnings inequality (Chapter 2). Nevertheless, strengthening wage-setting
institutions and reforming tax-benefit systems would support a broader sharing of productivity gains
(OECD, 2018b). Collective bargaining in Bulgaria covers only 20-30% of employees, lower than in many
OECD countries but is still among the highest in Central and Eastern Europe (Kirov, 2019). As in most
OECD countries, eroding bargaining reflects falling trade union membership to less than 15% of employees
in 2016. Many employers likewise avoid membership of organisations, limiting collective bargaining mainly
to the public sector and heavy industry. The labour code allows for administrative extension of sector-level
0
2
4
6
8
10
12
14
RO
UG
RC
BG
RLV
ALT
UC
ZE
CH
ES
VN
DE
UC
EE
CS
VK
NLD
PO
LA
UT
OE
CD
IRL
HU
NF
INE
ST
DN
KLU
XB
EL
ES
P
% of labour force
A. Participants in active labour market programmes2018 or latest year available
0
10
20
30
40
50
60
ME
XR
OU
GR
CLV
AC
HL
BG
RS
VK
SV
NLT
UC
EE
CE
ST
IRL
KO
RO
EC
DD
EU
CZ
EP
OL
CH
EN
LD FIN
AU
TH
UN
DN
K
% of GDP per capita
B. Spending on activation measures per unemployed2018 or latest year available
52
OECD ECONOMIC SURVEYS: BULGARIA 2021 © OECD 2021
collective agreements, but the mechanism has not been used since 2016. The government has limited
options to influence wage setting, but through minimum wage and unemployment benefit levels it can help
to strengthen workers’ bargaining power.
Making the tax and benefit system work for all
Incentives to work from the tax and benefit system are comparatively strong, reflecting both low tax rates
and very modest social minimum benefits to those out of work. Bulgaria has a flat income tax of 10%,
introduced in 2008 to complement a similar flat corporate tax, with the aim of boosting growth by attracting
investment and high-skilled workers as well as strengthening tax collection. However, social security
contributions amount to 13.8% for employees and 19.2% for employers in 2019. As a result, labour income
is in effect taxed at a high and proportional rate (average tax wedge 43%), while low and proportional
taxation apply to capital income (see Figure 3.14 in Chapter 3). This results in a dual tax system with strong
incentives for incorporation. Moreover, the combined average tax rate from income taxation and
employees’ social security contributions is close to the OECD average for low-income workers, but
comparatively low for high-income workers (Figure 1.30). This is inefficient as it reduces labour demand
for low-skilled workers and hampers inclusion through income redistribution (Brys et al., 2016).

53
OECD ECONOMIC SURVEYS: BULGARIA 2021 © OECD 2021
Figure 1.30. No basic tax allowance results in tax rates for low incomes close to the OECD average
Average tax rate from personal income and social security contributions, 2019
Note: The average tax rate is calculated for a single household without children and housing costs at 20% of the average wage.
Source: OECD staff calculations using OECD TaxBen models.
StatLink 2 https://stat.link/gmducv
Many Eastern European countries have used flat tax systems, but gradually introduced more progressivity
as living standards improved. Latvia and Lithuania have replaced their flat tax with progressive taxation,
while Estonia has increased the basic tax allowance substantially. Bulgaria provides a tax allowance of
EUR 100 per child (Table 1.5), but has no basic tax allowance. Consideration should be given to reducing
the tax burden for lower-income households in the medium or longer term since this would support job
creation and labour market participation of low-skilled groups. Recent evidence across OECD countries
suggests that having more tax progressivity for lower-middle income levels is associated with higher long-
term output (Akgun et al., 2017). A tax reform focusing on reducing the tax burden for lower incomes could
be combined with an increase in the standard personal income tax rate to finance other recommendations
to boost growth and well-being in this Assessment. However, a possible tax increase should be delayed
until the recovery from the COVID-19 crisis is well advanced.
0
5
10
15
20
25
30
35
40
45
50
0
5
10
15
20
25
30
35
40
45
50
KO
R
ES
T
NZ
L
IRL
ES
P
CA
N
ISR
AU
S
GB
R
JPN
LUX
GR
C
SV
K
US
A
PR
T
CZ
E
BG
R
FR
A
NO
R
OE
CD
TU
R
LVA
ITA
CH
E
CE
EC
AU
T
PO
L
NLD IS
L
FIN
BE
L
SV
N
SW
E
LTU
HU
N
DN
K
DE
U
RO
U
% of gross income% of gross incomeA. Low-income earners (67% of average wage)
Personal income tax
Employees' social security contributions
0
5
10
15
20
25
30
35
40
45
50
0
5
10
15
20
25
30
35
40
45
50
KO
R
BG
R
ES
T
JPN
NZ
L
SV
K
CZ
E
ES
P
CA
N
LVA
PO
L
US
A
CH
E
GB
R
AU
S
FR
A
CE
EC
ISR
HU
N
TU
R
OE
CD
PR
T
NO
R
GR
C
IRL
AU
T
LTU
ISL
LUX
SV
N
FIN
RO
U
ITA
SW
E
DE
U
DN
K
NLD
BE
L
% of gross income% of gross incomeB. High-income earners (200% of average wage)
Personal income tax
Employees' social security contributions

54
OECD ECONOMIC SURVEYS: BULGARIA 2021 © OECD 2021
Table 1.5. Tax allowances in flat tax countries
Annual allowances in personal income taxation, EUR, 2019
Bulgaria Romania Hungary Estonia
Basic tax allowance No 1 285 No 6 000
Income phase-out in place - Yes - Yes
Family or children allowance 100 per child 403 per person in care
(child or family member)
2 160 per child
(higher for two or more children)
1 848 per child
(from the second child)
Income phase-out in place No Yes No No
Flat income tax rate 10% 10% 15% 20%
Source: OECD TaxBen models.
Reducing the tax burden for lower-income groups would also have an important impact on income
inequality. Combined income taxes, employees’ social contributions and social cash benefits currently do
little to support low-income households and reduce high income inequality (Figure 1.31; Hallaert, 2020).
The inequality-reducing effect is quantified by comparing the Gini coefficient for household incomes before
and after taxes and transfers for the working-age population. Bulgaria has comparatively high income
inequality before taxes and transfers with a Gini coefficient above 45. Cash transfers reduces the Gini
coefficient by a decent 13%, which given high ageing in Bulgaria may partly reflect the influence of public
pensions to pensioners that are still included in the working-age population (age 15-65). On the tax side,
there is almost no inequality reduction through personal income taxes and employees’ social security
contributions. Simulations based on the EUROMOD model suggest that an annual basic tax allowance of
EUR 2 800 for low incomes financed by an increase in the statutory tax rate could reduce relative poverty
by around 0.6 percentage point and inequality by 0.8 Gini points (Barrios et al., 2020).
Figure 1.31. Taxes and transfers do little to reduce high market income inequality
Percentage reduction in inequality by taxes and transfers, working-age population, 2018 or latest available year
Note: Inequality reduction is measured as the difference between Gini coefficients before and after taxes and transfers scaled by the Gini
coefficient for household incomes before taxes and transfers, see Causa and Hermansen (2017). The split between transfers and taxes is
computed using the Gini coefficient for income after transfers and before taxes. Taxes compose personal income taxes and employees’ social
security contributions, while transfers only include cash social benefits. Working-age population refers to age 18-65.
Source: OECD, Income Distribution database.
StatLink 2 https://stat.link/5e3lpm
5
10
15
20
25
30
35
40
45
50
55
-5
0
5
10
15
20
25
30
35
40
45
CH
L
CR
I
BG
R
CH
E
NZ
L
LTU
US
A
LVA
JPN
ISR
ES
T
GB
R
ISL
HU
N
CA
N
ITA
RO
U
CE
EC
AU
S
ES
P
OE
CD
SW
E
DE
U
LUX
SV
K
PO
L
PR
T
NLD
NO
R
CZ
E
GR
C
FR
A
AU
T
DN
K
SV
N
FIN
BE
L
IRL
Gini (0-100)% Transfers (left) Taxes (left) Inequality reduction (left) Gini before taxes and transfers (right)

55
OECD ECONOMIC SURVEYS: BULGARIA 2021 © OECD 2021
Nonetheless, the current flat income tax system has several advantages, which need to be weighed against
the potential gains from a reform. Having no exemptions ensures simplicity and transparency and provides
a robust tax base that has grown at a faster rate than the economy after the global financial crisis.
Introducing, for example, a basic tax allowance, could require a sizeable increase in the personal income
tax rate to be revenue neutral, although a phase out of the tax allowance for those with higher incomes as
in Estonia and Romania would reduce the revenue lost. Thorough cost-benefit analysis is thus warranted
when considering a reform of the flat tax system.
Public cash transfer schemes are in need of reform as well, not least to address persistently high poverty.
Spending on social cash benefits, excluding pensions, was only 3.1% of GDP in 2018, well below most
EU and OECD countries (Table 1.6). In addition, targeting of benefits is dire; only 15% of total cash
transfers went to the bottom 20% of the working-age population in 2018, well below the OECD average of
24%. The main reasons are high rates of non-take up among the poorest households combined with limited
and ineffective use of means-tested benefits. One study found that more than 40% of intended benefit
recipients did not take up the benefits to which they were entitled (Tasseva, 2016). At the same time, more
than 60% of social assistance claimants received benefits they were not entitled to as they could not pass
the income-test based on the information they subsequently reported in the study. Available cross-country
evidence suggests that these problems are similar or worse in Bulgaria compared to other Central and
Eastern European countries (Avram, 2013; Fonayet et al., 2020).
Table 1.6. Spending on social protection benefits is low
Social protection benefits, excluding old age and survivor, per cent of GDP, 2018
Bulgaria CEEC EU27
Cash and in kind
Cash benefits 3.1 3.7 5.5
In kind benefits 5.4 5.2 8.8
Means-testing
Means-tested benefits 0.5 0.6 2.4
Non means-tested benefits 8.0 8.4 11.9
Function
Sickness and health care 4.9 5.1 7.8
Disability 1.2 1.3 2.0
Family and children 1.7 1.8 2.2
Unemployment 0.5 0.4 1.2
Housing 0.0 0.1 0.4
Social exclusion not classified elsewhere 0.2 0.2 0.6
Total social protection benefits to working-age population 8.4 8.9 14.4
Memorandum: Old age and survivors benefits 8.0 8.3 12.3
Source: Eurostat, Social protection database (ESSPROS).
The benefit system in Bulgaria is fragmented, lacks coordination and targets individuals rather than families
(World Bank, 2019). There are no fewer than 15 different transfers created through different laws and
operated under different agencies and rules. The main non-contributory benefit schemes are:
Social Assistance based on the Guaranteed Minimum Income (GMI): This is a last resort benefit
granted to low income households, conditional on income and assets tests and differentiated by
age, family and housing arrangements. The benefit formula is complex and depends on income for
the preceding month. For 2020, the GMI is EUR 38 per month and a typical family with two children

56
OECD ECONOMIC SURVEYS: BULGARIA 2021 © OECD 2021
would be entitled to EUR 46 per month, which is substantially below the poverty line and other
countries (Figure 1.32).
Heating Allowance: Additional social assistance for heating is available for five months of the year
during winter. Entitlement criteria and benefit level follow a similar complex formula as for the GMI.
For 2019/2020, the base allowance is EUR 48 per month with actual benefits varying according to
the heating source, which can discourage investments to improve energy efficiency.
Benefits for Families with Children: A monthly allowance for bringing up a child until age 20 or
completion of secondary school is available for low-income families (less than EUR 250 per month).
Benefit provision is conditional on school attendance, but evidence suggest that sanctions are
rarely imposed. The maximum monthly benefit amount is EUR 20 per child in 2019. Other targeted
benefits and one-offs are also available, for instance for lone parents, upon childbirth, adoption and
first grade enrolment.
Figure 1.32. Minimum-income benefits are low
Guaranteed minimum income benefits, as a percentage of median disposable income, 2019
Note: Includes the heating allowance for Bulgaria.
Source: OECD, Benefits, Taxes and Wages database.
StatL https://stat.link/zrcfwh
Qualitative analysis has found that the high complexity of programmes causes confusion for social workers,
dealing with large amounts of paper work (Bogdanov and Zahariev, 2009). Similarly, claimants report that
the application process is long and cumbersome and that the benefit amount is too low to provide sufficient
income support.
The contributory benefit schemes, notably unemployment insurance, are likewise hard to access and with
short duration. At least 12 months of employment during the latest 18 months are required to qualify for
unemployment benefits and right to the maximum benefit period of 12 months requires no less than 15
years of employment. With less than three years of work, only four months of benefits can be claimed.
These maximum durations are lower than in most OECD countries and penalises especially the youth and
those with unstable careers. The benefit level is generally 60% of previous gross income with an upper
ceiling of EUR 825 and a minimum level of EUR 100 per month, resulting in a comparatively high net
replacement rate about 77% for low-wage earners. However, around 30% of the unemployed receive
insurance benefits of less than EUR 250 per month insufficient to escape relative poverty, reflecting that
they previously only worked part-time or part of the year (Stoilova and Staneva, 2018).
0
10
20
30
40
50
60
70
80
0
10
20
30
40
50
60
70
80
US
A
RO
U
BG
R
ITA
HU
N
SV
K
LTU
CA
N
ISR
PR
T
CE
EC
CZ
E
LVA
GR
C
PO
L
ES
P
ES
T
KO
R
AU
S
OE
CD
SV
N
NO
R
FR
A
BE
L
LUX
NZ
L
AU
T
DE
U
SW
E
CH
E
ISL
FIN
GB
R
IRL
NLD
DN
K
JPN
%%
Single person without children Couple with 2 children

57
OECD ECONOMIC SURVEYS: BULGARIA 2021 © OECD 2021
Because of low and hard accessible benefits, many families are strongly dependent on private transfers
from relatives working abroad. Aggregate remittances inflow amounted to 3.4% of GDP in 2019 (World
Bank), higher than in any OECD country. While remittances help to secure a living, there are indications
that they may harm incentives for labour market participation (IME, 2019). Moreover, such income streams
can stop abruptly as the COVID-19 shock has shown.
Bulgaria should reform the social benefit system by easing entitlement criteria and increasing generosity,
while improving incentives and active support for labour market participation. For instance, a family of three
living in a flat with more than two rooms is not eligible for social assistance, independent of the size of each
room. A 2016 reform made some progress by combining all benefits for children with disabilities into one
scheme. Several Eastern European countries have reformed their tax-benefit systems to strengthen
inclusion, including Lithuania in 2017-2018 with a New Social Model reform that increased coverage and
generosity of unemployment benefits and raised tax progressivity (OECD, 2018c). Simplification of benefit
schemes could also be considered as in the United Kingdom, which replaced six means-tested schemes
with the Universal Credit. Combining some of the many available benefits for children in Bulgaria could
help to ease the administrative burdens. At the very least, there is a need to uprate social benefits more
systematically to inflation. Currently, adjustment is irregular and can be delayed for a long time, for instance
the GMI was nominally fixed from 2009 to 2017.
Promoting public integrity and succeeding in the fight against corruption
Over the past decade, Bulgaria has made substantial progress by consolidating its legal and institutional
framework concerning administrative and judicial reform, and by strengthening the fight against corruption
and tackling organised crime. In 2020, charges have been brought in a number of high-level investigations
of corruption (European Commission, 2020d). Although corruption perception has declined since the late
1990s and despite many reforms, it has stagnated at a high level compared to OECD countries and
remains an issue for both the public (Figure 1.33; European Commission, 2020e) and companies operating
in the country (WEF, 2018; Worldwide Governance Indicators, 2019; GAN Integrity, 2017). While it takes
time for reforms to show results and change perceptions, Bulgaria has not yet established a coherent
public integrity system and it still lacks a solid record of convictions in high-level corruption cases
(European Commission, 2019a; 2020d; Anti-Corruption Fund, 2020). Moreover, some appointment
procedures to the anti-corruption institutions and judiciary caused public controversy and anti-corruption
street protests have been ongoing since early July 2020 (Hope, 2020). Building public trust and gaining a
reputation of independence and professionalism of the anti-corruption and judiciary institutions will thus be
essential for the governance reforms to succeed.
The impact of corruption on economic performance is significant, as it affects the business climate, distorts
markets and impedes effective service delivery (Chapter 2; IMF, 2019b). Corruption has also been found
to be among the factors that discourage labour market participation and incentivise emigration (Cooray
and Dzhumashev, 2018; Cooray and Schneider, 2016), both critical constraints for growth in Bulgaria. By
building on the implemented governance reforms, Bulgaria could reduce the economic costs of corruption
and accelerate income convergence. Estimates based on cross-country evidence suggest that closing half
of the gap to the OECD average for the control of corruption indicator (Figure 1.33, Panel C) would boost
GDP per capita by almost 5% in 10 years (Box 1.5). While such estimates are uncertain and the indicator
captures institutional quality in a broad sense, the magnitude is nevertheless larger than all other quantified
reforms combined.
According to the 2019 monitoring report under the EU’s Cooperation and Verification Mechanism, Bulgaria
has made sufficient progress in all its six focus areas to exit the mechanism (European Commission,
2019b). It was set up at the time of EU accession to ensure continued reform progress of the judiciary and
in the fight against corruption and organised crime. The Commission likewise assessed advancements on

58
OECD ECONOMIC SURVEYS: BULGARIA 2021 © OECD 2021
governance of state-owned enterprises (Chapter 2) and implementation of anti-money laundering
framework to be sufficient to allow entry into ERM II by July 2020 (cf. above). However, the recent EU rule
of law assessment pointed to continued challenges in delivering concrete results (European Commission,
2020d) and the Commission has not yet formally closed the Cooperation and Verification mechanism for
Bulgaria.
Figure 1.33. Corruption is perceived as high
Note: Panel B shows the point estimate and the margin of error. Panel D shows sector-based subcomponents of the “Control of Corruption”
indicator by the Varieties of Democracy Project.
Source: Panel A: Transparency International; Panels B & C: World Bank, Worldwide Governance Indicators; Panel D: Varieties of Democracy
Institute; University of Gothenburg; and University of Notre Dame.
StatLink 2 https://stat.link/1as95z
The reforms have strengthened the roles of the specialised prosecutors, the anti-corruption agency, the
internal inspectorates and the chief inspectorate under the Prime Minister’s office in implementing integrity
standards (European Commission, 2019b). However, to ensure that institutional responsibilities of the
various bodies do not result in fragmented action and undermine implementation, the government should
continue to use coordination mechanisms between entities at the national and subnational levels, such as
formal councils, informal exchange of information or networks, as well as build on defined reporting
procedures. Moreover, ensuring that key oversight actors, including the anti-corruption agency and the
National Anti-Corruption Policy Council have the necessary financial and human resources will also be
critical to ensure they fulfil their mandate.
To safeguard judicial independence and the rule of law, Bulgaria should implement accountability
mechanisms for the Prosecutor General and improve the governance of judges (Council of Europe, 2020;
0
10
20
30
40
50
60
70
80
90
ME
X
CO
L
TU
R
BG
R
HU
N
RO
U
GR
C
SV
K
CZ
E
LVA
CR
I
PO
L
KO
R
SV
N
CH
L
US
A
ES
T
IRL
AU
T
DE
U
NLD FIN
DN
K
A. Corruption Perceptions IndexScale: 0 (worst) to 100 (best), 2019
-1.0
-0.5
0.0
0.5
1.0
1.5
2.0
2.5
ME
XT
UR
CO
LB
GR
RO
UG
RC
HU
NLV
AS
VK
CZ
EC
RI
KO
RP
OL
SV
NC
HL
US
AE
ST
IRL
AU
TD
EU
NLD
DN
KF
IN
B. Control of corruptionScale: -2.5 (worst) to 2.5 (best), 2018
-0.6
-0.4
-0.2
0.0
0.2
0.4
0.6
0.8
1.0
1.2
1.4
1996 2000 2004 2008 2012 2016
C. Evolution of "Control of Corruption"Scale: -2.5 (higher) to 2.5 (lower corruption), 2018
OECD
CEEC
BGR
0.0
0.2
0.4
0.6
0.8
1.0Executive bribery
Executiveembezzlement
Public sectorbribery
Public sectorembezzlement
Legislaturecorruption
Judicial corruption
D. Corruption by sector, "Control of Corruption"Scale: 0 (worst) to 1 (best), 2018
OECD
CEEC
BGR

59
OECD ECONOMIC SURVEYS: BULGARIA 2021 © OECD 2021
Venice Commission, 2020). Specifically, concerns have been raised regarding the Prosecutor General’s
power to influence cases and essential immunity from criminal investigation of himself (Council of Europe,
2020; European Commission, 2020d). In 2020, the Constitutional Court clarified that a Prosecutor General
cannot exert his supervisory and methodological guidance role in cases against himself. However, in
practice a criminal investigation against the Prosecutor General is unlikely to be opened since all
investigators and prosecutors are subordinated to him and no practical possibility for suspending the
Prosecutor General exists (Venice Commission, 2019; 2020). Reform is ongoing to address this long-
standing issue by appointing a special prosecutor, following recommendations by the Venice Commission
(2019; 2020). Resolving all concerns raised, including on appointment procedures (European Commission,
2020d), will be vital to signal commitment and build public trust. A draft law on accountability of the
Prosecutor General is pending at the National Assembly and will be discussed upon receiving the Venice
Commission’s Opinion.
Internal control functions of public agencies have been improved, including the use of corruption risk
assessments in the development and implementation of sectoral plans. Following an assessment,
agencies are required to assign responsibilities, mandates and measures to address the corruption risks.
The Anti-Corruption Commission prepares an analysis of all anti-corruption plans of ministries and state
agencies. The National Anti-corruption Policy Council monitors their implementation and issues decisions
with recommendations. Effective implementation of the risk assessment plans and the Council’s
recommendations would contribute to embedding a robust risk management culture, and improving fraud
prevention and detection within public institutions. By increasing resilience to fraud and corruption, public
institutions ensure taxpayers’ money and public funds are not diverted from their intended use, thus
contributing to strengthening socio-economic development and building trust in the government’s actions.
In recent years, several cases of policy capture by private interests have been identified, such as the
bankruptcy of the Corporate Commercial Bank in 2014, which was at the centre of an informal network of
business and political elites (BTI Project, 2018), and is still being considered by the court. Several high-
ranking officials, including the head of the anti-corruption agency, resigned in 2019 following allegations of
acquisition of real estate below market prices, but subsequent inspections did not lead to claims of conflict
of interest (Anti-Corruption Fund, 2020). Coupled with these cases, 78% of citizens surveyed feel that
political connections are essential for business success. These relations negatively affect public decisions
and the business environment, as a large majority (84%) agreed or tended to agree that “too close links
between business and politics in Bulgaria lead to corruption” (European Commission, 2020e).
Established companies may have an interest in creating entry barriers to the markets or maintaining a
status quo. They may invest into building and maintaining networks of reciprocity with public officials to
influence public decision-making processes (OECD, 2017b). This may contribute to discouraging new
businesses and innovators who lack the knowledge of administrative processes and contacts in the public
administration (OECD, 2017b; SGI, 2018). Strengthening transparency on media ownership in a country
that ranks 111 out of 180 countries on the World Press Freedom Index (Reporters Without Borders, 2020),
down from 87 in 2013, and where media has significant influence on political life (Ganev et al., 2018; BTI
Project, 2018; European Commission, 2020d) would contribute to improving the integrity of public decision-
making processes. To mitigate risks of policy capture and undue influence, the government should also
introduce legislation to regulate lobbying activities. This legislation could aim to enhance transparency of
interests and influences affecting the design, assessment, monitoring and reform of public decisions. To
improve detection of possible integrity breaches, procedures and protection of whistle-blowers likewise
need strengthening. Bulgaria will implement the EU Directive on whistle-blower protection by 2022 and it
should use this opportunity to encourage officials to use the mechanisms and enhance people’s
acceptance of whistle-blower activities.

60
OECD ECONOMIC SURVEYS: BULGARIA 2021 © OECD 2021
Table 1.7. Recommendations on macroeconomic and selected structural policies
MAIN FINDINGS RECOMMENDATIONS (key recommendations are in bold)
Fiscal and financial policy to mitigating the impact of COVID-19
Bulgaria entered the pandemic in a strong fiscal position and has put in place a fiscal support package during the pandemic.
Extend the duration of fiscal support measures to families and firms, and expand them in case of a resurgence of the pandemic.
Ensure an effective and rapid use of the available European Union funding to support the recovery.
Once the recovery is well underway, move back towards a balanced budget by increasing revenues and improving spending efficiency, and longer term continue ensuring fiscal sustainability.
The 60:40 wage subsidy scheme has protected jobs and household incomes from the impact of the COVID-19 shock. The health system will need to increase capacity to deal with the large growth in COVID-19
infections and to prepare for the COVID-19 vaccination programme.
Establish additional benefit and employment programmes to protect those not covered by the social safety net and help people
move to new jobs.
Strengthen capacity of the health system to deal with the COVID-19
pandemic and rapidly implement the vaccination programme.
Non-performing loans have been reduced, but remain well above OECD average levels. Deteriorating economic prospects are expected to
adversely affect asset quality in view of the potential worsening of the financial situation of firms and households as a result of COVID-19
pandemic.
Deepen liquidity support to firms and households through the
financial sector, if warranted.
After integrating into regional and global value chains, the challenge is now to boost the domestic value added of gross exports generated
through this activity.
Focus innovation support on domestic firms engaging in the supply of
inputs to multinational/foreign firms.
Spending pressures related to the ageing population could rise by more than expected. Low retirement incomes could lead to growing social pressure to increase their adequacy.
Accelerate the equalisation of the pension age for women and men.
Increase the retirement age to link it to improvements in life expectancy.
Supporting decarbonisation of the economy
Coal accounts for almost half of energy production and is an important source of high air pollution and greenhouse gas emissions. Pricing of the environmental costs of fossil fuels is uneven across sectors.
Gradually remove support for fossil fuels and align carbon prices for sectors outside of the EU Emissions Trading System (ETS),
while protecting poorer households.
Support reskilling and relocation of displaced workers in coal
regions.
Energy efficiency is lower than in most OECD countries, notably in the residential building sector.
Continue to support housing renovation and improve targeting to
low-income groups.
Provide information about the benefits of energy saving
investments to households.
Improving inclusiveness
The share of youth not in education, employment or training is high,
especially among the Turkish and Roma populations.
Improve outreach of current support services and expand the Youth
Guarantee Programme.
Coverage and spending on active labour market programmes are low. Invest more in coverage and quality of active labour market
policies.
Implement systematic impact assessment of active labour market
programmes to focus funding on those that are effective.
Collective bargaining has declined and only covers 20-30% of employees. While the minimum wage has increased robustly, it remains low at just EUR 312 per month in 2020 and has no target or indexation
mechanism to ensure future increases.
Collaborate with social partners to install a transparent and objective minimum wage setting mechanism to reflect inflation and productivity
growth.
The flat personal income tax of 10% with no basic tax allowance combined with social security contributions places a high tax burden on lower-income households compared to other countries. Nonetheless, potential gains from a reform need to be weighed against the advantages
of the current tax system.
Consideration should be given to reducing the tax burden for lower-
income individuals in the medium or longer term.
Spending on social protection benefits is comparatively low and benefits are poorly targeted to the lowest income households, reflecting high non-
take up combined with limited and ineffective means testing.
Relax entitlement criteria and increase generosity of social benefits.
Streamline and simplify multiple and complex means-tested social
benefit schemes, notably for families with children.
Improving governance for a stronger post-COVID-19 recovery
In spite of significant governance reforms, key integrity and anti-corruption institutions are not forming a coherent public integrity system,
resulting in fragmented action and limited impact.
Provide the integrity and anti-corruption institutions with the necessary responsibilities, coordination mechanisms and
resources to fulfil their role.

61
OECD ECONOMIC SURVEYS: BULGARIA 2021 © OECD 2021
Judicial reform has made substantial progress, but accountability needs further strengthening and judicial independence needs to be
safeguarded.
Implement an effective and transparent accountability mechanism
for the Prosecutor General in line with international standards.
Enhance judicial independence in relation to the probation period
in appointing judges and the composition of the Supreme Judicial
Council.
Several cases of vested interests between businesses and political elites have been identified in recent years. There is no regulation of lobbying activities and international rankings suggest challenges in ensuring
media freedom.
Introduce lobbying regulation, including a code of conduct for the
engagement of lobbyists with members of Parliament.
Protect the independence of media to ensure the integrity of public
decision-making processes.
Whistle-blowing mechanisms and protections are comparatively weak. Implement the EU whistle-blower Directive and launch a campaign
to enhance officials and the public’s acceptance of whistle blowing.
References
Akgun, O., B. Cournède and J.M. Fournier (2017), “The effects of the tax mix on inequality and growth”,
OECD Economics Department Working Papers, No. 1447, OECD Publishing, Paris,
https://doi.org/10.1787/c57eaa14-en.
Anti-Corruption Fund (2020), Anti-Corruption Institutions: Activity Without Visible Results.
Association of Banks in Bulgaria (2020), Quarterly Bulletin, Issue 62, July 2020.
Avram, S. (2013), “Outcomes of social assistance in Central and Eastern Europe: A pre-transfer post-
transfer comparison”, ISER Working Paper Series, No. 2013-18.
Barrios, S. et al. (2020), “Progressive Tax Reforms in Flat Tax Countries”, Eastern European Economics,
Vol. 58/2, pp. 83-107.
BME and BMEW/Bulgarian Ministry of Energy and Ministry of Environment and Water (2020), Integrated
Energy and Climate Plan of the Republic of Bulgaria, 2021-2030.
BMES/Bulgarian Ministry of Education and Science (2013), Strategy for reducing the share of early
school leavers (2013-2020).
BMLSP/Bulgarian Ministry of Labour and Social Policy (2019), Elaboration of a subsequent assessment
of the effect of the active labour market policy financed by state budget resources at individual level
(net effect) of the programs and measures, included in the national employment action plan for 2017.
Bogdanov, V. and Zahariev, B. (2009), Analysis of the situation in relation to minimum income schemes
in Bulgaria. A study of national policies, European Commission.
Brys, B. et al. (2016), “Tax design for Inclusive Economic Growth”, OECD Taxation Working Papers, No.
26, OECD Publishing, Paris, https://doi.org/10.1787/5jlv74ggk0g7-en.
BTI Project (2018), Bulgaria Country Report, Bertelsmann Transformation Atlas, Bertelsmann Stiftung.
Bulgarian Government (2019), Bulgaria 2030: National Development Programme.
Bulgarian Government (2013), National strategy for reducing poverty and promoting social inclusion
2020.
Bulgarian National Bank (2020), Economic Review, Issue 1/2020.
Causa, O. and M. Hermansen (2017), “Income redistribution through taxes and transfers across OECD
countries”, OECD Economics Department Working Papers, No. 1453, OECD Publishing, Paris,
https://doi.org/10.1787/18151973
Cooray, A. and F. Schneider (2016), “Does corruption promote emigration? An empirical examination”,
Journal of Population Economics, Vol. 29/1, pp. 293-310.
Cooray, A. and R. Dzhumashev (2018) “The effect of corruption on labour market outcomes”, Economic
Modelling, August, pp. 207-218.

62
OECD ECONOMIC SURVEYS: BULGARIA 2021 © OECD 2021
Council of Europe (2020), Decision by the Committee of Ministers of the Council of Europe on Kolevi v.
Bulgaria, 3 September 2020, CM/Del/Dec(2020)1377bis/H46-9.
Di Ubaldo, M., M. Lawless and I. Siedschlag (2018), "Productivity spillovers from multinational activity to
local firms in Ireland", OECD Productivity Working Papers, No. 16, OECD Publishing, Paris,
https://doi.org/10.1787/58619717-en.
Égert, B. and P. Gal (2017), "The quantification of structural reforms in OECD countries: A new
framework", OECD Economics Department Working Papers, No. 1354, OECD Publishing, Paris,
https://doi.org/10.1787/2d887027-en.
Eurofound (2017), Social Mobility in the EU.
European Central Bank (2019), ECB concludes comprehensive assessment of six Bulgarian banks,
Press Release, 26 July 2019.
European Commission (2020a), “Undeclared Work in the European Union”, Special Eurobarometer 498
– September 2019.
European Commission (2020b), Country Report Bulgaria 2020.
European Commission (2020c), Youth Guarantee country by country: Bulgaria.
European Commission (2020d), 2020 Rule of Law Report: Country Chapter on the rule of law situation in
Bulgaria.
European Commission (2020e), “Corruption”, Special Eurobarometer 502 – June 2020.
European Commission (2019a), Progress in Bulgaria under the Cooperation and Verification Mechanism,
Technical report.
European Commission (2019b), Progress in Bulgaria under the Cooperation and Verification Mechanism,
Progress report.
European Commission (2018a), The 2018 Ageing Report: Economic and Budgetary Projections for the
EU Member States (2016-2070), Institutional Paper, No. 79.
European Commission (2018b), Volume I: Current and future income adequacy in old age in the EU,
Pension Adequacy Report 2018.
European Commission (2017), “Impact of fiscal policy on income distribution”, Report on Public Finances
in EMU 2017, pp. 71-131.
Fonayet, F., Á. Eraso and J. Sánchez (2020), “Efficiency of Social Expenditure Levels in Reducing
Poverty Risk in the EU-28”, Poverty & Public Policy, Vol. 12/1, pp. 43-62.
GAN Integrity (2017), Bulgaria Corruption Report.
Ganev, G., M. Popova and F. Bönker (2018), Bulgaria Report, Sustainable Governance Indicators,
Bertelsmann Stiftung.
Guillemette, Y., et al. (2017), "A revised approach to productivity convergence in long-term scenarios",
OECD Economics Department Working Papers, No. 1385, OECD Publishing, Paris,
https://doi.org/10.1787/0b8947e3-en.
Hallaert, J.-J. (2020), “Inequality, Poverty, and Social Protection in Bulgaria”, IMF Working Paper, No.
20/147.
Hertz, T., M. Meurs and S. Selcuk (2009), “The Decline in Intergenerational Mobility in Post-Socialist
Bulgaria”, World Development, Vol. 37/3, pp. 739-752.
Hope, K. (2020), “Bulgarian PM under pressure amid anti-corruption protests”, Financial Times, 16 July
2020.
IEA (2019), World Energy Outlook 2019, OECD Publishing, Paris, https://doi.org/10.1787/caf32f3b-en.
IMF (2019a), “Corporate Productivity in Bulgaria”, Selected Issues, IMF Country Report, No. 19/84.
IMF (2019b), “Bulgaria’s Governance Reforms”, Selected Issues, IMF Country Report, No. 19/84.

63
OECD ECONOMIC SURVEYS: BULGARIA 2021 © OECD 2021
IME/Institute for Market Economics (2019), Assessment of the people not in employment, education and
training (NEETs) in Bulgaria and policy measures to effectively address their integration, European
Commission, VC/2019/017.
Ivanova, N., and E. Ivanov (2017), “The role of Bulgaria in global value chains”, Bulgarian National Bank
Discussion Paper, DP/105/2017.
JRC/Joint Research Centre (2018), EU coal regions: Opportunities and challenges ahead, JRC Science
for Policy Report.
Kirov, V. (2019), “Bulgaria: collective bargaining eroding, but still existing”, Chapter 4 in Müller, T. et al.
(eds.), Collective bargaining in Europe: towards and endgame, Vol. I, European Trade Union Institute
(ETUI).
Kummritz, V., D. Taglioni and D. Winkler (2017), “Economic upgrading through global value chain
participation : which policies increase the value added gains?”, Policy Research Working Paper, No.
8007, World Bank Group.
Medina, L. and F. Schneider (2017), “Shadow Economies Around the World: New Results for 158
Countries Over 1991-2015”, CESifo Working Paper Series, No. 6430.
Muir, D. and A. Weber (2013), “Fiscal Multipliers in Bulgaria: Low But Still Relevant”, IMF Working
Papers, No. 13/49.
National Statistical Institute (2018), Poverty mapping in the Republic of Bulgaria.
NEA (2020), Nuclear power and the cost-effective decarbonisation of electricity systems, NEA Policy
Brief.
OECD (2020a), OECD Economic Outlook, Interim Report September 2020,
https://doi.org/10.1787/34ffc900-en.
OECD (2020b), OECD Economic Outlook, Volume 2020 Issue 2, No. 108, OECD Publishing, Paris,
https://doi.org/10.1787/39a88ab1-en.
OECD (2020c), COVID-19 and the low-carbon transition. Impacts and possible policy responses, OECD
Policy Responses to Coronavirus (COVID-19), OECD Publishing, Paris.
OECD (2019a), OECD Review of the Corporate Governance of State-Owned Enterprises: Bulgaria.
OECD (2019b), Under Pressure: The Squeezed Middle Class, OECD Publishing, Paris,
https://doi.org/10.1787/689afed1-en
OECD (2018a), Good Jobs for All in a Changing World of Work: The OECD Jobs Strategy, OECD
Publishing, Paris, https://doi.org/10.1787/9789264308817-en.
OECD (2018b), OECD Employment Outlook 2018, OECD Publishing, Paris,
http://dx.doi.org/10.1787/empl_outlook-2018-en.
OECD (2018c), OECD Economic Surveys: Lithuania 2018, OECD Publishing, Paris,
https://doi.org/10.1787/eco_surveys-ltu-2018-en.
OECD (2017a), Preventing Ageing Unequally, OECD Publishing, Paris,
https://doi.org/10.1787/9789264279087-en.
OECD (2017b), Preventing Policy Capture: Integrity in Public Decision Making, OECD Public
Governance Reviews, OECD Publishing, Paris, http://dx.doi.org/10.1787/9789264065239-en.
Reporters Without Borders (2020), Bulgaria: Black sheep of the European Union.
Schneider, F. (2016), “Estimating the Size of the Shadow Economies of Highly-developed Countries:
Selected New Results”, CESifo DICE Report, Vol. 14/4, pp. 44-53.
SE3Tnet (2020), Accelerated lignite exit in Bulgaria, Romania and Greece.
SGI/Sustainable Governance Indicators Network (2018), Bulgaria Report, Sustainable Governance
Indicators 2018, Bertelsmann Stiftung.

64
OECD ECONOMIC SURVEYS: BULGARIA 2021 © OECD 2021
Solt, F. (2020), “Measuring Income Inequality Across Countries and Over Time: The Standardized World
Income Inequality Database”, Social Science Quarterly, Vol. 101/3, pp. 1183-1199.
Stoilova, R. and M. Staneva (2018), The Middle Class in Bulgaria, in: Siegmann, A. and M. Schäfer
(eds.), No Robots: The Position of Middle-Class Households in Nine European Countries, Nieuwe
Haagsche.
Taglioni, D. and D. Winkler (2016), Making global value chains work for development, The World Bank.
Tasseva, I. (2016), “Evaluating the performance of means-tested benefits in Bulgaria”, Journal of
Comparative Economics, Vol. 44/4, pp. 919-935.
Venice Commission (2020), Urgent interim opinion on the draft new constitution, Opinion No. 1002/2020.
Venice Commission (2019), Opinion on draft amendments to the Criminal Procedure Code and the
Judicial System Act, concerning criminal investigations against top magistrates, Opinion No.
968/2019.
WEF/World Economic Forum (2018), The Global Competitiveness Report 2018.
Williams, C. and J. Yang (2017), “Tackling Falsely-Declared Salaries in Bulgaria: Evidence from a 2015
Survey”, Economic Alternatives, Issue 3, pp. 333-351.
World Bank (2019), Harmonizing services for inclusive growth: Improving access to essential services for
vulnerable groups in Bulgaria, Technical report.


