1 | Page Economic consequences of terrorism: Geography matters Abstract Terrorism can impose significant costs on an economy. This paper analyses the effect of geography on terrorism. In particular, this paper hypothesizes that a terrorist attack in financial hubs of a country will have significantly higher economic cost than a similar attack in a remote part of the country. In particular, we focus on the case study of Pakistan and Net Foreign Direct Investment (NFDI). We find that terrorism in financial hubs of Pakistan has imposed a significant cost on NFDI, but similar attacks in remote areas have had insignificant impacts. This heterogeneity of the geography of terrorism has long been ignored in the literature, and as such is likely to be a significant contribution. Omer Majeed Australian National University.
Transcript
1 | P a g e
Economic consequences of terrorism: Geography
matters
Abstract
Terrorism can impose significant costs on an economy. This paper analyses
the effect of geography on terrorism. In particular, this paper hypothesizes that
a terrorist attack in financial hubs of a country will have significantly higher
economic cost than a similar attack in a remote part of the country.
In particular, we focus on the case study of Pakistan and Net Foreign Direct
Investment (NFDI). We find that terrorism in financial hubs of Pakistan has
imposed a significant cost on NFDI, but similar attacks in remote areas have
had insignificant impacts. This heterogeneity of the geography of terrorism
has long been ignored in the literature, and as such is likely to be a significant
contribution.
Omer Majeed
Australian National University.
2 | P a g e
1. Introduction
Terrorism1 can impose significant costs on the economy. One of the major
costs associated with terrorism is the number of lives lost and permanent
health injuries. Some of the other significant costs include reductions in
economic growth (Blomberg et al., 2004, Eckstein and Tsiddon, 2004), Net
Foreign Direct Investment (NFDI) (Enders and Sandler, 1996), trade (Nitsch
and Schumacher, 2004) and tourism (Enders et al., 1992).
This paper argues that the economic costs of a terrorist incident vary by the
geography of the terrorist incident. In particular, we argue that a terrorist
attack in one of the financial hubs of a country will have a significantly higher
impact on the economy than a similar attack in a remote area. For the purpose
of this paper we define a financial hub to be a high economic activity area of
the country.
To the best of our knowledge, previous studies in the literature have not
disaggregated terrorist attacks by location of where they happen within a
country. As such this is identified as a significant contribution to the literature
and is likely to have important policy implications.
Attacks in a financial hub, as opposed to remote areas, are likely to cause
higher economic costs for the following five reasons: i) attacks in a financial
hub would get more media coverage than a remote area would, and as such is
likely to affect consumer and business confidence more; ii)an attack in major
city/economic hub is likely to cause a bigger psychological impact; iii) such an
attack is also likely to disrupt activity of a larger section of the economy; iv)
the financial sector of the economy, including stock exchange and the banking
1We use the definition of Enders and Sandler for terrorism: “Terrorism is the premeditated
use or threat to use violence by individuals or subnational groups to obtain a political or social objective through the intimidation of a large audience beyond that of the immediate victim”. ENDERS, W. & SANDLER, T. 2006. The political economy of terrorism, Cambridge University Press.
3 | P a g e
sector, are usually located in the financial hubs of an economy. Given this, an
attack in a financial hub of a country is more likely to reverberate through the
financial sector; and v) an attack inside the financial hub is likely to cause
more infrastructure and property damage. Based on this, the main hypothesis
of this paper is: economic costs of a terrorist incident vary by the geography of
the terrorist incident.
This paper investigates the heterogeneity of the terrorist attacks on economic
costs by analysing the case study of Pakistan. The choice of country for case
study is determined by two factors: i) the country had to experience terrorism
in financial hubs of the country as well as remote areas of the country; and ii)
terrorism incidents had to be prevalent for a long enough period to alter the
economic behaviour of the stakeholders in the country. Terrorism in Pakistan
has occurred all over the country, including remote areas and financial hubs.
In addition, Pakistan has experienced persistent and significant number of
terrorist attacks since 2001. Given these reasons, Pakistan provides a good
study to analyse whether economic costs vary by the location of the terrorist
attack.
To test the main hypothesis that the costs of a terrorist attack vary by
geography we employ a Vector Autoregression (VAR) approach to look at the
interaction between terrorism and NFDI in Pakistan. We choose NFDI for
three reasons. Firstly, analysing NFDI gives this paper a base point to compare
with the growing literature on terrorism and foreign direct investment (FDI)
(Muckley, 2010, Abadie and Gardeazabal, 2008, Enders and Sandler, 1996,
Enders et al., 2006, Bandyopadhyay et al., 2011, Sandler and Enders, 2004,
Mancuso et al., 2010). Secondly, FDI is likely to be sensitive to terrorism
because, ceteris paribus, foreign investors are likely to show risk aversion to
terrorism and divert their capital to safer place. Lastly, FDI is available in
monthly terms since July 2001. Other real variables such as GDP,
consumption and total investment are only available at annual level from 1973
4 | P a g e
onwards. An econometric analysis using these variables would yield a
significant degrees of freedom problem, especially for VAR analysis.
The main results of this paper confirm the main hypothesis that the location of
terrorist attack matters. In particular the impulse response functions (IRF)
from VAR show that terrorist attacks in major cities have high and statistically
significant reduction in FDI, but at the same time a similar attack in a remote
area does not affect FDI. According to our estimates, terrorism in economic
hubs of Pakistan reduced NFDI by around 10.7 per cent or around 3.0 billion
US dollars (2009 prices). These results are similar to Enders and Sandler’s
(1996) results on the effect of terrorism in Spain and Greece.
The rest of the paper is organized as follows. Section 2 talks about the
economic reasoning of why geography matters for a terrorist attack, section
gives the background of terrorism in Pakistan, section 3 describes data,
whereas section 4 gives the econometric methodology, section 5 gives the
results, section 7 analyses the accumulated effect of terrorism on NFDI and
section 7 concludes and evaluates policy implications.
2. Economic reasoning
As mentioned before, there are five main reasons why a terrorist attack in an
economic hub, like a major city, would have a higher economic cost than a
similar terrorist attack in a remote area. First, a terrorist attack in a major city
is likely to attract bigger media coverage. This extra media coverage is likely
to dampen both consumer and business confidence. This can be particularly
relevant for foreign investors as it can be hypothesized that FDI has a high
elasticity to terrorism.
Second, an attack in a major city is also likely to have a bigger psychological
impact, as this signals to various stake holders that the state may be weak and
5 | P a g e
that the terrorist may be well organized. Such kinds of a signal may force
stake holders to rationally expect future terrorist attacks and as such they
would be forced to alter their behaviour. This may be particularly bad for
foreign investors.
Third, there are more businesses, employees and economic activity in a major
city as opposed to a remote area. As such, disruption in a major city is likely to
cause higher economic costs than disruptions in remote areas.
Fourth, Financial institutions such as stocks markets, banks and other financial
intermediaries tend to gravitate towards financial hubs. A major attack near
these organizations is likely to cause a bigger negative shock to the financial
sector than compared to a similar attack in a distant remote area.
Finally, there are more economic assets in a financial hub. These include
infrastructure, property, and higher human and physical capital. Given this, an
attack in a financial hub is likely to cause higher damage to these assets of an
economy.
For the terrorist, the decision making is rational and involves weighing the
cost and benefit of attacking a financial hub versus a remote area. Attacking a
financial hub gets terrorists more political leverage but at the same time it is
harder and more costly. Hence the terrorists will attack a financial hub if
equation (2.1) holds and attack a remote area if equation (2.2) holds.
Expected (benefit from attacking a financial hub – cost of attack) > 0 (2.1)
Expected (benefit from attacking a remote area – cost of attack) > 0 (2.2)
6 | P a g e
3. Background and context
After the terrorist attacks on September 11, 2001, Pakistani military bases and
land routes were used by the US and NATO to attack the Taliban in
Afghanistan. As a consequence, the Taliban saw the government of Pakistan
as a puppet of the US and started retaliating against the people and the state of
Pakistan.
There are several terrorist organizations operating in Pakistan and Afghanistan
that have declared war on the government of Pakistan. Some of these include
figures. To capture terrorism we created a causality list which was the number
of people killed plus number of people wounded in a terrorist attack.
Terrorist attacks were disaggregated by geography into three categories as
following: i) major cities which included Karachi, Lahore, Islamabad and
Rawalpindi. These are the main cities of Pakistan, as well as the financial hubs
and government centres; ii) remote areas included Khyber Pakhtunkhwa (KP),
Balochistan, Pakistani part of Kashmir, Gilgit-Baltistan and tribal agencies on
the Pak-Afg border in the North-West of Pakistan. Based on contribution by
GDP, these regions add very little to the Pakistan’s economy and are
considered remote; and iii) medium zones consisted of the remainder of i and
ii.
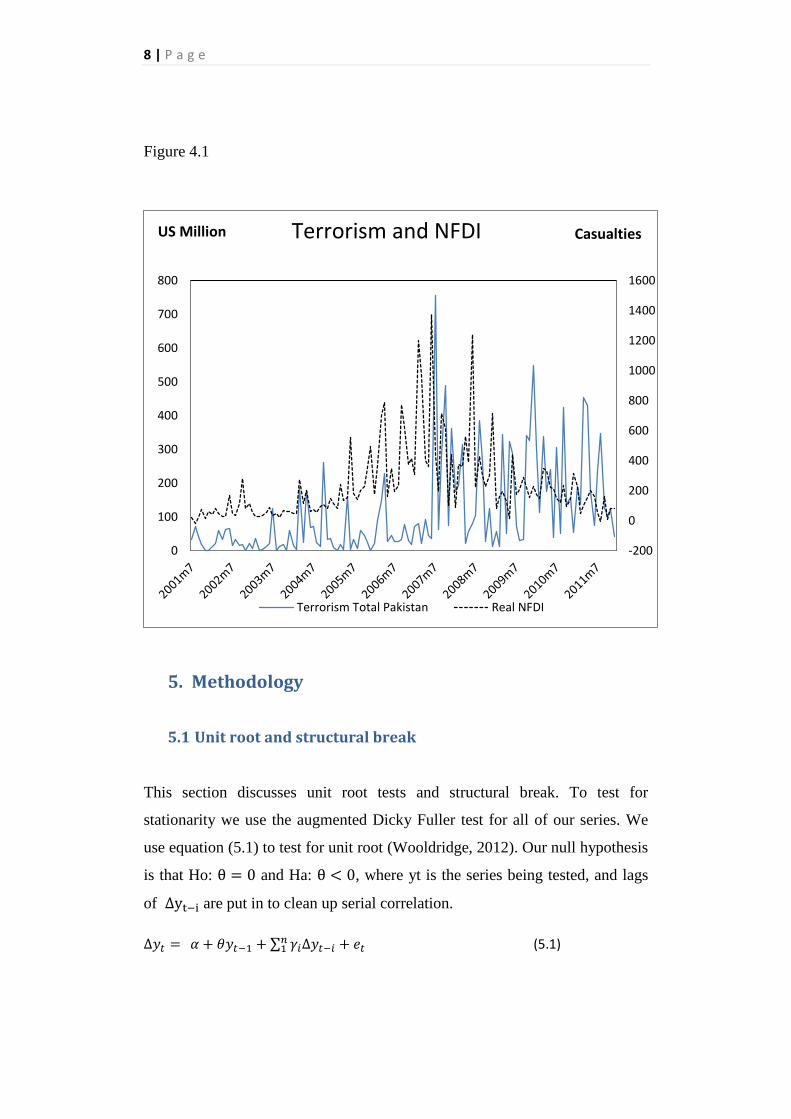
Table 4.1 gives summary statistics and figure 4.1 looks at the association
between terrorism in Pakistan and NFDI. There were a total of 14199
casualties due to terrorism between July 2001 and December 2011 for
Pakistan. Of which 9213 were in major cities, 3431 were in remote areas and
the remainder in the medium zone. In addition, we can see that the surge in
terrorism since 2008 has had a significant impact on NFDI, which started to
decline thereafter.
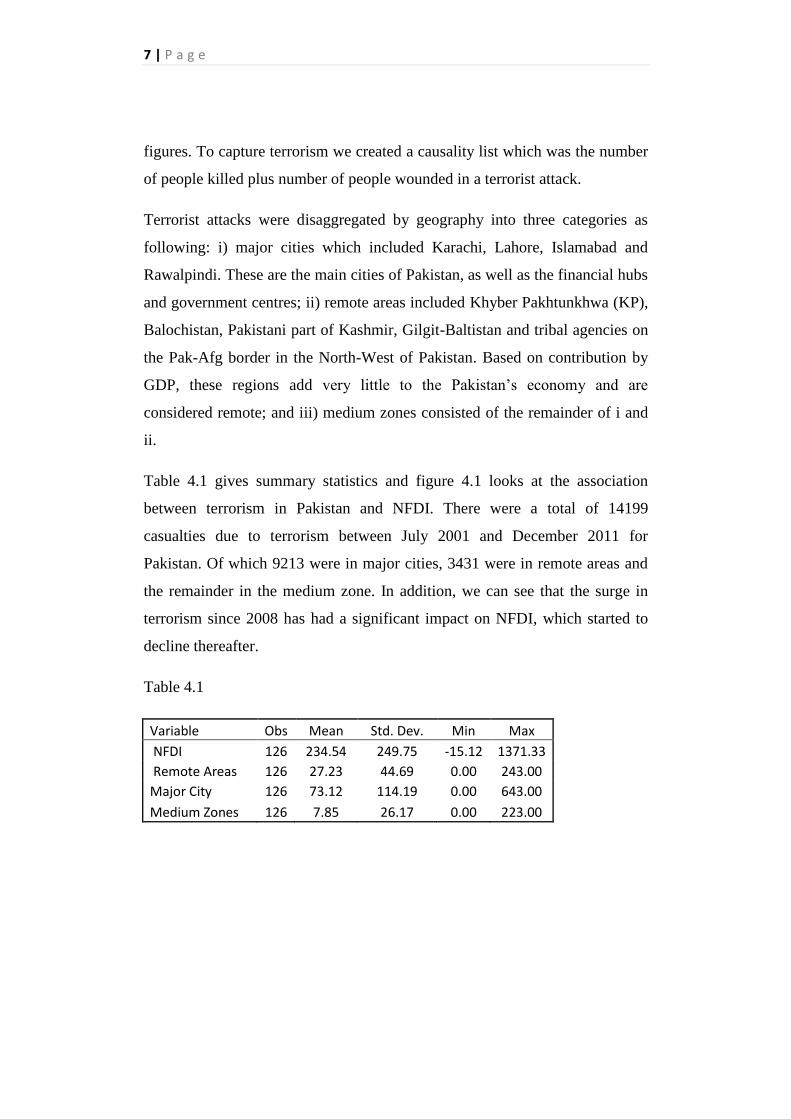
Table 4.1
Variable Obs Mean Std. Dev. Min Max
NFDI 126 234.54 249.75 -15.12 1371.33
Remote Areas 126 27.23 44.69 0.00 243.00
Major City 126 73.12 114.19 0.00 643.00
Medium Zones 126 7.85 26.17 0.00 223.00
8 | P a g e
Figure 4.1
5. Methodology
5.1 Unit root and structural break
This section discusses unit root tests and structural break. To test for
stationarity we use the augmented Dicky Fuller test for all of our series. We
use equation (5.1) to test for unit root (Wooldridge, 2012). Our null hypothesis
is that Ho: and Ha: , where yt is the series being tested, and lags
of are put in to clean up serial correlation.
∑ (5.1)
-200
0
200
400
600
800
1000
1200
1400
1600
0
100
200
300
400
500
600
700
800
Terrorism Total Pakistan Real NFDI
Terrorism and NFDI US Million Casualties
9 | P a g e
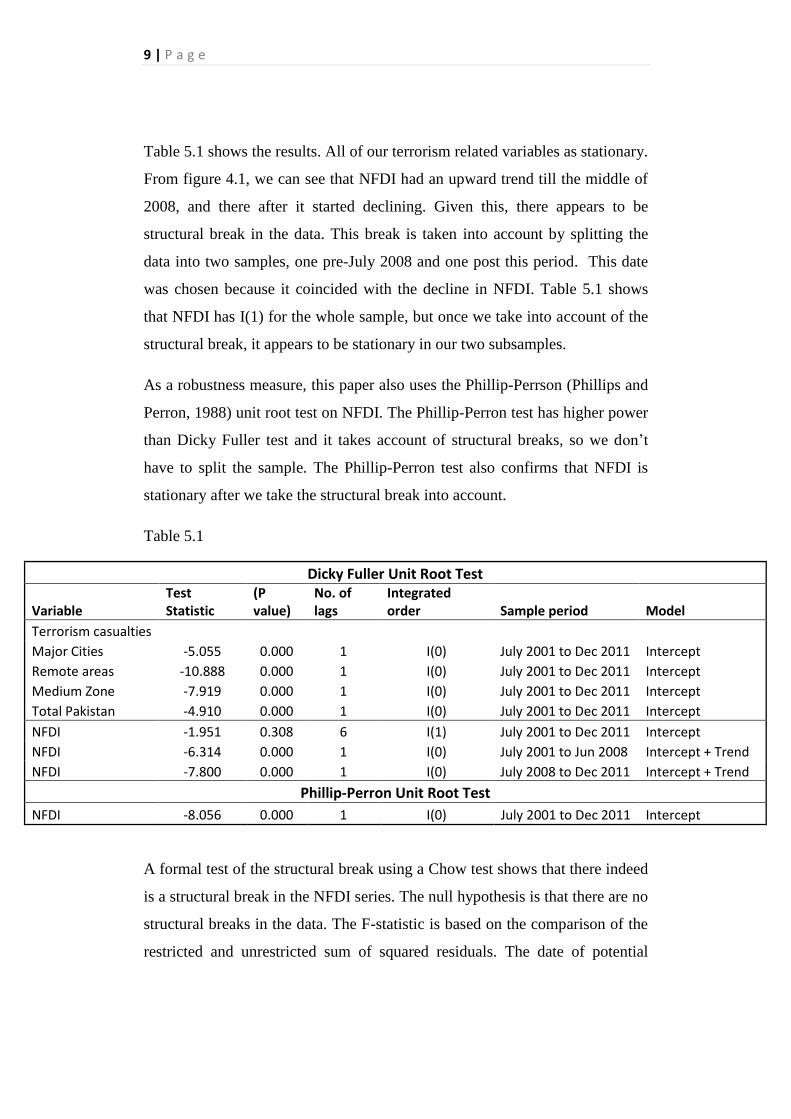
Table 5.1 shows the results. All of our terrorism related variables as stationary.
From figure 4.1, we can see that NFDI had an upward trend till the middle of
2008, and there after it started declining. Given this, there appears to be
structural break in the data. This break is taken into account by splitting the
data into two samples, one pre-July 2008 and one post this period. This date
was chosen because it coincided with the decline in NFDI. Table 5.1 shows
that NFDI has I(1) for the whole sample, but once we take into account of the
structural break, it appears to be stationary in our two subsamples.
As a robustness measure, this paper also uses the Phillip-Perrson (Phillips and
Perron, 1988) unit root test on NFDI. The Phillip-Perron test has higher power
than Dicky Fuller test and it takes account of structural breaks, so we don’t
have to split the sample. The Phillip-Perron test also confirms that NFDI is
stationary after we take the structural break into account.
Table 5.1
Dicky Fuller Unit Root Test
Variable Test Statistic
(P value)
No. of lags
Integrated order Sample period Model
Terrorism casualties
Major Cities -5.055 0.000 1 I(0) July 2001 to Dec 2011 Intercept
Remote areas -10.888 0.000 1 I(0) July 2001 to Dec 2011 Intercept
Medium Zone -7.919 0.000 1 I(0) July 2001 to Dec 2011 Intercept
Total Pakistan -4.910 0.000 1 I(0) July 2001 to Dec 2011 Intercept
NFDI -1.951 0.308 6 I(1) July 2001 to Dec 2011 Intercept
NFDI -6.314 0.000 1 I(0) July 2001 to Jun 2008 Intercept + Trend
NFDI -7.800 0.000 1 I(0) July 2008 to Dec 2011 Intercept + Trend
Phillip-Perron Unit Root Test
NFDI -8.056 0.000 1 I(0) July 2001 to Dec 2011 Intercept
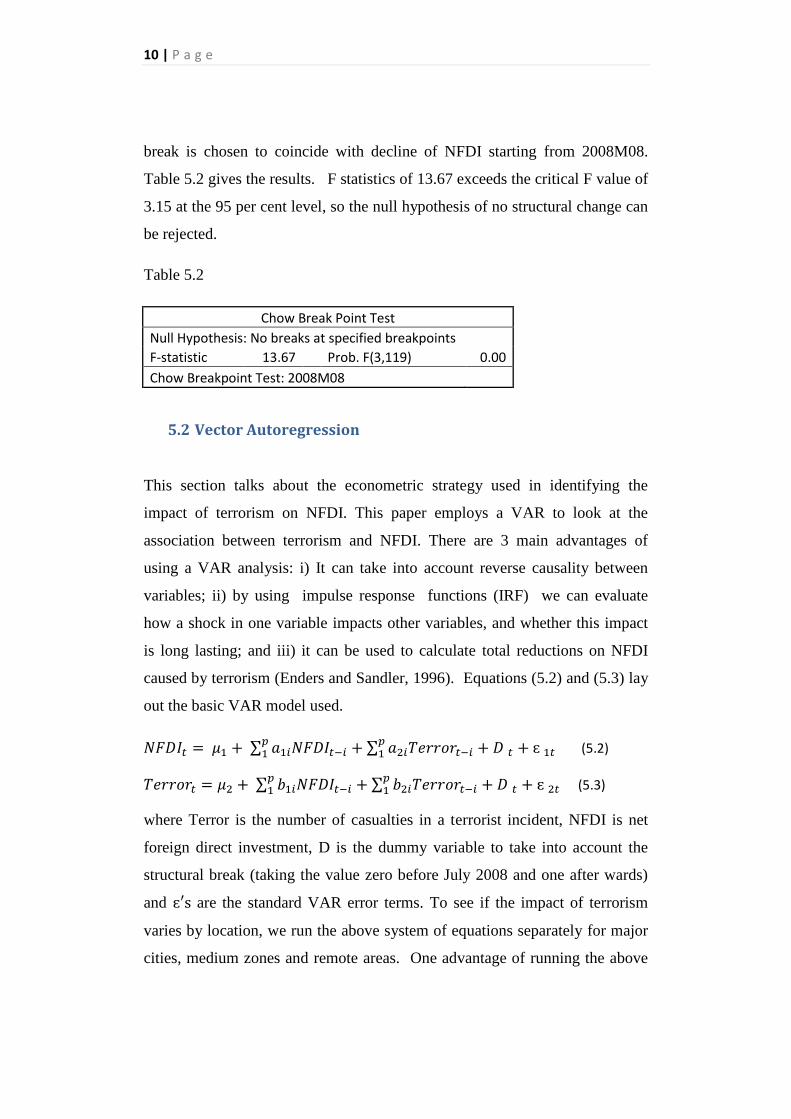
A formal test of the structural break using a Chow test shows that there indeed
is a structural break in the NFDI series. The null hypothesis is that there are no
structural breaks in the data. The F-statistic is based on the comparison of the
restricted and unrestricted sum of squared residuals. The date of potential
10 | P a g e
break is chosen to coincide with decline of NFDI starting from 2008M08.
Table 5.2 gives the results. F statistics of 13.67 exceeds the critical F value of
3.15 at the 95 per cent level, so the null hypothesis of no structural change can
be rejected.
Table 5.2
Chow Break Point Test
Null Hypothesis: No breaks at specified breakpoints
F-statistic 13.67 Prob. F(3,119) 0.00
Chow Breakpoint Test: 2008M08
5.2 Vector Autoregression
This section talks about the econometric strategy used in identifying the
impact of terrorism on NFDI. This paper employs a VAR to look at the
association between terrorism and NFDI. There are 3 main advantages of
using a VAR analysis: i) It can take into account reverse causality between
variables; ii) by using impulse response functions (IRF) we can evaluate
how a shock in one variable impacts other variables, and whether this impact
is long lasting; and iii) it can be used to calculate total reductions on NFDI
caused by terrorism (Enders and Sandler, 1996). Equations (5.2) and (5.3) lay
out the basic VAR model used.
∑ ∑
(5.2)
∑ ∑
(5.3)
where Terror is the number of casualties in a terrorist incident, NFDI is net
foreign direct investment, D is the dummy variable to take into account the
structural break (taking the value zero before July 2008 and one after wards)
and are the standard VAR error terms. To see if the impact of terrorism
varies by location, we run the above system of equations separately for major
cities, medium zones and remote areas. One advantage of running the above
11 | P a g e
regression separately for each type of location is that the system does not run
out of degrees of freedom as quickly and hence with higher number of
observations available gives a more precise estimate of the confidence
intervals around the IRFs. A Cholesky decomposition is used to analyse the
IRFs of the VAR system. Since both equations have identical right-hand-side
variables, ordinary least squares will yield efficient estimates.
We use the likelihood ratio (LR) test to ascertain the number of lags required
for the above system of equations. The LR test selected 12 lags for all systems,
except for the system involving medium zones where it selected 13 lags. As
the NFDI data is not seasonally adjusted, using 12 or more lags also serves the
purpose of controlling for seasonality. For major cities VAR AIC choose 12
lags as well. For other specifications, AIC and BIC always choose lags less
than 12. Given that NFDI data is not seasonally adjusted, AIC and BIC chosen
models maybe mis-specified because they don’t account for seasonality.
The identification assumption is that terrorism does not contemporaneously
react to NFDI. This assumption is based on the fact that terrorists may require
some time to logistically organize themselves. In contrast, NFDI can
contemporaneously react to terrorism. As a robustness measure we test to see
if the ordering of our variables matter.
For robustness measure we also tests to see if the results are sensitive to
specification by putting terrorism in all regions and NFDI in one VAR system.
Our sensitivity analysis shows that the main results of the paper remain valid
after the robustness tests.
12 | P a g e
6. Results
6.1 Impulse response functions
By analysing the moving average representation of a VAR2 we can trace out
the dynamic responses of the variables in the VAR system (Enders, 2008).
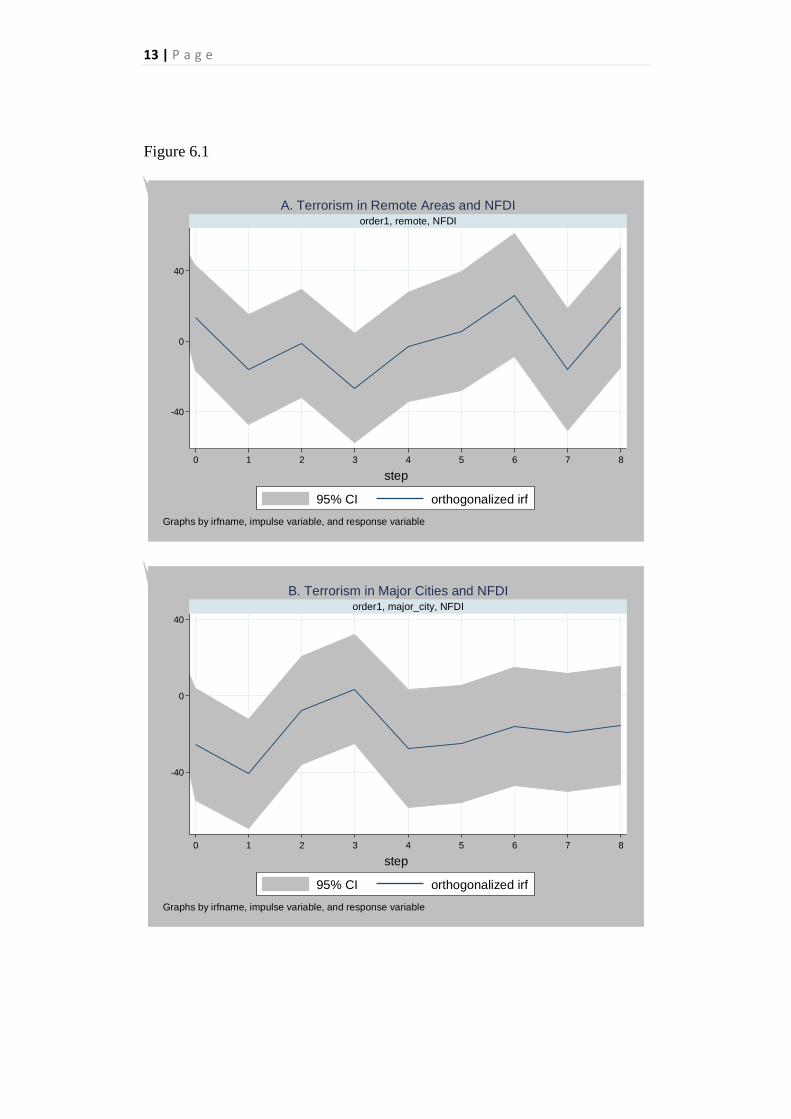
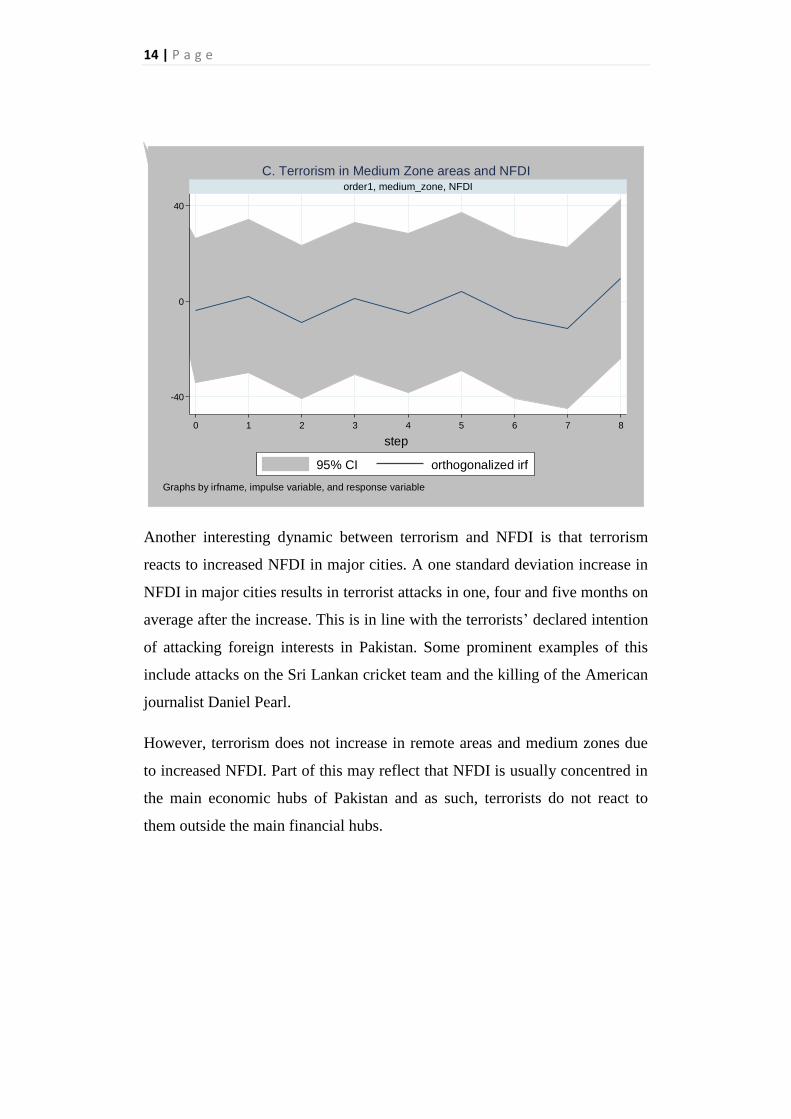
Figure 6.1 traces out the impacts of terrorist incidents by location on NFDI.
Figure 6.1 confirms our hypothesis that terrorism attacks in major cities have a
higher cost than terrorism in remote area and medium zones. According to
panel A and C in figure 6.1, a shock to terrorism in a remote area and medium
zones has no statistically significant impact on NFDI at the 95 per cent
confidence level. However, a shock in terrorism in a major city has both
economically and statically a negative impact on NFDI. A standardized attack
in a major city decreases NFDI by around $40.94 million 2009 US dollars in
one months’ time. This result is statistically significant at the 95 per cent
level3.
2 VAR results are not produced here for saving space, as there is not much interpretation we
can do with reduced forms. However, these results can be produced on request. 3 All other impacts are statistically insignificant at 95 per cent level.
13 | P a g e
Figure 6.1
-40
0
40
0 1 2 3 4 5 6 7 8
order1, remote, NFDI
A. Terrorism in Remote Areas and NFDI
95% CI orthogonalized irf
step
Graphs by irfname, impulse variable, and response variable
-40
0
40
0 1 2 3 4 5 6 7 8
order1, major_city, NFDI
B. Terrorism in Major Cities and NFDI
95% CI orthogonalized irf
step
Graphs by irfname, impulse variable, and response variable
14 | P a g e
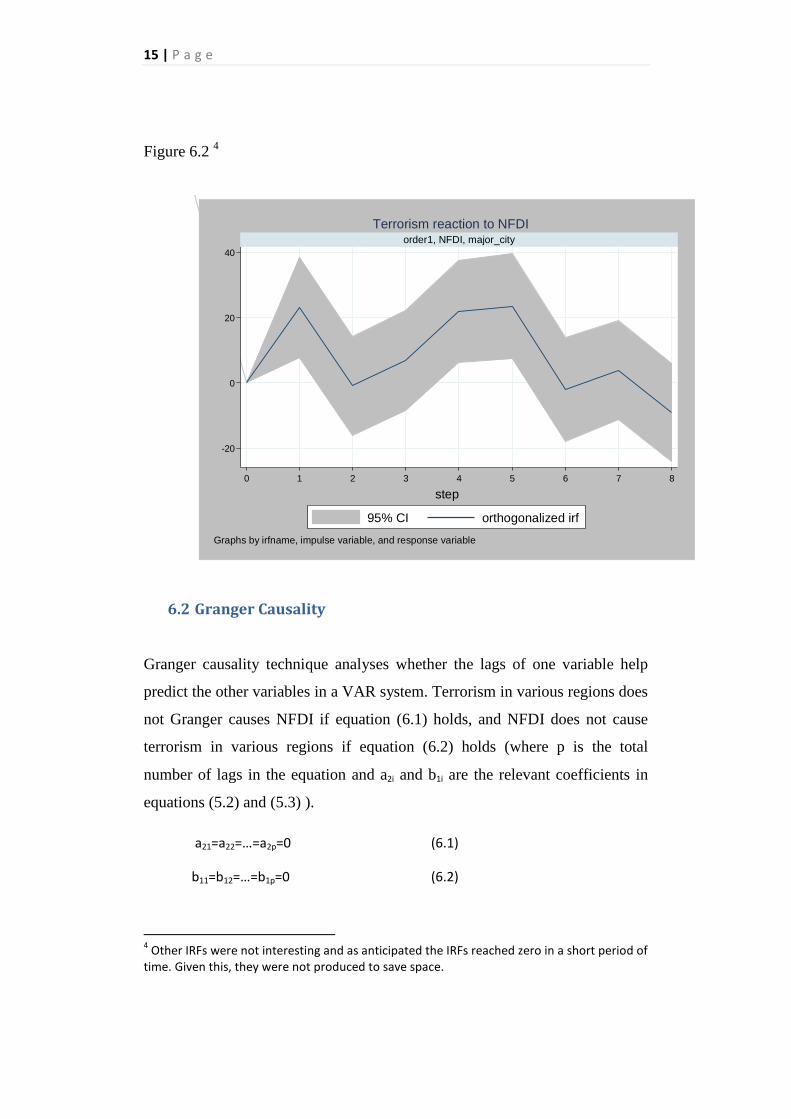
Another interesting dynamic between terrorism and NFDI is that terrorism
reacts to increased NFDI in major cities. A one standard deviation increase in
NFDI in major cities results in terrorist attacks in one, four and five months on
average after the increase. This is in line with the terrorists’ declared intention
of attacking foreign interests in Pakistan. Some prominent examples of this
include attacks on the Sri Lankan cricket team and the killing of the American
journalist Daniel Pearl.
However, terrorism does not increase in remote areas and medium zones due
to increased NFDI. Part of this may reflect that NFDI is usually concentred in
the main economic hubs of Pakistan and as such, terrorists do not react to
them outside the main financial hubs.
-40
0
40
0 1 2 3 4 5 6 7 8
order1, medium_zone, NFDI
C. Terrorism in Medium Zone areas and NFDI
95% CI orthogonalized irf
step
Graphs by irfname, impulse variable, and response variable
15 | P a g e
Figure 6.2 4
6.2 Granger Causality
Granger causality technique analyses whether the lags of one variable help
predict the other variables in a VAR system. Terrorism in various regions does
not Granger causes NFDI if equation (6.1) holds, and NFDI does not cause
terrorism in various regions if equation (6.2) holds (where p is the total
number of lags in the equation and a2i and b1i are the relevant coefficients in
equations (5.2) and (5.3) ).
a21=a22=…=a2p=0 (6.1)
b11=b12=…=b1p=0 (6.2)
4 Other IRFs were not interesting and as anticipated the IRFs reached zero in a short period of
time. Given this, they were not produced to save space.
-20
0
20
40
0 1 2 3 4 5 6 7 8
order1, NFDI, major_city
Terrorism reaction to NFDI
95% CI orthogonalized irf
step
Graphs by irfname, impulse variable, and response variable
16 | P a g e
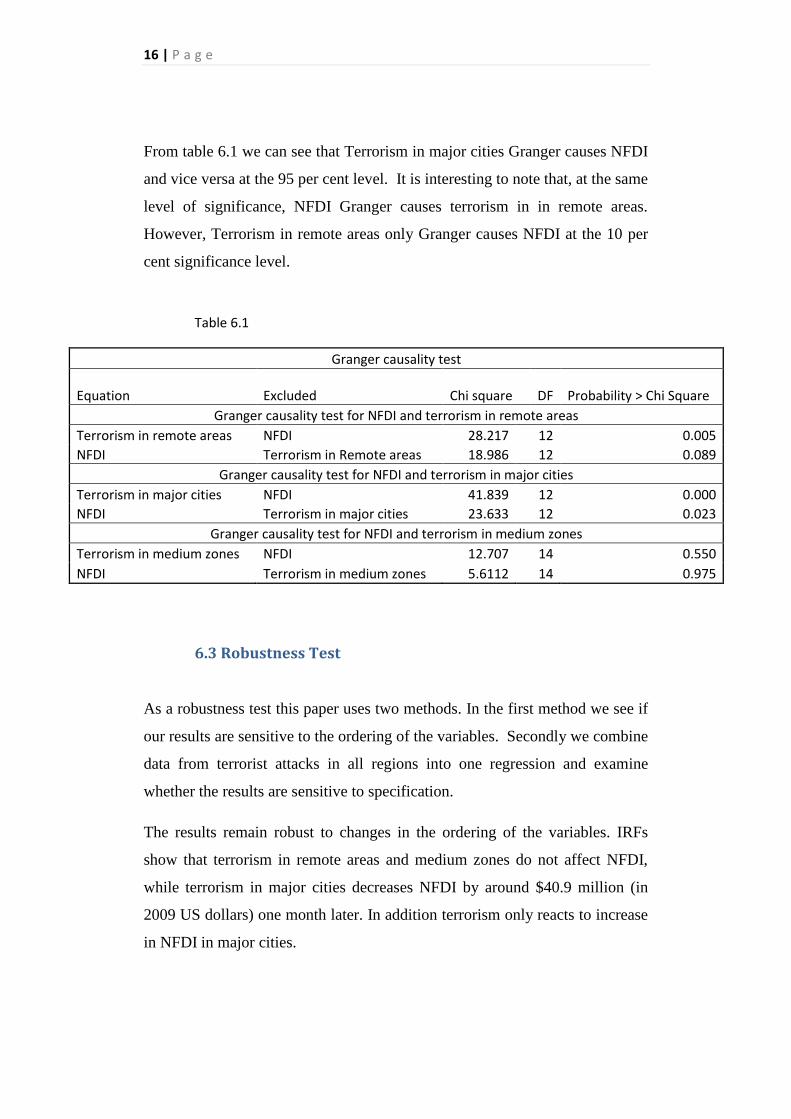
From table 6.1 we can see that Terrorism in major cities Granger causes NFDI
and vice versa at the 95 per cent level. It is interesting to note that, at the same
level of significance, NFDI Granger causes terrorism in in remote areas.
However, Terrorism in remote areas only Granger causes NFDI at the 10 per
cent significance level.
Table 6.1
Granger causality test
Equation Excluded Chi square DF Probability > Chi Square
Granger causality test for NFDI and terrorism in remote areas
Terrorism in remote areas NFDI 28.217 12 0.005
NFDI Terrorism in Remote areas 18.986 12 0.089
Granger causality test for NFDI and terrorism in major cities
Terrorism in major cities NFDI 41.839 12 0.000
NFDI Terrorism in major cities 23.633 12 0.023
Granger causality test for NFDI and terrorism in medium zones
Terrorism in medium zones NFDI 12.707 14 0.550
NFDI Terrorism in medium zones 5.6112 14 0.975
6.3 Robustness Test
As a robustness test this paper uses two methods. In the first method we see if
our results are sensitive to the ordering of the variables. Secondly we combine
data from terrorist attacks in all regions into one regression and examine
whether the results are sensitive to specification.
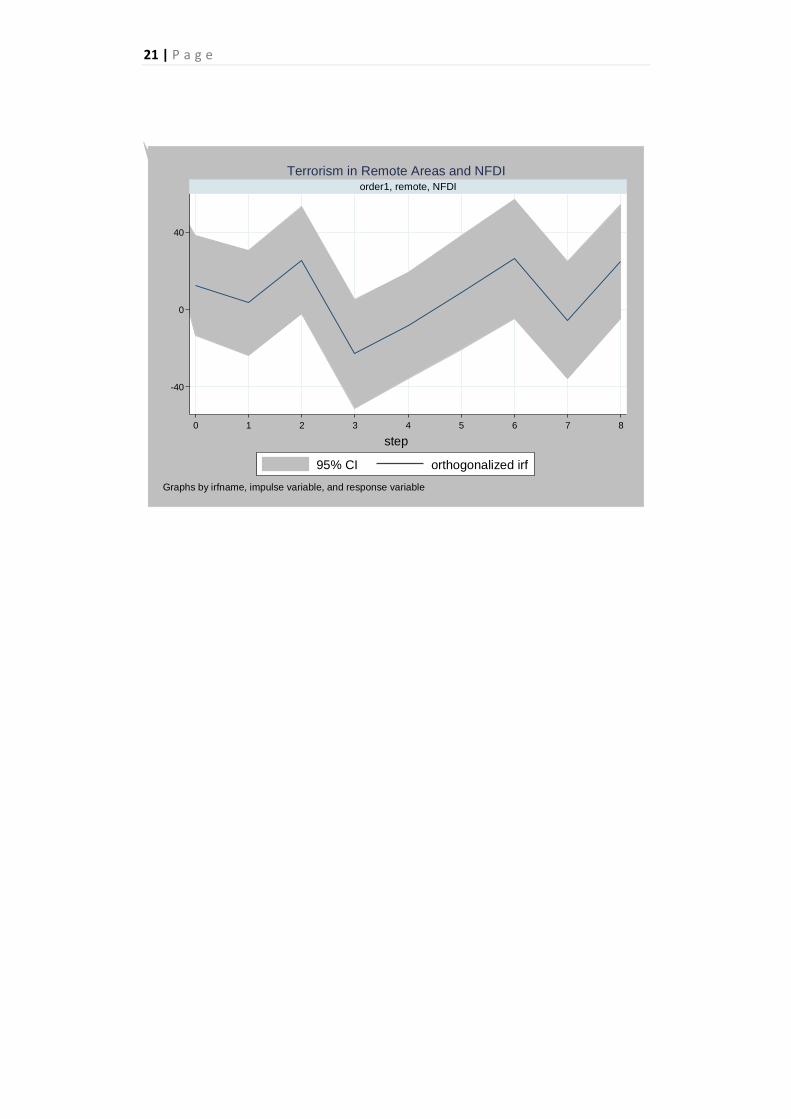
The results remain robust to changes in the ordering of the variables. IRFs
show that terrorism in remote areas and medium zones do not affect NFDI,
while terrorism in major cities decreases NFDI by around $40.9 million (in
2009 US dollars) one month later. In addition terrorism only reacts to increase
in NFDI in major cities.
17 | P a g e
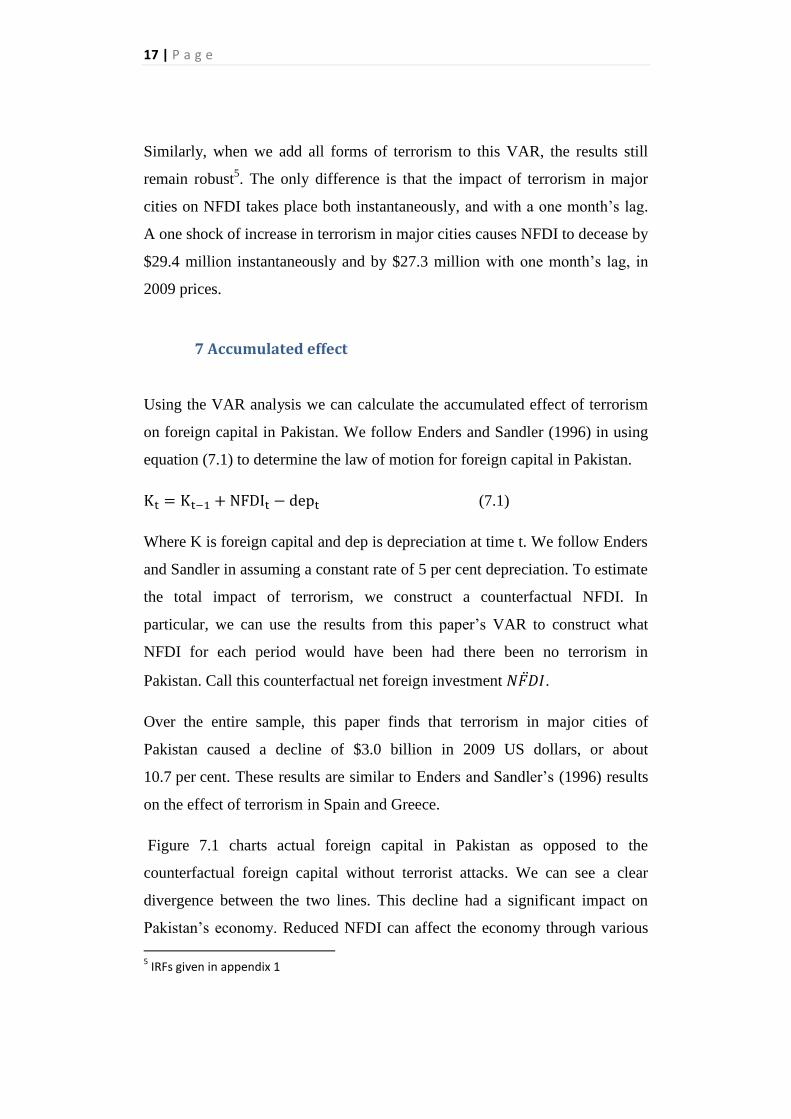
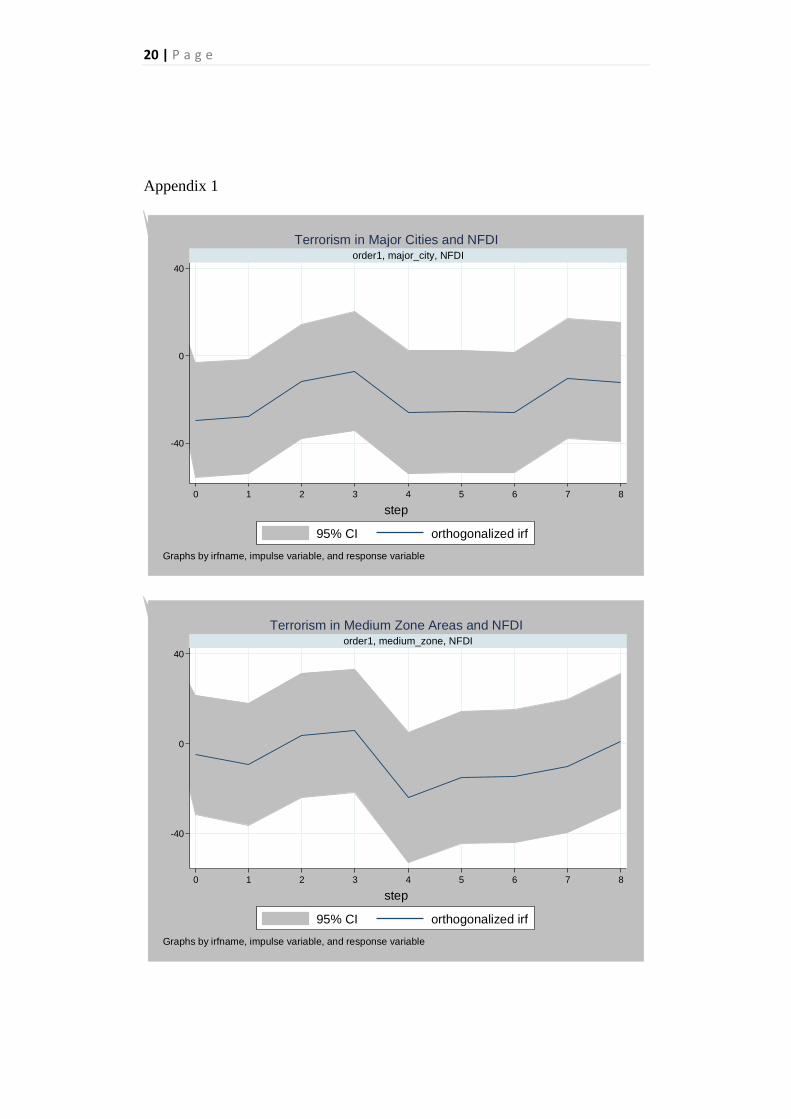
Similarly, when we add all forms of terrorism to this VAR, the results still
remain robust5. The only difference is that the impact of terrorism in major
cities on NFDI takes place both instantaneously, and with a one month’s lag.
A one shock of increase in terrorism in major cities causes NFDI to decease by
$29.4 million instantaneously and by $27.3 million with one month’s lag, in
2009 prices.
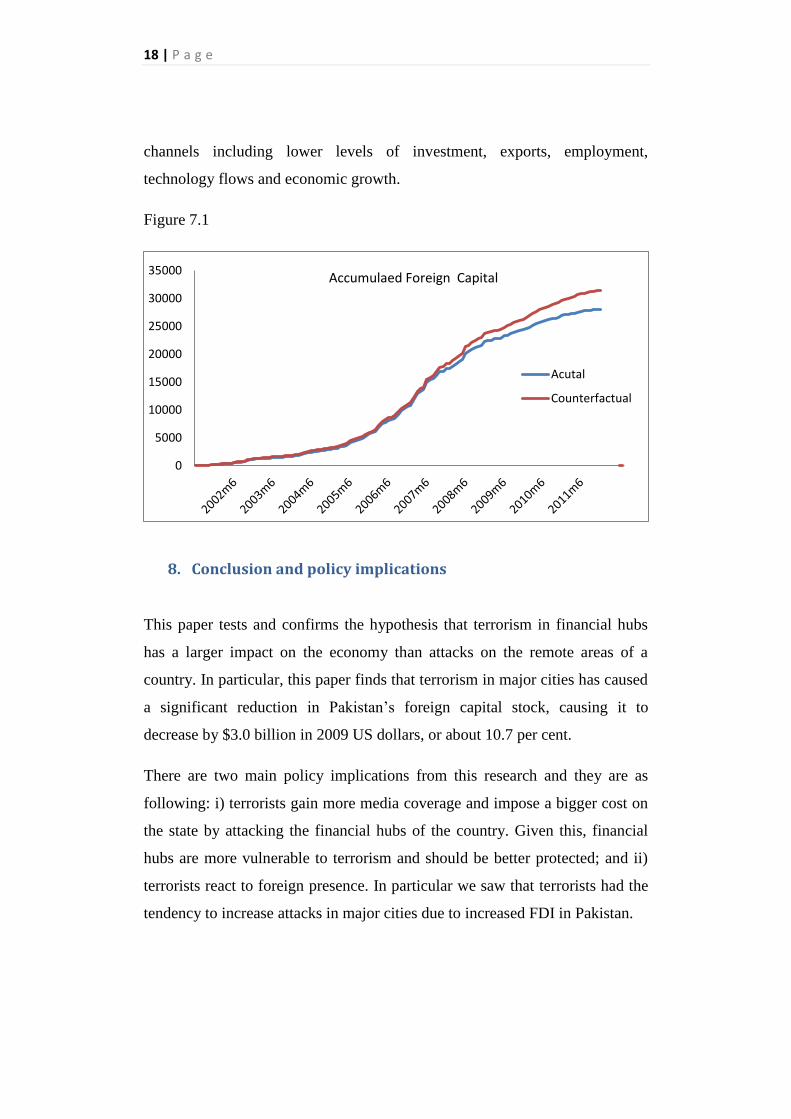
7 Accumulated effect
Using the VAR analysis we can calculate the accumulated effect of terrorism
on foreign capital in Pakistan. We follow Enders and Sandler (1996) in using
equation (7.1) to determine the law of motion for foreign capital in Pakistan.
(7.1)
Where K is foreign capital and dep is depreciation at time t. We follow Enders
and Sandler in assuming a constant rate of 5 per cent depreciation. To estimate
the total impact of terrorism, we construct a counterfactual NFDI. In
particular, we can use the results from this paper’s VAR to construct what
NFDI for each period would have been had there been no terrorism in
Pakistan. Call this counterfactual net foreign investment ̈ .
Over the entire sample, this paper finds that terrorism in major cities of
Pakistan caused a decline of $3.0 billion in 2009 US dollars, or about
10.7 per cent. These results are similar to Enders and Sandler’s (1996) results
on the effect of terrorism in Spain and Greece.
Figure 7.1 charts actual foreign capital in Pakistan as opposed to the
counterfactual foreign capital without terrorist attacks. We can see a clear
divergence between the two lines. This decline had a significant impact on
Pakistan’s economy. Reduced NFDI can affect the economy through various
5 IRFs given in appendix 1
18 | P a g e
channels including lower levels of investment, exports, employment,
technology flows and economic growth.
Figure 7.1
8. Conclusion and policy implications
This paper tests and confirms the hypothesis that terrorism in financial hubs
has a larger impact on the economy than attacks on the remote areas of a
country. In particular, this paper finds that terrorism in major cities has caused
a significant reduction in Pakistan’s foreign capital stock, causing it to
decrease by $3.0 billion in 2009 US dollars, or about 10.7 per cent.
There are two main policy implications from this research and they are as
following: i) terrorists gain more media coverage and impose a bigger cost on
the state by attacking the financial hubs of the country. Given this, financial
hubs are more vulnerable to terrorism and should be better protected; and ii)
terrorists react to foreign presence. In particular we saw that terrorists had the
tendency to increase attacks in major cities due to increased FDI in Pakistan.
0
5000
10000
15000
20000
25000
30000
35000
Acutal
Counterfactual
Accumulaed Foreign Capital
19 | P a g e
It would be incorrect to conclude from this research that security apparatus
should focus on the financial hubs only and ignore remote areas of the
country. If this happens, then the terrorists can use the vacuum to launch
attacks on the main sectors of the economy. The example of how terrorists in a
remote-land-locked country managed to use the vacuum in Afghanistan to
launch attack on the main financial hub of the world is still prominent in every
one’s memory.
References
ABADIE, A. & GARDEAZABAL, J. 2008. Terrorism and the world economy. European
Economic Review, 52, 1-27. BANDYOPADHYAY, S., SANDLER, T. & YOUNAS, J. 2011. Foreign direct investment,
aid, and terrorism: an analysis of developing countries. Federal Reserve Bank of St. Louis Working Paper No.
BLOMBERG, S. B., HESS, G. D. & ORPHANIDES, A. 2004. The macroeconomic consequences of terrorism. Journal of Monetary Economics, 51, 1007-1032.
ECKSTEIN, Z. & TSIDDON, D. 2004. Macroeconomic consequences of terror: theory and the case of Israel. Journal of Monetary Economics, 51, 971-1002.
ENDERS, W. 2008. Applied econometric time series, John Wiley & Sons. ENDERS, W., SACHSIDA, A. & SANDLER, T. 2006. The impact of transnational
terrorism on US foreign direct investment. Political Research Quarterly, 59, 517-531.
ENDERS, W. & SANDLER, T. 1996. Terrorism and foreign direct investment in Spain and Greece. Kyklos, 49, 331-352.
ENDERS, W. & SANDLER, T. 2006. The political economy of terrorism, Cambridge University Press.
ENDERS, W., SANDLER, T. & PARISE, G. F. 1992. An econometric analysis of the impact of terrorism on tourism. Kyklos, 45, 531-554.
MANCUSO, A. J., DIRIENZO, C. E. & DAS, J. 2010. Assessing terrorist risk and FDI using relative information measures. Applied Economics Letters, 17, 787-790.
MUCKLEY, C. 2010. Terrorism, Tourism and FDI: Estimating a lower bound on the Peace Dividend in Northern Ireland. Available at SSRN 1689510.
NITSCH, V. & SCHUMACHER, D. 2004. Terrorism and international trade: an empirical investigation. European Journal of Political Economy, 20, 423-433.
PHILLIPS, P. C. & PERRON, P. 1988. Testing for a unit root in time series regression. Biometrika, 75, 335-346.
SANDLER, T. & ENDERS, W. 2004. An economic perspective on transnational terrorism. European Journal of Political Economy, 20, 301-316.
WOOLDRIDGE, J. M. 2012. Introductory econometrics: a modern approach, Cengage Learning.
20 | P a g e
Appendix 1
-40
0
40
0 1 2 3 4 5 6 7 8
order1, major_city, NFDI
Terrorism in Major Cities and NFDI
95% CI orthogonalized irf
step
Graphs by irfname, impulse variable, and response variable
-40
0
40
0 1 2 3 4 5 6 7 8
order1, medium_zone, NFDI
Terrorism in Medium Zone Areas and NFDI
95% CI orthogonalized irf
step
Graphs by irfname, impulse variable, and response variable
21 | P a g e
-40
0
40
0 1 2 3 4 5 6 7 8
order1, remote, NFDI
Terrorism in Remote Areas and NFDI
95% CI orthogonalized irf
step
Graphs by irfname, impulse variable, and response variable