38
Economic Development, Growth of Human Capital, and the Dynamics of the Wage Structure by Jacob Mincer, Columbia University September 1995 1994-95 Discussion Paper Series No. 744

Economic Development, Growth of HumanCapital, and the Dynamics of the Wage Structure
byJacob Mincer, Columbia University
September 1995
1994-95 Discussion Paper Series No. 744

Economic Development, Growth of Human Capital, and the Dynamics of the
Wage Structure"
by
Jacob Mincer
Columbia University
and National Bureau of Economic Research
Abstract
Human capital is not only a factor in economic growth, but also an effect of itor of developments generated by economic growth. In this paper I elucidate the sources ofgrowth of human capital in the course of economic development. On the supply side discussedin Part I I include the growth of family income, urbanization, the demographic transitiontriggered by declines in mortality, and the rising cost of time, an important factor in the growthof the female labor force in the 20th century.
The supply side alone cannot explain the continuous growth of human capital as itimplies a self limiting decline in rates of return below those in alternative investments. Thetrendless (though fluctuating) rates of return on human capital are consistent with growingdemands for human capital in the labor market. Growth of demand for labor skills is a functionof capital accumulation and of technological changes which put a premium on labor skills.Evidence on this hypothesis is summarized in Part II, and on supply responses to growingdemand for human capital in Part III. Changes in the skill and wage structures in the labormarket are an important part of the evidence.
The reciprocal relation between economic growth and the growth of human capital islikely to be an important key to sustained economic growth. A caveat applies to indirecteffects of economic growth on family instability which may lead to a deterioration of childhoodhuman capital in sizable sectors of society.
* Helpful comments were received from D. Bloom, R. Findlay, B. Jovanovic, and E. Zupnick.Competent research assistance was provided by 0 . Azfar and P. Ranjan. NSF support isgratefully acknowledged.

The concept of human capital plays a major role in modern treatments of growth
theory and of labor economics. In one sense, the distinction between the two is in levels of
aggregation. At the macroeconomic level the social stock of human capital and its growth are
central to the process of economic growth; at the micro level differences in human capital
stock and in their growth can explain much of the observed variation in the wage structure and
in the wage distribution among individuals and groups. Although pursued independently these
applications view human capital and its growth as a cause of economic growth: of the
economy as a whole in the theory of growth, and of individuals in labor economics.
Human capital is implicated in the process of growth not merely as a cause but also as
an effect of economic growth or of developments generated by economic growth. The
reciprocal relation between economic growth and the growth of human capital is likely to be an
important key to sustained economic growth.
It is my purpose, in this paper, to elucidate the sources of growth of human capital. I
stress the role of the family and of the labor market, as revealed in research of labor economists
including my own.
I Supply Side
The growth of human capital in 20th century economies has been spectacular: From
low levels of schooling and a great deal of illiteracy even in advanced countries in the late 19th
century to a large majority of high school graduates at the present time. The continuing
growth of human capital is an integral part of several other profound social transformations
experienced in this century. Table 1 shows the changes for the U.S: (1) Growth of education:
From very small proportions of high school graduates to almost universal completion. (2) A
1
sevenfold rise in per capita real incomes. (3) Urbanization: From nearly half of the labor force
in agriculture to less than 5%. (4) The demographic transition: From large and extended
families with high fertility and mortality to nuclear and sub-nuclear families with much greater
longevity and better health, and (5) The trend in female participation in the labor market:
From a miniscule proportion of married women working outside their households in 1890 to
nearly two thirds at the end of the current century.
The developments in the U.S. are paralleled by the history of most currently advanced
economies. Though more recent, these trends are unfolding as well in less developed
countries where, as in most of them, income growth is positive. Table 2 shows the current
differences between poor and advanced countries which very much correspond to the trends
shown for the U.S. in Table 1. The trends are strongly interrelated; All are generated by and
feed back on economic growth.
In what follows I sketch the economic analysis which relates these trends to economic
growth, and points to the growth of human capital as their consequence.
(1) Direct effect of income growth on educational trends
Education is an asset that generates not only earnings, but also a stream of non-market
utilities involving learning and culture. As such, it may be viewed as a consumption good
which, therefore, is directly related to income. The positive income effects apply also to the
acquisition of education as an investment good, to the extent that imperfect capital markets
necessitate a degree of self financing of education. The positive effect of parental income on
school enrollment of their children is documented in many micro-economic studies. Inter-
country comparisons (Table 3) show similar results. But as Table 3 shows, the effect of
income is greatly reduced- the coefficient declines greatly when variables representing

urbanization, demographic change, and women's labor force participation are included. The
income coefficient is reduced because the additional variables are in part generated by
income(wage) growth. Their effect on education can therefore be viewed as an indirect effect
of economic growth.
(2) Urbanization
Given low price and income elasticities of the demand for food, the growth of
industrial productivity, whether or not agricultural productivity grows at the same or lesser
rate, results in a reduced demand for farm labor, and lower wages in agriculture than in
industry1. The share of the agricultural labor force in the total labor force declines more
rapidly than the share of food expenditures in consumer budgets as their incomes grow. Cities
grow as a result of labor migration from farms in response to the urban-rural wage differential,
rather than from urban fertility alone. Urban fertility is historically lower than rural fertility as
the net costs of raising children are lower on the farm. With smaller families in the city than on
the farm and greater profitability of education in the urban environment, urban families devote
more resources per child to their education. But as urbanization grows, expected migration
flows of the young to the cities increase incentives for farm families to invest in their children's
education as well as to reduce their number. At the same time technological changes in
agriculture increase the importance of education and reduce the usefulness of experience,
thereby reducing the power of the elders in the extended family. Both technology and
migration contribute to the decline of the extended family2.
1 If agricultural productivity grows faster than industrial productivity the demand for farmlabor is still likely to decline, given the low income and price elasticities.2 See Rosenzweig (1994) for an instructive analysis of the effects of the "green revolution" inIndia.3

(3) The demographic transition
The demographic transition is the long term change from populations with high birth
and death rates to much larger populations with low birth and death rates. Family size changes
from large and extended households to small nuclear (even sub-nuclear) units. It is
inextricably also a change from low to high levels of human capital per person. The long term
growth of human capital is intimately connected with the demographic transition both as a
factor in it as well as an outcome of it. The changes in family size and in human capital during
the transition are linked as an effective, though not necessarily direct, substitution of quality for
quantity of children.
While Malthus was right in concluding that economic growth due to increases in
productivity would support a larger population, his prediction that population growth would
ultimately eliminate the income gains from productivity growth was incorrect. The error is
due to his basically biological theory that fertility is limited mainly by fecundity and that
therefore mortality is the ultimate factor which adjusts numbers of people to available
resources.
Modern economists discard the Malthusian notion of the predominance of biologically
conditioned fertility, and substitute for it a demand function for children3 which focuses both
on their numbers and "quality", or their human capital. This leads to a better understanding of
the actual dynamics of the demographic transition which was triggered by the Industrial
Revolution in the West some two centuries ago and in the less developed world in the current
century.
3 For a comprehensive synthesis see Becker's Treatise on the Family. 1981. and T.P.Schultz,Economics of Population. 1981.

The starting point of the demographic transition analysis is the decline in mortality that
set in with the growth of income4 in Western Europe. After a rather long lag fertility began to
decline in response to the decline in mortality. This response, not anticipated by Malthus,
reveals that fertility decisions were matters of choice rather than of biology. If the family
contemplates an optimal rather than maximal number of surviving children, the decline in
mortality forces a revision in fertility behavior, since the same number of survivors can be
produced with fewer births. Fertility may therefore decline, but as the cost of producing a
survivor declines5, more surviving children are desired. Since the number of survivors
represents the difference between births and deaths of children, if fertility declines while
number of surviving children increases, fertility must decline less rapidly than mortality yielding
positive and increasing rates of population growth.
A necessary condition for a reduction in mortality to produce a reduction in fertility is
a price-inelastic demand for children(T.P.Schultz,1981). Define the cost of producing a
csurviving child, ns - —J-T .
Here p(s) is the probability of survival to adulthood, while c is the cost of raising a child,
conditional on survival. A reduction in mortality increases p(s), which reduces 71 s and so
increases the demand for surviving children. If b is the birthrate, the number of surviving
children per family is n = b.p(s).i3
4 Historians also stress the relevance of public health measures as a factor independent ofincome. This point is probably more applicable to the current experience of less developedcountries.5 Costs decline because fewer births are needed to produce a survivor.5
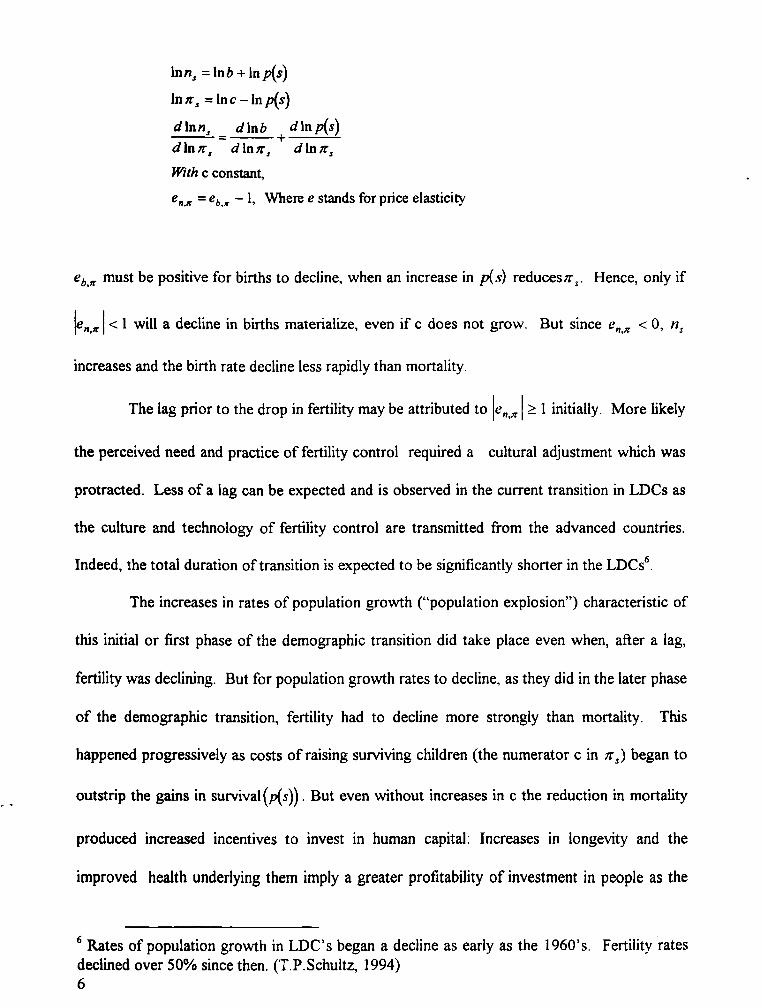
\nns =\nb + \np(s)
\n7Ts = In c - In p{s)
d\nns d\nb d\np(s)
dIn ns d\nn s d\nns
With c constant,
enx = ehK - 1, Where e stands for price elasticity
ebn must be positive for births to decline, when an increase in p(s) reduces;rs. Hence, only if
enn < 1 will a decline in births materialize, even if c does not grow. But since enn < 0, ns
increases and the birth rate decline less rapidly than mortality.
The lag prior to the drop in fertility may be attributed to enn > 1 initially. More likely
the perceived need and practice of fertility control required a cultural adjustment which was
protracted. Less of a lag can be expected and is observed in the current transition in LDCs as
the culture and technology of fertility control are transmitted from the advanced countries.
Indeed, the total duration of transition is expected to be significantly shorter in the LDCs6.
The increases in rates of population growth ("population explosion") characteristic of
this initial or first phase of the demographic transition did take place even when, after a lag,
fertility was declining. But for population growth rates to decline, as they did in the later phase
of the demographic transition, fertility had to decline more strongly than mortality. This
happened progressively as costs of raising surviving children (the numerator c in ns) began to
outstrip the gains in survival (p(s)). But even without increases in c the reduction in mortality
produced increased incentives to invest in human capital: Increases in longevity and the
improved health underlying them imply a greater profitability of investment in people as the
6 Rates of population growth in LDCs began a decline as early as the 1960's. Fertility ratesdeclined over 50% since then. (T.P.Schultz, 1994)
effective payoff period lengthens7. With limited budgets investments in health and education of
children reduced fertility further. The initial phase of the demographic transition, when
population growth increased merged into the next phase as fertility declines accelerated in
consequence of growing costs (c) of raising children.
In addition to costs due to urban living, the growth of real wages in industry and
services, the opportunity cost of time in raising children is another factor which leads to
declines in population growth8 and the ultimate completion of the demographic transition, all
the while providing further incentives for investment in human capital; as the numbers of
children decline and income per child grows.
(4) Growth of the female labor force is a feature of 20th century societies experiencing
economic growth9. The basic analysis of this phenomenon recognizes the productive non-
market activities of consumers which are combined with purchased market goods and services
to create final objects of utility or "commodities" in Becker's terminology. These activities use
time, and growth of real wages raises the opportunity cost of non-market time. Consequently
inputs of non-market time- time spent in household production- are reduced in favor of
substitute market inputs bought with increased market earnings. The transfer of time from
household production to market earnings shows up in growing labor force participation of
women whose household activities are curtailed in favor of earning activities. Another effect
of the growing cost of time is the reduction of household demands for time -intensive
7 This was first pointed out by O'Hara(1972).8 This description of the demographic transition as a non-linear effect of economic growth onpopulation growth casts doubt on attempts to analyze economic growth as an effect ofpopulation growth: The same rate of population growth corresponds to low and high levels ofincome, depending on the stage of the demographic transition.9 The first analysis by Mincer(1962) used a price theoretic approach and was applied to theU.S. experience. Becker(1965) contributed a theoretical framework which utilizes theconcept of the "household production function". Goldin's book (1990) covers the U.S. historyin great detail.7

"commodities" such as child raising which accelerates the downward trend in fertility. Both
consequences require an initially sharp division of labor between the sexes in market and
household activities which is clearly much greater at the outset of economic growth ( or in less
advanced economies) when wages are low and fertility is high, taking up much of the adult life
of mothers. As a result, work of married women outside the household is infrequent at that
stage.
Two qualifications to this analysis involve income effects10. If demand for household
intensive commodities were income elastic (r|> l) the analysis may not hold. Also, if
productivity growth in household activities were as (or more) rapid than in the market, relative
price changes which generate the substitution from time intensive to other commodities would
either not materialize or reverse. The answers to these possible objections are: (a) Relative
price changes which create the proper substitution move in the proper direction so long as
market productivity grows more rapidly than household productivity- a proposition acceptable
on both logical and empirical grounds; (b) It is true that if productivity in non-market activities
were to advance as rapidly as in market activities relative prices for household (time) intensive
commodities would not change over time, eliminating the substitution effect. But income
growth due to productivity growth would reduce the share of income spent on time intensive
commodities, hence of time spent in the household, provided the income elasticity of demand
for time intensive commodities is less than for other commodities, i.e. less than unitary. This
very plausibly applies to production of necessities which require a great deal of household time
such as food, shelter and other utilities including children.
10 For a detailed analysis see Becker(1965) and Mincer(1962).8

Small income elasticities are, indeed, observed in empirical demand functions for
numbers of children, but large ones for expenditures on children's "quality"11. Here both the
substitution and income effects work in the same direction :Much of the expenditure on market
goods substituted for non-market time as inputs to the raising of children are purchased
educational inputs. And the income elasticity of demand for "quality" of children such as their
education is much greater than the elasticity of demand for quantity, as the analogy with
consumer durables would predict, and is indeed observed.
In sum, the growth of human capital of children is due to all three developments:
relative price changes due to increases in the cost of time, standard income effects, and
productivity effects.
I portrayed the growth of women's labor force, and reductions in fertility as jointly
dependent on economic or wage and income growth, and children's human capital growth as
an outcome. Of course, labor force growth and reduction of family size also exert direct
negative effects on one another, thereby speeding the processes.
The growth of human capital as an outcome is not restricted to children, it also
extends to women as they contemplate their future role in the market and in the family. Two
considerations lead to incentives for women's expanded investment in themselves: (1) As time
spent in the workforce increases with improved health and longevity, and in child care
decreases, the payoff to human capital investments at school and on the job grows since the
payoff period is lengthened. Increases in school enrollment and in job training of women are
indeed observed in correlation with labor force growth, especially with the growing continuity
of labor market activities (Mincer, 1993).
11 Voluminous evidence is cited in T.W.Schultz(1974) and Becker(1981).9

(2) The increasing marital separation and turnover may be related to the declining division of
labor in the family and to reduced parental stakes in children as their number declines.
Awareness of a high probability of divorce which is likely to cause an income loss to the
spouse without a market career leads to a precautionary growth of market work activities to
ensure economic independence12. Increased investments in education and training, delayed
marriage and fertility are vital parts of this response to risk, and more generally to the growing
expectation of a long working life.
Part II: Demand Side
All the described effects of economic growth on human capital formation whether
direct or indirect, generate continuously expanding supplies of human capital. Higher incomes,
the increased cost of time, city living, the demographic transition, and changing roles of
women in the market and in the family - all increase the motivation for human capital
investment by individuals and families.
But this is not a complete explanation of the unceasing upward trend in human capital
accumulation. Theoretically, a trend due to the expansion of supply is self limiting: Sooner or
later such investments would be curtailed as the rate of return on human capital would decline
and fall below the rates on alternative investments. In fact, rates of return to human capital
have not declined over the past century, just as rates on physical capital remained trendless. In
theory, the obvious inference is that secularly growing market demands for human capital lifted
the rates of return upward as supply grew, in part as a response to rising demand. The net
outcome was a fluctuating but trendless rate of return on human capital investments.
12 See Johnson and Skinner(1986)10

Industry demands for skilled, educated labor increases either because demand for its
services and products increases or because its productivity grows as a result of physical capital
accumulation or of technological change.
When human capital is viewed as a factor of production, coordinate with physical
capital and "raw" or unskilled labor, a hypothesis of complementarity between physical and
human capital implies growth of demand for human capital as a consequence of physical
capital accumulation (Griliches 1969). Physical capital accumulation raises the marginal
product of human capital more than that of raw labor, producing wage(profitability ) incentives
for the conversion of labor into human capital by means of training and education.
The accumulation of physical capital is not exogenous, however. Indeed the demand
for both physical and human capital responds to opportunities for profit that emerge from cost-
reducing and product innovating changes in technology.
Secular growth of demand for human capital, resulting from skill-biased technological
change (Nelson and Phelps 1966) or from physical-human capital complementarities, offers a
plausible resolution of the apparent puzzle of trendless rates of return on education in the face
of continuous upward trends in education13. Except for the agricultural context (Griliches,
Welch, T.W.Schultz) these hypotheses were not subjected to empirical verification until quite
recently.
Thanks to the availability of rich microdata sets and some indexes of technological
change at the sectoral level, it has become possible to test the hypothesis that the pace of
technology affects the demand for human capital, using U.S. data covering the past two or
three decades. Changes in technology are difficult to measure, so the tests are largely indirect.
13 This is not to claim that technological change is always skill biased. Shortages of skills canbe ameliorated by skill saving technological responses over some time periods.11

They use contributing factors such as R & D intensity, or consequences such as growth of
productivity as demand shifters.
Using a variety of microdata sets, Lillard and Tan(1986) as well as Bartel and
Sicherman(1995) found a greater incidence of training in industries whose productivity growth
was fastest. Bartel and Lichtenberg(1987) report that, based on census data, relatively more
educated workers were employed in those manufacturing industries( in 1960, 1970, and 1980)
where capital equipment was newer and research and development (R&D) expenditures were
more intensive. Extending the census data to all broadly defined industries (18 sectors) , Gill
(1989) observed greater utilization of educated workers and steeper wage profiles in sectors
with more rapid decade- long productivity growth.
I tested the hypothesis that recent technological change is biased toward human capital
(Mincer 1989) on the 18 US industrial sectors, using annual PSID data of the male labor force
in 1968 through 1987, and Jorgenson-Fraumeni productivity growth (PG) indexes14 for the
period 1960 through 1985. The use of decade long averages for the intersectoral cross
sections of these indexes reduces much of the year-to-year error typical of such residuals.
Consistent with the skill bias hypothesis, the PSID data show that a more rapid pace
of technological change in a sector ( indexed by PG) generates a greater demand for education
and training of the sectoral workforce; as evidenced by:
1. The share of educated workers and the use of training is greater in the sector.
2. Educational wage differentials(in percent terms) are larger within sectors with rapid
productivity growth.
14 The Jorgenson-Fraumeni indexes contain measures of quantity and of "quality" of laborinputs. The latter are based on education, age, and sex of the workforce. The productivitygrowth residuals are, therefore, largely purged of human capital components. This insures thatthere is no spurious correlation in the empirical relations between productivity growth andhuman capital.12

3. Mobility of educated and, especially of young workers into these sectors is observable and
appears to erode much of the educational wage gains over the course of a decade.
4. Wage profiles are steeper in progressive sectors, as incidence of training is greater in
them.
5. Separation rates increase in the short run. They decline in the long run, presumably
because training intensifies.
All these findings can be viewed as responses of firms and workers to skill-biased
technological change. This is true of the utilization and wage effects and, with an additional
assumption, of the turnover effects. That additional assumption is a degree of firm specificity
in training investments necessitated by changing technology, or more precisely, significant
employer investments in such training.
In another study (Mincer and Higuchi 1988) we showed that the difference between
the United States and Japan in rates of technological change (measured by sectoral and
national Jorgenson type total productivity growth indexes) can explain why wage structures
and turnover rates differ across sectors and between the two countries. The remarkably low
turnover rate in Japan viewed as "lifetime employment" is frequently described as a reflection
of a culture that puts great emphasis on group loyalty. Yet in the same culture, turnover rates
were a great deal higher prior to the second world war. The difference appears to be an effect
of the remarkably rapid technological progress in Japan since 1950. This technological catch
up required sizable investments in human capital in schools and in enterprises. The
phenomenal growth of educational attainments in Japan in recent decades is well known. The
even more intense effort to adapt, train, and retrain workers for continuous rapid technological
changes is not visible in available data. However, effects of training on wage growth and
turnover are visible in the negative relationship between the two within industrial sectors
13

observed in Japan and in the United States. In both countries, industries with more rapid
growth had both steeper wage profiles and lower turnover rates. Indeed, using the parameters
of those relations, a rate of productivity growth in Japan that was four times that in the Unite
States in the period from 1960 to 1980 predicted rather well the over threefold steeper wage
profiles and the less than one-third frequency of firm separations in Japan. Somewhat weaker
but quite pronounced differences of the same sort were observed in a comparison of American
and Japanese plants in the United States, that is, in the same cultural environment. Here the
much larger investments in training and screening of workers in the Japanese plants was more
directly observable.
Positive cross-sectional associations between the pace of technological change in a
sector and indexes of relative demand for human capital do not, by themselves, establish a
causal relationship nor the direction of causality, as articulated in the hypothesis of skill-biased
technology.. To resolve the possible doubts that may attach to the interpretation based on
cross-sections, a companion time-series analysis was taken as the next step.
The time-series analysis of annual aggregates over a recent 25-year period is provided
in "Human Capital, Technology, and the Wage Structure" (Mincer, 1993). This study focuses
on the dramatic changes in wage differentials by education and by experience during the period
from 1963 through 1987. Both sets of differentials are, in part, indicators of the payoffs for
skill, or of rates of return on human capital investments. Fluctuations in them are the outcome
of changes in relative supplies of educated and experienced workers, and in relative demands
for them. Both relative supply and relative demand variables are brought to bear in equations
which "explain " the series of wage differentials. The findings shown in Table 4 substantially
confirm the cross-sectional results:
14

1. The year-to-year educational wage differentials (between college and high school
graduates) are very closely tracked by relative supplies of graduates in (roughly) their first
decade of work experience, and by changes in demand for more educated workers. The latter
is indexed by research and development expenditure per employee (RDE). as well as by trends
in service employment(RSG) relative to goods producing employment. Of these, RDE
accounts for most of the explanatory power.
2. With the decline of average productivity growth and the near cessation of average real
wage growth since the early 70's, the skill-biased changes in demand took the form of
increases in demand for workers with post-secondary education and decreases in demand for
workers at lower education levels. The decline in demand for workers at lower educational
levels is attributed by some analysts (e.g. Murphy and Welch, 1989) to the growth of world
trade: Imports and exports in U.S. trade more than doubled as a percentage of GNP between
1960 and 1990. As import competing industries tend to be less skill intensive this may have
led to a reduction in wages of less skilled workers15. In my regression findings (Table 4) the
effect of the net balance of trade variable (RNE) on the skill wage gap is significant but quite
small when substituted for research and development (RDE). It is not significant when added
to the RDE variable.
3. Changes in age distributions (cohort effects) account, in part, for the observed steepening
of the experience profile of wages in the 1970's: Increased proportions of young workers
("baby boomers") reduced their wages relative to older workers16. They do not account for
the steepening of the high school profile in the 1980s or for the stabilization of the slope of the
13 See articles in Kosters(1994) and a review by Burtless(1995). Based on a micro-levelstudies, described below, most economists doubt that the growth of trade had much of aneffect, if any, on the decline of less skilled wages.16 See Welch(1979) for the analysis of cohort effects.15

college profile between the 1970s and 1980s. A more complete explanation for the steepened
profiles is provided by additional variables that reflect the growing profitability of human
capital.
4. Capital-skill complementarity appears to be at work alongside skill-biased changes in
technology: When new equipment per worker is used as the measure of capital intensity, the
variable has a positive effect on the skill wage differential. It is not clear, however, whether
the skill bias embodied in new equipment represents anything different than the effect of new
technology.
The importance of skill-biased technological change in affecting relative demands for
human capital is invoked in an indirect manner in a number of micro-level studies17 that attempt
to shed light on the dramatic changes in the U.S. wage structure in the past two decades. In
these studies skill-biased technology is suggested as a hypothesis consistent with a variety of
observed changes at the industry or plant level. These changes include increased utilization of
skilled workers within a complete array of industries and plants whether or not they engage in
or compete with internationally traded goods and services. The increase in (relative) utilization
of skilled workers is positively correlated with the increase in skill wage gaps across industries
and plants. This is evidence for a growing demand for skills. If the growth of international
trade were the major factor in reducing the demand for unskilled labor in manufacturing
therefore its price, its relative utilization in non-manufacturing would have been positively
correlated with the skill wage gap, but the opposite is observed.
A natural corollary of the dramatic changes in the skill structure of wages in the
1970s and 1980s is in the substantial growth in wage (and income) inequality (as measured by
17 For comprehensive reviews see Levy and Murnane(1992) and Freeman (1995). No directmeasures of technology are available except for a study of computer use and its effects byKrueger(1991).16

e.g. the variance of log wage), especially in the latter period. The widening inequality is
viewed by some-perhaps many-observers as an ominous reflection of a deteriorating economy
and society. It has stimulated research by economists and sociologists.
The sense in which changes in wage inequality are a corollary of changes in skill
differentials in wages (by education and age) is obvious: When these differentials change, total
inequality changes in the same direction, unless within group differences move in an opposite
direction. This proviso is intuitively implausible, yet it did emerge in the 1970s, as some
observers report: residual (within education and age groups) inequality did not narrow, when
educational differentials shrank. Since residual inequality is the larger part of total inequality,
resolutions of puzzles about changes in residual inequality are a matter of some importance in
the developing research effort. (Levy and Murnane, 1992, Freeman, 1995)
Part III: Human Capital Supply Responses to Growth in Demand
A question of great interest is whether the growth of skill differentials in wages and more
generally in wage inequality, now seen for close to two decades, can be expected to reverse
itself, and if so, how fast. Changes in the age distribution might have some effect. As the
"baby boom" that steepened the wage profile was followed by a "baby bust", a flattening of
age profiles might have been expected, and this in turn would have contributed to a reduction
in inequality. But this did not happen, because the age profile of wages is affected not only by
demographic change but also by skill premiums, which rose in the 1980s. The major question,
therefore, is whether the supply of human capital can be expected to grow in response to high
rates of return sufficiently so as to eventually reduce the rates of return to a normal level, and
so reduce inequality as well.
17

The supply responses are analyzed in my recent study "Investment in US Education
and Training" (1994). In analyzing supply responses it is important to distinguish between
stocks and flows of human capital. The stock of human capital, such as educational
attainment, exerts an effect on educational differentials in wages, while the flow, measured by
enrollments responds to the wage differentials, or more precisely to rates of return. The rather
lengthy lag of the build up in the stock of educational attainment following changes in the
enrollment gives rise to apparent paradoxes such as the growth of educational supplies
(attainment) in the 70s when the rates of return were falling, and the leveling of supply when
the rates were rising steeply. Correctly understood, the 70's decline of rates is due to the
effect of an increasing stock accumulated by growth of enrollment in the 60s when rates were
rising. Stocks leveled off in the 80s as flows of enrollment declined in the 70s in response to
declining rates. Consequently the growth of rates of return in the 80s was due to upward
shifting demand as was shown in Table 4.
According to human capital theory, investments in education (school enrollments and
participation in training) respond positively to prospective rates of return as well as to parental
education and income, and respond negatively to tuition costs. In Table 5 parental education
was used to represent both informational and financial advantages facilitating the education of
children. Since the measure of the educational wage differential, used in the empirical analysis
is not a rate of return, it misses the direct (net tuition) costs of schooling as a factor which is
included in Table 5. The prospective educational wage premia are visualized as the ratio
(minus unity) of wages of college to high school graduates about a decade after graduation,
which are currently observed by families and students. This is the "overtaking stage of
experience" which is minimally affected by job training (Mincer 1974).
18
At all stages- enrollment rates (1) in October following high school graduation, (2) of
high school graduates aged 18-24, and (3) of the population of 18-24 years old- the response
to wage premium and to parental education was positive and significant, while tuition had a
negative effect.
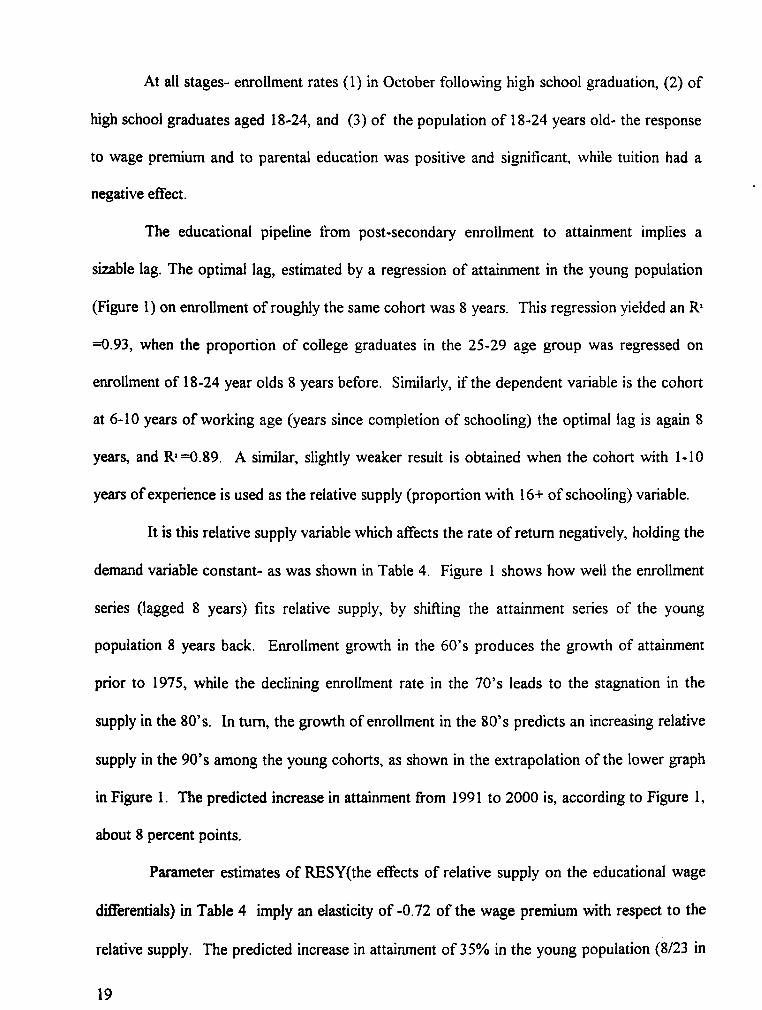
The educational pipeline from post-secondary enrollment to attainment implies a
sizable lag. The optimal lag, estimated by a regression of attainment in the young population
(Figure 1) on enrollment of roughly the same cohort was 8 years. This regression yielded an R2
=0.93, when the proportion of college graduates in the 25-29 age group was regressed on
enrollment of 18-24 year olds 8 years before. Similarly, if the dependent variable is the cohort
at 6-10 years of working age (years since completion of schooling) the optimal lag is again 8
years, and R l=0.89. A similar, slightly weaker result is obtained when the cohort with 1-10
years of experience is used as the relative supply (proportion with 16+ of schooling) variable.
It is this relative supply variable which affects the rate of return negatively, holding the
demand variable constant- as was shown in Table 4. Figure 1 shows how well the enrollment
series (lagged 8 years) fits relative supply, by shifting the attainment series of the young
population 8 years back. Enrollment growth in the 60's produces the growth of attainment
prior to 1975, while the declining enrollment rate in the 70's leads to the stagnation in the
supply in the 80's. In turn, the growth of enrollment in the 80's predicts an increasing relative
supply in the 90's among the young cohorts, as shown in the extrapolation of the lower graph
in Figure 1. The predicted increase in attainment from 1991 to 2000 is, according to Figure 1,
about 8 percent points.
Parameter estimates of RESY(the effects of relative supply on the educational wage
differentials) in Table 4 imply an elasticity of-0.72 of the wage premium with respect to the
relative supply. The predicted increase in attainment of 35% in the young population (8/23 in
19
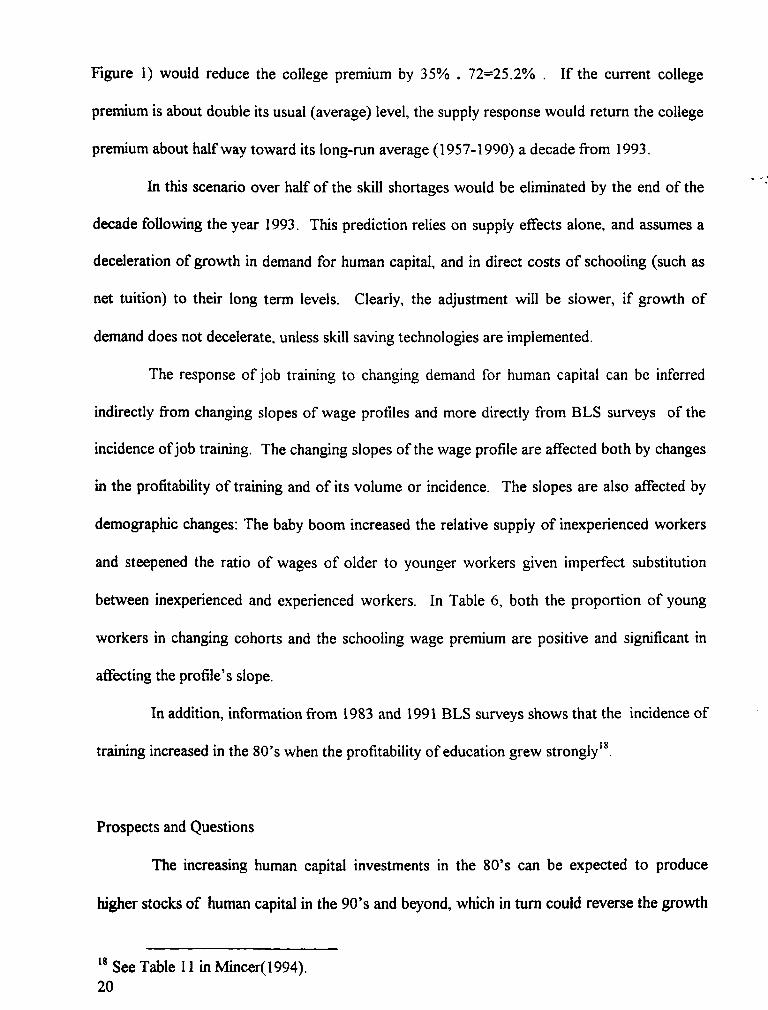
Figure 1) would reduce the college premium by 35% . 72=25.2% . If the current college
premium is about double its usual (average) level, the supply response would return the college
premium about halfway toward its long-run average (1957-1990) a decade from 1993.
In this scenario over half of the skill shortages would be eliminated by the end of the
decade following the year 1993. This prediction relies on supply effects alone, and assumes a
deceleration of growth in demand for human capital, and in direct costs of schooling (such as
net tuition) to their long term levels. Clearly, the adjustment will be slower, if growth of
demand does not decelerate, unless skill saving technologies are implemented.
The response of job training to changing demand for human capital can be inferred
indirectly from changing slopes of wage profiles and more directly from BLS surveys of the
incidence of job training. The changing slopes of the wage profile are affected both by changes
in the profitability of training and of its volume or incidence. The slopes are also affected by
demographic changes: The baby boom increased the relative supply of inexperienced workers
and steepened the ratio of wages of older to younger workers given imperfect substitution
between inexperienced and experienced workers. In Table 6, both the proportion of young
workers in changing cohorts and the schooling wage premium are positive and significant in
affecting the profile's slope.
In addition, information from 1983 and 1991 BLS surveys shows that the incidence of
training increased in the 80's when the profitability of education grew strongly18.
Prospects and Questions
The increasing human capital investments in the 80's can be expected to produce
higher stocks of human capital in the 90's and beyond, which in turn could reverse the growth
18 See Table 11 in Mincer(1994).20

of rates of return and of wage inequality at a later date, provided the growth of demand for
education and skilled workers decelerates. If so, estimates of the optimal lag between
attainment and enrollment and of elasticities of rates of return with respect to the supply of
human capital stocks, suggest a decline of rates of return half-way toward the "normal", long-
run level in the next decade or so.
The suggested period of readjustment of supply and of the wage structure is expected
to be longer than the decade long fluctuations in the past, because the skill-biased growth in
demand, especially in the past decade has been very strong, reflecting the birth of a new era of
information and communication technology.
Looking to the future, a more basic question remains concerning the scope of possible
supply responses to the growth in demand: If the current growth of demand for human capital
is based on skill-biased technology, and skills acquired at school and on the job are a function
of the quality of learning and not merely of the time spent in it, a bottleneck in the expansion
of human capital supply may lie in the inadequate quality of learning absorbed by the
workforce, especially at the elementary and secondary levels of schooling.
If this quality deteriorated or remained inadequate in the face of growing technological
demands in the past decade or two, it may have been a factor in the widening and persistence
of educational differentials and in inequality more generally. Evidence on trends in quality of
learning is difficult to come by, but apprehension about quality levels appears to be justified by
a variety of tests and international comparisons. At a deeper level quality problems are not
restricted to schooling. They start with childhood development before entering school. Human
capital inadequacies at home and in early schooling are likely to affect the efficiency of job
training. Therefore, quality bottlenecks are not effectively overcome by the substitution of
21

training for schooling: The needs for remediation increase the cost of training and are likely to
reduce job training as well.
Childhood human capital: Progress or Impediment?
In the past the division of labor within the family made the family economically
interdependent therefore more stable. The growth of real wages, the decline of fertility, and
the improvements in health and life expectancy are some of the factors generated by economic
growth which led to the growth of women's labor market participation and market career
orientation. The consequence is a considerable reduction in the division of labor within the
family. The greater economic independence of spouses (current or prospective) may well
generate increasing marital separation and turnover. I indicated before that this development in
turn augments women's incentives, on precautionary or insurance grounds, to increase their
investment in themselves. But the effects on the investment in the human capital of children
are uncertain: Even though greater human capital investments per child are the outcome of the
demographic transition and continue to rise with growing technology, deterioration is likely to
arise from growing family instability. The latter is reflected not only in high separation rates.
Postponements of marriages and reduction of marriage rates as well as growing cohabitation
and out of wedlock births are other manifestations of profound changes in family structure
experienced in the advanced countries of North America and Western Europe.
Do these new and growing family structures represent a viable adaptation to the
consequences of economic growth, or are they symptoms of decay created by economic
growth?
The implication for the human capital of the large proportion of children living with
only one parent or only one biological parent are problematic. Recent studies (McLanahan and
22

Sandefur, 1994) s h o w that children growing up in single parent households are twice as likely
to drop out o f high school , o f being unemployed, and o f becoming teenage parents themselves.
After separation, the single parent household loses about 4 0 % o f family income, children lose
most o f the contact with fathers, while growing proportions o f single mothers are away at
work most o f the day. Even when income and ethnicity are held constant, children in single
parent households are likely to suffer the consequences o f a reduced human capital
potential . (Dawson, 1988)
Since human capital is a factor in producing additions to human capital (Ben Porath
1967, Becker 1975) the disadvantages o f an impoverished early human capital stock cumulate
over the life-time19. Although the repercussions o f family instability are most pronounced in
the poor population, the proportion o f population in poverty has not g r o w n significantly in the
past t w o or three decades, whi le the growth o f family instability has been rapid in most o f the
advanced economies in that period2 0 . Is there a danger that e c o n o m i c growth is carrying seeds
o f its o w n destruction ? This "Schumpeterian" thought may be as w r o n g as its predecessor,
but more research will be required to evaluate the nature and dimensions o f the problem and
some policies will be needed to deal with it.
19 Lesser addition to human capital translate into flatter w a g e profiles.20 If the welfare system is a factor in the disintegration o f poor families, its contribution to theproblem may have actually diminished in the past t w o decades as welfare benefits declined inthe U.S.23

References:
Bartel, A. and F. Lichtenberg, " The Comparative Advantage of Educated Workers inImplementing New Technology," Review of Economics and Statistics. February,
1987.
Bartel, A and N.Sicherman, "Technological change and the Skill Acquisition of Young Workers".NBER working paper # 5107, May 1995.
Becker, G.S., Treatise on the Family, Harvard Press, 1981.
, " A Theory of Allocation of Time," Economic Journal. 1965.
, Human Capital, 2nd ed., Chicago U. Press, 1975.
Becker, G.S and H.G. Lewis, " On the Interaction between the Quantity and Quality of Children,"Journal of Political Economy. Suppl. March/April 1973.
Becker, G.S., K.Murphy, and R. Tamura," Human Capital, Fertility, and Economic Growth, " Journalof Political Economy, 1990.
Burtless, G., "International Trade and Earnings Inequality," Journal of Economic Literature. June1995.
Ben-Porath, Y. , "Production of Human Capital and the Life-Cycle of Earnings," Journal of PoliticalEconomy, 1967.
Dawson , D. A., " Family Structure and Children's Health and Well-being ," Journal of Marriage andthe Family . 53 , 1991 .
Freeman, R.B, Program Report on Labor Studies, NBER Reporter. Fall 1994.
Gill, I., "Technological Change, Education, and Obsolescence of Human Capital," Ph.D Thesis,U.of Chicago, 1989.
Goldin , C. .Understanding the Gender Gap , Oxford U. Press , 1990 .
Griliches , Z. , " Capital - Skill Complementarity ," Review of Economics and statistics , November ,1969.
Johnson W .R. and J . Skinner , " Labor Supply and Marital Separation," American Economic Review,vol. 76 , No. 3 , 1986 .
Jorgenson, D., F.Gollop, and B.Fraumeni, Productivity and the U.S. Economic Growth. Harvard U.Press, 1987; Updated series, 1990.
24

Katz , L. and K. Murphy , " Changes in Relative Wages , 1963 - 1987 ," Quarterly Journal ofEconomics , Feb. 1992 .
Kosters, M. ed., Trade and Wages. American Enterprise Institute, 1994.
Krueger, A. , "How Computers Have Changed the Wage Structure," NBER Working Paper #3858,1991.
Levy , F. and R . J . Murnane , " U . S . Earnings Levels and Earnings Inequality ," Journal ofEconomic Literature , September 1992 .
Lillard, L and H.Tan, Training: Who Gets It and What are Its Effects. Rand Corporation, March1986.
Lucas, R.E., " On the Mechanics of Economic Development," Journal of Monetary Economics. 1988.
Me Lanahan , S. and G. Sandefiir, Growing UP with a Single Parent, Harvard U. Press , 1994 .
Mincer , J. .Schooling . Experience . and Earnings , Columbia University Press , 1974 ; Reprintedby Gregg Revivals , 1993 .
Mincer, J., "Labor Force Participations of Married Women ," in Aspects of Labor Economics , H . GLewis , ed. , Princeton Press , 1962 .
, " Education and Unemployment of Women , "in Studies in Labor supply , E .Elgar, 1993 .
_>" Human Capital Responses to Technological Change in the Labor Market," in Studiesin Human Capital, E . Elgar Publ. , 1993 .
, " Human Capital, Technology , and the Wage Structure ," in Studies in Human Capital,E.Elgar Publ., 1993 .
, " Investment in U . S . Education and Training ,"NBER Working Paper 4844August 1994 .
Mincer, J. and T. Higuchi, " Wage Structures and Labor Turnover in the U . S . and in JapanJournal of the Japanese and International Economics , June 1988 .
Murphy, K. and F. Welch, "Wage Premiums for College Graduates," Educational Researcher. May1989.
Nelson R. and E. Phelps , " Investments in Humans , Technological Diffusion , and EconomicGrowth," American Economic Review , May 1966 .
OJ Hara, D.I., Changes in Mortality and Family Decisions Regarding Children. The RandCorporation, Santa Monica, 1972.
25
Romer, P., "Increasing Returns and Economic Growth," Journal of Political Economy. 1986.
Rosenzweig, M.R., "Human Capital Accumulation, The Family, and Economic Development," inHuman Capital and Economic Development. WE. Upjohn Institute, 1994.
Schultz, T.W. ed. Economics of the Family. NBER, 1975.
, " The Ability to Deal With Disequilibria," Journal of Economic Literature. 1975.
Schultz, T.P., Economics of Population , Addison-Wesley, 1981.
, " Human Capital, Family Planning, and Their Effects on Population Growth," AEA
Papers and Proceedings., May 1994.
Welch , F. , " Education in Production ," Journal of Political Economy , January 1970 .
, "Effects of Ccohort size on Earnings," Journal of Political Economy. October 1979.
26

C/l
D
£1
(2
e
2J - -S
1§o
Lab
o
1
s
1
ife
oe4)Cu
11Jjj2W
"S
ta
11
>
abo
ri.g
ricu]
j <
3
capi
(per
8^
* 1eo usva t)
X oo
§
All
1c
*Sbct/S
/—S.
SO
»n
m
^-vfS
00 -̂v
SoC8
N P
<**
o
so"
44%
840
*n
•n" i
oOAe
s P
oSO
63.0
%
N P
q
SO
SO
oosO^
O\
v PP^
qoo
oONo>
dov<
sCO00
co
1g
ical
Sta
t
c/i
<u
oV)oto
Sta
tica
lor
i
COONON
t:
Hep
o
H<uSOuo
|
CO
U
oCO

Table 2
Intercountry Comparisons (1990 and before )*( By Level of Income)
Countries:
Education% Postsecondary2
Years of school3, MaleYears of school3,femaleReal GDP per capita4
Rate of Growth (1965-1980 )5
Rate of Growth (1980-1990 )5
% Urban Population1990% Urban Population1960Life Expectancy 1991Life Expectancy 1960Infant Mortality6
Total Fertility ratePopulation GrowthRate 1960 - 1991Rate 1990 - 2000Percent of Women inLabor Force
High Income(1)
11.4%10.910.7
$18,1703.0%
2.4%
78%
69%
76.469.61.4%1.8
8.542%
Middle Income(2)
3.0%6.15.0
$4,8303.1%
1.3%
60%
41%
67.254.14.6%3.3
2.01.632%
Low IncomeAll Excl India &
China(3) (4)
.6%4.32.2
$1,5102.7%
4.6%
29%
17%
61.944.27.7%3.8
2.21.933%
.6%3.11.5
$1,3201.9%
1.6%
26%
13%
54.741.09.8%5.5
2.62.528%
NOTES:1 High Income - GNP per capita >$6,000 (35 countries)
Middle Income - GNP per capita >$500 to $6,000 (92 countries)Low Income - GNP per capita <$500 (46 countries)
2,3 Population 25+4 Purchasing Power Parity ($)5 Rate of Growth of GNP per capita6 Per thousand live births
SOURCE : UN ,Human Development Report, 1993 .
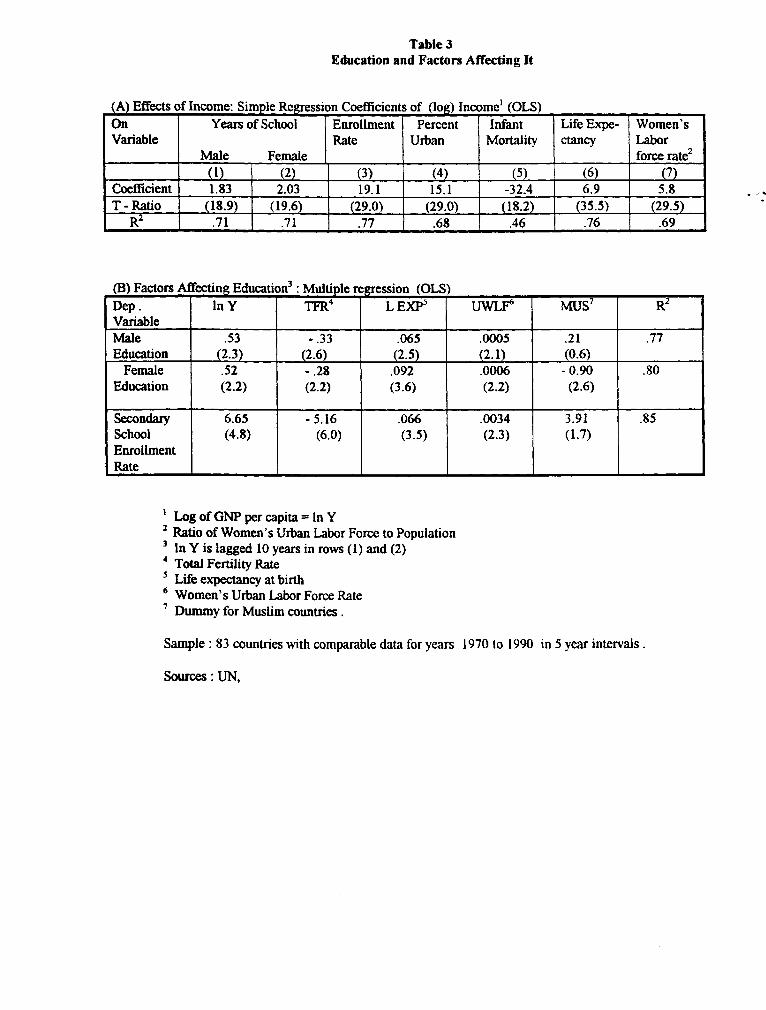
Table 3Education and Factors Affecting It
(A) Effects of Income: Simple Regression Coefficients of (log) Income1 (OLS)OnVariable
CoefficientT-Ratio
R2
Years of School
Male Female(1)1.83
(18.9).71
(2)2.03
(19.6).71
EnrollmentRate
(3)19.1
(29.0).77
PercentUrban
(4)15.1
(29.0).68
InfantMortality
(5)-32.4
(18.2).46
Life Expe-ctancy
(6)6.9
(35.5).76
Women'sLaborforce rate2
(7)5.8
(29.5).69
(B) Factors Affecting Education3: Multiple regression (OLS)Dep.VariableMaleEducation
FemaleEducation
SecondarySchoolEnrollmentRate
lnY
.53(2.3).52(2.2)
6.65(4.8)
TFR4
-.33(2.6)-.28(2.2)
-5.16(6.0)
LEXP5
.065(2.5).092(3.6)
.066(3.5)
UWLF6
.0005(2.1).0006(2.2)
.0034(2.3)
MUS7
.21(0.6)
-0.90(2.6)
3.91(1.7)
R2
.77
.80
.85
1 Log of GNP per capita = In Y2 Ratio of Women's Urban Labor Force to Population3 In Y is lagged 10 years in rows (1) and (2)4 Total Fertility Rate5 Life expectancy at birth6 Women's Urban Labor Force Rate
7 Dummy for Muslim countries .
Sample : 83 countries with comparable data for years 1970 to 1990 in 5 year intervals
Sources: UN,

Table 4Educational wage differentials (college - high school)1 1963 - 1987
Variables
Intercept
RESY.2
DR.2
PG
RDE.2
RNE
RSG
EQ
R2
(I)-0.09(1.4)- 0.065
(2.2)
1.12(2.2)
-0.011(4.5)
0.69
(2)-0.59
(3.4)- 0.086
(1.9)-0.20(4.6)0.45(1.00)
0.088(4.1)
0.80
Coefficients(3)
-0.41(4.6)
- 0.080(3.0)
0.00024(12.3)
0.044(3.5)
0.91
(4)0.06(1.0)
0.081(1.1)
-0.14(2.7)
0.88(1.9)
0.000064(3.4)0.75
(5)-0.14
(3.5)0.002(0.2) * •
0.00025(9.0)
0.000028(2.1)
0.89
Notes
t - values in parentheses. Excluded variables not significant. Subscripts.2 and .3 denote a 2-year and 3-year lag.
RESY- Proportion of young college+graduates among young workers (experience 1-10 years)
DR - Ratio of young (experience less than or equal to ten years) to total workforce
PG - Total Factor Productivity growth (Jorgenson measure)
RDE- Research and Development Expenditure per worker
RNE - Merchandise Trade Balance as a ratio to GDP
RSG- Ratio of Service to Goods Producing Employment
EQ- Expenditure on New Equipment per Worker
1 Percent wage differential between male college and high school graduates with 6-10 years of work experience.
Source: Table 2 in Mincer(1993)

TablesEnrollment Rates (1967 - 1990)
T - statistics in parentheses ; elasticities in asterisks
ExogenousVariables Are 3 -yr moving avgsCollege WagePremium1
ParentalEducation2
Tuition
Intercept
Residual fromfirst regression
R2
%ofHSGraduates (1)Enrolled next Oct2.9(5.1)•0.45*3.7(3.7)•0.84*-0.007(2.9)•-0.81*27.7(3.1)
0.75
%ofHSGradsEnrolled , Age 18 - 24
(2) (3)1.3(3.2)•0.31*1.2(1.7)*0.42*-O.002(0.96)•-0.29*18.8(3.1)
0.69
1.3(4.3)•0.31*1.2(2.3)•0.43*-0.002(1.1)*-0.26+
18.8(4.1)0.46(3.9)0.82
% of PopulationAge 18-24 Enrolled
(4) (5)0.77(2.8)*0.23#
1.6(3.4)•0.73 •-0.0004(-0-3)*-0.08#
3.2(0.7)
0.79
0.77(3.6)•0.23*1.6(4.5)•0.74+-0.0003(-0-3)•-0.06*3.2(1-0)0.32(3.9)0.88
1 Percent Wage differential of male college and high school graduates with 6 - 1 0 years of experience2 Average schooling of males with 26-30 years of experience .
SOURCES : Table 6 in Mincer (1994)Column (1) : Condition of Education , 1992 , Table 7 -1Columns (2 - 5 ) : School Enrollment - Social and Economic Characteristics of students : October, 1992 , P20 - 474
All Variables are 3 - year moving averages

Table 6Slope of Wage Profile* (1967 - 1990)
( T - stats in parentheses ; elasticities in asterisks)
intercept
r,
DR
u
R*
High School-0.0165
(-2.9)0.31(7.8)
•0.68*0.06(5.1)
*0.61*0.0011(5.2)
•0.17*0.91
Collegen . s .
0.12(3.6)
•0.27*0.06(6.0)
*0.76*n . s .
0.60
All endogenous and exogenous variables are for males only.Two sets (one each for the two different columns above , corresponding to high school and college) of each of the endogenous andexogenous variables are used.
r, - College Wage Premium .DR - ratio of numbers of workers of 1-10 yrs experience to all workers with 1-40 years of experience .u - unemployment rates for recent high school grads .
rk at experience = 10 years, where r is the rate of return on post - school investments and k is the time - equivalentfraction of earnings spent acquiring those investments
n .s. = not significant
SOURCE : Table 10 in Mincer (1994).

Figure 1
or
36
34-
32
30
23
26
24
22
20
18
16
14.
12
10
figure I l
COLLEGE GRADS in the 2 5 - 2 3 populationshtftd 8 yr. versus 18—24 enroitmt rate
P
predictedvalues
5 7 | 5 9 1 6 1 I 6 3 I 6 5 I 6 7 1 6 9 I 7 1 I 7 3 I 7 5 i 7 7 1 7 9 I a i l 8 3 I 8 5 1 8 7 1 8 9 1 9 1 I58 60 62 64- 66 68 70 72 74- 76 73 80 82 84 86 88 90 92
Q enroUmt rate, 18—24 % coU ed. 25-29
Source: Figure 4 in Mincer (1994).

1994-1995 Discussion Paper SeriesDepartment of Economics
Columbia University1022 International Affairs Bldg.
420 West 118th StreetNew York, N.Y., 10027
The following papers are published in the 1994-95 Columbia University Discussion Paper serieswhich runs from early November to October 31 (Academic Year). Domestic orders for discussionpapers are available for purchase at $8.00 (US) each and $140.00 (US) for the series. Foreign orderscost $10.00 (US) for individual paper and $185.00 for the series. To order discussion papers, pleasesend your check or money order payable to Department of Economics, Columbia University to theabove address. Be sure to include the series number for the paper when you place an order.
708. Trade and Wages: Choosing among Alternative ExplanationsJagdish Bhagwati
709. Dynamics of Canadian Welfare ParticipationGarrey F. Barret, Michael I. Cragg
710. Much Ado About Nothing? Capital Market Reaction to Changes inAntitrust Precedent concerning Exclusive Territories.Sherry A. Glied, Randall S. Kroszner
711. The Cost of DiabetesMatthew Kahn
712. Evidence on Unobserved Polluter Abatement EffortMatthew E. Kahn
713. The Premium for Skills: Evidence from MexicoMichael Cragg
714. Measuring the Incentive to be HomelessMichael Cragg, Mario Epelaum
715. The WTO: What Next?Jagdish Bhagwati
716. Do Converters Facilitate the Transition to a New Incompatible Technology?A Dynamic Analysis of ConvertersJay Phil Choi
716A. Shock Therapy and After: Prospects for Russian ReformPadma Desai
717. Wealth Effects, Distribution and The Theory of Organization-Andrew F. Newman and Patrick Legros

1994-95 Discussion Paper Series
718. Trade and the Environment: Does Environmental Diversity Detract from the Case forFree Trade?-Jagdish Bhagwati and T.N. Srinivasan (Yale Univ)
719. US Trade Policy: Successes and Failures-Jagdish Bhagwati
720. Distribution of the Disinflation of Prices in 1990-91 Compared with Previous BusinessCycles-Philip Cagan
721. Consequences of Discretion in the Formation of Commodities Policy-John McLaren
722. The Provision of (Two-Way) Converters in the Transition Process to a New IncompatibleTechnology-Jay Pil Choi
723. Globalization, Sovereignty and Democracy-Jagdish Bhagwati
724. Preemptive R&D, Rent Dissipation and the "Leverage Theory"-Jay Pil Choi
725. The WTO's Agenda: Environment and Labour Standards, Competition Policy and theQuestion of Regionalism-Jagdish Bhagwati
726. US Trade Policy: The Infatuation with FT As-Jagdish Bhagwati
727. Democracy and Development: New Thinking on an Old Question-Jagdish Bhagwati
728. The AIDS Epidemic and Economic Policy Analysis-David E. Bloom, Ajay S. Mahal
729. Economics of the Generation and Management of Municipal Solid Waste-David E. Bloom, David N. Beede
730. Does the AIDS Epidemic Really Threaten Economic Growth?-David E. Bloom, Ajay S. Mahal
731. Big-City Governments-Brendan O'Flaherty
732. International Public Opinion on the Environment-David Bloom

1994-95 Discussion Paper Series
12>2>. Is an Integrated Regional Labor Market Emerging in the East and Southeast Asia?-David Bloom, Waseem Noor
734. Migration, Integration and Development-Abhijit V. Banerjee, Andrew Newman
735. Infrastructure, Human Capital and International Trade-Ronald Findlay
736. Short Ballots: Why Mayors Are in Charge of So Many Different Things-Brendan O'Flaherty
737. Demand for Environmental Goods: Evidence from Voting Patterns on California Initiatives-Matthew Kahn and John Matsusaka
738. Inflation and Stabilization in Poland 1990 - 1995-S.Wellisz
739. Paniculate Pollution Trends in the 1980's-M. Kahn
740. Why has Wage Dispersion Grown in Mexico? Is it the Incidence of Reforms or theGrowing Demand for Skills?-M.I. Cragg and M. Epelbaum
741. Russia's Transition Toward the World Economy:-P. Desai
742. Poland: Transition and Integration in the World Economy-S. Wellisz
743. Team Effects on Compensation: An Application to Salary Determination in the National HockeyLeague-T. Idson and L.H. Kahane
744. Economic Development, Growth of Human Capital, and the Dynamics of theWage Structure-J. Mincer


