JOURNAL OF ECONOMIC DEVELOPMENT 39 Volume 28, Number 2, December 2003 ECONOMIC DISADVANTAGES OF BLACKS IN HIGH BLACK PROPORTION CITIES CHEONSOO PARK AND BONG JOON YOON Ministry of Labor, Republic of Korea and State University of New York This paper proposes wage premiums for jobs in high black proportion cities as a source of the continuing economic disadvantages for poor blacks. The estimated hedonic model of individual wages confirms the presence of such wage premiums which result in high labor costs and economic stagnation in a black-concentrated region, while the regional black ratio regression indicates a significant statistical correlation between a region’s black ratio and its disamenities. From the empirical results emerge the following conclusions: First, the equality of the estimated wage premiums for high black ratio between blacks and whites precludes direct prejudice-based discrimination. A caveat, however, is that the full wage premiums are conferred upon workers moving freely across regions in search of better wages and amenities, not applying to the mobility-restricted or the non-employed. Second, the wage premiums for high black ratio, causing economic stagnation of a black- concentrated region, constitute a statistical discrimination against blacks. This is because, given the pre-existing poverty among inner city blacks, the victims of the regional economic decline are mainly those unskilled, poor blacks who suffer non-employment due to inadequate resources for job search and mobility. Keywords: Wage Premium, Black-concentrated Region, Statistical Discrimination JEL classification: J7, J3 1. INTRODUCTION Black Americans have long endured institutionalized discrimination, which has permeated their economic life. Since the seminal work of Becker (1957), numerous studies have shown how prejudice and discrimination hurt blacks economically by wage-employment discrimination and in other ways such as residential segregation (Rose-Ackerman (1975) and Yinger (1976, 1986)). Title VII of the Civil Rights Act of 1964 prohibits discrimination on the basis of race, gender or national origin in wages, hiring, layoffs and promotion. The affirmative action program followed civil rights policy to further hiring and promotion of minorities, especially blacks. Nevertheless, the economic disadvantages of blacks continue today, as shown by the persistent white-
Transcript
JOURNAL OF ECONOMIC DEVELOPMENT 39 Volume 28, Number 2, December 2003
ECONOMIC DISADVANTAGES OF BLACKS
IN HIGH BLACK PROPORTION CITIES
CHEONSOO PARK AND BONG JOON YOON
Ministry of Labor, Republic of Korea and State University of New York
This paper proposes wage premiums for jobs in high black proportion cities as a source of the continuing economic disadvantages for poor blacks. The estimated hedonic model of individual wages confirms the presence of such wage premiums which result in high labor costs and economic stagnation in a black-concentrated region, while the regional black ratio regression indicates a significant statistical correlation between a region’s black ratio and its disamenities. From the empirical results emerge the following conclusions: First, the equality of the estimated wage premiums for high black ratio between blacks and whites precludes direct prejudice-based discrimination. A caveat, however, is that the full wage premiums are conferred upon workers moving freely across regions in search of better wages and amenities, not applying to the mobility-restricted or the non-employed. Second, the wage premiums for high black ratio, causing economic stagnation of a black- concentrated region, constitute a statistical discrimination against blacks. This is because, given the pre-existing poverty among inner city blacks, the victims of the regional economic decline are mainly those unskilled, poor blacks who suffer non-employment due to inadequate resources for job search and mobility.
Black Americans have long endured institutionalized discrimination, which has permeated their economic life. Since the seminal work of Becker (1957), numerous studies have shown how prejudice and discrimination hurt blacks economically by wage-employment discrimination and in other ways such as residential segregation (Rose-Ackerman (1975) and Yinger (1976, 1986)). Title VII of the Civil Rights Act of 1964 prohibits discrimination on the basis of race, gender or national origin in wages, hiring, layoffs and promotion. The affirmative action program followed civil rights policy to further hiring and promotion of minorities, especially blacks. Nevertheless, the economic disadvantages of blacks continue today, as shown by the persistent white-
CHEONSOO PARK AND BONG JOON YOON 40
black gaps in wages and employment access. Aided by the civil rights policy, the black-white wage gap narrowed rapidly in 1960s and early 1970s, but the convergence has stagnated since then. (Leonard (1996), O’Neill (1990), Altonji and Blank (1999)). True, the affirmative action program has helped the black middle class, but the living standards of poor blacks have worsened relative to whites and to other blacks and even in absolute terms.1 Especially bleak is the poverty of blacks in the inner city afflicted with a dysfunctional educational infrastructure and lack of personal safety.
As a key factor in the slowdown of black-white wage convergence, Juhn, Murphy, and Pierce (1991) suggest unobservable school quality differences between blacks and whites, while O’Neill (1990), Maxwell (1994) and Neal and Johnson (1996) point out racial discrepancies in basic skills due to differences in education and family background. According to Juhn (1992) and Bound and Freeman (1992) the exit rate from non-employment and the employment rate of blacks, particularly less educated poor blacks, declined in relation to whites over the 1970s and 1980s. O’Regan and Quigley (1996) report that the employment decline of minorities is due to their isolation from whites and non-poor households. These researches identify the immediate contributing factors of inner city black poverty, namely isolation and low-quality education, but pay less attention to why these factors persist over time. They correctly point to blacks’ inaccessibility to jobs or residences in high-employment areas located outside black enclaves, but fail to explain the mechanism which prevents the black enclaves from attracting employers. Hence, the reason why the economic distress of the inner city blacks persists despite anti-discrimination laws and waning prejudice against blacks remains not fully answered.2
This paper is an attempt to help explain the dynamics of the perpetual economic plight of inner-city blacks despite eroding bigotry. We propose the presence of wage premiums for jobs in high black proportion cities as a source of the continuing economic disadvantages of poor blacks, constituting a statistical discrimination against them. Suppose workers require wage premiums to reside in areas of high black population, expecting that such a locale tends to offer poor regional amenities. The wage premiums worsen labor costs and profitability for the firms located in the region. This results in the shrinking job opportunities and economic decline of the region,3 which put into motion the equilibrating process to generate out-migration and a further increase in the wage premiums in order to compensate for the region’s aggravating amenities due to its economic decline. When the equilibrium is achieved, the residents, who could have left the region but chose to stay and receive the region’s wage premiums, are no worse off. Given pre-existing black poverty, it is predominantly blacks who suffer, and in
1 Kuran (1955, p. 144), Jaynes and Williams (1989, p. 275). 2 Already by 1972, 96% of whites endorsed equal employment opportunity for blacks, up from 42% in
1944. See Kuran (1994, p. 138). 3 This explains how a region’s economic stagnation can coexist with high wages, a seeming paradox.
ECONOMIC DISADVANTAGES OF BLACKS IN HIGH BLACK PROPORTION CITIES 41
particular poor inner city blacks. Lacking the financial resources to search or move for jobs elsewhere, they tend to be non-employed, not realizing the compensating wage premiums for the region’s deteriorated amenities such as worse school quality. Consequently, isolation and low-quality education/skills of the poor inner-city blacks continue, perpetuating their low employment and poverty.
To validate our proposition, we estimate a hedonic model of individual wages, an innovation of which is to incorporate the proportion of blacks in a metropolitan area as a main explanatory variable that characterizes workers’ residential region. The estimated results show a statistically significant and positive coefficient for this variable, supporting the presence of wage premiums for jobs in regions with high proportions of blacks. What are the sources of these wage premiums? One possible source would be whites’ prejudice or taste against blacks, leading whites to view black population in an area as a disamenity, generating a compensating wage premium to persuade whites to locate there. Our empirical results, however, reveal that not only whites but also blacks earn this premium and that the black-white difference in the premium is statistically insignificant. This suggests statistical discrimination, rather than direct prejudice-based discrimination, as a source of the premium. That is, given the imperfect information on regional amenities, a high black ratio in a metropolitan area works as a signal for the region’s inferior amenities if easily observable black population ratio is statistically negatively associated with costly-to-observe regional amenities. Our estimated regional black ratio equation confirms the negative statistical association between black ratio and regional amenities. Consequently, the observed wage premium for a region with a high black proportion is a statistical discrimination against the region and therefore against its less mobile black residents, which helps perpetuate their poverty.
The paper is organized as follows: Section 2 estimates a hedonic model of individual wages and confirms the presence of wage premiums for jobs in high black proportion cities. Examining the source of such wage premiums, Section 3 demonstrates that they constitute statistical discrimination against blacks. Section 4 concludes the paper.
2. PRESENCE OF WAGE PREMIUMS FOR JOBS
IN HIGH BLACK PROPORTION CITIES Observed wages reflect equilibrating processes not just for the productivity of the
labor but also for various amenities whose levels differ across cities. When workers choose a residential location, they consider simultaneously the combination of wages and amenities offered by each city. If the offered compensating wage premium for the disamenities (lack of amenities) in a city is too small, the resident would choose to live elsewhere, which would raise the premium, and vice versa. The supply of and demand for labor determines the compensating wages for disamenities for each city. A hedonic wage model relates the observed equilibrium wage to the amenities of the residential location as well as the worker’s productivity traits.
CHEONSOO PARK AND BONG JOON YOON 42
2.1. A Hedonic Model of Individual Wages Consider identical workers with the same tastes and productivity who move freely
across regions that offer different wages, rents, and amenities, searching for regions with higher utility. At equilibrium, when the workers have exhausted the opportunities for utility-augmenting moves, utility levels are equalized among these workers, because otherwise they would move to a new location offering a higher utility. The relationships at this equilibrium among wages, rents and disamenities provide the workers’ wage acceptance function, an upward sloping wage-disamenity indifference curve. That is, the workers require wage premiums to compensate for disamenities, i.e., disagreeable regional characteristics.
Holding the rental rate constant, wage-disamenity indifference (wage acceptance) curves differ among workers with identical productivity but different tastes. Now, enter the demand side of the labor market: a firm situated in a city is constrained by fixed levels of the region’s disamenities and chooses the lowest cost worker given the constraint. At equilibrium, the observed combinations of wage and disamenity provide the wage opportunity (wage-disamenity) locus, which is the lower envelope of the wage-acceptance curves of different taste workers. From upward sloping wage acceptance curves, it follows that the wage also slopes upward with respect to disamenities along the wage opportunity locus for workers at a fixed level of productivity.4 Based on the wage opportunity locus, a hedonic model of individual wages relates the observed equilibrium wages to the regional levels of disamenities as well as the worker’s personal traits affecting their productivity.
Our hedonic model of earnings specifies the logarithm of wages )(ln W as follows:
εγβ +′+′= ZXWln , (1)
where β and γ denote coefficient vectors and ε a disturbance term; X lists workers’ personal characteristics such as demographic variables and human capital traits, which affect their productivity. Z is a vector of the characteristics - including local disamenities - of the regions where the workers reside. The region’s black proportion is a key variable in Z .
For data on wages and personal characteristics, X , we use the annual demographic file of the Current Population Survey (CPS), March 1994. Our estimation of the earnings function is confined to full-time workers earning above the minimum wage (149 dollars
4 The wage opportunity locus does not provide the shape of any individual wage-amenity tradeoff. Rather, it presents equilibrium marginal wage differentials for any disamenity, given a fixed level of worker productivity. When the fixed productivity assumption is dropped, the wage opportunity locus still slopes upward with respect to the disamenity unless productivity is negatively related to disamenity. See Henderson (1982).
ECONOMIC DISADVANTAGES OF BLACKS IN HIGH BLACK PROPORTION CITIES 43
per week) who worked for at least 40 weeks during 1993 and who were between 16 and 66 years old, excluding the self-employed.5 These individual data are matched with regional data at the level of the metropolitan statistical area (MSA).6 Besides amenities and black population ratio, the regional variables Z include the composite cost of living index for each MSA. The index is expected to affect the dependent variable, log of nominal wages, at least as a regional wage deflator.7 Definitions and summary statistics of the variables used in this study are listed in Appendix A and B.
2.2. Estimation Results
Table 1 provides the estimates of the earnings model (1) for the full sample.8 Our coefficient estimates for personal characteristics are consistent with human capital theory, and not very different from those reported in the earnings literature.9 The coefficient estimates of Female and Black show that women earn 26.3% less than men and blacks earn 9.9% less than non-blacks, both results being comparable to the race and gender gap estimates of the previous studies.10
Among the regional variables, first, Temperature shows a negative association with wages: colder winter weather, a disamenity, increases wages at a rate of 0.3 percent per 1 degree fall in mean January temperature. Second, air pollution and crime rate show positive coefficients, suggesting the presence of compensating wage premiums for these disamenities but the coefficients are statistically insignificant. Third, population size is associated with higher wages at a rate of 1.17 percent wage increase per 1 million increase in the population of the MSA.11 To the extent that a large population is accompanied by congestion and pollution, population size is an indirect measure of disamenities, which are to be compensated by the estimated wage premiums.12
5 By full time workers we mean the workers who worked more than 35 hours a week at the time of the
survey. $149 was calculated by 1 week x $4.25 (minimum wage in 1993) x 35 hours. 6 Our regional data sources are U.S. Bureau of Census (1990), Census of Population: CP-2-1B; U.S.
Bureau of Census (1991), State and Metropolitan Area Data: 1990; U.S. Bureau of Census (1992), City and Data Book: 1990; U.S. Environmental Protection Agency (1992), National Air Quality and Emissions Trends Report: 1991; U.S. Department of Commerce, Statistical Abstract of the United States: 1994.
7 We also used the housing cost index in place of the composite cost of living index. The estimated results were essentially the same, giving slightly worse statistical fit.
8 Here and below, only statistically significant coefficients will be discussed unless noted otherwise. 9 Our estimated rate of return to schooling is 7.3 percent. Experience increases wages at a decreasing rate
so that workers are paid highest around 32 years of experience. Married persons earn 8.3 percent more than unmarried persons.
10 See Altonji and Blank (1999) among others. 11 This is derived from ∂lnW/∂Population evaluated at the sample mean population of 3.1552 millions. 12 According to our estimate of the quadratic earnings profile with respect to the urban population size, a
CHEONSOO PARK AND BONG JOON YOON 44
Table 1. Wage Equation Estimated for the Entire Sample Dependent Variable : Log of Annual Earnings, Wln 1)
Variable Coefficient t-value Intercept 8.569231 165.140* Log of Living Cost Index 0.237363 3.338* Black Ratio2) 0.280792 3.591* Population3) 0.018688 3.257* Population Squared -0.001108 -3.043* Population Growth4) (%) 0.001842 3.734* Unemployment Rate (%) 0.000793 0.198* Temperature (Fo) -0.00303 -3.958* Air Pollution (mg/m3) 0.000131 0.687* Crime Rate 4.518x10⁻⁶ 1.180* Experience 0.036404 24.308* Experience Squared -0.000575 -17.010* Schooling 0.072871 35.785* Married 0.082978 8.085* Children -0.010468 -1.026* Infants 0.045346 3.718* Government Job -0.072429 -4.872* Veteran 0.004237 0.305* Union 0.104878 4.432* Move -0.02786 -1.486* Female -0.262881 -25.070* Black -0.099016 -6.6570*
Region North-East -0.015991 -0.796* South -0.037161 -2.063* West -0.014378 -0.657*
Industry Agriculture -0.29256 -4.671* Mining 0.267365 3.875* Construction -0.138857 -4.452* Durable -0.00252 -0.094* Non-Durable -0.02686 -0.956* Communication 0.056666 2.173* Wholesale -0.10248 -3.249* Retail -0.337744 -12.752*
city with 8.4 million population is the worst (with the highest compensating differential) for residents. This contrasts with Clark, Kahn, and Ofek (1988) who used 1980 PUMS data to report that a 4.9 million city is the worst.
ECONOMIC DISADVANTAGES OF BLACKS IN HIGH BLACK PROPORTION CITIES 45
Table 1. (Continued) Variable Coefficient t-value
Finance -0.087331 -3.216* Business Service -0.256669 -8.865* Personal Service -0.32991 -9.346* Entertainment -0.347592 -7.862* Professional Service -0.195176 -8.760* Occupation Managerial 0.552887 19.621*
Notes: 1) Excluded dummies for region, industry, and occupation are Midwest, Public Administration, and Handlers. 2) The black ratio variable is not in percent but proportion, the number of blacks over the population in the MSA. 3) If an MSA belongs to a conglomerate metropolitan area (CMSA), the CMSA population is used. 4) The growth rate of population for 10 years (1980-1990). *( ** ) indicates significance at 5% (10%) level.
Among other regional characteristics, population growth rate is positively associated
with wages at a rate of 0.18 percent increase in wages for each percent of population increase in the preceding 10-year (1980-1990) period, supporting the hypothesis that people move from regions with low-earnings to high-earnings. The coefficient estimate for the region’s unemployment rate is highly insignificant, which reflects two opposing effects canceling each other: unemployment is a disamenity which adds compensating premiums to wages, while it is also an indicator of excess labor supply which decreases wages.13
13 Some empirical results show that the positive disamenity effect overwhelms the negative excess labor
supply effect, which means that local wages are higher in a high unemployment region. Other studies show that the latter effect is predominant or the net effect is unclear. See Izraeli (1977), Roback (1988), Rosen (1979), and Smith (1983).
CHEONSOO PARK AND BONG JOON YOON 46
The composite cost of living index in logarithm is expected to have a coefficient of 1.0, if the index works solely as a deflator for purchasing power. But, its estimated coefficient shows that a 1 percent increase in the cost of living is associated with only a 0.24 percent nominal wage increase, implying that a higher cost of living may reflect better amenities the region offers and hence the shortfall of 0.76 percent can be explained also as a compensating wage differential. Region dummies show that wages in the South are lower than in the other three regions of the U.S. The South could be interpreted as an amenity, relating to the movement of population from the snowbelt to the sunbelt during recent decades. Occupations and industries were controlled by their corresponding dummy variables.
Our main interest lies in the effect of a region’s proportion of blacks (Black Ratio) on wages. According to Table 1, a one percentage point increase in the local Black Ratio is estimated to raise local wages by 0.28 percent, confirming the presence of wage premiums for jobs in high black proportion cities. Since job seekers consider job locations as well as wages, the estimate implies that they are unwilling to accept job offers in a high black ratio region unless they are paid higher wages. This positive slope of wage opportunity loci for the local black ratio suggests that workers may view high black proportion and disamenities alike, assuming that the racial composition of the local population does not affect local productivity. Hence, the estimated regional wage premium for large black ratio is a compensating wage differential as for disamenities.
3. WAGE PREMIUMS IN CITIES WITH HIGH BLACK PROPORTION
AS STATISTICAL DISCRIMINATION
Given that individuals collect a wage premium for working in cities with a high
proportion of blacks, what are the sources of the premium? We consider two competing postulates. The first emphasizes prejudice-based discrimination as the source in that whites consider black population in a community as a disamenity, requiring compensating wage premiums. Following this view, the higher the black proportion in a region, the more whites earn and the less blacks earn, as expounded by many sociologists.14
The alternative postulate we propose is statistical discrimination: black population proportion is positively correlated with regional disamenities which may result from inadequate public services due to a narrow local tax base, an inefficient allocation of state and federal funds, etc. Whites may not regard black population as a disamenity, but they can use an easily observable high black proportion of a metropolitan area as a convenient signal for the region’s various disamenities, accurate information on which may be costly to obtain. Then, the avoidance of disamenities by whites translates into
14 See Glenn (1963), Blalock (1967), Tienda and Lii (1987), and Cassirer (1996).
ECONOMIC DISADVANTAGES OF BLACKS IN HIGH BLACK PROPORTION CITIES 47
their avoidance of a high black proportion region unless paid compensating wage premiums, which economically damage the region and its poor black residents.
3.1. Wage Premium for a High Black Ratio Region as a Prejudice-Based
Discrimination? The postulate that the compensatory payments for a region’s high black ratio
originate in whites’ direct, prejudice-based discrimination against blacks can be tested by checking how blacks are compensated for the ratio. Clearly, it is not plausible that blacks discriminate against themselves. To examine the black-white differences in compensating wage premiums for an area’s high black ratio, we modify the specification for the earnings model. The new specification controls the sex effects by focusing on the white and black male sample and introduces interaction terms of the race dummy variable (Black) with the black population ratio (Black Ratio) as well as with other explanatory variables.
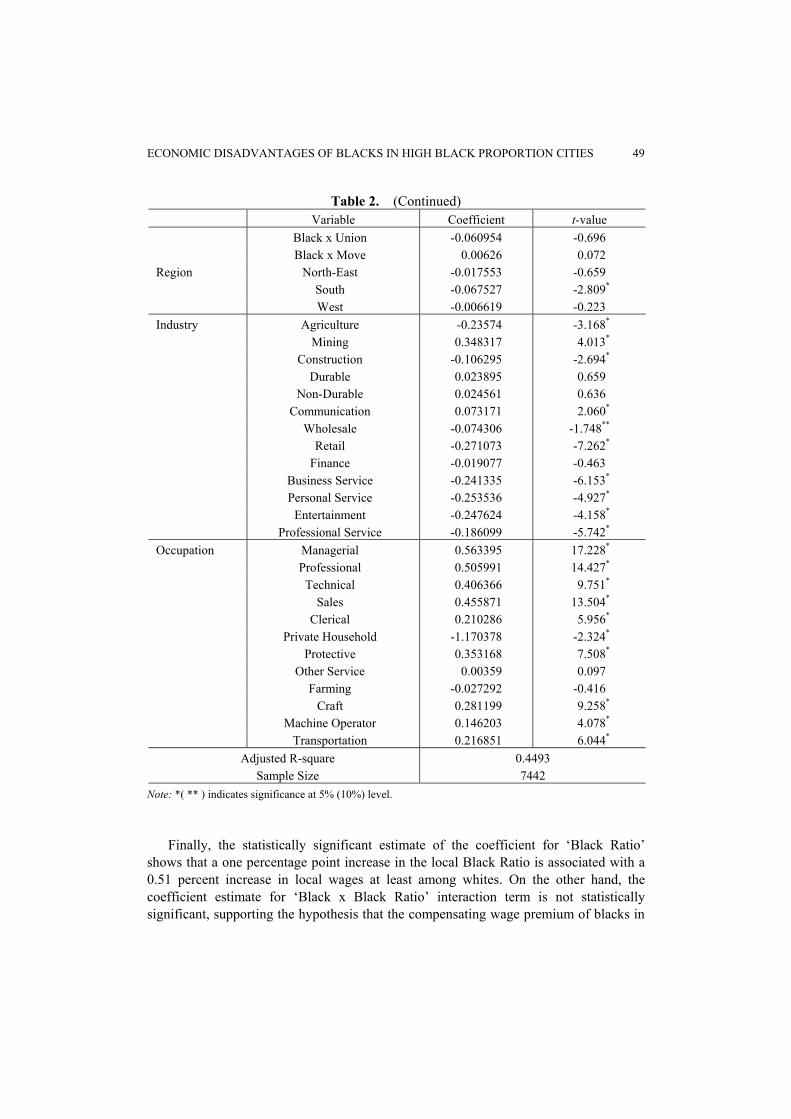
According to the estimated results of the new specification given in Table 2, almost all the explanatory variables with statistically significant coefficient estimates in the previous specification continue to have statistical significance of their coefficients with signs unchanged. An exception is ‘Black’, the coefficient estimate of which is insignificant. But the significant coefficients of ‘Black x Experience’ and ‘Black x Experience Squared’ reaffirm the black-white wage gap: the blacks’ return to experience is much lower than that of the whites for the entire work life and especially in the beginning of the career at 2.15 percent versus the whites’ 4.28 percent wage increase per extra year of experience. The estimated low return to experience among blacks reveals, though indirectly, the black-white gap in education quality, being consistent with findings of other studies.15
The coefficient estimates of ‘Black x Air Pollution’, ‘Black x Population’ and ‘Black x Population Squared’ among other black-interaction terms shows that, unlike white wages, black wages decrease with air pollution and population. A negative effect of pollution on wages can occur if the required anti-pollution regulation increases production costs or if high pollution is associated with a region’s dependence on old, smokestack industries and hence with lagging wages. The negative wage effect of population size seems to reveal that a city with a larger population, a disamenity for whites, tends to offer better public transportation network, an amenity for poor inner city blacks who may not own cars. Both effects indicate that blacks, lacking resources for mobility or for a job search elsewhere, do not equally share the compensating wage premiums whites realize in return for the region’s disamenities.
15 See Juhn, Murphy, and Pierce (1991b), O’Neill (1990), Maxwell (1994), and Neal and Johnson (1996).
CHEONSOO PARK AND BONG JOON YOON 48
Table 2. Wage Equation with Black-Interaction Terms Estimated for the White and Black Male Sample
Intercept 8.396908 121.807* Log of Living Cost Index 0.174332 1.767**
Black Ratio 0.507668 4.612* Population 0.015485 1.936** Population Squared -0.00112 -2.198* Population Growth (%) 0.001591 2.321* Unemployment Rate (%) 0.00096 0.174* Temperature (Fo) -0.002322 -2.190* Air Pollution (mg/m3) 0.000144 0.537* Crime Rate 4.587x10⁻⁶ 0.869* Experience 0.042753 19.535* Experience Squared -0.000665 -13.686* Schooling 0.073414 27.143* Married 0.134363 8.320* Children -0.003272 -0.225* Infants 0.070754 4.209* Government Job -0.070617 -3.056* Veteran -0.033739 -2.122* Union 0.158543 4.958* Move -0.040258 -1.551* Black 0.062692 0.328*
Black-Interaction Black x Black Ratio -0.154158 -0.567* Terms: Black x Population -0.043259 -2.107*
Black x Population Squared 0.003432 2.193* Black x Population Growth 0.001238 0.555* Black x Unemployment Rate 0.025974 1.319* Black x Temperature -0.003574 -1.042* Black x Air Pollution -0.001452 -1.858** Black x Crime Rate 6.199x10⁻⁶ 0.355* Black x Experience -0.021269 -2.925* Black x Experience Squared 0.000395 2.530* Black x Schooling 0.010069 1.098* Black x Married 0.027233 0.548* Black x Children 0.101997 2.098* Black x Infants -0.107679 -1.759** Black x Government Job 0.055783 1.149* Black x Veteran 0.019689 0.407*
ECONOMIC DISADVANTAGES OF BLACKS IN HIGH BLACK PROPORTION CITIES 49
Table 2. (Continued) Variable Coefficient t-value
Black x Union -0.060954 -0.696* Black x Move 0.00626 0.072*
Region North-East -0.017553 -0.659* South -0.067527 -2.809* West -0.006619 -0.223*
Industry Agriculture -0.23574 -3.168* Mining 0.348317 4.013* Construction -0.106295 -2.694* Durable 0.023895 0.659* Non-Durable 0.024561 0.636* Communication 0.073171 2.060* Wholesale -0.074306 -1.748** Retail -0.271073 -7.262* Finance -0.019077 -0.463* Business Service -0.241335 -6.153* Personal Service -0.253536 -4.927* Entertainment -0.247624 -4.158* Professional Service -0.186099 -5.742*
Note: *( ** ) indicates significance at 5% (10%) level. Finally, the statistically significant estimate of the coefficient for ‘Black Ratio’
shows that a one percentage point increase in the local Black Ratio is associated with a 0.51 percent increase in local wages at least among whites. On the other hand, the coefficient estimate for ‘Black x Black Ratio’ interaction term is not statistically significant, supporting the hypothesis that the compensating wage premium of blacks in
CHEONSOO PARK AND BONG JOON YOON 50
a high black ratio of the region does not differ from that of whites. That is, the empirical evidence invalidates the postulate that the wage premium for a high regional black ratio represents prejudice or taste-based discrimination of whites against blacks or that whites regard a high black ratio as a direct disamenity.
3.2. High-Black Ratio Wage Premium as Statistical Discrimination against Blacks
Not being a prejudice-based discrimination, the estimated wage premium in higher
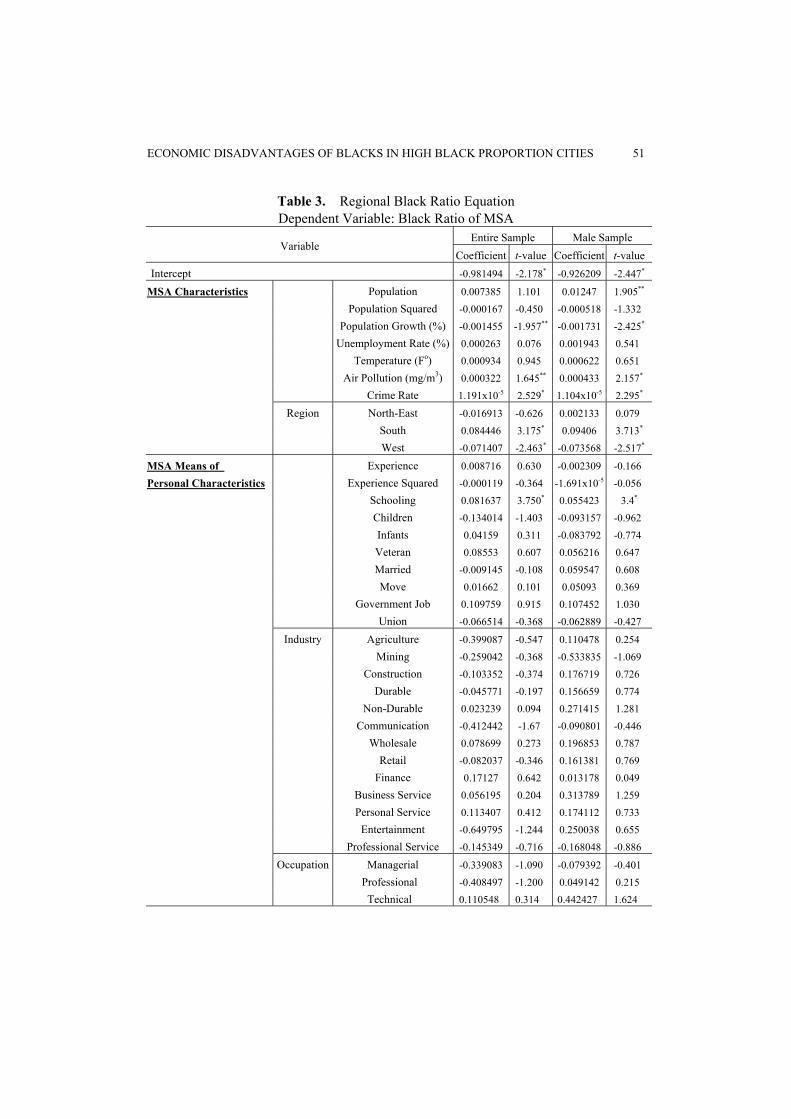
black-ratio regions will constitute a statistical discrimination, if black ratio is used as a collective signal of a region’s quality of life. Hence, we need to examine whether the ratio is positively correlated with regional disamenities such as high pollution, high crime rate, or inadequate schools, leading to the need for compensatory wages for the resident workers.16 In Table 3 we provide the results of an estimation where the black ratio in metropolitan areas is regressed on mean values of personal variables and regional characteristics, noting that the regression represents the statistical association or correlation between black ratio and its regressors, not causation. The results demonstrate overall positive correlation between black population ratio and regional disamenities.
First, the level of air pollution is positively associated with the black ratio at a rate of 0.03 percentage point increase in black ratio for each 1 mg/m3 increase in air pollution for the entire sample and 0.04 percentage point increase for the male sample. Second, the crime rate is positively associated with the black ratio at a rate of 0.001 percentage point increase in black ratio for each additional offense per population of 100,000. Third, the positive sign of the coefficient estimates of Temperature and Population, an indirect measure of disamenity to whites as discussed earlier, is also consistent with the positive black ratio-disamenities relationship, although the estimates are statistically not significant.
Fourth, black ratio is inversely associated with regional population growth: a 10 percent increase in city population during the preceding decade (1980-1990) is associated with a 1.5 percentage point decrease in the local black ratio for the entire sample and with a 1.7 percentage point decrease for the male sample. In other words, population growth - a sign of economic growth and prosperity - over the previous decade was mainly experienced in low black ratio regions rather than in high ones. The wage premiums for a high black ratio region, hurting the local economy by production cost increase, offers an explanation for the observed low (high) growth of a high (low) black ratio region. In the sense that high population growth is also a sign of desirability in living and superior amenities of a region, the inverse association between regional black ratio and population growth reinforces our observation that black population ratio in a region is associated positively with overall disamenities including quality of education, which is not included in our regression due to difficulty of acquiring data.
16 For the neighborhood effects in hedonic housing studies see Bartik and Smith (1987), among others.
ECONOMIC DISADVANTAGES OF BLACKS IN HIGH BLACK PROPORTION CITIES 51
Table 3. Regional Black Ratio Equation Dependent Variable: Black Ratio of MSA
Note: *( ** ) indicates significance at 5% (10%) level. The positive statistical association between black ratio and regional disamenities
makes the wage premiums for a high-black region a statistical discrimination not just against the region but also against its black residents, because the victims of the region’s economic decline caused by these wage premiums are mainly its poor black residents. To be specific, the wage premiums for a region’s high black ratio worsen the labor costs and profitability of local firms, and lead to loss of jobs and economic decline for the region. This underlies the negative association between black ratio and the region’s population growth, which is a sign of economic prosperity, as observed in the black ratio regression. Given pre-existing inner city black poverty, it would be mainly poorly- educated, unskilled blacks without adequate resources for mobility and job search who bear the full weight of regional decline, suffering non-employment.17 The wealthier residents, consisting of mostly whites and some middle class blacks, leave for another job elsewhere unless paid the full black ratio wage premium. As the wealthy families depart, financial support and leveraged performance monitoring on local schools weaken so that the quality of education worsens. With the local tax base dwindling due to the economic decline of the region and departure of the wealthy, public services deteriorate in personal and property security, pollution control, etc., further encouraging flight of non-poor households, increasing the black ratio, and aggravating the plight of the poor inner city blacks. At the equilibrium, the wealthy residents enjoy wage premiums to sufficiently make up for the poor regional disamenities. But the full wage premiums do not apply to the non-employed blacks trapped in the inner city due to lack of mobility, perpetuating their poverty. Therefore, while the wage premiums for high black ratio
17 For the high incidence of black non-employment, see Juhn (1992), and Bound and Freeman (1992).
ECONOMIC DISADVANTAGES OF BLACKS IN HIGH BLACK PROPORTION CITIES 53
regions are a statistical discrimination against such regions, they also constitute a statistical discrimination against black residents of these regions.
4. CONCLUDING REMARKS Motivated to help explain the persistent economic distress of the inner city blacks,
this paper focuses on the wage premiums required for jobs in high black proportion cities. The estimated hedonic model of individual wages confirms the presence of such premiums, while the regional black ratio regression indicates significant statistical association between a region’s black ratio and its disamenities. From these results emerge the following conclusions concerning the fate of inner city blacks.
First, the equality of the estimated wage premium for high black ratio between blacks and whites precludes direct prejudice-based discrimination. A caveat, however, is that the full wage premiums are conferred upon workers moving freely across regions in search of better wages and amenities, not applying to the mobility-restricted or the non-employed. Second, the wage premiums for high black ratio, causing the economic stagnation of a black-concentrated region, constitute a statistical discrimination against blacks. While a mobile worker is compensated for the region’s high black ratio, the firms are not and as a result their labor costs go up, leading to loss of jobs in the region. Given the pre-existing poverty among inner city blacks, the victims of the regional economic decline are mainly the unskilled, poor blacks who, without adequate resources for job search and mobility, suffer non-employment. Hence the wage premiums for a high black ratio city constitute a statistical discrimination against its black residents, not just against the region.
Our study of wage premiums for high regional black population proportion poses several limitations. First, an MSA, which we use to represent a region, may be non-homogenous, dividing into several sub-regions with differing amenities and racial makeup. Especially in large MSA’s with minorities concentrated in some sub-regions, the MSA average characteristics may misrepresent a worker’s residential area. Also, commuting workers would suffer less from the local disamenities than residents, affecting the interdependence of disamenities and wages. Neglecting sub-regions and commuter due to unavailability of data may have biased our estimates.18 Second, the analysis is confined to the black minority versus whites, partly for analytical simplicity and partly on account of the historical gravity of discrimination against blacks in the U.S. Whether similar findings hold among other minorities, especially Hispanic and Asian
18 With data on commuting unavailable, we have tried to estimate its influence by including interaction
terms of the disamenities/black ratio and the MSA’s population size in the wage regression model. But the estimated coefficients of the interaction terms turn out to be statistically insignificant, while the effects of other variables remain essentially unchanged from the model without these terms.
CHEONSOO PARK AND BONG JOON YOON 54
immigrants whose native tongue is not English, would be an interesting subject. Third, we fail to distinguish between blacks who suffer the negative consequences of the regional high black ratio, being unable to realize compensatory wage premiums, and those who do not. Identifying the differential characteristics of the two groups would help offer a practical suggestion to improve the fate of the poor inner city blacks.
These limitations require further research.
APPENDIX A
Summary Statistics of Variables Used for Wage Regression in Tables 1 and 2 Entire Sample White and Black Males
Variable: Definition Mean St. Dev. Mean St. Dev.
lnW: Log of the Yearly Personal Earnings 10.1132 0.675243 10.24889 0.674358 Log of Composite Cost of Living Index of MSA 0.071097 0.123879 0.066597 0.121518 Black Ratio: proportion of black population in MSA 0.132254 0.082375 0.130956 0.082063 Population1) (in millions) of the MSA or Conglomerate MSA 3.155172 4.224886 3.056365 4.123421 Population Squared 27.80348 63.89585 26.34168 62.09758 Population Growth2) (%) 17.43262 13.94209 17.15285 13.97138 Unemployment Rate of MSA in % 6.202835 1.936819 6.20125 1.909672 Temperature: Mean January Temperature of MSA in Fahrenheit 3) 38.51752 13.0691 38.43072 12.96015 Air Pollution (mg/m3): The Particulate Level of MSA in the Air 4) 99.28968 52.27898 98.26915 51.18696 Crime Rate per 100,000 population in 1989 in MSA 6634.909 1750.402 6625.141 1771.75 Experience: Age – Schooling - 6 18.73443 11.02049 18.90527 10.91554 Experience Squared 472.4212 485.0408 476.5421 486.7634 Schooling 13.6493 2.858395 13.55697 3.011655 Married = 1, if married; (= 0 otherwise) 0.614459 0.486741 0.670384 0.470105 Children = 1, if with kid(s) above age 6 and under age 18 0.320716 0.466769 0.326794 0.469073 Infants = 1, if with kid(s) under age 6 0.189906 0.392241 0.215399 0.411127 Government Job = 1, if government job 0.183961 0.387466 0.1595 0.366166 Veteran = 1, if veteran 0.138859 0.345812 0.240527 0.427432 Union = 1, if a member of Labor Union 0.036401 0.187291 0.041655 0.199814 Move = 1, if moved across counties 0.058516 0.234726 0.060736 0.238862 Female= 1, if female 0.432746 0.495474 Black = 1, if black 0.107171 0.309342 0.094061 0.291933 Region Dummies: North-East = 1, if resides in North-East 0.10021 0.300291 0.104004 0.305287
South = 1, if resides in the South 0.460083 0.498422 0.460898 0.498502 West = 1, if resides in the West 0.273584 0.445814 0.266192 0.441995
Excluded dummy: Midwest = 1, if resides in the Midwest
ECONOMIC DISADVANTAGES OF BLACKS IN HIGH BLACK PROPORTION CITIES 55
Notes: 1) If an MSA belongs to a conglomerate metropolitan area (CMSA), the CMSA population is used. 2) The growth rate of population in MSA or CMSA for 10 years (1980-1990). 3) Normal values over the 30-year period (average daily minimum), 1961-1990. 4) High second maximum 24-hour concentration (applicable NAAQS is 150mg/m3) in micrograms per cubic meter in 1991. Data Sources: Black ratio, Population from Census 1990; Crime Rate from State and Metropolitan Area Data 1991; Temperature from City Data Book 1992; Air Pollution from National Air Quality and Emissions Trends Report 1991; Unemployment Rate from Bureau of Labor Statistics, Local Area Unemployment Statistics; Composite Cost of Living Index from Statistical Abstract of the United States 1994; all other variables are from the CPS data.
CHEONSOO PARK AND BONG JOON YOON 56
APPENDIX B
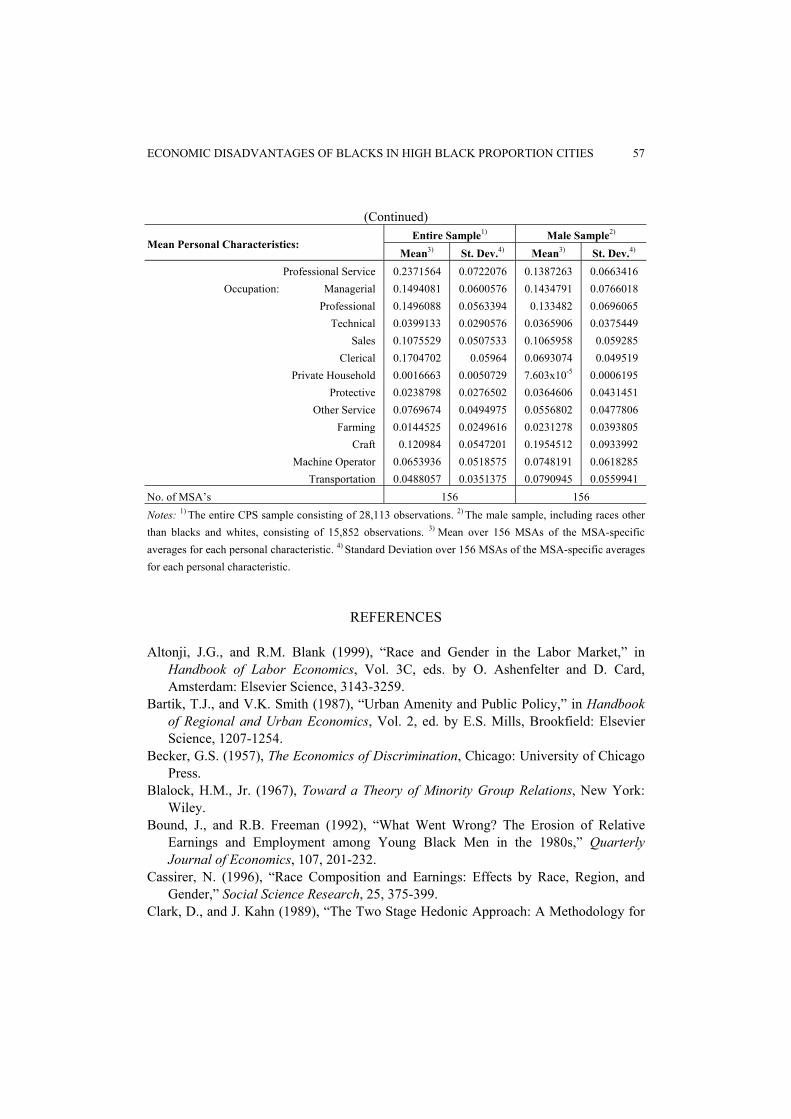
Summary Statistics for MSA Characteristics and MSA Means of Personal Characteristics used for the Black Ratio Regressions of Table 3
Variable MSA Characteristics:
Mean Standard Deviation
Black Ratio 0.1156408 0.0986499 Population 1.8601057 3.5445973
Population Squared 15.943624 60.072003 Population Growth (%) 12.409615 13.785639
Unemployment Rate (%) 6.7314103 2.781478 Temperature (Fo) 36.392949 12.444282
Air Pollution (mg/m3) 84.634615 43.915033 Crime Rate 6189.7244 1804.9309
Region: North-East 0.1217949 0.328102 South 0.410592 0.4918842 West 0.25 0.4344073
Entire Sample1) Male Sample2)
Mean Personal Characteristics: Mean3) St. Dev.4) Mean3) St. Dev.4)
Transportation 0.0488057 0.0351375 0.0790945 0.0559941 No. of MSA’s 156 156 Notes: 1) The entire CPS sample consisting of 28,113 observations. 2) The male sample, including races other than blacks and whites, consisting of 15,852 observations. 3) Mean over 156 MSAs of the MSA-specific averages for each personal characteristic. 4) Standard Deviation over 156 MSAs of the MSA-specific averages for each personal characteristic.
REFERENCES
Altonji, J.G., and R.M. Blank (1999), “Race and Gender in the Labor Market,” in Handbook of Labor Economics, Vol. 3C, eds. by O. Ashenfelter and D. Card, Amsterdam: Elsevier Science, 3143-3259.
Bartik, T.J., and V.K. Smith (1987), “Urban Amenity and Public Policy,” in Handbook of Regional and Urban Economics, Vol. 2, ed. by E.S. Mills, Brookfield: Elsevier Science, 1207-1254.
Becker, G.S. (1957), The Economics of Discrimination, Chicago: University of Chicago Press.
Blalock, H.M., Jr. (1967), Toward a Theory of Minority Group Relations, New York: Wiley.
Bound, J., and R.B. Freeman (1992), “What Went Wrong? The Erosion of Relative Earnings and Employment among Young Black Men in the 1980s,” Quarterly Journal of Economics, 107, 201-232.
Cassirer, N. (1996), “Race Composition and Earnings: Effects by Race, Region, and Gender,” Social Science Research, 25, 375-399.
Clark, D., and J. Kahn (1989), “The Two Stage Hedonic Approach: A Methodology for
CHEONSOO PARK AND BONG JOON YOON 58
the Valuation of Environmental Amenities,” Journal of Environmental Economics and Management, 16, 106-120.
Clark, D., J. Kahn, and H. Ofek (1988), “City Size, Quality of Life, and the Urbanization Deflator of the GNP: 1910-1984,” Southern Economic Journal, 54, 701-714.
Glenn, N.D. (1963), “Occupational Benefits to Whites from the Subordination of Negroes,” American Sociological Review, 28, 443-448.
Henderson, J.V. (1982), “Evaluating Consumer Amenities and Interregional Welfare Differences,” Journal of Urban Economics, 11, 32-59.
Izraeli, O. (1977), “Differentials in Nominal Wages and Prices between Cities,” Urban Studies, 14, 275-290.
Jaynes, G.D., and R.M. Williams (1989), A Common Destiny: Blacks and American Society, Washington, D.C.: National Academic Press.
Juhn, C. (1992), “The Decline of Male Labor Market Participation: The Role of Declining Labor Market Opportunities,” Quarterly Journal of Economics, 107, 79-121.
Juhn, C., K.M. Murphy, and B. Pierce (1991), “Accounting for the Slowdown in Black-white Wage Convergence,” in Workers and their Wages, ed. by M.H. Kosters, Washington, D.C.: AEI Press.
Kuran, T. (1995), Private Truths, Public Lies, Cambridge, MA: Harvard University Press.
Leonard, J.S. (1996), “Wage Disparities and Affirmative Action in the 1980’s,” American Economic Review (Papers and Proceedings), 86, 285-289.
Maxwell, N. (1994), “The Effect on Black-white Wage Differences in the Quantity and Quality of Education,” Industrial and Labor Relations Review, 47(2), 249-264.
Neal, D.A., and W.R. Johnson (1996), “The Role of Premarket Factors in Black-white Wage Differences,” Journal of Political Economy, 104(5), 869-895.
O’Neill, J. (1990), “The Role of Human Capital in Earnings Differences between Black and White Men,” Journal of Economic Perspectives, 4, 25-45.
O’Regan, K.M., and J.M. Quigley (1996), “Teenage Employment and the Spatial Isolation of Minority and Poverty Households,” Journal of Human Resources, 31(3), 692-702.
Roback, J. (1988), “Wage, Rent, and Amenities: Differences among Workers and Regions,” Economic Inquiry, 26, 23-41.
Rose-Ackerman, S. (1975), “Racism and Urban Structure,” Journal of Urban Economics, 2, 85-103.
Rosen, S. (1979), “Wage-based Indexes of Urban Quality of Life,” in Current Issues in Urban Economics, eds. by P. Mieszkowski and M. Straszheim, Baltimore: Johns Hopkins Press.
Smith, V.K. (1983), “The Role of Site and Job Characteristics in Hedonic Wage Models,” Journal of Urban Economics, 13, 269-32.
Tienda, M., and D.T. Lii (1987), “Minority Concentration and Earnings Inequality: Blacks, Hispanics, Asians Compared,” American Journal of Sociology, 93, 141-165.
ECONOMIC DISADVANTAGES OF BLACKS IN HIGH BLACK PROPORTION CITIES 59
U.S. Bureau of Census (1990), Census of Population: CP-2-1B, Washington, D.C.: U.S. Government Printing Office.
_____ (1991), State and Metropolitan Area Data: 1990, Washington, D.C.: U.S. Government Printing Office.
_____ (1992), City and Data Book: 1990, Washington, D.C.: U.S. Government Printing Office.
_____ (1994), Current Population Survey: May 1994, Washington, D.C.: U.S. Government Printing Office.
U.S. Bureau of Labor Statistics, Local Area Unemployment Statistics, http://stats.bls. gov/laud.htm.
U.S. Department of Commerce (1994), Statistical Abstract of the United States 1994, Washington, D.C.: U.S. Government Printing Office.
U.S. Environmental Protection Agency (1992), National Air Quality and Emissions Trends Report: 1991.
Yinger, J. (1976), “Racial Prejudice and Racial Residential Segregation in an Urban Model,” Journal of Urban Economics, 3, 383-396.
_____ (1986), “Measuring Racial Discrimination with Fair Housing Audits,” American Economic Review, 76, 881-893.
Mailing Address: Bong Joon Yoon, Department of Economics, State University of New York at Binghamton, Binghamton, NY 13902-6000, U.S.A. Tel: 607-777-2987, Fax: 607-777-2681. E-mail: [email protected]
Manuscript received January, 2003; final revision received August, 2003.