Page 1
Economic estimation of forest fire damage in N-E Italy1
Eva Valese2, Daniele Lubello2,Tommaso Anfodillo3, Raffaele Cavalli3, Davide Pettenella3, Tiziano Tempesta3, Vinicio Carraro3, Marta Garadozzi2, Emanuela Ramon4, Alice Lemessi4.
Abstract In Italy, about 45,000 ha of forest areas are burned each year. The ignitions are mainly
human-caused (over 90 percent) and about 50 percent are arsons. The recent Italian
National Law n. 353/2000 therefore prescribes that costs of human-caused fires must be
refunded by the person responsible (when discovered). Two main components of the costs
are identified: those paid for the active fire-fighting operations and the costs due to forest
ecosystem disturbance. This study proposes a methodological framework for estimating
the total costs of forest fires and applies the method to a specific area (Veneto region) of
the north-eastern Italy.
The costs of active fire-fighting were calculated taking into account all Regional forest
fire-fighting organizations. Data on volunteers and regional operators, forest fire statistics,
equipment and machinery types and use were studied and unit costs (€ h-1
) calculated at
both provincial and regional level.
Environmental costs are estimated accounting for different forest benefits:
- wood production;
- climate change mitigation (CO2 stocks);
- nature and biodiversity conservation;
- hydrogeological protection;
- tourism activity.
Environmental cost complies with the Veneto region forest situation. It is computed by
local prices and considering the 2003 Forest Inventory. This method is designed to require
very few input data to be measured in the burnt area namely the percentage of dead trees,
stand age, distance from the main road and the length of it that could be damaged by
falling rocks. A GIS-ACCESS application allows cost computation to be automated and to
integrate all the results. These results will be used in legal proceedings when the person
responsible for a fire is caught.
Introduction In Italy, about 45,000 ha of forest areas are damaged by fire each year (1970-
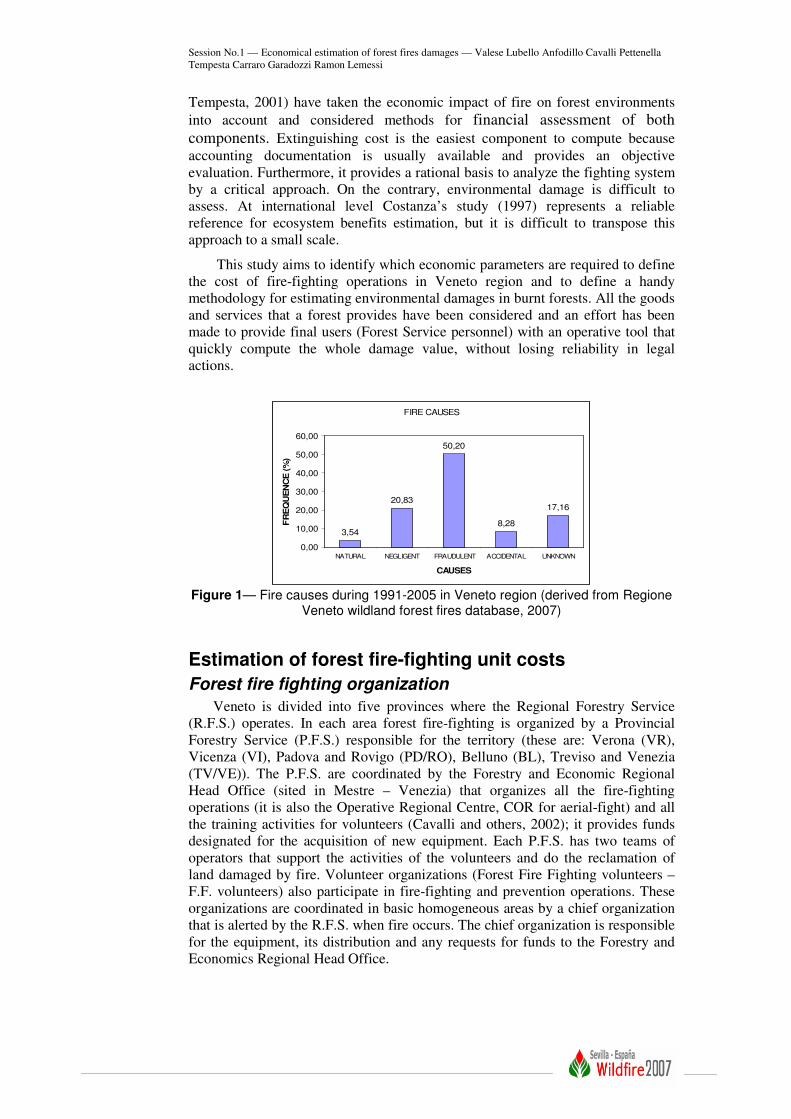
2005 National Forestry Service statistics5). More than 90 percent of forest fires are
human-caused (Lovreglio and others, 2006). In N-E Italy 50.2 percent are arsons
and this represents the main problem in fire management policy (figure 1). This is
the reason why at national level, as in most of European countries, specific
regulations have been approved by State (Law 353/2000) and regional authorities.
To improve the effectiveness of public actions in fire prevention, a State law
requires, on a compulsory basis, forest authorities to evaluate direct and indirect
financial and economic damage and to demand that the fire raiser pays a full
refund. More precisely, two main components of the damage are defined by the
law and should be evaluated: the total costs for fire fighting operations and costs
due to environment degradation. Several authors (Gonzalez-Caban and others,
1984; Gonzalez-Caban and McKetta, 1986; Wood, 1988; Marchetti and Pettenella,
1994; Baiguera and Pettenella, 1997; Giau, 1998; Hesseln, 2000; Marangon and
1 An abbreviated version of this paper was presented as a poster at the 4th International Wildland
Fire Conference, May 14-17, 2007, Sivilla. 2 PHd student, Dept. Te.S.A.F. – University of Padua, 3 Accademic, Dept. Te.S.A.F. – University of Padua 4 Veneto Region - Forestry and Economic Regional Head Office (Mestre – Venezia) 5 http://www2.corpoforestale.it/web/guest/serviziattivita/antincendioboschivo
Page 2
Session No.1 — Economical estimation of forest fires damages — Valese Lubello Anfodillo Cavalli Pettenella
Tempesta Carraro Garadozzi Ramon Lemessi
Tempesta, 2001) have taken the economic impact of fire on forest environments
into account and considered methods for financial assessment of both
components. Extinguishing cost is the easiest component to compute because
accounting documentation is usually available and provides an objective
evaluation. Furthermore, it provides a rational basis to analyze the fighting system
by a critical approach. On the contrary, environmental damage is difficult to
assess. At international level Costanza’s study (1997) represents a reliable
reference for ecosystem benefits estimation, but it is difficult to transpose this
approach to a small scale.
This study aims to identify which economic parameters are required to define
the cost of fire-fighting operations in Veneto region and to define a handy
methodology for estimating environmental damages in burnt forests. All the goods
and services that a forest provides have been considered and an effort has been
made to provide final users (Forest Service personnel) with an operative tool that
quickly compute the whole damage value, without losing reliability in legal
actions.
FIRE CAUSES
3,54
20,83
50,20
8,28
17,16
0,00
10,00
20,00
30,00
40,00
50,00
60,00
NATURAL NEGLIGENT FRAUDULENT ACCIDENTAL UNKNOWN
CAUSES
FR
EQ
UE
NC
E (
%)
I
Figure 1— Fire causes during 1991-2005 in Veneto region (derived from Regione
Veneto wildland forest fires database, 2007)
Estimation of forest fire-fighting unit costs
Forest fire fighting organization
Veneto is divided into five provinces where the Regional Forestry Service
(R.F.S.) operates. In each area forest fire-fighting is organized by a Provincial
Forestry Service (P.F.S.) responsible for the territory (these are: Verona (VR),
Vicenza (VI), Padova and Rovigo (PD/RO), Belluno (BL), Treviso and Venezia
(TV/VE)). The P.F.S. are coordinated by the Forestry and Economic Regional
Head Office (sited in Mestre – Venezia) that organizes all the fire-fighting
operations (it is also the Operative Regional Centre, COR for aerial-fight) and all
the training activities for volunteers (Cavalli and others, 2002); it provides funds
designated for the acquisition of new equipment. Each P.F.S. has two teams of
operators that support the activities of the volunteers and do the reclamation of
land damaged by fire. Volunteer organizations (Forest Fire Fighting volunteers –
F.F. volunteers) also participate in fire-fighting and prevention operations. These
organizations are coordinated in basic homogeneous areas by a chief organization
that is alerted by the R.F.S. when fire occurs. The chief organization is responsible
for the equipment, its distribution and any requests for funds to the Forestry and
Economics Regional Head Office.
Page 3
Session No.1 — Economical estimation of forest fires damages — Valese Lubello Anfodillo Cavalli Pettenella
Tempesta Carraro Garadozzi Ramon Lemessi
Collecting data
The research considered all the operations and costs incurred by volunteers
and R.F.S. in the years 2002, 2003 and 2004. In the last years an information
database based on GIS software has been introduced for the registration and
management of operations, but a regional database of equipment and its
deployment is still lacking: each chief area organization wrote the databases on
their own. For this reason, to collect data on personnel and equipment a
questionnaire was drawn up and given to each P.F.S. operators crew and to some
volunteer F.F. organizations. 22 out of 113 organizations were analyzed (almost
20% of the total). The organizations were assisted directly by a person responsible
for the research when help was asked for in getting input data.
Operators and volunteers
To characterize cost elements it is useful to separate P.F.S. operators from F.F.
volunteers. F.F. volunteers are divided into two categories, depending on the
required medical and physical check-up: those who can operate on the fire front
and those who cannot. Some essential data must be considered to estimate the total
hourly cost (Bacchini and others, 2005):
• personal protective clothing equipment;
• learning/training costs based on training courses already organized;
• medical check-up costs necessary to obtain physical suitability;
• insurance costs based on contracts signed with insurance agencies (only F.F.
volunteers);
• management costs of the organizations like paperwork, computer, phone bills,
water, etc. (only F.F. volunteers);
• refund of taxes paid by the employer (only F.F. volunteers);
• salary in relation to the hour and day of the service call (only P.F.S. operators).
To obtain an hourly unit cost, the amount of the different invoices is related to the
effective operative fire-fighting time during each year and the relative P.F.S.
Table 1 shows F.F. volunteer and R.F.S. operator hourly costs.
Table 1— Operators and volunteers costs.
Volunteers at the fire front BL PD/RO TV/VE VI VR unit
5.95 15.86 6.86 6.17 24.73 € h-1
Volunteers not at the fire front
5.16 12.08 5.65 5.31 19.69 € h-1
Regional fire-fighting operators
5.23 5.52 6.50 6.58 6.83 € h-1
+
Hourly costs for
regional operators
In
working
time
Out
working
time
Extra-time
night
Extra-time
holidays
Extra-time
holidays
night
Heading group (specialized super) 17.03 18.57 19.88 21.00 22.50 € h-1
Heading group (specialized) 15.97 17.42 18.65 19.70 21.10 € h-1
Operator (specialized super) 15.31 16.85 18.16 19.28 20.78 € h-1
Operator (specialized) 14.36 15.81 17.04 18.09 19.49 € h-1
Equipment costs elements
In Italy, machinery and equipment are usually divided into personal
equipment (protective clothing), manual equipment (fire tools), adapters and
accessories for pumps and helicopter cooperation, mechanical equipment (pumps,
chainsaw, etc.), machines (divided in 4 different categories according to
Page 4
Session No.1 — Economical estimation of forest fires damages — Valese Lubello Anfodillo Cavalli Pettenella
Tempesta Carraro Garadozzi Ramon Lemessi
overloaded mass and type of driving licence needed), as stated by Sulli and Marchi
(1995a; 1995b).
Different cost calculation elements where asked in the questionnaire:
• Initial investment (P, €);
• Undepreciated value (S, €);
• Actualization rate (ia, pure number);
• Economic life (N, years);
• Productive time (H, h y-1
or km y-1
for wheeled machines);
• Housing (Sh, € y-1
);
• Repair (R, € y-1
);
• Fuel (B, € y-1
);
• Lubricants (0.15*B, € y-1
);
• Taxes and insurances (IT, € y-1
);
• Tyres (T, € y-1
).
Adapting existing information in the literature (Miyata 1980; Hippoliti and
others 1980; Pettenella and Cutolo 1987; Sartori and Galletto 1992; Cross 1998;
Edwards 2001; Amman 2004; ASAE EP 496.2 2004), a general formula was
defined to calculate unit costs (C) of all the equipment used during fire-fighting
operations. Referring to the equipment category, different cost elements can be
considered or not. In the following general formula all the cost elements are
considered.
( ) ( )
H
ITTBShR
HN
SiPC a ++⋅++
+⋅
−⋅=
15,1
Estimates were made for each equipment category and averages for the
Veneto Region and Provinces were then given. A t-test was also performed to test
the difference between provinces. Helicopters and airplane flight costs per minute
refer to what was indicated in specific contracts that the Forestry and Economic
Regional Head Office signs periodically with specialized external enterprises.
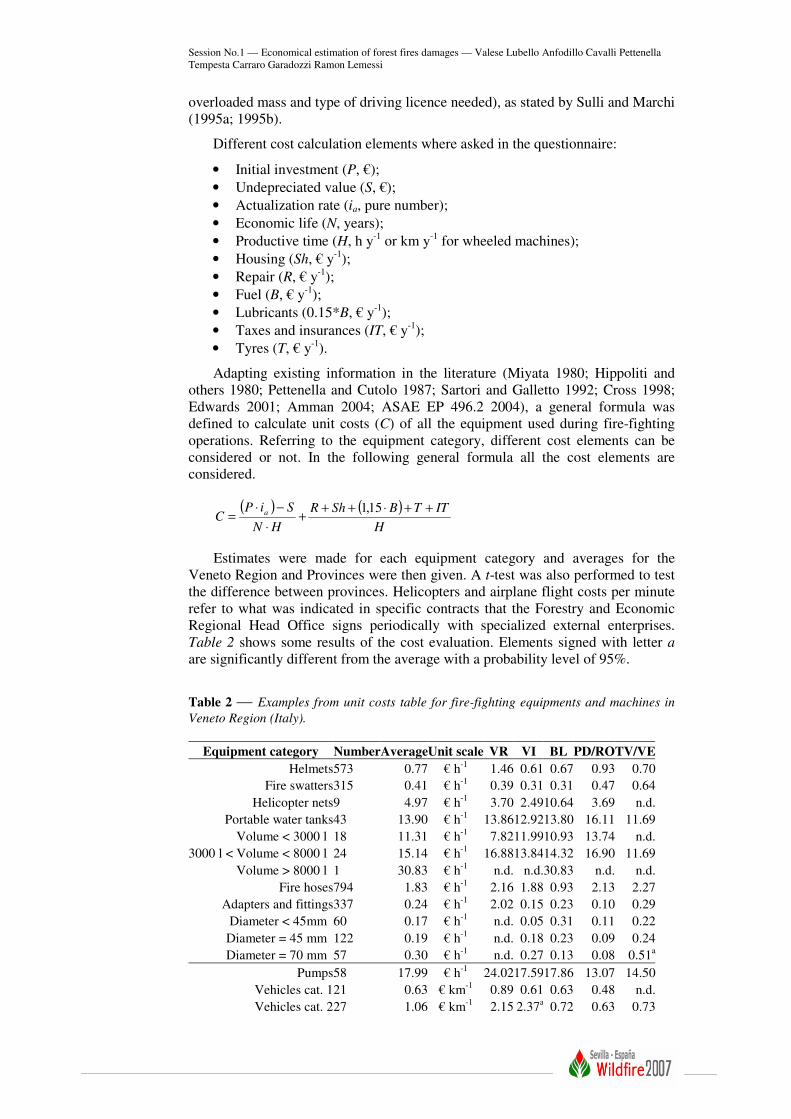
Table 2 shows some results of the cost evaluation. Elements signed with letter a
are significantly different from the average with a probability level of 95%.
Table 2 — Examples from unit costs table for fire-fighting equipments and machines in
Veneto Region (Italy).
Equipment category NumberAverageUnit scale VR VI BL PD/ROTV/VE
Helmets 573 0.77 € h-1
1.46 0.61 0.67 0.93 0.70
Fire swatters 315 0.41 € h-1
0.39 0.31 0.31 0.47 0.64
Helicopter nets 9 4.97 € h-1
3.70 2.4910.64 3.69 n.d.
Portable water tanks 43 13.90 € h-1
13.8612.9213.80 16.11 11.69
Volume < 3000 l 18 11.31 € h-1
7.8211.9910.93 13.74 n.d.
3000 l < Volume < 8000 l 24 15.14 € h-1
16.8813.8414.32 16.90 11.69
Volume > 8000 l 1 30.83 € h-1
n.d. n.d.30.83 n.d. n.d.
Fire hoses 794 1.83 € h-1
2.16 1.88 0.93 2.13 2.27
Adapters and fittings 337 0.24 € h-1
2.02 0.15 0.23 0.10 0.29
Diameter < 45mm 60 0.17 € h-1
n.d. 0.05 0.31 0.11 0.22
Diameter = 45 mm 122 0.19 € h-1
n.d. 0.18 0.23 0.09 0.24
Diameter = 70 mm 57 0.30 € h-1
n.d. 0.27 0.13 0.08 0.51a
Pumps 58 17.99 € h-1
24.0217.5917.86 13.07 14.50
Vehicles cat. 1 21 0.63 € km-1
0.89 0.61 0.63 0.48 n.d.
Vehicles cat. 2 27 1.06 € km-1
2.15 2.37a
0.72 0.63 0.73
Page 5
Session No.1 — Economical estimation of forest fires damages — Valese Lubello Anfodillo Cavalli Pettenella
Tempesta Carraro Garadozzi Ramon Lemessi
Vehicles cat. 3 8 5.24 € km-1
n.d. 3.85 1.03 5.12 6.38
Vehicles cat. 4 7 0.93 € km-1
0.65 1.51 0.81 0.39 n.d.
Regional helicopter 32.65 € min-1
National civil protection
service Canadair 86.10 € min-1
It must be underlined that equipment costs are mostly influenced by annual
utilization, which can reduce the hourly depreciation rate. It is obvious that annual
utilization depends on fire frequency and duration and consequently on related
operations. Unit costs listed in table 1 and table 2 refer to 2006. A yearly update is
possible using the excel-tool, thanks to recalculating factors, specific for each
equipment category and personnel, which have been calculated reassessing the
data obtained with the questionnaire.
Excel-tool for active fight costs evaluation
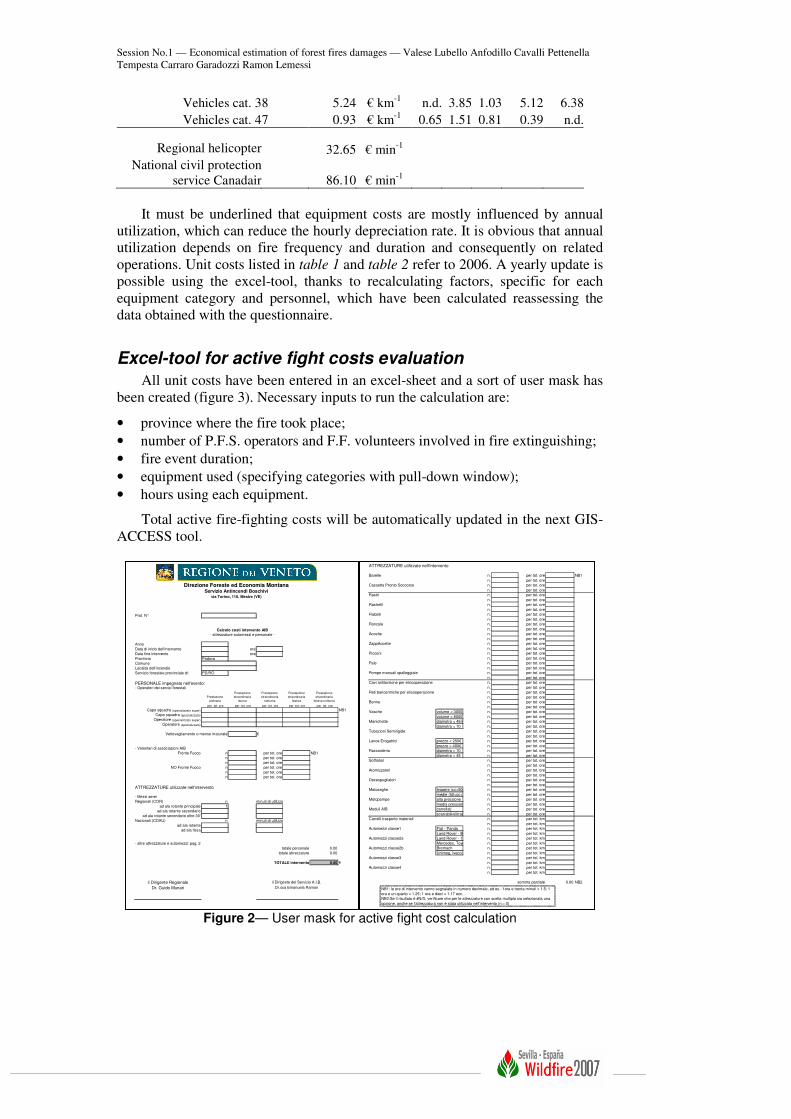
All unit costs have been entered in an excel-sheet and a sort of user mask has
been created (figure 3). Necessary inputs to run the calculation are:
• province where the fire took place;
• number of P.F.S. operators and F.F. volunteers involved in fire extinguishing;
• fire event duration;
• equipment used (specifying categories with pull-down window);
• hours using each equipment.
Total active fire-fighting costs will be automatically updated in the next GIS-
ACCESS tool.
Figure 2— User mask for active fight cost calculation
ATTREZZATURE utilizzate nell'intervento
Barelle n. per tot. ore NB1
n. per tot. ore
Cassetta Pronto Soccorso n. per tot. ore
n. per tot. ore
Rastri n. per tot. ore
n. per tot. ore
Rastrelli n. per tot. ore
n. per tot. ore
Flabelli n. per tot. ore
n. per tot. ore
Roncole n. per tot. ore
n. per tot. ore
Accette n. per tot. ore
n. per tot. ore
ZappAccette n. per tot. ore
n. per tot. ore
Picconi n. per tot. ore
n. per tot. ore
Pale n. per tot. ore
n. per tot. ore
Pompe manuali spalleggiate n. per tot. ore
n. per tot. ore
Cavi antitorsione per elicooperazione n. per tot. ore
n. per tot. ore
Reti baricentriche per elicooperazione n. per tot. ore
n. per tot. ore
Benne n. per tot. ore
n. per tot. ore
Vasche volume < 3000 l n. per tot. ore
volume > 8000 l n. per tot. ore
Manichette diametro < 45mm n. per tot. ore
diametro = 70 n. per tot. ore
Tubazioni Semirigide n. per tot. ore
n. per tot. ore
Lance Erogatrici prezzo < 250€ n. per tot. ore
prezzo > 400€ n. per tot. ore
Raccorderia diametro = 70 n. per tot. ore
diametro = 45 n. per tot. ore
Soffiatori n. per tot. ore
n. per tot. ore
Atomizzatori n. per tot. ore
n. per tot. ore
Decespugliatori n. per tot. ore
n. per tot. ore
Motoseghe leggere (cc<50cc) n. per tot. ore
medie (50<cc<70) n. per tot. ore
Motopompe alta pressione n. per tot. ore
media pressione n. per tot. ore
Moduli AIB carrellati n. per tot. ore
scarrabili/elitrasportabili n. per tot. ore
Carrelli trasporto materiali n. per tot. km
n. per tot. km
Automezzi classe1 Fiat - Panda n. per tot. km
Land Rover - 90 n. per tot. km
Automezzi classe2a Land Rover - 110 o 130 n. per tot. km
Mercedes, Toyota, Opel, Nissann. per tot. km
Automezzi classe2b Bremach n. per tot. km
Unimog, Iveco, Hanomag, Scamn. per tot. km
Automezzi classe3 n. per tot. km
n. per tot. km
Automezzi classe4 n. per tot. km
n. per tot. km
somma parziale 0.00 NB2
NB1: le ore di intervento vanno segnalate in numero decimale, ad es.: 1ora e trenta minuti = 1.5; 1
ora e un quarto = 1.25; 1 ora e dieci = 1.17 ecc…
NB2:Se il risultato è #N/D, verificare che per le attrezzature con scelta multipla sia selezionata una
opzione, anche se l'attrezzatura non è stata utilizzata nell'intervento (n.= 0)
Prot. N°
Calcolo costi intervento AIB
- attrezzature automezzi e personale -
Anno
Data di inizio dell'intervento ore
Data fine intervento ore
Provincia Padova
Comune
Località dell'incendio
Servizio forestale provinciale di: PD/RO
PERSONALE impegnato nell'evento:- Operatori dei servizi forestali
Prestazione
ordinaria
Prestazione
straordinaria
diurna
Prestazione
straordinaria
notturna
Prestazione
straordinaria
festiva
Prestazione
straordinaria
festiva notturna
per tot. ore per tot. ore per tot. ore per tot. ore per tot. ore
Capo squadra (specializzato super) NB1
Capo squadra (specializzato)
Operatore (specializzato super)
Operatore (specializzato)
Vettovagliamento o mense maturate €
- Volontari di associazioni AIB
Fronte Fuoco n per tot. ore NB1
n per tot. ore
n per tot. ore
NO Fronte Fuoco n per tot. ore
n per tot. ore
n per tot. ore
ATTREZZATURE utilizzate nell'intervento
- Mezzi aerei
Regionali (COR) n minuti di utilizzo
ad ala rotante principale 1
ad ala rotante secondario
ad ala rotante secondario oltre 30'
Nazionali (COAU) n minuti di utilizzo
ad ala rotante
ad ala fissa
- altre attrezzature e automezzi: pag. 2
totale personale 0.00
totale attrezzature 0.00
TOTALE intervento 0.00 €
il Dirigente Regionale il Dirigente del Servizio A.I.B.
Dr. Guido Munari Dr.ssa Emanuela Ramon
Direzione Foreste ed Economia Montana
via Torino, 110. Mestre (VE)
Servizio Antincendi Boschivi
Page 6
Session No.1 — Economical estimation of forest fires damages — Valese Lubello Anfodillo Cavalli Pettenella
Tempesta Carraro Garadozzi Ramon Lemessi
Methodology for the evaluation of soil and above-ground damage (environmental damage)
The methodology for environmental damage evaluation assesses seven
functions linked to the forest, according to its position, category and products
(table 3). The total value of environmental damage is the sum of the seven
functions, deemed the principle ones. Other utilities are characteristic of the forest,
such as educational and historic ones, but these aspects are related to the analytic
approach and not to the work objective.
Table 3— Forest functions and benefits.
Forest function Benefit
Wood production Wood products
Non-wood production Non-wood products (mushrooms, chestnuts, etc.)
Tourism Recreation chance increment
Hunting Recreation chance increment
Hydrogeological protection Reduction of soil erosion and runoff
Protection against climate change
(CO2 uptake)
Health improvement
Nature conservation value Conservation of genetic inheritance and rare
ecosystems for future generations
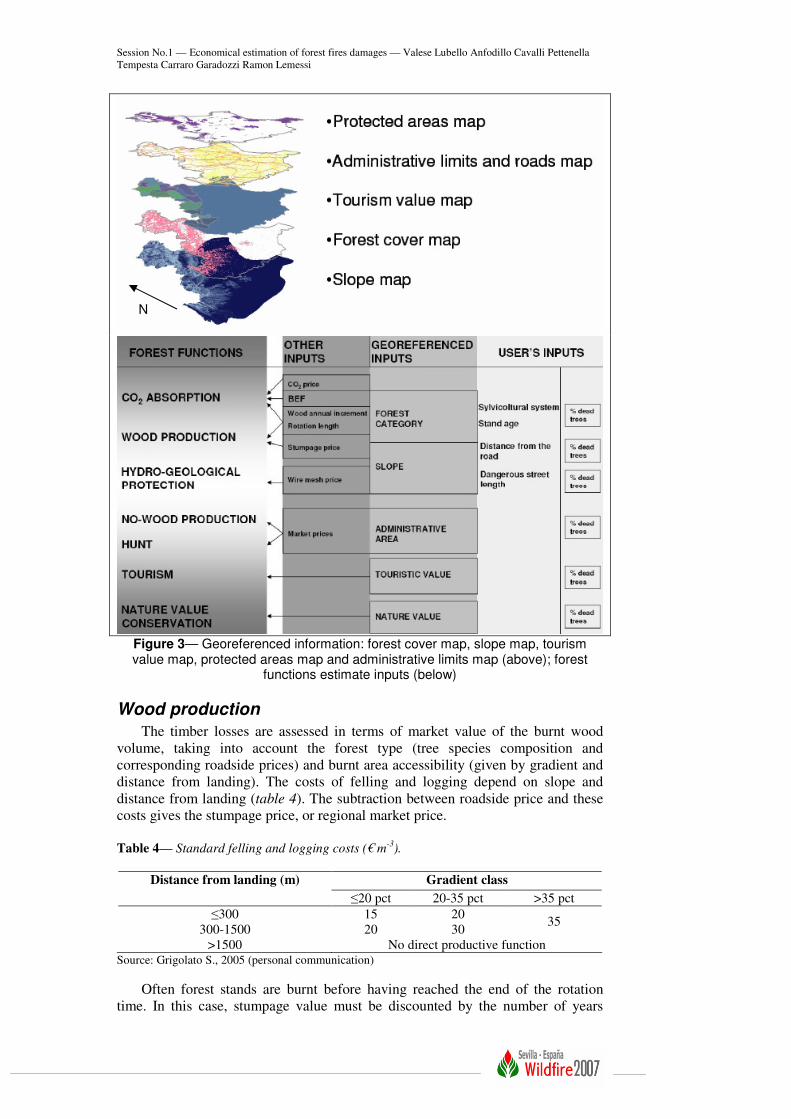
A regional database was created joining five GIS informative layers (forest
cover map, gradient map, tourism value map, protected areas map and
administrative limits map) and other sources (figure 3). The forest cover map
consists of 3,611 patches and each patch contains information about all layers.
Furthermore, the computation system is automated by a user friendly interface.
The use of local data concerning forest categories and other aspects, like wood
annual increment and prices, hunting and tourism value, is a guarantee of
estimation accuracy.
In this section every forest function will be described in detail. Two aspects
are common to all of them:
• estimation unit is defined like the minimum area where the forest category is
homogeneous and it coincides with the forest cover map patches. A unique
code defines each patch;
• the patch code is associated to the regional database where the most of inputs to
reach the evaluation are stored. Database information is joined to the patch
codes.
Georeferenced information was applied in order to minimize the field surveys
the customer must collect to run calculations. User has to put six inputs into the
computation system (an ACCESS application) to make it run:
1. patch codes;
2. percentage of dead trees;
3. stand age;
4. sylvicultural system;
5. distance from landing;
6. dangerous road length or the length of road where rocks could fall.
Forest Service personnel must survey all the information required in the burnt
area. The first field survey will be to measure the fire perimeter using GPS
technology. This georeferenced information must be intersected with the forest
cover map to get patch codes, using a GIS software.
Page 7
Session No.1 — Economical estimation of forest fires damages — Valese Lubello Anfodillo Cavalli Pettenella
Tempesta Carraro Garadozzi Ramon Lemessi
Figure 3— Georeferenced information: forest cover map, slope map, tourism value map, protected areas map and administrative limits map (above); forest
functions estimate inputs (below)
Wood production
The timber losses are assessed in terms of market value of the burnt wood
volume, taking into account the forest type (tree species composition and
corresponding roadside prices) and burnt area accessibility (given by gradient and
distance from landing). The costs of felling and logging depend on slope and
distance from landing (table 4). The subtraction between roadside price and these
costs gives the stumpage price, or regional market price.
Table 4— Standard felling and logging costs (€ m
-3).
Gradient class Distance from landing (m)
≤20 pct 20-35 pct >35 pct
≤300 15 20
300-1500 20 30 35
>1500 No direct productive function Source: Grigolato S., 2005 (personal communication)
Often forest stands are burnt before having reached the end of the rotation
time. In this case, stumpage value must be discounted by the number of years
N
Page 8
Session No.1 — Economical estimation of forest fires damages — Valese Lubello Anfodillo Cavalli Pettenella
Tempesta Carraro Garadozzi Ramon Lemessi
before the rotation time. The damage to wood production function is computed by
the following:
( )Mortality
r
CPVolumeAreaWPD
m
r∗
+
−∗∗=
1
Where:
WPD = wood production damage (€); Area = burnt area (ha); Volume =
commercial maturity volume of timber (m3 ha
-1); Pr = roadside price (€ m
-3); C =
felling and logging costs (€ m-3
); r = discount rate; m = years to rotation time;
Mortality = percentage of dead trees. Mortality of trees is representative of fire
intensity.
In order to calculate the Volume variable as precisely as possible, a regional
analysis of timber annual increments and usual rotation age was done, consulting
the Veneto Region Inventory Database (2005). A mean annual increment was
assessed for every forest category, both high and low forest (when existing).
Volume results from the following formula:
RIaVolume ∗=
Where:
Ia = timber annual increment (m3 ha
-1 y
-1); R = rotation time (y).
As regards roadside price Pr, this depends on forest category composition and
on sylvicultural system. Prices will be referred to lumber or firewood production
according to high or low forest.
Non-wood products
Non-wood production availability decreases after fire and is characterized by
extreme variability in space and time. The most frequent products in the Veneto
region are mushrooms and sweet chestnuts, although other products, like truffles,
are found in very localized places. The biggest problem in the assessment of non-
wood production is the lack of information on how much is the yearly yield from
the forest. Consequently, it is sometimes necessary to find alternatives to the
market value approach. As a proxy for mushrooms values we used the value of
harvesting permits sold by local municipalities. This approximation appears
reasonable considering that most mushrooms harvesters get a recreational benefit
from this activity, more than an effective financial one. The formula used to assess
lost mushroom production is:
( )
( )Mortality
rr
rAIAreaNWPD
n
n
∗+∗
−+∗=
1
11*
Where:
NWPD = non-wood production damage (€), in this case mushroom production
damage; Area = burnt area (ha); AI = harvesting rights income, cumulated in one
year (€ ha-1
) or goods sale annual income; r = discount rate; n = years of lost
mushroom production or lost income from harvesting rights sale, this is considered
to be ten years by national regulations; Mortality = percentage of dead trees.
The loss in chestnuts production is computed only when fire occurred in sweet
chestnut stands, the location of which is known by the forest cover map as a
specific forest category. In this case mean annual chestnut production and mean
Page 9
Session No.1 — Economical estimation of forest fires damages — Valese Lubello Anfodillo Cavalli Pettenella
Tempesta Carraro Garadozzi Ramon Lemessi
market price are known. A market value approach is applied taking into account
stand age and an adequate period of restoration (ten years for Law 353/2000). The
formula to compute chestnut production damage is the same as that used for
mushrooms, with the only difference being that AI, or goods sale annual income, is
calculated as:
chPAprodAI ∗=
Where:
Aprod = annual chestnut production (t ha-1
); Pch = sweet chestnuts market
price (€ t-1
).
Tourism and recreational activities
Fire can determine a reduction of the number of people visiting an area for
recreational purposes. Environmental damage from the reduction of recreational
benefits is considered both for areas mainly used for wood production and for
recreational utility. The assessments have been made using data from several
works focused on tourism trends in last decade in Veneto region (Tempesta, 2004;
Da Pozzo and others 2003;) and the following formula has been applied:
( )
( )Mortality
rr
rVNAreaTD
n
n
tt ∗+∗
−+∗∗∗=
1
11
Where:
TD = tourism damage (€); Area = burnt area (ha); Nt = mean number of
visitors per year in one hectare; Vt = mean value of one visit (€); r = discount rate;
n = years of lost tourism activities in the burnt area; Mortality = percentage of
dead trees.
The methods estimation choice to assess Nt and Vt was regional situation
dependent. This is anyway an applicative example that may be transferred to other
regional cases. Both variables have been studied for the major mountain basins,
where most forestry cover is present (Figure 4). The rest of Veneto region forest
has been compared with a low mountain basin using the benefit transfer method.
Two techniques have been applied to assess the mean number of annual
visitors (Nt). Statistic data have been considered first. Local tourist offices record
arrivals and stays in receptive structures, but this information source explain only
50 percent of the total phenomenon. The second technique consists of ad hoc
investigations:
• field surveys (counting visitors in sample tourist sites);
• contingent valuation (questionnaires and direct/indirect interviews).
Other indicators can be used to evaluate visitors number if the required
precision level is lower, for example number of parking tickets sold and data on
local vehicular traffic.
The mean value of the a single visit (Vt ) has been assessed by using travel cost
and contingent valuation methods.
Page 10
Session No.1 — Economical estimation of forest fires damages — Valese Lubello Anfodillo Cavalli Pettenella
Tempesta Carraro Garadozzi Ramon Lemessi
The period of time during which tourist activities are lost (n) is closely
connected to stand mortality rate and burnt area accessibility6. Also sylvicultural
system has been considered from a tourism restoration perspective. For example,
coppice stands damaged by fire recover completely after a period of no longer than
one year, hence no loss takes place in those areas.
Figure 4— Main tourism basins in Veneto region
Hunting
The environmental damage from loss of hunting potential has been considered
from a recreational point of view and not as a loss of marketable production. No
quantity ranges were available to assess hunt production, on the contrary
willingness to pay for hunting can be estimated by using criteria similar to those
given for no-wood products. In this case the number of hunters and annual licence
cost have been collected at province level, since these values depend on the range
of hunted species in each province. Loss of hunting rights income is computed as:
( )
( )Mortality
rr
rAIAreaHD
n
n
∗+∗
−+∗∗=
1
11
Where:
HD = potential lost hunting damage (€); Area = burnt area (ha); AI = hunting
rights income, cumulated in one year (€ ha-1
); r = discount rate; n = years of lost
hunting rights sale (national regulations require ten years of hunting suspension);
Mortality = percentage of dead trees.
Hydrogeological protection function
The role of the forest in environment protection and consolidation of
watersheds is well known. However, soil fertility is hardly affected by high
intensity fires because the surface organic layers are leached by precipitations
following a fire event (Aylward B., 2004). Damaged forest floors become
sensitive to erosion and many problems can involve roading, like big rocks falling.
6 Time delay in tourism function restoration depends on erosive phenomena connected to the fire
effect. Details on time delay computation are given in Hydrogeological protection section.
Page 11
Session No.1 — Economical estimation of forest fires damages — Valese Lubello Anfodillo Cavalli Pettenella
Tempesta Carraro Garadozzi Ramon Lemessi
To assess environmental damage from alteration of hydrogeological system
two aspects have been considered:
1. loss of soil fertility and restoration time delay;
2. loss of watersheds consolidation (protection given to principal roads
against big rocks falling).
Another hypothesis might be pursued, for example estimating the increase of
costs to empty streams and catchment areas from ground deposition or the increase
of costs to rehabilitate settlements after flooding events. Both alternatives require
detailed investigations or are hard to standardize, and erosion from fires is often
combined with other factors. In addition, the mean area burnt in Veneto region
corresponds to about 5.2 ha and the probability of landslides after fire is very low
(Regione Veneto wildland forest fires database, 2007).
Loss of soil fertility is estimated by assigning a time delay d to the burnt area,
defined as the number of years pioneer species need to colonize the forest floor
after fire (Trabaud and Pradon, 1992). The time delay represents a postponement
in forest capacity to provide social utilities and is estimated by using a Gradient-
Pburn model7, predicting landslides probability in mountain basins. In this study
we assume that:
• pioneer species do not colonize burnt areas if landslides are active;
• the area where the fire event takes place is considered a mountain basin;
• the percentage of burnt basin is assessed by the percentage of dead stand.
The model algorithm is as follows:
( ) ( )GRADIENTPBURNed
∗−∗−+
=017.002219.06765.21
98.12
Where:
d = delay (years); PBURN = percentage of burnt area; GRADIENT = mean
gradient of burnt area (percent).
The delay d must be applied to the forest functions as an additional period of
lost function benefit. For example, tourism activities loss period corresponds to
time delay and no loss occurs if the time delay is zero, that means fire intensity is
low or the burnt area is quite flat. In these conditions landslides do not occur. It
has been assumed that d can have a maximum value of ten years, when fire burns
70 percent of the stand and the gradient exceeds 40 percent.
Protection against big rocks falling is assessed only when a road section might
be involved in rock fall events, i.e. below high gradient hillsides. In this case
heavy wire mesh will be laid along the whole road section. Dangerous road length
is one of the six inputs the user must enter into the computation procedure. The
user must be careful in road length assessment: consolidation financial costs are
particularly onerous (average wire mesh unit value is 370 € m-1
), so are advisable
only when the danger of rocks falling is really high.
7 The Gradient-Pburn model has been created using data provided by
http://landslides.usgs.gov/research/wildfire/pw-ref.php.
Page 12
Session No.1 — Economical estimation of forest fires damages — Valese Lubello Anfodillo Cavalli Pettenella
Tempesta Carraro Garadozzi Ramon Lemessi
Protection against climate change (Co2)
Carbon dioxide emissions following the combustion of wood biomass and
organic matter, with a consequent increase in the concentrations of greenhouse
gases in the atmosphere, involve a cost that can be estimated by referring to
market prices of carbon shares (such as the European Union Emission Trading
Scheme). The price is transparent following implementation of the Kyoto Protocol,
with the creation of a market for credits related to “flexible mechanisms” (and in
particular, what is known as the Clean Development Mechanism), the voluntary
creation of a series of compensatory actions on the part of local authorities,
businesses and even individual citizens.
The economic value of carbon dioxide emitted by fire must be deemed as a
“temporary” loss of protection against climate change. In Italy, forest areas cannot
be converted to other uses, hence stand re-growth will restore carbon dioxide lost
from timber biomass, back to the initial level. The assessment method is as
follows:
1. economic evaluation of carbon dioxide emitted by fire;
2. correction of that evaluation by discounting future benefits to the present time.
The economic value of carbon dioxide is the value of corresponding carbon
emitted, calculated as:
MortalityPCAreaCO c ∗∗∗∗=12
442
Where:
CO2 = economic value of carbon dioxide emitted by fire (€); Area = burnt area
(ha); Pc = price of one ton of carbon8 (€ t
-1); Mortality = percentage of dead trees;
C = carbon emitted by fire (t ha-1
), calculated as:
cfBEFwdVolumeC ∗∗∗=
Where:
Volume = wood volume of stand when fire occurred (m3 ha
-1); wd = weight
density of wood (kg m-3
); BEF = biomass expansion factor9 (coefficient of
transformation by volume of the wood mass, expressed in m3, into epigeous
arboreal biomass, expressed in t of dry matter); cf = carbon rate in one unit weight
of biomass (standard value is 0.5).
The environmental damage to absorption of carbon dioxide is then assessed by
the following formula:
∗
∗
−−
∗
−∗∗+=
+
+
ddn
dn
d
d
qqr
q
qr
qaCOAreaCOCCD
11122
8 PC can be updated by analyzing the quotations on the websites that monitor share transactions
(http://www.pointcarbon.com/, http://carbonfinance.org/, http://carbonfinance.org/). It is advisable to
refer to quotations regarding operations in the fields of agricultural and forest land management since
they refer to temporary carbon fixation in the atmosphere (for this reason the value of the shares is,
ceteris paribus, lower). 9 The data concerning destroyed stock generally refer to the cormometric/ dendrometric wood mass
and must therefore be multiplied by an expansion factor (BEF) in order to estimate the total loss of
carbon stock (http://afoludata.jrc.it/carboinvent/ciintro.cfm).
Page 13
Session No.1 — Economical estimation of forest fires damages — Valese Lubello Anfodillo Cavalli Pettenella
Tempesta Carraro Garadozzi Ramon Lemessi
Where:
CO2 = economic value of carbon dioxide emitted by fire (€); Area = burnt area
(ha); q = r +1; r = discount rate; d = restoration time delay (years); n = stand age;
CO2 a = economic value of carbon dioxide stored each year by stand.
Nature value conservation
Of all the factors considered, the nature conservation role is the most difficult
to quantify, as it represents the value attributed to biodiversity. A simplified
estimation procedure refers to Italian State Law n. 353 of 2000 which states that
when an area burned by fire includes a protected area the total value of the
environmental damage, as estimated using conventional methods, can be increased
by fifty percent.
The protected areas map shows which forest units may be considered in nature
conservation assessment. However, this method does have a shortcoming: quite
frequently, in areas of high environmental value the financial losses from lack of
wood production, non-wood forest products or hunting are extremely limited and
the multiplication coefficient has to be applied to practically insignificant values.
It will be a judge’s decision if environmental damage estimation must be
increased or not. This work aims to give solid indications about fire compensation
by the person responsible, and does not describe specific stand characteristics in
detail.
Conclusions The analysis of forest fire damage costs in N-E Italy, both environmental and
fire fighting ones, provides an operative GIS-ACCESS application and automated
damage computation procedure. This work is part of the international trend to
consider the forest from an economic standpoint and no longer as a timber
provider. Climate change and the biodiversity loss alert in the last decade are
increasing the significance of the forest role as “impact bearing”, also in legal
proceedings. A first structure has been fixed for total damage assessment. Many
improvements might be made as the investigation progresses and more
information becomes available (fire-erosion quantitative relationship, evaluation
of biodiversity value, etc.).
The current level of assessment precision provides objective indications for
quantifying claims for damage. The ACCESS application is a good system and it
has been set to print all the information concerning the forest area burnt. The
computation procedure speed should help Forest Service personnel by supplying a
user friendly interface.
References Amman, H. 2004. Coûts-machines 2005. Coûts occasionnés par les parties du bâtiment
et les installations mécaniques. Rapport FAT n. 621/2004. Tänikon: FAT.
ASAE EP496.2. 2004. Agricultural machinery management. ASAE Standards,
engineering practices and data. St. Joseph, MI: ASAE.
Aylward, B. 2004. Land-use, Hydrological Function and Economic Valuation. In:
Bonnell, M.; Bruijnzeel, L.A. (eds.), Forests-Water-People in the Humid Tropics.
Cambridge, Cambridge University Press.
Page 14
Session No.1 — Economical estimation of forest fires damages — Valese Lubello Anfodillo Cavalli Pettenella
Tempesta Carraro Garadozzi Ramon Lemessi
Bacchini, M.; Garadozzi, M.; Pettenella, D. 2005. Interventi anti-incendio boschivo. Un
tariffario per la valutazione dei costi. Sherwood 117, 15-20.
Baiguera, M.; Pettenella, D. 1997. La contabilità ambientale delle risorse forestali:
un’applicazione alla regione Lombardia. L’Italia Forestale e Montana, 5: 347–365.
Cavalli, R.; Giolo, E.; Lemessi, A.; Ulliana, G. 2002. Gli incendi boschivi nel Veneto.
Analisi statistica del fenomeno nel decennio 1991-2000. Regione del Veneto,
Direzione Regionale Foreste ed Economia Montana – Servizio Antincendi Boschivi.
Costanza R. and others. 1997. The value of the world’s ecosystem services and natural capital. Nature, n.387.
Cross, T. 1998. Machinery cost calculation methods. AE&RD n. 13. U.S. Department of
Agriculture, University of Tennessee, Institute of Agriculture, Knoxville, Tenn.
http://economics.ag.utk.edu/pubs/
Da Pozzo, M.; Tempesta, T.; Tiene, M. 2003. Turismo e attività ricreative a Cortina
d’Ampezzo. Udine, FORUM
Edwards, W. 2001. Estimating farm machinery costs. PM 710. U.S. Department of
Agriculture, Iowa State University of Science and Technology, Ames, Iowa.
http://www.extension.iastate.edu/pubs/
Giau, B. 1998. Manuale per la valutazione della qualità economica dei boschi e per la
sua rappresentazione. Edizioni Bosco e Ambiente, Frontone (PS).
Gonzalez-Caban; McKetta. 1986. Analyzing fuel management cost. Western Journal of
Applied forestry 1(4): 116-121
Gonzalez-Caban and others 1984. Costs of fire suppression forces based on cost-
aggregation approach. USDA For. Serv. Res. Paper PSW-171.
Hesseln, H. 2000. The economics of prescribed burning: a research review. Forest
Science 46(3): 322-334.
Hippoliti, G.; Marinelli, A.; Uzielli, L.; Piegai, F. 1980. La valorizzazione delle risorse
forestali italiane, Volume IV. Accademia Nazionale di Agricoltura, Accademia
Economico Agraria dei Georgofili, Accademia Italiana di Scienze Forestali (Firenze).
http://afoludata.jrc.it/carboinvent/ciintro.cfm http://landslides.usgs.gov/research/wildfire/pw-ref.php http://www.pointcarbon.com/, http://carbonfinance.org/, http://carbonfinance.org/
http://www2.corpoforestale.it/web/guest/serviziattivita/antincendioboschivo
Lovreglio, R.; Leone, V.; Giaquinto, P.; Notarnicola, A. 2006. New tools for the analysis of fire causes and their motivations: the Delphi technique. In: Proceedings of the
5th
International Conference on Forest Fire research, 27-30 November, 2006, Figueira
da Foz, Portugal, D. X. Viegas ed.
Marangon, F.; Tempesta, T. 2001. La valutazione dei beni ambientali come supporto
alle decisioni pubbliche. Udine: forum.
Marchetti, M.; Pettenella, D. 1994. La vegetazione e il fuoco: analisi di alcune componenti del rischio e dei costi economici. Cellulosa e Carta, 45 (3).
Miyata, E. 1980. Determining fixed and operating costs of logging equipments. General
Technical Report NC-55. U.S. Department of Agriculture Forest Service, S. Paul,
Mich.: North Central Forest Experiment Station.
Pettenella, D.; Tutolo, N. 1987. La valutazione dei costi di utilizzo delle macchine
forestali. Genio rurale 50 (4), 51-58.
Reyes, O.; Casal, M. 2002. Experimental field emergence and early survival of six tree
species in relation to forest fires. In: Fire and Biological Processes. Ed. L Trabaud,
R Prodon; pp. 277–290. Backhuys Publishers: Leiden, the Netherlands.
Sartori, L.; Galletto, L. 1992. Costi di riparazione e manutenzione dei trattori nella
provincia di Padova. Rivista di ingegneria agraria 2, 81-89.
Sulli, F.; Marchi, E. 1995a. Classificazione degli automezzi per l’antincendio boschivo impiegati in italia (prima parte). Sherwood 1, 39-43.
Sulli, F.; Marchi, E. 1995b. Classificazione degli automezzi per l’antincendio boschivo
impiegati in italia (seconda parte). Sherwood 2, 39-45.
Tempesta, T. 2004. La popolazione dei frequentatori della Montagna Veneta. Turistica,
Aprile-Giugno.
Wood, D.B. 1988. Costs of prescribed burning in southwestern ponderosa pine.
Western Journal of Applied Forestry 3(4): 115-119