SP11-1 SP11 Walking and cycling facilities Introduction This procedure provides a method of evaluating the economic efficiency of walking and cycling facility improvements, with the exception of signalised crossings over roads. This simplified procedure assumes that: 1. An 8 percent discount rate and 30 year analysis period are used. 2. Construction will be completed in the first year and will be in service by the end of year 1. 3. All costs are exclusive of GST. 4. In cases where the above assumptions are not appropriate, either the simplified procedure should be modified or full procedures used. The simplified procedure is designed to consider one option at a time. Where it is logical to do so, consider other suitable options in order to select the optimal solution. If there is more than one option, the evaluation will involve incremental analysis of the costs and benefits of the different options. In particular, where a separate dedicated cycleway is proposed the alternative option of providing wider sealed shoulders or cycle lanes on the carriageway must be considered. The preferred option shall have a minimum incremental BCR of 1.0 and shall be sensitivity tested using a target incremental BCR that is 1.0 higher than the ratio used for choosing the preferred option (refer to appendix A12 of volume 1). For walking and cycling facilities, the worksheets for all the options must be submitted together with a summary of the incremental analysis. To use the worksheets, it is necessary to determine both the current numbers, and growth rate of cycle/pedestrian traffic for the activity. These must be based on local counts and realistic projections or for cyclists, and can be obtained for cyclists using worksheet 7. Note: All walking and cycling proposals will potentially be subject to a safety audit to help ensure that safety is improved as a result of the proposal. Worksheet Description 1 Evaluation summary 2 Cost of the do minimum 3 Costs of the do option 4 Travel time cost savings Land Transport NZ’s Economic Evaluation Manual – Volume 2 SP11 revised 29-June-2009
Transcript
SP11-1
SP11 Walking and cycling facilities Introduction This procedure provides a method of evaluating the economic efficiency of walking
and cycling facility improvements, with the exception of signalised crossings over roads.
This simplified procedure assumes that:
1. An 8 percent discount rate and 30 year analysis period are used. 2. Construction will be completed in the first year and will be in service by the end
of year 1.3. All costs are exclusive of GST.4. In cases where the above assumptions are not appropriate, either the
simplified procedure should be modified or full procedures used. The simplified procedure is designed to consider one option at a time. Where it is logical to do so, consider other suitable options in order to select the optimal solution. If there is more than one option, the evaluation will involve incremental analysis of the costs and benefits of the different options. In particular, where a separate dedicated cycleway is proposed the alternative option of providing wider sealed shoulders or cycle lanes on the carriageway must be considered. The preferred option shall have a minimum incremental BCR of 1.0 and shall be sensitivity tested using a target incremental BCR that is 1.0 higher than the ratio used for choosing the preferred option (refer to appendix A12 of volume 1).
For walking and cycling facilities, the worksheets for all the options must be submitted together with a summary of the incremental analysis.
To use the worksheets, it is necessary to determine both the current numbers, and growth rate of cycle/pedestrian traffic for the activity. These must be based on local counts and realistic projections or for cyclists, and can be obtained for cyclists using worksheet 7.
Note: All walking and cycling proposals will potentially be subject to a safety audit to help ensure that safety is improved as a result of the proposal.
Worksheet Description
1 Evaluation summary
2 Cost of the do minimum
3 Costs of the do option
4 Travel time cost savings
5 Quality benefits
6 Accident cost savings
7 Cycle demand
8 BCR and incremental analysis
Land Transport NZ’s Economic Evaluation Manual – Volume 2 SP11 revised 29-June-2009
SP11-2
SP11 Walking and cycling facilities, continued
Explanation for worksheet 1 Evaluation summary
Worksheet 1 provides a summary of the general data used for the evaluation as well as the results of the analysis.
The information required is a subset of the information required for the funding allocation process.
1. Evaluator(s)/reviewer(s): Enter the full name, contact details, name of organisation, office location, etc, of the evaluator(s) and reviewer(s).
2. Proposal details: Provide a general description of the proposal (and package where relevant), describe the problems with the existing facilities and the problems to be addressed.
3. Location: Provide brief description of the proposal location including: a location/route map a layout plan of the proposal.
4. Alternatives and options: Describe the do minimum that is usually the least cost option to maintain the current facility in an unimproved state. Describe the options assessed and how the preferred option will improve the road section.
5. Timing: The construction start is assumed to be 1 July of the financial year in which the project is submitted for a commitment to funding.
6. Economic efficiency: Enter the timeframe information, identify the expected duration of construction (months) and identify whether land designation is required.
7. Enter the applicable data to your request into the appropriate spaces provided.8. PV cost of do minimum: Use worksheet 2 to calculate the PV cost of the do minimum. This should
be the lowest cost option that will keep the road in service. It will provide no improvements.9. PV cost of preferred option: Use worksheet 3 to estimate the preferred option PV cost10. Enter the benefits values from worksheets 4 (travel time savings), 5 (walking and cycling facility
benefits) and 6 (accident cost savings). To bring the benefits up to the base date values, use the appropriate update factors supplied in appendix A12.3.
11. The national benefit cost ratio is calculated by dividing the PV of the net benefits (PV benefits of the do minimum subtracted from the PV benefits of the option) by PV of the net costs (PV costs of the do minimum subtracted from the PV costs of the option).
Land Transport NZ’s Economic Evaluation Manual – Volume 2 SP11 revised 29-June-2009
SP11-3
SP11 Walking and cycling facilities, continued Evaluation summary Worksheet 1
1 Evaluator(s)Reviewer(s)
2 Proposal detailsApproved organisation nameProposal/package nameYour referenceProposal descriptionDescribe the problem to be addressed
3 LocationBrief description of location
4 Alternatives and optionsDescribe the do minimum
Summarise the options assessed
5 TimingTime zero (assumed construction start date) 1 July Expected duration of construction (months)Period of analysis
6 Economic efficiencyDate economic evaluation complete (mm/yyyy)Base date for costs and benefits 1 JulyLand designation required yes/no
7 Data (only fill in the applicable data)Existing pedestrian/cycling volumes AADT in 20Estimated new pedestrian/cyclist volume AADTEstimated motor vehicle volumes AADTEstimated motor vehicle speed km/hPedestrian/cyclist growth rate %Width available for walking/cycling before mWidth available for walking/cycling after mLength walked/cycled before works kmLength walked/cycled after works kmExpected reduction in private vehicle travel km per day
8 PV cost of do minimum A9 PV cost of the preferred option B
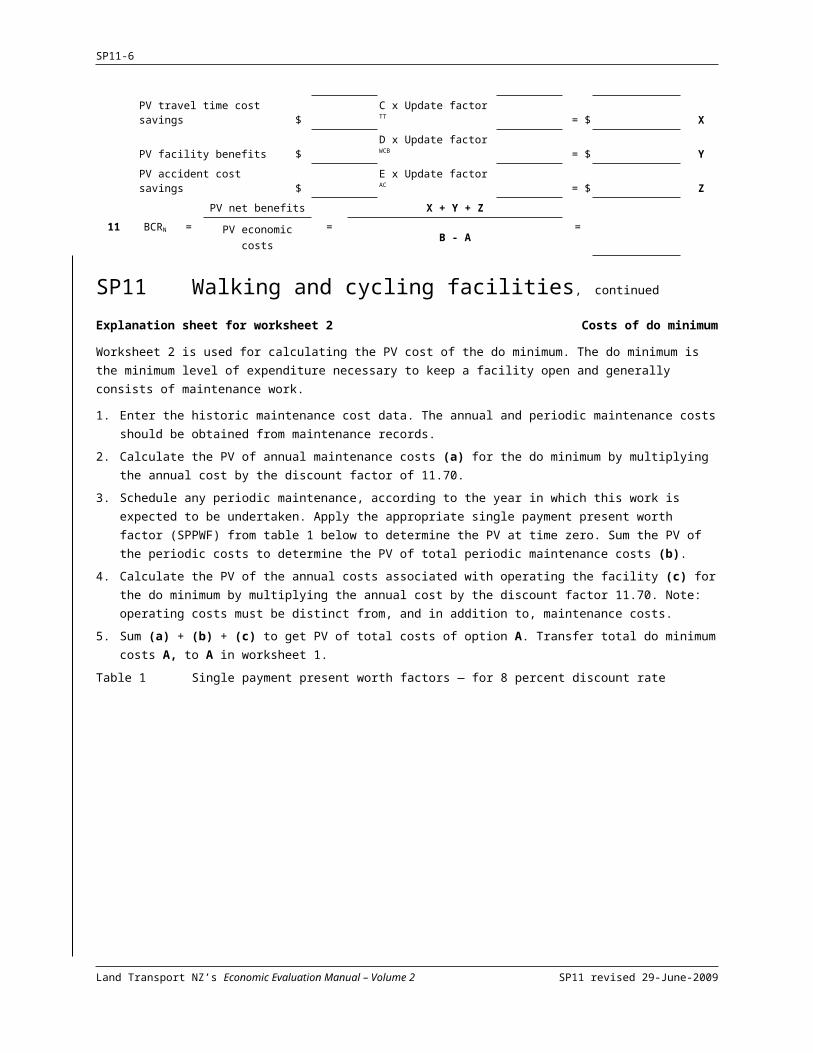
10 Benefit values from worksheets 4, 5 and 6PV travel time cost savings $ C x Update factor TT = $ XPV facility benefits $ D x Update factor WCB = $ YPV accident cost savings $ E x Update factor AC = $ Z
11 BCRN =PV net benefits
=X + Y + Z
=PV economic costs B - A
Land Transport NZ’s Economic Evaluation Manual – Volume 2 SP11 revised 29-June-2009
SP11-4
SP11 Walking and cycling facilities, continued
Explanation sheet for worksheet 2 Costs of do minimum
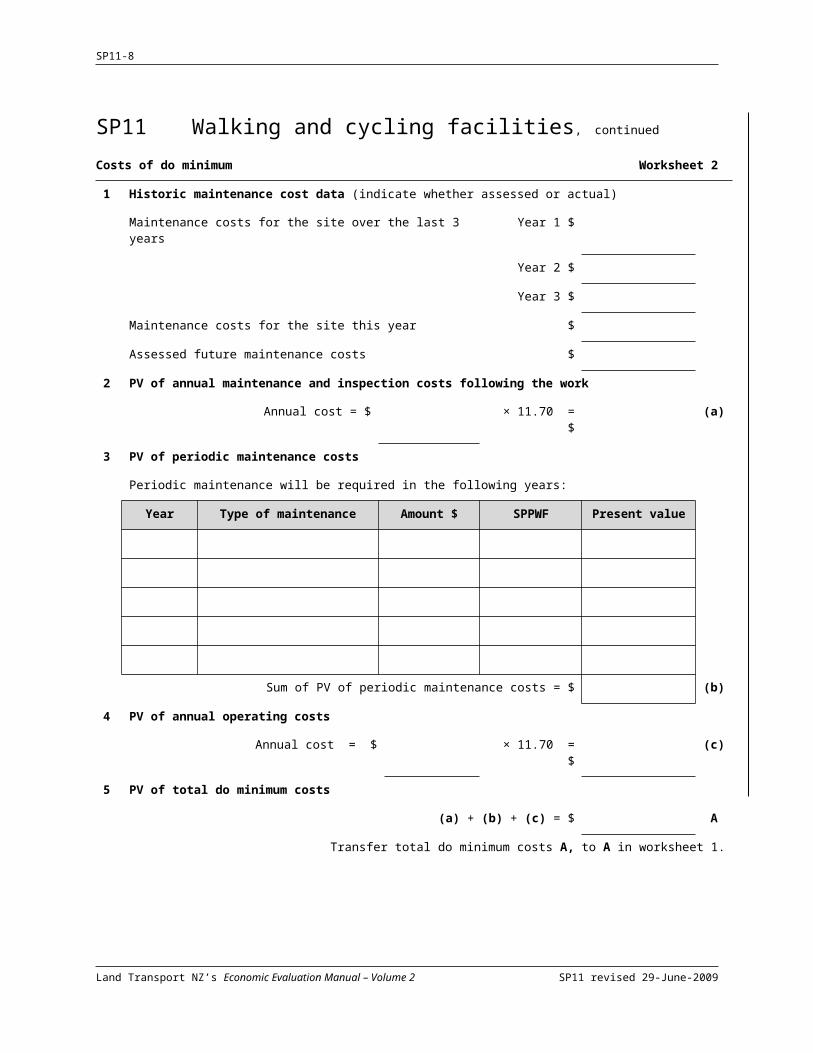
Worksheet 2 is used for calculating the PV cost of the do minimum. The do minimum is the minimum level of expenditure necessary to keep a facility open and generally consists of maintenance work.
1. Enter the historic maintenance cost data. The annual and periodic maintenance costs should be obtained from maintenance records.
2. Calculate the PV of annual maintenance costs (a) for the do minimum by multiplying the annual cost by the discount factor of 11.70.
3. Schedule any periodic maintenance, according to the year in which this work is expected to be undertaken. Apply the appropriate single payment present worth factor (SPPWF) from table 1 below to determine the PV at time zero. Sum the PV of the periodic costs to determine the PV of total periodic maintenance costs (b).
4. Calculate the PV of the annual costs associated with operating the facility (c) for the do minimum by multiplying the annual cost by the discount factor 11.70. Note: operating costs must be distinct from, and in addition to, maintenance costs.
5. Sum (a) + (b) + (c) to get PV of total costs of option A. Transfer total do minimum costs A, to A in worksheet 1.
Table 1 Single payment present worth factors — for 8 percent discount rateYear SPPWF Year SPPWF
Land Transport NZ’s Economic Evaluation Manual – Volume 2 SP11 revised 29-June-2009
SP11-5
SP11 Walking and cycling facilities, continued
Costs of do minimum Worksheet 2
1 Historic maintenance cost data (indicate whether assessed or actual)
Maintenance costs for the site over the last 3 years Year 1 $
Year 2 $
Year 3 $
Maintenance costs for the site this year $
Assessed future maintenance costs $
2 PV of annual maintenance and inspection costs following the work
Annual cost = $ × 11.70 = $ (a)
3 PV of periodic maintenance costs
Periodic maintenance will be required in the following years:
Year Type of maintenance Amount $ SPPWF Present value
Sum of PV of periodic maintenance costs = $ (b)
4 PV of annual operating costs
Annual cost = $ × 11.70 = $ (c)
5 PV of total do minimum costs
(a) + (b) + (c) = $ A
Transfer total do minimum costs A, to A in worksheet 1.
Land Transport NZ’s Economic Evaluation Manual – Volume 2 SP11 revised 29-June-2009
SP11-6
SP11 Walking and cycling facilities, continued Explanation sheet for worksheet 3 Costs of the option
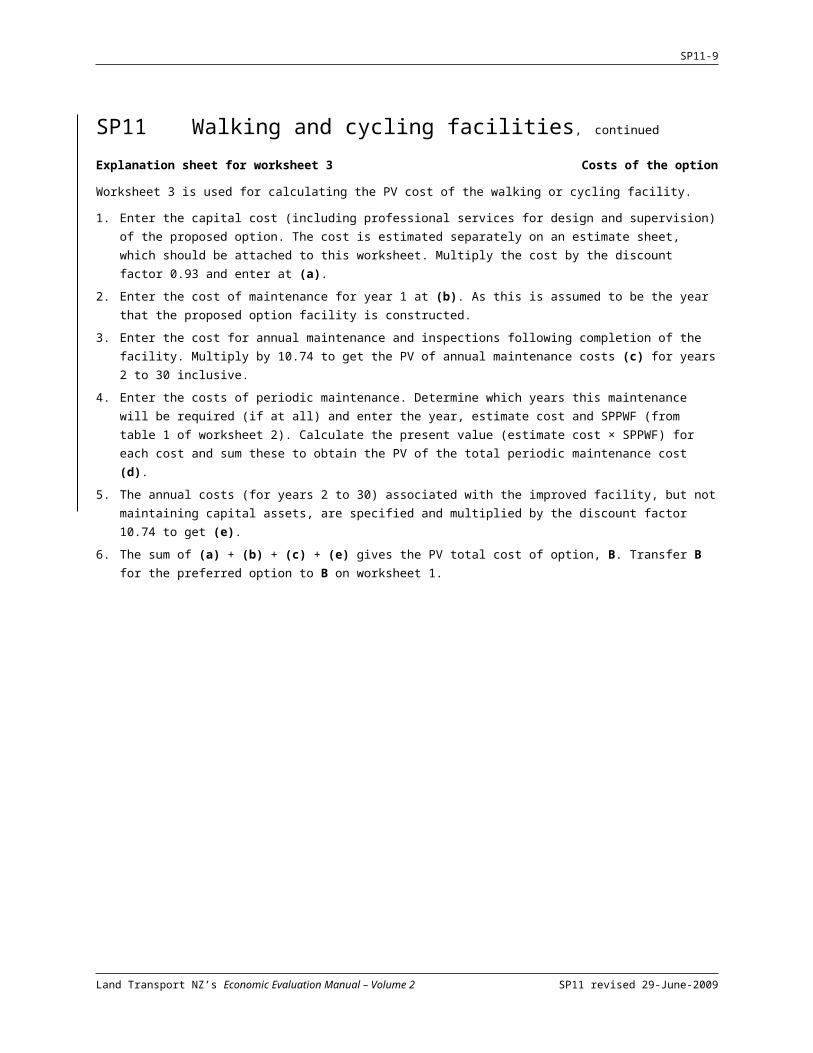
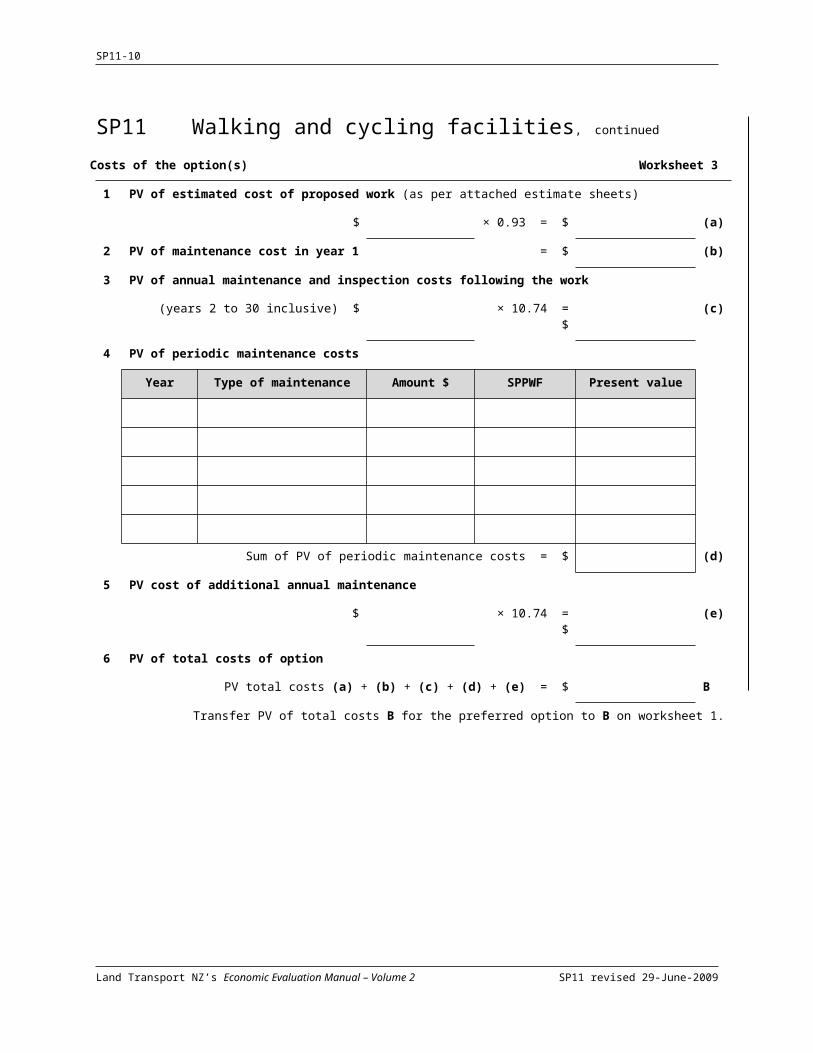
Worksheet 3 is used for calculating the PV cost of the walking or cycling facility.
1. Enter the capital cost (including professional services for design and supervision) of the proposed option. The cost is estimated separately on an estimate sheet, which should be attached to this worksheet. Multiply the cost by the discount factor 0.93 and enter at (a).
2. Enter the cost of maintenance for year 1 at (b). As this is assumed to be the year that the proposed option facility is constructed.
3. Enter the cost for annual maintenance and inspections following completion of the facility. Multiply by 10.74 to get the PV of annual maintenance costs (c) for years 2 to 30 inclusive.
4. Enter the costs of periodic maintenance. Determine which years this maintenance will be required (if at all) and enter the year, estimate cost and SPPWF (from table 1 of worksheet 2). Calculate the present value (estimate cost × SPPWF) for each cost and sum these to obtain the PV of the total periodic maintenance cost (d).
5. The annual costs (for years 2 to 30) associated with the improved facility, but not maintaining capital assets, are specified and multiplied by the discount factor 10.74 to get (e).
6. The sum of (a) + (b) + (c) + (e) gives the PV total cost of option, B. Transfer B for the preferred option to B on worksheet 1.
Land Transport NZ’s Economic Evaluation Manual – Volume 2 SP11 revised 29-June-2009
SP11-7
SP11 Walking and cycling facilities, continued Costs of the option(s) Worksheet 3
1 PV of estimated cost of proposed work (as per attached estimate sheets)
$ × 0.93 = $ (a)
2 PV of maintenance cost in year 1 = $ (b)
3 PV of annual maintenance and inspection costs following the work
(years 2 to 30 inclusive) $ × 10.74 = $ (c)
4 PV of periodic maintenance costs
Year Type of maintenance Amount $ SPPWF Present value
Sum of PV of periodic maintenance costs = $ (d)
5 PV cost of additional annual maintenance
$ × 10.74 = $ (e)
6 PV of total costs of option
PV total costs (a) + (b) + (c) + (d) + (e) = $ B
Transfer PV of total costs B for the preferred option to B on worksheet 1.
Land Transport NZ’s Economic Evaluation Manual – Volume 2 SP11 revised 29-June-2009
SP11-8
SP11 Walking and cycling facilities, continued Explanation for worksheet 4 Travel time cost savings
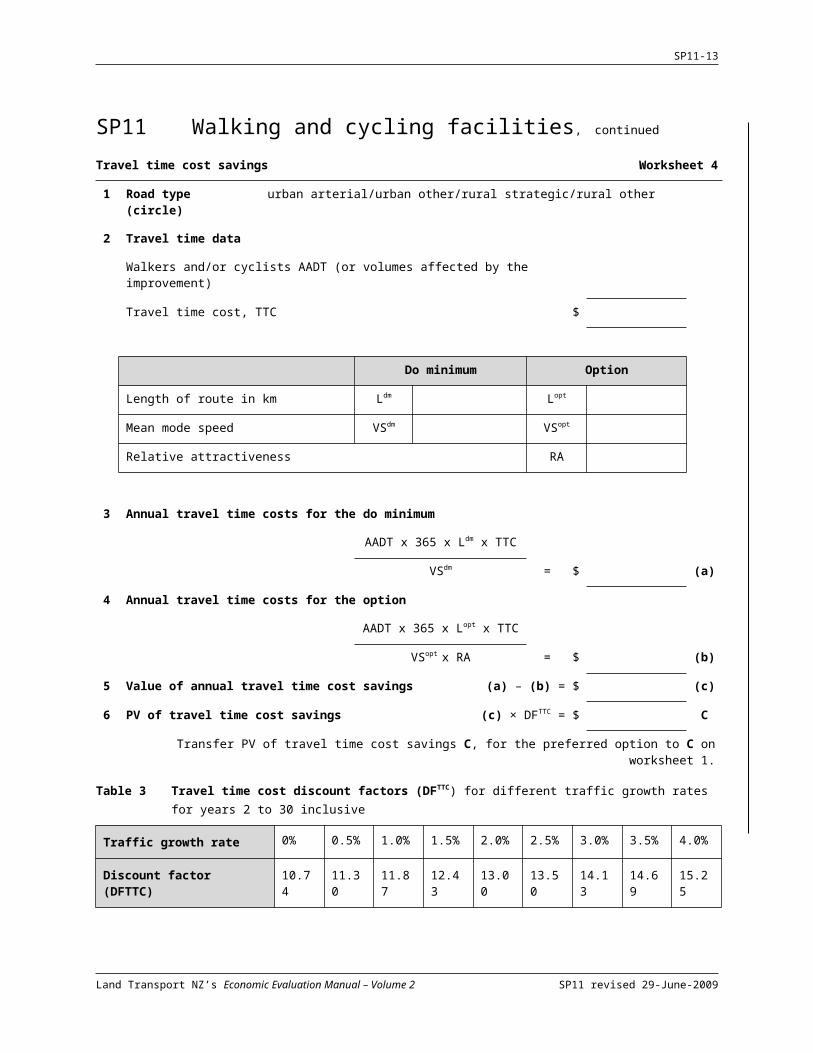
Worksheet 4 is used for calculating pedestrian and cyclist travel time cost savings.
1. Circle the road type.2. Enter the data required to complete the travel time cost savings calculations. Default values for
travel time costs are found in table 1 below. Note: if it is a cycle facility being evaluated, the length of the option facility must be adjusted for diversion off or to the most direct route using the factors from table 2. For example, if the facility moves cyclists from in traffic with road side parking with no cycle lane, to in traffic with road side parking but with a marked cycle lane, enter the relative attractiveness value of 1.8 into the assigned cell.
3. Calculate the annual travel time costs for the do minimum (a) using the formula provided.4. Calculate the annual travel time costs for the option (b) using the formula provided. The travel
speed and route length will be the same for both the do minimum and the project option if the work does not either shorten the route or increase travel speeds.
5. Calculate the annual travel time cost savings by subtracting the travel time costs for the option (b) from the do minimum travel time costs (a) to get (c).
6. Determine the PV of the travel time cost savings, C by multiplying (c) by the appropriate discount factor from table 3. Transfer the PV of travel time cost savings C, for the preferred option to worksheet 1.
Table 1 Travel time cost for standard traffic mixes for all periods combined ($/hr - 2008)
Road type Description Travel time cost
Urban arterial Arterial and collector roads within urban areas carrying traffic volumes greater than 7,000 motorised vehicles/day 19.36
Urban other Urban roads other than urban arterial 19.31
Rural strategicArterial and collector roads connecting main centres of population and carrying traffic of over 2,500 motorised vehicles/day
27.67
Rural other Rural roads other than rural strategic 27.04
Table 2 Benefit factors for different types of cycle facilities
Type of cycle facility Relative attractiveness
On-street with parking, no marked cycle lane 1.0
On-street with parking, marked cycle lane 1.8
On-street without parking, marked cycle lane 1.9
Land Transport NZ’s Economic Evaluation Manual – Volume 2 SP11 revised 29-June-2009
SP11-9
Off-street cycle path 2.0
Land Transport NZ’s Economic Evaluation Manual – Volume 2 SP11 revised 29-June-2009
SP11-10
SP11 Walking and cycling facilities, continued Travel time cost savings Worksheet 4
1 Road type (circle) urban arterial/urban other/rural strategic/rural other
2 Travel time data
Walkers and/or cyclists AADT (or volumes affected by the improvement)
Travel time cost, TTC $
Do minimum Option
Length of route in km Ldm Lopt
Mean mode speed VSdm VSopt
Relative attractiveness RA
3 Annual travel time costs for the do minimum
AADT x 365 x Ldm x TTC
= $ (a)VSdm
4 Annual travel time costs for the option
AADT x 365 x Lopt x TTC
= $ (b)VSopt x RA
5 Value of annual travel time cost savings (a) – (b) = $ (c)
6 PV of travel time cost savings (c) × DFTTC = $ C
Transfer PV of travel time cost savings C, for the preferred option to C on worksheet 1.
Table 3 Travel time cost discount factors (DFTTC) for different traffic growth rates for years 2 to 30 inclusive
Land Transport NZ’s Economic Evaluation Manual – Volume 2 SP11 revised 29-June-2009
SP11-11
SP11 Walking and cycling facilities, continued Explanation for worksheet 5 Benefits for walking and cycling facilities
Worksheet 5 is used to calculate the walking and cycling facility benefits for the various options. Only one category for walking and one category for cycling may be used in an evaluation of a project. If a project contains more categories, they must be submitted as separate evaluations.
Projects that combine walking and cycling may claim benefits for both modes but safety issues arising from pedestrian/cycle conflicts must be addressed, and if there are additional accident costs these must be accounted for in worksheet 6. Make sure the estimates of the new number of pedestrians and/or cyclists generated by the facility are realistic.
1. Circle the option(s) being considered.2. Fill in the appropriate information into the blank fields then calculate the present value of the
category by multiplying along the line. The basis of the composite health, safety and environmental benefits used in worksheet 4 is described in chapter 8.
3. Transfer the total(s) (a), (b), (c) or (d) to D on worksheet 1, and (e) or (f) to E on worksheet 1 in the absence of a specific accident analysis.
Required information:
L Length of new facility in km
NPD Number of new pedestrians per day
NTD Number of new and existing cycle trips per day
DF Discount factor (from table 1). The discount factor will be different between walking and cycling categories depending on their individual growth rate
Table 1 Discount factors (DF) for different growth rates for years 2 to 30 inclusive
Land Transport NZ’s Economic Evaluation Manual – Volume 2 SP11 revised 29-June-2009
SP11-12
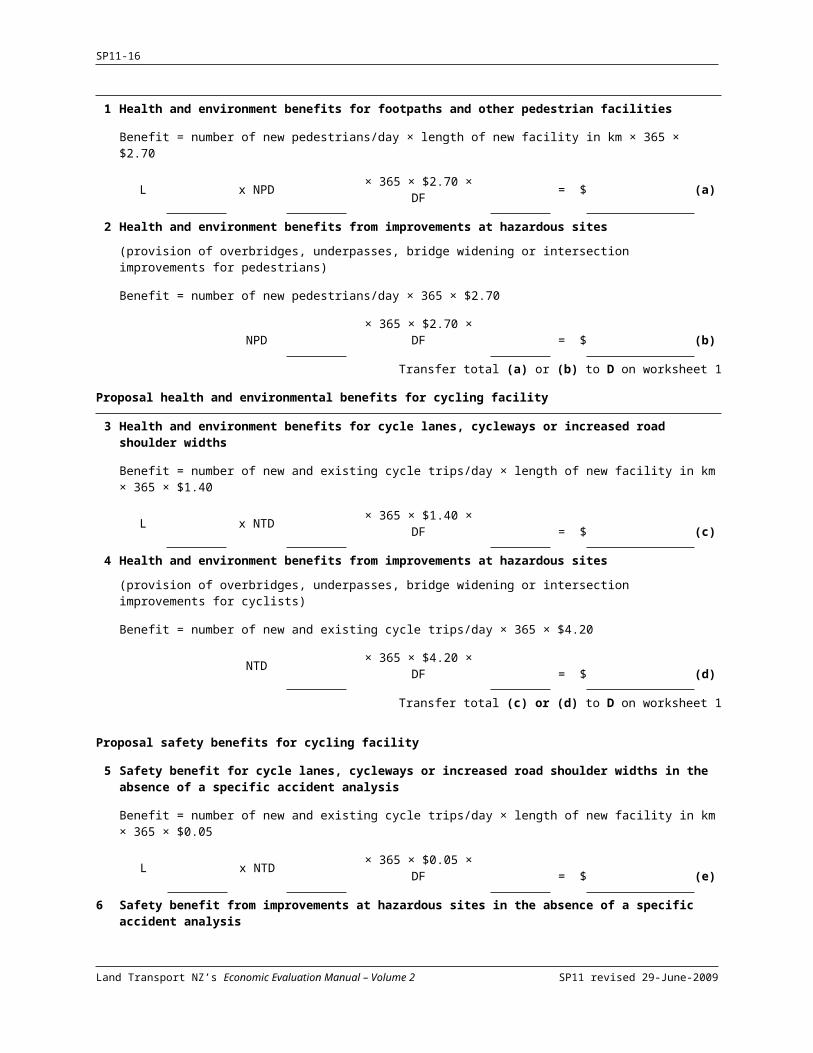
SP11 Walking and cycling facilities, continued Proposal health and environmental benefits for walking facility Worksheet 5
1 Health and environment benefits for footpaths and other pedestrian facilities
Benefit = number of new pedestrians/day × length of new facility in km × 365 × $2.70
L x NPD × 365 × $2.70 × DF = $ (a)
2 Health and environment benefits from improvements at hazardous sites(provision of overbridges, underpasses, bridge widening or intersection improvements for pedestrians)
Benefit = number of new pedestrians/day × 365 × $2.70
NPD × 365 × $2.70 × DF = $ (b)
Transfer total (a) or (b) to D on worksheet 1
Proposal health and environmental benefits for cycling facility
3 Health and environment benefits for cycle lanes, cycleways or increased road shoulder widths
Benefit = number of new and existing cycle trips/day × length of new facility in km × 365 × $1.40
L x NTD × 365 × $1.40 × DF = $ (c)
4 Health and environment benefits from improvements at hazardous sites(provision of overbridges, underpasses, bridge widening or intersection improvements for cyclists)
Benefit = number of new and existing cycle trips/day × 365 × $4.20
NTD × 365 × $4.20 × DF = $ (d)
Transfer total (c) or (d) to D on worksheet 1
Proposal safety benefits for cycling facility
5 Safety benefit for cycle lanes, cycleways or increased road shoulder widths in the absence of a specific accident analysis
Benefit = number of new and existing cycle trips/day × length of new facility in km × 365 × $0.05
L x NTD × 365 × $0.05 × DF = $ (e)
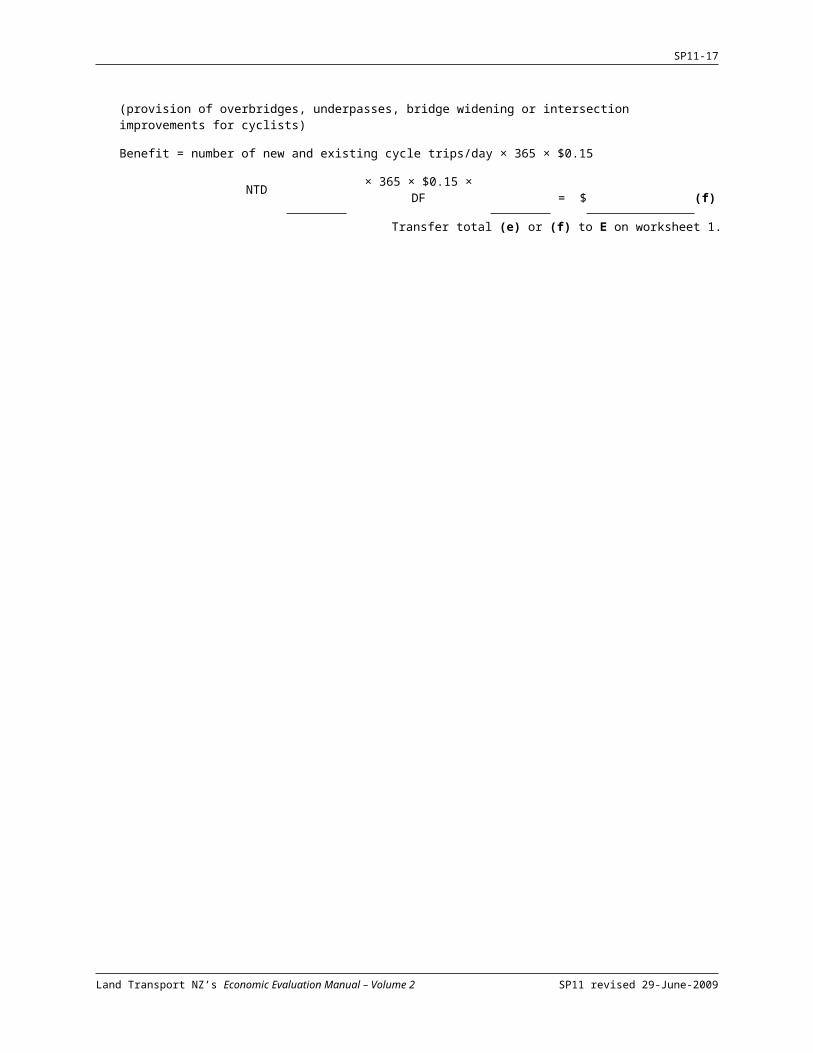
6 Safety benefit from improvements at hazardous sites in the absence of a specific accident analysis(provision of overbridges, underpasses, bridge widening or intersection improvements for cyclists)
Benefit = number of new and existing cycle trips/day × 365 × $0.15
NTD × 365 × $0.15 × DF = $ (f)
Transfer total (e) or (f) to E on worksheet 1.
Land Transport NZ’s Economic Evaluation Manual – Volume 2 SP11 revised 29-June-2009
SP11-13
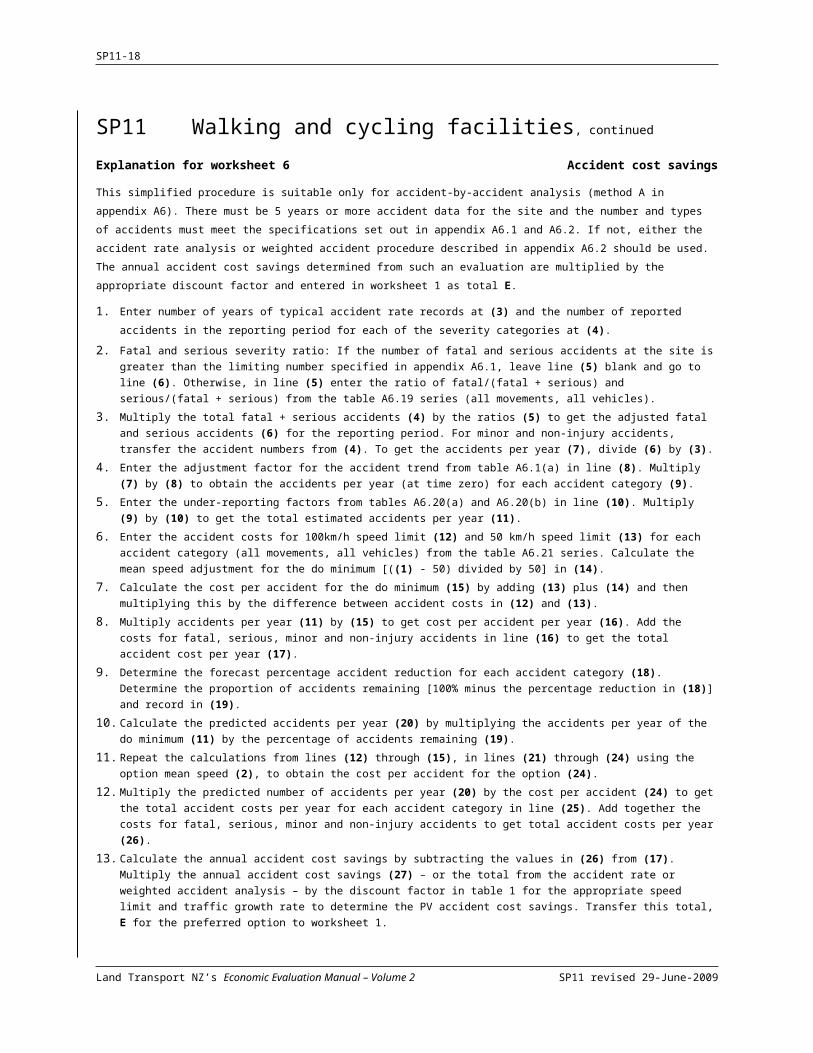
SP11 Walking and cycling facilities, continued Explanation for worksheet 6 Accident cost savings
This simplified procedure is suitable only for accident-by-accident analysis (method A in appendix A6). There must be 5 years or more accident data for the site and the number and types of accidents must meet the specifications set out in appendix A6.1 and A6.2. If not, either the accident rate analysis or weighted accident procedure described in appendix A6.2 should be used. The annual accident cost savings determined from such an evaluation are multiplied by the appropriate discount factor and entered in worksheet 1 as total E.
1. Enter number of years of typical accident rate records at (3) and the number of reported accidents in the reporting period for each of the severity categories at (4).
2. Fatal and serious severity ratio: If the number of fatal and serious accidents at the site is greater than the limiting number specified in appendix A6.1, leave line (5) blank and go to line (6). Otherwise, in line (5) enter the ratio of fatal/(fatal + serious) and serious/(fatal + serious) from the table A6.19 series (all movements, all vehicles).
3. Multiply the total fatal + serious accidents (4) by the ratios (5) to get the adjusted fatal and serious accidents (6) for the reporting period. For minor and non-injury accidents, transfer the accident numbers from (4). To get the accidents per year (7), divide (6) by (3).
4. Enter the adjustment factor for the accident trend from table A6.1(a) in line (8). Multiply (7) by (8) to obtain the accidents per year (at time zero) for each accident category (9).
5. Enter the under-reporting factors from tables A6.20(a) and A6.20(b) in line (10). Multiply (9) by (10) to get the total estimated accidents per year (11).
6. Enter the accident costs for 100km/h speed limit (12) and 50 km/h speed limit (13) for each accident category (all movements, all vehicles) from the table A6.21 series. Calculate the mean speed adjustment for the do minimum [((1) - 50) divided by 50] in (14).
7. Calculate the cost per accident for the do minimum (15) by adding (13) plus (14) and then multiplying this by the difference between accident costs in (12) and (13).
8. Multiply accidents per year (11) by (15) to get cost per accident per year (16). Add the costs for fatal, serious, minor and non-injury accidents in line (16) to get the total accident cost per year (17).
9. Determine the forecast percentage accident reduction for each accident category (18). Determine the proportion of accidents remaining [100% minus the percentage reduction in (18)] and record in (19).
10. Calculate the predicted accidents per year (20) by multiplying the accidents per year of the do minimum (11) by the percentage of accidents remaining (19).
11. Repeat the calculations from lines (12) through (15), in lines (21) through (24) using the option mean speed (2), to obtain the cost per accident for the option (24).
12. Multiply the predicted number of accidents per year (20) by the cost per accident (24) to get the total accident costs per year for each accident category in line (25). Add together the costs for fatal, serious, minor and non-injury accidents to get total accident costs per year (26).
13. Calculate the annual accident cost savings by subtracting the values in (26) from (17). Multiply the annual accident cost savings (27) – or the total from the accident rate or weighted accident analysis – by the discount factor in table 1 for the appropriate speed limit and traffic growth rate to determine the PV accident cost savings. Transfer this total, E for the preferred option to worksheet 1.
Table 1 Accident cost discount factor (DFAC) for different traffic growth rates and speed limits for years 2 to 30 inclusive
Land Transport NZ’s Economic Evaluation Manual – Volume 2 SP11 revised 29-June-2009
SP11-14
SP11 Walking and cycling facilities, continued Accident cost savings Worksheet 6
Movement category Vehicle involvement1 Do minimum mean speed Road category
Posted speed limit Traffic growth rate2 Option mean speed
Do minimum Severity Non-injuryFatal Serious Minor
3 Number of years of typical accident rate records4 Number of reported accidents over period5 Fatal/serious severity ratio (tables A6.19(a) to (c)) 1 16 Number of reported accidents adjusted by severity (4) (5)7 Accidents per year = (6)/(3)8 Adjustment factor for accident trend (table A6.1(a))9 Adjusted accidents per year = (7) × (8)
10 Under-reporting factors (tables A6.20(a) and (b))11 Total estimated accidents per year = (9) ×(10)12 Accident cost, 100 km/h limit (tables A6.21(e) to (h))13 Accident cost, 50 km/h limit (tables A6.21(a) to (d))14 Mean speed adjustment = ((1) - 50)/5015 Cost per accident = (13) + (14) × [(12) – (13)]16 Accident cost per year = (11) × (15)
17 Total cost of accidents per year (sum of columns in row (16) fatal + serious + minor + non-injury) $
Option18 Percentage accident reduction19 Percentage of accidents ‘remaining’ [100 – (18)]20 Predicted accidents per year (11) x (19)21 Accident cost, 100km/h speed limit (tables A6.21(e) to (h))22 Accident cost, 50km/h speed limit (tables A6.21(a) to (d))23 Mean speed adjustment = ((2) - 50)/5024 Cost per accident = (22) + (23) × [(21) – (22)]25 Accident cost per year = (20) × (24)
26 Total cost of accidents per year (sum of columns in row (25) fatal + serious + minor + non-injury) $
Transfer PV of accident cost savings, E for the preferred option to E on worksheet 1
Land Transport NZ’s Economic Evaluation Manual – Volume 2 SP11 revised 29-June-2009
SP11-15
SP11 Walking and cycling facilities, continued Explanation for worksheet 7 Cycle demand
This worksheet is used to calculate cycle demand for a new cycle facility. The new commuters section of the worksheet calculates the total new daily cyclist commuters. The new other section calculates the total daily new other cyclists. Finally the overall new cyclists is devised.
1. Calculate the area within each buffer distance that is connected to the route. The buffer distances are defined at 0.4, 0.8 and 1.6 km. The buffer represents the distance to the cycling facility.
2. Enter the population density per square kilometre for each of the buffer zones.3. The population per buffer is calculated by multiplying the area of each buffer (1) by the density
per square kilometre (2).4. Calculate the total population, for all buffers by calculating the sum of row (3)5. Enter the cycle commute mode share. This value is the same for all buffers. Cyclist commute mode
share values can be found in section 8.16.6. Row (6) contains the likelihood of a new cyclist multiplier for each buffer. This adjusts for the
higher likelihood for the populations living closer to the facility, to use the facility.7. Multiply the population of residents per buffer (3) by the likelihood multiplier (6).8. Calculate the sum of row (7).9. Calculate the cyclist rate by multiplying the cyclist commute share (5) by 0.96, then add on 0.32.10. Calculate the total number of existing daily cyclists by multiplying the sum in row (4) by the cyclist
rate (9).11. Calculate the total number of new daily cyclists by multiplying the sum in row (8) by the cyclist
rate (9).
Land Transport NZ’s Economic Evaluation Manual – Volume 2 SP11 revised 29-June-2009
SP11-16
SP11 Walking and cycling facilities, continued Cycle demand Worksheet 7
New and existing cyclists
Buffers (km) <0.4 0.4 to <0.8 0.8 to ≤ 1.6
1 Area (km2)
2 Density per square kilometre
3 Population in each buffer (3) = (1) × (2)
4 Total population in all buffers (Sum of (3))
5 Commute share (single value for all) %
6 Likelihood of new cyclist multiplier 1.04 0.54 0.21
7 Row (7) = (3) x (6)
8 Sum of row (7)
9 Cyclist rate (9) = ((5) x 0.96) + 0.32 %
10 Total existing daily cyclists (10) = (4) × (9)
11 Total new daily cyclists (11) = (8) x (9)
Land Transport NZ’s Economic Evaluation Manual – Volume 2 SP11 revised 29-June-2009
SP11-17
SP11 Walking and cycling facilities, continued Explanation sheet for worksheet 8 Benefit cost ratio and incremental analysisBenefit-cost analysis
1. Under benefits, enter the discounted values of benefits, for each option.2. Under costs, enter the discounted value for the road authority’s capital and maintenance costs for
each option.3. Calculate the benefit cost ratio for each option by dividing the total benefits by the option costs.Incremental analysis
1. Rank the options in order of increasing cost.2. Compare the lowest cost option with the next higher cost option to calculate the incremental BCR.3. If the incremental BCR is less than the target incremental BCR specified in appendix A12 of volume
1, discard the second (higher cost) option in favour of the first. Compare the first option with the next higher cost option.
4. If the incremental BCR is greater than the target incremental BCR, the second (higher cost) option becomes the basis for comparison against the next higher cost option.
5. Repeat the procedure until no higher cost options are available that have an incremental BCR greater than the target incremental BCR.
6. Undertake a sensitivity test using a target incremental BCR that is 1.0 greater than the ratio used in steps 2 to 5 above. Report the results of this sensitivity test in the project report.
Land Transport NZ’s Economic Evaluation Manual – Volume 2 SP11 revised 29-June-2009
SP11-18
SP11 Walking and cycling facilities, continued Benefit cost ratio and incremental analysis Worksheet 8
Time zero
Base date
BCR calculations Do minimum
Option Option Option Option
Benefits
Route improvements
Improvements at hazardous sites
Promotion proposals
Present value total benefits
Cost
Present value capital costs (do minimum)
Present value maintenance costs
Present value total costs
BCR
Base option for comparison Next higher cost option Incremental analysis