Page 1
ECONOMIC GROWTH CENTER
YALE UNIVERSITY
P.O. Box 208269New Haven, CT 06520-8269
CENTER DISCUSSION PAPER NO. 831
DOES INTELLECTUAL PROPERTY PROTECTION SPURTECHNOLOGICAL CHANGE?
Sunil KanwarYale University and University of Delhi
and
Robert E. EvensonYale University
June 2001
Note: Center Discussion Papers are preliminary materials circulated to stimulate discussions and criticalcomments.
We are most indebted to T. Paul Schultz and Doug Gollin for their time and trouble. We would also liketo express our gratitude to William Nordhaus, Gus Ranis, Peter Phillips, Jenny Lanjouw, and theparticipants of the Development Discussion Group at the Department of Economics, Yale University. This research was conducted while the first author was a Fulbright Visiting Fellow at the Department ofEconomics, Yale University.
This paper can be downloaded without charge from the Social Science Research Networkelectronic library at: http://papers.ssrn.com/paper.taf?abstract_id=275322
An index to papers in the Economic Growth Center Discussion Paper Series is located at:http://www.econ.yale.edu/~egcenter/research.htm
Page 2
Does Intellectual Property Protection Spur Technological Change?
Sunil Kanwar and Robert Evenson
Abstract
Of the diverse factors motivating technological change, one factor that has received increasing
attention in the recent past has been the protection of intellectual property rights. Given fairly
recent changes in the international policy ethos where a regime of stronger intellectual
property protection has become a fait accompli for most developing countries, it is of some
significance to ask whether more stringent protection of intellectual property does indeed
encourage innovation. And this is the question which this paper examines, utilising cross-
country panel data on R&D investment, patent protection and other country-specific
characteristics spanning the period 1981-1990. The evidence unambiguously indicates the
significance of intellectual property rights as incentives for spurring innovation.
JEL Classification: O34, O31Keywords: Intellectual Property Rights, Technological Change, Economic Growth
Page 3
2
Does Intellectual Property Protection spur Technological Change?
Sunil Kanwar and Robert Evenson
A distinctive characteristic of modern economic growth has been the significant role played by
technological change. Of the diverse factors motivating technological change, one factor that
has received increasing attention in the recent past has been the role of intellectual property
protection. Given the shift in the ownership distribution of innovations away from individuals
and towards large corporations in ‘recent decades’1, intellectual property protection has
arguably become an even more important stimulus than hitherto; for such protection augments
both the means and the incentive to undertake expensive innovation. While there has been an
on-going debate on whether strong(er) intellectual property protection encourages or retards
the rate of technological change and, by implication, that of economic growth, policy-makers
have in any case moved towards a regime of stronger intellectual property protection in recent
times, as evidenced by the agreement on Trade Related Intellectual Property issues (TRIPs)
under the GATT-WTO2 in April 1994.
That the inventor be given protection for his invention was a principle recognized as
early as the fifteenth century, when the very first patents were granted by the city state of
Venice. The motives cited were the natural right of the inventor to the fruits of his labour, the
benefits accruing therefrom to society at large, society’s compensation (therefore) of the costs
incurred by him, and the fillip this would provide to inventive propensities (Mandich, 1948).
This is not to imply, however, that opposition to such protection did not also exist right from
the early times. Some argued even then, for instance, that such protection mimicked
Page 4
3
prohibitive tariffs (insofar as the protected products could not be imported freely, hindering
trade) and ought not to be granted (Schiff, 1971)3. That this issue has continued to remain
controversial into the present times would be understating the case; one of the important
reasons for this being the lack of cumulative empirical evidence. Evenson (1990) categorises
the attempts to examine the incentive effects of IPRs on innovation into two - studies of (firm)
behaviour (see the following section; references in Evenson 1990; Lanjouw and Cockburn
2000; and Sakakibara and Branstetter 2001), and studies on the intrinsic value of protection
(see the references cited in Evenson 1990; and Schankerman 1998). To these categories we
may add (or else widen the first category to include) attempts to estimate aggregate or
economy-wide response (Gould and Gruben 1996). The evidence is thin and mixed, to say the
least. Evenson himself opines that the (weak) evidence "... does not imply that intellectual
property rights are of little value as inducements to innovate. It attests to the relevance of the
process of imitation".
This paper seeks to analyse empirically the influence that intellectual property
protection might have on innovation and technological change. We study this relationship at
the economy-wide level, using cross-country data on the strength of intellectual property
rights, technological change and other relevant country-specific controls. Our evidence shows
unambiguously, that intellectual property protection (proxied by an index of patent rights) has
a strong positive effect on technological change (proxied by R&D investment expenditures),
and therefore on economic growth. This has obvious implications for developing countries,
which have been confronted by an international policy ethos favouring the strengthening of
intellectual property rights under the recent TRIPs agreement almost as a fait accompli. We
Page 5
4
provide some evidence that conforming with the agreement may not be fruitless in the longer
run. Of course, needless to add, the strengthening of IPRs must occur not just on the statute
books but in reality. Only then would stronger IPRs provide the right incentives for
innovation.
Section 2 briefly considers the pros and cons of weak protection versus strong
protection in the global context, and the implications this might have for the relation between
intellectual property protection and technological change. Section 3 delineates the estimation
model. Section 4 briefly discusses the data and samples used for estimation, and the
appropriate estimation procedure in our context. Section 5 then presents the estimation results
while section 6 outlines some broad conclusions.
Strong protection or Weak protection?
When considering the process of technological change, two important characteristics of
innovations ought to be kept in mind. First, innovations are non-rival goods. That is, use of a
particular innovation by a producer does not preclude other entrepreneurs from using it.
Second, innovations are partially non-excludable goods. This implies that the innovator is
often unable to completely prevent others from unauthorisedly using the innovation (Romer,
1990). It is these two properties of innovations that form the basis of the argument in favour
of intellectual property protection, which serves to decrease the degree of non-excludability of
innovations by assigning to the inventor the property rights over his innovation for a given
period of time. How strong should the protection given be, however, is a difficult and
complex question to settle in practice. We briefly discuss below the various arguments for and
Page 6
5
against the strong protection of intellectual property.
Arguments favouring weak protection
One of the more obvious benefits supposed to accrue from the weak protection of intellectual
property (as in developing countries), is to keep the market prices (of products made from or
using protected technology) low. Second, a related positive is claimed to be the cheap
acquisition of technology. Underlying these arguments appear to be the suppositions that
protected products have no close substitutes or competition, that the menu of products
available would be the same irrespective of the protection regime (i.e. strong or weak), and
that there are no offsetting costs to the countries in question (Sherwood, 1990). Third, there
are several instances of patent abuse involving inadequate disclosure in developing countries,
where important bits of knowledge have been withheld from the patent applications, without
which even those skilled in the art would not be able to replicate the inventions after the
expiry of the patent (Roffe, 1974). Fourth, strong protection, by creating a monopoly, may
induce the producer to accumulate 'sleeping patents' in an effort to preserve market share
(Gilbert and Newbery, 1982). In which case, strong protection will only serve to limit the rate
of technological change. Although, whether a producer would want to preserve market share
with extant technology would depend upon whether or not he can do better by innovating
(Park, 1997).
In a global context, Deardorff (1992) demonstrates that as patent protection spreads
(to developing countries, for instance), the gains from protection in the form of monopoly
profits to inventors taper off as diminishing returns set in, and at some point could fall short of
Page 7
6
the costs arising from distorted consumer choice due to monopoly pricing. Again, Chin and
Grossman (1990) show that the globally efficient degree of protection may not be evenly
welfare-maximising. Thus, in the South or innovation-importing countries, welfare may be
negative. Grossman and Helpman (1991) show that stronger protection (or production
subsidies) would cause the global rate of technical innovation to fall. Finally, Helpman (1993)
shows that strong protection will increase the rate of innovation only in the short term as it
raises profitability; in the long term it lowers the innovation rate as the producers tend to
produce the older products.
Arguments favouring strong protection
On the other hand, there is evidence which suggests that strong protection stimulates
innovative activity, at least in some industries such as pharmaceuticals and chemicals. Thus,
Levin et.al. (1987), in a survey of 650 American R&D executives who had been asked to rank
order alternative means of protecting products and processes across 130 industries, found that
for the pharmaceuticals and chemicals industries the executives placed great emphasis on
patent protection. This result is supported by Mansfield (1986), who questioned a hundred
R&D executives across different U.S. industries about what percentage of their inventions
over the period 1981-1983 would not have been made had it not been for the availability of
patents. The survey responses revealed that 60% of the inventions in pharmaceuticals and
about 40% in chemicals would not have been developed in those circumstances (see Evenson
1990 for a summary of similar evidence). This evidence is in consonance with Segerstrom
(1991) who shows that government incentives to innovation unambiguously increase inventive
Page 8
7
intensity, although welfare increases only if innovation intensity exceeds a threshold. It is not,
however, necessarily in agreement with Segerstrom, Anant and Dinopoulos (1990), who show
that stronger protection may either increase or lower inventive activity.
Second, 'strong' protection is often necessary because even with this ‘strong’
protection competition begins to gnaw away the profits fairly quickly. Lesser (2000) notes
that the commercial life of a new (crop) variety in the U.S. is only about 7 years and has been
declining due to competition (and is not the statutory 20 years). Mansfield (1985), using a
survey of 100 U.S. firms spanning 13 manufacturing industries, reports that the average time
lapse till the point where information on new products or processes is leaked to rival firms
was only about a year for products and 15 months for processes.
Third, foreign direct investment and the transfer of technology from the North to the
South may be adversely affected, at least in certain industries, if adequate protection is
wanting in the South. Taylor (1993, 1994) shows that weak protection in the South (to
facilitate unintended technology transfers, for instance), would evoke a defensive response
from inventors in the North, which may ultimately eliminate the gains from weak protection.
Lai (1998) qualifies this statement by showing that the relationship between protection (in the
South) and innovation (in the North) depends on whether imitation or ‘multinationalization’
(i.e. foreign direct investment) is the mode of international production transfer. If imitation is
the mode of production transfer, stronger protection will lower the rate of innovation and the
rate of technology transfer; but if multinationalization is the channel, the effect on innovation
and the rate of technology transfer from the North to the South will be just the opposite.
Diwan and Rodrik (1991) demonstrate that when the structure of demand in the South differs
Page 9
8
markedly from that in the North, (strong) protection in the South will stimulate invention (in
the North), leading to net gains for the South. By implication, given the existence of
considerable taste differentials between developing and developed countries (as in
pharmaceutical and agricultural products), the South may lose considerably by not granting
adequate protection.
Fourth, strong protection by the South may be necessary if it is to prevent rampant
piracy of intellectual property and consequent retaliation by the North (for some piracy
estimates see Gadbaw and Richards 1988). It was the loss of this potential profit which
originally motivated the North (particularly the United States) to bargain hard to bring
intellectual property issues within the purview of the GATT/WTO; for the dispute settlement
mechanism in this forum was reasonably effective, whereas there was no such mechanism in
the WIPO4 (Sherwood, 1990). Moreover, by linking intellectual protection with trade, the
North gained insofar as it could use trade sanctions to counter piracy5. This can be prevented,
however, if the root cause of piracy - namely, weak protection - is remedied.
Thus, we find that a host of arguments can be adduced for and against the strong
protection of intellectual property rights. From the arguments per se and the empirical
evidence, one is hard put to decide on the appropriate degree of protection. Nor is the
theoretical literature much help in this regard. It is the purpose of this paper, therefore, to
empirically examine the relationship between intellectual property protection and the rate of
technological change.
The Estimation Model
Page 10
9
In doing so we do not wish to deduce the relationship from a more general relationship such
as that between economic growth and protection (as do Gould and Gruben 1996), because
economic growth is a very complex and ill-defined process, at least relatively speaking. In
other words, the relationship between protection and technological change does not follow
very easily from findings relating to the relationship between protection and economic growth.
Therefore, it might be more convincing to dwell on the behaviour of technological change per
se, the variable on which protection is supposed to have a more direct impact.
Capturing technological change
To proceed with the estimation we must first clarify what constitutes technological change. At
one level technological change may be interpreted to refer not to the change in technology in
existence (i.e. known to society at any given point in time), but rather to the change in
technology in use? Obviously, the latter cannot occur without the former. However, the
former can and does occur independently of the latter. Thus, many new innovations may exist
and yet not be commercially exploited because, for instance, they may be economically
unviable. To the extent that they are not yet employed, they do not cause any change in the
extant technology of production, and hence do not influence economic growth. By the same
token, only when they are exploited in the market can the technology of production be said to
have changed, with possible ramifications for economic growth. Therefore, it is this
phenomenon of the adoption or economic exploitation of innovations that ought ideally to be
emphasized, rather than the phenomenon of the generation of innovations per se. In actual
fact, however, this distinction may not be practicable.
Page 11
10
We propose to represent technological change, therefore, by research and
development investment as a proportion of gross national product (RDI)6. While all of
research and development expenditure does not necessarily fructify into inventions and
innovations, such investment has the virtue of being more closely related to inventive activity
than is, say, non-residential physical capital investment, while at the same time being more ‘all-
encompassing’ than still another possible proxy, namely patent applications.
The explanatory variables
Countries differ widely in the strength of protection that they provide to intellectual property.
While a comprehensive evaluation of the relative strengths of protection would require
dwelling on each of several instruments such as patents, trademarks, copyrights and trade
secrets (South Centre, 1997)7, differences in patent laws across countries are considered the most
important and are perhaps the most dramatic. The protection offered may differ along several
dimensions. Thus, patent laws across countries differ with respect to coverage. While some countries
allow both product and process patents in a broad range of activities, some disallow product patents for
innovations in certain areas such as pharmaceuticals, chemicals and food products (e.g. India). Second,
patent laws differ with respect to the duration of protection. Patent duration in most western European
nations has been 20 years, whereas in other countries it has varied between 5 and 17 years (e.g. India,
Pakistan, Sri Lanka, Jordan, US). Further, while some countries measure patent life from the patent
application filing date (e.g. Nigeria, Jordan, Thailand), others measure it from the publication date
(India, Korea, Austria, Australia), while still others measure it from the grant date (Pakistan, Mexico,
Portugal, Canada, Iceland, US). Third, enforcement procedures may differ depending on whether or not
countries allow for preliminary injunctions in the case of an alleged infringement, and on who carries
Page 12
11
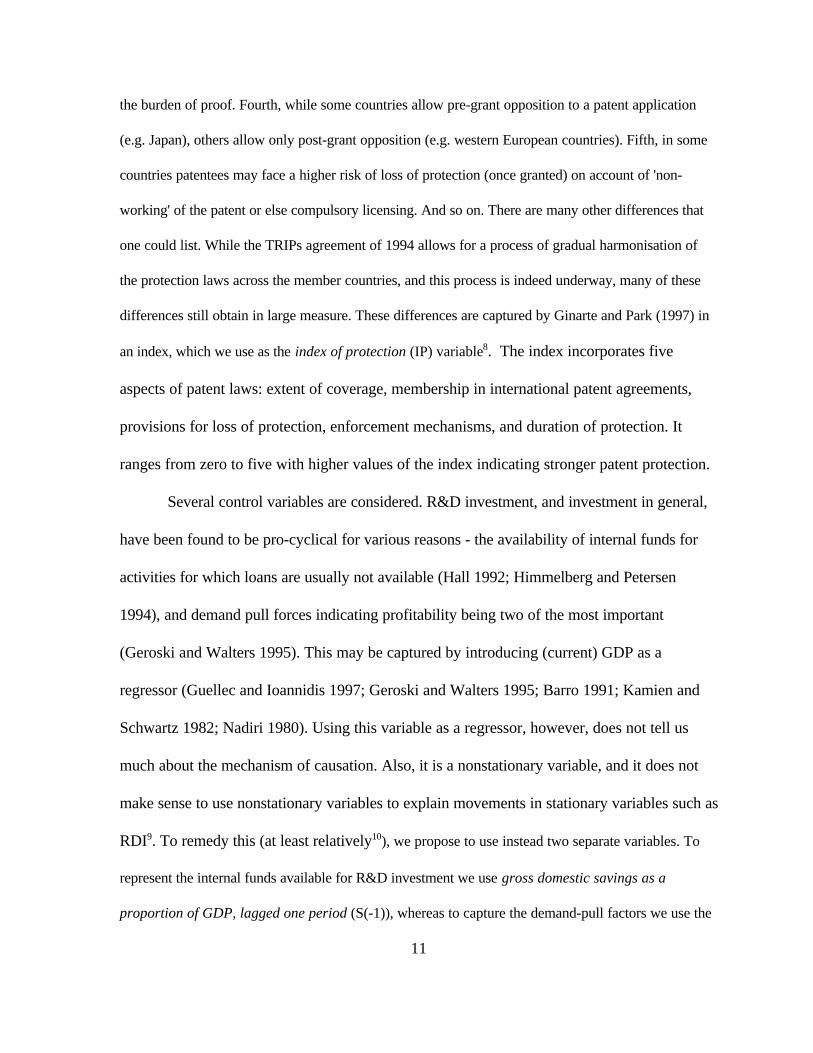
the burden of proof. Fourth, while some countries allow pre-grant opposition to a patent application
(e.g. Japan), others allow only post-grant opposition (e.g. western European countries). Fifth, in some
countries patentees may face a higher risk of loss of protection (once granted) on account of 'non-
working' of the patent or else compulsory licensing. And so on. There are many other differences that
one could list. While the TRIPs agreement of 1994 allows for a process of gradual harmonisation of
the protection laws across the member countries, and this process is indeed underway, many of these
differences still obtain in large measure. These differences are captured by Ginarte and Park (1997) in
an index, which we use as the index of protection (IP) variable8. The index incorporates five
aspects of patent laws: extent of coverage, membership in international patent agreements,
provisions for loss of protection, enforcement mechanisms, and duration of protection. It
ranges from zero to five with higher values of the index indicating stronger patent protection.
Several control variables are considered. R&D investment, and investment in general,
have been found to be pro-cyclical for various reasons - the availability of internal funds for
activities for which loans are usually not available (Hall 1992; Himmelberg and Petersen
1994), and demand pull forces indicating profitability being two of the most important
(Geroski and Walters 1995). This may be captured by introducing (current) GDP as a
regressor (Guellec and Ioannidis 1997; Geroski and Walters 1995; Barro 1991; Kamien and
Schwartz 1982; Nadiri 1980). Using this variable as a regressor, however, does not tell us
much about the mechanism of causation. Also, it is a nonstationary variable, and it does not
make sense to use nonstationary variables to explain movements in stationary variables such as
RDI9. To remedy this (at least relatively10), we propose to use instead two separate variables. To
represent the internal funds available for R&D investment we use gross domestic savings as a
proportion of GDP, lagged one period (S(-1)), whereas to capture the demand-pull factors we use the
Page 13
12
ratio of current per capita GDP to per capita GDP lagged one period (? GDPPC)11.
Countries that have factor bundles that contain relatively more human capital will tend
to innovate and hence invest at a faster rate than countries having factor bundles with lower
proportions of this resource, because this input is central to research and development (Romer
1990). In other words, it is an enabling factor. Given that in certain skills (e.g. in
communications) the returns are higher if others are also skilled, increases in human capital
tend to induce higher rates of investment (Romer 1991). In cross-country analysis we must
also allow for the fact that more educated countries are better able to absorb the innovations
made elsewhere (Nelson and Phelps 1966). We do not consider literacy rates apt for this
purpose, because these are usually based on criteria such as whether the respondent can sign
his name, or whether he can identify a given number of characters of some language etc.,
which are not particularly cogent indicators of his skill level. Nor would primary school
enrolment rates serve the purpose, because too many countries have already achieved 100%
enrolment at this level and hence there would be insufficient variation in this variable.(Barro,
1991). Besides, ideally we ought to use a stock measure of human capital rather than a flow
measure. Therefore, we represent the human capital variable by the Barro-Lee (2000) data on
the average number of years of formal schooling of the population equal to or over age 15
(EDU).
Political instability is an important factor influencing investment decisions. Countries
with unstable political, and hence economic, climates witness a drying up of productive
investment. Even localized political conflicts that tend to be long drawn out can stifle
investment in those regions within countries or at the very least divert scarce resources away
Page 14
13
from R&D towards the control and resolution of that conflict. We propose to represent this
factor by a relatively comprehensive ‘state failure’ dummy. Using data on genocides and
politicides, revolutionary wars, ethnic wars, and abrupt régime changes towards autocratic
rule compiled by the Center for International Development and Conflict Management (see
Esty et.al. 1998), we construct a political instability dummy (ID) for each country which
equals 1 in years exhibiting one or more of these phenomena and equals 0 otherwise.
The I-O literature points out that lending institutions are reluctant to lend for R&D
activities simply because such ventures tend to be highly risky with uncertain expected rates of
return. Therefore, R&D investment tends to get financed mainly from internal funds (Hall
1992; Himmelbery and Petersen 1994). Hence, as we argued above, the importance of
savings. Even so, the real lending rate of interest (RLR) may be used as an additional control
variable, perhaps to reflect the opportunity cost of internal funds if not the actual cost of
borrowed funds used for R&D (Guellec and Ioannidis 1997).
Finally, it has been argued that the trade orientation of a country can be of importance
in determining its propensity to innovate. The conjecture (sometimes implicit) is that relatively
open economies tend to face relatively more competition, not having access to sheltered
markets, and are compelled to invest relatively more in R&D (Edwards 1992; World Bank
1987; Krueger 1978; Bhagwati 1978; and Lewis 1955). Measuring the degree of openness of
an economy, however, has proved a fairly thorny exercise. The alternative measures used in
the literature have been exports shares, trade shares (i.e. exports plus imports as a share of
GDP), effective tariff rates, real exchange rate distortions, black market exchange rate
premiums and still other measures. All of these measures may be shown to be deficient in one
Page 15
14
respect or another. Some, however, are better than others and one that seems to be preferred
is the black market exchange rate premia (Gould and Gruben 1996). We, therefore, use the
black market exchange rate premia to construct a black market premium dummy (BMPD),
which equals 0 for relatively open economies or those whose black market premium is less
than the median of the sample countries, and 1 for the relatively closed economies or those
whose black market premium is more than the median12.
The above discussion leads us to the following estimation model:
RDIt = f(St-1, ? GDPPCt, EDUt, BMPDt, IDt, RLRt, IPt) (1)
where the different variables are as defined above. What we are interested in is the 'long term'
relationship between intellectual property protection and research and development
investment, and it appears reasonable that yearly data would not be appropriate to capture it.
Surely, yearly changes in research and development investment cannot be expected to reflect
the response of innovation to changes in the strength of protection, not only because changes
in the latter are rather occasional, but also because innovation decisions tend to be relatively
long term decisions. It would be more plausible, therefore, to estimate this relationship using
data averaged over longer periods than a single year. Such averaging would reduce, if not
eliminate, the yearly variations in R&D investment on account of 'short run' causes. Over how
many periods should the data be averaged, however, is not à priori clear. Following the lead
of earlier researchers studying long-term macro-relationships using panel data (e.g. Islam
1995), we use quinquennial data to estimate this relationship. Partly, we are forced to do this,
because data on some variables such as education (EDU) and the index of protection (IP) are
only available on a quinquennial basis (see the data section below).
Page 16
15
Data, Samples and Estimation Issues
Data and Samples
Data on the variables discussed above were collected from several different sources (see
Appendix 3). The maximum sample size was 32 countries (listed in Table 1). The major
constraining factor for the sample period was the short series for R&D investment, which was
available only from 1981 to 1990 for a respectable number of countries. But for this
constraint, the sample period could have been longer. While data on most variables were
available on a yearly basis, those for EDU and IP were only available quinquennially. Atleast
for variable IP this is understandable, because changes in patent laws and their enforcement
are few and well-spaced so that it becomes difficult to capture changes in protection levels on
a yearly basis. The summary statistics pertaining to the variables are listed in Appendix 1.
Data on all the variables were available for only 29 countries for the period 1981-
199013. Since we propose to use five-year averages, this implies that we have only two data
points for each country, 1985 (or the average for 1981-85) and 1990 (or the average for
1986-90), for a total of 58 observations. Estimations using this sample constitute 'Exercise 1'.
If we are prepared to drop variable RLR from the initial general model, on grounds that earlier
work on R&D shows internal funds to be the really significant source of funds for such
investment, then our sample size becomes 31 countries (now including Jordan and Pakistan).
Estimations using this larger sample constitute 'Exercise 2'. Many researchers have used
literacy rates (LIT) in lieu of the human capital variable that we have defined above. While we
have reservations about the use of literacy rates to represent skill levels (which we briefly
voiced above), doing so expands our sample of countries by another (Nigeria). Estimations
Page 17
16
based on this expanded sample of 32 countries constitute 'Exercise 3'.
Estimation Issues
A large menu of alternative methods obtains for the estimation of panel data models with
individual country effects. A significant issue that arises in this context is whether such effects
ought to be treated as 'fixed' or 'random'. In a lot many applications the former approach is
adopted, which requires estimating the individual effects as parameters. It is not clear à priori,
however, that it ought to be the automatically preferred approach. Indeed, it has been shown
(Nerlove 1967, 1971; Maddala 1971; Nickell 1981) that OLS estimates (either ignoring or)
treating individual effects as constants to be estimated gave "exceedingly poor estimates' of
the system parameters. These studies point out that the advantage of the 'random effects'
model follows from the fact that estimating a fixed effects model implies not only substantially
fewer degrees of freedom but also rules out all information that may be available by directly
comparing individual units. This is particularly egregious when the number of individual units
in a panel substantially exceeds the number of time periods (as in our samples, where the
number of countries outnumber the number of time periods by a factor of as much as 1514);
for, in such a situation, we must make efficient use of the information across individual units,
to estimate that part of the behavioural relationship under study which contains variables that
(are hypothesized to) differ substantially across the units. For these reasons we prefer to use a
random effects model for studying our relationship. Specifically, the econometric model
estimated is of the type:
yit = + ßk xkit + µI + eit i = 1, …, N; t = 1, …, Tß̄1
Page 18
17
where µI ~ N(0, )s µ2
eit ~ N(0, )s e2
EµIeijt = 0, ú i, j and t,
EµIµj = 0, i Ö j,
Eeitejs = 0, i Ö j, t Ö s. (2)
where the regressand yit refers to R&D investment for the ith country in the tth year, while xkit
refers to the kth regressor for the ith country in the tth year. All variables are taken in (natural)
logs. All variables are stationary. Estimation yields feasible GLS estimates of the model
parameters, which are discussed below.
Estimation Results
In Table 1 we categorize the list of countries in our data set into five groups, based on the
average strengths of intellectual property protection obtaining in these countries over the
period 1981-1990. We also note the share of GNP that they devote to R&D15. From these
data there appears to be a monotonic positive relation between RDI and the strength of
intellectual property protection. Thus, countries with the lowest level of protection invest less
than 1/3 of 1% of their GNP on research and development activities. At the other extreme,
countries with the highest level of protection invest almost 6 times as much on R&D. Of
course, no firm conclusion can be reached unless we allow for various control factors that
impinge on R&D investment. This is what we do in the following exercises.
Intellectual property protection and technological change: Exercise 1
Page 19
18
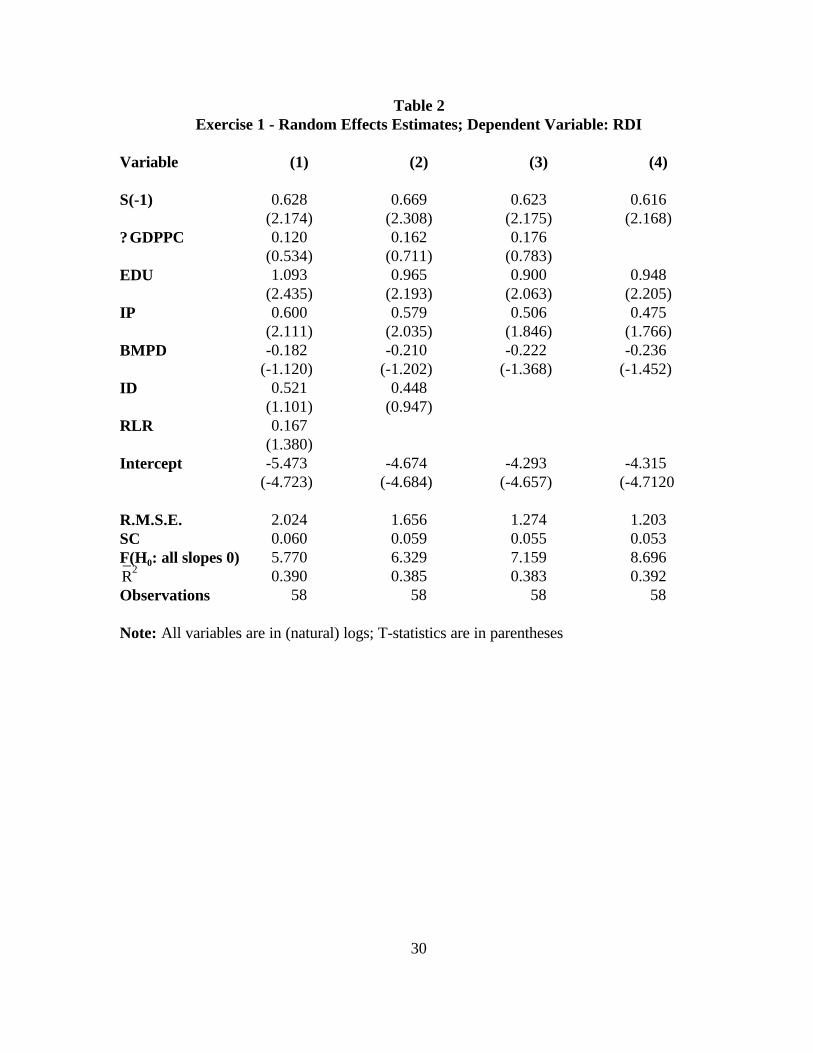
Table 2 reports the 'random effects' GLS estimates using a sample of 29 countries for which
data were available for all the variables discussed above. Model (1) sets out the results of the
'complete' model, i.e. equation (1) above. Note, that in this analysis, we move from a relatively
general model to a relatively specific one (Charemza and Deadman 1997). In doing so, we
may use various model selection tests such as the 'root mean squared error' (R.M.S.E) and the
'Schwarz criterion' (SC). We must emphasize, however, that one cannot afford to be
doctrinaire about the model selection procedure adopted, for the simple reason that theory is
just not well-defined enough to guide us in starting from 'the' complete model. More often
than not, the available data may be the binding constraint. Interestingly, this criticism applies
as much to general-to-specific modelling as to specific-to-general modelling where researchers
start off with a 'base model' and then add variables one by one; for theory may not be
particularly helpful in guiding us to 'the' base model either. We bear these reservations in mind
as we proceed.
Model (1) results show that internal funds have a strong and significant positive
influence on R&D. This supports earlier findings in the I-O literature which point to the
importance of internal funds for investing in such uncertain ventures as research and
development for which financial institutions are quite unwilling to lend. Relatively educated
countries, ceteris paribus, invest significantly more in research and development; indeed, a
skilled manpower base is a pre-requisite to R&D activities. The strength of intellectual
property protection is positively and significant associated with R&D, supporting the
hypothesis that we had set out to test. Thus, countries which provided stronger protection
tended to have larger proportions of their GDP devoted to R&D activities.
Page 20
19
Both the political instability dummy as well as the real lending rate, however, have the
wrong sign, although insignificant. Model (2), therefore, drops RLR because theory suggested
this to be relatively unimportant in explaining R&D (internal funds mostly financing such
activity, as we pointed out). Variable ID still has the wrong sign, so model (3) drops this
variable too. The results show that the conclusions we reached above about the importance of
internal funds, education and the strength of intellectual property protection remain
unaffected. Additionally, the trade orientation variable BMPD is now marginally significant
(using a one-tail test) - economies which are relatively open tend to face greater competition
and therefore spend more on R&D. In model (4) we further drop the demand variable
? GDPPC, which had the right sign but was insignificant in model (3). The internal funds
variable, education, the index of protection as well as the trade orientation variable all
continue to be significant16. (All these conclusions would still be valid were we to reverse the
model selection procedure and move from the 'base model' (4) to a more general model (3);
and indeed even (2) and (1), except that we should eschew (2) and (1) because in these
models variables ID and RLR appear with the wrong signs.) Model (4) has the lowest root
mean squared error and also minimizes the Schwarz criterion17.
Intellectual property protection and technological change: Exercise 2
The received literature on R&D emphasizes the significance of internal funds for such risky
investments as R&D, for which creditors are generally unwilling to lend. If, therefore, we
were to start with a model that excludes the variable RLR, i.e.
RDIt = f(St-1, ? GDPPCt, EDUt, BMPDt, IDt, IPt) (3)
Page 21
20
our sample size rises to 31 countries (now including Jordan and Pakistan) or 62 observations.
The 'random effects' GLS estimates based on this larger sample are reported in Table 3. Model
(1) results reveal lagged savings to have a significant positive influence on R&D. The trade
orientation variable is strongly negatively related to RDI, indicating the importance of
international competition in encouraging research and development activities. Intellectual
property protection continues to have a strong positive association with R&D, as in the
previous exercise.
But the political instability dummy again has the wrong sign, although it is
insignificant. Model (2), therefore, drops this variable. All of our previous results - from
model (1) - remain unchanged. Models (3) and (4) further drop the education variable EDU
and the demand variable ? GDPPC, respectively, which have the right sign but are insignificant
in model (2). We find that the sequence of dropping these variables (i.e. which variable we
drop first) does not affect the qualitative results. Finally, model (5) drops both EDU and
? GDPPC. The internal funds variable, the trade orientation variable and the index of
protection all continue to be significant18. (Again, these conclusions would remain valid if we
were to move from the 'base model' (5) to the more general model (2) by adding variables.
They would also be valid in the case of model (1), but as before we should eschew this model
where variable ID appears with the wrong sign.) Model (5) has the lowest root mean squared
error and also minimizes the Schwarz criterion.
Intellectual property protection and technological change: Exercise 3
Some researchers use literacy rates (LIT) rather than the number of schooling years (EDU) to
Page 22
21
define the human capital variable. While we prefer to use the latter as a measure of skill levels,
using literacy rates instead expands our sample of countries by one more (Nigeria). The simple
correlation coefficient between the 'education' and 'literacy' variables was 0.74, supporting the
substitution of 'LIT' for 'EDU' only partially. Table 4 reports the random effects GLS
estimates based on this larger sample of 32 countries or 64 observations. (In this exercise we
continue to exclude variable RLR.) Model (1) results, based on the following equation
RDIt = f(St-1, ? GDPPCt, LITt, BMPDt, IDt, IPt) (4)
reveal lagged savings to have a strongly positive influence on R&D activities. So also do
literacy levels, providing support to our results in exercise 1. The protection of intellectual
property rights appears to strongly encourage R&D, as in both the previous exercises.
The political instability dummy ID once again has the wrong sign, and is also
significant. This variable is, therefore, omitted from model (2). The literacy variable is now
insignificant, although only marginally so (at the 10% level using a one-tail test). This should
not distract us from the plausible effects found for education in the previous two exercises, in
view of the 'modest' correlation between 'literacy' and the 'education' variables reported above.
Also, the demand variable is now positively significant. Model (3) further omits the trade
orientation variable BMPD, which has the right sign but is insignificant in model (2). This
leads to no further changes in the results found in model (2). Finally, model (4) drops both
LIT and BMPD. We find that the internal funds variable, the demand variable, and the index
of protection all continue to be significant19. (Even if we move from the 'reference model' (4)
to the more general model (2) by progressively adding the relevant variables, the same
conclusions hold.) Model (4) has the lowest root mean squared error, although not the
Page 23
22
Schwarz statistic.
Conclusions
This paper set out to establish an empirical relation between the protection of intellectual
property rights and technological change (and hence between the former and economic
growth). We found evidence to support the claim that the former encourages the latter insofar
as intellectual property protection was found to have a strong positive association with R&D
investment. This relation continued to hold even when several pertinent control variables were
allowed for. Results may have been even more pronounced if we had reliable, quantifiable
evidence on the implementation aspect of intellectual protection across countries, for many
developing countries may appear to have strong protection laws on their statutes but are
rather remiss in their implementation. Our results imply that the lack of an incentive structure
can be a significant mitigating factor for technological change even when other constraints
such as internal funds, availability of skills and trade orientation may not be binding.
Page 24
23
References
Barro, R.J. 1991, 'Economic growth in a cross section of countries', Quarterly Journal of
Economics, 106(2), 407-443.
Barro, R.J. and J.W. Lee 2000, Barro-Lee Data Set: International Measures of Schooling
Years and Schooling Quality, NBER website 'www.nber.org', National Bureau of
Economic Research, Cambridge.
Bhagwati, J. 1978, Anatomy and Consequences of Exchange Control Regimes, Ballinger,
Cambridge.
Charemza, W.W. and D.F. Deadman 1997, New Directions in Econometric Practice, Edward
Elgar, Cheltenham.
Chin, J.C. and G.M. Grossman 1990, 'Intellectual Property Rights and North-South Trade' in
R.W. Jones and A.O. Krueger (eds.) The Political Economy of International Trade:
Essays in Honor of Robert E. Baldwin, Basil Blackwell, Cambridge.
Deardorff, A.V. 1992, 'Welfare Effects of Global Patent Protection', Economica, 59(233), 35-
52.
Diwan, I. and D. Rodrik 1991, 'Patents, Appropriate Technology and North-South Trade',
Journal of International Economics, 29(1), 27-48.
Edwards, S. 1992, 'Trade orientation, distortions and growth in developing countries', Journal
of Development Economics, 39(1), 31-58.
Esty, D.C. et.al. 1998, 'The State Failure Project: Early Warning Research for U.S. Foreign
Policy Planning' in J.L. Davies and T.R. Gurr (eds.) Preventive Measures Building
Risk Assessment and Crisis Early Warning Systems, Rowman and Littlefield, Boulder.
Page 25
24
Evenson, R.E. 1990, 'Survey of Empirical Studies' in W.E. Siebeck (ed.) Strengthening
Protection of Intellectual Property in Developing Countries: A Survey of the
Literature, World Bank Discussion Paper 112, The World Bank, Washington D.C.
Gadbaw, R.M. and T.J. Richards 1988, Intellectual Property Rights: Global Consensus,
Global Conflict?, Westview Press, Boulder.
Geroski, P.A. and C.F. Walters 1995, 'Innovative Activity Over the Business Cycle',
Economic Journal, 105(431), 916-928.
Gilbert, R.J. and D.M.G. Newbery 1982, 'Preemptive patenting and the persistence of
monopoly', American Economic Review, 72(3), 514-526.
Ginarte, J.C. and W.G. Park 1997, 'Determinants of patent rights: A cross-national study',
Research Policy, 26(3), 283-301.
Gould, D.M. and W.C. Gruben 1996, 'The role of intellectual property rights in economic
growth', Journal of Development Economics, 48(2), 323-350.
Grossman, G.M. and E. Helpman 1991, Innovation and Growth in the Global Economy, MIT
Press, Cambridge.
Guellec, D. and E. Ioannidis 1997, 'Causes of fluctuations in R&D expenditures: A
quantitative analysis', OECD Economic Studies, 29(2), 123-139.
Hall, B.H. 1992, Investment and R&D at the Firm Level: Does the Source of Financing
Matter?, Working Paper No. 4096, National Bureau of Economic Research,
Cambridge.
Himmelberg, C. and B. Petersen 1994, 'R&D and Internal Finance: A Panel Study of Small
Firms in High-Tech Industries', Review of Economics and Statistics, 76(1), 38-51.
Page 26
25
Islam, N. 1995, 'Growth Empirics: A Panel Data Approach', Quarterly Journal of Economics,
110(4), 1127-1170.
Kamien, M.I. and N.L. Schwartz 1982, Market Structure and Innovation, Cambridge
University Press, Cambridge.
Krueger, A.O. 1978, Liberalization Attempts and Consequences, Ballinger, Cambridge.
Lai, E. 1998, 'International Intellectual Property Rights Protection and the Rate of Product
Innovation', Journal of Development Economics, 55(1), 133-153.
Lanjouw, J.O. and I. Cockburn 2000, Do Patents Matter?: Empirical Evidence after GATT,
Working Paper 7495, National Bureau of Economic Research, Cambridge.
Lesser, W. 2000, 'An Economic Approach to Identifying an ‘Effective sui generis System’ for
Plant Variety Protection Under TRIPs' in V. Santaniello, R. Evenson, D. Zilberman
and G. Carlson (eds.) Agriculture and Intellectual Property Rights, CABI publishing,
Wallingford.
Levin, R.C., A. Klevorick, R.R. Nelson and S.G. Winter 1987, 'Appropriating the Returns
from Industrial Research and Development', Brookings Papers on Economic Activity,
no. 3, Washington, D.C.
Lewis, W.A. 1955, The Theory of Economic Growth, Allen and Unwin, London.
Maddala, G.S. 1971, 'The Use of Variance Components Models in Pooling Cross Section and
Time Series Data', Econometrica, 39(2), 341-358.
Mandich, G. 1948, 'Venetian Patents (1450-1550)', Journal of the Patent Office Society,
30(3), 166-224.
Page 27
26
Mansfield, E. 1985, 'How rapidly does industrial technology leak out?', Journal of Industrial
Economics, 34(2), 217-223.
Mansfield, E. 1986, 'Patents and Innovation: An Empirical Study', Management Science,
32(1), 173-181.
Nadiri, M.I. 1980, 'Contributions and Determinants of Research and Development
Expenditures in the U.S. Manufacturing Industries' in G.M. von Furstenberg (ed.)
Capital, Efficiency and Growth, Ballinger Publishing Company, Cambridge.
Nelson, R.R. and E.S. Phelps 1966, 'Investment in Humans, Technological Diffusion, and
Economic Growth', American Economic Review, 56(1/2), 59-75.
Nerlove, M. 1971, 'Experimental Evidence on the Estimation of Dynamic Economic Relations
from a Time Series of Cross Sections', Economic Studies Quarterly, 18(1), 42-74.
Nerlove, M. 1971, 'Further Evidence on the Estimation of Dynamic Economic Relations from
a Time Series of Cross Sections', Econometrica, 39(2), 359-387.
Nickell, S. 1981, 'Biases in Dynamic Models with Fixed Effects', Econometrica, 49(6), 1417-
1426.
Park, W.G. 1997, 'A note on innovation and patent protection: Intertemporal imitation-risk
smoothing', Economics Letters, 54(2), 185-189.
Penn World Table Mark 5.6a 2001, National Bureau of Economic Research, Cambridge.
Pick's Currency Yearbook, various years, Pick Publishing Corporation, New York.
Rapp, R.T. and R.P. Rozek 1990, 'Benefits and costs of intellectual property protection in
developing countries', Journal of World Trade, 24(5), 74-102.
Page 28
27
Roffe, P. 1974, 'Abuses of Patent Monopoly: A Legal Appraisal', World Development, 2(9),
15-26.
Romer, P.M. 1990, 'Endogenous Technological Change', Journal of Political Economy,
98(5), pt. 2, S71-S102.
Sakakibara, M. and L. Branstetter 2001, 'Do stronger patents induce more innovation?
Evidence from the 1988 Japanese patent law reforms', RAND Journal of Economics,
32(1), 77-100.
Schankerman, M. 1998, 'How Valuable is Patent Protection? Estimation by Technology Field',
RAND Journal of Economics, 29(1), 77-107.
Scherer, F.M. and D. Ross 1990, Industrial Market Structure and Economic Performance,
Houghton Mifflin, Boston.
Schiff, E. 1971, Industrialization without National Patents: The Netherlands, 1869-1912;
Switzerland, 1850-1907, Princeton University Press, Princeton.
Segerstrom, P. 1991, 'Innovation, Imitation and Economic Growth', Journal of Political
Economy, 99(4), 807-827.
Sherwood, R.M. 1990, Intellectual Property and Economic Development, Westview Press,
Boulder.
South Centre 1997, The TRIPs Agreement: A Guide for the South, South Centre,
Switzerland.
Summers, R. and A. Heston 1991, 'The Penn World Table (Mark 5): An Expanded Set of
International Comparisons 1950-1988', Quarterly Journal of Economics, 106(2), 327-
368.
Page 29
28
Taylor, M.S. 1993, 'TRIPs, Trade and Technology Transfer', Canadian Journal of
Economics, 26(3), 625-637.
Taylor, M.S. 1994, 'TRIPS, Trade and Growth', International Economic Review, 35(2), 361-
381.
World Bank 1987, World Development Report 1987, Oxford University Press, New York.
World Bank 2000, World Development Indicators 2000, The World Bank, Washington D.C.
World Currency Yearbook, various years, International Currency Analysis Inc., New York.
Page 30
29
Table 1Strength of Intellectual Property Protection and R&D investment, 1981-1990
0 # IP* < 1 1 # IP < 2 2 # IP < 3 3 # IP < 4 4 # IP # 5Country RDI* Country RDI Country RDI Country RDI Country RDI
Indonesia 0.303 Venezuela 0.352 Iceland 0.812 Nigeria 0.542 Austria 1.27
6Mexico 0.397 Singapore 0.660 Sri Lanka 0.185 Italy 1.11
0India 0.772 Canada 1.419 Australia 1.222 Netherlands 2.08
1Thailand 0.257 Jamaica 0.058 Norway 1.516 USA 2.71
9Jordan 0.231 Mauritius 0.352 Spain 0.612Portugal 0.415 Finland 1.720 UK 2.229Pakistan 0.926 Ireland 0.870 S. Africa 0.882
Sweden 2.822S. Korea 1.421Denmark 1.389France 2.233Japan 2.704Belgium 1.614
Av. RDI 0.303 0.479 0.842 1.490 1.79
7
Note: * IP - Index of Protection; RDI - Share of R&D investment in GNP
Page 31
30
Table 2Exercise 1 - Random Effects Estimates; Dependent Variable: RDI
Variable (1) (2) (3) (4)
S(-1) 0.628 0.669 0.623 0.616(2.174) (2.308) (2.175) (2.168)
?GDPPC 0.120 0.162 0.176(0.534) (0.711) (0.783)
EDU 1.093 0.965 0.900 0.948(2.435) (2.193) (2.063) (2.205)
IP 0.600 0.579 0.506 0.475(2.111) (2.035) (1.846) (1.766)
BMPD -0.182 -0.210 -0.222 -0.236(-1.120) (-1.202) (-1.368) (-1.452)
ID 0.521 0.448(1.101) (0.947)
RLR 0.167(1.380)
Intercept -5.473 -4.674 -4.293 -4.315(-4.723) (-4.684) (-4.657) (-4.7120
R.M.S.E. 2.024 1.656 1.274 1.203SC 0.060 0.059 0.055 0.053F(H0: all slopes 0) 5.770 6.329 7.159 8.696
0.390 0.385 0.383 0.392R̄2
Observations 58 58 58 58
Note: All variables are in (natural) logs; T-statistics are in parentheses
Page 32
31
Table 3Exercise 2 - Random Effects Estimates; Dependent Variable: RDI
Variable (1) (2) (3) (4) (5)
S(-1) 0.344 0.372 0.377 0.338 0.344 (1.672) (1.734) (1.944) (1.612) (1.816)
?GDPPC 0.087 0.164 0.155 (0.443) (0.807) (0.804)
EDU 0.252 0.191 0.207(0.842) (0.634) (0.692)
IP 0.943 0.806 0.890 0.806 0.897 (3.232) (2.889) (3.409) (2.892) (3.432)
BMPD -0.546 -0.375 -0.381 -0.394 -0.400 (-2.208) (-1.617) (-1.676) (-1.715) (-1.780)
ID 0.857 (1.661)
Intercept -2.796 -2.602 -2.354 -2.492 -2.224 (-3.506) (-3.298) (-3.113) (-3.212) (-3.010)
R.M.S.E. 1.218 0.932 0.766 0.866 0.701SC 0.0498 0.052 0.045 0.0487 0.042F(H0: all slopes 0) 4.156 4.566 5.061 5.361 6.151
0.247 0.239 0.230 0.243 0.233R̄2
Observations 62 62 62 62 62
Note: All variables are in (natural) logs; T-statistics are in parentheses
Page 33
32
Table 4Exercise 3 - Random Effects Estimates; Dependent Variable: RDI
Variable (1) (2) (3) (4)
S(-1) 0.629 0.889 0.885 0.939(3.210) (4.146) (4.134) (4.371)
?GDPPC 0.198 0.392 0.414 0.560(1.030) (1.762) (1.871) (2.551)
LIT 0.049 0.037 0.038(1.976) (1.252) (1.268)
IP 1.132 0.795 0.876 0.843(3.782) (2.671) (3.101) (3.262)
BMPD -0.070 -0.073(-1.025) (-0.904)
ID 1.368 (4.062)
Intercept -3.945 -4.304 -4.396 -4.373(-5.413) (-5.373) (-5.542) (-5.622)
R.M.S.E. 0.815 0.833 0.804 0.766SC 0.057 0.075 0.071 0.077F(H0: all slopes 0) 9.403 7.055 8.350 10.829
0.467 0.345 0.348 0.362R̄2
Observations 64 64 64 64
Note: All variables are in (natural) logs; T-statistics are in parentheses
Page 34
33
Appendix 1Means and Standard Deviations of the Variables
Variable Mean Standard Deviation
RDI 1.205 0.807
S(-1) 20.701 8.762
?GDPPC 808.900 864.290
EDU 6.989 2.278
LIT 87.973 17.757
IP 2.940 0.977
BMPD 0.500 0.504
ID 0.159 0.367
RLR 3.953 7.966
Page 35
34
Appendix 2
Definitions of Variables
RDI: Research and Development expenditure as a percentage share of GNP (%)
S(-1): Real Savings share of GDP (at 1985 international prices), lagged one period (%)
? GDPPC: Real GDP per capita (chain index in 1985 international prices) as a proportion of
the previous period real GDP per capita (US $$)
EDU: Average number of schooling years in population over 15 (years)
LIT: Total literacy rate in population over 15 (%)
IP: Index of patent protection
BMPD: Black market exchange rate premium dummy
ID: Political instability dummy
RLR: Real lending rate of interest (%)
Page 36
35
Appendix 3
Data Sources
RDI: World Bank 2000
S(-1): Penn World Tables 5.6a (also see Summers and Heston 1991)
? GDPPC: Penn World Tables 5.6a (also see Summers and Heston 1991)
EDU: Barro-Lee 1996
LIT: World Bank 2000
IP: Ginarte-Park 1997
BMPD: Pick's Currency Yearbook and World Currency Yearbook (various years)
ID: Esty et.al. 1998
RLR: World Bank 2000
Page 37
36
1. Thus, in the United States, the share of all patents issued to individual inventors was 91% in 1901; but
by the early 1980s this had reduced to under 19% (Scherer and Ross 1990).
2. GATT - General Agreement on Tariffs and Trade; WTO - World Trade Organisation.
3. Thus, the Dutch government repealed the existing patent law in 1869, whereas the Swiss government
could not enact a patent law because successive referendums in the late-19th century defeated such a
proposal.
4. World Intellectual Property Organisation.
5. In fact, the U.S. repeatedly used its trade laws 'super 301' and 'special 301' in its bilateral dealings with
some nations.
6. R&D data were available as proportions of GNP and not GDP; the discrepancy should be of the second
order of smalls.
7. In addition, the protection of geographical indications, integrated circuits and industrial designs may also
be considered subsequent to the TRIPs agreement of 1995 (South Centre, op.cit.); but this falls outside the
sample period for this study.
8. An alternative index is that constructed by Rapp and Rozek (1990), and used by Gould and Gruben
(1996). The Rapp and Rozek index is based on a comparison of individual countries' patent laws with the
guidelines proposed by the US Chamber of Commerce's Intellectual Property Task Force in Guidelines
for Standards for the Protection and Enforcement of Patents. It ranks countries from zero to five, with
the former signifying an absence of patent protection laws and the latter full conformity with the proposed
standards. The Ginarte-Park index is superior in many respects, as it looks into various facets of patent
protection in greater detail, and therefore makes for greater variation in the index or protection even
amongst the developed countries.
9. This is precisely another problem with the Gould and Gruben (1996) study, in that they try to explain
Notes:
Page 38
37
a stationary variable such as the growth rate of GDP using a nonstationary variable such as GDP.
10. Ideally, we ought to estimate a vector autoregression model to take care of the related endogeneity
problem. This, however, would require long time series of data, which are just not available.
11. To jump ahead for a moment, since all variables are measured in logs, the ratio of current to lagged
per capita GDP will translate into a change in (log) GDP between periods; hence the use of the operator
‘? ’ for this variable.
12. The black market exchange rate premium itself is calculated as (BMR - OR)/OR, where BMR is the
black market exchange rate and OR is the official exchange rate (both measured in local currency per US
dollar).
13. Even so, for Austria, Mexico, and Indonesia (1981-85 only), we had to use the real deposit rate in lieu
of the real lending rate.
14. In the econometric studies cited above, the number of cross section units were assumed to exceed the
number of time periods only by a factor of 2.5.
15. See endnote 6.
16. The (F-distribution variant of the) LM-statistic for the null hypothesis H0: S(-1) = 0 is LMF = 30.504;
for the null hypothesis H0: EDU = 0, LMF = 30.242; for the null hypothesis H0: BMPD = 0, LMF =
37.707, and for the null hypothesis H0: IP = 0, LMF = 35.098. In all four cases, the LM statistics
comfortably exceed the critical value F(1, 53) = 7.161 at the 1% level.
17. It also happens to have the highest adjusted R2, but we do not use this statistic for model selection
because it is quite unreliable in many situations. We report it here only for those who might be interested.
18. The (F-distribution variant of the) LM-statistic for the null hypothesis H0: S(-1) = 0 is LMF = 16.742;
for the null hypothesis H0: BMPD = 0, LMF = 17.916, and for the null hypothesis H0: IP = 0, LMF =
7.478. In all three cases, the LM statistics comfortably exceed the critical value F(1, 58) . 7.103 at the
1% level.
Page 39
38
19. The (F-distribution variant of the) LM-statistic for the null hypothesis H0: S(-1) = 0 is LMF = 16.268;
for the null hypothesis H0: ? GDPPC = 0, LMF = 30.280; and for the null hypothesis H0: IP = 0, LMF =
22.930. In all three cases, the LM statistics comfortably exceed the critical value F(1, 60) . 7.080 at the
1% level.