+ All Categories
Home > Documents > Economic Impact Analysis: Route 54 Expressway

Economic Impact Analysis: Route 54 Expressway

Date post: 08-Apr-2018
Category:
Upload: modot-transportation-library
View: 218 times
Download: 0 times
Share this document with a friend
13
CUMULATIVE NET GENERAL REVENUE 0. 06 : 1.00 $8.817 mi ll ion CUMULATIVE PERSONAL INCOME 1.44 : 1.00 $210.970 million CUMULATIVE VALUE-ADDED / GSP 2.46 : 1.00 $361.208 million CUMULATIVE ECONOMIC OUTPUT 4.00 : 1.00 $587.231 million ANNUAL EMPLOYMENT 150 at an average wage of $24,102 ANNUAL NET GENERAL REVENUE $0.187 mi ll ion ANNUAL PERSONAL INCOME $5.274 mill ion ANNUAL VALUE-ADDED / GSP $9.030 mill ion ANNUAL ECONOMIC OUTPUT $14.681 million ECONOMIC IMPACT ANALYSIS FOR MISSOURI Route 54 Expressway CUMULATIVE ECONOMIC IMPACT ACROSS MISSOURI AVERAGE ANNUAL ECONOMIC IMPACT ACROSS MISSOURI Benefit Ratio 20-Year Total Our mission is to provide a w orld-class transportation experience that delights our customers and promotes a prosperous Missouri. MoDOT's Route 54 Expressway will create a new four lane road structure around the current Route 54. The purpose of the project is to reduce traffic congestion throughout the Lake of the Ozarks region while maintaining access to the business districts. The project will cost an estimated $146.7 Million and constructi on will take place over a five-year period. Over 20 years, every dollar of Route 54 Expressway investment returns:  $0.06 in new net general revenues to the State of Missouri totaling $8.8 million  $1.44 in new personal income to Missourians totaling $211.0 million  $2.46 in new value-added (GSP) to Missouri's economy totaling $361.2 million  $4.00 in new economic activity (output) to Missouri's economy totaling $587.2 million On average each year , the project creates 150 new jobs annually paying an average wage of $24,102 per job, generates $0.2 million in new net general revenues annually, $5.3 million in new personal income annually, $9.0 million in new value-added to the economy annually, and $14.7 million annually in new economic activity. Location of Route 54 Expressway CONSTRUCTION PHASE Average Annual Employment Impact OPERATIONS PHASE Average Annual Employment Impact
Transcript

8/7/2019 Economic Impact Analysis: Route 54 Expressway

http://slidepdf.com/reader/full/economic-impact-analysis-route-54-expressway 1/13

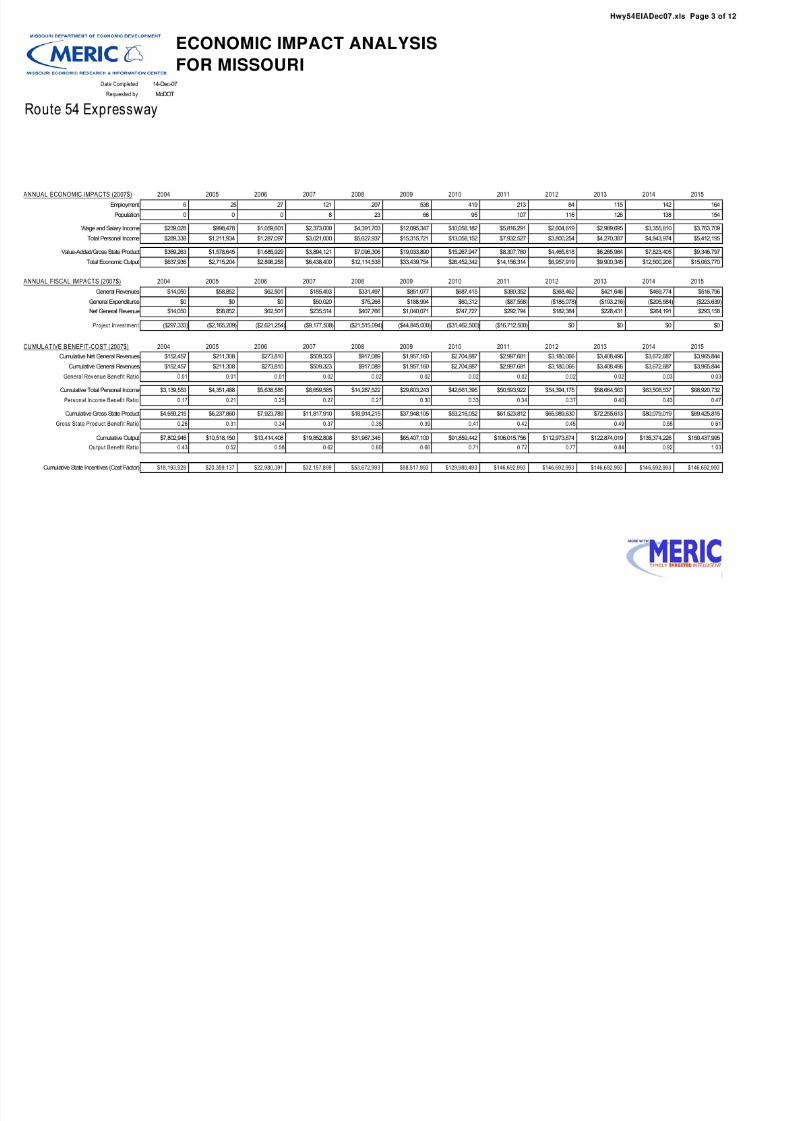
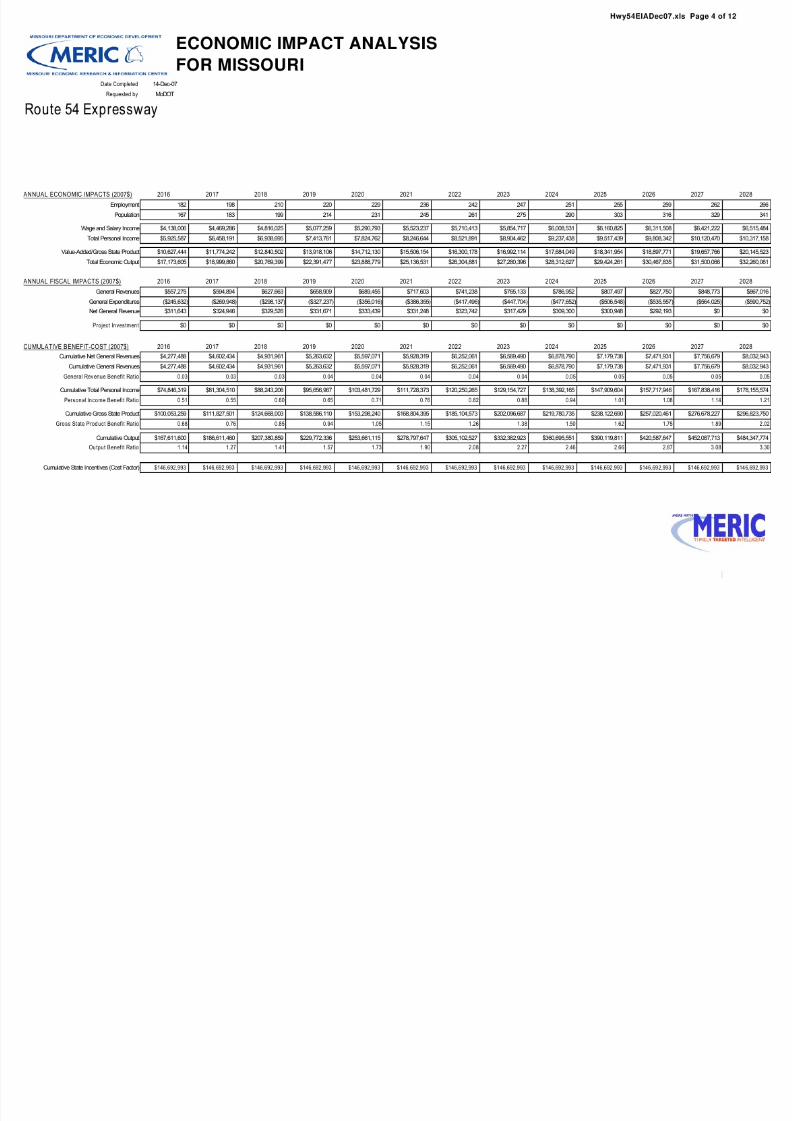
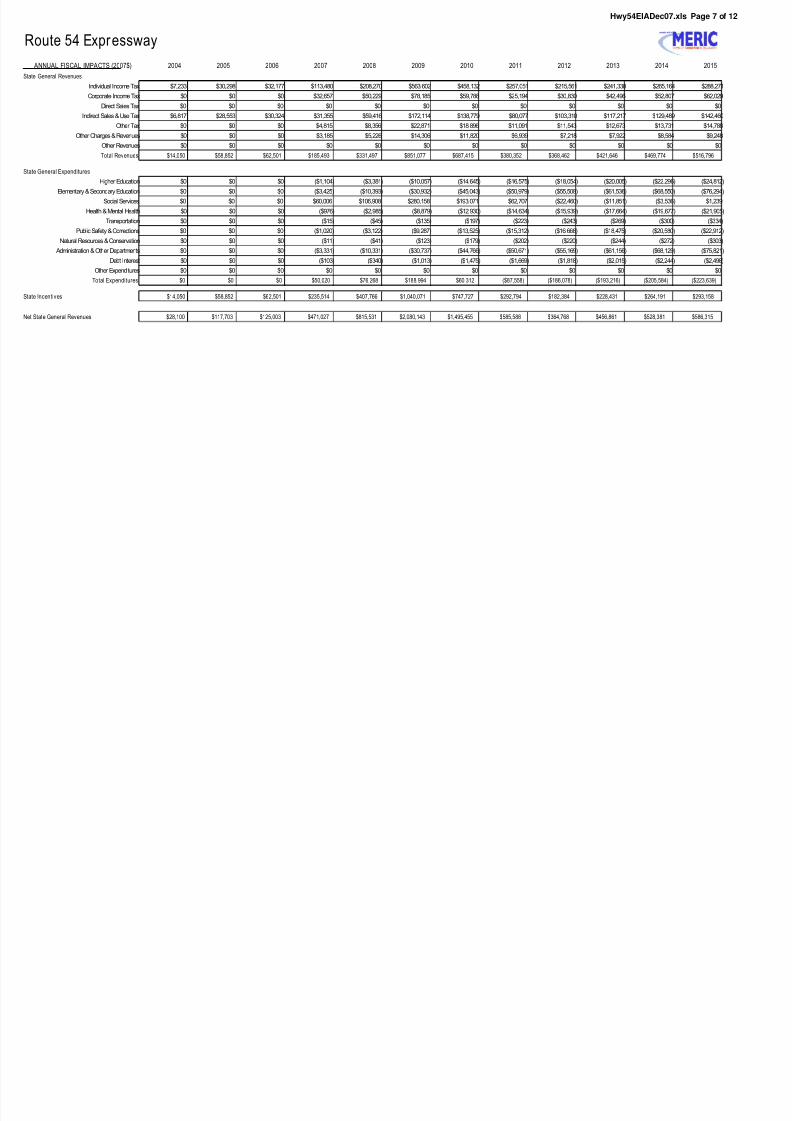
CUMULATIVE NET GENERAL REVENUE 0.06 : 1.00 $8.817 million

CUMULATIVE PERSONAL INCOME 1.44 : 1.00 $210.970 million

CUMULATIVE VALUE-ADDED / GSP 2.46 : 1.00 $361.208 million

CUMULATIVE ECONOMIC OUTPUT 4.00 : 1.00 $587.231 million

ANNUAL EMPLOYMENT 150 at an average wage of $24,102

ANNUAL NET GENERAL REVENUE $0.187 million

ANNUAL PERSONAL INCOME $5.274 million

ANNUAL VALUE-ADDED / GSP $9.030 million

ANNUAL ECONOMIC OUTPUT $14.681 million

ECONOMIC IMPACT ANALYSIS FOR MISSOURI

Route 54 Expressway

CUMULATIVE ECONOMIC IMPACT ACROSS MISSOURI

AVERAGE ANNUAL ECONOMIC IMPACT ACROSS MISSOURI

Benefit Ratio 20-Year Total

Our mission is to provide a w orld-class transportation experience that delights our

customers and promotes a prosperous Missouri. MoDOT's Route 54 Expressway will create a new four lane road structure around the current Route 54. The purpose

of the project is to reduce traffic congestion throughout the Lake of the Ozarks region while maintaining access to the

business districts. The project will cost an estimated $146.7 Million and construction will take place over a five-year

period.

Over 20 years, every dollar of Route 54 Expressway investment returns: 

  $0.06 in new net general revenues to the State of Missouri totaling $8.8 million

  $1.44 in new personal income to Missourians totaling $211.0 million

  $2.46 in new value-added (GSP) to Missouri's economy totaling $361.2 million

  $4.00 in new economic activity (output) to Missouri's economy totaling $587.2 million

On average each year , the project creates 150 new jobs annually paying an average wage of $24,102 per job,

generates $0.2 million in new net general revenues annually, $5.3 million in new personal income annually, $9.0million in new value-added to the economy annually, and $14.7 million annually in new economic activity.

Location of Route 54 Expressway

CONSTRUCTION PHASE

Average Annual Employment Impact

OPERATIONS PHASE

Average Annual Employment Impact

8/7/2019 Economic Impact Analysis: Route 54 Expressway

http://slidepdf.com/reader/full/economic-impact-analysis-route-54-expressway 2/13

8/7/2019 Economic Impact Analysis: Route 54 Expressway

http://slidepdf.com/reader/full/economic-impact-analysis-route-54-expressway 3/13

8/7/2019 Economic Impact Analysis: Route 54 Expressway

http://slidepdf.com/reader/full/economic-impact-analysis-route-54-expressway 4/13

8/7/2019 Economic Impact Analysis: Route 54 Expressway

http://slidepdf.com/reader/full/economic-impact-analysis-route-54-expressway 5/13

Hwy54EIADec07.xls Page 5 of 12

Date Completed 14-Dec-07

Requested by MoDOT

Route 54 Expressway

  ANNUAL ECONOMIC IMPACTS (2007$) 2029 2030 2031 2032 2033 2034 2035 2036 2037 2038 2039 2040 2041

Employment 268 271 275 0 0 0 0 0 0 0 0 0 0

Population 352 363 375 0 0 0 0 0 0 0 0 0 0

Wage and Salary Income $6,651,766 $6,759,853 $6,852,668 $0 $0 $0 $0 $0 $0 $0 $0 $0 $0

Total Personal Income $10,656,516 $10,932,602 $11,225,788 $0 $0 $0 $0 $0 $0 $0 $0 $0 $0

Value-Added/Gross State Product $20,871,488 $21,393,275 $22,119,240 $0 $0 $0 $0 $0 $0 $0 $0 $0 $0

Total Economic Output $33,167,517 $34,403,926 $35,311,382 $0 $0 $0 $0 $0 $0 $0 $0 $0 $0

  ANNUAL FISCAL IMPACTS (2007$) 2029 2030 2031 2032 2033 2034 2035 2036 2037 2038 2039 2040 2041

General Revenues $887,838 $903,886 $924,811 $0 $0 $0 $0 $0 $0 $0 $0 $0 $0

General Expenditures ($618,245) ($644,534) ($669,777) $0 $0 $0 $0 $0 $0 $0 $0 $0 $0

Net General Revenue $0 $0 $0 $0 $0 $0 $0 $0 $0 $0 $0 $0 $0

Project Investment $0 $0 $0 $0 $0 $0 $0 $0 $0 $0 $0 $0 $0

CUMULATIVE BENEFIT-COST (2007$) 2029 2030 2031 2032 2033 2034 2035 2036 2037 2038 2039 2040 2041

Cumulative Net General Revenues $8,302,536 $8,561,888 $8,816,922 $8,816,922 $8,816,922 $8,816,922 $8,816,922 $8,816,922 $8,816,922 $8,816,922 $8,816,922 $8,816,922 $8,816,922

Cumulative General Revenues $8,302,536 $8,561,888 $8,816,922 $8,816,922 $8,816,922 $8,816,922 $8,816,922 $8,816,922 $8,816,922 $8,816,922 $8,816,922 $8,816,922 $8,816,922

Net General Revenue Benefit Ratio 0.06 0.06 0.06 N/A N/A N/A N/A N/A N/A N/A N/A N/A N/A

Cumulative Total Personal Income $188,812,090 $199,744,692 $210,970,479 $210,970,479 $210,970,479 $210,970,479 $210,970,479 $210,970,479 $210,970,479 $210,970,479 $210,970,479 $210,970,479 $210,970,479

Personal Income Benefit Ratio 1.29 1.36 1.44 N/A N/A N/A N/A N/A N/A N/A N/A N/A N/A

Cumulative Gross State Product $317,695,238 $339,088,513 $361,207,753 $361,207,753 $361,207,753 $361,207,753 $361,207,753 $361,207,753 $361,207,753 $361,207,753 $361,207,753 $361,207,753 $361,207,753

Gross State Product Benefit Ratio 2.17 2.31 2.46 N/A N/A N/A N/A N/A N/A N/A N/A N/A N/A

Cumulative Output $517,515,291 $551,919,216 $587,230,598 $587,230,598 $587,230,598 $587,230,598 $587,230,598 $587,230,598 $587,230,598 $587,230,598 $587,230,598 $587,230,598 $587,230,598

Output Benefit Ratio 3.53 3.76 4.00 N/A N/A N/A N/A N/A N/A N/A N/A N/A N/A

Cumulative State Incentives (Cost Factor) $146,692,993 $146,692,993 $146,692,993 $146,692,993 $146,692,993 $146,692,993 $146,692,993 $146,692,993 $0 $0 $0 $0 $0

ECONOMIC IMPACT ANALYSIS

FOR MISSOURI

8/7/2019 Economic Impact Analysis: Route 54 Expressway

http://slidepdf.com/reader/full/economic-impact-analysis-route-54-expressway 6/13

Hwy54EIADec07.xls Page 6 of 12

Route 54 Expressway

  ANNUAL FISCAL IMPACTS (2007$) 1992 1993 1994 1995 1996 1997 1998 1999 2000 2001 2002 2003

State General Revenues

Individual Income Tax $6,643 $7,372 $6,573 $6,700 $5,625 $5,699 $5,341 $5,942 $5,569 $5,357 $5,731 $4,704

Corporate Income Tax $0 $0 $0 $0 $0 $0 $0 $0 $0 $0 $0 $0

Direct Sales Tax $0 $0 $0 $0 $0 $0 $0 $0 $0 $0 $0 $0Indirect Sales & Use Tax $6,261 $6,947 $6,194 $6,314 $5,301 $5,371 $5,034 $5,599 $5,248 $5,048 $5,401 $4,433

Other Tax $0 $0 $0 $0 $0 $0 $0 $0 $0 $0 $0 $0

Other Charges & Revenues $0 $0 $0 $0 $0 $0 $0 $0 $0 $0 $0 $0

Other Revenues $0 $0 $0 $0 $0 $0 $0 $0 $0 $0 $0 $0

Total Revenues $12,904 $14,319 $12,767 $13,014 $10,926 $11,070 $10,375 $11,541 $10,817 $10,405 $11,132 $9,138

State General Expenditures

Higher Education $0 $0 $0 $0 $0 $0 $0 $0 $0 $0 $0 $0

Elementary & Secondary Education $0 $0 $0 $0 $0 $0 $0 $0 $0 $0 $0 $0

Social Services $0 $0 $0 $0 $0 $0 $0 $0 $0 $0 $0 $0

Health & Mental Health $0 $0 $0 $0 $0 $0 $0 $0 $0 $0 $0 $0Transportation $0 $0 $0 $0 $0 $0 $0 $0 $0 $0 $0 $0

Public Safety & Corrections $0 $0 $0 $0 $0 $0 $0 $0 $0 $0 $0 $0

Natural Resources & Conservation $0 $0 $0 $0 $0 $0 $0 $0 $0 $0 $0 $0

Administration & Other Departments $0 $0 $0 $0 $0 $0 $0 $0 $0 $0 $0 $0

Debt Interest $0 $0 $0 $0 $0 $0 $0 $0 $0 $0 $0 $0

Other Expenditures $0 $0 $0 $0 $0 $0 $0 $0 $0 $0 $0 $0

Total Expenditures $0 $0 $0 $0 $0 $0 $0 $0 $0 $0 $0 $0

State Incentives $12,904 $14,319 $12,767 $13,014 $10,926 $11,070 $10,375 $11,541 $10,817 $10,405 $11,132 $9,138

Net State General Revenues $25,808 $28,639 $25,534 $26,027 $21,851 $22,139 $20,750 $23,082 $21,634 $20,810 $22,263 $18,276

8/7/2019 Economic Impact Analysis: Route 54 Expressway

http://slidepdf.com/reader/full/economic-impact-analysis-route-54-expressway 7/13

Hwy54EIADec07.xls Page 7 of 12

Route 54 Expressway

  ANNUAL FISCAL IMPACTS (2007$) 2004 2005 2006 2007 2008 2009 2010 2011 2012 2013 2014 2015

State General Revenues

Individual Income Tax $7,233 $30,298 $32,177 $113,480 $208,270 $563,602 $458,132 $257,051 $215,561 $241,338 $265,164 $288,271

Corporate Income Tax $0 $0 $0 $32,657 $50,229 $78,185 $59,788 $25,194 $30,830 $42,496 $52,807 $62,029

Direct Sales Tax $0 $0 $0 $0 $0 $0 $0 $0 $0 $0 $0 $0Indirect Sales & Use Tax $6,817 $28,553 $30,324 $31,355 $59,416 $172,114 $138,779 $80,077 $103,310 $117,217 $129,489 $142,460

Other Tax $0 $0 $0 $4,815 $8,356 $22,871 $18,896 $11,091 $11,543 $12,673 $13,731 $14,788

Other Charges & Revenues $0 $0 $0 $3,185 $5,226 $14,306 $11,820 $6,939 $7,218 $7,922 $8,584 $9,248

Other Revenues $0 $0 $0 $0 $0 $0 $0 $0 $0 $0 $0 $0

Total Revenues $14,050 $58,852 $62,501 $185,493 $331,497 $851,077 $687,415 $380,352 $368,462 $421,646 $469,774 $516,796

State General Expenditures

Higher Education $0 $0 $0 ($1,104) ($3,381) ($10,057) ($14,645) ($16,575) ($18,054) ($20,005) ($22,296) ($24,812)

Elementary & Secondary Education $0 $0 $0 ($3,425) ($10,393) ($30,932) ($45,043) ($50,979) ($55,508) ($61,536) ($68,550) ($76,294)

Social Services $0 $0 $0 $60,006 $106,908 $280,158 $193,071 $62,707 ($22,460) ($11,851) ($3,536) $1,239

Health & Mental Health $0 $0 $0 ($976) ($2,985) ($8,879) ($12,930) ($14,634) ($15,939) ($17,664) ($19,677) ($21,905)

Transportation $0 $0 $0 ($15) ($45) ($135) ($197) ($223) ($243) ($269) ($300) ($334)

Public Safety & Corrections $0 $0 $0 ($1,020) ($3,122) ($9,287) ($13,525) ($15,312) ($16,668) ($18,475) ($20,580) ($22,912)

Natural Resources & Conservation $0 $0 $0 ($11) ($41) ($123) ($179) ($202) ($220) ($244) ($272) ($303)

Administration & Other Departments $0 $0 $0 ($3,331) ($10,331) ($30,737) ($44,766) ($50,671) ($55,169) ($61,156) ($68,129) ($75,821)

Debt Interest $0 $0 $0 ($103) ($340) ($1,013) ($1,475) ($1,669) ($1,818) ($2,015) ($2,244) ($2,498)

Other Expenditures $0 $0 $0 $0 $0 $0 $0 $0 $0 $0 $0 $0

Total Expenditures $0 $0 $0 $50,020 $76,268 $188,994 $60,312 ($87,558) ($186,078) ($193,216) ($205,584) ($223,639)

State Incentives $14,050 $58,852 $62,501 $235,514 $407,766 $1,040,071 $747,727 $292,794 $182,384 $228,431 $264,191 $293,158

Net State General Revenues $28,100 $117,703 $125,003 $471,027 $815,531 $2,080,143 $1,495,455 $585,588 $364,768 $456,861 $528,381 $586,315

8/7/2019 Economic Impact Analysis: Route 54 Expressway

http://slidepdf.com/reader/full/economic-impact-analysis-route-54-expressway 8/13

8/7/2019 Economic Impact Analysis: Route 54 Expressway

http://slidepdf.com/reader/full/economic-impact-analysis-route-54-expressway 9/13

8/7/2019 Economic Impact Analysis: Route 54 Expressway

http://slidepdf.com/reader/full/economic-impact-analysis-route-54-expressway 10/13

8/7/2019 Economic Impact Analysis: Route 54 Expressway

http://slidepdf.com/reader/full/economic-impact-analysis-route-54-expressway 11/13

8/7/2019 Economic Impact Analysis: Route 54 Expressway

http://slidepdf.com/reader/full/economic-impact-analysis-route-54-expressway 12/13

8/7/2019 Economic Impact Analysis: Route 54 Expressway

http://slidepdf.com/reader/full/economic-impact-analysis-route-54-expressway 13/13


Recommended