Page 1
i
ECONOMIC IMPACT AND RISK FACTORS ASSOCIATED WITH LUMPY
SKIN DISEASE OUTBREAKS IN CATTLE FARMS IN NAKURU COUNTY,
KENYA
A thesis submitted in partial fulfilment of requirements for Masters degree of
University of Nairobi (Veterinary Epidemiology and Economics)
Samuel Kipruto Kiplagat, BVM
Department of Public Health, Pharmacology and Toxicology
2019
Page 2
ii
DECLARATION
This thesis is my original work and has not been presented for a degree in any other
University.
Signature: ___________________ Date: __________________
Name: Kiplagat Samuel Kipruto – J56/87908/2016
This thesis has been submitted for examination with our approval as
University supervisors:
1. Signature:___________________ Date: __________________
PROF. KITALA PHILIP M (BVM, M.Sc., PhD)
Department of Public Health, Pharmacology and Toxicology
University of Nairobi
2. Signature:___________________ Date: __________________
DR. ONONO JOSHUA ORUNGO (BVM, M.Sc., MBA., PhD)
Department of Public Health, Pharmacology and Toxicology
University of Nairobi
3. Signature:___________________ Date: __________________
DR. NICK LYONS (MA, VetMB, MSc, PhD, Dip ECBHM,
MRCVS)
The Pirbright Institute, United Kingdom.
Page 3
iii
DEDICATION
I dedicate this work to my parents for their tireless effort to raise me up and see that I
achieve my education goals.
Page 4
iv
ACKNOWLEDGEMENTS
I thank sincerely my supervisors Prof. P.M. Kitala and Drs J.O. Onono and N.A. Lyons for
their tireless effort from the development of the research proposal, fieldwork and writing
up of the thesis. Special thanks to Dr. N.A. Lyons for making the fieldwork possible.
I acknowledge the monetary support from Global Challenges Research Fund (GCRF) from
Biotechnology and Biological Sciences Research Council (BBSRC) through the Pirbright
Institute, United Kingdom.
My gratitude goes to the University of Nairobi administration for admitting me to this
course and the CAVs library staff for the assistance accorded to me especially in finding
online study resources and plagiarism checks. I cannot forget to thank the farmers of
Nakuru County who spared their time to respond to the questionnaires. I also remember in
a special way my field assistants, namely, S.K. Kosgei, A.K. Rotich, S.K. Kirwa, K.M
Njehia and J.K Kuria together with the Subcounty Veterinary Officers of Nakuru County.
My sincere gratitude goes to my classmates in the MVEE course for providing the
necessary support and companionship.
I thank the Almighty God for good health and enabling me to finish this study.
Page 5
v
TABLE OF CONTENTS
Title……………………………...…………………………………………………………i
Declaration .......................................................................................................................... ii
Dedication .......................................................................................................................... iii
Acknowledgements ............................................................................................................ iv
Table of Contents ................................................................................................................ v
List of Tables ................................................................................................................... viii
List of Figures .................................................................................................................... ix
List of Appendices .............................................................................................................. x
Abreviations and Acronyms ............................................................................................... xi
Abstract ............................................................................................................................ xiii
Chapter One: Introduction .................................................................................................. 1
1.1 Background to the Study ........................................................................................... 1
1.2 Objectives of study .................................................................................................... 3
1.2.1 Broad objective ............................................................................................. 3
1.2.2 Specific Objectives ............................................................................................. 3
Chapter Two: Literature Review ......................................................................................... 5
2.1 Epidemiology of Lumpy Skin Disease ...................................................................... 5
2.1.1 Aetiology of Lumpy Skin Disease ......................................................................... 5
2.1.2 Animal species affected by Lumpy Skin Disease .................................................. 5
2.1.3 Occurrence and distribution ................................................................................... 5
Page 6
vi
2.1.4 Clinical signs of Lumpy Skin Disease ................................................................... 6
2.1.5 Transmission and pathogenesis of Lumpy Skin Disease ....................................... 6
2.2 Diagnosis of Lumpy Skin Disease ............................................................................ 8
2.3 Prevention and control of Lumpy Skin Disease ........................................................ 8
2.4 Risk factors of Lumpy Skin Disease ....................................................................... 12
2.5 Economics of lumpy skin disease control and prevention ...................................... 15
2.6 Case-control study design ....................................................................................... 22
Chapter Three: Materials and Methods ............................................................................. 24
3.1 Study Area ............................................................................................................... 24
3.2 Study design and sample size determination ........................................................... 26
3.3 Case and control definitions .................................................................................... 27
3.4 Data Collection ........................................................................................................ 27
3.5 Data management and analysis ............................................................................... 29
Chapter Four: Results ........................................................................................................ 34
4.1 Characteristics of the households ............................................................................ 34
4.2 Cattle management .................................................................................................. 34
4.3 Cattle productivity ................................................................................................... 36
4.4 Distribution of potential risk factors of LSD outbreaks in case and control herds . 36
4.4.1 Univariable analysis .......................................................................................... 37
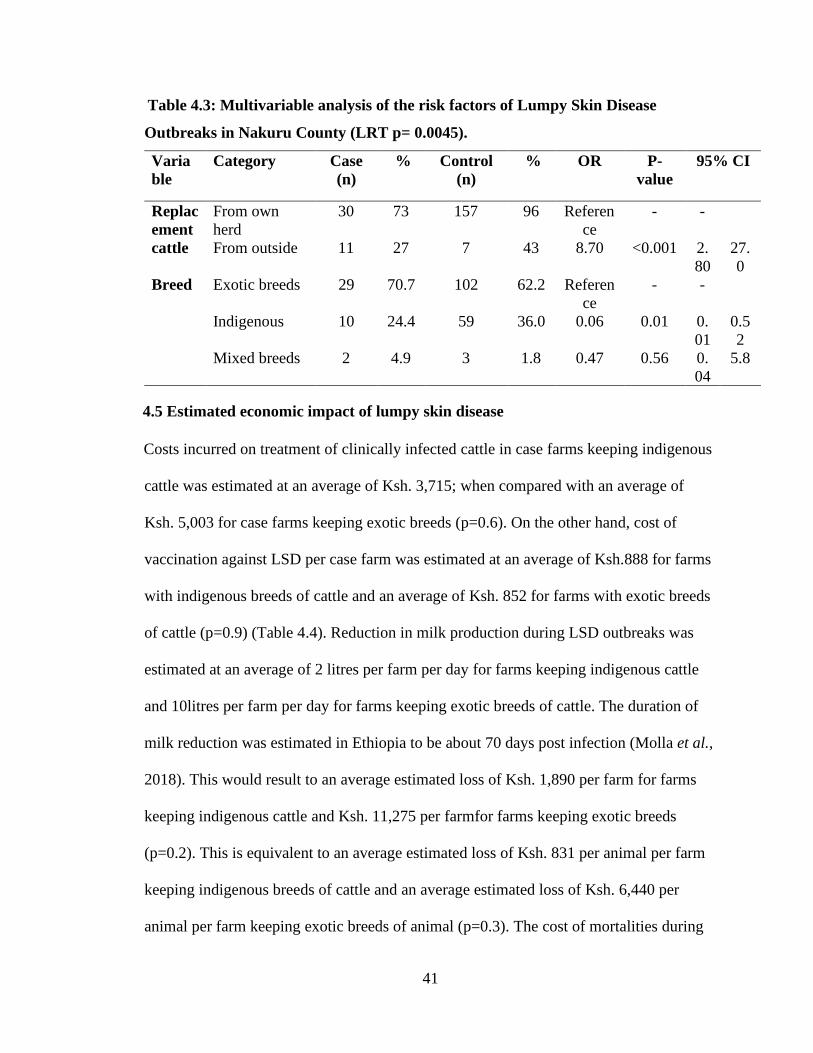
4.4.2 Multivariable analysis ....................................................................................... 40
4.4.3 Risk factors as thought by farmers ................................................................... 40
4.5 Estimated economic impact of lumpy skin disease ................................................. 41
Chapter Five: Discussion .................................................................................................. 45
Page 7
vii
References ......................................................................................................................... 53
Appendices ........................................................................................................................ 72
Page 8
viii
LIST OF TABLES
Table 4.1: Management practices on 41 case and 164 control farms in Nakuru County,
2017................................................................................................................................... 35
Table 4.2: Univariablee analysis of the risk factors of Lumpy Skin Disease Outbreaks in
Nakuru County. ................................................................................................................. 38
Table 4.4: Multivariable analysis of the risk factors of Lumpy Skin Disease Outbreaks in
Nakuru County (LRT p= 0.0045). .................................................................................... 41
Table 4.5: Economic Impact Lumpy Skin Disease in Nakuru County, 2017. .................. 42
Page 9
ix
LIST OF FIGURES
Figure 3.1 Map of Kenya showing the location of Nakuru County and the nine sub-
counties. ............................................................................................................................ 25
Figure 3.2: The Impact of Livestock Disease (Rushton et al., 1999) ............................... 30
Figure 4.1 Economic impact of Lumpy Skin Disease outbreaks in case farms in Nakuru
County, 2017. .................................................................................................................... 44
Page 10
x
LIST OF APPENDICES
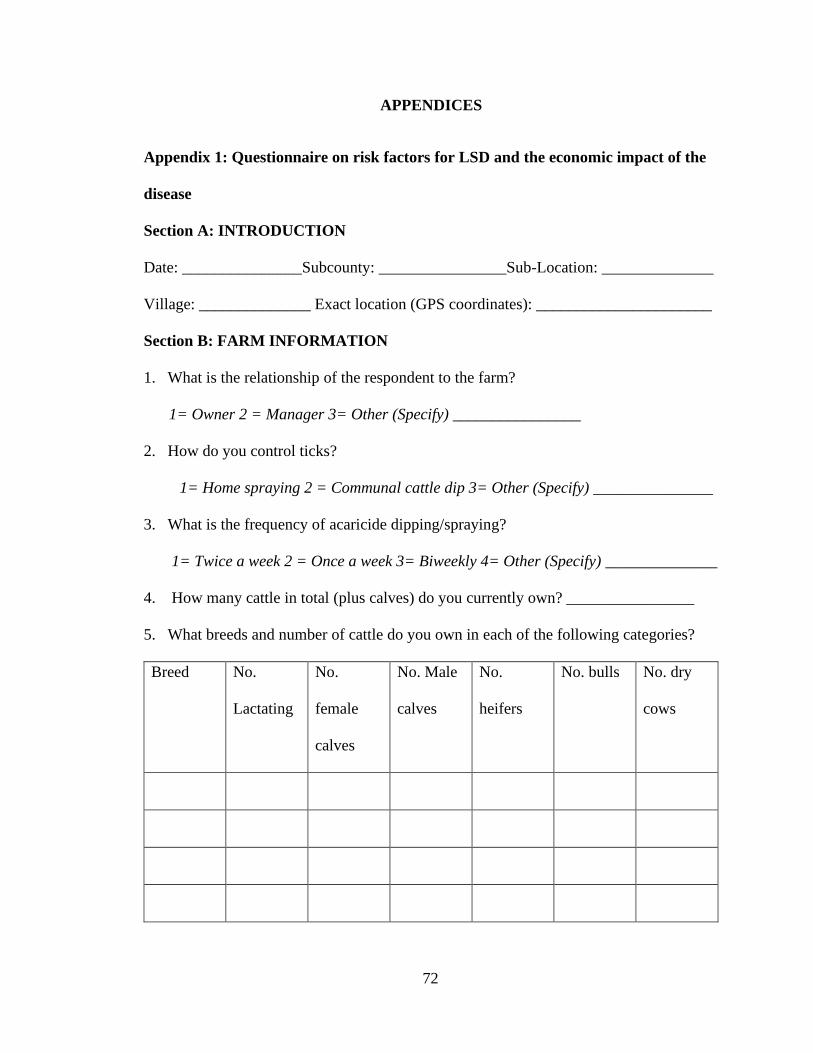
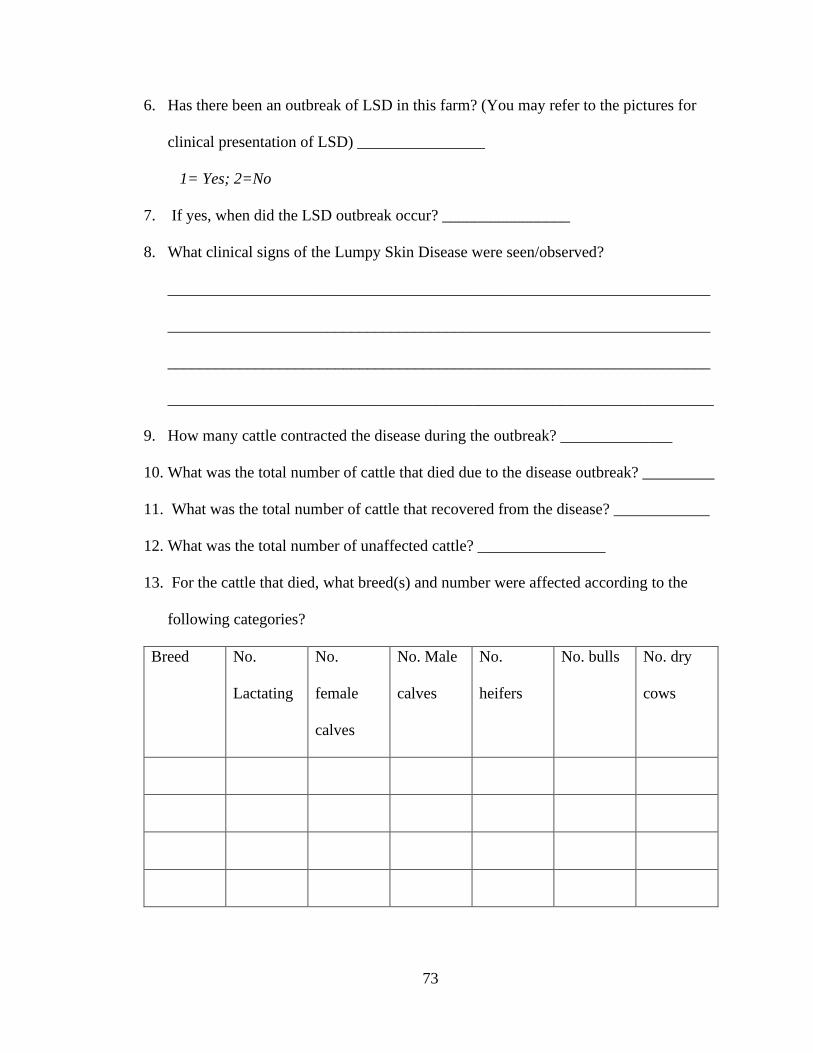
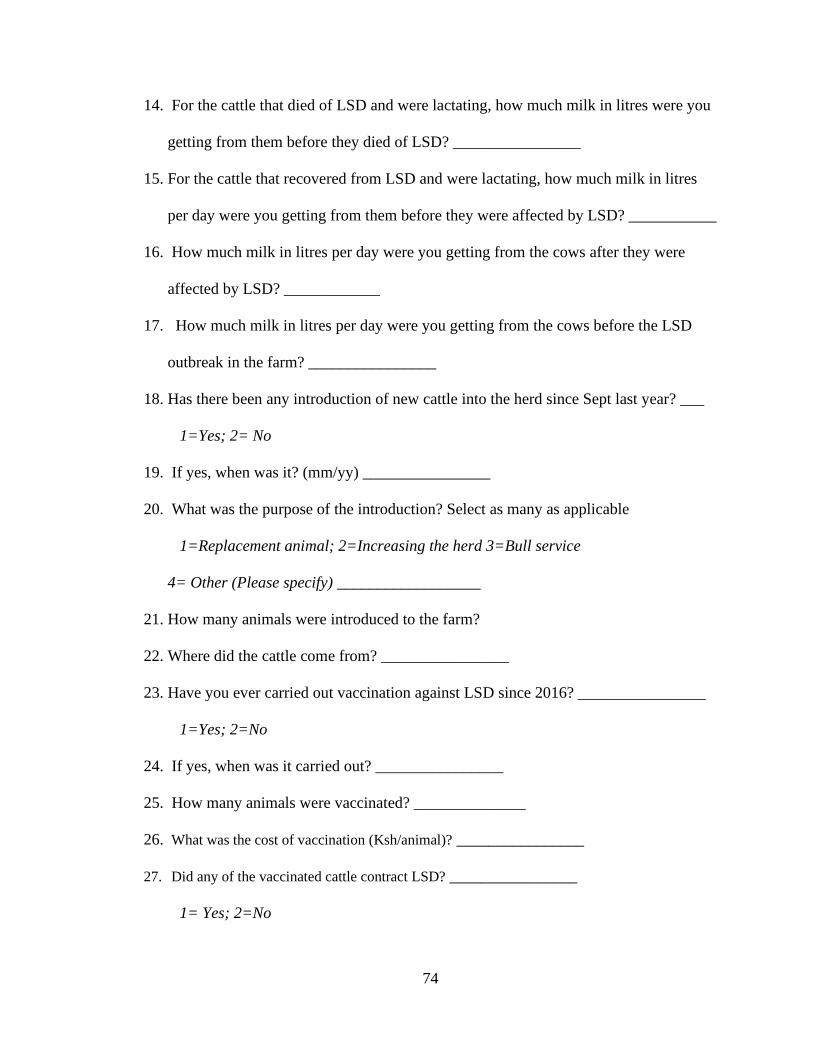
Appendix 1: Questionnaire on risk factors for LSD and the economic impact of the
disease ............................................................................................................................... 72
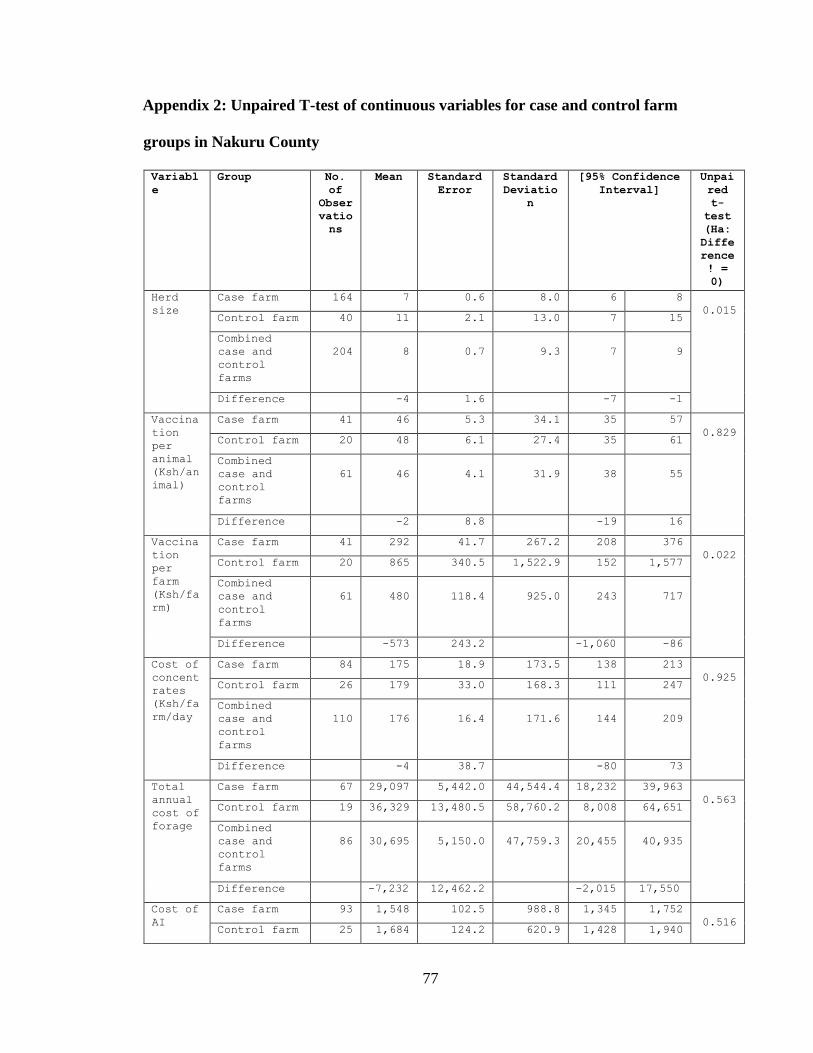
Appendix 2: Unpaired T-test of continuous variables for case and control farm groups in
Nakuru County .................................................................................................................. 77
Appendix 3: Unpaired T-test of continuous variables for indigenous and exotic breed
groups of cattle in case farms only in Nakuru County...................................................... 78
Appendix 4: Unpaired T-test of continuous variables for indigenous and exotic breed
groups of cattle in case and control farms in Nakuru County ........................................... 80
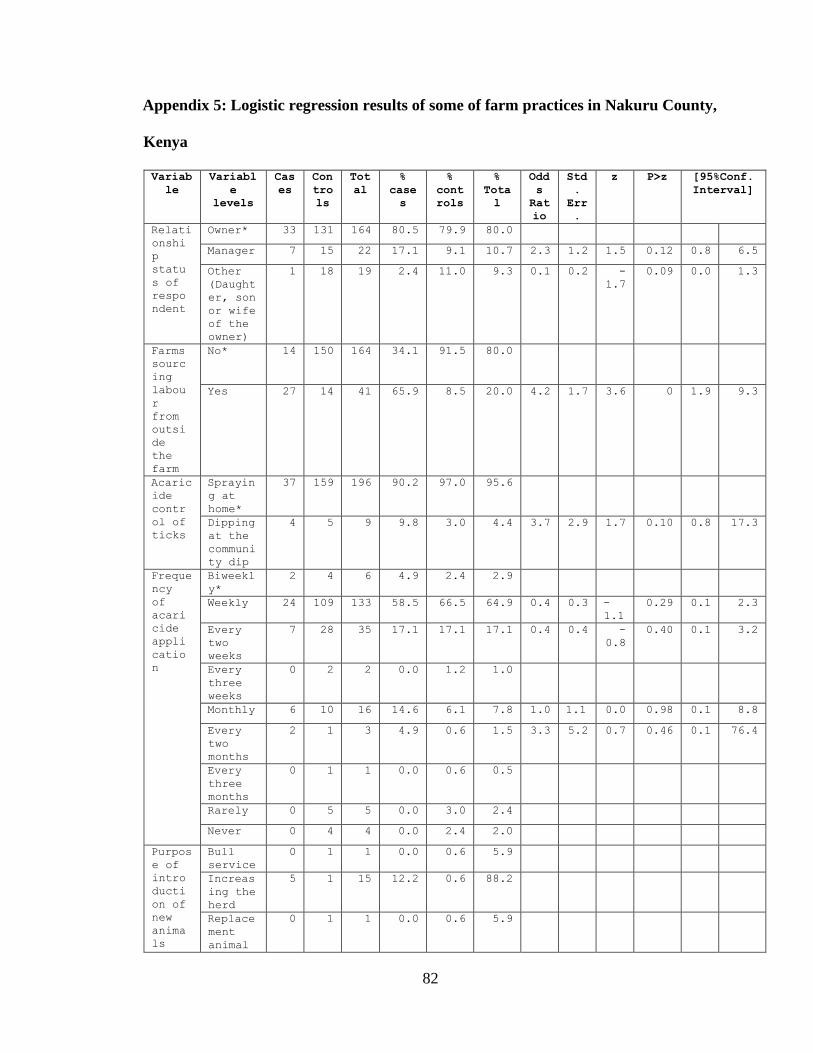
Appendix 5: Logistic regression results of some of farm practices in Nakuru County,
Kenya ................................................................................................................................ 82
Appendix 6: What farmers think are the factors that cause LSD outbreak in the area ..... 83
Appendix 7: Herd structure and sizes in case and control farms in Nakuru County at
individual animal level ...................................................................................................... 84
Appendix 8: T test results for mean differences for continuous variables associated with
cattle management in Nakuru County............................................................................... 84
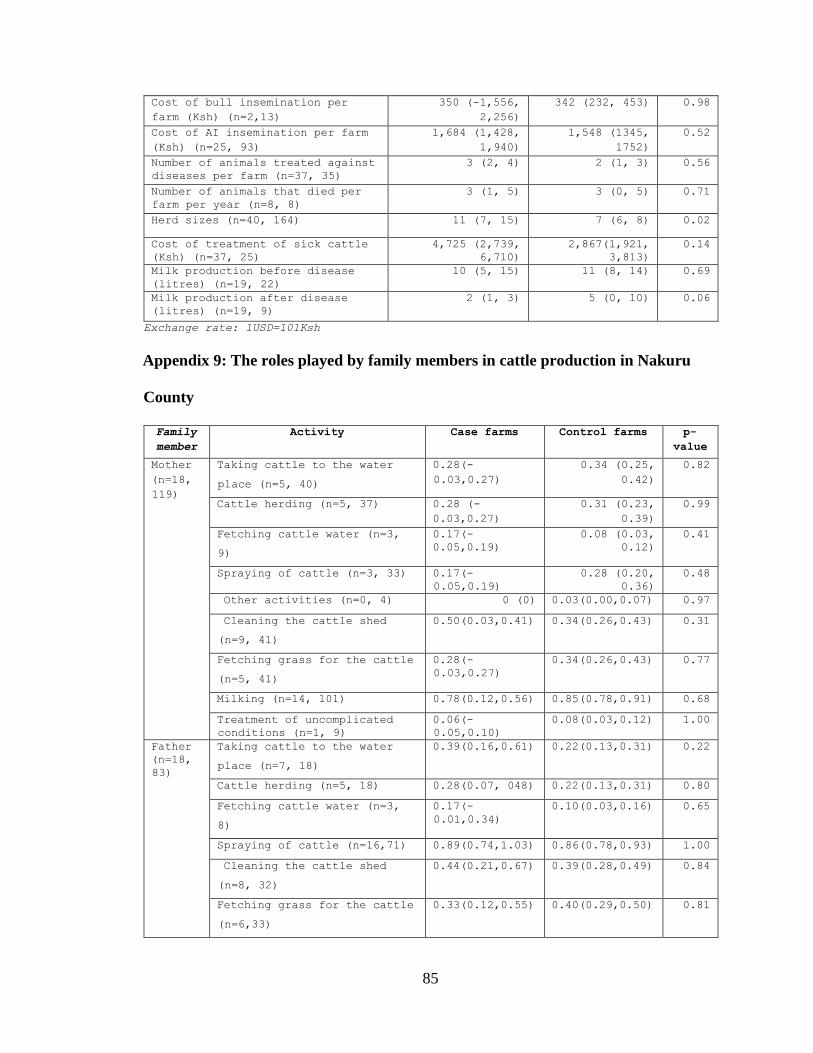
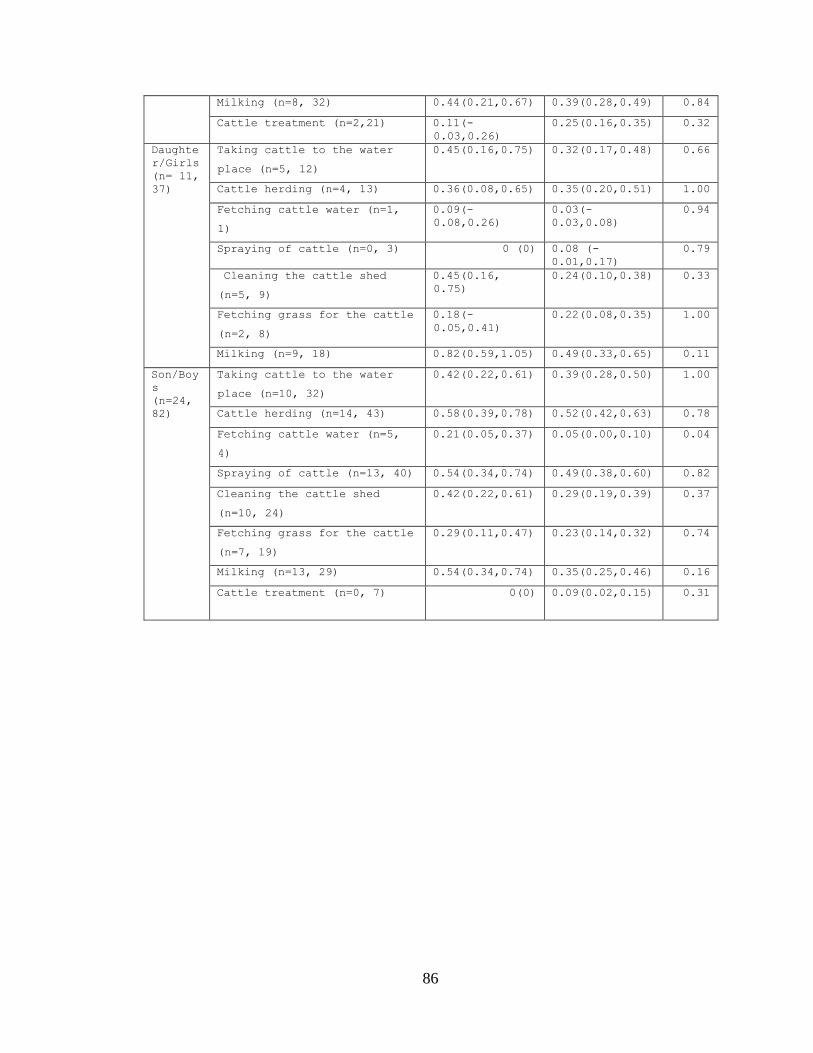
Appendix 9: The roles played by family members in cattle production in Nakuru
County ............................................................................................................................... 85
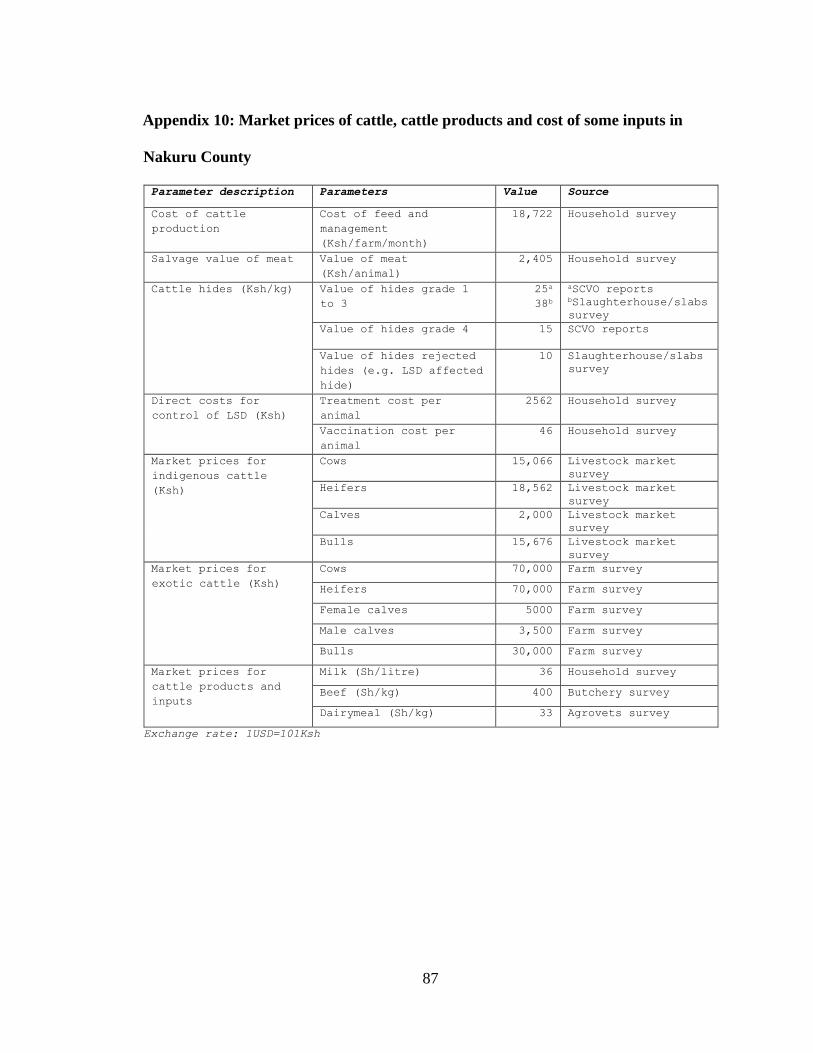
Appendix 10: Market prices of cattle, cattle products and cost of some inputs in Nakuru
County ............................................................................................................................... 87
Page 11
xi
ABREVIATIONS AND ACRONYMS
BVM Bachelor of Veterinary Medicine
GCRF Global Challenges Research Fund
BBSRC Biotechnology and Biological Sciences Research Council
FAO Food and Agriculture organization of the United Nations
GDP Gross Domestic Product
GoK Government of Kenya
KNBS Kenya National Bureau of Statistics
AgDP Agricultural Gross Domestic Product
IGAD Intergovernmental Authority on Development
LPI Land Policy Initiative
LSD Lumpy Skin Disease
AU-IBAR African Union Inter-African Bureau for Animal Resources
EFSA European Food Safety Authority
IFAT Immunofluorescence Antibody Test
OIE World Organization for Animal Health
CFSPH Centre for Food Security and Public Health
LSDV Lumpy Skin Disease Virus
pH potential of Hydrogen
ELISA Enzyme-linked Immunosorbent Assay
VNT Virus Neutralization Test
ID Vet Innovative Diagnostic Veterinary Services
PCR Polymerase Chain Reaction
Page 12
xii
DNA Deoxyribonucleic Acid
SPV Sheep Pox Virus
KSGP Kenyan Sheep and Goat Pox
RVF Rift Valley Fever
BEFV Bovine Ephemeral Fever Virus
MSD Merck Sharp and Dohme pharmaceuticals
KEVEVAPI Kenya Veterinary Vaccines Production Institute
GPV Goat Pox Virus
CODA-CERVA Veterinary and Agrochemical Research Centre
GMP Good Manufacturing Practices
DIVA Differentiating Infected from Vaccinated Animals
SPPV Sheep pox Vaccine
GALVmed Global Alliance for Livestock Veterinary Medicines
SCVO Subcounty Veterinary Officer
STATA Data Analysis and Statistical Software
AI Artificial Insemination
Ksh. Kenya Shillings
USD United States of America Dollars
CI Confidence Interval
EMA European Medicines Agency
Page 13
xiii
ABSTRACT
Lumpy Skin Disease (LSD) is spreading rapidly to previously disease-free areas causing
enormous economic losses. The factors that favour its spread are not extensively studied
in the tropics. This study was carried out in Nakuru County, Kenya with the aim of
identifying the risk factors of LSD outbreaks and estimating the economic impact of the
disease. A retrospective case control study was carried out on 205 farms in order to
compare the frequency of risk factors in the case and control farms. A frequency of factor
that is greater in cases than in controls is judged as a risk factor. Forty-one and 164 case
and control herds were assembled. Data from both case and control herds were collected
via questionnaires administered through personal interviews. Data collected included herd
sizes, age and sex structures, breeds, source of replacement stock, grazing system and costs
(direct and indirect) incurred when LSD outbreaks occurred. The data were analysed using
STATA 13® and R 3.3.3 for association tests. A mixed model was used with fixed effects
on village and the rest of the variables as random. A univariable and multivariable logistic
regression analysis of disease outcome and the risk factors was done and model built by
backward fitting using likelihood ratio tests. The economic impact was estimated using the
framework and methods suggested by Rushton in 1999 and used by Jemberu et al. in 2014
and Molla et al. in 2017 in the estimation of economic impact of Foot and Mouth Disease
and LSD respectively in Ethiopia. The factors that were significantly associated with LSD
outbreaks on univariable analysis included breed, source of replacement stock and herd
size. Farms which replaced their herds with cattle from outside the farm were 8.4 times
more likely to experience LSD outbreaks compared to farms that replaced from their own
herds (p=0.000), exotic breeds were 14.3 times more likely to experience LSD outbreaks
Page 14
xiv
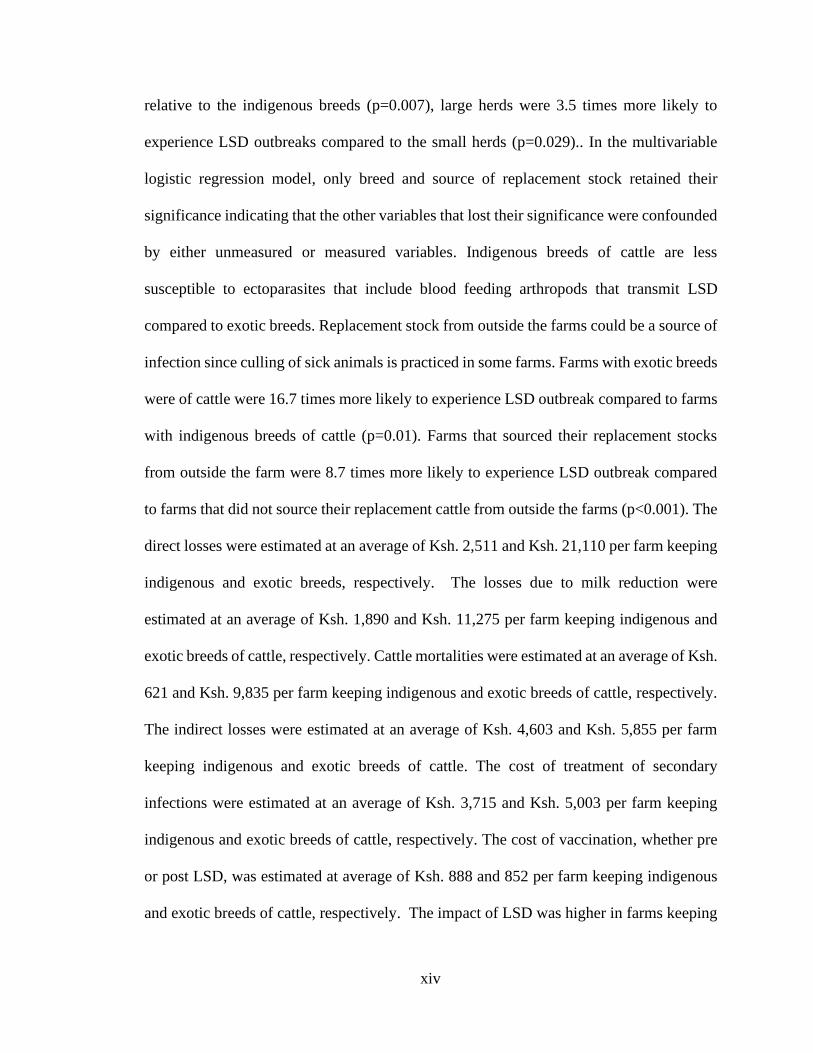
relative to the indigenous breeds (p=0.007), large herds were 3.5 times more likely to
experience LSD outbreaks compared to the small herds (p=0.029).. In the multivariable
logistic regression model, only breed and source of replacement stock retained their
significance indicating that the other variables that lost their significance were confounded
by either unmeasured or measured variables. Indigenous breeds of cattle are less
susceptible to ectoparasites that include blood feeding arthropods that transmit LSD
compared to exotic breeds. Replacement stock from outside the farms could be a source of
infection since culling of sick animals is practiced in some farms. Farms with exotic breeds
were of cattle were 16.7 times more likely to experience LSD outbreak compared to farms
with indigenous breeds of cattle (p=0.01). Farms that sourced their replacement stocks
from outside the farm were 8.7 times more likely to experience LSD outbreak compared
to farms that did not source their replacement cattle from outside the farms (p<0.001). The
direct losses were estimated at an average of Ksh. 2,511 and Ksh. 21,110 per farm keeping
indigenous and exotic breeds, respectively. The losses due to milk reduction were
estimated at an average of Ksh. 1,890 and Ksh. 11,275 per farm keeping indigenous and
exotic breeds of cattle, respectively. Cattle mortalities were estimated at an average of Ksh.
621 and Ksh. 9,835 per farm keeping indigenous and exotic breeds of cattle, respectively.
The indirect losses were estimated at an average of Ksh. 4,603 and Ksh. 5,855 per farm
keeping indigenous and exotic breeds of cattle. The cost of treatment of secondary
infections were estimated at an average of Ksh. 3,715 and Ksh. 5,003 per farm keeping
indigenous and exotic breeds of cattle, respectively. The cost of vaccination, whether pre
or post LSD, was estimated at average of Ksh. 888 and 852 per farm keeping indigenous
and exotic breeds of cattle, respectively. The impact of LSD was higher in farms keeping
Page 15
xv
exotic breeds than indigenous breeds of cattle. Within the farms keeping exotic breeds,
direct losses from LSD had a higher impact with the milk loss being the greatest, followed
by mortalities. In the farms with indigenous breeds of cattle, indirect losses had a higher
impact with treatment being the greatest source of losses. Based on these estimates, the
total losses of LSD for farms keeping indigenous cattle was estimated at Ksh 7,114 and
Ksh 26,965 for farms keeping exotic breeds of cattle. Yet, if these farms implemented
vaccination as a control strategy against LSD, they would save approximately, Ksh 6,226
and 26,113 for farms keeping indigenous and exotic cattle breeds, respectively. These
levels of resources can be reallocated to other management functions within cattle farms.
It is recommended that the efficacy of LSD vaccine currently used in Kenya be re-
evaluated, farmers are trained on LSD control measures such as vaccination, introduction
of cattle examined and certified by the veterinary authorities to be free of notifiable
diseases such as LSD and cattle gaining entry into the county for market or pasture and
water be vaccinated prior to accessing the county. In conclusion, LSD occurs in Nakuru
County and is one of the major causes of morbidity and mortality. Control measures of the
disease needs to be refined, especially use of vaccines.
Page 16
1
CHAPTER ONE: INTRODUCTION
1.1 Background to the Study
Studies on the epidemiology of infectious diseases such as Lumpy Skin Disease (LSD)
include evaluation of risk factors leading to infection by an organism, factors that affect
transmission of the organism between susceptible and infectious hosts and factors
associated with clinically recognizable disease among infected hosts (Nelson and
Williams, 2013). Diseases can be characterized epidemiologically by prevalence,
incidence, transmission route and proportions of susceptible populations. This
characterization is important for development of a control program that targets specific
diseases in populations (Nelson and Williams, 2013). The methods used in quantification
of occurrence of diseases in populations include prevalence, and incidence rates
(Kruijshaar et al., 2002; Nelson and Williams, 2013) and different mortality
measures (Kruijshaar et al., 2002).
Lumpy skin disease (LSD) is a generalized skin disease, which is caused by a poxvirus in
the family Poxviridae and the genus capripoxvirus (Ahmed and Zaher, 2008; Gari et al.,
2011). The disease typically shows skin nodules of 2 to 5 cm in diameter, lymphadenopathy
and fever (Magori-Cohen et al., 2012). The primary hosts of Lumpy Skin Disease are
mostly cattle and occasionally in the buffalo (Sharawi and Abd El-Rahim, 2011; El-
Tholoth and El-Kenawy, 2016).
The disease is transmitted majorly mechanically by biting and blood feeding arthropods
(OIE, 2010; Tuppurainen and Oura, 2012). Therefore, control by quarantine and movement
control is not very effective (Coetzer, 2004). The disease outbreak is seasonal depending
on abundance of suitable vectors. Mechanical transmission of the virus may be reduced by
Page 17
2
efficient vector control, but this may be impractical or very costly. Largescale use of
insecticides is also not recommended due to environmental pollution. Acts that limit the
breeding sites of vectors such as stagnant water, manure and sludge is recommended
(Tuppurainen and Golan, 2016). The first case should be detected early enough, followed
by a quick and extensive vaccination campaign for a successful control and eradication of
LSD (OIE, 2017).
The morbidity of LSD is variable within and between herds. It has been argued that it
depends on the status of immunity of the host (host susceptibility) and how abundant the
mechanical arthropod vectors are in an environment. The estimated morbidity in a herd
normally ranges from 5% to 45%, with a mortality of between 1 to 10%, with higher
mortality attributed to secondary infections (OIE, 2010; 2013). Furthermore, a mortality as
high as 75 - 85% have been reported (CFSPH, 2011). A localised outbreak of the disease
occurred in Kenya in 1957 within the Rift Valley province, around Lake Nakuru (Burdin,
1959; MacOwan, 1959; Davies, 1982). Kenya Sheep and Goat pox Virus (SGPV) was
found to have infected the sheep in the farm of first LSD outbreak occurrence. It is believed
that this first LSD occurrence was from Kenya SGPV that had a changed host adaptation
for cattle. This is because the DNA of the viruses were found to be alike on restriction
endonuclease analysis (Davies, 1991). After the first outbreak in 1957, LSD epidemics
have occurred irregularly in various parts of Kenya (AU-IBAR, 2013) with low level of
reporting. Some media houses have reported suspected LSD cases in Nakuru (Standard
Group PLC, 2015), Kiambu (Hivisasa, 2015), Muranga (Standard PLC, 2018), Baringo
(Standard Group PLC, 2019a&b), Bungoma (Knowledge Bylanes Kenya, 2017) and Uasin
Gishu (Hivisasa, 2018) counties. Coakley and Capstick (1961) developed a vaccine from
Page 18
3
Kedong strain of LSDV and its use in vaccination is thought to have prevented a possible
spread of the disease epidemic in 1968. Owing to how the disease behaved in Kenya, it
was hypothesized that the virus was particular to high altitude and indigenous trees covered
areas, like the Mau Forest (Davies, 1982). The isolated strains of LSD virus from the first
outbreak in 1957 and subsequent years have been found to be serologically the same.
Additionally, the South African Neethling and the West African strains are also related.
Therefore, they can only be differentiated by use of indirect Fluorescent Antibody Test
(FAT) (Davies, 1982).
During the first LSD outbreak of 1957, the morbidity of the disease in Nakuru was 1-2%
(Ayres-Smith, 1960). Consequently, the epidemic spread of LSD within Kenya is thought
to have caused a considerable economic loss to the farming community and the general
economy (MacOwan, 1959) but this loss was not quantified. Although sporadic outbreaks
of LSD have continued to occur within the cattle farming systems in Kenya, no studies
have to date been conducted to determine the predictors of the disease outbreaks in cattle
herds and its subsequent economic cost.
1.2 Objectives of study
1.2.1 Broad objective
To determine the risk factors and economic implications of lumpy skin disease outbreak
in cattle production systems in Nakuru County, Kenya.
1.2.2 Specific Objectives
i. To determine the farm-level risk factors of Lumpy skin disease in Nakuru
County.
Page 19
4
ii.To estimate economic impact of Lumpy Skin Disease outbreak in affected cattle
herds in cattle farms.
Page 20
5
CHAPTER TWO: LITERATURE REVIEW
2.1 Epidemiology of Lumpy Skin Disease
2.1.1 Aetiology of Lumpy Skin Disease
Lumpy skin disease (LSD) is a generalized viral skin disease. It is caused by a poxvirus
in the family Poxviridae and the genus capripoxvirus (Ahmed and Zaher, 2008; Gari et
al., 2011).
2.1.2 Animal species affected by Lumpy Skin Disease
The primary hosts of Lumpy Skin Disease are cattle mostly and the buffalo occasionally
(Sharawi and Abd El-Rahim, 2011; El-Tholoth and El-Kenawy, 2016).
2.1.3 Occurrence and distribution
The first description of the disease was in Zambia in 1929. In Kenya, it was described in
1957 (MacOwan, 1959). Lumpy Skin Disease was reported in a sheep and cattle mixed
farm in Nakuru. The disease is thought to have been introduced by indigenous sheep that
was infected with sheep pox virus. The lambs in the farm started showing clinical signs
of sheep pox. The calves followed showing a similar condition (Burdin, 1959; African
Union Inter-African Bureau for Animal Resources, AU-IBAR, 2013). The calves are
thought to have been cross-infected by the virus from the sheep and goats (AU-IBAR,
2013).
Lumpy Skin Disease is a transboundary disease that occurred commonly in most African
countries and sporadically in the Middle East. However, since 2012, the disease has been
observed to be spreading from the Middle East into Europe (Food and Agriculture
Organization of the United Nations, FAO, 2015; European Food Safety Authority, EFSA,
2017).
Page 21
6
2.1.4 Clinical signs of Lumpy Skin Disease
The LSDV causes a systemic disease that can be acute or sub-acute. The typical
symptoms can be mild to severe and include fever, dermal and mucosal nodules
(Tuppurainen, 2005; Centre for Food Security and Public Health, CFSPH, 2008).
Nodules are also found in the internal organs, lymphadenitis, oedema and occasionally
death (Tuppurainen, 2005) are reported. Raised, circular, firm, coalescing nodules on the
skin are common and cores of necrotic material called “sit-fasts”.
The nodules vary in size from 1 cm to 7 cm in diameter mostly found on the genitalia,
perineum, udder, legs, neck, and head. Sometimes the extension into the musculature
underneath forms a nidus for fly infestations and secondary bacterial infections (CFSPH,
2008; CFSPH, 2011; Tuppurainen and Oura, 2012). The nodules involve the musculature
are frequently painful (OIE, 2010). Regional lymph nodes become up to ten times
enlarged, oedematous, congested and have pyaemic foci and cellulitis (Salib and Osman,
2011). High mortalities are usually associated with secondary bacterial infections on the
skin and pneumonia (OIE, 2013).
Extensive generalization in animals may cause lameness and subsequent reluctance to
move. Prolonged fever may cause abortion (Ocaido et al., 2008).
2.1.5 Transmission and pathogenesis of Lumpy Skin Disease
Biting and blood feeding arthropods are thought to primarily transmit LSDV
mechanically (OIE, 2010; Tuppurainen and Oura, 2012). It is thought so because of the
disease outbreaks are seasonal, mostly occurring in warm and rainy conditions that
coincide with arthropod high densities (Sprygin et al., 2019). Hard ticks (B. decoloratus,
R. appendiculatus and A. hebraeum) could be involved in the transmission of LSDV
Page 22
7
(Lubinga et al., 2013, 2014; Tuppurainen et al., 2013a, b, 2014a). Tabanidae, Glossina
and Culicoides spp. are implicated to transmit LSD because of their presence in the areas
where there has been continuing active disease (FAO,1991). Stomoxys calcitrans
experimentally has mechanically transmitted capripoxvirus to naive sheep and goats.
(Kitching and Mellor, 1986; Mellor et al., 1987). The fly is thought to transmit LSDV in
cattle through the same mechanism (Baldacchino et al., 2013).
The disease can also be transmitted through direct contact between infected and naive
animals. However, this route has been found to be ineffective for spread of the disease
(Weiss, 1968; Carn and Kitching, 1995; CFSPH, 2008).
The sources of infection include cutaneous lesions and crusts, blood, secretions of the
nose and eyes, saliva, milk and semen (Irons et al., 2005). These nodules are commonly
present on the nasal, lachrymal, buccal, rectal genital and udder mucous membranes
(OIE, 2013). Subclinical infection is common with clinical signs of the disease observed
in about half of the animals infected (Tuppurainen and Oura, 2012). The skin lesions at
an acute stage show changes in the histopathology. These include lymphangitis and
vasculitis followed by thrombosis and infarction. The result is oedema of the skin as well
as necrosis and lymphadenopathy. Initially, serum may exude from the LSD skin
nodules. Then as it ages, it develops a typical zone of necrosis that is inverted, greyish
pink and conical. The adjoining tissue present with oedema, haemorrhages and
congestion. The necrotic cores separate from the adjoining skin to form what is known as
‘sit-fasts’. The necrotic cores lead to secondary bacterial infection. During LSD
infection, several virus-encoded factors are produced. The factors are responsible for
influencing the pathogenesis (Tuppurainen and Oura, 2012).
Page 23
8
2.2 Diagnosis of Lumpy Skin Disease
The recently commercially available diagnostic test kits for LSDV is double antigen
ELISA from Innovative Diagnostics®. It has improved sensitivity (>99.7%) compared to
Virus Neutralization Test (VNT) (Innovative Diagnostics Vet, 2017). The characteristic
clinical signs and differential diagnosis of LSD can also be used to form the tentative
diagnosis. Clinical diagnosis can be confirmed in the laboratory using conventional PCR
tests (Tuppurainen, 2005; CFSPH, 2008; OIE, 2011; OIE, 2013; OIE, 2017) and virus
isolation (OIE, 2017).
2.3 Prevention and control of Lumpy Skin Disease
The LSDV has a potential to spread rapidly and causes significant economic losses.
Therefore, the Office International des Epizooties (OIE) includes LSD in the list of
notifiable diseases of cattle (Bowden et al., 2008). Farms may practice the isolation of
sick animals from the unaffected animals and symptomatic treatment that consist of local
dressing of wounds and application of repellent sprays to avoid fly infestations and
secondary infections (CFSPH, 2008; Tuppurainen and Oura, 2012). Broad spectrum
antibiotics may be administered for infections affecting the skin, lungs and cellulitis
(Davies, 1991).
2.3.1 Sanitary prophylaxis
Sanitary prophylaxes include restrictions of importation of livestock, semen, carcasses,
skins and hides to help prevent the introduction of LSD into disease-free countries
(Thrusfield, 2005) as it has been shown that cutaneous lesions and crusts, blood,
secretions of the nose and eyes, saliva, milk and semen are sources of infection (Irons et
al., 2005).
Page 24
9
Outbreaks may be controlled and eliminated by strict quarantine, restriction of animal
movements, isolation and slaughtering of all affected animals, appropriate carcass
disposal, washing and disinfection of the buildings and control of insects (CFSPH, 2008;
Tuppurainen and Oura, 2012; OIE, 2013). Control and elimination of LSDV is
complicated especially in countries where viability of slaughter of all affected and/or in
contact with affected animals is low. This is because of the presence of asymptomatic
animals shedding the virus (Tuppurainen et al., 2015). These asymptomatic animals can
transmit the virus through arthropod vectors (Tuppurainen et al., 2015). Animals affected
by CaPV do not become carriers. The infection will be cleared eventually (Tuppurainen
et al., 2015). However, LSD virus isolation is possible up to 35 days in cutaneous skin
lesions and crusts and PCR can demonstrate nucleic acid of the virus up to 3 months. The
semen of some infected bulls have demonstrated the DNA of LSDV up to 5 months post-
infection. Additionally, saliva, semen and skin nodules of experimentally infected cattle
have demonstrated LSDV for 11, 22 and 33 days respectively. No virus has been isolated
from urine or faeces (OIE, 2013).
2.3.2 Medical prophylaxis
Vaccination is the only effective medical control measure (OIE, 2013) which should
target the whole affected region with 100% vaccination coverage so as to stop a
continued spread of the virus into areas free of the disease (Tuppurainen and Golan,
2016). Lumpy Skin Disease has been successfully vaccinated against by use of
homologous live attenuated virus vaccine and heterologous live attenuated virus
vaccines. Heterologous vaccines (sheeppox and goatpox vaccines) use in sheep and goat
pox disease free countries is not advised (Tuppurainen and Oura, 2012; OIE, 2013) as the
Page 25
10
level of attenuation essential to safely administer in sheep and goats is lower than that
required for cattle. Therefore, the vaccine can become a potential source of infection for
the naive sheep and goat herds (Coetzer, 2004). Capripoxvirus strains are homologous,
therefore, it has the potential of being used to protect cattle, sheep and goats as a single
vaccine strain (Kitching, 2003). Some non-homologous vaccine viruses do not fully
protect cattle against LSD. These include the Kenyan sheep pox vaccine strain
(Somasundaram, 2011; Ayelet et al., 2013; Tageldin et al., 2014). The Kenyan sheep and
goat pox vaccine virus (KSGP) O-240 which was thought to be Sheep Pox Virus (SPV)
has been found to be LSDV. The attenuation level of this virus may not be sufficient
enough to be safely used in cattle. As such, it causes clinical disease in vaccinated
animals. Other strains such as Kedong and Isiolo goat pox strains that can infect cattle,
sheep and goats has the potential for use against all capripox diseases as a broad-
spectrum vaccine (Tuppurainen et al., 2014b).
Lumpy skin disease also occurs in the same geographical areas with other economically
and public health important diseases such as Rift Valley fever, peste des petits ruminants
and sheep pox and goat pox. Therefore, availability of a single multivalent vaccine that
can offer protection from all these five diseases is imperative. The South African and
Canadian researchers are combining efforts to make this a reality (Boshra et al., 2013).
This is anticipated to greatly reduce the expensive plans of separately carrying out
several vaccinations against these diseases (Boshra et al., 2013). Research on
recombinant Rift Valley fever virus (RVFV) and bovine ephemeral fever virus (BEFV)
with LSDV have been tried. Mice were protected against challenge from virulent RVFV
by the recombinant construct of LSDV-RVFV. Cattle were partially protected against the
Page 26
11
virulent challenge by the LSDV-BEFV recombinant construct. However, specific
immune response, both humoral and cellular was elicited for BEFV (Wallace and
Viljoen, 2005).
Currently, live attenuated vaccines are the ones available for use. They are recommended
for use in endemic countries only, unless otherwise authorized. The two vaccines from
MSD Animal Health and Onderstepoort Biological Products were shown to contain
LSDV in unpublished research (Tuppurainen and Golan, 2016). The Kenyan vaccine that
was believed to be LSDV was found to be Goat Pox Virus (GPV) strain (Omoga, 2018)
while the KSGP O-180 and KSGP O-240 vaccines were found to be LSDV (Tuppurainen
et al., 2014b).
Scientists at CODA-CERVA, Belgium are currently carrying out independent challenge
experiments using all currently used live vaccines and two newly developed inactivated
vaccines used in cattle against LSDV. The aim of these yet to be published studies is to
evaluate the safety and efficacy of all currently used live vaccines and two newly
developed vaccines in the protection of cattle against LSDV (Tuppurainen and Golan,
2016).
The purity of LSDV vaccines is questionable, but can be tested. It may contain
endogenous agents and contaminants. This is because the source of primary cells used in
their manufacture is small ruminants and the source areas are also endemic with diseases
such as bluetongue, foot-and-mouth disease, peste des petits ruminants, Rift Valley fever
and rabies. Therefore, vaccines used to control LSDV need to be produced under
conditions of strict purity testing and Good Manufacturing Process (GMP). Vaccines
Page 27
12
against LSDV with a Differentiating Infected from Vaccinated Animals (DIVA) factor
are not currently available on commercial scale (Tuppurainen and Golan, 2016).
Attenuated LSDV field strains or the South-African LSDV Neethling strains are used to
manufacture live LSDV vaccines in South Africa. The vaccine containing homologous
LSDV is more efficacious than that containing SPV (Ben-Gera et al., 2015). The
vaccines do not totally protect every individual animal. Protection at good levels can be
achieved by covering 80–90% or more of the herd, followed by annual boosters to
maintain protection (Kitching, 2003).
Sheep pox virus and GPV sourced vaccines with demonstrated safety and efficacy
against LSDV can be used in cattle. The Middle East previously used SPV vaccines such
as Yugoslavian RM65 SPPV and Romanian SPP vaccine. The Yugoslavian RM65 SPPV
use in cattle was at a dose that is10 times stronger than that used in sheep. Turkey use
Bakirköy SPPV at a dose three times that of sheep (Tuppurainen and Golan, 2016).
Inactivated and live SPV vaccines have been shown to protect sheep at comparable levels
(Boumart et al., 2016). An independent efficacy study at the CODA-CERVA (with
results yet to be published) on inactivated SPV and LSDV vaccines against LSDV is
being carried out (Tuppurainen and Golan, 2016).
2.4 Risk factors of Lumpy Skin Disease
Several pathogen factors enable the disease to spread. The virus has high stability.
Therefore, it can survive at ambient temperature for long periods, more so in dried scabs.
Its high resistance to inactivation can enable it to survive in necrotic skin nodules,
desiccated crusts, infected tissue culture fluid and in air-dried hides (OIE, 2013).
Page 28
13
The LSDV is susceptible to high temperatures, sunlight and pH extremes. However, the
virus can survive well at low temperatures (OIE, 2013; Tuppurainen and Oura, 2012).
On the other hand, environmental factors that favour the spread of the disease include
the varied agroclimatic zones. In a study by Gari et al. (2010) in Ethiopia, it was found
that the risk for occurrence of LSD is higher in agro-climates on midland and lowland
compared to the agro-climates on the highland. The reason for this phenomenon may be
due the presence of large biting fly populations in the midland and lowland agro-climates
as they experience warm and humid climates favourable for their multiplication (Troyo et
al., 2008; Tuppurainen and Oura, 2012).
Grazing and watering of cattle in communal areas is associated with the occurrence of
LSD (Gari et al., 2010). The risk of virus exposure and mechanical transmission by
Stomoxys spp. and mosquitoes (Aedes aegypti) is enhanced by contact and intermingling
of different herds in post-harvest fields (Chihota et al., 2001; Gari et al., 2010;
Waret-Szkuta et al., 2011). Farms bordering game areas where there is interface between
wildlife and cattle is also a risk factor (Gomo et al., 2017) as it is thought that there are
some wildlife hosts of LSDV (Tuppurainen et al., 2018) such as the African Cape
Buffalo (Maclachlan and Dubovi, 2016). The disease has been reported in water
buffaloes, giraffes and impalas (Carter and Wise, 2006).
The host also has a role to play in the spread of the disease. Cattle of all breeds, age
groups and sex are considered to be at risk of being infected, with severe and serious
complications. Regarding breed susceptibility, LSD Occurrence is higher in Bos taurus
than in Bos indicus (Zelalem et al., 2015a) and the disease is also severe in Bos taurus
compared to Bos indicus since Bos taurus has a thin skin compared to the thick-skinned
Page 29
14
Bos indicus (Coetzer, 2004) and possible decreased susceptibility of Bos indicus to
ectoparasites (Ibelli et al., 2012). The less susceptibility of Bos indicus to LSD which
was first recognised in 1929 may not be due to innate immunity as it takes several years
to develop the innate immunity as seen in N’Dama breeds of West Africa that are
trypanotolerant (Murray et al., 1982). However, calves are less susceptible than adults
according to Zelalem et al. (2015a) but often experience more severe disease than adults
(CFSPH, 2008; OIE, 2010; Tuppurainen and Oura, 2012) due to weak cellular immunity
in calves (Hunter and Wallace, 2001). Introducing new animals into a herd was found by
Birhanu (2012) to be highly associated with LSD occurrence.
Animal movements is also considered to be a risk factor (Woods, 1988; Zelalem et al.,
2015b). This occurs when animals are moved from place to place for vaccination, trade
activity and in search of water and pasture during the dry season (Zelalem et al., 2015b).
Infected cattle moving into areas free of disease also increase the risk of spread of LSD
(Sevik and Dogan, 2016).
Gari et al. (2010) found the risk factors for LSD occurrence as communal grazing,
introduction of new cattle and watering management. However, communal grazing and
watering was found not to be a significant risk factor (Zelalem et al., 2015a). Warm
season is associated with occurrence of Lumpy Skin Disease due to high insect activity
(p = 0.000, OR = 4.224. CI = 1.13-7.57) (Zelalem et al., 2015a). Occurrence of LSD has
been more experienced in the midland agro-climatic zones than highlands due to high
frequency of introduction of new animals (Gari et al., 2012) and warm humid climates
that support large populations of biting flies (Troyo et al., 2008; Gari et al., 2012;
Zelalem et al., 2015a). The disease is more prevalent along water courses during the dry
Page 30
15
weather (Woods, 1988; Coetzer, 2004) and rapidly spread during heavy rains due to
increased vector distribution (Woods, 1988).
Windborne dispersal of vectors is also thought to be a risk factor (Yeruham et al., 1995;
Klausner et al., 2017). The original infection in one of the villages in Israel is thought to
have been transmitted by stable flies (Stomoxys calcitrans) blown by the wind from
origin of the disease at El Arish located in Northern Sinai, or at Ismailiya and the Nile
delta located in Egypt. A cow in the neighbouring village also became infected, and is
thought to have been spread by a veterinarian who was attending to the first LSD cases
(Yeruham et al., 1995). However, stronger winds significantly diminish chances of
vectors passive transfer by wind (Saegerman et al., 2018). The vectors can also be
transferred through vehicles transporting hay and straw (Klausner et al., 2017).
The arthropod vectors are also very active in warm, wet and land covered areas. These
environmental factors pose a risk for LSDV spread (Ali et al., 2012). The complete range
of vectors for transmission of LSDV has not well known (EFSA AHAW Panel, 2015). It
is thought that the type of vectors vary according to the geographical regions that is
influenced by the environment, temperature, humidity and abundance of the vectors
(EFSA AHAW Panel, 2015; Gubbins et al., 2018). The blood feeding arthropod vectors
also have a chewing feeding behaviour where the chewing–regurgitating feeding
mechanism maybe responsible for transmission of viruses (Lovisolo et al., 2003).
2.5 Economics of lumpy skin disease control and prevention
The government of United States classifies Capripox viruses as potential agents for agri-
terrorism (Tuppurainen and Oura, 2012). Therefore, LSD is a priority disease that needs to
be controlled in order to enhance livelihoods of the affected people (GALVmed, 2018).
Page 31
16
Generally, the disease can cause indirect or direct production losses. The direct losses
accrue from reduced yields and alterations in the normal herd structure due to mortalities.
Indirect losses include cost of management and control of LSD, limited access to markets
and limited use of modern technologies (Rushton, 2009). A more detailed approach to
assessment of direct and indirect losses caused by LSD has been developed and used
recently in the Balkan countries by Casal et al. (2018).
Although LSD has low morbidity and mortality rates, it’s economic importance in Africa
is due to prolonged loss of production in dairy and beef cattle, loss of weight in infected
cattle, and loss of traction for farms using cattle as a source of draught power (Tuppurainen
and Oura, 2012; Klement, 2018). Additionally, mastitis and severe orchitis, which may
lead to infertility have been reported (Ocaido and Kakaire, 2008; Gari et al., 2011;
Tuppurainen and Oura, 2012). Other losses include reduced quality of hides, meat, culling
losses and cost of treatment (for secondary bacterial infection) and prevention of the
disease (Yacob et al., 2008; Gari et al., 2011). Great financial losses are experienced at the
national level. This is due to high costs of control and eradication of the disease, limitation
of global trade in livestock and livestock products (Tuppurainen and Oura, 2012).
Mortality loss due to LSD infection is characterised by two factors: incidence and case
fatality rates (Klement, 2018). The incidence rate depends on the abundance of vectors
present, immune status of the host and the types of preventive measures in use against LSD
(Gari et al., 2011). Incidence rate in an affected herd can be as high as 85% if no prevention
actions are taken (Tuppurainen and Oura, 2012). Case fatality rate is very difficult to
estimate accurately because of two reasons. First, in the developed countries, sick animals
are mostly culled. Secondly, the exact cause of natural death is not usually provided in the
Page 32
17
developing countries (Klement, 2018). The case fatality rate reported in Albania was 5.8%
(EFSA AHAW Panel, 2015), 54.8% in Turkey (Sevik and Dogan, 2017) and 9.3 and 21.9%
for Zebu and cross-breeds respectively in Ethiopia due to different breed susceptibilities
(Gari et al., 2011). The mortality due to LSD is usually 1 – 3% in most outbreaks
(Tuppurainen and Oura, 2012). Cattle mortalities due to LSD was estimated to cost USD
756 per animal in a dairy farm in Jos Plateau of Nigeria (Adedeji et al., 2017).
Reduced milk production is one of the losses caused by LSD outbreaks in affected farms
(Klement, 2018). In Turkey, it was reported that milk loss of about 159 litres per lactation
occurred for an affected lactating cow that survived (Sevik and Dogan, 2017). In Ethiopia,
the milk loss was estimated at between 1.5 - 3% (51 - 312 litres) per lactation for affected
lactating cow in Zebu and cross-breed cattle, respectively (Gari et al., 2011). However,
both studies did not detail how milk loss was estimated (Klement, 2018). The reduction in
milk production of 51.5% was also reported in farms in Jordan (Abutarbush et al., 2015).
Furthermore, a recent study in Ethiopia by Molla et al. (2017) showed 74% loss in milk
production within 2.5 months of disease outbreak, while another study also estimated a
milk production loss of 3.26% in Ethiopia (Hailu et al., 2015).
Lumpy skin disease losses in beef cattle are related to the interference of the usual
dynamics of the herd. These include reduced reproductive rates and weight gains in
breeding and finished stocks, respectively (Klement, 2018). A 23.1% decrease in
bodyweight has been reported in Jordan (Abutarbush et al., 2015) and 1.2% beef loss in
Ethiopia by Hailu et al. (2015). A study by Gari et al. (2011) in Ethiopia reported that the
annual offtake rates in beef cattle reduced by 1.2% for zebu cattle and 6.2% for cross-breed
cattle.
Page 33
18
Lumpy skin disease has been found to cause abortions and infertility (Tuppurainen and
Oura, 2012; Sevik and Dogan, 2017). However, it is still not clear how LSD directly causes
the abortions and infertility (Klement, 2018). It could be as a result of virus replication in
essential cells and direct destruction or indirect damages of organ function as a result
of host immune system responding to the presence of viral proteins (Baron et al.,
1996). The disease also causes damage to the hides (Tuppurainen and Oura, 2012).
Occurrence of the disease during the cropping season in areas where animal draught power
is used for farming results in losses of farming days. In Ethiopia, oxen affected by LSD
that survived led to a loss of an average of 16 days of draught power (Gari et al., 2011), a
median loss of 10 days (Molla et al., 2017) and estimated draft power loss of 2.52% (Hailu
et al., 2015).
Economic impact of LSD is not only at the specific farms affected, but extends to impact
the consumers, other members of the society especially the taxpayers, employment and
income in affected communities and international trade (Thrusfield, 2005; Klement,
2018). Quarantine of the farms surrounding the infected farms restrict free movement of
cattle to grazing areas and markets. Although the benefits of quarantine may be more
than the costs, livestock owners in non-infected farms may have to bear some of these
costs. Therefore, any disease control decision should identify and take into account these
costs (Peck and Bruce, 2017).
Other control expenditures include vaccination, drugs, personnel and stamping out. These
control costs are incurred either by the owners of infected cattle or the government
through taxpayers’ money (Klement, 2018). A cost estimate of these control expenditures
generalizable between countries is difficult to come up with. This is because the different
Page 34
19
countries apply different combinations of control measures and the value of cattle differ
from country to country (Klement, 2018). This is well demonstrated in the Europe
epidemic of 2015 – 2016 (EFSA AHAW Panel, 2015; Agianniotaki et al., 2017). The
countries apply different control measures due to the differences in legislation that inform
the control policies that is unique to each country (Peck and Bruce, 2017).
In Jordan, Abutarbush et al. (2015) estimated the cost of supportive treatment of cattle
affected by LSD at £ 28 per animal. In Albania, the cost of supportive treatment was
estimated at € 28.7 per animal (Karalliu et al., 2017) and € 31.1 per animal (Casal et al.,
2018). In Bulgaria, the estimated cost of treatment was € 0.1 per animal, which is much
lower because the animals were slaughtered shortly after positive confirmation of LSD
infection (Casal et al., 2018).
A general cost of LSD and control measures for all countries is difficult to estimate. First,
the countries are affected differently by the disease. Secondly, there is a difference in
production structures of animals and how the different countries implement the various
control approaches as seen in the Balkan outbreak of 2016 – 2017 (Casal et al., 2018;
Klement, 2018). In this outbreak, a total of € 20.9 million was used in the control of disease
in the three countries. The amount used was € 8.6 million, € 6.7 million and € 5.3 million
in Bulgaria, Former Yugoslav Republic of Macedonia and Albania, respectively. The
average cost per affected herd and per affected animal in affected herd was € 6,994 and €
147 for Bulgaria, € 3,071 and € 258 for Yugoslav Republic of Macedonia, € 869 and € 539
for Albania, respectively (Casal et al., 2018). The government assumed 78% - 91% of the
total cost in all the countries except in Albania where the government took responsibility
for 39% of the total cost of the disease control (Casal et al., 2018). Partial stamping out of
Page 35
20
clinically infected animals seemed to be the most effective method of LSD control as
shown in the Former Yugoslav Republic of Macedonia where only four outbreaks were
experienced in 2017. This method had also been proposed by EFSA (2016). Albania carried
out vaccination with no culling of infected cattle and reported 372 new cases in 2017,
majority being from non-vaccinated herds. Bulgaria on the other hand applied a stricter
(and expensive) measure and experienced no outbreaks in 2017. The measures included
complete stamping out of infected herds and compensation for all the cattle, a rapid
vaccination campaign and aerial fumigation of vectors (Casal et al., 2018). This aerial
fumigation has come under criticism as it is expensive, environmental unfriendly and a
concern to public health and food chain (Klement, 2018). Vaccinations decreased the
number of cases dramatically in these three Balkan countries and reduced the cost of
disease from € 12.6 million to € 0.5 million. Therefore, high coverage vaccinations with
homologous vaccine is the most cost-effective measure for reducing LSD virus spread
(Casal et al., 2018). The vaccination efficacy in Bulgaria was 96% and 48% - 85% in
Albania (EFSA, 2018). Use of effective vaccines such as the attenuated Neethling vaccine
(Ben-Gera et al., 2015) is economical so long as the vaccine does not cause post-
vaccination LSD outbreak that may result to trade restriction.
Despite the low efficacy of some vaccines used against LSD, vaccination in Ethiopia has
been shown to be an inexpensive way to reduce LSD induced losses (Gari et al., 2011).
Additionally, devoting resources to development of new generation combined vaccines
such as for control of Rift Valley Fever and LSD is thought to yield high net returns upto
an estimated USD 982,837 net present value as shown in simulations done in South Africa
Page 36
21
for dairy operations (Mdlulwa et al., 2018). The net benefit of LSD control through annual
vaccination was estimated at 4USD per head (Hailu et al., 2015).
The losses due to international trade limitations vary significantly between countries
(Klement, 2018). A study in Borena bull market in Ethiopia reported that the losses due to
rejection of bulls affected by LSD was more than double the losses caused by mortality
(Alemayehu et al., 2013). The potential losses from trade suspensions in the European
Union countries is estimated to be higher compared to mortality losses as they have stricter
trade restrictions (Klement, 2018). For example, the decline in export of cattle in Bulgaria
reduced from 10,000 heads of cattle in 2014 to 605 in 2016 (94% decrease) due to blue
tongue outbreaks (Klement, 2018). Apart from the effects of trade restrictions on live
animals, meat and dairy, trade in genetic resources can also be affected as Irons et al. (2005)
reported that LSD virus can be secreted in semen. Countries in the trade of exporting bull
semen will therefore incur high losses (Klement, 2018). The LSD control policies in
different countries can therefore be influenced by international code of conduct governing
trade. Despite numerous studies that have examined the economic implications of lumpy
skin disease outbreaks around the World, to date there are no studies that have investigated
the cost of LSD outbreaks in Kenya.
Page 37
22
2.6 Case-control study design
This A case-control study design is useful in determining the association between the
exposure and outcome of interest that could be disease or otherwise. In simple terms, the
cases identified to have the outcome are assembled first and the controls recognized to be
free of the outcome are assembled next. The exposures of the two groups are then
retrospectively evaluated and the frequency of the exposures in the case and control groups
are compared statistically (Lewallen and Courtright, 1998).
Case control studies are advantageous in that they are relatively fast, low-cost, and easy to
carry out. The design is suitable for investigation of outbreaks and rare diseases or
outcomes. The design produces rapid results and the deductions may be used to rationalize
a more expensive and laborious longitudinal research (Lewallen and Courtright, 1998).
However, case-control studies are subject to bias, cannot produce incidence data,
challenging if record keeping is either insufficient or undependable and is prone to
difficulty in the selection of controls (Lewallen and Courtright, 1998).
In the selection of cases, certain key elements must be put int consideration. These include
sources of the cases, the definition of disease or the diagnostic criteria for the outcome and
whether the incident or prevalent cases or both are to be included (Dohoo et al., 2009).
Cases are randomly sampled or selected based on specific inclusion criteria (Rose and Van
der Laan, 2009) outlined above by Dohoo et al. (2009).
Controls chosen must be at comparable risk of developing the outcome. It should be
representative of the population which experienced the exposure that gave rise to the cases.
Usually, one control is selected for each case, but to improve the precision of association
measures, more than one control (up to a maximum of four or five) per case can be selected
Page 38
23
(Dohoo et al., 2009). Matching is used, whereby the factors chosen to define how controls
are to be comparable to the cases are established (Lewallen and Courtright, 1998). The
main purpose for matching is to eliminate confounding, but it has also been shown to
improve the efficiency of a study. Conditional logistic regression is used for analysis of
such studies (Rose and Van der Laan, 2009) as the act of matching introduces potential
bias. Matching can be done in two ways: individual matching and frequency matching. In
individual matching, the researcher matches subject by subject while in frequency
matching, the researcher ensures equal distribution of a variable among cases and controls
(De Graaf et al., 2011).
Several studies have used case-control study design in the field of veterinary science,
although with issues compared to those in human health (Cullen et al., 2016). Some of the
recent ones used in cattle include septic arthritis (Chamorro et al., 2019), Follicular Cystic
Ovarian Disease (Sayad et al., 2019), bovine tuberculosis (Milne et al., 2019) and anthrax
(Simbotwe et al., 2019).
Page 39
24
CHAPTER THREE: MATERIALS AND METHODS
3.1 Study Area
The study was carried out in Nakuru County, Kenya (Figure 3.1). The county has a human
population of 1,603,325 people, projected to be 2,046,395 by 2017 (KNBS, 2009). The
total number of households in the County was 409,836. The livestock population was
estimated at 439,994 cattle, 505,035 sheep and 227,037 goats (KNBS, 2015). It is the fourth
largest County in Kenya by human population. The County covers an area of 7,495 km²
and comprises of nine administrative sub-Counties, 11 constituencies and 55 Wards
(KNBS, 2015). The study population included all cattle herds present in the county. There
are different cattle production systems in the county, with areas bordering Baringo and
Narok counties practising pastoralism and areas around Nakuru town practising intensive
cattle production.
Page 40
25
Figure 3.1 Map of Kenya showing the location of Nakuru County and the nine sub-
counties.
Page 41
26
3.2 Study design and sample size determination
This was a frequency matched case-control study and the sampling units were households
that kept cattle. This is whereby matching is done subject by subject based on the potential
confounder. This study design was adopted because the incidence of affected herds with
LSD was thought to be low from local expert opinion. Potential case farms were identified
by staff working for the Subcounty Veterinary Officer (SCVOs) in Nakuru County based
on written records of attended cases. Subsequent case herds were identified through
discussion with local animal health practitioners and farmers affected with disease.
Unaffected households (controls) in the same village with the cases were all listed and
assigned with a unique identification number and randomly selected until the desired
number of control households was reached. The sample size was estimated using the epiR
(version 0.9-99) package in R3.5.2 based on the methodology described by Dupont (1988).
This uses the following equation to estimate sample size for frequency matched case
control studies:
𝐍 =(𝐳𝛃𝐯𝛗
𝟏 𝟐⁄+𝐳𝛂
𝟐⁄ 𝐯𝟏𝟏 𝟐⁄
)𝟐
(𝐞𝟏−𝐞𝛗)𝟐 [1]
Where,
Z = Number of standard deviations from the data point mean
v = Variance
e = Exponent
ψ = Odds ratio for exposure in case and controls.
α = Type I error probabilities
β = Type II error probabilities
Page 42
27
N = Number of cases,
To optimise the efficiency of the study, four controls were matched for each case. Based
on the assumption of 20% of controls having a risk factor of interest, in order to have 80%
power to detect an odds ratio (OR) of 3.0 with 95% confidence, 41 cases and 164 controls
were required. This assumed a moderate correlation in exposures between case and control
exposures (rho = 0.2).
3.3 Case and control definitions
Case herds were defined based on clinical suspicion of LSD in at least one bovine
demonstrating the characteristic clinical sign of raised, circular, firm, coalescing nodules
with cores of necrotic material called sit-fasts which vary from 1 cm to 7 cm (CFSPH,
2008; CFSPH, 2011; Tuppurainen and Oura, 2012). Case farms were eligible for
recruitment into the study if the suspected case occurred between September 2016 and
October 2017.
Control herds were matched based on location being within the same village, and were
eligible for recruitment into the study if no suspected LSD had been reported during the
same time period or one year in the past.
3.4 Data Collection
Primary data were collected between October 2017 and February 2018 on household-level
herd structures and putative risk factors for LSD. The questionnaire was administered to
household heads, farm managers or any family members that was knowledgeable about
the farm at least over the study period. Risk factors were chosen based on those described
in the literature and included age category, breed, introduction of new animals, vaccination
status against LSD, habits that encourage herd contact and mixing such as communal
Page 43
28
grazing land, forests and watering points, intermingling in post-harvest fields and
communal dipping at the household level. These information were arranged into a
questionnaire (Appendix 1) in a mixture of open ended and closed ended questions and
administered using KoboCollect® mobile application. From case households, data were
also collected on various aspects of direct and indirect losses due to LSD. Otherwise the
questions asked were identical on case and control households.
The data collected on sources of direct losses from LSD outbreaks included number of
cattle mortalities and loss in milk production, while the data on sources of indirect losses
included cost of vaccination and treatment of sick cattle.
The cost of cattle mortalities was estimated by use of the number of cattle that died per sex
and age category and their market prices. Prices of cattle were obtained from various
livestock auction markets and farms breeding cattle for sale and were stratified by age and
sex. Milk production loss was estimated by considering the reduction in milk loss per farm,
the market price of milk and the duration of reduction of milk loss in lactating cattle
affected by LSD.
The cost of vaccination was based on the amount of money households spent on animal
vaccinations against LSD. Treatment costs was based on amounts of money spent by
households on treatment of clinical cases of LSD in herds, prices of antibiotics they used
in treatment of secondary wounds, consultation charges and transport charges that an
animal health services provider would incur when they visited the farms. Feed and
management costs were estimated at household level based on the amounts of money spent
on purchase of feeds, and management costs associated with herding cattle. These included
the cost of water, concentrates, forage, breeding, hired labour and family contribution to
Page 44
29
cattle rearing in terms of milking, spraying, herding, watering, feeding, cleaning of cattle
sheds and treatment of cattle.
3.5 Data management and analysis
Data were downloaded from KoboCollect® mobile application and exported to MS Excel®
2010. They were then analysed using STATA 13® and R 3.3.3. The data analysis included
estimating descriptive statistical measures including mean and standard deviation and
inferential analysis and at all times the level of significance was set at 5%.
The strength of evidence for household-level univariable associations between putative
risk factors and having at least one case of LSD was estimated using conditional logistic
regression for binary or categorical variables and a unpaired t-test for continuous variables.
Conditional logistic regression was performed including the matching variable (village) as
a fixed effect in all models.
Variables that were associated on univariable conditional logistic regression analysis (at
P≤0.2) were taken forward to the multiple conditional logistic regression analysis. The
liberal P-value was chosen so as to include as many variables as possible in the
multivariable analysis. The multivariable model was built using backward stepwise
process. The maximum model (i.e. all variables significant on the univariable analysis)
were included in the starting model arranged in order of the largest Wald statistic. The
model was then fitted by performing likelihood ratio tests (LRT) to compare models with
and without each of the variables. Variables were retained if the P-value of the LRT was
≤0.05. Interaction was tested in the final model using LRTs and the goodness of fit was
tested using the Hosmer-Lemeshow test. Presence of collinearity was tested by use of
variance inflation factors in STATA®.
Page 45
30
The economic impact of the Lumpy Skin Disease outbreak was estimated by use of a
framework described by Rushton et al. (1999) to estimate direct losses on production and
indirect losses through the reaction and expenditure due to disease. According to this
framework, livestock disease impacts on household incomes and national economy
through direct and indirect losses. Direct losses are either visible (loss of milk production,
loss of draught power, lower weight gains and dead animals) or invisible (fertility
problems, changes in herd structure, delay in the sale of animals and animal products). On
the other hand, indirect losses are either additional costs (costs related with disease
prevention and control such as cost of vaccines, vaccine delivery, movement control,
diagnostic tests and culled animals) or value of revenue foregone (use of sub-optimal
breeds and denied access to markets both local and international). The framework is
presented in the figure 3.2 below.
Figure 3.2: The Impact of Livestock Disease (Rushton et al., 1999)
Page 46
31
The approach used by Jemberu et al. (2014) in estimation of economic impact of Foot and
Mouth Disease and by Molla et al. (2017) in estimation of economic impact of LSD in
Ethiopia was adopted in the analysis of the estimated economic losses.
The economic cost of LSD vaccination was calculated as;
Vacostij = NVai ∗ PVai [2]
Where,
Vacostij = the vaccination cost for affected herd i with breed j (without consideration of
subsidy if any);
NVai = the number of animals vaccinated;
PVai = the average per head expenditure on LSD vaccination (whether prior or post LSD);
The economic cost of LSD treatment was calculated as;
TrCostij = NTri ∗ PTri [3]
Where,
TrCostij = the treatment cost for affected herd i with breed j;
NTri = the number of animals treated;
PTri = the average per head expenditure to LSD treatment;
Economic losses due to milk loss per LSD affected herd were calculated as;
Lmilkij = Ncowi ∗ Qi ∗ Tmilki ∗ Pmilkj [4]
Where,
Lmilkij = economic losses due to milk loss for herd i with breed j;
Ncowi = number of lactating cows affected in herd i;
Qi = average quantity of milk lost in liters per affected herd per day in herd i;
Tmilki = average duration of illness in days of affected lactating cows in herd i,
Page 47
32
Pmilkj = average selling price of milk per litre reported by farmers in herd i. The economic
loss due to mortality per herd was calculated as
Lmortij = (Nmortfcalfi ∗ Pfcalf) + (Nmortmcalfi ∗ Pmcalf) + (Nmortheifi ∗ Pheif) +
(Nmortbulli ∗ Pbull) + (Nmortlacti ∗ Plact) + (Nmortdryi ∗ Pdry) [5]
Where,
Lmortij = economic losses due to mortality for a herd i with breed j;
Nmortfcalfi = number of female calves died in herd i;
Pfcalf = price of a female calf;
Nmortmcalfi = number of male calves died in herd i;
Pmcalf = price of a male calf;
Nmortheifi = number of heifers died in herd i;
Pheif = price of a heifer;
Nmortbulli = number of bulls died in herd i;
Pbull = price of a bull;
Nmortlacti = number of lactating cows died in herd i;
Plact = price of a lactating cow;
Nmortdryi = number of dry cows died in herd i;
Pdry = price of a dry cow;Total economic losses per herd were aggregated as the sum of
all losses arising from milk loss, mortality, cost of treatment and cost of vaccination.
TELij = Vacostij ∗ TrCostij ∗ Milkij ∗ Mortij [6]
Where,
TELij = total economic losses for herd i in a farm with breed j,
Page 48
33
The average of each of the economic losses per specific head of cattle present in the
affected herds was obtained by dividing the specific economic losses in the herd by the
total number of cattle in the herd. The average of each of the economic losses per affected
herd was obtained by dividing the specific economic losses in the herd by the total number
of herds affected.
Page 49
34
CHAPTER FOUR: RESULTS
4.1 Characteristics of the households
A total of 41 case farms and 164 control farms were visited in six villages of Rongai sub-
county. The other 8 sub-counties did not have any reported cases of LSD within the study
period (reported LSD cases were from the year 2013 and earlier, which did not meet the
case definition of this study). The majority (80.1%) of respondents were the farm owners
in both case and control farms. The herd structure and sizes of the farms are shown in
Table 4.1. There were more exotic breeds (71%) in the case herds than in the control
farms (62%). However, the differences were not statistically significant at p<0.05 (Table
4.1). There were 448 cattle in the case farms and 1,183 in the control farms (Appendix
7).
4.2 Cattle management
Of the three herd sizes considered (Table 4.1), significantly (p<0.05) more case herds
(37%) were large sizes than the control herds (22%). The distribution of grazing system
was similar for both case and control herds. Zero grazing was the most popular grazing
system being practised by 72% and 73% of the case and control farms, respectively. The
artificial insemination (AI) appeared to be the widely method of breeding practised by
59% and 54% of the case and control farms, respectively (Table 4.1).
Page 50
35
Table 4.1: Management practices on 41 case and 164 control farms in Nakuru
County, 2017.
Variable Level Case
farms
(n=41)
Control
farms
(n=164)
Case
farms
(%)
Control
farms
(%)
P-
Value
Herd size Small (1 – 3) 11 61 26 37 0.03
Medium (4 – 9) 15 67 37 41
Large (≥10) 15 36 37 22
Grazing
system
Tethering 1 9 2 5 0.94
Zero-grazing 30 118 73 72
Free-range 10 37 24 23
Watering
system
In rivers 11 29 27 18 0.08
Communal dams 4 38 10 23
Communal
boreholes
0 1 0 1
Piped and
harvested water
26 115 63 70
Breeding AI 24 89 59 54 0.83
Own bull 0 8 0 4
Shared bull 17 66 41 41
Vaccinatio
n against
LSD
Yes 5 15 12 9 0.47
No 36 149 88 91
Replaceme
nt animals
Own herd 30 157 73 95.7 0.00
From outside 11 7 27 4.3
Key: AI=Artificial insemination, LSD=Lumpy Skin Disease
Vaccination against LSD in the farms appeared to be minimal. The vaccination was
reported to have been carried out by 12% and 9% of the case and control herds,
respectively, before the outbreak of LSD. Majority of the farmers only vaccinated their
Page 51
36
cattle against LSD, later after the outbreak of the disease, as a reaction to the LSD
outbreaks. The source of replacement stock appeared to be mostly from own herds,
although the practise was more in the control herds than in the case herds. The difference
was significant (p<0.05) (Table 4.1).
Labour was sourced from outside the farms in 90.2% of the case farms and 30.5% of the
control farms. The role of women in the farms was milking (83.3%) and for men and
boys was spraying (50%) and herding (50%), respectively (Appendix 9).
4.3 Cattle productivity
The average milk production in Rongai sub-county was estimated at 10.4 litres per farm
per day in both case and control farms. The production of exotic breeds of cattle was
estimated at an average of 13.2 litres per farm per day and an average of 7.1 litres per
farm per day for indigenous breeds.
The number of cattle slaughtered in abattoirs in Rongai Sub-county in the years 2016 and
2017 was 1,845 and 1,791 respectively. A kilogram of beef was sold at an average of
Ksh. 400 per kilogram.
The prevailing market prices of different categories of cattle, some cattle products and
inputs in Nakuru County as shown in Appendix 10.
4.4 Distribution of potential risk factors of LSD outbreaks in case and control herds
The distribution of the potential risk factors of LSD outbreaks in case and control herds is
displayed in Table 4.3. There were significantly less indigenous breeds in the case herds
(24.4%) than in the control herds (OR=0.07, p=0.007). Indeed, case herds were 14.3
times more likely to have exotic breeds of cattle relative to the control herd. Significantly
(P<0.05) more large herds were in the case herds (37%) than in the control herds
Page 52
37
(OR=3.51, p=0.029). Case herds were 3.5 times more likely to have large herds relative
to the control herds.
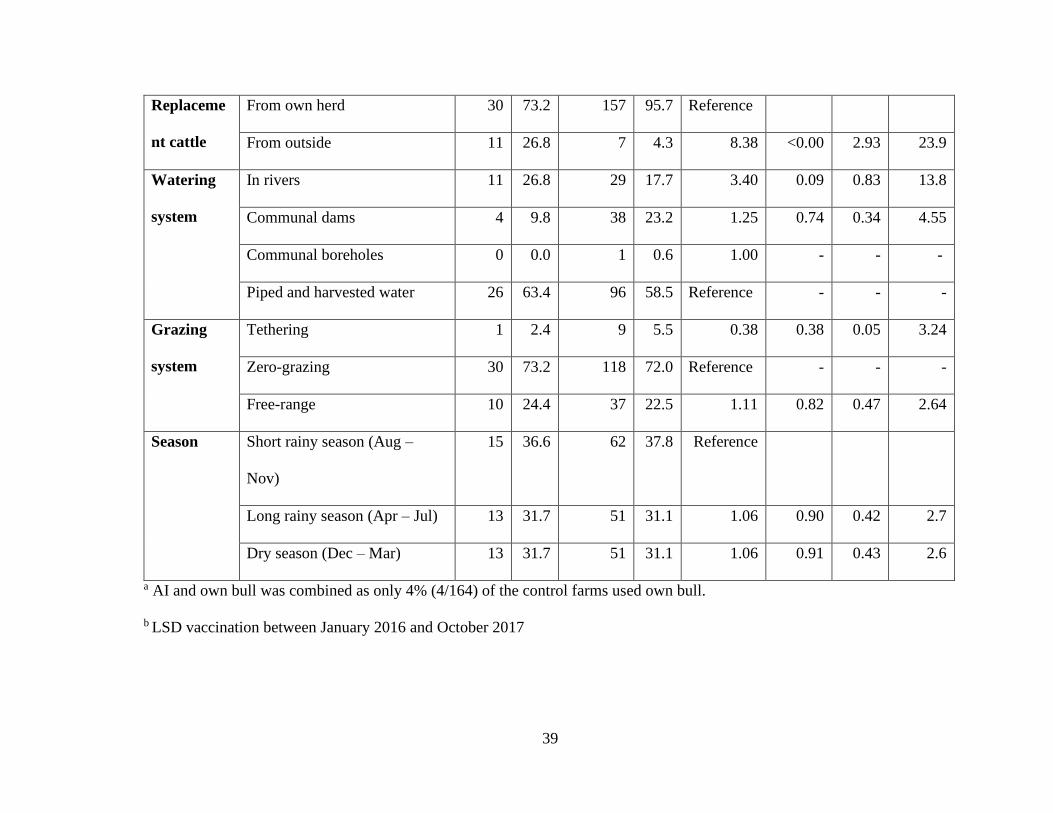
Significant replacement of cattle from outside stocks were more in the case herds
(27%) than in the control herds (4.3%) (OR=8.38, p=0.000). Indeed, case herds were
8.38 times more likely to have obtained replacement stocks from outside relative to the
control herd.
4.4.1 Univariable analysis
The significant variables (p≤0.05) from the univariable logistic regression were
replacement of cattle from outside stocks, indigenous breeds of cattle and large herd sizes
(Table 4.2). Farms which replaced their herds with cattle from outside the farm were 8.4
times more likely to experience LSD outbreaks compared to farms that replaced from
their own herds (OR=8.38, p=0.000). Herds with exotic breeds were 14.3 times more
likely to experience LSD outbreaks relative to herds with indigenous (OR=0.07,
p=0.007). Similarly, large herds were 3.5 times more likely to experience LSD outbreaks
compared to the small herds (OR=3.51, p=0.029) (Table 4.2).
Page 53
38
Table 4.2: Univariable analysis of the risk factors of Lumpy Skin Disease Outbreaks in Nakuru County.
Variable Category Cases
(n)
% Control
(n)
% OR P-value 95% CI
Breed
Exotic 29 70.7 102 62.2 Reference - - -
Indigenous 10 24.4 59 36.0 0.07 0.01 0.01 0.48
Mixed
2 4.9 3 1.8 1.03 0.98 0.11 9.72
Herd size
Small (0 – 3) 11 26.8 61 37.2 Reference - - -
Medium (4 – 9) 15 36.6 67 40.9 1.76 0.25 0.67 4.64
Large (≥10)
15 36.6 36 22.0 3.51 0.03 1.14 10.83
Dipping
system
Home spraying 37 90.2 155 96.9 Reference - - -
Community dip 4 9.8 5 3.1 3.71 0.01 0.80 17.29
Breeding
system
AI or own bulla 24 58.5 97 59.5 Reference - - -
Shared bull 17 41.5 66 40.5 1.11 0.84 0.402 .081
LSD
Vaccinatio
n b
Yes 5 12.2 15 9.1 1.52 0.47 0.49 4.71
No 36 87.8 149 90.9 Reference - - -
Page 54
39
Replaceme
nt cattle
From own herd
30 73.2 157 95.7 Reference
From outside 11 26.8 7 4.3 8.38 <0.00 2.93 23.9
Watering
system
In rivers
11 26.8 29 17.7 3.40 0.09 0.83 13.8
Communal dams 4 9.8 38 23.2 1.25 0.74 0.34 4.55
Communal boreholes 0 0.0 1 0.6 1.00 - - -
Piped and harvested water 26 63.4 96 58.5 Reference - - -
Grazing
system
Tethering
1 2.4 9 5.5 0.38 0.38 0.05 3.24
Zero-grazing 30 73.2 118 72.0 Reference - - -
Free-range 10 24.4 37 22.5 1.11 0.82 0.47 2.64
Season Short rainy season (Aug –
Nov)
15 36.6 62 37.8 Reference
Long rainy season (Apr – Jul) 13 31.7 51 31.1 1.06 0.90 0.42 2.7
Dry season (Dec – Mar) 13 31.7 51 31.1 1.06 0.91 0.43 2.6
a AI and own bull was combined as only 4% (4/164) of the control farms used own bull.
b LSD vaccination between January 2016 and October 2017
Page 55
40
4.4.2 Multivariable analysis
The variables from univariable analysis with p≤0.2 were included into the multivariable
logistic regression model. The significant variables (p≤0.05) were “replacement of cattle
from outside herds” (OR=7.28, p=0.001) and indigenous breeds of cattle (OR=0.07,
p=0.015) (Table 4.3). The other variables that were significant in univariable analysis
were not significant on multivariable analysis indicating that they were confounded by
either unmeasured or measured variables. The Odds Ratios of the variables that remained
significant in multivariable analysis did not change much (Tables 4.2 and 4.3) from
univariable to multivariable analysis indicating that confounding was not a major
problem.
4.4.3 Risk factors as thought by farmers
Most of the farmers (78.8%) did not have any idea on what could have caused the LSD
outbreak. The top risk factors that the other farmers thought include mixing of affected
with unaffected ones along the road (4.4%), spread by the wind (3.6%), spread by biting
flies (3.6%), spread from the outbreak in that occurred in the area (2.2%), cattle from
Loruk in Baringo county and Pokot being taken for sale in Marigat, Mogotio, Nakuru and
Kenya Meat Commission within Nakuru county passing through the area (0.7%) and
pastoralist cattle who may be brought into the area infected with LSD from Narok county
in search of pasture in Nakuru county (0.7%).
Page 56
41
Table 4.3: Multivariable analysis of the risk factors of Lumpy Skin Disease
Outbreaks in Nakuru County (LRT p= 0.0045).
Varia
ble
Category Case
(n)
% Control
(n)
% OR P-
value
95% CI
Replac
ement
cattle
From own
herd
30 73 157 96 Referen
ce
- -
From outside
11 27 7 43 8.70 <0.001 2.
80
27.
0
Breed
Exotic breeds
29 70.7 102 62.2 Referen
ce
- -
Indigenous
10 24.4 59 36.0 0.06 0.01 0.
01
0.5
2
Mixed breeds 2 4.9 3 1.8 0.47 0.56 0.
04
5.8
4.5 Estimated economic impact of lumpy skin disease
Costs incurred on treatment of clinically infected cattle in case farms keeping indigenous
cattle was estimated at an average of Ksh. 3,715; when compared with an average of
Ksh. 5,003 for case farms keeping exotic breeds (p=0.6). On the other hand, cost of
vaccination against LSD per case farm was estimated at an average of Ksh.888 for farms
with indigenous breeds of cattle and an average of Ksh. 852 for farms with exotic breeds
of cattle (p=0.9) (Table 4.4). Reduction in milk production during LSD outbreaks was
estimated at an average of 2 litres per farm per day for farms keeping indigenous cattle
and 10litres per farm per day for farms keeping exotic breeds of cattle. The duration of
milk reduction was estimated in Ethiopia to be about 70 days post infection (Molla et al.,
2018). This would result to an average estimated loss of Ksh. 1,890 per farm for farms
keeping indigenous cattle and Ksh. 11,275 per farmfor farms keeping exotic breeds
(p=0.2). This is equivalent to an average estimated loss of Ksh. 831 per animal per farm
keeping indigenous breeds of cattle and an average estimated loss of Ksh. 6,440 per
animal per farm keeping exotic breeds of animal (p=0.3). The cost of mortalities during
Page 57
42
LSD outbreaks was estimated at an average of Ksh. 621per farm keeping indigenous
breed of cattle and an average of Ksh. 9,835 per farm keeping exotic breeds (p=0.2). The
estimated average mortality loss at animal level is Ksh. 11 per animal per farm with
indigenous breeds and Ksh. 2,142 per animal per farm keeping exotic breeds of cattle
(p=0.2) (Figure 4.1). Based on these estimates, the total loss of LSD for farms keeping
indigenous cattle was estimated at Ksh 7,114 and Ksh 26,965 for farms keeping exotic
breed of cattle. Yet, if these farms implemented vaccination as a control strategy against
LSD in farms, they would be able to save approximately, Ksh 6,226 and 26,113 for farms
keeping indigenous and exotic cattle breeds, respectively. This level of resources can be
reallocated to other LSD management functions within the cattle farms.
Table 4.4: Economic Impact Lumpy Skin Disease in Nakuru County, 2017.
Disease losses Animal
category
Number of
animal
deaths per
category
(Total
number of
animals =
215)
Number of
farms affected
(Total number
of farms =10)
Price of
animal per
category
(KSH/animal)
Loss
(KSH)
Cattle
deaths
Indigenous
breeds of
cattle
Lactating
cows 2 1 15,066 30,132
Dry
cows 0 0 15,066 0
Bulls 0 0 15,676 0
Heifers 0 0 18,562 0
Female
calves 1 1 2,000 2,000
Male
calves 0 0 2,000 0
Total 3 2 32,132
Average loss for indigenous breeds per animal per farm 621
Animal
category
Number of
animal
deaths per
category
Number of
farms affected
(Total number
of farms =31)
Price of
animal per
category
(KSH/animal)
Loss
(KSH)
Page 58
43
(Total
number of
animals =
233)
Exotic
breeds of
cattle
Lactating
cows 6 5 70,000 420,000
Dry
cows 2 2 50,000 100,000
Heifers 8 4 70,000 560,000
Bulls 1 1 30,000 30,000
Female
calves 2 1 5,000 10,000
Male
calves 4 1 3,500 14,000
Total 23 14 1134000
Average loss for exotic breeds per farm 9,835
Breed category Milk price
(KSH/Litre)
Milk
reduction
(litres
per
farm)
Duration
of milk
drop
(Days)
Number
of farms
affected
Average
loss per
farm
(KSH)
Milk
reduction
per farm
per
outbreak
Indigenous breeds of
cattle 36 1.5 70 2 1,890
Exotic breeds of
cattle 36 9.9 70 7 11,275
Cost of
LSD
control
Item of cost and
breed
Number of
farms that
effected the
control
Number
of
animals
Loss per
farm
(KSH)
Average
loss per
animal
per farm
(KSH)
Average
loss per
farm
(KSH)
Cost of treatment of
LSD in indigenous
case farms
8 37 28,270 2,194 3,715
Cost of treatment of
LSD in exotic case
farms
29 33 42,300 2,684 5,003
Cost of vaccination
of LSD in
indigenous case
farms (Pre and post
LSD)
7 130 5,795 39 888
Cost of vaccination
of LSD farms with
exotic breeds (Pre
and post LSD) 13 144 10,780
52
852
Page 59
44
Figure 4.1 Economic impact of Lumpy Skin Disease outbreaks in case farms in
Nakuru County, 2017.
NB: 1USD=101Ksh.
0
1000
2000
3000
4000
5000
6000
7000
8000
9000
10000
11000
12000
13000
14000
15000
16000
17000
18000
19000
20000
21000
22000
Indirect
losses
Direct
losses
Indirect
losses
Direct
losses
Indigenous farms Exotic farms
CO
ST
OF
LS
D P
ER
FA
RM
PE
R O
UT
BR
EA
K
(KS
H./
FA
RM
/OU
TB
RE
AK
)
IMPACT OF LUMPY SKIN DISEASE
Milk loss per farm
Cattle deaths per farm
Vaccination against LSD per
farm
Treatment of LSD per farm
Page 60
45
CHAPTER FIVE: DISCUSSION
The results of this study show that the average herd size for case and control farms was
eight animals per farm. Farms keeping indigenous breeds of cattle had an average herd
size of eleven while those keeping exotic breeds had an average herd size of seven. A
study by Roderick et al. (1998) found out that herd sizes fluctuate seasonally due to
changes in nutrition, herd mobility and disease mortality. This compares well with herd
sizes of four (Murage and Ilatsia, 2011) and five (Muia et al., 2011; Njarui et al., 2012)
estimated from previous studies conducted in Central Kenya (Nyandarua and Kiambu
districts) and Eastern and Central Africa (Machakos and Wote in Kenya and Masaka in
central Uganda) respectively. A recent study by Nyaguthii (2018) in Nakuru showed that
the general average herd size was 5.5 and 8.2 in farms affected by Foot and Mouth
Disease. The herd sizes can also vary according to the production system. In small scale
dairy production system, herd sizes ranges from two to four cows, three to ten cows in
small scale dairy and meat and over fifty five cows in large scale dairy and meat systems
(Bebe et al., 2003b; Murage and Ilatsia, 2011).
Majority of the study farms from this study kept exotic (Ayrshire and Friesian) breeds.
Farms that kept indigenous breeds of cattle constituted about 34%. These results are
consistent with results obtained in studies conducted in the Kenya highlands, where
exotic breeds (Friesian and Ayrshire) constituted 62% of the study population and 22%
were indigenous cattle ( Bebe et al., 2003a). Overall, Rege et al. (2001) estimated that
indigenous breeds of cattle constituted 77% of cattle population and 23% exotic breeds
and their crosses in Kenya. This shows that majority of cattle in Kenya are indigenous
kept almost exclusively in pastoral production systems and the high milk yielding exotic
Page 61
46
breeds and their crosses kept in high potential areas where they are kept for milk
production. Nakuru County is considered a high potential area, thus the composition of
cattle breeds found.
In the current study, average of three animals were fed an average of two kilograms of
concentrates per farm per day. Concentrate feeding is crucial in dairy enterprises for
increased milk yield.
Milk yield in farms with indigenous breeds was seven litres per farm per day and double
that in farms with exotic breeds. Farms reportedly spent a significant amount of money
on water and forage in Nakuru County. Forage is an important feed source in the cattle
systems where the cattle graze (James and Charles, 1996). Small scale dairy use one
kilogram of concentrates to feed cows per day per milking per cow (Meme, 1998).
Nyaguthii (2018) found out that the average milk production in Nakuru was 11 litres per
farm per day. Muia et al. (2011) obtained similar estimates in a study carried out in
Nyandarua, Kenya. In a study conducted by Njarui et al. (2012) in Machakos and Wote
in Kenya and Masaka in Uganda, milk production also fluctuated with seasons ranging
from three litres per cow per day in the dry season to nine litres per cow per day in the
wet season. The findings of this study of thirty-six Kenya shillings per litre as the study
was conducted in the last months of the wet season. Wet season is associated with
abundance of feeds for the cattle and a resultant increased milk yield. There was also
concomitant change in the price of milk with availability of milk – Ksh. 30 per litre in
wet season and Ksh. 75 in dry season. Although this was not apparent in the current
study, dairy farmers should be advised on the importance of conserving forage in the
Page 62
47
rainy season when it is plenty for use in times of scarcity such as the dry period and thus
avoid production disruption.
The use of artificial insemination (AI) for breeding purposes was not common, practised
by only 33% of the study farms. The cost of semen was cited as the inhibiting factor
being an average of Ksh. 1,577 per dose. This was considered way out of reach for most
small scale dairy farmers. As a result, farmers resorted to using either their own bulls or
sometimes shared bulls between farms for breeding. This practise poses a high risk of
introducing infectious diseases in their farms. In Central Kenya, the use of AI has been
adopted by over 50% of surveyed farms (Murage and Ilatsia, 2011) and 40% in
Nyandarua, Kenya (Muia et al., 2011). Natural breeding using the bull has been found to
be the preferred method in large scale dairy and meat production systems (Onono et al.,
2012). However, some researchers argue that progressive large dairy farms use AI and
embryo technology extensively.
Hiring of farm labour was a common practise – 43% of the study farms had acquired
farm labour from outside their farms, mostly from the neighbours. These results are
consistent with those reported by Nyaguthii (2018) in farms surveyed in Nakuru County
for foot-and-mouth disease outbreaks. Other activities in the farms were carried out by
the members of the households.
The risk factors associated with occurrence of lumpy skin disease (LSD) from
univariable analysis included breed, herd size and replacement stocks. However, in the
final multivariable model, only breed and replacement stock retained their significance.
Like for other infectious diseases, breed was strongly associated with LSD outbreaks
presumably because indigenous breeds of cattle are less susceptible to ectoparasites that
Page 63
48
include blood feeding arthropods that transmit LSD compared to exotic breeds (Ibelli et
al., 2012). Replacement stocks obtained from outside the farm risks the introduction of
infectious diseases into the farms. This is because culling of sick animals is commonly
practiced by some farms. In one of the livestock auction markets, one farmer was selling
his cow which had clinical signs of LSD with the only consequence of this being
reduction in the price of the animal. These results agreed with those obtained in another
study conducted in the three main Ethiopian agro-climatic zones (Gari et al., 2010).
Communal grazing and watering of cattle, practises that encourage mixing of cattle, were
not significantly associated with LSD outbreaks, which is consistent with what was
obtained by Zelalem et al. (2015a) in West Wolega zone of Ethiopia unlike in the study
by Gari et al. (2010). These differences may have been due to other differences in the
management of study herds and the study approach. It was rather surprising that there
were no significant differences in the proportions of case and control herds that were
vaccinated against LSD. One would have expected significantly more control herds than
case herds to have been vaccinated. Information on the frequency of vaccinations and the
durations since the last vaccinations were carried out was not sought in this study. The
farmers could not remember the dates of vaccinations or the type of vaccines that were
being administered to their cattle. So, the question remains for how long the LSD vaccine
protected against LSD. Given the nature of the current study (case-control) with
possibilities of confounders, this question cannot be answered easily.
The bulk of the loss of LSD was mainly associated with the indirect losses (vaccinations
and treatment of secondary bacterial infections) in farms with indigenous breeds of cattle
which was Ksh. 4,603. Farms with exotic breeds of cattle had the bulk of the economic
Page 64
49
losses in the direct losses at Ksh. 21,110. Farms with indigenous breeds of cattle incurred
a total loss of Ksh. 7,114 while those keeping exotic breeds incurred a total loss of Ksh.
26,965. Much lower estimates were obtained in a similar study in Ethiopia at the
equivalent of Ksh. 400 per cow. Similar to the current study, the costs were more in
farms with exotic breeds of cattle relative to farms indigenous breeds of cattle. These
differences may have occurred due to much higher doses of antibiotics administered to
the much heavier exotic breeds for treatment of secondary bacterial infections.
Additionally, farms keeping exotic breeds of cattle seek professional services of animal
health practioners which is more costly compared to those keeping the indigenous breeds
who buy the antibiotics over the counter and administer it to the cattle on their own.
Secondary bacterial infection for LSD cases is the cause of most of the sickness and loss
of production in herds (Woods, 1988). The losses are also high when the disease severity
is high. The disease is more devastating in exotic breeds of cattle compared to indigenous
breeds of cattle since exotic breeds have a thin skin compared to the thick-skinned
indigenous breeds (Coetzer, 2004). Milk production due to LSD dropped from an
average of 4 and 12 litres per farm per day to 3 and 2 litres per farm per day, a 25% and
83% drop for farms with indigenous and exotic breeds, respectively. In a study conducted
in Ethiopia, milk reduction was by five litres per cow per day (Ayelet et al., 2013). In
other studies, milk production dropped by 50% and more (Woods, 1988). consistently
It is evident from the current study that the major economic impact of LSD to the farmers
lies in the indirect losses for farms keeping indigenous breeds of cattle (especially the
cost of treatment) and direct losses in farms keeping exotic breeds (especially milk loss).
Similar studies conducted in the North-Western and Central regions of Ethiopia have
Page 65
50
reported that the main factor of the economic loss at the herd level was due to mortality
(one thousand dollars) followed by milk loss (one hundred and twenty dollars) (Molla et
al., 2017).
The low direct losses compared to indirect losses in farms keeping indigenous breeds of
cattle from this study may be a cause of low incentive for the farmers to control LSD
since the cost of prevention and control of LSD is more than the direct losses. Farms
keeping indigenous breeds of cattle are majorly pastoralists. In a study on constraints of
cattle production in pastoral areas, LSD was found to be a disease with low score for
impact on livelihoods (5%) and low incidence (3%). It was ranked eighth among the
thirteen prevalent diseases in pastoral areas (Onono et al., 2013). The typical breed of
cattle raised in the arid and semi-arid regions of Kenya and East Africa, where
pastoralism is practised is indigenous breeds (Scarpa et al., 2003).
Page 66
51
CHAPTER SIX: CONCLUSIONS AND RECOMMENDATIONS
6.1 Conclusions
• Majority of the farms in Rongai sub-county raised exotic breeds of cattle.
• Farm level factors that were positively associated with LSD outbreaks were herd
size and source of replacement stocks while breed was negatively associated with
LSD outbreaks.
In the multivariable analysis, only two factors are retained their significance –
breed and source of replacement stock.
• The indirect losses were estimated at Ksh. 4,603 and Ksh. 5,855 for farms
keeping indigenous and exotic breeds of cattle respectively. This is in comparison
to estimated direct losses of Ksh. 2,511 and Ksh. 21,110 for farms keeping
indigenous and exotic breeds of cattle respectively.
6.2 Recommendations
• Farmers should be educated on the importance of maintaining closed herd, that is,
to avoid acquiring replacement stock from outside their herds to avoid
introduction of LSD in their farms.
• Controlled trials (field trials) should be carried out where two groups of herds,
one vaccinated against LSD and the other one not vaccinated against LSD, are
followed for a period of time and the incidence of LSD in the two groups
compared. This will determine the status of the efficacy of LSD vaccines
currently in use in Kenya.
• Farmers, especially those keeping exotic breeds of cattle should be trained on the
best prevention and control strategies such as annual vaccination against the
Page 67
52
disease, biosecurity measures such as introduction of animals examined and
certified by the veterinary authorities to be free of infectious diseases.
• The county to adopt a policy whereby cattle from other counties accessing the
area for trade, water and pasture be vaccinated against the disease prior to entry
into the county. Vaccination against the disease can also be introduced at the
points of entry of livestock into the county.
• The LSD has a potential to cause enormous economic impact. Farmers therefore
need to employ the above control strategies in order to save the money that could
have been incurred from the losses caused by the disease. These savings can be
redirected into other profit-making enterprises in the farm.
Page 68
53
REFERENCES
Abutarbush, S. M., Ababneh, M. M., Al Zoubi, I. G., Al Sheyab, O. M., Al Zoubi, M.
G., Alekish M. O. and Al Gharabat R. J. (2015). Lumpy Skin Disease in Jordan:
Disease Emergence, Clinical Signs, Complications and Preliminary‐associated
Economic Losses. Transboundary and emerging diseases, 62(5): 549 – 554
https://onlinelibrary.wiley.com/doi/full/10.1111/tbed.12177 Accessed on
22/03/2018
Adedeji, A.J., Adole, J.A., Dogonyaro, B.B., Kujul, N., Tekki, I.S., Asala, O.O., Chima,
N.C., Dyek, Y.D., Maguda, A.S. and Aba-Adulugba, E.P., (2017). Recurrent
outbreaks of lumpy skin disease and its economic impact on a dairy farm in Jos,
Plateau State, Nigeria. Nigerian Veterinary Journal, 38(2):151-158.
African Union Inter-African Bureau for Animal Resources (2013). Lumpy Skin Disease
http://www.au-ibar.org/lumpy-skin-disease Accessed on 28/02/2018
Agianniotaki, E.I., Tasioudi, K.E., Chaintoutis, S.C., Iliadou, P., Mangana-Vougiouka,
O., Kirtzalidou, A., Alexandropoulos, T., Sachpatzidis, A., Plevraki, E., Dovas,
C.I. and Chondrokouki, E. (2017). Lumpy skin disease outbreaks in Greece during
2015–16, implementation of emergency immunization and genetic differentiation
between field isolates and vaccine virus strains. Veterinary microbiology, 201: 78-
84.
Ahmed, W.M. and K.S. Zaher (2008). Observations on lumpy skin disease in local
Egyptian cows with emphasis on its impact on ovarian function. African Journal of
Microbiological Research, 2: 252-257.
Page 69
54
Alemayehu, G., Zewde, G., and Admassu, B. (2013). Risk assessments of lumpy skin
diseases in Borena bull market chain and its implication for livelihoods and
international trade. Tropical Animal Health and Production, 45(5): 1153-1159.
Ali, H., Ali, A.A., Atta, M.S., Cepica, A., 2012. Common, emerging, vector‐borne and
infrequent abortogenic virus infections of cattle. Transboundary and Emerging
Diseases, 59(1): 11 - 25. https://doi.org/10.1111/j.1865-1682.2011.01240.x
Ayelet, G., Abate, Y., Sisay, T., Nigussie, H., Gelaye, E., Jemberie, S., and Asmare, K.
(2013). Lumpy skin disease: Preliminary vaccine efficacy assessment and overview
on outbreak impact in dairy cattle at Debre Zeit, central Ethiopia. Antiviral
Research, 98(2): 261–265. https://doi.org/10.1016/j.antiviral.2013.02.008
Ayres-Smith, R. A. (1960). The symptoms and clinical diagnosis of lumpy skin disease in
Egypt Veterinary Record, 72: 469-472.
Baldacchino F., Vithee M., Marc D., Florian D., Theeraphap C. and Ge´rard D.
(2013). Transmission of pathogens by Stomoxys flies (Diptera, Muscidae): a review.
Parasite, 20: 26.
Baron, S., Fons, M., and Albrecht, T. (1996). Viral pathogenesis. In Medical
Microbiology. 4th edition. University of Texas Medical Branch at Galveston.
Bebe, B. O., Udo, H. M. J., Rowlands, G. J., and Thorpe, W. (2003a). Smallholder dairy
systems in the Kenya highlands: Breed preferences and breeding practices.
Livestock Production Science, 82(2–3):117–127. https://doi.org/10.1016/S0301-
6226(03)00029-0 Accessed on 28/02/2018
Bebe, B. O., Udo, H. M. J., Rowlands, G. J., and Thorpe, W. (2003b). Smallholder dairy
systems in the Kenya highlands: Cattle population dynamics under increasing
Page 70
55
intensification. Livestock Production Science, 82(2–3):211–221.
https://doi.org/10.1016/S0301-6226(03)00013-7 Accessed on 28/02/2018
Ben-Gera J., Klement E., Khinich E., Stram Y. and Shpigel N.Y. (2015). Comparison
of the efficacy of Neethling lumpy skin disease virus and x10RM65 sheep-pox live
attenuated vaccines for the prevention of lumpy skin disease. The results of a
randomized controlled field study. Vaccine, 33(38): 4837 – 4842.
Birhanu (2012). Assessments of the risk factors and financial impacts of LSD in
selected districts of Tigray and Afar Regional States, Northeastern Ethiopia.
M.Sc. Thesis, Wollega University, Ethiopia.
Boshra, H., Truong, T., Nfon, C., Gerdts, V., Tikoo, S., Babiuk, L. A., and Babiuk, S.
(2013). Capripoxvirus-vectored vaccines against livestock diseases in Africa.
Antiviral research, 98(2): 217-227.
Boumart Z., Daouam S., Belkourati I., Rafi L., Tuppurainen E., Tadlaoui K.O. and
Harrak M. El (2016). Comparative innocuity and efficacy of live and inactivated
sheeppox vaccines. BMC Veterinary Research, 12 (1): 133.
Bowden, T.R., S.L. Babiuk, G.R. Parkyn, J.S. Copps and D.B. Boyle (2008).
Capripoxvirus tissue tropism and shedding: a quantitative study in
experimentally infected sheep and goats. Virology, 371: 380-393.
Burdin M.L., (1959). The use of histopathological examination of skin material for the
diagnosis of Lumpy skin disease in Kenya. Bulletin Des Epizooties En Afrique,
7: 27-36.
Page 71
56
Carn V. M., and R. P. Kitching (1995). An investigation of possible routes of
transmission of lumpy skin disease virus (Neethling). Epidemiology and
Infections, 114: 219–226.
Carter G.R. and D.J. Wise (2006). Poxviridae. A Concise Review of Veterinary
Virology. Accessed from
https://www.libyanvet.com/Books/10%20Poxviridae.pdf on 16/09/2019
Casal J, Allepuz A, Miteva A, Pite L, Tabakovsky B, Terzievski D, Alexandrov T
and Beltran-Alcrudo D (2018). Economic cost of lumpy skin disease
outbreaks in three Balkan countries: Albania, Bulgaria and the Former Yugoslav
Republic of Macedonia (2016-2017). Transboundary and Emerging Diseases,
65(6): 1680-1688 https://doi.org/10.1111/tbed.12926
Center for Food Security and Public Health (2008). Center for Food Security and
Public Health, Iowa State University, College of Veterinary Medicine. Accessed
on 19/12/2016
Center for Food Security and Public Health (2011). Center for Food Security and
Public Health, Iowa State University, College of Veterinary Medicine. Accessed
on 19/12/2016
Chamorro, M. F., Reppert, E. J., Robinson, L., Cernicchiaro, N., Biller, D., and
Miesner, M. (2019). Factors associated with septic arthritis of the distal
interphalangeal joint in beef cattle: A case-control study. The Veterinary
Journal, 244: 104-111.
Page 72
57
Chihota, C.M., L.F. Rennie, R.P. Kitching and Mellor P.S. (2001). Mechanical
transmission of lumpy skin disease virus by Aedes aegypti (Diptera: Culicidae).
Epidemiology and Infections, 126: 317-321.
Coakley, W. and Capstick, P. B. (1961). Protection of cattle against lumpy skin affecting
small scale production of a tissue culture propagated virus vaccine. Veterinary
Science, 2: 369
Coetzer, J.A.W. (2004). Lumpy skin disease, in: Infectious diseases of livestock, edited by
Coetzer, J.A.W. & Tustin, R.C. Cape Town: Oxford University Press Southern
Africa, 2:1268-1276.
Cullen, J.N., Sargeant, J.M., Makielski, K.M. and O’Connor, A.M., (2016). The case-
control design in veterinary sciences: A survey. Preventive Veterinary
Medicine, 134: 179-187.
Davies F. G. (1982). Observations on the Epidemiology of Lumpy Skin Disease in
Kenya. The Journal of Hygiene, 88 (1): 95-102 Accessed: 11-12-2018 on
https://www.jstor.org/stable/3862979
Davies, F. G. (1991). Lumpy skin disease of cattle: A growing problem in Africa and
the Near East. World Animal Review, 68(3): 37 – 42 Accessed on 11/12/18 on
http://www.fao.org/docrep/u4900t/u4900t0d.htm
De Graaf, M. A., Jager, K. J., Zoccali, C., and Dekker, F. W. (2011). Matching, an
appealing method to avoid confounding? Nephron Clinical Practice, 118(4):
c315-c318.
Dohoo, I.R., Martin, S.W. and Stryhn, H., (2009). Veterinary epidemiologic
research. VER. Inc., Charlottetown, PE, Canada.
Page 73
58
Dupont, W. D. (1988). Power calculations for matched case-control studies. Biometrics,
44: 1157-1168.
EFSA Panel on Animal Health and Welfare (AHAW). (2015). Scientific Opinion on
lumpy skin disease. EFSA Journal, 13(1): 3986.
https://doi.org/10.2903/j.efsa.2015.3986
European Food Safety Authority (2018). Lumpy Skin Disease: Vaccination is most
effective control method. European Food Safety Authority (EFSA) Accessed on
02/03/2018 from www.efsa.europa.eu
European Food Safety Authority (2017). Lumpy skin disease. European Food Safety
Authority. www.efsa.europa.eu/en/topics/topic/lumpy-skin-disease Accessed on
29/06/2017
European Food Safety Authority (2016). Urgent advice on lumpy skin disease. EFSA
Journal, 4573: 27. https://doi.org/10.2903/j.efsa.2016.4573
El-Tholoth M. and El-Kenawy A.A. (2016). G-Protein-Coupled Chemokine Receptor
Gene in Lumpy Skin Disease Virus Isolates from Cattle and Water Buffalo
(Bubalus bubalis) in Egypt. Transboundary and Emerging Diseases, 63(6): 288
– 295
Food and Agriculture Organization of the United Nations (1991). Lumpy skin disease
of cattle: A growing problem in Africa and the Near East In: Animal genetic
resources. World Animal Review, 68:3
Food and Agriculture Organization of the United Nations (2015). Emergence of
lumpy skin disease in Europe. EMPRES WATCH, 33.
Page 74
59
GALVMED (2018). Gates foundation and DFID award GALVmed $51 million to
combat livestock disease. https://www.galvmed.org/news/gates-foundation-
dfid-award-galvmed-51-million-to-combat-livestock-disease/ Accessed on
27/09/2018.
Gari G., Bonnet, P., Roger F. and Waret-Szkuta, A. (2011). Epidemiological Aspects
and Financial Impact of Lumpy Skin Disease in Ethiopia. (NAHDIC) Preventive
Veterinary Medicine, 102: 274-283.
Gari G., Grosbois V., Waret-Szkuta A., Babiuk S., Jacquiet P. and Roger F.
(2012). Lumpy skin disease in Ethiopia: seroprevalence study across different
agro-climatic zones. Acta Tropica, 123(2): 101 – 106.
Gari G., Waret-Szkuta A., Grosbois V., Jacquiet P. and Roger F. (2010). Risk
factors associated with observed clinical lumpy skin disease in Ethiopia.
Epidemiology and Infections, 138: 1657-1666.
Gomo C., Kanonhuwa K., Godobo F., Tada O. and Makuza S. M. (2017). Temporal
and spatial distribution of lumpy skin disease (LSD) outbreaks in Mashonaland
West Province of Zimbabwe from 2000 to 2013. Tropical animal health and
production, 49(3): 509-514.
Gubbins, S., Stegeman, A., Klement, E., Pite, L., Broglia, E., and Abrahantes, J. C.
(2018). Inferences about the transmission of lumpy skin disease virus between
herds from outbreaks in Albania in 2016. Preventive Veterinary Medicine, In press.
https://doi.org/10.1016/j.prevetmed.2018.12.008.
Hailu, B., Gari, G., Tolosa, T., Beyene, B., and Teklue, T. (2015). Study on the
epidemiological and financial impacts of clinical lumpy skin disease in selected
Page 75
60
districts of Tigray and Afar regional states, North Eastern Ethiopia. International
Journal of Current Research, 7: 17415-17425.
Ibelli, A.M.G., Ribeiro, A.R.B., Giglioti, R., Regitano, L.C.A., Alencar, M.M.,
Chagas, A.C.S., Paco, A.L., Oliveira, H.N.D., Duarte, J.M.S. and Oliveira,
M.C.S., (2012). Resistance of cattle of various genetic groups to the tick
Rhipicephalus microplus and the relationship with coat traits. Veterinary
Parasitology, 186(3-4): 425-430.
Hivisasa (2014). Naivasha vet department issues alert over lumpy skin disease
outbreak https://hivisasa.com/posts/-------------naivasha-vet-department-issues-
alert-over-lumpy-skin-disease-outbreak--------- Accessed on 14/09/2019
Hivisasa (2015). Vaccinate cattle against Lumpy Skin Disease, Lari farmers told
https://hivisasa.com/posts/vaccinate-cattle-against-lumpy-skin-disease-lari-
farmers-told Accessed on 14/09/2019
Hivisasa (2018). Ainabkoi farmers in agony as veterinary officer issues warning
https://hivisasa.com/posts/935-farmers-cry-foul-over-lumpy-skin-disease
Accessed on 14/09/2019
Hunter, P., and Wallace D. (2001). Lumpy Skin Disease in southern Africa: review of
the disease and aspects of control. Journal of the South African Veterinary
Association, 72(2).
Innovative Diagnostics Vet (2017). Veterinary diagnostic tests. ID Screen® Capripox
double antigen multi-species https://www.id-vet.com/produit/id-screen-
capripox-double-antigen-multi-species/ Accessed on 18/12/2017.
Page 76
61
Irons, P.C., Tuppurainen E.S.M. and Venter E.H. (2005). Excretion of lumpy skin
disease virus in bull semen. Theriogenology, 63: 1290-1297.
James, A. D., and Charles, A. B. (1996). Measuring the productivity of grazing and
foraging livestock. Agricultural Systems, 52(2-3): 271-291.
Jemberu, W.T., Mourits, M.C., Woldehanna, T. and Hogeveen, H., (2014). Economic
impact of foot and mouth disease outbreaks on smallholder farmers in
Ethiopia. Preventive Veterinary Medicine, 116(1-2): 26-36.
Karalliu, E., Boçi, R., Hatia, V., Prifti, V., Keçi, R., Manaj, B., and Koleci, X. (2017). A
case study of lumpy skin disease outbreak in Rrapëz, Lushnje, Albania. Albanian
Journal of Agricultural Sciences, special edition pp. 497-502.
Kitching R.P. (2003). Vaccines for lumpy skin disease, sheep pox and goat pox. Vaccines
OIE List A. Emerging Animal Diseases, 114: 161–167.
Kitching R.P. and Mellor P.S. (1986). Insect transmission of capripoxvirus. Research in
Veterinary Science, 40: 255–258.
Klausner, Z., Fattal, E., and Klement, E. (2017). Using synoptic systems’ typical wind
trajectories for the analysis of potential atmospheric long‐distance dispersal of
lumpy skin disease virus. Transboundary and Emerging Diseases, 64(2): 398 - 410.
Klement, E. (2018). Economic Impact of Lumpy Skin Disease In: Lumpy Skin Disease.
Springer, Cham. DOI: 10.1007/978-3-319-92411-3_3
Kenya National Bureau of Statistics (2009). Statistical abstract. The government printer,
Nairobi.
Kenya National Bureau of Statistics (2015). Population and housing census 2009.
Page 77
62
Knowledge Bylanes Kenya (2017). Quarantine issue in Mt Elgon following the
outbreak of lumpy skin disease
https://www.knowledgebylanes.co.ke/quarantine-issue-in-mt-elgon-following-
the-outbreak-of-lumpy-skin-disease/ Accessed on 14/09/2019
Kruijshaar, M.E., Barendregt, J.J. and Hoeymans N. (2002). The use of models in
the estimation of disease epidemiology Bulletin of the World Health
Organization, 80(8): 622 – 628
http://www.who.int/bulletin/archives/80(8)622.pdf Accessed on 21/03/2018
Lewallen, S., and Courtright, P. (1998). Epidemiology in practice: case-control
studies. Community Eye Health, 11(28): 57 – 58.
Lovisolo, O., Hull, R., and Rösler, O. (2003). Coevolution of viruses with hosts and
vectors and possible paleontology. Advances in Virus Research, 62: 325-379.
Lubinga, J. C., Tuppurainen, E. S. M. Stoltsz, W. H. Ebersohn, K. Coetzer, J. A.
W. and Venter E. H. (2013). Detection of lumpy skin disease virus in saliva of
ticks fed on lumpy skin disease virus-infected cattle. Experimental and Applied
Acarology, 61: 129–138.
Lubinga, J. C., E. S. M. Tuppurainen, J. A. W. Coetzer, W. H. Stoltsz, and E. H.
Venter, (2014). Evidence of lumpy skin disease virus over-wintering by
transstadial persistence in Amblyomma hebraeum and transovarial persistence in
Rhipicephalus decoloratus ticks. Experimental and Applied Acarology,62: 77–
90.
Maclachlan N. and Edward J Dubovi J. E. (2016). Poxviridae, in: Fenner's Veterinary
Virology 5th Edition edited by N. Maclachlan Edward J Dubovi Imprint: Academic
Page 78
63
Press Accessed from https://www.sciencedirect.com/topics/neuroscience/lumpy-
skin-disease on 16/09/2019
MacOwan, K.D.S. (1959). Observations on the epizootiology of lumpy skin disease during
the first year of its occurrence in Kenya. Bulletin of Epizootic Diseases of Africa, 7:
7-20.
Magori-Cohen, R., Y. Louzoun, Y. Herziger, E. Oron, A. Arazi, E. Tuppurainen,
N.Y. Shpigel and E. Klement (2012). Mathematical modelling and evaluation
of the different routes of transmission of lumpy skin disease virus. Veterinary
Research, 43:1
Mdlulwa, Z., Masemola, M., Chaminuka, P., and Madyo, S. (2018). Economic analysis
of new generation vaccines for control of lumpy skin disease and Rift Valley Fever
in South Africa. Agrekon, 1: 1-16.
Mellor P.S., Kitching R.P. and Wilkinson P.J. (1987). Mechanical transmission of
capripox virus and African swine fever virus by Stomoxys calcitrans. Research in
Veterinary Science, 43: 109 – 112.
Meme, M. F. (1998). Descriptive and Gross Margin analysis for the case study farmers.
PhD thesis, University of Reading, UK.
Milne, G., Graham, J., Allen, A.R., Lahuerta-Marin, A., McCormick, C.M., Presho,
E., Skuce, R.A. and Byrne, A., (2019). Characteristics of Northern Irish cattle
herds without bovine tuberculosis infection. Veterinary Record, vetrec-2018.
Molla, W., de Jong, M. C. M., Gari, G., and Frankena, K. (2017). Economic impact of
lumpy skin disease and cost effectiveness of vaccination for the control of outbreaks
in Ethiopia. Preventive Veterinary Medicine, 147: 100–107.
Page 79
64
https://doi.org/10.1016/j.prevetmed.2017.09.003
Muia, J. M. K. ., Kariuki, J. N. ., Mbugua, P. N. ., Gachuiri, C. K. ., Lukibisi, L. B. .,
Ayako, W. O. ., and Ngunjiri, W. V. (2011). Smallholder dairy production in high
altitude Nyandarua milk-shed in Kenya: Status, challenges and opportunities.
Livestock Research for Rural Development, 23(5) Article #108.
Retrieved September 13, 2019, from http://www.lrrd.org/lrrd23/5/muia23108.htm
Murage, A. W., and Ilatsia, E. D. (2011). Factors that determine use of breeding services
by smallholder dairy farmers in Central Kenya. Tropical Animal Health and
Production, 43(1):199–207. https://doi.org/10.1007/s11250-010-9674-3
Murray, M., W.I. Morrison, and Whitelaw D.D. (1982). Host susceptibility to African
trypanosomiasis: Trypanotolerance. Advances in Parasitology, 21:1–68.
Nelson K. E., and Williams C. M. (Eds.) (2013). Infectious disease epidemiology. Jones
and Bartlett Publishers, Boston, Massachusetts.
https://books.google.co.ke/books?hl=en&lr=andid=SnYGIlHpix0C&oi=fnd&pg=P
R1&dq=nelson+&+williams+2013&ots=r4bUPrPX_p&sig=Q6RRzr47lLA1waI6Ia
goc8uKK-
c&redir_esc=y#v=onepage&q=nelson%20&%20williams%202013&f=false
Accessed on 15/06/2018
Njarui D M G, Kabirizi J M, Itabari J K, Gatheru M, Nakiganda A and Mugerwa S
(2012). Production characteristics and gender roles in dairy farming in peri-urban
areas of Eastern and Central Africa. Livestock Research for Rural Development,
24(122). Retrieved February 28, 2018, from
http://www.lrrd.org/lrrd24/7/njar24122.htm
Page 80
65
Nyaguthii D.M (2018). Occurrence and Risk Factors Associated with Foot and Mouth
Disease in Smallholder Dairy Farms of Nakuru County, Kenya. MSc. thesis,
University of Nairobi, Kenya. Accessed on 17/03/2019 on
http://erepository.uonbi.ac.ke/handle/11295/105392
Ocaido M., Otim C.P. and D. Kakaire (2008). Impact of major diseases and vectors in
smallholder cattle production systems in different agro-ecological zones and
farming systems in Uganda. FVM, Makerere University, Kampala, Uganda.
Livestock Research for Rural Development, 21(9).
Omoga, D.C.A (2018). Molecular based detection, validation of LAMP assay and
Phylogenetic analysis of Capripoxvirus in Kenya (PhD thesis, Jomo Kenyatta
University of Agriculture and Technology, Kenya).
Office International des Epizooties (2010). Terrestrial Manual of Lumpy Skin Disease,
Chapter 2.4.14. Version adopted by the World Assembly of Delegates of the OIE in
May 2010, OIE, Paris. Accessed on 18/12/2016
Office International des Epizooties (2011). Lumpy Skin Disease. Terrestrial Animal
Health Code. OIE, Paris. Accessed on 18/12/2016
Office International des Epizooties (2013). Lumpy Skin Disease. Aetiology,
epidemiology, diagnosis, prevention and control references. OIE Technical Disease
Cards. Accessed on 18/12/2016
Office International des Epizooties (2017). Lumpy skin disease. Chapter 2.4.13 Accessed
on 27/06/2017
Page 81
66
Onono, J. O., Wieland, B., and Rushton, J. (2012). Productivity in different cattle
production systems in Kenya. Tropical Animal Health and Production, 45(1): 423–
430. https://doi.org/10.1007/s11250-012-0233-y
Onono, J. O., Wieland, B., and Rushton, J. (2013). Constraints to cattle production in a
semiarid pastoral system in Kenya. Tropical animal health and production, 45(6)
:1415-1422.
Peck, D., and Bruce, M. (2017). The economic efficiency and equity of government
policies on brucellosis: comparative insights from Albania and the United States of
America. Revue scientifique et technique (International Office of Epizootics), 36(1):
291-302.
Rege, J. E. O., Kahi A.K., Okomo-Adhiambo M., Mwacharo J. and Hanotte O.
(2001). Zebu cattle of Kenya: Uses, performance, farmer preferences, measures of
genetic diversity and options for improved use. Animal Genetic Resources Research
1. ILRI (International Livestock Research Institute), Nairobi, Kenya. 103pp.
Roderick, S., Stevenson, P., and Ndungu, J. (1998). The production parameters
influencing the composition and structure of pastoral cattle herds in a semi-arid area
of Kenya. Animal Science, 66(3): 585–594.
https://doi.org/10.1017/S1357729800009164
Rose, S., and Van der Laan, M. J. (2009). Why match? Investigating matched case-
control study designs with causal effect estimation. The International Journal of
Biostatistics, 5(1).
Rushton J. (2009). The economics of animal health and production. CAB International,
London, UK.
Page 82
67
Rushton J., Thorton, P.K. and Otte, M.J. (1999). Methods of economic impact
assessment. Revolutions in Science Technology, 18(2):315 – 342.
https://onlinelibrary.wiley.com/doi/full/10.1111/tbed.12565 Accessed on 22/03/2018
Saegerman, C., Bertagnoli, S., Meyer, G., Ganière, J.P., Caufour, P., De Clercq, K.,
Jacquiet, P., Fournie, G., Hautefeuille, C., Etore, F. and Casal, J. (2018). Risk of
introduction of lumpy skin disease in France by the import of vectors in animal
trucks. PloS one, 13(6): e0198506. https://doi.org/10.1371/journal.pone.0198506
Salib, F. A., and Osman, A. H. (2011). Incidence of lumpy skin disease among Egyptian
cattle in Giza Governorate, Egypt. Veterinary world, 4(4).
Sayad, A., Koohi, M.K., Vodjgani, M., Abdi, K., Gharagozloo, F., Rezvanfar, M.A.,
Akbarein, H., Baeeri, M. and Abdollahi, M., (2019). An Evaluation of the Plasma
Levels of Frequently Used Pesticides in Dairy Cattle and Its Possible Correlation
with the Occurrence of Follicular Cystic Ovarian Disease: A Case-Control
Study. Novelty in Biomedicine, 7(2): 55-63.
Scarpa, R., Ruto, E. S., Kristjanson, P., Radeny, M., Drucker, A. G., and Rege, J. E.
(2003). Valuing indigenous cattle breeds in Kenya: an empirical comparison of
stated and revealed preference value estimates. Ecological Economics, 45(3): 409-
426.
Şevik, M., and Doğan, M. (2017). Epidemiological and molecular studies on lumpy skin
disease outbreaks in Turkey during 2014–2015. Transboundary and emerging
diseases, 64(4):1268-1279.
Page 83
68
Sharawi S.S. and Abd El-Rahim I.H. (2011). The utility of polymerase chain reaction for
diagnosis of lumpy skin disease in cattle and water buffaloes in Egypt. Revolutions
in Science Technology, 30:821–30.
Simbotwe, M., Mulenga, E., Furuta, Y., Munkombwe Muuka, G., Hang’ombe, B.M.
and Higashi, H., (2019). Geographic distribution of cattle anthrax in Western
Zambia. Japanese Journal of Veterinary Research, 67(2): 195-202.
Somasundaram, M. K. (2011). An outbreak of lumpy skin disease in a Holstein Dairy
Herd in Oman: a clinical report. Asian Journal of Animal Veterinary Advancements,
6: 851–859.
Sprygin, A., Pestova, Y., Wallace, D. B., Tuppurainen, E., and Kononov, A. V. (2019).
Transmission of lumpy skin disease virus: a short review. Virus research, 269.
Standard Group PLC (2015). Quarantine in six sub-counties over epidemic
https://www.standardmedia.co.ke/article/2000147238/quarantine-in-six-sub-
counties-over-epidemic Accessed on 14/09/2019
Standard Group PLC (2018a). Farmers accuse county of failing to vaccinate livestock
https://www.standardmedia.co.ke/article/2001295092/farmers-accuse-county-of-
failing-to-vaccinate-livestock Accessed on 14/09/2019
Standard Group PLC (2018b). Farmers risk losing livestock as outbreak of lumpy skin
disease bites https://www.standardmedia.co.ke/health/article/2001298744/fear-as-
lumpy-skin-disease-spreads-in-murang-a Accessed on 14/09/2019
Standard Group PLC (2019). Disease outbreak leaves trail of livestock deaths
https://www.farmers.co.ke/article/2001294702/residents-of-baringo-south-counting-
losses-after-an-outbreak-of-lumpy-skin Accessed on 14/09/2019
Page 84
69
Tageldin, M. H., D. B. Wallace, G. H. Gerdes, J. F. Putterill, R. R. Greyling, M. N.
Phosiwa, R. M. Al Busaidy, and Al Ismaaily S. I. (2014). Lumpy skin disease of
cattle: an emerging problem in the Sultanate of Oman. Tropical Animal Health and
Production, 46: 241–246.
Thrusfield M (2005). The economics of infectious diseases. In: Veterinary epidemiology.
Blackwell Science, London: 357–367
Tuppurainen, E.S.M., Babiuk, S., and Klement, E. (2018). Lumpy Skin Disease. VI,
109. Springer Int Publishing. DOI: 10.1007/978-3-319-92411-3
Troyo, A., O. Calderon-Arguedas, D.O. Fuller, M.E. Solano, A. Avendano, K.L.
Arheart, D.D. Chadee and Beier J.C. (2008). Seasonal profiles of Aedes aegypti
(Diptera: Culicidae) Larval habitats in an urban area of Costa Rica with the history
of mosquito control. Journal of Vector Ecology, 33: 1-13.
Tuppurainen E. and Galon N. (2016). Lumpy skin disease: Current situation in Europe
and neighbouring regions and necessary control measures to halt the spread in
South-East Europe. Europe – OIE Regional Commission.
Tuppurainen E. S. M., E. H. Venter, J. L. Shisler, G. Gari, G. A. Mekonnen, N. Juleff,
N. A. Lyons, K. De Clercq, C. Upton, T. R. Bowden, S. Babiuk and L. A.
Babiuk (2015). Review: Capripoxvirus Diseases: Current Status and Opportunities
for Control. Transboundary and Emerging Diseases, 64(3): 729 – 745.
Tuppurainen S. M., J. A. W. Coetzer, W. H. Stoltsz, and E. H. Venter (2014a).
Evidence of lumpy skin disease virus over-wintering by transstadial persistence in
Amblyomma hebraeum and transovarial persistence in Rhipicephalus decoloratus
ticks. Experimental and Applied Acarology, 62: 77–90.
Page 85
70
Tuppurainen, E.S., Pearson, C.R., Bachanek-Bankowska, K., Knowles, N.J., Amareen,
S., Frost, L., Henstock, M.R., Lamien, C.E., Diallo, A. and Mertens, P.P.
(2014b). Characterization of sheep pox virus vaccine for cattle against lumpy skin
disease virus. Antiviral Research, 109(1): 1–6.
https://doi.org/10.1016/j.antiviral.2014.06.009
Tuppurainen, E. S. M., J. C. Lubinga, W. H. Stoltsz, M. Troskie, S. T. Carpenter, J. A.
W. Coetzer, E. H. Venter and Oura C. A. L. (2013a). Mechanical transmission of
lumpy skin disease virus by Rhipicephalus appendiculatus male ticks. Epidemiology
and Infections, 141: 425–430.
Tuppurainen, E. S. M., J. C. Lubinga, W. H. Stoltsz, M. Troskie, S. T. Carpenter, J. A.
W. Coetzer, E. H. Venter and Oura C. A. L., (2013b). Evidence of vertical
transmission of lumpy skin disease virus in Rhipicephalus decoloratus ticks. Tick
Borne Diseases, 4: 329–333.
Tuppurainen, S.M. (2005). The detection of lumpy skin disease virus in samples of
experimentally infected cattle using different diagnostic techniques, Onderstepoort.
Journal of Veterinary Research, 72(2): 153-64.
Tuppurainen, E.S.M. and Oura C.A.L. (2012). Review: Lumpy Skin Disease: An
Emerging Threat to Europe, the Middle East and Asia. Transboundary and
Emerging Diseases, 59(1): 40 - 48.
Wallace, D. B., and Viljoen, G. J. (2005). Immune responses to recombinants of the South
African vaccine strain of lumpy skin disease virus generated by using thymidine
kinase gene insertion. Vaccine, 23(23): 3061-3067.
Page 86
71
Waret-Szkuta A., A. Ortiz-Pelaez, F. Roger, D.U. Pfeiffer and Guitian F.J. (2011).
Herd contact structure based on shared use of water points and grazing points in the
Highlands of Ethiopia. Epidemiology and Infections, 139(6): 875 – 885.
Weiss, K.E. (1968). Lumpy skin disease virus. Virology monographs, 3:111 – 131.
Woods, J. A. (1988). Lumpy skin disease—a review. Tropical Animal Health and
Production, 20(1): 11-17.
Yacob, H., B. Nesanet and Dinka A. (2008). Part II: Prevalence of major skin diseases in
cattle, sheep and goats at Adama Veterinary Clinic, Oromia regional state, Ethiopia.
Revue de Médecine Veterinaire, 159 (8-9): 455 - 461.
Yeruham, I., Nir, O., Braverman, Y., Davidson, M., Grinstein, H., Haymovitch, M.,
and Zamir, O. (1995). Spread of lumpy skin disease in Israeli dairy
herds. Veterinary Record, 137: 91 - 91.
Zelalem Abera, Hailu Degefu, Getachew Gari and Menbere Kidane (2015a). Sero-
prevalence of lumpy skin disease in selected districts of West Wollega zone,
Ethiopia. BMC Veterinary Research, 11:135
Zelalem Abera, Hailu, D., Getachew, G. and Zelalem Ayana (2015b). Review on
Epidemiology and Economic Importance of Lumpy Skin Disease. International
Journal of Basic and Applied Virology, 4(1): 8 – 21
Page 87
72
APPENDICES
Appendix 1: Questionnaire on risk factors for LSD and the economic impact of the
disease
Section A: INTRODUCTION
Date: _______________Subcounty: ________________Sub-Location: ______________
Village: ______________ Exact location (GPS coordinates): ______________________
Section B: FARM INFORMATION
1. What is the relationship of the respondent to the farm?
1= Owner 2 = Manager 3= Other (Specify) ________________
2. How do you control ticks?
1= Home spraying 2 = Communal cattle dip 3= Other (Specify) _______________
3. What is the frequency of acaricide dipping/spraying?
1= Twice a week 2 = Once a week 3= Biweekly 4= Other (Specify) ______________
4. How many cattle in total (plus calves) do you currently own? ________________
5. What breeds and number of cattle do you own in each of the following categories?
Breed No.
Lactating
No.
female
calves
No. Male
calves
No.
heifers
No. bulls No. dry
cows
Page 88
73
6. Has there been an outbreak of LSD in this farm? (You may refer to the pictures for
clinical presentation of LSD) ________________
1= Yes; 2=No
7. If yes, when did the LSD outbreak occur? ________________
8. What clinical signs of the Lumpy Skin Disease were seen/observed?
____________________________________________________________________
____________________________________________________________________
____________________________________________________________________
_________________________________________________________________________
9. How many cattle contracted the disease during the outbreak? ______________
10. What was the total number of cattle that died due to the disease outbreak? _________
11. What was the total number of cattle that recovered from the disease? ____________
12. What was the total number of unaffected cattle? ________________
13. For the cattle that died, what breed(s) and number were affected according to the
following categories?
Breed No.
Lactating
No.
female
calves
No. Male
calves
No.
heifers
No. bulls No. dry
cows
Page 89
74
14. For the cattle that died of LSD and were lactating, how much milk in litres were you
getting from them before they died of LSD? ________________
15. For the cattle that recovered from LSD and were lactating, how much milk in litres
per day were you getting from them before they were affected by LSD? ___________
16. How much milk in litres per day were you getting from the cows after they were
affected by LSD? ____________
17. How much milk in litres per day were you getting from the cows before the LSD
outbreak in the farm? ________________
18. Has there been any introduction of new cattle into the herd since Sept last year? ___
1=Yes; 2= No
19. If yes, when was it? (mm/yy) ________________
20. What was the purpose of the introduction? Select as many as applicable
1=Replacement animal; 2=Increasing the herd 3=Bull service
4= Other (Please specify) __________________
21. How many animals were introduced to the farm?
22. Where did the cattle come from? ________________
23. Have you ever carried out vaccination against LSD since 2016? ________________
1=Yes; 2=No
24. If yes, when was it carried out? ________________
25. How many animals were vaccinated? ______________
26. What was the cost of vaccination (Ksh/animal)? ________________
27. Did any of the vaccinated cattle contract LSD? ________________
1= Yes; 2=No
Page 90
75
28. If no vaccination was carried out, what was the reason for not vaccinating?
________________
29. Where do you always graze your cattle (Tick as many as possible)?
1. Grazing along the feeder roads
2. Grazing along the main roads
3. Grazing in shared post-harvest fields
4. Grazing in private land
5. Grazing in shared land
6. Zero-grazing
7. Tethering
8. Forest
9. Game reserve/park/conservancy
10. Other (Please specify) _____________________________________
30. Where do you always water your cattle (Tick as many as possible)?
1. Shared river
2. Shared dam/pond
3. Private access to river
4. Private dam/pond
5. Own borehole
6. Piped water
7. Harvested rain water
8. Other (Please specify) _______________________________________
31. What factor(s) do you think may have contributed or contributes to the disease outbreak in
this area? __________________________________________________________________
Page 91
76
32. How many cattle that contracted LSD were treated (for secondary bacterial infection and
wounds etc)? ________________
33. How much did you spend on the treatment of LSD per animal? ________________
34. If water for cattle is bought, how much do you spend per month________________
35. How many animals do you feed with the concentrate feed per day? ________________
36. How much in kg do you feed each animal per day________________
37. What is source of the forage/hay________________
38. How often do you buy forage ________________?
39. What amount of forage/hay do you buy________________?
40. Which means of breeding do you use? 1. Artificial insemination 2. Bull
41. How much did you pay for the last breeding? ________________
42. How much do you spend on hired labour per month________________?
43. What roles do the following family members play on cattle production? (Tick as many as
appropriate)
Father Mother Son(s) Daughter(s)
Spraying of cattle
Cattle herding
Fetching grass for the cattle
Cleaning the cattle shed
Fetching cattle water
Taking cattle to the water place
Cattle treatment
Page 92
77
Appendix 2: Unpaired T-test of continuous variables for case and control farm
groups in Nakuru County
Variabl
e
Group No.
of
Obser
vatio
ns
Mean Standard
Error
Standard
Deviatio
n
[95% Confidence
Interval]
Unpai
red
t-
test
(Ha:
Diffe
rence
! =
0)
Herd
size
Case farm 164 7 0.6 8.0 6 8
0.015 Control farm 40 11 2.1 13.0 7 15
Combined
case and
control
farms
204
8
0.7
9.3
7
9
Difference
-4 1.6
-7 -1
Vaccina
tion
per
animal
(Ksh/an
imal)
Case farm 41 46 5.3 34.1 35 57
0.829 Control farm 20 48 6.1 27.4 35 61
Combined
case and
control
farms
61
46
4.1
31.9
38
55
Difference
-2 8.8
-19 16
Vaccina
tion
per
farm
(Ksh/fa
rm)
Case farm 41 292 41.7 267.2 208 376
0.022 Control farm 20 865 340.5 1,522.9 152 1,577
Combined
case and
control
farms
61
480
118.4
925.0
243
717
Difference
-573 243.2
-1,060 -86
Cost of
concent
rates
(Ksh/fa
rm/day
Case farm 84 175 18.9 173.5 138 213
0.925 Control farm 26 179 33.0 168.3 111 247
Combined
case and
control
farms
110
176
16.4
171.6
144
209
Difference
-4 38.7
-80 73
Total
annual
cost of
forage
Case farm 67 29,097 5,442.0 44,544.4 18,232 39,963
0.563 Control farm 19 36,329 13,480.5 58,760.2 8,008 64,651
Combined
case and
control
farms
86
30,695
5,150.0
47,759.3
20,455
40,935
Difference
-7,232 12,462.2
-2,015 17,550
Cost of
AI
Case farm 93 1,548 102.5 988.8 1,345 1,752
0.516 Control farm 25 1,684 124.2 620.9 1,428 1,940
Page 93
78
Combined
case and
control
farms
118
1,577
84.9
922.5
1,409
1,745
Difference
-136
208.3
-548 277
Cost of
bull
insemin
ation
Case farm 13 342 50.6 182.4 232 453
0.957 Control farm 2 350 150.0 212.1 -1,556 2,256
Combined
case and
control
farms
15
343
46.0
178.2
245
442
Difference
-8 140.4
-311 296
Annual
cost of
labour
(Ksh/fa
rm/year
)
Case farm 60 55,400 4,004.3 31,017.3 47,387 63,413
0.033 Control farm 27 76,667 11,628.1 60,421.6 52,765 100,569
Combined
case and
control
farms
87
62,000
4,625.9
43,147.1
52,804
71,196
Difference
-1,267 9,789.5
-
40,731
- 1,803
Annual
cost of
water
(Ksh/fa
rm/year
)
Case farm 71 11,001 1,572.8 13,252.8 7,864 14,138
0.551 Control farm 17 13,239 3,929.8 16,203.0 4,908 21,570
Combined
case and
control
farms
88
11,433
1,470.9
13,798.2
8,510
14,357
Difference
-2,238 3,739.5
-9,672 5,196
Amounts
of
concent
rate
fed per
cow per
farm
per day
Case farm 84 2 0.1 1.0 2 2
0.926 Control farm 26 2 0.2 1.0 1 2
Combined
case and
control
farms
110
2
0.1
1.0
2
2
Difference
0 0.2
0 0
Appendix 3: Unpaired T-test of continuous variables for indigenous and exotic
breed groups of cattle in case farms only in Nakuru County
Variabl
e
Group No.
of
Obse
rvat
ions
Mean Standar
d Error
Standard
Deviatio
n
[95% Confidence
Interval]
Unpai
red
t-
test
(Ha:
Diffe
rence
! =
0)
Treatme
nt cost
Exotic breeds 29 5,003 1,136.5 6,120.4 2,675 7,332
0.595 Indigenous
breeds
8 3,715 1,969.9 5,571.7 - 943 8,373
Page 94
79
Combined exotic
and indigenous
breeds
37
4,725
979.0
5,954.8
2,739
6,710
Difference
1,288 2,402.0
-3,588 6,165
Vaccina
tion
per
animal
Exotic breeds 13 52 9.1 32.7 33 72
0.323 Indigenous
breeds
7
39
3.8
10.2
30
49
Combined exotic
and indigenous
breeds
20
48
6.1
27.4
35
61
Difference
13 12.8
-14 40
Vaccina
tion
per
farm
Exotic breeds 13 852 480.3
1,731.7
-194 1,899
0.962
Indigenous
breeds
7
888
438.4
1,160.0
-185
1,961
Combined exotic
and indigenous
breeds
20
865
340.5
1,522.9
152
1,577
Difference
- 36 733.5
-1,577 1,505
Cost of
treatme
nt per
animal
Exotic breeds 29 2,974 522.8 2,815.5 1,903 4,045
0.075 Indigenous
breeds
8
1,080
448.6
1,268.8
19
2,141
Combined exotic
and indigenous
breeds
37
2,565
438.2
2,665.2
1,676
3,453
Difference
1,894 1,030.9
- 199 3,987
Mortali
ty loss
per
farm
(Ksh/fa
rm)
Exotic breeds 31 9,835 3,752.3 20,892.1 2,172 17,499
0.175 Indigenous
breeds
10
621
600.9
1,900.1
-739
1,980
Combined exotic
and indigenous
breeds
41
7,588
2,897.5
18,553.3
1,732
13,444
Difference
9,215 6,672.1
-4,281 22,710
Mortali
ty loss
per
animal
(Ksh/an
imal/fa
rm)
Exotic breeds 31 2,142 914.4 5,091.4 274 4,009
0.197 Indigenous
breeds
10
11
10.1
32.1
-12
34
Combined exotic
and indigenous
breeds
41
1,622
703.6
4,505.5
200
3,044
Difference
2,131 1,624.0
-1,154 5,416
Level
of milk
product
ion
before
disease
(litres
/farm)
Exotic breeds 14 12 3.2 12.0 5 19
0.169 Indigenous
breeds
5
4
0.8
1.9
2
6
Combined exotic
and indigenous
breeds
19
10
2.5
10.9
5
15
Difference
8 5.5
- 4 19
Milk
product
ion
after
disease
(Litres
/farm)
Exotic breeds 14 2 0.6 2.1 1 3
0.636 Indigenous
breeds
5
3
0.8
1.7
0
5
Combined exotic
and indigenous
breeds
19
2
0.5
2.0
1
3
Difference
-1 1.1
-3 2
Exotic breeds 31 11,275 4,077.6 22,703.0 2,947 19,602
Page 95
80
Cost of
milk
loss
per
farm
(Ksh/fa
rm)
Indigenous
breeds
10
1,890
1,015.8
3,212.4
-408
4,188
0.204
Combined exotic
and indigenous
breeds
41
8,986
3,145.0
20,138.0
2,630
15,342
Difference
9,385 7,263.1
-5,306 24,076
Cost of
milk
loss
per
animal
per
farm
(Ksh/an
imal/fa
rm)
Exotic breeds 29 6,440 3,099.8 16,692.7 90 12,790
0.325 Indigenous
breeds
9
831
439.5
1,318.5
-183
1,844
Combined exotic
and indigenous
breeds
38
5,112
2,390.1
14,733.8
269
9,954
Difference
5,609 5,622.3
-5,793 17,012
Milk
drop
per
farm
due to
LSD
(litres
/farm)
Exotic breeds 14 10 3.0 11.4 3 16
0.124
Indigenous
breeds
5
2
0.7
1.5
0
3
Combined exotic
and indigenous
breeds
19
8
2.4
10.4
3
13
Difference
8 5.2
- 3 19
Appendix 4: Unpaired T-test of continuous variables for indigenous and exotic
breed groups of cattle in case and control farms in Nakuru County
Variabl
e
Group No.
of
Obse
rvat
ions
Mean Standard
Error
Standard
Deviatio
n
[95% Confidence
Interval]
Unpai
red
t-
test
(Ha:
Diffe
rence
! =
0)
Herd
size
Exotic breeds 136 7 0.7 8.3 5 8
0.003 Indigenous
breeds
69
11
1.3
10.6
8
13
Combined exotic
and indigenous
breeds
205
8
0.7
9.3
7
9
Difference
- 4 1.3
- 7 - 1
Vaccina
tion
per
animal
(Ksh/an
imal)
Exotic breeds 38 50 5.9 36.6 38 62
0.270 Indigenous
breeds
23
41
4.4
21.3
31
50
Combined exotic
and indigenous
breeds
61
46
4.1
31.9
38
55
Difference
9 8.4
- 7 26
Vaccina
tion
per
farm
(Ksh/fa
rm)
Exotic breeds 38 477 169.6 1,045.2 134 821
0.980 Indigenous
breeds
23
484
146.8
704.2
179
788
Combined exotic
and indigenous
breeds
61
480
118.4
925.0
243
717
Page 96
81
Difference
- 6 246.4
-499 487
Cost of
concent
rates
(Ksh/fa
rm/day
Exotic breeds 106 179 16.9 173.7 146 213
0.362 Indigenous
breeds
4
99
35.6
71.3
-14
212
Combined exotic
and indigenous
breeds
110
176
16.4
171.6
144
209
Difference
80 87.4
- 93 253
Total
annual
cost of
forage
Exotic breeds 46 36,355 8,727.0 59,189.6 18,778 53,932
0.241 Indigenous
breeds
40
24,186
4,603.5
29,114.9
14,875
33,498
Combined exotic
and indigenous
breeds
86
30,695
5,150.0
47,759.3
20,455
40,935
Difference
12,169 10,301.3
-8,316 32,654
Cost of
AI
insemin
ation
Exotic breeds 114 1,592 87.6 935.0 1,419 1,766
0.348 Indigenous
breeds
4
1,150
50.0
100.0
991
1,309
Combined exotic
and indigenous
breeds
118
1,577
84.9
922.5
1,409
1,745
Difference
442 469.5
-488 1,372
Cost of
bull
insemin
ation
Exotic breeds 11 355 51.1 169.5 241 468
0.702 Indigenous
breeds
4
313
112.5
225.0
-46
671
Combined exotic
and indigenous
breeds
15
343
46.0
178.2
245
442
Difference
42 107.3
-190 274
Annual
cost of
labour
(Ksh/fa
rm/year
)
Exotic breeds 67 65,373 5,637.8 46,147.6 54,117 76,629
0.184 Indigenous
breeds
20
50,700
6,536.2
29,230.7
37,020
64,380
Combined exotic
and indigenous
breeds
87
62,000
4,625.9
43,147.1
52,804
71,196
Difference
14,673 10,943.4
-7,085 36,432
Annual
cost of
water
(Ksh/fa
rm/year
)
Exotic breeds
77
12,365
1,648.0
14,461.3
9,083
15,648
0.094
Indigenous
breeds
11
4,909
1,108.1
3,675.0
2,440
7,378
Combined exotic
and indigenous
breeds
88
11,433
1,470.9
13,798.2
8,510
14,357
Difference
7,456 4,400.5
-1,292 16,204
Amounts
of
concent
rate
fed per
cow per
farm
per day
Exotic breeds 106 2 0.1 1.0 2 2
0.465 Indigenous
breeds
4
2
0.3
0.6
1
2
Combined exotic
and indigenous
breeds
110
2
0.1
1.0
2
2
Difference
0 0.5
- 1 1
Page 97
82
Appendix 5: Logistic regression results of some of farm practices in Nakuru County,
Kenya
Variab
le
Variabl
e
levels
Cas
es
Con
tro
ls
Tot
al
%
case
s
%
cont
rols
%
Tota
l
Odd
s
Rat
io
Std
.
Err
.
z P>z [95%Conf.
Interval]
Relati
onshi
p
statu
s of
respo
ndent
Owner* 33 131 164 80.5 79.9 80.0
Manager 7 15 22 17.1 9.1 10.7 2.3 1.2 1.5 0.12 0.8 6.5
Other
(Daught
er, son
or wife
of the
owner)
1 18 19 2.4 11.0 9.3 0.1 0.2 -
1.7
0.09 0.0 1.3
Farms
sourc
ing
labou
r
from
outsi
de
the
farm
No* 14 150 164 34.1 91.5 80.0
Yes 27 14 41 65.9 8.5 20.0 4.2 1.7 3.6 0 1.9 9.3
Acaric
ide
contr
ol of
ticks
Sprayin
g at
home*
37 159 196 90.2 97.0 95.6
Dipping
at the
communi
ty dip
4 5 9 9.8 3.0 4.4 3.7 2.9 1.7 0.10 0.8 17.3
Freque
ncy
of
acari
cide
appli
catio
n
Biweekl
y*
2 4 6 4.9 2.4 2.9
Weekly 24 109 133 58.5 66.5 64.9 0.4 0.3 -
1.1
0.29 0.1 2.3
Every
two
weeks
7 28 35 17.1 17.1 17.1 0.4 0.4 -
0.8
0.40 0.1 3.2
Every
three
weeks
0 2 2 0.0 1.2 1.0
Monthly 6 10 16 14.6 6.1 7.8 1.0 1.1 0.0 0.98 0.1 8.8
Every
two
months
2 1 3 4.9 0.6 1.5 3.3 5.2 0.7 0.46 0.1 76.4
Every
three
months
0 1 1 0.0 0.6 0.5
Rarely 0 5 5 0.0 3.0 2.4
Never 0 4 4 0.0 2.4 2.0
Purpos
e of
intro
ducti
on of
new
anima
ls
Bull
service
0 1 1 0.0 0.6 5.9
Increas
ing the
herd
5 1 15 12.2 0.6 88.2
Replace
ment
animal
0 1 1 0.0 0.6 5.9
Page 98
83
Appendix 6: What farmers think are the factors that cause LSD outbreak in the
area
Factor Number
of
respons
es from
case
farms
Number of
responses
from
control
farms
Total
respon
ses
Percent
of
response
s from
case
farms
Percent
of
response
s from
control
farms
Percent
of
total
respons
es
Unknown 24 84 108 82.8 77.8 78.8
Mixing of affected
with unaffected
ones along the road
1 5 6 3.4 4.6 4.4
Spread by wind 0 5 5 0.0 4.6 3.6
Biting flies 2 3 5 6.9 2.8 3.6
There was an
outbreak in the
area
0 3 3 0.0 2.8 2.2
Cows from Loruk in
Baringo and Pokot
going to Marigat,
Mogotio, Nakuru and
KMC passing through
the area
0 1 1 0.0 0.9 0.7
Drought making the
cattle weak
0 1 1 0.0 0.9 0.7
Ticks 0 1 1 0.0 0.9 0.7
May have been
caused by Maasai
cattle which were
grazing around the
area
0 1 1 0.0 0.9 0.7
Maybe from the bush 1 0 1 3.4 0.0 0.7
Mixing of cattle
with cattle from
Narok when grazing
on the road
0 1 1 0.0 0.9 0.7
New animal in the
farm and movement
to the dip
0 1 1 0.0 0.9 0.7
Taking the animal
for bull service
0 1 1 0.0 0.9 0.7
The cow must have
come with it from
the market I bought
it from
0 1 1 0.0 0.9 0.7
Vaccinators
vaccinating using
the same needle
from infected herds
1 0 1 3.4 0.0 0.7
Page 99
84
Appendix 7: Herd structure and sizes in case and control farms in Nakuru County
at individual animal level
Breed Category Case farms
(n=448)
Control farms
(n=1,183)
p-value
Exotic
(n=734)
Lactating (n=272) 0.18 (0.14,0.21) 0.16 (0.14, 0.18) 0.57
Female calves
(n=110) 0.07 (0.05,0.10) 0.07 (0.05, 0.08) 0.61
Male calves (n=68) 0.04 (0.02,0.06) 0.04 (0.03, 0.05) 0.74
Heifers (n=182) 0.09 (0.06,0.11) 0.12(0.10, 0.14) 0.07
Dry cows (n=56) 0.03 (0.01,0.04) 0.04 (0.03, 0.05) 0.57
Bulls (n=46) 0.04 (0.02,0.06) 0.02 (0.01, 0.03) 0.05
Indigenous
(n=739)
Lactating (n=189) 0.10 (0.07,0.13) 0.12 (0.10, 0.14) 0.20
Female calves
(n=95) 0.04 (0.03,0.06) 0.06 (0.05, 0.08) 0.19
Male calves (n=71) 0.05 (0.03,0.07) 0.04 (0.03, 0.05) 0.79
Heifers (n=174) 0.15 (0.11,0.18) 0.09 (0.07, 0.11) 0.00
Dry cows (n=107) 0.06 (0.03,0.07) 0.07 (0.05, 0.08) 0.38
Bulls (n=103) 0.09 (0.06,0.11) 0.05 (0.04, 0.07) 0.02
Farms
keeping
both Exotic
and
indigenous
cattle
breeds
(n=158)
Lactating (n=28) 0.01 (0.00,0.02) 0.02 (0.01, 0.03) 0.61
Female calves
(n=19) 0.01 (0.00,0.02) 0.01 (0.01, 0.02) 0.71
Male calves (n=12) 0.00(-0.00,0.01) 0.01 (0.00, 0.01) 0.61
Heifers (n=70) 0.03 (0.02,0.05) 0.05 (0.04, 0.06) 0.20
Dry cows (n=7) 0.00 (0, 0) 0.01 (0.00, 0.01) 0.23
Bulls (n=22) 0.02 (0.00,0.03) 0.01 (0.01, 0.02) 0.83
Appendix 8: T test results for mean differences for continuous variables associated
with cattle management in Nakuru County
Parameter Case farms Control farms p-
value
Total cost of vaccination per
farm (Ksh) (n=20,41)
865 (152, 1,577) 292 (208, 376) 0.02
Number of animals vaccinated per
farm (n=20,41)
15 (7, 23) 7 (5, 9) 0.02
Amount of concentrates fed per
animal per day (kg) (n=26,84)
1.20 (1.48, 2.29) 0.95 (1.64,
2.09)
0.25
Daily cost of concentrates per
farm (Ksh) (n= 26, 84)
179 (111, 247) 175 (138, 213) 0.93
Monthly cost of forage per farm
(Ksh) (n=19,67)
3027 (667, 5,388) 2425 (1,519,
3,330)
0.56
Monthly cost of hired labour per
farm (Ksh) (n=27, 60)
6,389 (4,397,
8,381)
4,617 (3949,
5,284)
0.03
Monthly cost of water per farm
(Ksh) (n=17,71)
1,103 (409, 1,797) 917 (655, 1,178) 0.55
Page 100
85
Cost of bull insemination per
farm (Ksh) (n=2,13)
350 (-1,556,
2,256)
342 (232, 453) 0.98
Cost of AI insemination per farm
(Ksh) (n=25, 93)
1,684 (1,428,
1,940)
1,548 (1345,
1752)
0.52
Number of animals treated against
diseases per farm (n=37, 35)
3 (2, 4) 2 (1, 3) 0.56
Number of animals that died per
farm per year (n=8, 8)
3 (1, 5) 3 (0, 5) 0.71
Herd sizes (n=40, 164) 11 (7, 15) 7 (6, 8) 0.02
Cost of treatment of sick cattle
(Ksh) (n=37, 25)
4,725 (2,739,
6,710)
2,867(1,921,
3,813)
0.14
Milk production before disease
(litres) (n=19, 22)
10 (5, 15) 11 (8, 14) 0.69
Milk production after disease
(litres) (n=19, 9)
2 (1, 3) 5 (0, 10) 0.06
Exchange rate: 1USD=101Ksh
Appendix 9: The roles played by family members in cattle production in Nakuru
County
Family
member
Activity Case farms
Control farms
p-
value
Mother
(n=18,
119)
Taking cattle to the water
place (n=5, 40)
0.28(-
0.03,0.27)
0.34 (0.25,
0.42)
0.82
Cattle herding (n=5, 37) 0.28 (-
0.03,0.27)
0.31 (0.23,
0.39)
0.99
Fetching cattle water (n=3,
9)
0.17(-
0.05,0.19)
0.08 (0.03,
0.12)
0.41
Spraying of cattle (n=3, 33) 0.17(-
0.05,0.19)
0.28 (0.20,
0.36)
0.48
Other activities (n=0, 4) 0 (0) 0.03(0.00,0.07) 0.97
Cleaning the cattle shed
(n=9, 41)
0.50(0.03,0.41) 0.34(0.26,0.43) 0.31
Fetching grass for the cattle
(n=5, 41)
0.28(-
0.03,0.27)
0.34(0.26,0.43) 0.77
Milking (n=14, 101) 0.78(0.12,0.56) 0.85(0.78,0.91) 0.68
Treatment of uncomplicated
conditions (n=1, 9)
0.06(-
0.05,0.10)
0.08(0.03,0.12) 1.00
Father
(n=18,
83)
Taking cattle to the water
place (n=7, 18)
0.39(0.16,0.61) 0.22(0.13,0.31) 0.22
Cattle herding (n=5, 18) 0.28(0.07, 048) 0.22(0.13,0.31) 0.80
Fetching cattle water (n=3,
8)
0.17(-
0.01,0.34)
0.10(0.03,0.16) 0.65
Spraying of cattle (n=16,71) 0.89(0.74,1.03) 0.86(0.78,0.93) 1.00
Cleaning the cattle shed
(n=8, 32)
0.44(0.21,0.67) 0.39(0.28,0.49) 0.84
Fetching grass for the cattle
(n=6,33)
0.33(0.12,0.55) 0.40(0.29,0.50) 0.81
Page 101
86
Milking (n=8, 32) 0.44(0.21,0.67) 0.39(0.28,0.49) 0.84
Cattle treatment (n=2,21) 0.11(-
0.03,0.26)
0.25(0.16,0.35) 0.32
Daughte
r/Girls
(n= 11,
37)
Taking cattle to the water
place (n=5, 12)
0.45(0.16,0.75) 0.32(0.17,0.48) 0.66
Cattle herding (n=4, 13) 0.36(0.08,0.65) 0.35(0.20,0.51) 1.00
Fetching cattle water (n=1,
1)
0.09(-
0.08,0.26)
0.03(-
0.03,0.08)
0.94
Spraying of cattle (n=0, 3) 0 (0) 0.08 (-
0.01,0.17)
0.79
Cleaning the cattle shed
(n=5, 9)
0.45(0.16,
0.75)
0.24(0.10,0.38) 0.33
Fetching grass for the cattle
(n=2, 8)
0.18(-
0.05,0.41)
0.22(0.08,0.35) 1.00
Milking (n=9, 18) 0.82(0.59,1.05) 0.49(0.33,0.65) 0.11
Son/Boy
s
(n=24,
82)
Taking cattle to the water
place (n=10, 32)
0.42(0.22,0.61) 0.39(0.28,0.50) 1.00
Cattle herding (n=14, 43) 0.58(0.39,0.78) 0.52(0.42,0.63) 0.78
Fetching cattle water (n=5,
4)
0.21(0.05,0.37) 0.05(0.00,0.10) 0.04
Spraying of cattle (n=13, 40) 0.54(0.34,0.74) 0.49(0.38,0.60) 0.82
Cleaning the cattle shed
(n=10, 24)
0.42(0.22,0.61) 0.29(0.19,0.39) 0.37
Fetching grass for the cattle
(n=7, 19)
0.29(0.11,0.47) 0.23(0.14,0.32) 0.74
Milking (n=13, 29) 0.54(0.34,0.74) 0.35(0.25,0.46) 0.16
Cattle treatment (n=0, 7) 0(0) 0.09(0.02,0.15) 0.31
Page 102
87
Appendix 10: Market prices of cattle, cattle products and cost of some inputs in
Nakuru County
Parameter description Parameters Value Source
Cost of cattle
production
Cost of feed and
management
(Ksh/farm/month)
18,722 Household survey
Salvage value of meat Value of meat
(Ksh/animal)
2,405 Household survey
Cattle hides (Ksh/kg) Value of hides grade 1
to 3
25a
38b
aSCVO reports bSlaughterhouse/slabs
survey
Value of hides grade 4 15 SCVO reports
Value of hides rejected
hides (e.g. LSD affected
hide)
10 Slaughterhouse/slabs
survey
Direct costs for
control of LSD (Ksh)
Treatment cost per
animal
2562 Household survey
Vaccination cost per
animal
46 Household survey
Market prices for
indigenous cattle
(Ksh)
Cows 15,066 Livestock market
survey
Heifers 18,562 Livestock market
survey
Calves 2,000 Livestock market
survey
Bulls 15,676 Livestock market
survey
Market prices for
exotic cattle (Ksh)
Cows 70,000 Farm survey
Heifers 70,000 Farm survey
Female calves 5000 Farm survey
Male calves 3,500 Farm survey
Bulls 30,000 Farm survey
Market prices for
cattle products and
inputs
Milk (Sh/litre) 36 Household survey
Beef (Sh/kg) 400 Butchery survey
Dairymeal (Sh/kg) 33 Agrovets survey
Exchange rate: 1USD=101Ksh