30
ECONOMIC IMPACT OF THE FOREIGN-OWNED SECTOR IN IRELAND Part of the Economic Impact Assessment of Ireland’s Corporation Tax Policy OCTOBER 2014

ECONOMIC IMPACT OF THE FOREIGN-OWNED SECTOR IN IRELAND Part of the Economic Impact Assessment of Ireland’s Corporation Tax Policy
OCTOBER 2014
ECONOMIC IMPACT OF THE FOREIGN-OWNED SECTOR IN IRELAND
Part of the Economic Impact Assessment of
Ireland’s Corporation Tax Policy
Department of Finance October 2014
Department of Finance Government Buildings, Upper Merrion Street, Dublin 2, Ireland Website: www.finance.gov.ie

Contents >
Executive Summary .................................................................................................................... 2
1. Introduction ..........................................................................................................................
2. Macroeconomic size and impact of FDI/foreign-owned sector ......................................... 6
3. Key features of foreign-owned sector and comparisons with indigenous sector ............ 18
Department of Finance | Impact of Foreign-Owned Sector – Economic Impact Assessment of Ireland’s Corporation Tax Policy Page 2
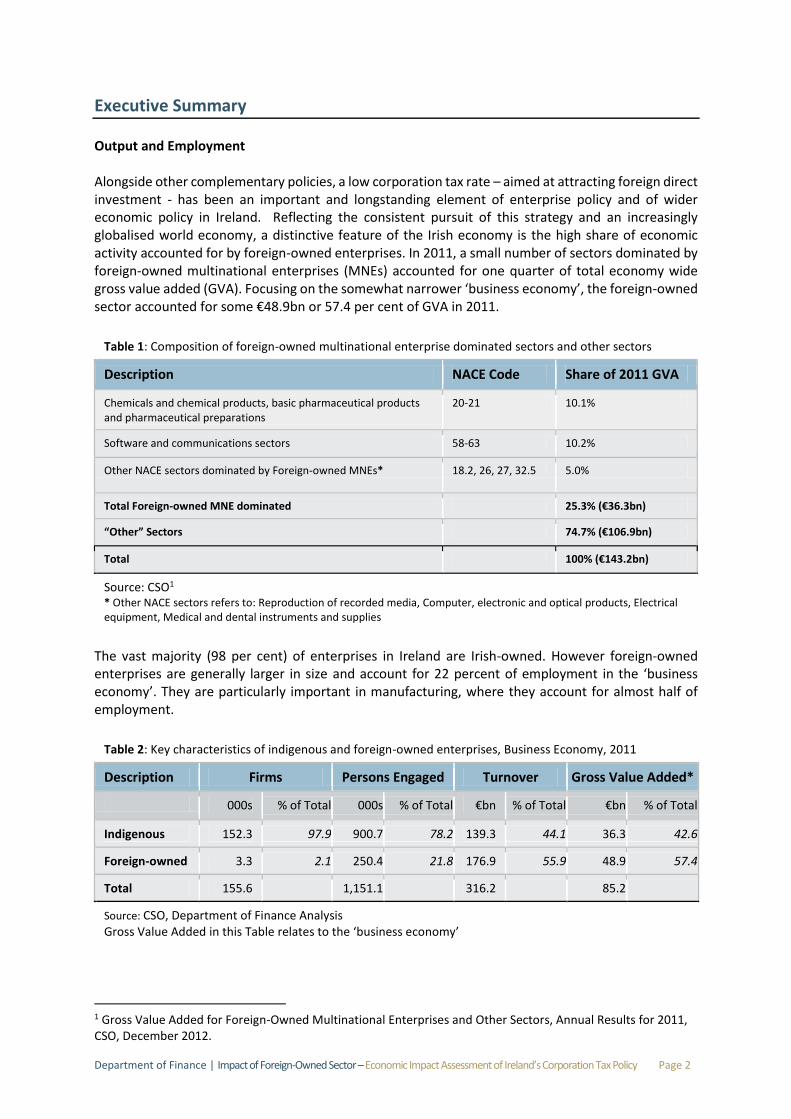
Executive Summary Output and Employment Alongside other complementary policies, a low corporation tax rate – aimed at attracting foreign direct investment - has been an important and longstanding element of enterprise policy and of wider economic policy in Ireland. Reflecting the consistent pursuit of this strategy and an increasingly globalised world economy, a distinctive feature of the Irish economy is the high share of economic activity accounted for by foreign-owned enterprises. In 2011, a small number of sectors dominated by foreign-owned multinational enterprises (MNEs) accounted for one quarter of total economy wide gross value added (GVA). Focusing on the somewhat narrower ‘business economy’, the foreign-owned sector accounted for some €48.9bn or 57.4 per cent of GVA in 2011.
Table 1: Composition of foreign-owned multinational enterprise dominated sectors and other sectors
Description NACE Code Share of 2011 GVA
Chemicals and chemical products, basic pharmaceutical products and pharmaceutical preparations
20-21 10.1%
Software and communications sectors 58-63 10.2%
Other NACE sectors dominated by Foreign-owned MNEs* 18.2, 26, 27, 32.5 5.0%
Total Foreign-owned MNE dominated 25.3% (€36.3bn)
“Other” Sectors 74.7% (€106.9bn)
Total 100% (€143.2bn)
Source: CSO1 * Other NACE sectors refers to: Reproduction of recorded media, Computer, electronic and optical products, Electrical equipment, Medical and dental instruments and supplies
The vast majority (98 per cent) of enterprises in Ireland are Irish-owned. However foreign-owned enterprises are generally larger in size and account for 22 percent of employment in the ‘business economy’. They are particularly important in manufacturing, where they account for almost half of employment.
Table 2: Key characteristics of indigenous and foreign-owned enterprises, Business Economy, 2011
Description Firms Persons Engaged Turnover Gross Value Added*
000s % of Total 000s % of Total €bn % of Total €bn % of Total
Indigenous 152.3 97.9 900.7 78.2 139.3 44.1 36.3 42.6
Foreign-owned 3.3 2.1 250.4 21.8 176.9 55.9 48.9 57.4
Total 155.6 1,151.1 316.2 85.2
Source: CSO, Department of Finance Analysis Gross Value Added in this Table relates to the ‘business economy’
1 Gross Value Added for Foreign-Owned Multinational Enterprises and Other Sectors, Annual Results for 2011, CSO, December 2012.
Department of Finance | Impact of Foreign-Owned Sector – Economic Impact Assessment of Ireland’s Corporation Tax Policy Page 3
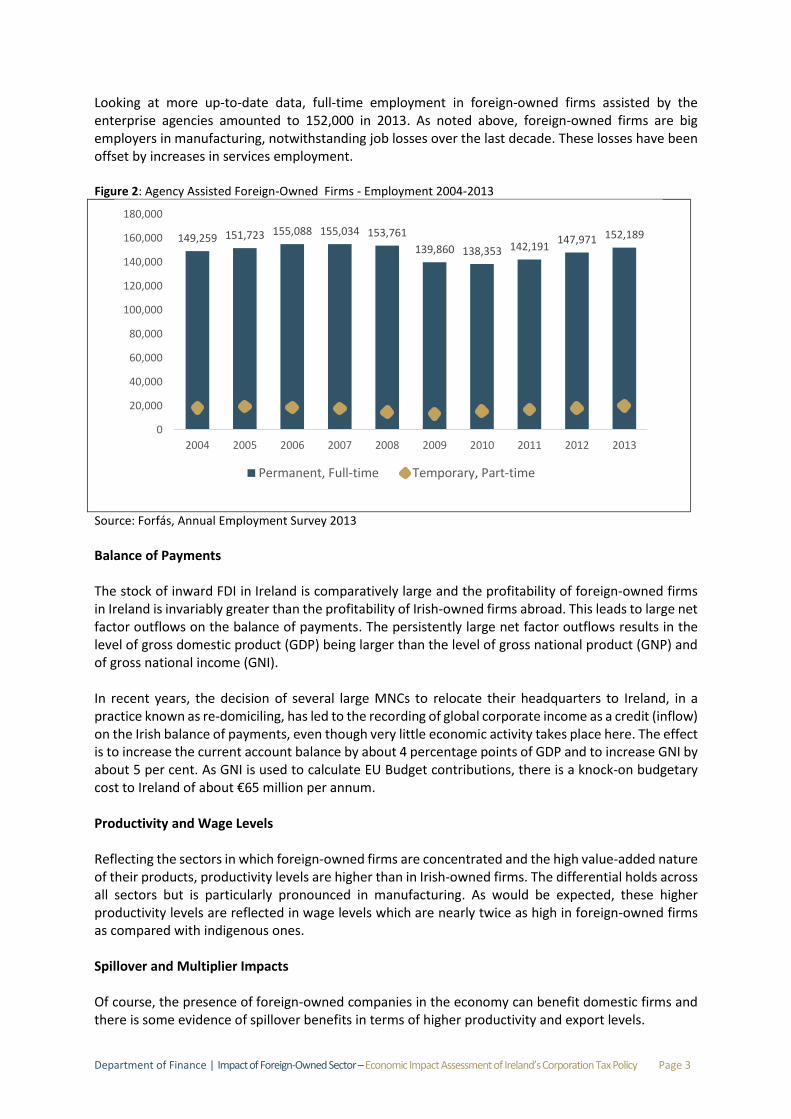
Looking at more up-to-date data, full-time employment in foreign-owned firms assisted by the enterprise agencies amounted to 152,000 in 2013. As noted above, foreign-owned firms are big employers in manufacturing, notwithstanding job losses over the last decade. These losses have been offset by increases in services employment. Figure 2: Agency Assisted Foreign-Owned Firms - Employment 2004-2013
Source: Forfás, Annual Employment Survey 2013
Balance of Payments The stock of inward FDI in Ireland is comparatively large and the profitability of foreign-owned firms in Ireland is invariably greater than the profitability of Irish-owned firms abroad. This leads to large net factor outflows on the balance of payments. The persistently large net factor outflows results in the level of gross domestic product (GDP) being larger than the level of gross national product (GNP) and of gross national income (GNI). In recent years, the decision of several large MNCs to relocate their headquarters to Ireland, in a practice known as re-domiciling, has led to the recording of global corporate income as a credit (inflow) on the Irish balance of payments, even though very little economic activity takes place here. The effect is to increase the current account balance by about 4 percentage points of GDP and to increase GNI by about 5 per cent. As GNI is used to calculate EU Budget contributions, there is a knock-on budgetary cost to Ireland of about €65 million per annum. Productivity and Wage Levels Reflecting the sectors in which foreign-owned firms are concentrated and the high value-added nature of their products, productivity levels are higher than in Irish-owned firms. The differential holds across all sectors but is particularly pronounced in manufacturing. As would be expected, these higher productivity levels are reflected in wage levels which are nearly twice as high in foreign-owned firms as compared with indigenous ones. Spillover and Multiplier Impacts Of course, the presence of foreign-owned companies in the economy can benefit domestic firms and there is some evidence of spillover benefits in terms of higher productivity and export levels.
149,259 151,723 155,088 155,034 153,761
139,860 138,353 142,191147,971 152,189
0
20,000
40,000
60,000
80,000
100,000
120,000
140,000
160,000
180,000
2004 2005 2006 2007 2008 2009 2010 2011 2012 2013
Permanent, Full-time Temporary, Part-time
Department of Finance | Impact of Foreign-Owned Sector – Economic Impact Assessment of Ireland’s Corporation Tax Policy Page 4
When the small group of sectors that are dominated by foreign-owned MNEs are grouped together as a single “foreign” sector, overall output and employment multipliers for the combined “sector” can be estimated. The multiplier impacts of the rest of the economy, considered as a single combined sector, are higher than those of the foreign-dominated sector. This reflects the higher productivity levels and import intensity of the latter.
Table 3: Type 1 multiplier and employment effect of foreign MNE dominated sectors and rest of economy
Sector Output Multiplier Employment effect
Foreign-dominated 1.2 3
Rest of economy 1.4 10
Source: Department of Finance Analysis
Note: The multiplier effect is the marginal whole-economy impact on output of an increase in final demand for either sector’s products The employment effect is the marginal economy-wide impact on employment of a €1m increase in demand in a sector
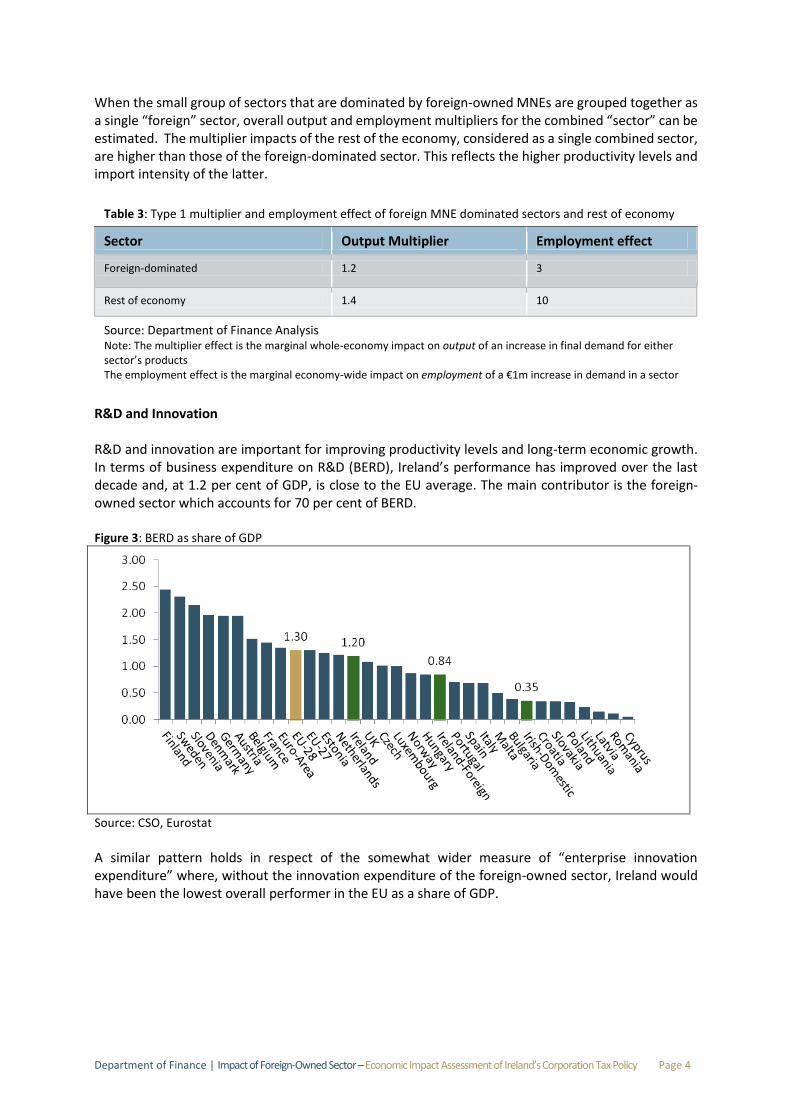
R&D and Innovation R&D and innovation are important for improving productivity levels and long-term economic growth. In terms of business expenditure on R&D (BERD), Ireland’s performance has improved over the last decade and, at 1.2 per cent of GDP, is close to the EU average. The main contributor is the foreign-owned sector which accounts for 70 per cent of BERD. Figure 3: BERD as share of GDP
Source: CSO, Eurostat A similar pattern holds in respect of the somewhat wider measure of “enterprise innovation expenditure” where, without the innovation expenditure of the foreign-owned sector, Ireland would have been the lowest overall performer in the EU as a share of GDP.
Department of Finance | Impact of Foreign-Owned Sector – Economic Impact Assessment of Ireland’s Corporation Tax Policy Page 5
1. Introduction Since the late 1950s, policy in Ireland has consistently sought to open-up the economy to the opportunities afforded by free trade, international capital mobility, EU membership and globalisation. Over the decades, key elements of this strategy have included the expansion of second and third level education from the 1960s onwards, the adoption of the euro in 1999 and the upgrading of transport and other public investment (aided by EU Structural and Cohesion Funds) in the 1990s and 2000s. A particularly longstanding element of this strategy has been a low corporation tax rate, a cornerstone of industrial and enterprise policy aimed at attracting foreign direct investment. The consistent pursuit of this policy approach has helped transform Ireland’s industrial base from a small, inefficient, protected domestic sector to a thriving, highly productive and innovative industrial and internationally-traded services sector with a large foreign-owned share. Through an analysis of the overall macroeconomic significance of the foreign-owned sector and some of its key features, this paper contributes to an understanding of the significance and impact of Ireland’s corporation tax regime. This paper, which was authored by Shane Enright, Brendan O’Connor and Mary Dalton, of the Department of Finance Economics Division,2 is part of a wider review of the corporation tax regime undertaken by the Department of Finance. Topics covered in this paper include the direct impacts of the sector in terms of output, employment and other macroeconomic aggregates such as the balance of payments. The paper also considers features such as productivity levels, indirect spillover and multiplier impacts, and levels of R&D and innovation expenditure. Chapter 2 focuses on the macroeconomic size and impact of the foreign-owned sector in terms of gross value added, employment and international trade and factor flows as captured by the balance of payments. The discussion on employment looks at the share of foreign-owned and indigenous employment in sectors as well as recent trends in employment in the foreign-owned sector. The chapter concludes with an examination of the domestic value added content of exports and the impacts that the large foreign-owned sector has on international factor flows and the balance of payments. Chapter 3 then looks at some of the key features of the foreign-owned sector such as productivity levels, indirect spillover and multiplier impacts, and R&D and innovation levels relative to the indigenous sector.
2 The authors would like to acknowledge the helpful comments provided on earlier drafts from John McCarthy, David Hegarty (both Department of Finance), Diarmaid Smyth (Central Bank of Ireland), Eddie Casey (Irish Fiscal Advisory Council) and members of the Department of Finance Policy Committee. The authors are grateful for data and insights provided by the Central Statistics Office, in particular Susana Portillo. All mistakes or errors remain the responsibility of the authors.
Department of Finance | Impact of Foreign-Owned Sector – Economic Impact Assessment of Ireland’s Corporation Tax Policy Page 6
1. Macroeconomic size and impact of FDI/foreign-owned sector
Section Summary
The share of foreign-owned firms in Irish economic activity is large in comparative terms, accounting for about a quarter of overall economic activity by some measures, and the majority of GVA generated in the business economy.
The vast majority of enterprises in Ireland are Irish-owned although the distribution varies across sectors. Foreign-owned enterprises are generally larger employers, and account for half of all employment in manufacturing.
Full-time employment in foreign-owned agency-assisted firms, a subset of overall foreign sector employment, amounted to 152,000 in 2013. Over the last decade or so manufacturing agency-assisted firms have seen a loss of about 15 per cent in full-time employment. This has largely been offset by employment growth in the services sector, with increases in most services sub-sectors.
Due to a high import content of exports, the value added share of exports in Ireland, at 58 percent, is low relative to other economies. Larger, closed economies display much higher ratios with the United States having a domestic value-added share of about 90 per cent.
The large stock of inward FDI has led to persistently large net factor outflows on the balance of payments. As a result, the level of Irish gross domestic product (GDP) is persistently larger than gross national product (GNP) and gross national income (GNI).
In recent years, the move of several large MNCs to ‘re-domicile’ their headquarters to Ireland has led to the recording of their global corporate income as an inflow on the Irish balance of payments, even if very little economic activity takes place or is recorded in Ireland. A knock-on effect of this is to increase Ireland's EU budget contribution by about €65 million per annum.
Introduction Irish industrial policy has targeted inward direct investment since the 1950s and the share of output now accounted for by foreign-owned multinationals is large by international standards. This section will discuss the impact on the main macroeconomic aggregates, employment, sectoral output and the balance of payments. Firm Characteristics and Gross Value Added The characteristics of foreign-owned and domestic enterprises in Ireland are very different across a range of dimensions. The CSO ‘Business in Ireland 20113’ publication provides a range of information on enterprise activity broken down by Irish and non-Irish enterprises. The data are drawn from administrative sources and surveys of manufacturing and services enterprises. Broadly speaking, it measures the business economy. As such it excludes agriculture, most self-employment, the public sector and some financial services activity. The analysis below is static in nature and refers to activity in 2011. Table 4 below sets out the main characteristics of indigenous firms compared to foreign-owned ones.
3 Business in Ireland 2011, CSO, November 2013.
Department of Finance | Impact of Foreign-Owned Sector – Economic Impact Assessment of Ireland’s Corporation Tax Policy Page 7
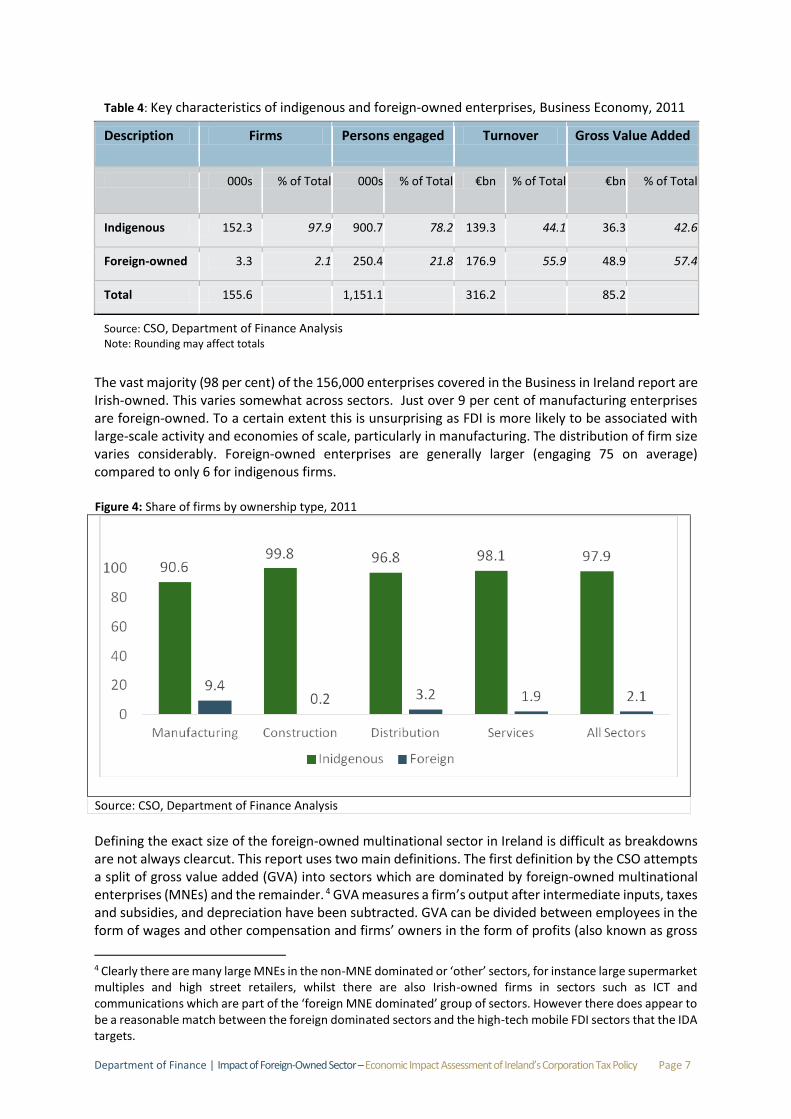
Table 4: Key characteristics of indigenous and foreign-owned enterprises, Business Economy, 2011
Description Firms Persons engaged Turnover Gross Value Added
000s % of Total 000s % of Total €bn % of Total €bn % of Total
Indigenous 152.3 97.9 900.7 78.2 139.3 44.1 36.3 42.6
Foreign-owned 3.3 2.1 250.4 21.8 176.9 55.9 48.9 57.4
Total 155.6 1,151.1 316.2 85.2
Source: CSO, Department of Finance Analysis Note: Rounding may affect totals
The vast majority (98 per cent) of the 156,000 enterprises covered in the Business in Ireland report are Irish-owned. This varies somewhat across sectors. Just over 9 per cent of manufacturing enterprises are foreign-owned. To a certain extent this is unsurprising as FDI is more likely to be associated with large-scale activity and economies of scale, particularly in manufacturing. The distribution of firm size varies considerably. Foreign-owned enterprises are generally larger (engaging 75 on average) compared to only 6 for indigenous firms. Figure 4: Share of firms by ownership type, 2011
Source: CSO, Department of Finance Analysis
Defining the exact size of the foreign-owned multinational sector in Ireland is difficult as breakdowns are not always clearcut. This report uses two main definitions. The first definition by the CSO attempts a split of gross value added (GVA) into sectors which are dominated by foreign-owned multinational enterprises (MNEs) and the remainder. 4 GVA measures a firm’s output after intermediate inputs, taxes and subsidies, and depreciation have been subtracted. GVA can be divided between employees in the form of wages and other compensation and firms’ owners in the form of profits (also known as gross
4 Clearly there are many large MNEs in the non-MNE dominated or ‘other’ sectors, for instance large supermarket multiples and high street retailers, whilst there are also Irish-owned firms in sectors such as ICT and communications which are part of the ‘foreign MNE dominated’ group of sectors. However there does appear to be a reasonable match between the foreign dominated sectors and the high-tech mobile FDI sectors that the IDA targets.
Department of Finance | Impact of Foreign-Owned Sector – Economic Impact Assessment of Ireland’s Corporation Tax Policy Page 8
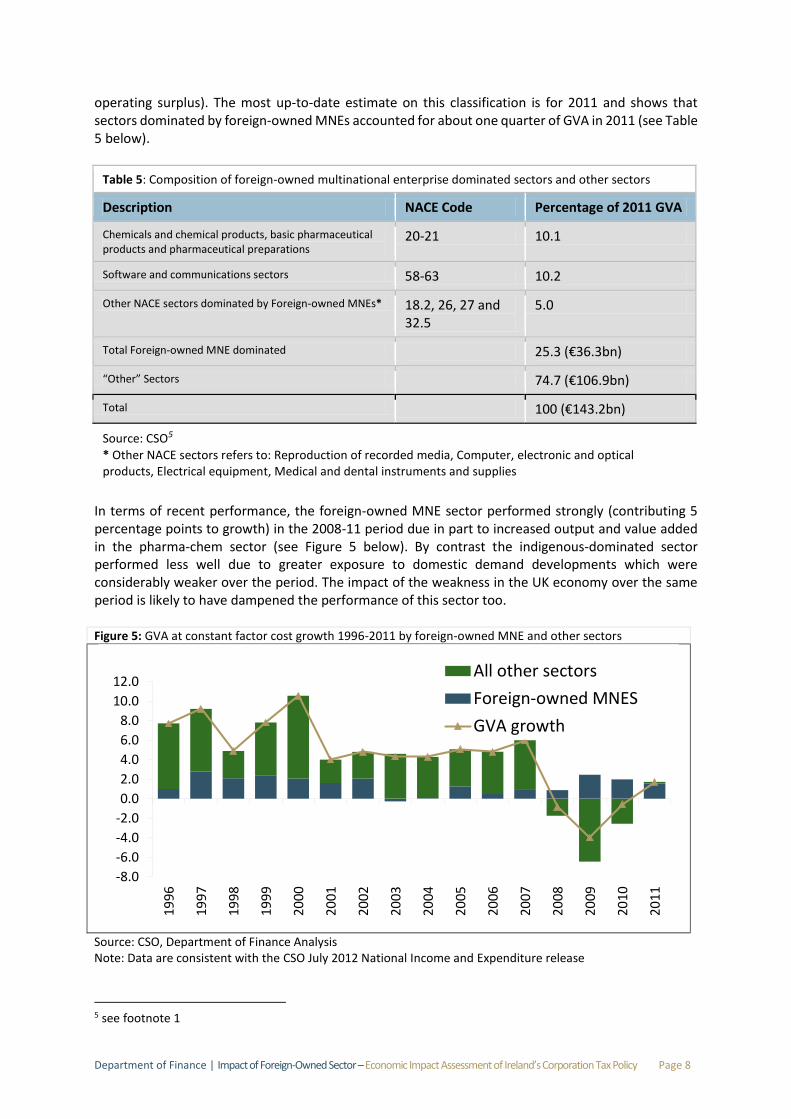
operating surplus). The most up-to-date estimate on this classification is for 2011 and shows that sectors dominated by foreign-owned MNEs accounted for about one quarter of GVA in 2011 (see Table 5 below).
Table 5: Composition of foreign-owned multinational enterprise dominated sectors and other sectors
Description NACE Code Percentage of 2011 GVA
Chemicals and chemical products, basic pharmaceutical products and pharmaceutical preparations
20-21 10.1
Software and communications sectors 58-63 10.2
Other NACE sectors dominated by Foreign-owned MNEs* 18.2, 26, 27 and 32.5
5.0
Total Foreign-owned MNE dominated 25.3 (€36.3bn)
“Other” Sectors 74.7 (€106.9bn)
Total 100 (€143.2bn)
Source: CSO5
* Other NACE sectors refers to: Reproduction of recorded media, Computer, electronic and optical products, Electrical equipment, Medical and dental instruments and supplies
In terms of recent performance, the foreign-owned MNE sector performed strongly (contributing 5 percentage points to growth) in the 2008-11 period due in part to increased output and value added in the pharma-chem sector (see Figure 5 below). By contrast the indigenous-dominated sector performed less well due to greater exposure to domestic demand developments which were considerably weaker over the period. The impact of the weakness in the UK economy over the same period is likely to have dampened the performance of this sector too. Figure 5: GVA at constant factor cost growth 1996-2011 by foreign-owned MNE and other sectors
Source: CSO, Department of Finance Analysis Note: Data are consistent with the CSO July 2012 National Income and Expenditure release
5 see footnote 1
-8.0
-6.0
-4.0
-2.0
0.0
2.0
4.0
6.0
8.0
10.0
12.0
1996
1997
1998
199
9
2000
2001
2002
2003
2004
2005
2006
2007
2008
2009
2010
2011
All other sectors
Foreign-owned MNES
GVA growth
Department of Finance | Impact of Foreign-Owned Sector – Economic Impact Assessment of Ireland’s Corporation Tax Policy Page 9
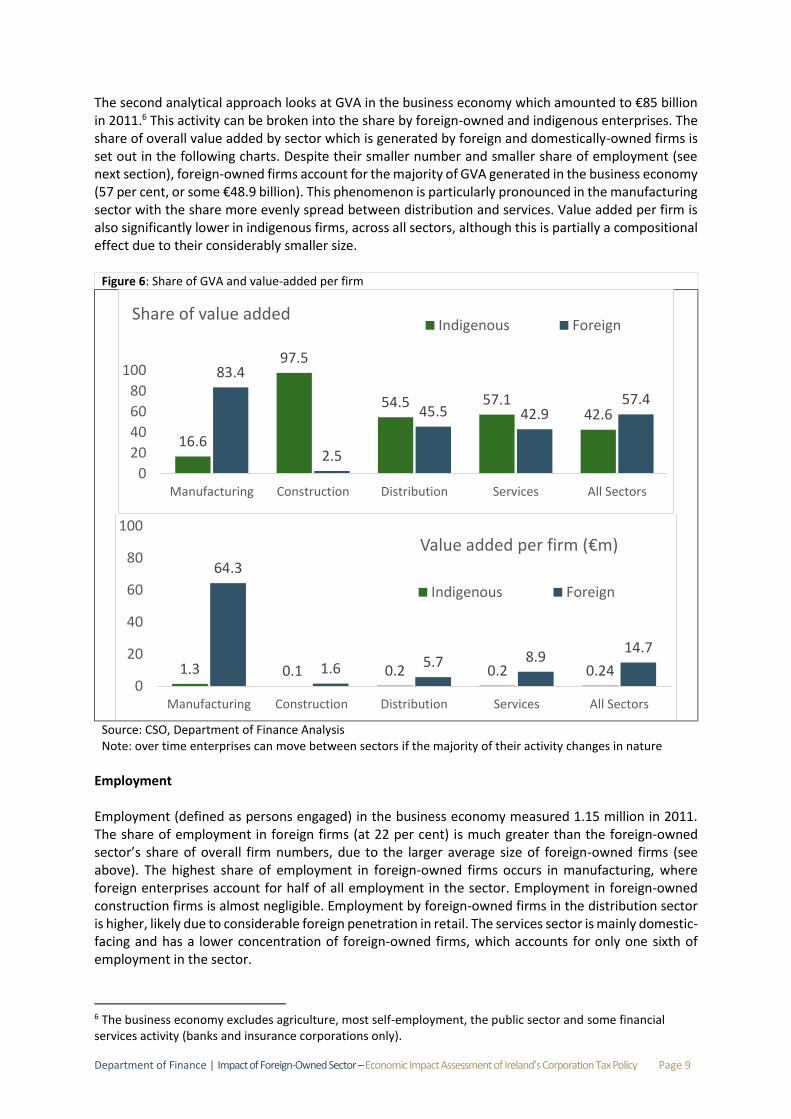
The second analytical approach looks at GVA in the business economy which amounted to €85 billion in 2011.6 This activity can be broken into the share by foreign-owned and indigenous enterprises. The share of overall value added by sector which is generated by foreign and domestically-owned firms is set out in the following charts. Despite their smaller number and smaller share of employment (see next section), foreign-owned firms account for the majority of GVA generated in the business economy (57 per cent, or some €48.9 billion). This phenomenon is particularly pronounced in the manufacturing sector with the share more evenly spread between distribution and services. Value added per firm is also significantly lower in indigenous firms, across all sectors, although this is partially a compositional effect due to their considerably smaller size.
Figure 6: Share of GVA and value-added per firm
Source: CSO, Department of Finance Analysis Note: over time enterprises can move between sectors if the majority of their activity changes in nature
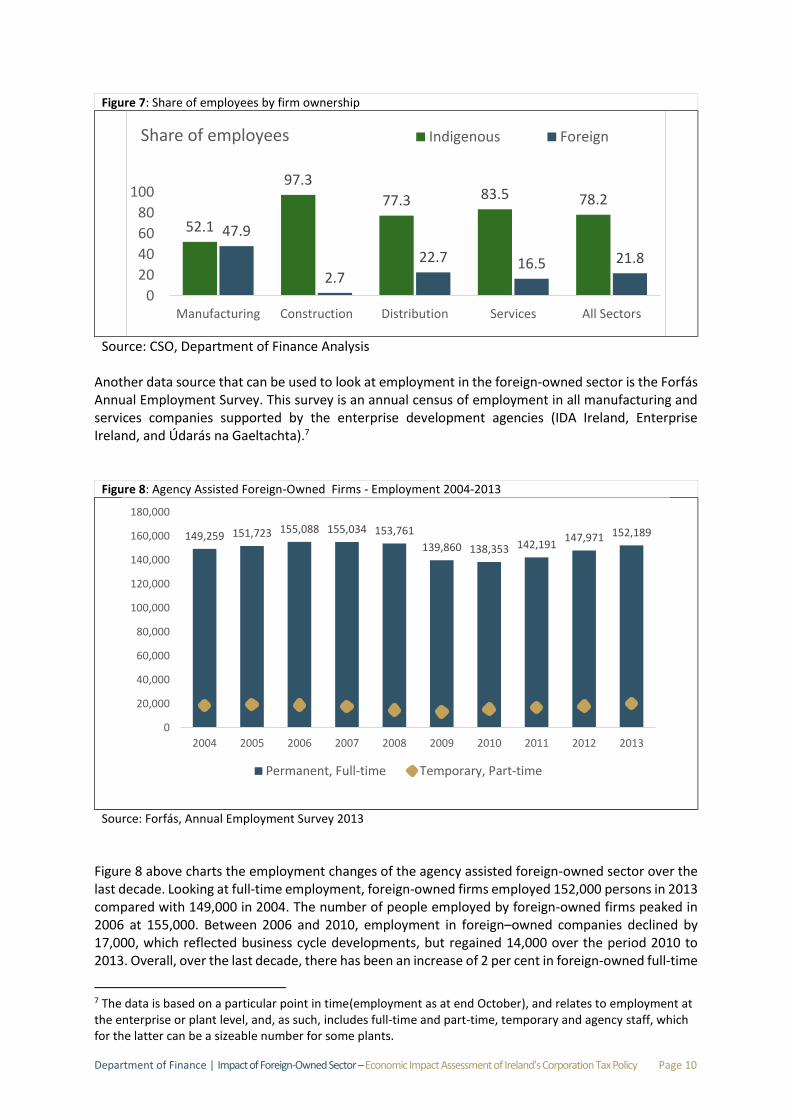
Employment Employment (defined as persons engaged) in the business economy measured 1.15 million in 2011. The share of employment in foreign firms (at 22 per cent) is much greater than the foreign-owned sector’s share of overall firm numbers, due to the larger average size of foreign-owned firms (see above). The highest share of employment in foreign-owned firms occurs in manufacturing, where foreign enterprises account for half of all employment in the sector. Employment in foreign-owned construction firms is almost negligible. Employment by foreign-owned firms in the distribution sector is higher, likely due to considerable foreign penetration in retail. The services sector is mainly domestic-facing and has a lower concentration of foreign-owned firms, which accounts for only one sixth of employment in the sector.
6 The business economy excludes agriculture, most self-employment, the public sector and some financial services activity (banks and insurance corporations only).
16.6
97.5
54.5 57.142.6
83.4
2.5
45.5 42.957.4
0
20
40
60
80
100
Manufacturing Construction Distribution Services All Sectors
Share of value addedIndigenous Foreign
1.3 0.1 0.2 0.2 0.24
64.3
1.6 5.7 8.914.7
0
20
40
60
80
100
Manufacturing Construction Distribution Services All Sectors
Value added per firm (€m)
Indigenous Foreign
Department of Finance | Impact of Foreign-Owned Sector – Economic Impact Assessment of Ireland’s Corporation Tax Policy Page 10
Figure 7: Share of employees by firm ownership
Source: CSO, Department of Finance Analysis
Another data source that can be used to look at employment in the foreign-owned sector is the Forfás Annual Employment Survey. This survey is an annual census of employment in all manufacturing and services companies supported by the enterprise development agencies (IDA Ireland, Enterprise Ireland, and Údarás na Gaeltachta).7
Figure 8: Agency Assisted Foreign-Owned Firms - Employment 2004-2013
Source: Forfás, Annual Employment Survey 2013
Figure 8 above charts the employment changes of the agency assisted foreign-owned sector over the last decade. Looking at full-time employment, foreign-owned firms employed 152,000 persons in 2013 compared with 149,000 in 2004. The number of people employed by foreign-owned firms peaked in 2006 at 155,000. Between 2006 and 2010, employment in foreign–owned companies declined by 17,000, which reflected business cycle developments, but regained 14,000 over the period 2010 to 2013. Overall, over the last decade, there has been an increase of 2 per cent in foreign-owned full-time
7 The data is based on a particular point in time(employment as at end October), and relates to employment at the enterprise or plant level, and, as such, includes full-time and part-time, temporary and agency staff, which for the latter can be a sizeable number for some plants.
52.1
97.3
77.3 83.5 78.2
47.9
2.7
22.7 16.5 21.8
0
20
40
60
80
100
Manufacturing Construction Distribution Services All Sectors
Share of employees Indigenous Foreign
149,259 151,723 155,088 155,034 153,761
139,860 138,353 142,191147,971 152,189
0
20,000
40,000
60,000
80,000
100,000
120,000
140,000
160,000
180,000
2004 2005 2006 2007 2008 2009 2010 2011 2012 2013
Permanent, Full-time Temporary, Part-time
Department of Finance | Impact of Foreign-Owned Sector – Economic Impact Assessment of Ireland’s Corporation Tax Policy Page 11
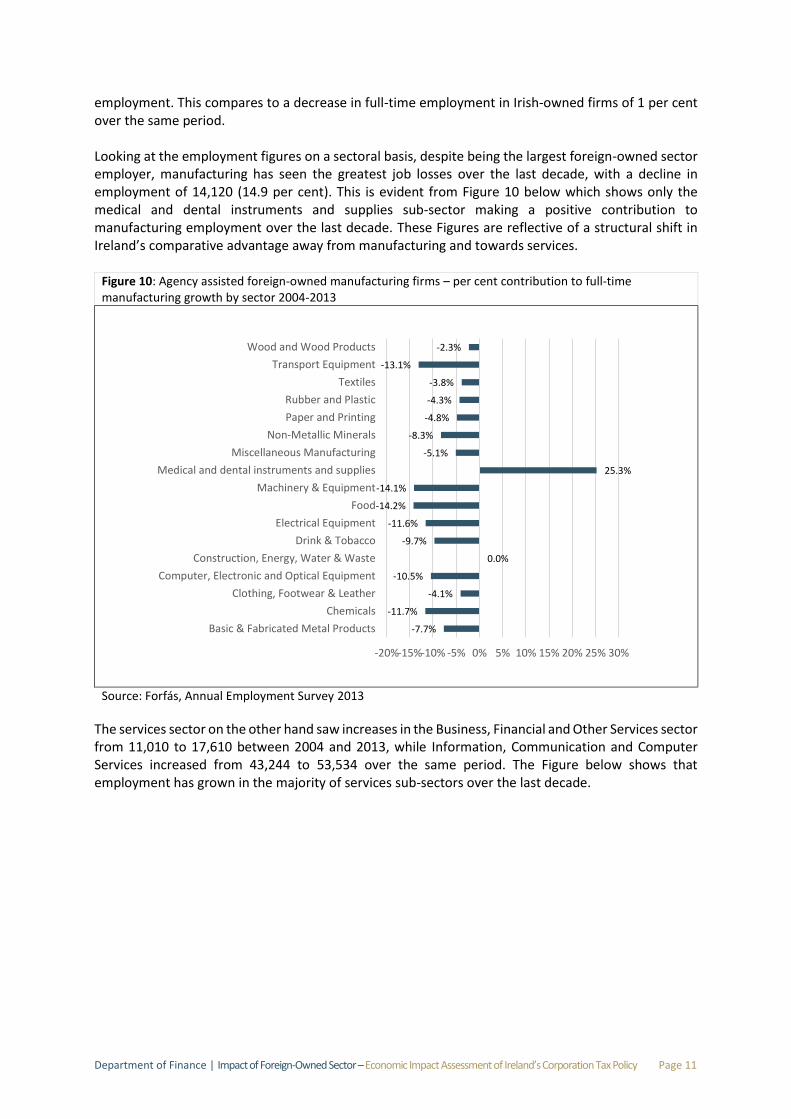
employment. This compares to a decrease in full-time employment in Irish-owned firms of 1 per cent over the same period. Looking at the employment figures on a sectoral basis, despite being the largest foreign-owned sector employer, manufacturing has seen the greatest job losses over the last decade, with a decline in employment of 14,120 (14.9 per cent). This is evident from Figure 10 below which shows only the medical and dental instruments and supplies sub-sector making a positive contribution to manufacturing employment over the last decade. These Figures are reflective of a structural shift in Ireland’s comparative advantage away from manufacturing and towards services.
Figure 10: Agency assisted foreign-owned manufacturing firms – per cent contribution to full-time manufacturing growth by sector 2004-2013
Source: Forfás, Annual Employment Survey 2013
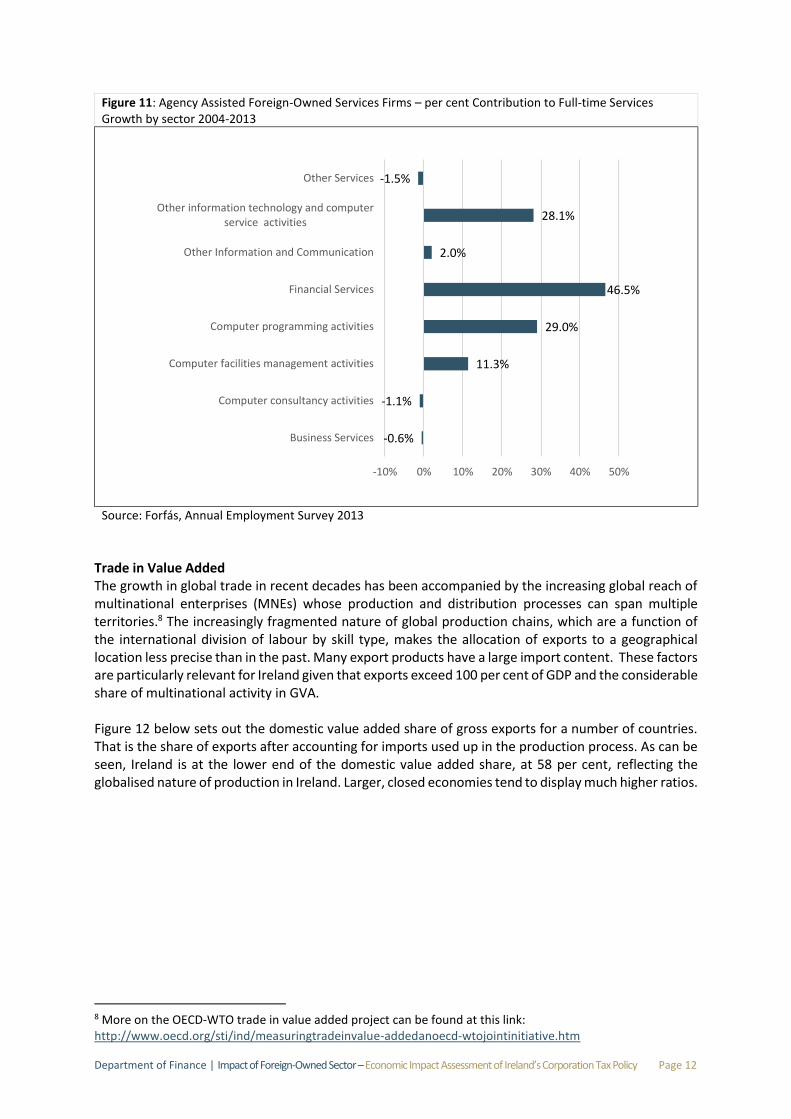
The services sector on the other hand saw increases in the Business, Financial and Other Services sector from 11,010 to 17,610 between 2004 and 2013, while Information, Communication and Computer Services increased from 43,244 to 53,534 over the same period. The Figure below shows that employment has grown in the majority of services sub-sectors over the last decade.
-7.7%
-11.7%
-4.1%
-10.5%
0.0%
-9.7%
-11.6%
-14.2%
-14.1%
25.3%
-5.1%
-8.3%
-4.8%
-4.3%
-3.8%
-13.1%
-2.3%
-20%-15%-10% -5% 0% 5% 10% 15% 20% 25% 30%
Basic & Fabricated Metal Products
Chemicals
Clothing, Footwear & Leather
Computer, Electronic and Optical Equipment
Construction, Energy, Water & Waste
Drink & Tobacco
Electrical Equipment
Food
Machinery & Equipment
Medical and dental instruments and supplies
Miscellaneous Manufacturing
Non-Metallic Minerals
Paper and Printing
Rubber and Plastic
Textiles
Transport Equipment
Wood and Wood Products
Department of Finance | Impact of Foreign-Owned Sector – Economic Impact Assessment of Ireland’s Corporation Tax Policy Page 12
Figure 11: Agency Assisted Foreign-Owned Services Firms – per cent Contribution to Full-time Services Growth by sector 2004-2013
Source: Forfás, Annual Employment Survey 2013
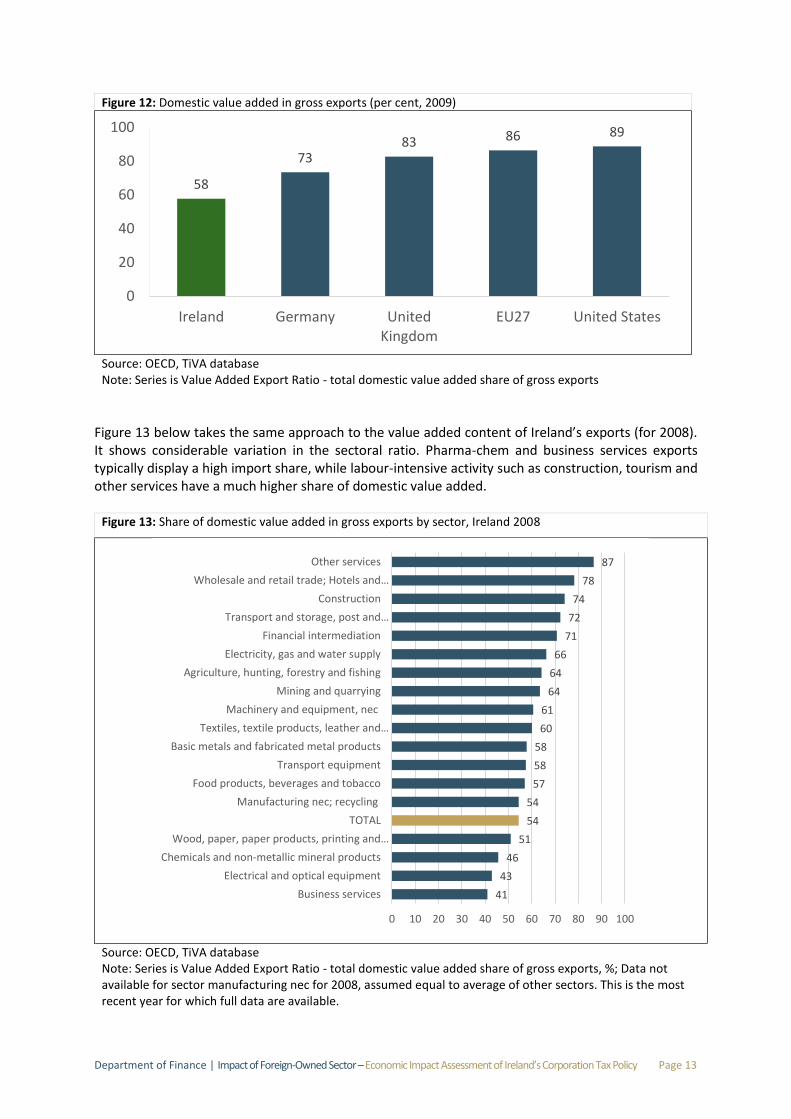
Trade in Value Added The growth in global trade in recent decades has been accompanied by the increasing global reach of multinational enterprises (MNEs) whose production and distribution processes can span multiple territories.8 The increasingly fragmented nature of global production chains, which are a function of the international division of labour by skill type, makes the allocation of exports to a geographical location less precise than in the past. Many export products have a large import content. These factors are particularly relevant for Ireland given that exports exceed 100 per cent of GDP and the considerable share of multinational activity in GVA. Figure 12 below sets out the domestic value added share of gross exports for a number of countries. That is the share of exports after accounting for imports used up in the production process. As can be seen, Ireland is at the lower end of the domestic value added share, at 58 per cent, reflecting the globalised nature of production in Ireland. Larger, closed economies tend to display much higher ratios.
8 More on the OECD-WTO trade in value added project can be found at this link: http://www.oecd.org/sti/ind/measuringtradeinvalue-addedanoecd-wtojointinitiative.htm
-0.6%
-1.1%
11.3%
29.0%
46.5%
2.0%
28.1%
-1.5%
-10% 0% 10% 20% 30% 40% 50%
Business Services
Computer consultancy activities
Computer facilities management activities
Computer programming activities
Financial Services
Other Information and Communication
Other information technology and computerservice activities
Other Services
Department of Finance | Impact of Foreign-Owned Sector – Economic Impact Assessment of Ireland’s Corporation Tax Policy Page 13
Figure 12: Domestic value added in gross exports (per cent, 2009)
Source: OECD, TiVA database Note: Series is Value Added Export Ratio - total domestic value added share of gross exports
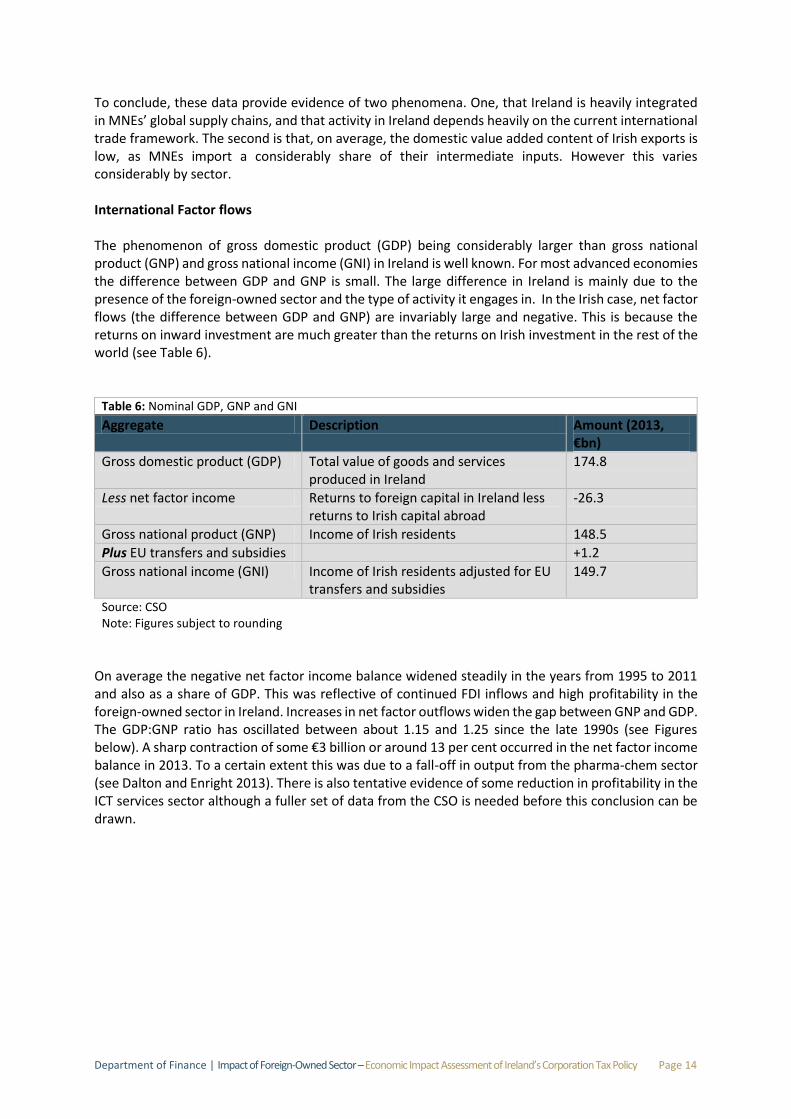
Figure 13 below takes the same approach to the value added content of Ireland’s exports (for 2008). It shows considerable variation in the sectoral ratio. Pharma-chem and business services exports typically display a high import share, while labour-intensive activity such as construction, tourism and other services have a much higher share of domestic value added.
Figure 13: Share of domestic value added in gross exports by sector, Ireland 2008
Source: OECD, TiVA database Note: Series is Value Added Export Ratio - total domestic value added share of gross exports, %; Data not available for sector manufacturing nec for 2008, assumed equal to average of other sectors. This is the most recent year for which full data are available.
58
7383 86 89
0
20
40
60
80
100
Ireland Germany UnitedKingdom
EU27 United States
41
43
46
51
54
54
57
58
58
60
61
64
64
66
71
72
74
78
87
0 10 20 30 40 50 60 70 80 90 100
Business services
Electrical and optical equipment
Chemicals and non-metallic mineral products
Wood, paper, paper products, printing and…
TOTAL
Manufacturing nec; recycling
Food products, beverages and tobacco
Transport equipment
Basic metals and fabricated metal products
Textiles, textile products, leather and…
Machinery and equipment, nec
Mining and quarrying
Agriculture, hunting, forestry and fishing
Electricity, gas and water supply
Financial intermediation
Transport and storage, post and…
Construction
Wholesale and retail trade; Hotels and…
Other services
Department of Finance | Impact of Foreign-Owned Sector – Economic Impact Assessment of Ireland’s Corporation Tax Policy Page 14
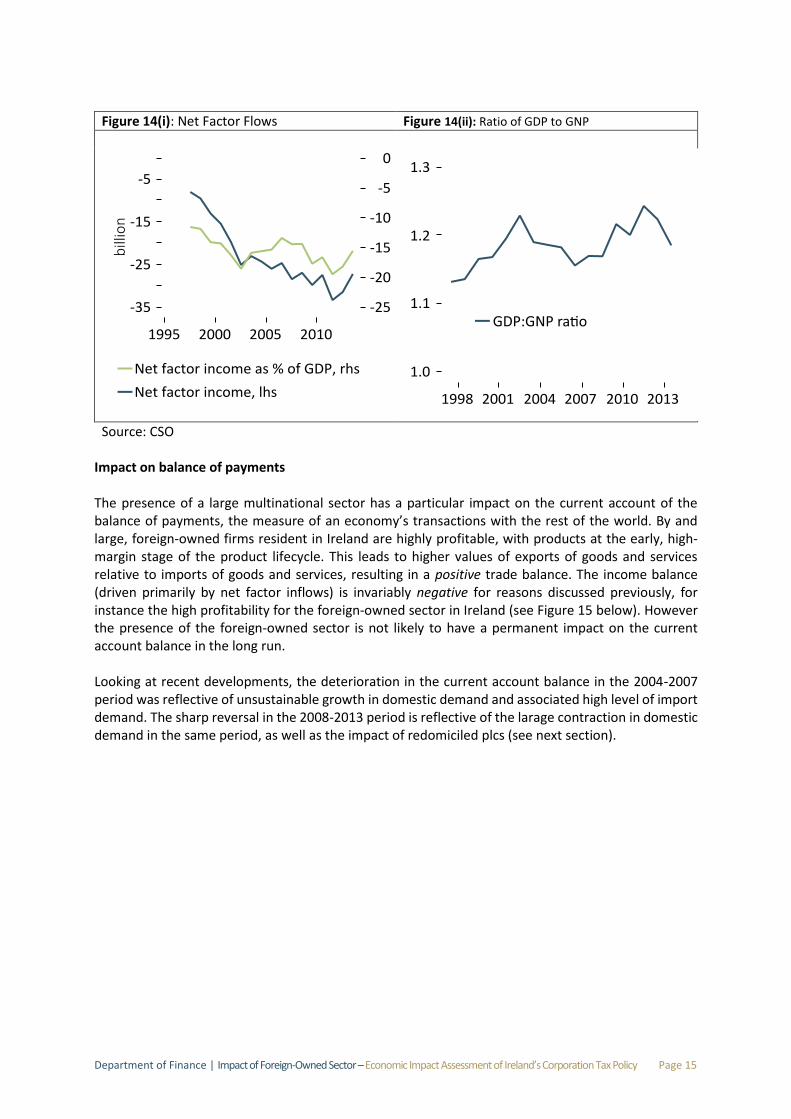
To conclude, these data provide evidence of two phenomena. One, that Ireland is heavily integrated in MNEs’ global supply chains, and that activity in Ireland depends heavily on the current international trade framework. The second is that, on average, the domestic value added content of Irish exports is low, as MNEs import a considerably share of their intermediate inputs. However this varies considerably by sector. International Factor flows The phenomenon of gross domestic product (GDP) being considerably larger than gross national product (GNP) and gross national income (GNI) in Ireland is well known. For most advanced economies the difference between GDP and GNP is small. The large difference in Ireland is mainly due to the presence of the foreign-owned sector and the type of activity it engages in. In the Irish case, net factor flows (the difference between GDP and GNP) are invariably large and negative. This is because the returns on inward investment are much greater than the returns on Irish investment in the rest of the world (see Table 6).
Table 6: Nominal GDP, GNP and GNI
Aggregate Description Amount (2013, €bn)
Gross domestic product (GDP) Total value of goods and services produced in Ireland
174.8
Less net factor income Returns to foreign capital in Ireland less returns to Irish capital abroad
-26.3
Gross national product (GNP) Income of Irish residents 148.5
Plus EU transfers and subsidies +1.2
Gross national income (GNI) Income of Irish residents adjusted for EU transfers and subsidies
149.7
Source: CSO Note: Figures subject to rounding
On average the negative net factor income balance widened steadily in the years from 1995 to 2011 and also as a share of GDP. This was reflective of continued FDI inflows and high profitability in the foreign-owned sector in Ireland. Increases in net factor outflows widen the gap between GNP and GDP. The GDP:GNP ratio has oscillated between about 1.15 and 1.25 since the late 1990s (see Figures below). A sharp contraction of some €3 billion or around 13 per cent occurred in the net factor income balance in 2013. To a certain extent this was due to a fall-off in output from the pharma-chem sector (see Dalton and Enright 2013). There is also tentative evidence of some reduction in profitability in the ICT services sector although a fuller set of data from the CSO is needed before this conclusion can be drawn.
Department of Finance | Impact of Foreign-Owned Sector – Economic Impact Assessment of Ireland’s Corporation Tax Policy Page 15
Figure 14(i): Net Factor Flows Figure 14(ii): Ratio of GDP to GNP
Source: CSO
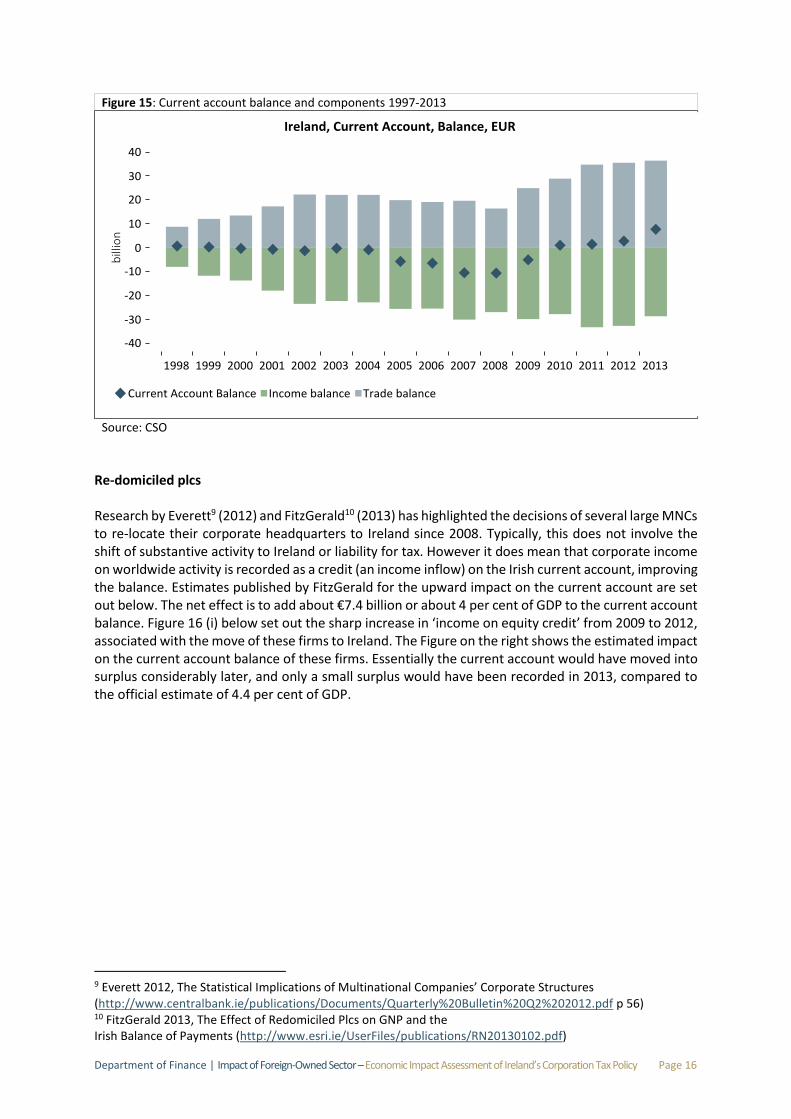
Impact on balance of payments The presence of a large multinational sector has a particular impact on the current account of the balance of payments, the measure of an economy’s transactions with the rest of the world. By and large, foreign-owned firms resident in Ireland are highly profitable, with products at the early, high-margin stage of the product lifecycle. This leads to higher values of exports of goods and services relative to imports of goods and services, resulting in a positive trade balance. The income balance (driven primarily by net factor inflows) is invariably negative for reasons discussed previously, for instance the high profitability for the foreign-owned sector in Ireland (see Figure 15 below). However the presence of the foreign-owned sector is not likely to have a permanent impact on the current account balance in the long run. Looking at recent developments, the deterioration in the current account balance in the 2004-2007 period was reflective of unsustainable growth in domestic demand and associated high level of import demand. The sharp reversal in the 2008-2013 period is reflective of the larage contraction in domestic demand in the same period, as well as the impact of redomiciled plcs (see next section).
Department of Finance | Impact of Foreign-Owned Sector – Economic Impact Assessment of Ireland’s Corporation Tax Policy Page 16
Figure 15: Current account balance and components 1997-2013
Source: CSO
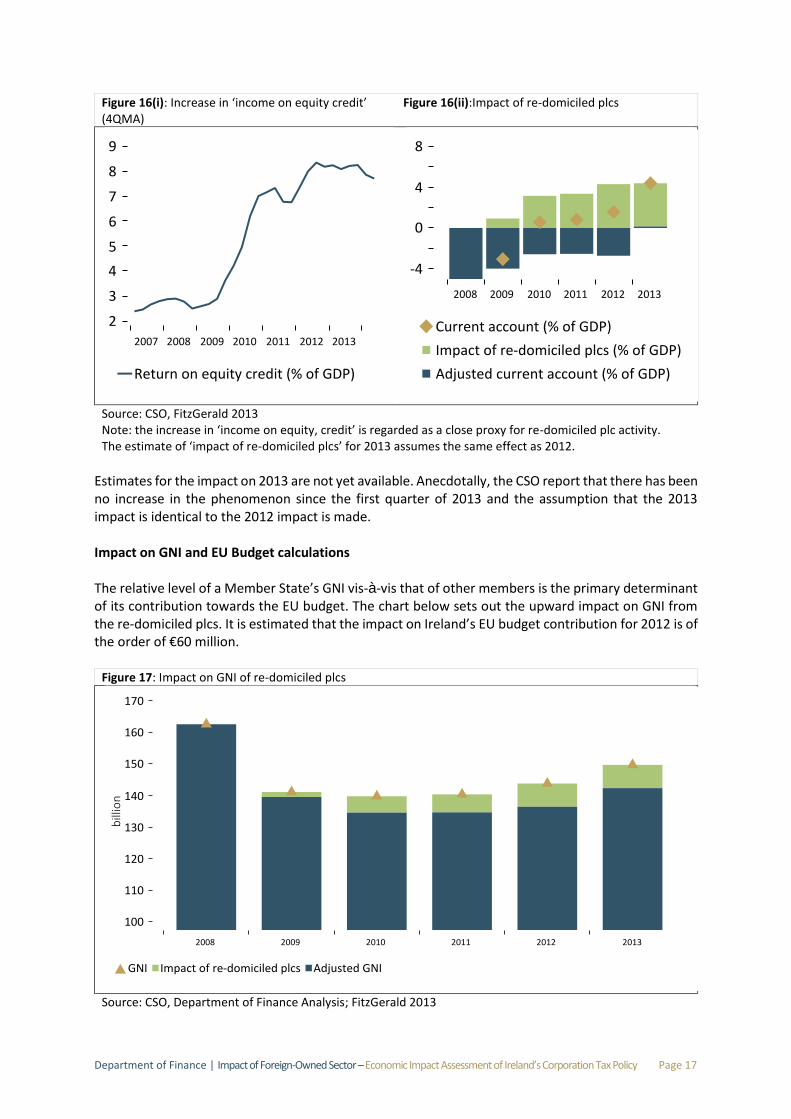
Re-domiciled plcs Research by Everett9 (2012) and FitzGerald10 (2013) has highlighted the decisions of several large MNCs to re-locate their corporate headquarters to Ireland since 2008. Typically, this does not involve the shift of substantive activity to Ireland or liability for tax. However it does mean that corporate income on worldwide activity is recorded as a credit (an income inflow) on the Irish current account, improving the balance. Estimates published by FitzGerald for the upward impact on the current account are set out below. The net effect is to add about €7.4 billion or about 4 per cent of GDP to the current account balance. Figure 16 (i) below set out the sharp increase in ‘income on equity credit’ from 2009 to 2012, associated with the move of these firms to Ireland. The Figure on the right shows the estimated impact on the current account balance of these firms. Essentially the current account would have moved into surplus considerably later, and only a small surplus would have been recorded in 2013, compared to the official estimate of 4.4 per cent of GDP.
9 Everett 2012, The Statistical Implications of Multinational Companies’ Corporate Structures (http://www.centralbank.ie/publications/Documents/Quarterly%20Bulletin%20Q2%202012.pdf p 56) 10 FitzGerald 2013, The Effect of Redomiciled Plcs on GNP and the Irish Balance of Payments (http://www.esri.ie/UserFiles/publications/RN20130102.pdf)
Department of Finance | Impact of Foreign-Owned Sector – Economic Impact Assessment of Ireland’s Corporation Tax Policy Page 17
Figure 16(i): Increase in ‘income on equity credit’ (4QMA)
Figure 16(ii):Impact of re-domiciled plcs
Source: CSO, FitzGerald 2013 Note: the increase in ‘income on equity, credit’ is regarded as a close proxy for re-domiciled plc activity. The estimate of ‘impact of re-domiciled plcs’ for 2013 assumes the same effect as 2012.
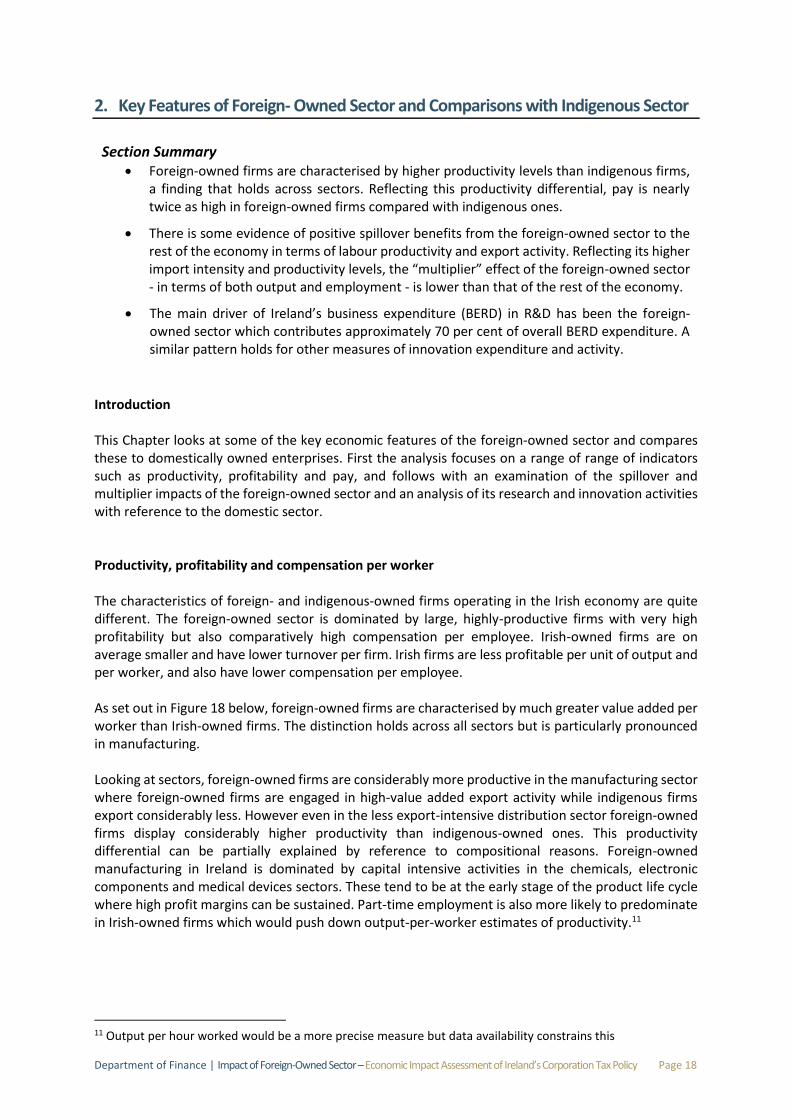
Estimates for the impact on 2013 are not yet available. Anecdotally, the CSO report that there has been no increase in the phenomenon since the first quarter of 2013 and the assumption that the 2013 impact is identical to the 2012 impact is made. Impact on GNI and EU Budget calculations The relative level of a Member State’s GNI vis-à-vis that of other members is the primary determinant of its contribution towards the EU budget. The chart below sets out the upward impact on GNI from the re-domiciled plcs. It is estimated that the impact on Ireland’s EU budget contribution for 2012 is of the order of €60 million.
Figure 17: Impact on GNI of re-domiciled plcs
Source: CSO, Department of Finance Analysis; FitzGerald 2013
Department of Finance | Impact of Foreign-Owned Sector – Economic Impact Assessment of Ireland’s Corporation Tax Policy Page 18
2. Key Features of Foreign- Owned Sector and Comparisons with Indigenous Sector
Section Summary
Foreign-owned firms are characterised by higher productivity levels than indigenous firms, a finding that holds across sectors. Reflecting this productivity differential, pay is nearly twice as high in foreign-owned firms compared with indigenous ones.
There is some evidence of positive spillover benefits from the foreign-owned sector to the rest of the economy in terms of labour productivity and export activity. Reflecting its higher import intensity and productivity levels, the “multiplier” effect of the foreign-owned sector - in terms of both output and employment - is lower than that of the rest of the economy.
The main driver of Ireland’s business expenditure (BERD) in R&D has been the foreign-owned sector which contributes approximately 70 per cent of overall BERD expenditure. A similar pattern holds for other measures of innovation expenditure and activity.
Introduction This Chapter looks at some of the key economic features of the foreign-owned sector and compares these to domestically owned enterprises. First the analysis focuses on a range of range of indicators such as productivity, profitability and pay, and follows with an examination of the spillover and multiplier impacts of the foreign-owned sector and an analysis of its research and innovation activities with reference to the domestic sector. Productivity, profitability and compensation per worker The characteristics of foreign- and indigenous-owned firms operating in the Irish economy are quite different. The foreign-owned sector is dominated by large, highly-productive firms with very high profitability but also comparatively high compensation per employee. Irish-owned firms are on average smaller and have lower turnover per firm. Irish firms are less profitable per unit of output and per worker, and also have lower compensation per employee. As set out in Figure 18 below, foreign-owned firms are characterised by much greater value added per worker than Irish-owned firms. The distinction holds across all sectors but is particularly pronounced in manufacturing. Looking at sectors, foreign-owned firms are considerably more productive in the manufacturing sector where foreign-owned firms are engaged in high-value added export activity while indigenous firms export considerably less. However even in the less export-intensive distribution sector foreign-owned firms display considerably higher productivity than indigenous-owned ones. This productivity differential can be partially explained by reference to compositional reasons. Foreign-owned manufacturing in Ireland is dominated by capital intensive activities in the chemicals, electronic components and medical devices sectors. These tend to be at the early stage of the product life cycle where high profit margins can be sustained. Part-time employment is also more likely to predominate in Irish-owned firms which would push down output-per-worker estimates of productivity.11
11 Output per hour worked would be a more precise measure but data availability constrains this
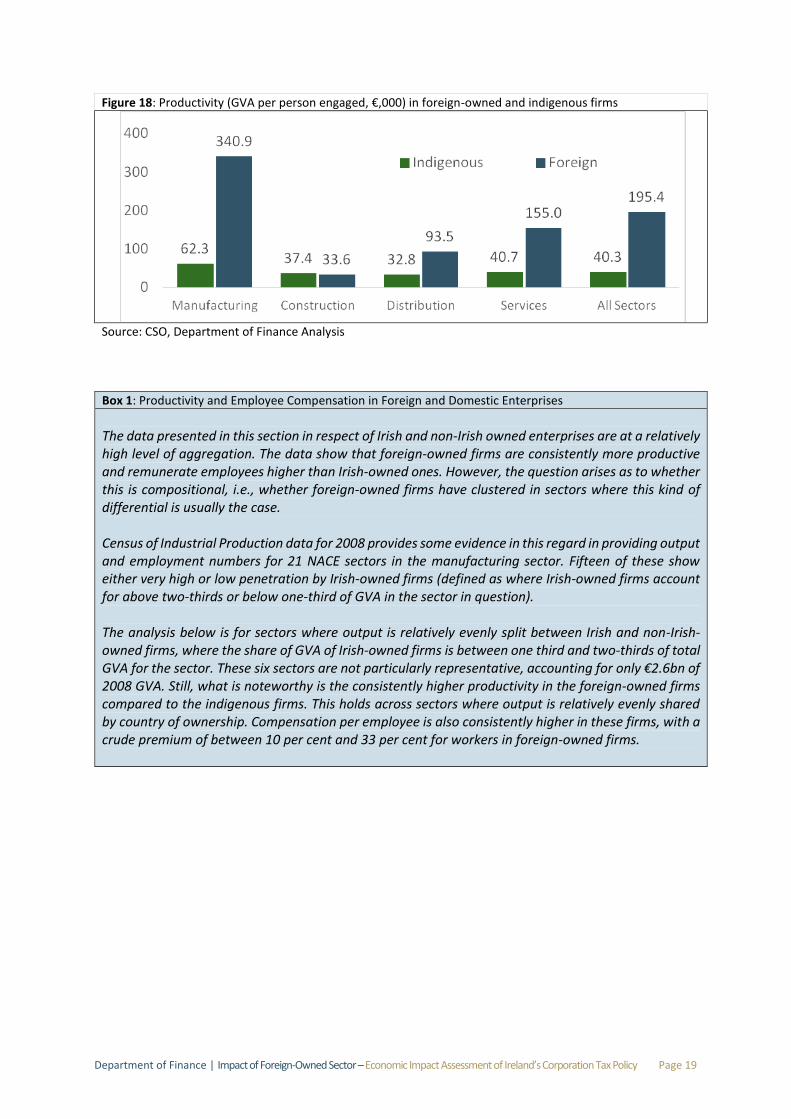
Department of Finance | Impact of Foreign-Owned Sector – Economic Impact Assessment of Ireland’s Corporation Tax Policy Page 19
Figure 18: Productivity (GVA per person engaged, €,000) in foreign-owned and indigenous firms
Source: CSO, Department of Finance Analysis
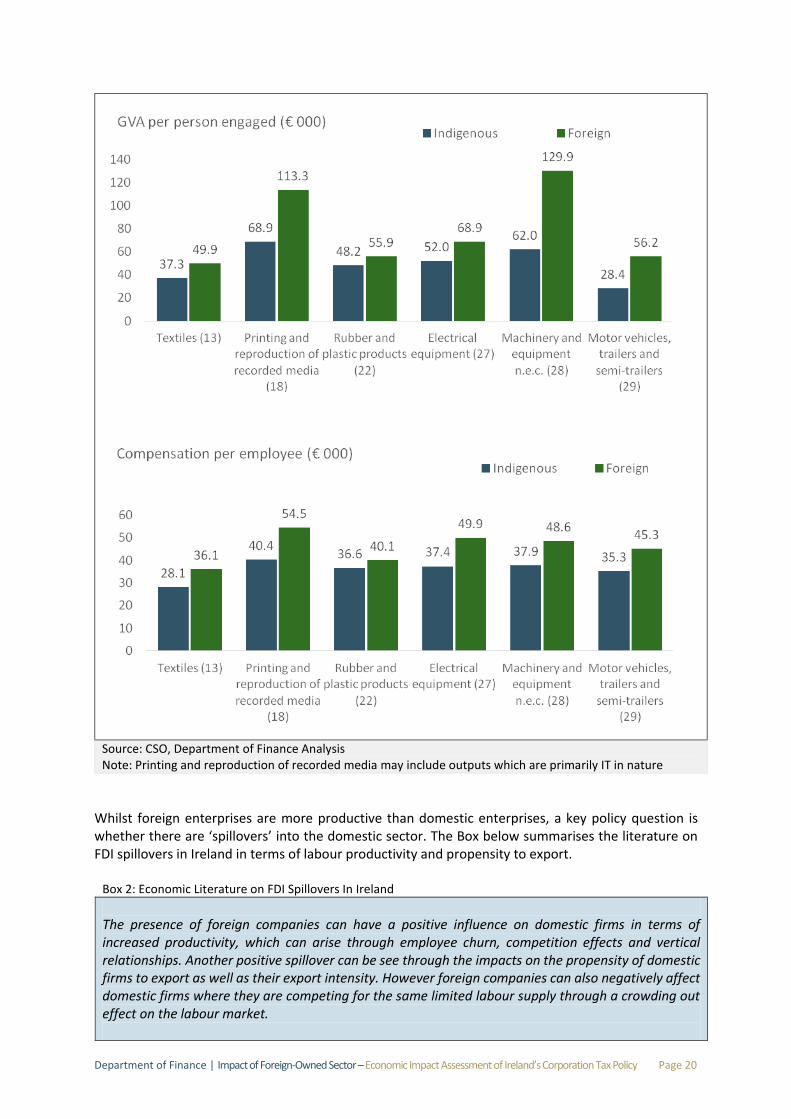
Box 1: Productivity and Employee Compensation in Foreign and Domestic Enterprises The data presented in this section in respect of Irish and non-Irish owned enterprises are at a relatively high level of aggregation. The data show that foreign-owned firms are consistently more productive and remunerate employees higher than Irish-owned ones. However, the question arises as to whether this is compositional, i.e., whether foreign-owned firms have clustered in sectors where this kind of differential is usually the case. Census of Industrial Production data for 2008 provides some evidence in this regard in providing output and employment numbers for 21 NACE sectors in the manufacturing sector. Fifteen of these show either very high or low penetration by Irish-owned firms (defined as where Irish-owned firms account for above two-thirds or below one-third of GVA in the sector in question). The analysis below is for sectors where output is relatively evenly split between Irish and non-Irish-owned firms, where the share of GVA of Irish-owned firms is between one third and two-thirds of total GVA for the sector. These six sectors are not particularly representative, accounting for only €2.6bn of 2008 GVA. Still, what is noteworthy is the consistently higher productivity in the foreign-owned firms compared to the indigenous firms. This holds across sectors where output is relatively evenly shared by country of ownership. Compensation per employee is also consistently higher in these firms, with a crude premium of between 10 per cent and 33 per cent for workers in foreign-owned firms.
Department of Finance | Impact of Foreign-Owned Sector – Economic Impact Assessment of Ireland’s Corporation Tax Policy Page 20
Source: CSO, Department of Finance Analysis Note: Printing and reproduction of recorded media may include outputs which are primarily IT in nature
Whilst foreign enterprises are more productive than domestic enterprises, a key policy question is whether there are ‘spillovers’ into the domestic sector. The Box below summarises the literature on FDI spillovers in Ireland in terms of labour productivity and propensity to export.
Box 2: Economic Literature on FDI Spillovers In Ireland The presence of foreign companies can have a positive influence on domestic firms in terms of increased productivity, which can arise through employee churn, competition effects and vertical relationships. Another positive spillover can be see through the impacts on the propensity of domestic firms to export as well as their export intensity. However foreign companies can also negatively affect domestic firms where they are competing for the same limited labour supply through a crowding out effect on the labour market.
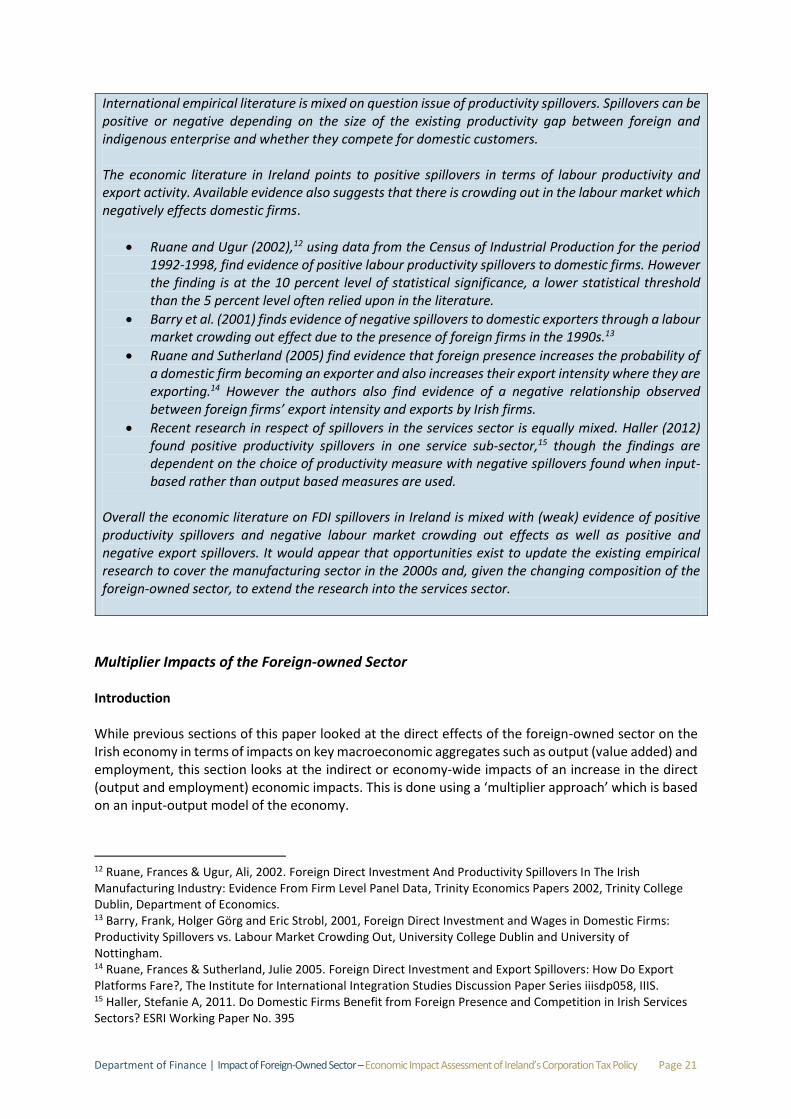
Department of Finance | Impact of Foreign-Owned Sector – Economic Impact Assessment of Ireland’s Corporation Tax Policy Page 21
International empirical literature is mixed on question issue of productivity spillovers. Spillovers can be positive or negative depending on the size of the existing productivity gap between foreign and indigenous enterprise and whether they compete for domestic customers. The economic literature in Ireland points to positive spillovers in terms of labour productivity and export activity. Available evidence also suggests that there is crowding out in the labour market which negatively effects domestic firms.
Ruane and Ugur (2002),12 using data from the Census of Industrial Production for the period 1992-1998, find evidence of positive labour productivity spillovers to domestic firms. However the finding is at the 10 percent level of statistical significance, a lower statistical threshold than the 5 percent level often relied upon in the literature.
Barry et al. (2001) finds evidence of negative spillovers to domestic exporters through a labour market crowding out effect due to the presence of foreign firms in the 1990s.13
Ruane and Sutherland (2005) find evidence that foreign presence increases the probability of a domestic firm becoming an exporter and also increases their export intensity where they are exporting.14 However the authors also find evidence of a negative relationship observed between foreign firms’ export intensity and exports by Irish firms.
Recent research in respect of spillovers in the services sector is equally mixed. Haller (2012) found positive productivity spillovers in one service sub-sector,15 though the findings are dependent on the choice of productivity measure with negative spillovers found when input-based rather than output based measures are used.
Overall the economic literature on FDI spillovers in Ireland is mixed with (weak) evidence of positive productivity spillovers and negative labour market crowding out effects as well as positive and negative export spillovers. It would appear that opportunities exist to update the existing empirical research to cover the manufacturing sector in the 2000s and, given the changing composition of the foreign-owned sector, to extend the research into the services sector.
Multiplier Impacts of the Foreign-owned Sector Introduction While previous sections of this paper looked at the direct effects of the foreign-owned sector on the Irish economy in terms of impacts on key macroeconomic aggregates such as output (value added) and employment, this section looks at the indirect or economy-wide impacts of an increase in the direct (output and employment) economic impacts. This is done using a ‘multiplier approach’ which is based on an input-output model of the economy.
12 Ruane, Frances & Ugur, Ali, 2002. Foreign Direct Investment And Productivity Spillovers In The Irish Manufacturing Industry: Evidence From Firm Level Panel Data, Trinity Economics Papers 2002, Trinity College Dublin, Department of Economics. 13 Barry, Frank, Holger Görg and Eric Strobl, 2001, Foreign Direct Investment and Wages in Domestic Firms: Productivity Spillovers vs. Labour Market Crowding Out, University College Dublin and University of Nottingham. 14 Ruane, Frances & Sutherland, Julie 2005. Foreign Direct Investment and Export Spillovers: How Do Export Platforms Fare?, The Institute for International Integration Studies Discussion Paper Series iiisdp058, IIIS. 15 Haller, Stefanie A, 2011. Do Domestic Firms Benefit from Foreign Presence and Competition in Irish Services Sectors? ESRI Working Paper No. 395
Department of Finance | Impact of Foreign-Owned Sector – Economic Impact Assessment of Ireland’s Corporation Tax Policy Page 22
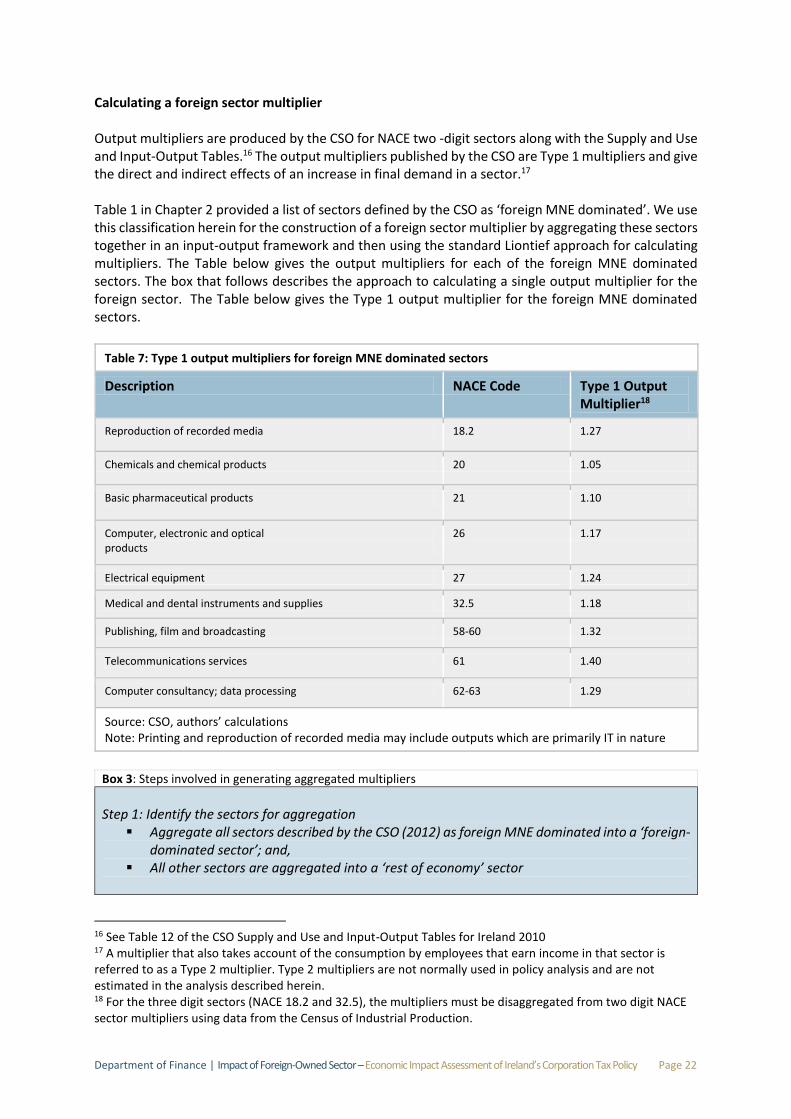
Calculating a foreign sector multiplier Output multipliers are produced by the CSO for NACE two -digit sectors along with the Supply and Use and Input-Output Tables.16 The output multipliers published by the CSO are Type 1 multipliers and give the direct and indirect effects of an increase in final demand in a sector.17 Table 1 in Chapter 2 provided a list of sectors defined by the CSO as ‘foreign MNE dominated’. We use this classification herein for the construction of a foreign sector multiplier by aggregating these sectors together in an input-output framework and then using the standard Liontief approach for calculating multipliers. The Table below gives the output multipliers for each of the foreign MNE dominated sectors. The box that follows describes the approach to calculating a single output multiplier for the foreign sector. The Table below gives the Type 1 output multiplier for the foreign MNE dominated sectors.
Table 7: Type 1 output multipliers for foreign MNE dominated sectors
Description NACE Code Type 1 Output Multiplier18
Reproduction of recorded media 18.2 1.27
Chemicals and chemical products 20 1.05
Basic pharmaceutical products 21 1.10
Computer, electronic and optical products
26 1.17
Electrical equipment 27 1.24
Medical and dental instruments and supplies 32.5 1.18
Publishing, film and broadcasting 58-60 1.32
Telecommunications services 61 1.40
Computer consultancy; data processing 62-63 1.29
Source: CSO, authors’ calculations Note: Printing and reproduction of recorded media may include outputs which are primarily IT in nature
Box 3: Steps involved in generating aggregated multipliers Step 1: Identify the sectors for aggregation
Aggregate all sectors described by the CSO (2012) as foreign MNE dominated into a ‘foreign-dominated sector’; and,
All other sectors are aggregated into a ‘rest of economy’ sector
16 See Table 12 of the CSO Supply and Use and Input-Output Tables for Ireland 2010 17 A multiplier that also takes account of the consumption by employees that earn income in that sector is referred to as a Type 2 multiplier. Type 2 multipliers are not normally used in policy analysis and are not estimated in the analysis described herein. 18 For the three digit sectors (NACE 18.2 and 32.5), the multipliers must be disaggregated from two digit NACE sector multipliers using data from the Census of Industrial Production.
Department of Finance | Impact of Foreign-Owned Sector – Economic Impact Assessment of Ireland’s Corporation Tax Policy Page 23
Step 2: Aggregate Table 9 of the Supply and Use and Input-Output Tables into a symmetric 2X2 matrix for foreign-owned and rest of economy sectors Step 3: Follow a Leontief process to reduce Tables 11 and 12 of the Supply and Use and Input-Output Tables from a 57X57 to a 2X2 table for the two sector economy and derive the multiplier.19 The column totals for the new two sector Table 12 will give the output multipliers
Source: CSO Supply and Use and Input-Output Tables for Ireland (2010), CSO, January 2014
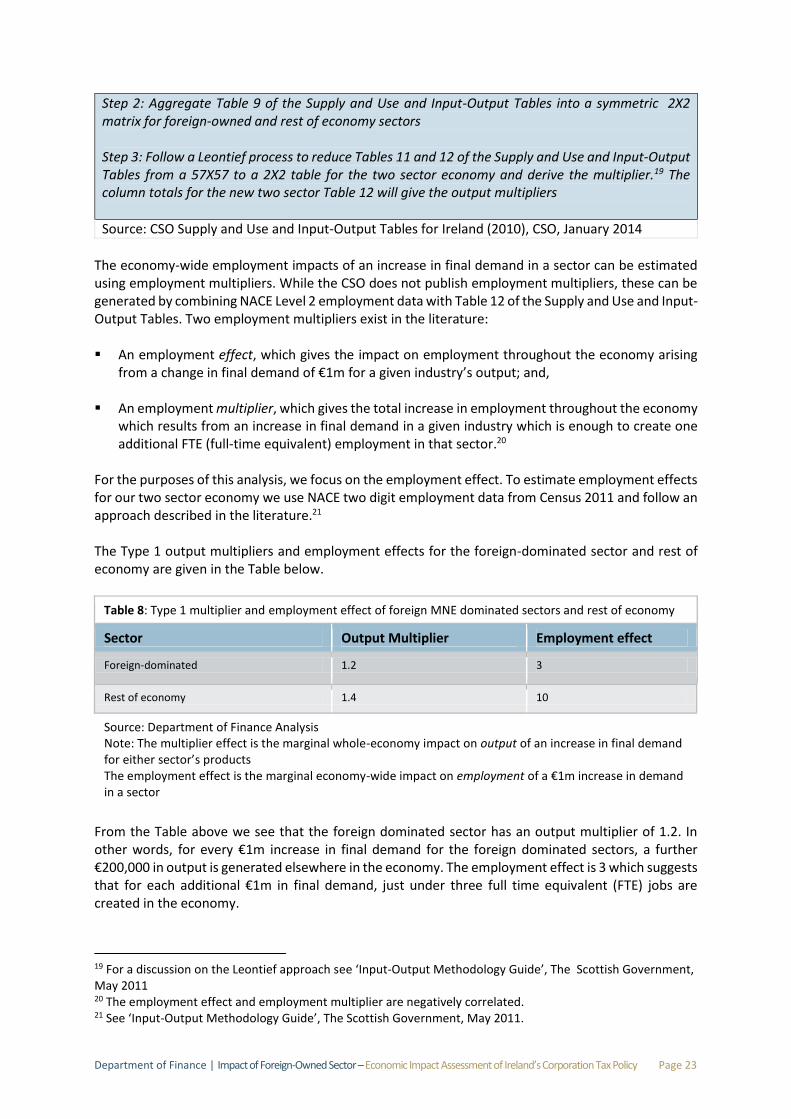
The economy-wide employment impacts of an increase in final demand in a sector can be estimated using employment multipliers. While the CSO does not publish employment multipliers, these can be generated by combining NACE Level 2 employment data with Table 12 of the Supply and Use and Input-Output Tables. Two employment multipliers exist in the literature: An employment effect, which gives the impact on employment throughout the economy arising
from a change in final demand of €1m for a given industry’s output; and,
An employment multiplier, which gives the total increase in employment throughout the economy which results from an increase in final demand in a given industry which is enough to create one additional FTE (full-time equivalent) employment in that sector.20
For the purposes of this analysis, we focus on the employment effect. To estimate employment effects for our two sector economy we use NACE two digit employment data from Census 2011 and follow an approach described in the literature.21 The Type 1 output multipliers and employment effects for the foreign-dominated sector and rest of economy are given in the Table below.
Table 8: Type 1 multiplier and employment effect of foreign MNE dominated sectors and rest of economy
Sector Output Multiplier Employment effect
Foreign-dominated 1.2 3
Rest of economy 1.4 10
Source: Department of Finance Analysis Note: The multiplier effect is the marginal whole-economy impact on output of an increase in final demand for either sector’s products The employment effect is the marginal economy-wide impact on employment of a €1m increase in demand in a sector
From the Table above we see that the foreign dominated sector has an output multiplier of 1.2. In other words, for every €1m increase in final demand for the foreign dominated sectors, a further €200,000 in output is generated elsewhere in the economy. The employment effect is 3 which suggests that for each additional €1m in final demand, just under three full time equivalent (FTE) jobs are created in the economy.
19 For a discussion on the Leontief approach see ‘Input-Output Methodology Guide’, The Scottish Government, May 2011 20 The employment effect and employment multiplier are negatively correlated. 21 See ‘Input-Output Methodology Guide’, The Scottish Government, May 2011.
Department of Finance | Impact of Foreign-Owned Sector – Economic Impact Assessment of Ireland’s Corporation Tax Policy Page 24
Relative to the rest of economy, the foreign dominated MNE sectors have lower output and employment multipliers. This is not surprising given the capital intensity of the foreign-owned sector and, as described earlier in this Chapter, the foreign-owned sector has higher labour productivity levels and a high import content of final demand.22
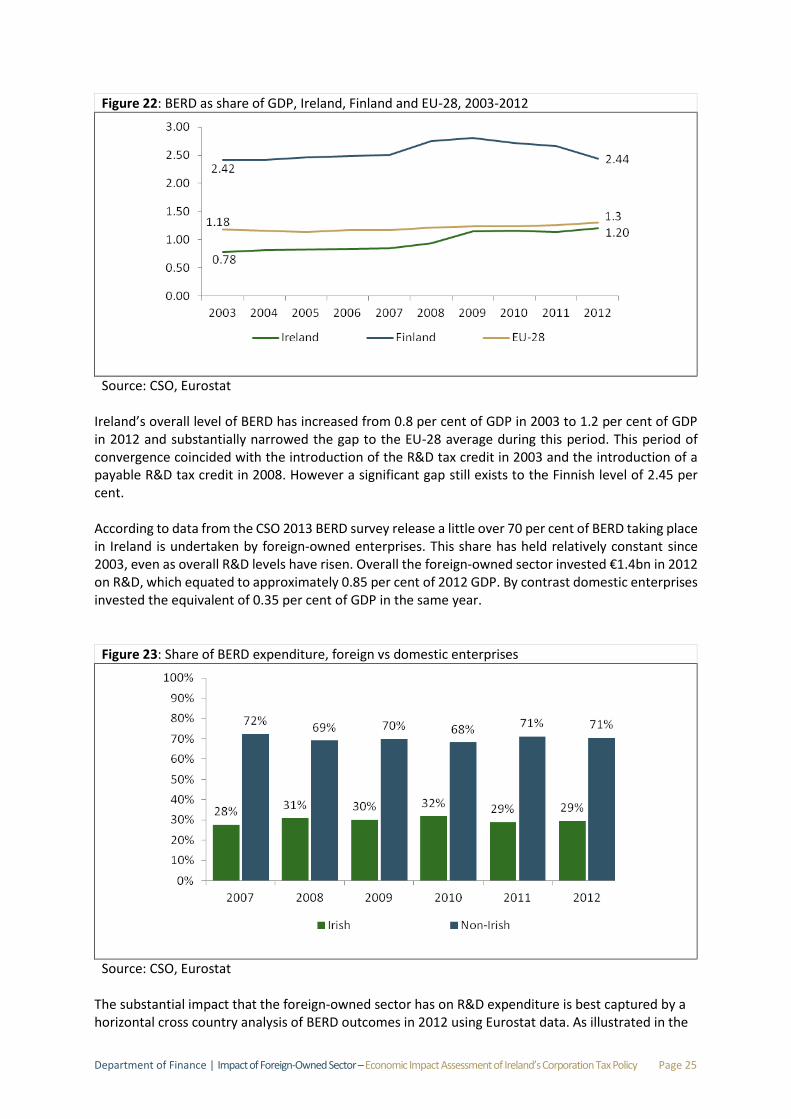
R&D and Innovation Outputs Introduction Previous sections discussed the direct impacts of the foreign-owned sector in Ireland in terms of output and employment. This section discusses more indirect impacts in terms of the contribution of the foreign-owned sector to R&D investment and innovation in the economy, factors generally viewed as important for productivity improvements and long term economic growth. Importance of R&D and Innovation The economic benefits of R&D and innovation expenditure can also be seen at the firm level through two main channels. The first channel is through innovations generated internally as a result of R&D activity. The second is through a firm’s capacity to absorb the knowledge spillovers occurring in other firms and incorporate them into their own production processes. This latter channel is seen to be dependent on the research and development capacity of the firm. Research and Development Expenditure Under Europe 2020,23 the EU ten year strategy for jobs and growth, the EU as a whole committed to investing 3 per cent of EU GDP in R&D by 2020 with Ireland committing to achieving a target of 2 per cent. The most recent Eurostat data for Ireland’s R&D investment levels relate to 2012 and show that Ireland had invested 1.7 per cent of GDP that year, up from 1.2 per cent in 2003. Overall R&D in an economy is split between business expenditure on R&D (BERD), higher level (HERD) and government (GvERD). The foreign-owned sector contributes to overall R&D expenditure through BERD and the impact of the sector on BERD can be measured through the biennial CSO and Eurostat BERD surveys. The Figure below shows Ireland’s overall trend in BERD compared with the EU 28 average. It also compares Ireland with Finland, the EU Member State with the highest BERD investment as a share of GDP.
22 Import multipliers for NACE level 2 are given in Table 12 of the Supply and Use and Input-Output Tables, which are generally in excess of 0.5. For instance NACE 21 (basic pharmaceutical products) has an import multiplier of 0.765, which suggests that for every €1m increase in final demand €765,000 is sourced produced from imported products. This compares with a much lower import multiplier of 0.29 for land transport services. 23 For a discussion of the EU 2020 strategy and the policy priorities and targets, see http://ec.europa.eu/europe2020/index en.htm
Department of Finance | Impact of Foreign-Owned Sector – Economic Impact Assessment of Ireland’s Corporation Tax Policy Page 25
Figure 22: BERD as share of GDP, Ireland, Finland and EU-28, 2003-2012
Source: CSO, Eurostat Ireland’s overall level of BERD has increased from 0.8 per cent of GDP in 2003 to 1.2 per cent of GDP in 2012 and substantially narrowed the gap to the EU-28 average during this period. This period of convergence coincided with the introduction of the R&D tax credit in 2003 and the introduction of a payable R&D tax credit in 2008. However a significant gap still exists to the Finnish level of 2.45 per cent. According to data from the CSO 2013 BERD survey release a little over 70 per cent of BERD taking place in Ireland is undertaken by foreign-owned enterprises. This share has held relatively constant since 2003, even as overall R&D levels have risen. Overall the foreign-owned sector invested €1.4bn in 2012 on R&D, which equated to approximately 0.85 per cent of 2012 GDP. By contrast domestic enterprises invested the equivalent of 0.35 per cent of GDP in the same year.
Figure 23: Share of BERD expenditure, foreign vs domestic enterprises
Source: CSO, Eurostat The substantial impact that the foreign-owned sector has on R&D expenditure is best captured by a horizontal cross country analysis of BERD outcomes in 2012 using Eurostat data. As illustrated in the
Department of Finance | Impact of Foreign-Owned Sector – Economic Impact Assessment of Ireland’s Corporation Tax Policy Page 26
figure below the impact of the foreign-owned sector on its own is equivalent to Norway’s overall level and just above that for Hungary, Italy, Spain or Portugal.
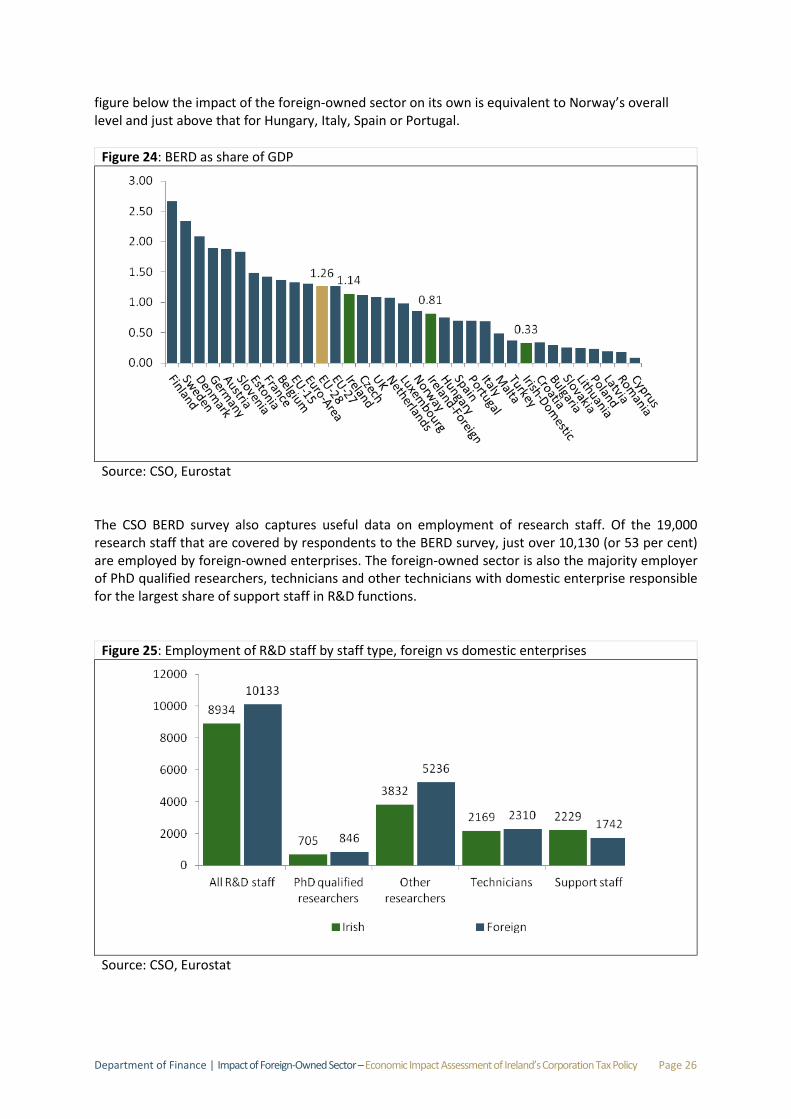
Figure 24: BERD as share of GDP
Source: CSO, Eurostat The CSO BERD survey also captures useful data on employment of research staff. Of the 19,000 research staff that are covered by respondents to the BERD survey, just over 10,130 (or 53 per cent) are employed by foreign-owned enterprises. The foreign-owned sector is also the majority employer of PhD qualified researchers, technicians and other technicians with domestic enterprise responsible for the largest share of support staff in R&D functions.
Figure 25: Employment of R&D staff by staff type, foreign vs domestic enterprises
Source: CSO, Eurostat
Department of Finance | Impact of Foreign-Owned Sector – Economic Impact Assessment of Ireland’s Corporation Tax Policy Page 27
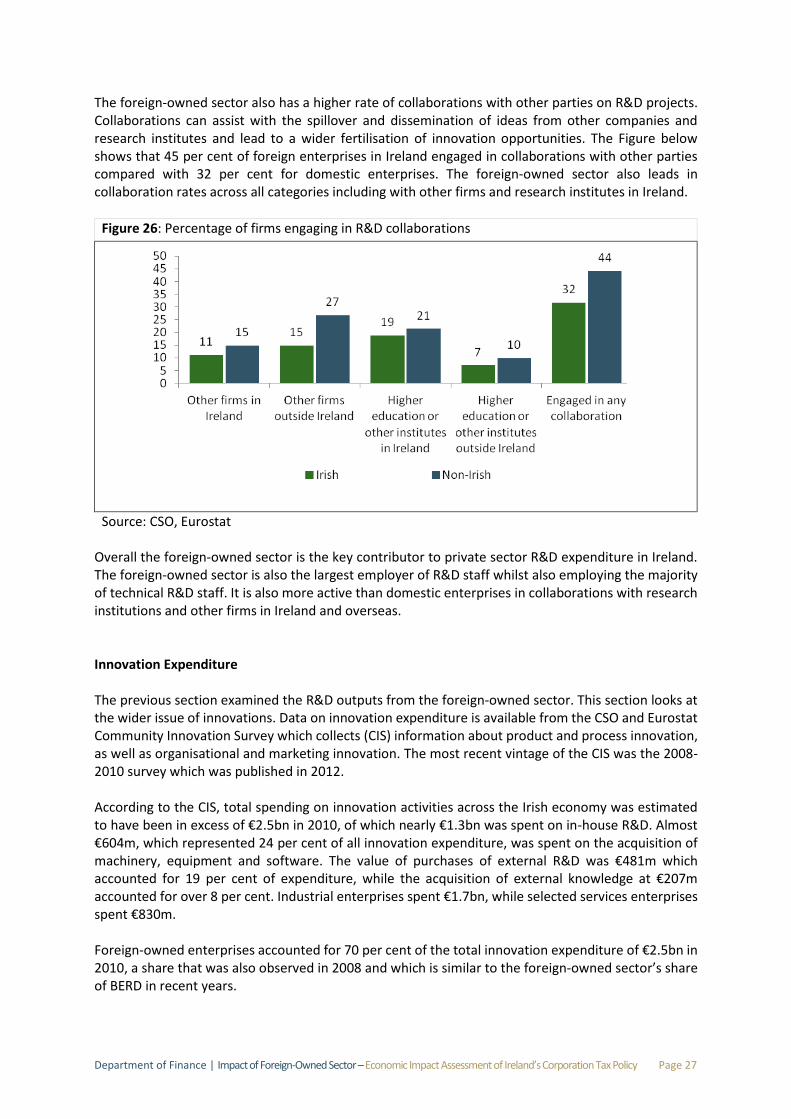
The foreign-owned sector also has a higher rate of collaborations with other parties on R&D projects. Collaborations can assist with the spillover and dissemination of ideas from other companies and research institutes and lead to a wider fertilisation of innovation opportunities. The Figure below shows that 45 per cent of foreign enterprises in Ireland engaged in collaborations with other parties compared with 32 per cent for domestic enterprises. The foreign-owned sector also leads in collaboration rates across all categories including with other firms and research institutes in Ireland.
Figure 26: Percentage of firms engaging in R&D collaborations
Source: CSO, Eurostat Overall the foreign-owned sector is the key contributor to private sector R&D expenditure in Ireland. The foreign-owned sector is also the largest employer of R&D staff whilst also employing the majority of technical R&D staff. It is also more active than domestic enterprises in collaborations with research institutions and other firms in Ireland and overseas. Innovation Expenditure The previous section examined the R&D outputs from the foreign-owned sector. This section looks at the wider issue of innovations. Data on innovation expenditure is available from the CSO and Eurostat Community Innovation Survey which collects (CIS) information about product and process innovation, as well as organisational and marketing innovation. The most recent vintage of the CIS was the 2008-2010 survey which was published in 2012. According to the CIS, total spending on innovation activities across the Irish economy was estimated to have been in excess of €2.5bn in 2010, of which nearly €1.3bn was spent on in-house R&D. Almost €604m, which represented 24 per cent of all innovation expenditure, was spent on the acquisition of machinery, equipment and software. The value of purchases of external R&D was €481m which accounted for 19 per cent of expenditure, while the acquisition of external knowledge at €207m accounted for over 8 per cent. Industrial enterprises spent €1.7bn, while selected services enterprises spent €830m. Foreign-owned enterprises accounted for 70 per cent of the total innovation expenditure of €2.5bn in 2010, a share that was also observed in 2008 and which is similar to the foreign-owned sector’s share of BERD in recent years.
Department of Finance | Impact of Foreign-Owned Sector – Economic Impact Assessment of Ireland’s Corporation Tax Policy Page 28
Figure 27: Share of innovation expenditure, domestic and foreign-owned enterprises
Source: CSO, Eurostat
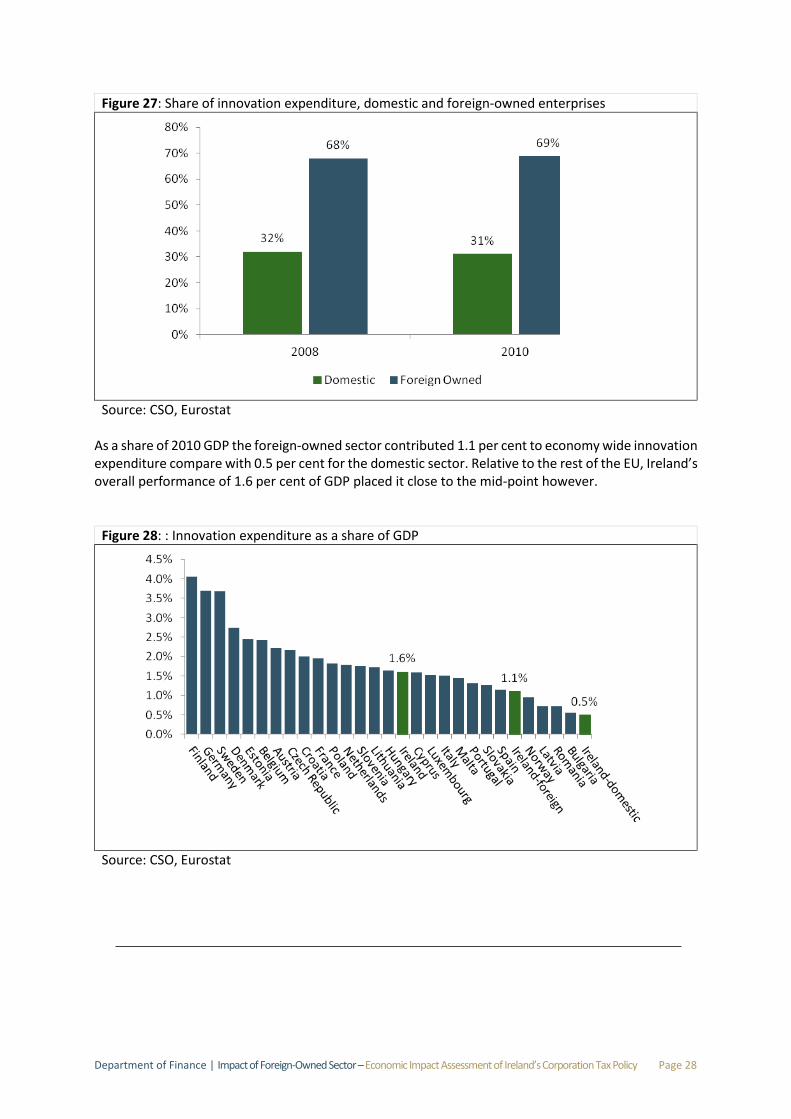
As a share of 2010 GDP the foreign-owned sector contributed 1.1 per cent to economy wide innovation expenditure compare with 0.5 per cent for the domestic sector. Relative to the rest of the EU, Ireland’s overall performance of 1.6 per cent of GDP placed it close to the mid-point however.
Figure 28: : Innovation expenditure as a share of GDP
Source: CSO, Eurostat


