EXTENSION CENTER FOR COMMUNITY VITALITY Economic Impact of Projects Leveraged by the Minnesota Historic Rehabilitation Tax Credit: Fiscal Year 2018 AN ECONOMIC IMPACT ANALYSIS PROGRAM REPORT Authored by Brigid Tuck, with contributions from Denis Gardner and Ginny Way FOR THE MINNESOTA DEPARTMENT OF ADMINISTRATION, STATE HISTORIC PRESERVATION OFFICE PHOTO: ST. AGATHA’S CONSERVATORY; PHOTO CREDIT: HESS ROISE AND COMPANY
Transcript
EXTENSION CENTER FOR COMMUNITY VITALITY
Economic Impact of Projects Leveraged by the Minnesota Historic Rehabilitation Tax Credit: Fiscal Year 2018
AN ECONOMIC IMPACT ANALYSIS PROGRAM REPORT Authored by Brigid Tuck, with contributions from Denis Gardner and Ginny Way
FOR THE MINNESOTA DEPARTMENT OF ADMINISTRATION, STATE HISTORIC PRESERVATION OFFICE PHOTO: ST. AGATHA’S CONSERVATORY; PHOTO CREDIT: HESS ROISE AND COMPANY
ECONOMIC IMPACT OF HISTORIC REHABILITATION TAX CREDIT IN FISCAL YEAR 2018 i
Cover Photo: St. Agatha’s Conservatory; Photo credit: Hess Roise and Company Prepared for: Minnesota Department of Administration, State Historic Preservation Office Acknowledgements: We would like to thank Denis Gardner and Ginny Way, both with the State Historic Preservation Office, for assistance in writing the history of the case studies. Notes on the Analysis: As part of Minnesota’s historic tax credit legislation, the State Historic Preservation Office “must annually determine the economic impact to the state from the rehabilitation of property for which credits or grants are provided” (Minnesota Statues, Chapter 290.0681, Subdivision 9). To complete this charge, the State Historic Preservation Office has contracted annually with University of Minnesota Extension’s economic impact analysis (EIA) program. Pursuant to Minnesota Statutes, Chapter 3.197 regarding the cost of reports, the total for this study was $2,500. The Minnesota State Historic Preservation Office is financed, in part, with federal funds from the National Park Service, U.S. Department of the Interior. However, the contents and opinions presented do not necessarily reflect the views or policies of the Department of the Interior, nor does the mention of trade names nor commercial products constitute endorsement or recommendation by the Department of the Interior. Regulations of the U.S. Department of Interior strictly prohibit unlawful discrimination in federally assisted programs on the basis of race, color, national origin, disability, or age. Any person who believes he or she has been discriminated against in any program, activity, or facility operated by a recipient of federal assistance should write to: Office of Equal Opportunity, National Park Service, 1849 C Street, N.W. Washington, DC, 20240. The data, analysis, and findings described in this report are specific to the geography, time period, and project requirements of the Minnesota Historic Rehabilitation Tax Credit. Findings are not transferable to other jurisdictions. Extension neither approves nor endorses the use or application of findings and other contents in this report by other jurisdictions.
Economic Impact of Projects Leveraged by the Minnesota Historic Rehabilitation Tax Credit: Fiscal Year 2018 AN ECONOMIC IMPACT ANALYSIS PROGRAM REPORT
November 2018 Authored by Brigid Tuck, Senior Economic Impact Analyst, Center for Community Vitality, with contributions from Denis Gardner, National Register Historian, and Ginny Way, National Register Architectural Historian, State Historic Preservation Office Editor: Elyse Paxton, Senior Editor, Center for Community Vitality
ECONOMIC IMPACT OF HISTORIC REHABILITATION TAX CREDIT IN FISCAL YEAR 2018 ii
Table of Contents EXECUTIVE SUMMARY 1 INTRODUCTION 2 ECONOMIC IMPACT IN FISCAL YEAR 2018 3 Direct Effect in Fiscal Year 2018 3 Indirect and Induced Effects 5 Total Impact in Fiscal Year 2018 5 Top Sectors Impacted 6 Fiscal Year 2018 Economic Impact in Context of Minnesota’s Economy 8 CASE STUDIES OF COMPLETED PROJECTS 9 Kirch-Latsch Building 10 Lake Street Sash and Door Company 12 Maass and McAndrew Company 14 McCloud-Edgerton House 16 O’Donnell Shoe Factory 18 Parlin and Orendorff Plow Company 20 SUMMARY OF PAST RESEARCH 22 Total Impacts: Fiscal Years 2011 to 2018 22 Total Impacts by Fiscal Year 22 APPENDIX 1: DEFINITION OF TERMS 25
ECONOMIC IMPACT OF HISTORIC REHABILITATION TAX CREDIT IN FISCAL YEAR 2018 1
EXECUTIVE SUMMARY: ECONOMIC IMPACT OF PROJECTS LEVERAGED BY THE MINNESOTA HISTORIC REHABILITATION TAX CREDIT IN FISCAL YEAR 2018
In April 2010, the Minnesota Historic Rehabilitation Tax Credit was signed into law. The goal of the credit
is to stimulate job growth, increase local tax bases, and revitalize communities across the state. It allows
either a state income tax credit or a grant in lieu of the credit. A state income tax credit up to 20 percent
of qualifying expenses is available if a property meets eligibility requirements. Alternatively, a grant in lieu
of the credit (equal to 90 percent of allowable credit) is available to property owners. The Federal Historic
Preservation Tax Incentives Program also provides a federal historic tax credit.
Each year, the State Historic Preservation Office contracts with Extension to determine the economic
impact of the state historic tax credit. This report quantifies the results of the tax credit for fiscal year
2018 and summarizes its total impact during eight years of the program. It also features six case studies,
which highlight completed projects and their impact on economic activity and property values.
Output Effects: In FY 2018, the total estimated economic impact of the Minnesota Historic
Rehabilitation Tax Credit was $715.2 million. Directly, through rehabilitation, the state historic tax
credit created $393.4 million of construction activity. This construction activity then generated $321.8
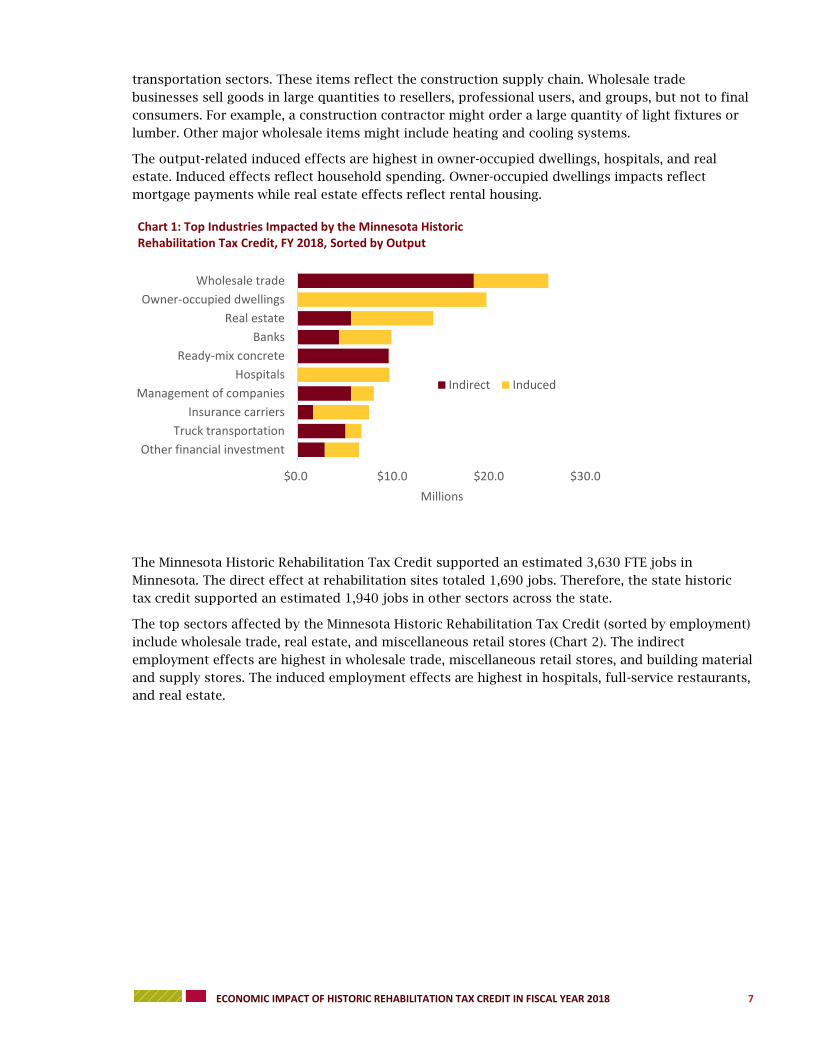
million of output in other industries in Minnesota. Sectors most impacted include wholesale trade,
owner-occupied housing, and real estate.
Employment Effects: In FY 2018, the Minnesota Historic Rehabilitation Tax Credit supported an
estimated 3,630 full-time equivalent (FTE) jobs in the state. This includes the 1,690 jobs at
rehabilitation sites during the construction activity (direct effect). It also includes 1,940 jobs at
supporting industries. Sectors most impacted include wholesale trade, real estate, and miscellaneous
retail stores.
Labor Income Effects: In FY 2018, the Minnesota Historic Rehabilitation Tax Credit generated an
estimated $235.2 million in labor income. Directly, the rehabilitation activities created $121.5 million
in labor income. Because of spending for rehabilitation, another $113.7 million of labor income was
generated across all industries in Minnesota.
Tax Credit: The projects, upon completion, will be eligible for $75.3 million of state historic tax
credits. Thus, for every dollar of state historic tax credit, private developers plan to invest $6.93 of
their own funds. Given a total impact of $715.2 million of activity, each dollar of the Minnesota
Historic Rehabilitation Tax Credit generates $9.50 of economic activity in the state.
Total Impact 2011-2018: Since the state historic tax credit became available in 2011, 119 projects
have received initial approval. These projects have generated an estimated $3.0 billion of economic
activity in the state. This includes $993.5 million in labor income (dollar figures are adjusted to 2018
dollars). The state historic tax credit has supported 16,557 jobs.
Highlighted Completed Projects: This study features six completed projects—the Kirch-Latsch
Building, Lake Street Sash and Door Company, Maass and McAndrew Company, McCloud-Edgerton
House, O’Donnell Shoe Company Factory, and Parlin and Orendorff Plow Company. Combined, the
projects generated $146.2 million in economic activity.
ECONOMIC IMPACT OF HISTORIC REHABILITATION TAX CREDIT IN FISCAL YEAR 2018 2
INTRODUCTION
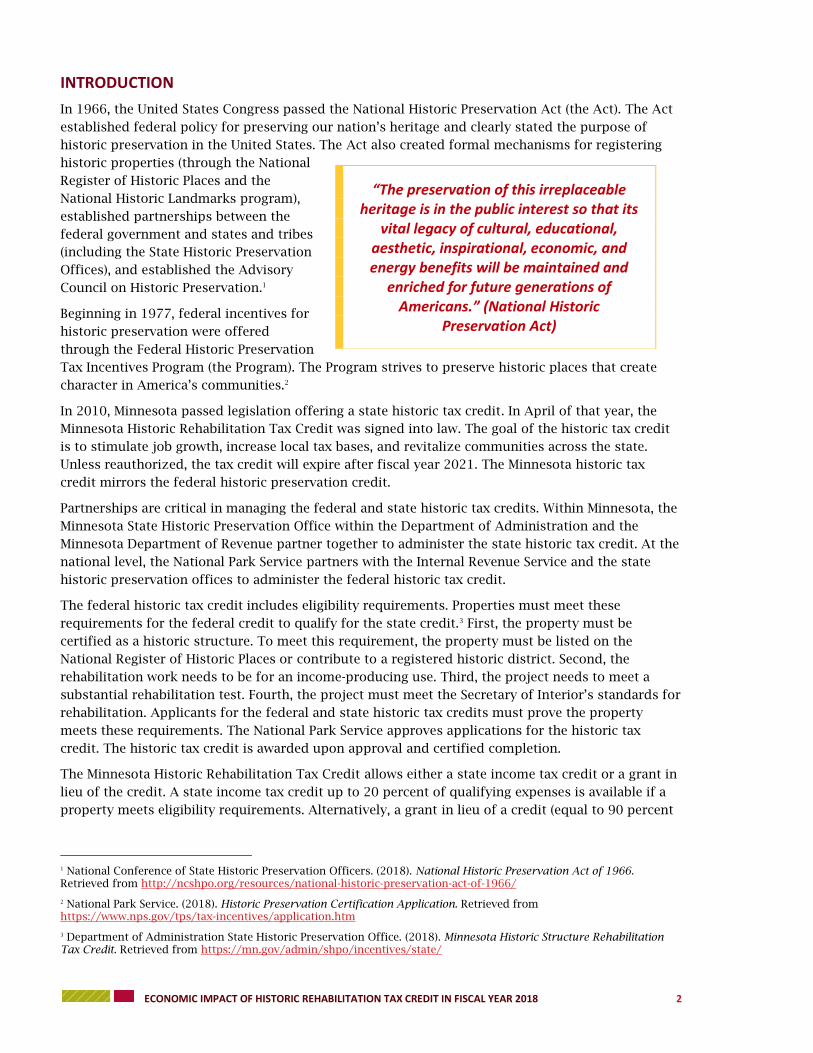
In 1966, the United States Congress passed the National Historic Preservation Act (the Act). The Act
established federal policy for preserving our nation’s heritage and clearly stated the purpose of
historic preservation in the United States. The Act also created formal mechanisms for registering
historic properties (through the National
Register of Historic Places and the
National Historic Landmarks program),
established partnerships between the
federal government and states and tribes
(including the State Historic Preservation
Offices), and established the Advisory
Council on Historic Preservation.1
Beginning in 1977, federal incentives for
historic preservation were offered
through the Federal Historic Preservation
Tax Incentives Program (the Program). The Program strives to preserve historic places that create
character in America’s communities.2
In 2010, Minnesota passed legislation offering a state historic tax credit. In April of that year, the
Minnesota Historic Rehabilitation Tax Credit was signed into law. The goal of the historic tax credit
is to stimulate job growth, increase local tax bases, and revitalize communities across the state.
Unless reauthorized, the tax credit will expire after fiscal year 2021. The Minnesota historic tax
credit mirrors the federal historic preservation credit.
Partnerships are critical in managing the federal and state historic tax credits. Within Minnesota, the
Minnesota State Historic Preservation Office within the Department of Administration and the
Minnesota Department of Revenue partner together to administer the state historic tax credit. At the
national level, the National Park Service partners with the Internal Revenue Service and the state
historic preservation offices to administer the federal historic tax credit.
The federal historic tax credit includes eligibility requirements. Properties must meet these
requirements for the federal credit to qualify for the state credit.3 First, the property must be
certified as a historic structure. To meet this requirement, the property must be listed on the
National Register of Historic Places or contribute to a registered historic district. Second, the
rehabilitation work needs to be for an income-producing use. Third, the project needs to meet a
substantial rehabilitation test. Fourth, the project must meet the Secretary of Interior’s standards for
rehabilitation. Applicants for the federal and state historic tax credits must prove the property
meets these requirements. The National Park Service approves applications for the historic tax
credit. The historic tax credit is awarded upon approval and certified completion.
The Minnesota Historic Rehabilitation Tax Credit allows either a state income tax credit or a grant in
lieu of the credit. A state income tax credit up to 20 percent of qualifying expenses is available if a
property meets eligibility requirements. Alternatively, a grant in lieu of a credit (equal to 90 percent
1 National Conference of State Historic Preservation Officers. (2018). National Historic Preservation Act of 1966. Retrieved from http://ncshpo.org/resources/national-historic-preservation-act-of-1966/
2 National Park Service. (2018). Historic Preservation Certification Application. Retrieved from https://www.nps.gov/tps/tax-incentives/application.htm
3 Department of Administration State Historic Preservation Office. (2018). Minnesota Historic Structure Rehabilitation Tax Credit. Retrieved from https://mn.gov/admin/shpo/incentives/state/
“The preservation of this irreplaceable heritage is in the public interest so that its
vital legacy of cultural, educational, aesthetic, inspirational, economic, and energy benefits will be maintained and
enriched for future generations of Americans.” (National Historic
ECONOMIC IMPACT OF HISTORIC REHABILITATION TAX CREDIT IN FISCAL YEAR 2018 3
of allowable credit) is available to property owners. The federal tax credit also allows an income tax
credit of 20 percent for qualifying expenses.
In December 2017, the United States Congress enacted Public Law Number 115-97 to amend the
Internal Revenue Code. The Public Law modifies the 20 percent historic rehabilitation tax credit and
repeals the 10 percent rehabilitation tax credit for non-historical buildings. It also provides
transition rules for both historic tax credits. While this change does not affect the projects within
this report, it will potentially affect a taxpayer’s ability to use the historic tax credit in the future.
By law, the State Historic Preservation Office “must annually determine the economic impact to the
state from the rehabilitation of property for which credits or grants are provided.” Since 2011,
University of Minnesota Extension has analyzed and reported on the economic impact of the state
historic tax credit. Although the federal and state tax credit can be paired together, the focus of this
report is on the state historic tax credit, as this is the direction given by state law.
This report examines the economic impact of the Minnesota Historic Rehabilitation Tax Credit on
multiple levels. First, it quantifies the impact of projects receiving initial approval in fiscal year (FY)
2018 (July 1, 2017 to June 30, 2018). Second, it presents six case studies of fully completed projects.
The case studies highlight the type of projects receiving the state historic tax credit, demonstrate
the economic impact of the individual projects, and show the effect of rehabilitation on estimated
market values (used for establishing property taxes). Finally, the report summarizes the economic
impact of the state historic tax credit during the eight years the state law has existed.
ECONOMIC IMPACT IN FISCAL YEAR 2018
Economic impact is comprised of direct, indirect, and induced effects. In this analysis, the direct
effect is the construction activity occurring at properties receiving the state historic tax credit. In
calculating economic impact, the first step is to quantify the direct effect.
Once quantified, the direct effect is entered into an input-output model. Input-output models trace
the flow of goods and services throughout an economy. Based on this information, one can measure
how a change in one part of the economy will affect other parts. Indirect and induced effects
measure the change in other parts of the economy created by the direct effect. Extension used the
input-output model IMPLAN to calculate the indirect and induced effects. 4
Direct Effect in Fiscal Year 2018
The direct effect of the Minnesota Historic Rehabilitation Tax Credit is the spending occurring at the
properties during the rehabilitation work. To measure the direct effect, the State Historic
Preservation Office provided Extension with details on the projects approved for the state historic
tax credit in FY 2018.
Property owners and developers seeking the state historic tax credit must follow procedures. The
National Park Service and the State Historic Preservation Office follow a rehabilitation project from
conception to completion. There are multiple points during the process where those seeking the
state historic tax credit must receive approval before moving forward. The National Park Service uses
numbers (Parts I, II, and III) to track the process. Minnesota’s State Historic Preservation Office uses
a letter (Part A and B) system. Within the system, Part II and Part A go together and Part III and Part
B pair. The National Park Service does have a Part I application, but it is not required for all
applicants. The other parts are mandatory for everyone.
4 IMPLAN software from MIG, Inc. Learn more at implan.com.
ECONOMIC IMPACT OF HISTORIC REHABILITATION TAX CREDIT IN FISCAL YEAR 2018 4
To receive the state historic tax credit, all applicants
must file for Part II approval before beginning work.
Once the project is complete, all applicants file for
Part III certification. The National Park Service must
certify all work is complete in order to award the state
historic tax credit.
As part of Part II approval, all state historic tax credit
applicants must complete the Minnesota State Historic
Preservation Office’s Part A application. The Part A
application collects information on estimated project
costs. The form seeks detailed information including
acquisition costs, site work, concrete, masonry, architecture and design services, legal, and
consulting fees. This is the detailed information Extension used to calculate the economic impact of
projects receiving Part II approval (ready to begin work) during FY 2018.
In fiscal year 2018, 16 properties received the initial Part II approval (Table 1). They filed the Part A
application detailing their planned expenditures to complete the rehabilitation work.
Table 1: Minnesota Historic Rehabilitation Tax Credit Projects Receiving National Park Service Part II Approval between July 1, 2017 and June 30, 2018 (FY 2018)
Historic Property Name Current Property Name Proposed Use Location
Board of Trade Office/Retail Duluth
Boarding House Office Saint Paul
Commission House Seestedt Building Retail/Residential Saint Paul
Dayton’s Department Store Macy’s Department Store Office/Retail Minneapolis
Degree of Honor Protective Association Building Residential Saint Paul
Fiterman Store and Factory Retail/Residential Minneapolis
Hillman Mechanical Equipment Building Retail Minneapolis
Hope Engine Company No. 3 Retail Saint Paul
Laurel Apartments Residential Minneapolis
Louise Building Retail/Residential Saint Paul
Merchants National Bank Office Saint Paul
Minnesota Mutual Life Insurance Company
Building
Residential Saint Paul
Porter Electric Warehouse #2 Office/Retail Minneapolis
Osborn Building Office Saint Paul
Rand Tower Hotel Minneapolis
St. Agatha’s Conservatory of Music and Arts Exchange Building Hotel Saint Paul
Source: Part A applications submitted to the State Historic Preservation Office
Federal Applications: Part I: Evaluation of significance
Part II: Approval before work begins Part III: Certifies work is complete
State Applications:
Part A: Budgeted project costs Part B: Actual project costs
ECONOMIC IMPACT OF HISTORIC REHABILITATION TAX CREDIT IN FISCAL YEAR 2018 5
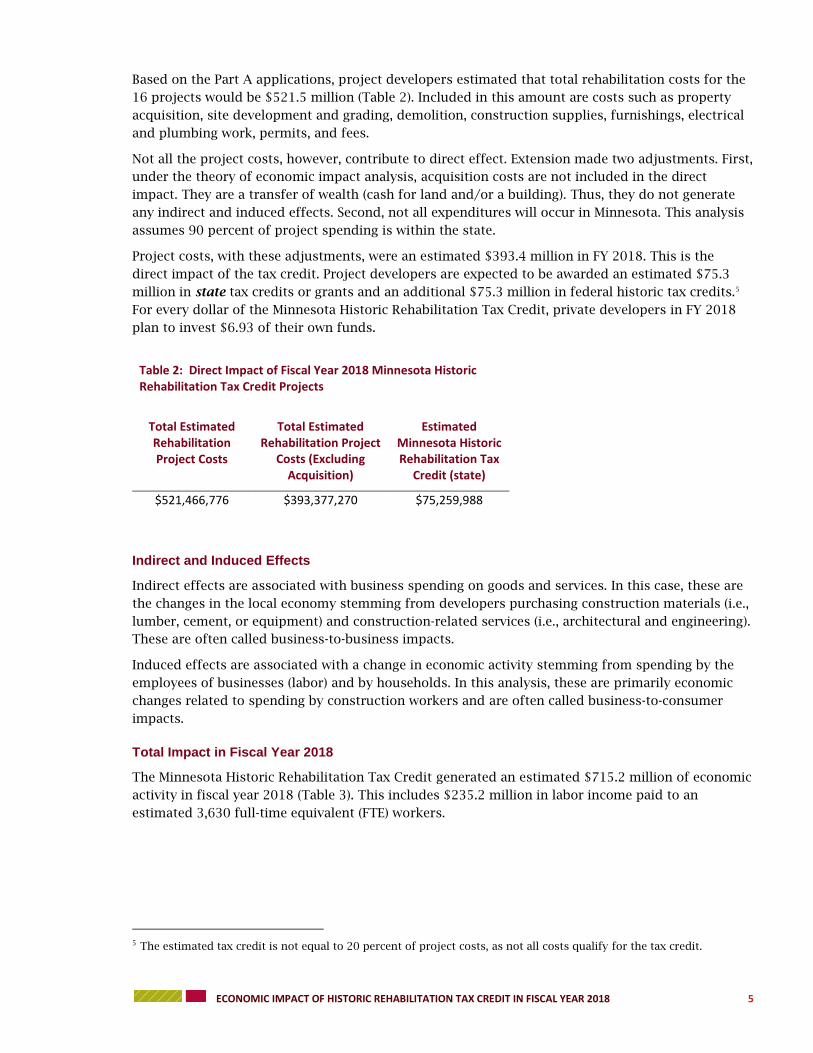
Based on the Part A applications, project developers estimated that total rehabilitation costs for the
16 projects would be $521.5 million (Table 2). Included in this amount are costs such as property
acquisition, site development and grading, demolition, construction supplies, furnishings, electrical
and plumbing work, permits, and fees.
Not all the project costs, however, contribute to direct effect. Extension made two adjustments. First,
under the theory of economic impact analysis, acquisition costs are not included in the direct
impact. They are a transfer of wealth (cash for land and/or a building). Thus, they do not generate
any indirect and induced effects. Second, not all expenditures will occur in Minnesota. This analysis
assumes 90 percent of project spending is within the state.
Project costs, with these adjustments, were an estimated $393.4 million in FY 2018. This is the
direct impact of the tax credit. Project developers are expected to be awarded an estimated $75.3
million in state tax credits or grants and an additional $75.3 million in federal historic tax credits.5
For every dollar of the Minnesota Historic Rehabilitation Tax Credit, private developers in FY 2018
plan to invest $6.93 of their own funds.
Table 2: Direct Impact of Fiscal Year 2018 Minnesota Historic Rehabilitation Tax Credit Projects
Total Estimated Rehabilitation Project Costs
Total Estimated Rehabilitation Project
Costs (Excluding Acquisition)
Estimated Minnesota Historic Rehabilitation Tax
Credit (state)
$521,466,776 $393,377,270 $75,259,988
Indirect and Induced Effects
Indirect effects are associated with business spending on goods and services. In this case, these are
the changes in the local economy stemming from developers purchasing construction materials (i.e.,
lumber, cement, or equipment) and construction-related services (i.e., architectural and engineering).
These are often called business-to-business impacts.
Induced effects are associated with a change in economic activity stemming from spending by the
employees of businesses (labor) and by households. In this analysis, these are primarily economic
changes related to spending by construction workers and are often called business-to-consumer
impacts.
Total Impact in Fiscal Year 2018
The Minnesota Historic Rehabilitation Tax Credit generated an estimated $715.2 million of economic
activity in fiscal year 2018 (Table 3). This includes $235.2 million in labor income paid to an
Chart 3: Percent of Output by Industry, Minnesota, 2016
ECONOMIC IMPACT OF HISTORIC REHABILITATION TAX CREDIT IN FISCAL YEAR 2018 9
The state historic tax credit also supported 3,630 jobs in Minnesota. In comparison, Minnesota
provided 3.7 million jobs. Nearly one-third of these jobs were in the professional and business
services industry (Chart 4). Other major industry employers include trade and health and social
services. The construction industry employed around 5 percent of Minnesota’s workforce. There
were approximately 181,500 jobs in the industry. The state historic tax credit directly supported
1,690 of those jobs.
CASE STUDIES OF COMPLETED PROJECTS
Since the Minnesota Historic Rehabilitation Tax Credit became law, 119 properties have received
initial approval. During its eight-year history, many projects have moved from Part II approval to
completion. This section of the report highlights six completed projects.
0.0% 5.0% 10.0% 15.0% 20.0% 25.0% 30.0%
Mining & utilitiesAgriculture, forestry, fishing
Transportation & warehousingConstruction
Other servicesManufacturing
Leisure & hospitalityGovernment
Health & social servicesTrade
Professional & business services
Chart 4: Percent of Employment by Industry, Minnesota, 2016
ECONOMIC IMPACT OF HISTORIC REHABILITATION TAX CREDIT IN FISCAL YEAR 2018 10
Background
The Kirch-Latsch building is located in historic downtown Winona. The building was constructed in
stages between 1860 and 1880. J.B. Kirch and Company, a farm implement and equipment dealer,
was the first occupant of the building. In the mid-1880s, Latsch and Son, a growing grocery retailer
and wholesaler, purchased the building. The company was located in Winona to capitalize on river
and rail connections, which helped the business thrive.7 Although the company owned several
buildings in the historic commercial heart of Winona, this building is the only one still standing.8
John A. Latsch (the son) is well-known in Winona for his philanthropy. As a young adult, while
enjoying an afternoon on the Mississippi River, he stepped on private land. The landowner chased
him off. Because of this experience, Latsch vowed to provide additional public places for children to
play. As a result, he donated nearly 20,000 acres of his personal land to public entities, including
land for John A. Latsch State Park. He also donated land to Whitewater State Park, Bluffside Park,
Prairie Island, Westfield Golf Course, Athletic Park, Gabrych Park, Latsch Island, and Aghaming Park
in the Winona area.9
The Kirch-Latsch building was placed onto the National Register of Historic Places in 1975. The
combination of the Gothic Revival and Italiante architecture makes it unique.10 The building
highlights the transition from one style to the other during that time.
The historical name of the building is the Kirch-Latsch building, based on the early tenants of the
building. However, since Latsch and Son was the more well-known occupant, it is commonly called
7 Wikipedia. (n.d.). Latsch Building. Retrieved from https://en.wikipedia.org/wiki/Latsch_Building 8 HBC Newsdesk. (2014, October 13). New life being breathed into historic Winona building. Retrieved from http://www.hbci.com/tv25/news/new-life-being-breathed-into-historic-winona-building/ 9 Squires, S. (2014, May 30). John A. Latsch, the man, the legacy. Retrieved from http://www.winonapost.com/News/ArticleID/40638/John-A-Latsch-the-man-the-legacy 10 National Park Service. (1975). National Registry of Historic Places inventory nomination form. Retrieved from https://npgallery.nps.gov/NRHP/GetAsset/b4c12551-5b11-4eb2-89fc-2c74e3a67570
ECONOMIC IMPACT OF HISTORIC REHABILITATION TAX CREDIT IN FISCAL YEAR 2018 11
the Latsch and Son building. The Latsch and Son building houses commercial tenants, including a
credit union on the main floor. Offices are located on the second floor.11 While rail access is no
longer available in the rear of the building, it does connect to Levy Park.
Project Financing and Economic Impact
Latsch Building Partnership received initial approval for the project in FY 2015. At the time, it
estimated that project costs qualifying for the state historic tax credit would be $3.0 million. The
estimated state historic tax credit based on that investment was $485,000.
On December 31, 2015, the project was completed when the Latsch and Son building was placed into
service. Latsch Building Partnership reported spending a total of $4.4 million, of which $3.6 million
qualified for the state historic tax credit (Table 4). In the end, the project received $711,084 in state
historic tax credits.
During rehabilitation, the Kirch-Latsch building project generated an estimated $6.9 million of
economic activity. As a result, for each dollar of state historic tax credit invested, the project created
$9.70 of activity. This includes private investments by the developer and the induced and indirect
effects generated by the project. 12
In addition to economic activity, the project also increased the property value of the building. Before
rehabilitation, the property value was $134,200. Upon project completion, the property value
increased by 997 percent to $1.5 million.
Table 4: Project Financing and Economic Impact of the Kirch-Latsch Building
Total Final Project Costs (millions) $4.4
Total Qualifying Rehabilitation Costs (millions) $3.6
State Historic Tax Credit $711,084
Economic Impact of Construction (millions) $6.9
Total Economic Activity Per Dollar of Tax Credit $9.70
Property Value 2014 $134,200
Property Value 2018 (millions)13 $1.5
11 The Latsch and Son Building. (2018). Our tenants. Retrieved from http://www.latschbuilding.com/ 12 The ratio of total economic activity per dollar of tax credit can vary, depending on the nature of the project. Two factors influence the ratio. One, the amount of additional investment by the developer (beyond the tax credit). Two, the nature of the project and the type of spending influence the magnitude of indirect and induced impacts. 13 Property value is estimated market value. Property tax value for parcel 320000500 accessed via Winona County Beacon.
ECONOMIC IMPACT OF HISTORIC REHABILITATION TAX CREDIT IN FISCAL YEAR 2018 12
Background
The Lake Street Sash and Door Company property represents Minneapolis’ history in the millwork
industry (the manufacturing of blinds, sashes, doors, shingles, moldings, stairs, and carpentry).
Minneapolis’ location as the center of lumber supply, sawmill capacity, millwork demand, and
transportation routes made it the epicenter of the millwork industry in the 1880s. Historian Isaac
Atwater commented during this period, “Minneapolis had more machinery engaged in the
manufacture of sash, doors, and blinds than any other city on the continent.”14
In 1864, Minnesota Central Railway Company constructed a railroad that connected Saint Anthony
Falls to Fort Snelling. This rail connection became a critical transportation corridor and helped spur
development. The corridor’s location near lumber being floated downriver from Northern Minnesota
and the sawmills needed to plane the wood, along with the availability of land, attracted the
millwork industry to the area. Fueled by demand from new businesses being established in
Minneapolis, along with population growth in the Upper Midwest, the millwork industry expanded
rapidly. 15
In 1916, Lake Street Sash and Door Company was founded. It quickly outgrew its original location,
and in 1922, it petitioned the city to expand to 4041 Hiawatha Avenue. The company built a factory,
warehouse, and lumber shed on the property. Together, it spanned an entire city block. The
company moved into the new building in 1926.
The property was added to the National Register of Historic Places in 2016. Documentation for its
placement reflects the good integrity of the buildings. The factory and the warehouse feature their
original historic appearance, design, and material use. The building reflects Minneapolis’ history in
the millwork industry and fits with the neighboring historic industrial buildings.16
14 National Park Service. (2016). National Register of Historic Places registration form. Retrieved from https://www.nps.gov/nr/feature/places/pdfs/16000440.pdf 15 Christensen, T. (n.d.). Factory not being razed; will be made over into loft apartments. Retrieved from http://www.longfellownokomismessenger.com/factory-not-being-razed-will-be-made-over-into-loft-apartments/ 16 National Park Service. (2016). National Register of Historic Places registration form. Retrieved from https://www.nps.gov/nr/feature/places/pdfs/16000440.pdf
ECONOMIC IMPACT OF HISTORIC REHABILITATION TAX CREDIT IN FISCAL YEAR 2018 13
The property is now known as Millworks Lofts and provides affordable housing. The property
features 55 one-bedroom apartments, 22 two-bedroom apartments, and one three-bedroom
apartment. It also offers amenities, such as multiple community rooms, a fitness and yoga studio, a
rooftop patio, and covered parking. The buildings maintain their historic feel, and apartments are
loft style, featuring high ceilings, polished concrete floors, and timber posts and beams.
Project Financing and Economic Impact
Dominium received initial approval for the project in FY 2016. At the time, the developer estimated
project costs to be $34.3 million. Based on this, the applicable state historic tax credit was estimated
at $5.9 million.
The projected ended on June 29, 2017 when Dominium placed the Lake Street Sash and Door
Company building (Millworks Lofts) into service. Upon project completion, the developer reported
spending a total of $34.3 million on the project, of which $28.8 million were costs qualifying for the
state historic tax credit (Table 5). As a result, Dominium received $5.8 million in state historic tax
credits.
The project generated an estimated $52.7 million in economic activity during the rehabilitation
phase. For every one dollar of state historic tax credit invested, the project generated $9.20 of
economic activity.17 Before rehabilitation, the property value was $1.6 million. Upon project
completion, the property value increased by 585 percent to $10.8 million.
Table 5: Project Financing and Economic Impact of the Lake
Street Sash and Door Company
Total Final Project Costs (millions) $34.3
Total Qualifying Rehabilitation Costs (millions) $28.8
State Historic Tax Credit (millions) $5.8
Economic Impact of Construction (millions) $52.7
Total Economic Activity Per Dollar of Tax Credit $9.20
Property Value 2015 (millions) $1.6
Property Value 2018 (millions)18 $10.8
17 The ratio of total economic activity per dollar of state historic tax credit includes private developer investment, as
well as the indirect and induced effects.
18 Property value is estimated market value. Property tax values accessed via City of Minneapolis PropertyInfo.
ECONOMIC IMPACT OF HISTORIC REHABILITATION TAX CREDIT IN FISCAL YEAR 2018 14
Background
The building located at 12-14 4th Street SW in Rochester, Minnesota was commissioned in 1900 by
the Rochester Woolen Manufacturing Company. In 1909, after three years as a garment factory and
five years as the Conley Camera Company manufacturing plant, it became a workshop and
showroom for the Maass and McAndrew Company, an early Rochester plumbing and mechanical
systems contractor with strong ties to the nascent Mayo medical practice.
In 1909, the company commissioned Garfield Schwartz to design the present north entryway and
display windows. This replaced the original four openings with plate glass, prismatic glass block
windows, and a decorative recessed entryway that would improve visual access to the showroom
from the street and help advertise the company's wares.
In 1910, when the building opened, Maass and McAndrew was the only firm listed under “plumbing”
in Rochester’s city directory. It was also the only local business offering plumbing and heating
supplies or services that was not primarily a hardware store.
At the time, the Mayo medical practice had a strong surgical focus and a growing reputation for
successful outcomes. The Maass and McAndrew Company supported the Mayo brothers’ early
practice of aseptic surgery by designing and fabricating sterilizers and portable operating room
furnishings that could be sterilized with steam. Since some of these furnishings were adopted by
physicians who observed their use in Rochester, they also contributed to a broader national
movement toward universal adoption of the aseptic surgical technique. In addition, the Maass and
McAndrew Company supported the Mayo medical practice’s innovations in surgery and research by
fabricating specialized devices and working on the design and installation of systems for all of its
offices and research facilities, as well as the hospitals it served. The Mayo medical practice
presented ideas to the Maass and McAndrew Company, who supplied the design and technical
assistance necessary for implementation.
By 1920, the company had sectioned off the east half of the showroom to create a separate leasable
storefront, as most of the building’s east wall had been obscured by the construction of an adjacent
ADDRESS 12-14 4th Street SW
Rochester, Minnesota
DATE BUILT 1900
REHABILITATION 2015-2016
DEVELOPER CMD Holdings
ORIGINAL USE Woolen Mill
CURRENT USE Office
MAASS AND
MCANDREW COMPANY
Photo Credit: Richard Wiener
ECONOMIC IMPACT OF HISTORIC REHABILITATION TAX CREDIT IN FISCAL YEAR 2018 15
building. The building has been rented by various tenants since 1929 when the Maass and McAndrew
Company sold the property.
The building’s new owners, Hunter and Traci Downs, rehabilitated the commercial building for use
as a restaurant and office space.
Project Financing and Economic Impact
During FY 2016, CMD Holdings received approval to begin the Maass and McAndrew Company
building project. In the initial application, the developer estimated project costs at $2.3 million. Based
on this, the potential state historic tax credit was estimated at $438,500 (Table 6).
The project ended on November 28, 2016 when the Maass and McAndrew Company building was
placed into service. Upon project completion, the developer reported spending $3.3 million, of which
$2.8 million qualified for the state historic tax credit. CMD Holdings received $561,841 in state
historic tax credits.
Based on these final reported expenditures, the project generated an estimated $6.7 million in
economic activity during the rehabilitation phase. For every one dollar of state historic tax credit
invested, the project generated $11.80 of economic activity. 19
Property values also increased because of rehabilitation. Prior to the project (2015), the property
value was $424,300. Upon project completion, the property value increased by 248 percent to $1.5
million.
Table 6: Project Financing and Economic Impact of Maass
and McAndrew Company Building
Total Project Cost (millions) $3.3
Total Qualifying Rehabilitation Costs (millions) $2.8
State Historic Tax Credit $561,841
Economic Impact of Construction (millions) $6.7
Total Economic Activity Per Dollar of Tax Credit $11.80
2015 Property Tax Value $424,300
2018 Property Tax Value (millions)20 $1.5
19 The ratio of total economic activity per dollar of state historic tax credit includes private developer investment, as
well as the indirect and induced effects.
20 Property tax value is estimated market value. Value from Olmsted County property records search.
Photo from the Minnesota Historical Society
ECONOMIC IMPACT OF HISTORIC REHABILITATION TAX CREDIT IN FISCAL YEAR 2018 16
Background
The McCloud-Edgerton House is located in Saint Paul’s historic Irvine Park neighborhood. Irvine Park
was designated as a historic district in 1973. The National Park Service granted the designation
because of the house’s distinct residential reflection of each phase of Saint Paul’s 19th century
economic development: the early- and mid-1850s, the post-Civil War period, and the 1890s. Further,
several of Saint Paul’s influential political, economic, military, medical, and religious leaders of the
era had ties to the neighborhood. Prime examples include Alexander Ramsey (the second governor
of Minnesota) and John Irvine (a pioneer landlord and realtor).21
The McCloud-Edgerton House was constructed in 1868 on Fort Road as a rental property. The
Edgerton family purchased the home in 1872. The family owned the property until 1909. In 1916, a
new set of owners moved the house from Fort Road to Walnut Street where they lived until the
1940s. Ownership of the house again transitioned. The last family to occupy the house lived on one
side of the duplex and operated a beauty parlor on the other side.22
By 2011, the McCloud-Edgerton House was in significant disrepair. The City of Saint Paul classified
the house as a Category 2 registered vacant building. Category 2 homes are condemned or have
multiple housing violations.23 Historic Saint Paul acquired the house with plans to sell for
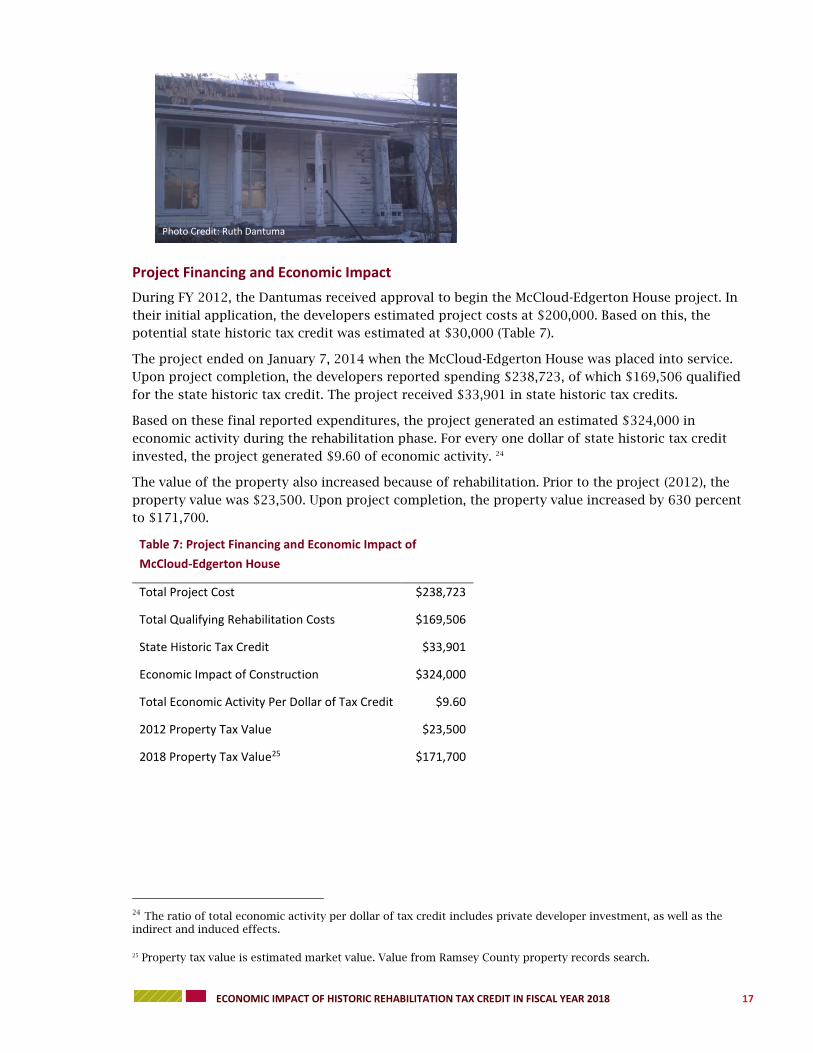
rehabilitation. Dirk and Ruth Dantuma purchased the house. The house was rehabilitated and is now
a rental property.
21 National Park Service. (1973). National Register of Historic Places inventory nomination form. Retrieved from https://npgallery.nps.gov/NRHP/GetAsset/d116b8aa-1296-4903-b6b9-393974bed366 22 Historic Saint Paul. (2011). Request for proposals: the rehabilitation of 311 Walnut Street. Retrieved from https://www.historicsaintpaul.org/sites/default/files/311_Walnut_RFP_12.6.2011.pdf
23 Saltzman, R. (2009, December 1). Buying a category 2 registered vacant building in Saint Paul. Retrieved from https://structuretech1.com/buying-a-category-2-registered-vacant-building-in-saint-paul/
ECONOMIC IMPACT OF HISTORIC REHABILITATION TAX CREDIT IN FISCAL YEAR 2018 17
Project Financing and Economic Impact
During FY 2012, the Dantumas received approval to begin the McCloud-Edgerton House project. In
their initial application, the developers estimated project costs at $200,000. Based on this, the
potential state historic tax credit was estimated at $30,000 (Table 7).
The project ended on January 7, 2014 when the McCloud-Edgerton House was placed into service.
Upon project completion, the developers reported spending $238,723, of which $169,506 qualified
for the state historic tax credit. The project received $33,901 in state historic tax credits.
Based on these final reported expenditures, the project generated an estimated $324,000 in
economic activity during the rehabilitation phase. For every one dollar of state historic tax credit
invested, the project generated $9.60 of economic activity. 24
The value of the property also increased because of rehabilitation. Prior to the project (2012), the
property value was $23,500. Upon project completion, the property value increased by 630 percent
to $171,700.
Table 7: Project Financing and Economic Impact of
McCloud-Edgerton House
Total Project Cost $238,723
Total Qualifying Rehabilitation Costs $169,506
State Historic Tax Credit $33,901
Economic Impact of Construction $324,000
Total Economic Activity Per Dollar of Tax Credit $9.60
2012 Property Tax Value $23,500
2018 Property Tax Value25 $171,700
24 The ratio of total economic activity per dollar of tax credit includes private developer investment, as well as the
indirect and induced effects.
25 Property tax value is estimated market value. Value from Ramsey County property records search.
Photo Credit: Ruth Dantuma
ECONOMIC IMPACT OF HISTORIC REHABILITATION TAX CREDIT IN FISCAL YEAR 2018 18
This case study originally appeared in the “Economic Contribution of Projects Leveraged by the
Minnesota Historic Rehabilitation Tax Credit in Fiscal Year 2015” report.26 It is reappearing here to
highlight subsequent increases in the estimated market value of the property.
Background
Designed by Butler Brothers Company of Saint Paul, the O’Donnell Shoe Company Factory was
constructed at 509 Sibley Street in Saint Paul. Completed in 1914, the six-story brick building was
the company’s second home. The building was a reflection of the business’ success, an enterprise
established in 1910 that eventually became the most successful shoe manufacturer in the state by
the 1920s.
After the building’s completion, the O’Donnell Shoe Company Factory had substantial open space to
house the varied mechanics required to make shoes and boots. The manufacturing process began on
the upper floors and was completed on the bottom floor, where the finished product was boxed and
shipped directly to stores or wholesalers.
In 1935, the O’Donnell Shoe Company Factory moved its operations to Humboldt, Tennessee. The
building was subsequently filled by a number of tenants during the following decades, and by the
turn of the 21st century, it was known as the “Renaissance Box.” The building was rehabilitated
during 2010-2011. According to the project developer, Aeon, “The redevelopment of the Renaissance
Box pays tribute to Minnesota’s heritage while meeting today’s needs for quality affordable
apartment homes.” The renovations, in part spurred by the Minnesota Historic Rehabilitation Tax
Credit, resulted in 70 apartment homes in the building.27
26 Report available at https://conservancy.umn.edu/handle/11299/197812 27 Lucas, A. M. (March 2009). Preserving a piece of Saint Paul’s history: Redeveloping the O’Donnell Shoe Company
Factory. Retrieved from http://www.aeonmn.org/wp-content/uploads/2014/10/Ren_Box_History.pdf.
ECONOMIC IMPACT OF HISTORIC REHABILITATION TAX CREDIT IN FISCAL YEAR 2018 19
Project Financing and Economic Impact
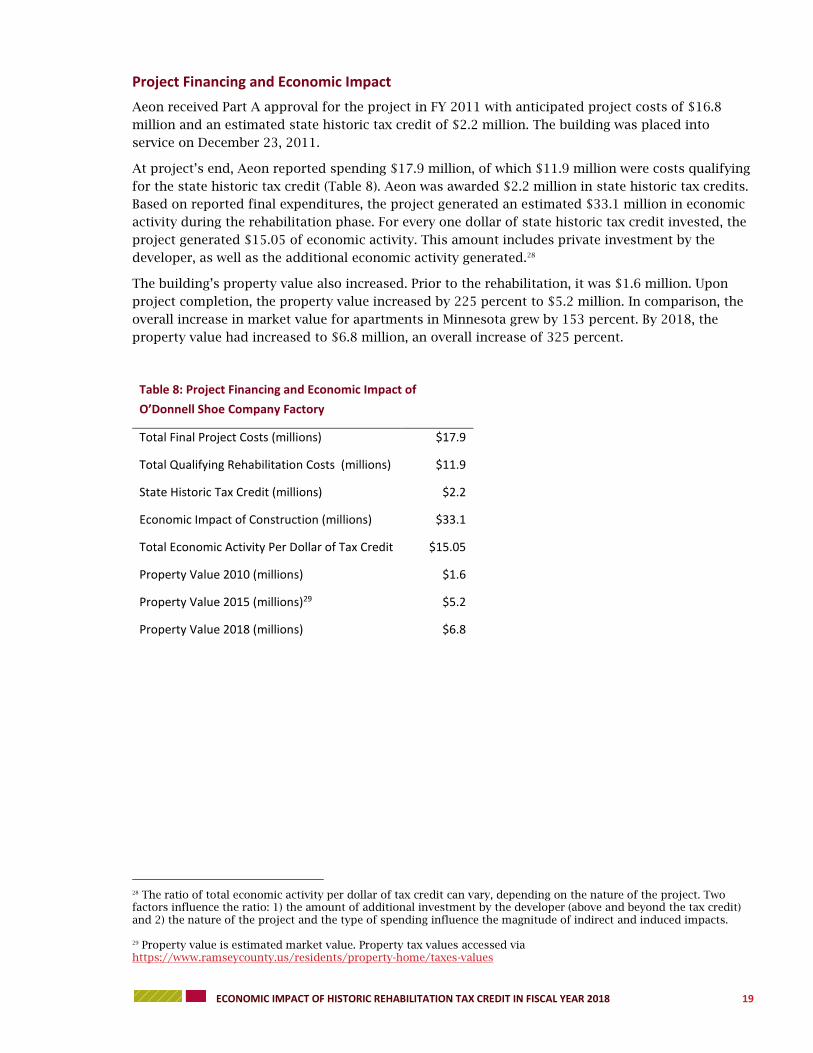
Aeon received Part A approval for the project in FY 2011 with anticipated project costs of $16.8
million and an estimated state historic tax credit of $2.2 million. The building was placed into
service on December 23, 2011.
At project’s end, Aeon reported spending $17.9 million, of which $11.9 million were costs qualifying
for the state historic tax credit (Table 8). Aeon was awarded $2.2 million in state historic tax credits.
Based on reported final expenditures, the project generated an estimated $33.1 million in economic
activity during the rehabilitation phase. For every one dollar of state historic tax credit invested, the
project generated $15.05 of economic activity. This amount includes private investment by the
developer, as well as the additional economic activity generated.28
The building’s property value also increased. Prior to the rehabilitation, it was $1.6 million. Upon
project completion, the property value increased by 225 percent to $5.2 million. In comparison, the
overall increase in market value for apartments in Minnesota grew by 153 percent. By 2018, the
property value had increased to $6.8 million, an overall increase of 325 percent.
Table 8: Project Financing and Economic Impact of
O’Donnell Shoe Company Factory
Total Final Project Costs (millions) $17.9
Total Qualifying Rehabilitation Costs (millions) $11.9
State Historic Tax Credit (millions) $2.2
Economic Impact of Construction (millions) $33.1
Total Economic Activity Per Dollar of Tax Credit $15.05
Property Value 2010 (millions) $1.6
Property Value 2015 (millions)29 $5.2
Property Value 2018 (millions) $6.8
28 The ratio of total economic activity per dollar of tax credit can vary, depending on the nature of the project. Two factors influence the ratio: 1) the amount of additional investment by the developer (above and beyond the tax credit) and 2) the nature of the project and the type of spending influence the magnitude of indirect and induced impacts. 29 Property value is estimated market value. Property tax values accessed via https://www.ramseycounty.us/residents/property-home/taxes-values
ECONOMIC IMPACT OF HISTORIC REHABILITATION TAX CREDIT IN FISCAL YEAR 2018 21
During 2010-2012, Greco Development rehabilitated the warehouse for residential and commercial
use.31 The Copham apartments are now situated in Minneapolis’ trendy and rapidly growing North
Loop.
Project Financing and Economic Impact
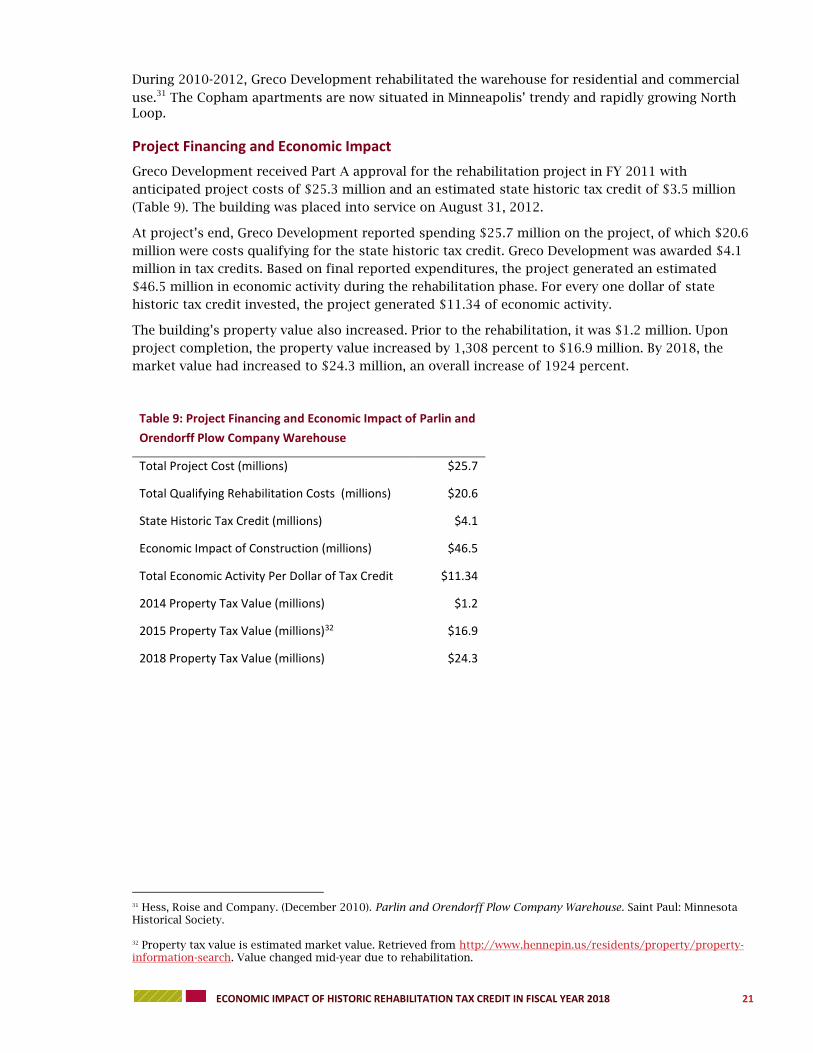
Greco Development received Part A approval for the rehabilitation project in FY 2011 with
anticipated project costs of $25.3 million and an estimated state historic tax credit of $3.5 million
(Table 9). The building was placed into service on August 31, 2012.
At project’s end, Greco Development reported spending $25.7 million on the project, of which $20.6
million were costs qualifying for the state historic tax credit. Greco Development was awarded $4.1
million in tax credits. Based on final reported expenditures, the project generated an estimated
$46.5 million in economic activity during the rehabilitation phase. For every one dollar of state
historic tax credit invested, the project generated $11.34 of economic activity.
The building’s property value also increased. Prior to the rehabilitation, it was $1.2 million. Upon
project completion, the property value increased by 1,308 percent to $16.9 million. By 2018, the
market value had increased to $24.3 million, an overall increase of 1924 percent.
Table 9: Project Financing and Economic Impact of Parlin and
Orendorff Plow Company Warehouse
Total Project Cost (millions) $25.7
Total Qualifying Rehabilitation Costs (millions) $20.6
State Historic Tax Credit (millions) $4.1
Economic Impact of Construction (millions) $46.5
Total Economic Activity Per Dollar of Tax Credit $11.34
2014 Property Tax Value (millions) $1.2
2015 Property Tax Value (millions)32 $16.9
2018 Property Tax Value (millions) $24.3
31 Hess, Roise and Company. (December 2010). Parlin and Orendorff Plow Company Warehouse. Saint Paul: Minnesota Historical Society. 32 Property tax value is estimated market value. Retrieved from http://www.hennepin.us/residents/property/property-information-search. Value changed mid-year due to rehabilitation.
34 These are estimated tax credits and grants, given the applications submitted and are distributed over time. Final tax credits and grants are not awarded until projects are completed.
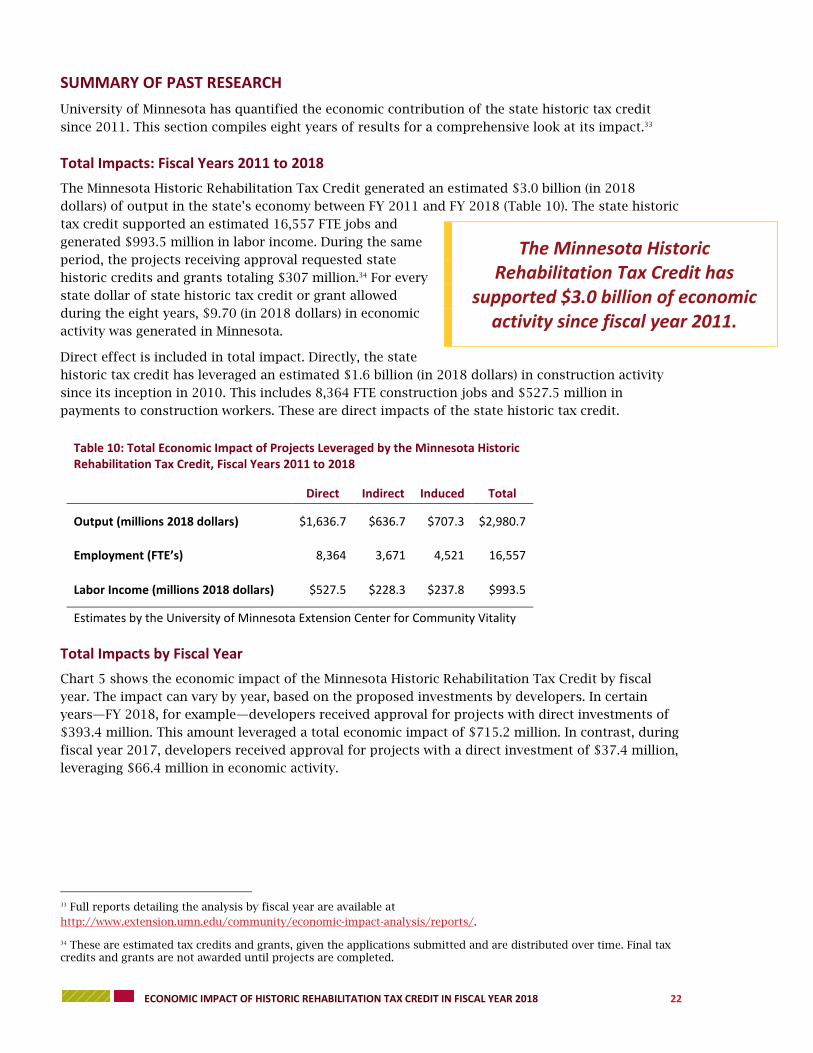
The Minnesota Historic Rehabilitation Tax Credit has
supported $3.0 billion of economic activity since fiscal year 2011.