Institute of AgricultureDepartment of Agricultural & Resource Economics
Economic Impacts of Agriculture and Forestry in Tennessee, 2011
Agricultural Experiment StationThe University of Tennessee
Knoxville
by Jamey Menard, Burton English,
and Kim Jensen
Agri‐Industry Modeling & Analysis Group (AIM‐AG)
June 2013
ii
Jamey Menard is a Research Leader. Burton English and Kim Jensen are Professors of Agricultural Economics.
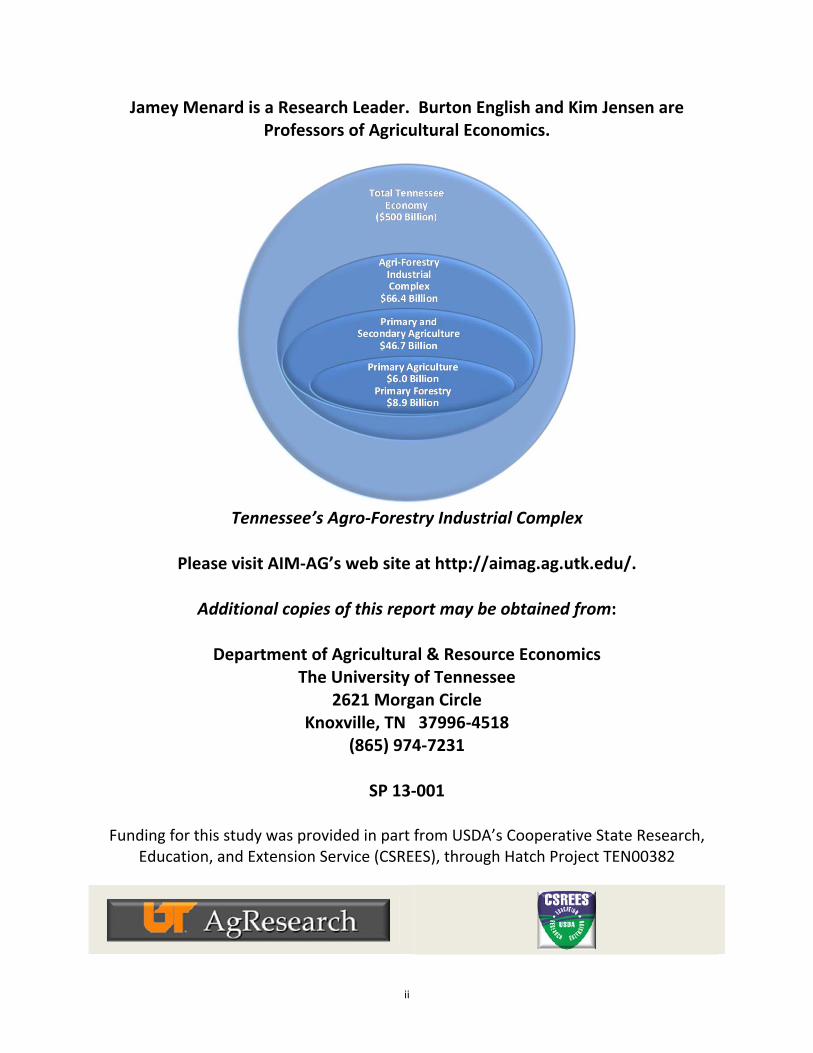
Tennessee’s Agro‐Forestry Industrial Complex
Please visit AIM‐AG’s web site at http://aimag.ag.utk.edu/.
Additional copies of this report may be obtained from:
Department of Agricultural & Resource Economics
The University of Tennessee 2621 Morgan Circle
Knoxville, TN 37996‐4518 (865) 974‐7231
SP 13‐001
Funding for this study was provided in part from USDA’s Cooperative State Research,
Education, and Extension Service (CSREES), through Hatch Project TEN00382
iii
Executive Summary In 2011, the agro‐forestry industrial complex contributed $66.4 billion to the Tennessee
economy, accounting for 13.3 percent of the economic activity conducted within the state, and employed an estimated 337,880 individuals, or 9.6 percent of the total number of workers. In this study the agro‐forestry industrial complex included the primary industries typically associated with agriculture and forest operations such as growing crops, the breeding and feeding of livestock, and the management and logging of trees. Also included in the industrial complex were input supply industries and value‐added sub‐sectors, which included food and beverage manufacturing, apparel and textiles, and forestry products manufacturing.
Agriculture, a subset of the agro‐forestry industrial complex, includes farming and related industries, as well as value‐added food and fiber production, processing and manufacturing. Agriculture accounted for 9.3 percent of the state’s economy and generated $46.7 billion in output. Agriculture employed close to 247,000 Tennesseans, with over 106,000 (both full‐ and part‐time) in agricultural production. In addition,
For 2011, agriculture input supplying industries – agricultural machinery and chemical
products – generated nearly $2.3 billion in cash receipts annually.
For 2011, Tennessee farmers earned more than 76.1 percent of their cash receipts from cattle and calves, soybeans, broilers, corn, cotton, and greenhouse/nursery.
Exports for Tennessee’s forest products outside the United States for 2011 totaled close to $1.0 billion. Paper products had the highest export value at $682.3 million, followed by wood products ($180.1 million), furniture and related products ($90.6 million), and forestry and logging ($79.5 million).
For 2011, major countries receiving Tennessee’s forest products exports include Mexico
for paper products, China for wood products, and Canada for furniture and fixtures and logging.
For 2011, value‐added agriculture manufacturing contributed a total of $38.4 billion to the state’s economy of which 83.3 percent came from food ($27.1 billion) and beverages ($4.9 billion) manufacturing.
Major markets for Tennessee’s 2011 exports of agricultural and livestock products included China, Mexico, Turkey, Indonesia, Viet Nam, Thailand, and Canada. This analysis was conducted using the Tennessee Agri‐Industry model (TNAIM) and the
Impact Analysis for Planning (IMPLAN) model and databases. TNAIM, an input‐output model for five trading regions within the state, traces transactions conducted within the economy and attempts to quantify the economic interdependencies within each region’s economy for a given point in time. Through these interdependencies, one can evaluate the indirect and induced impacts that economic activity in one region might have on the entire state economy.
iv
Table of Contents Page Executive Summary iii Table of Contents iv List of Tables v List of Figures vi Introduction 1 Overview of Agriculture and Forestry in Tennessee 2 State Level Changes in Livestock and Crops: 2009 to 2011 13 Livestock Changes in Inventory and Prices 13 Crop Changes in Acres Planted and Prices 14 Input‐Output Analysis: Data and Methods Used 16 Results 18
Economic Impacts at the State & In‐State Region Levels 18 Primary Agricultural Products 23 Secondary Agricultural Products 27 Primary Forest Products 30 Secondary Forest Products 32
Estimated Total Economic Impacts of Agriculture and Forestry 34 Primary Agriculture Products Total Impacts 37 Secondary Agriculture Products Total Impacts 43 Primary Forest Products Total Impacts 47 Secondary Forest Products Total Impacts 50
Tennessee Agriculture and Forestry Tax Impacts 58 Summary and Conclusion 59 Literature Cited 63 Appendix A: IMPLAN Methodology 66 Appendix B: IMPLAN Sectors with Descriptions 70 Appendix C: County Region Identification Table 82 Appendix D: Total Industry Output, Employment, Labor Income, and Total
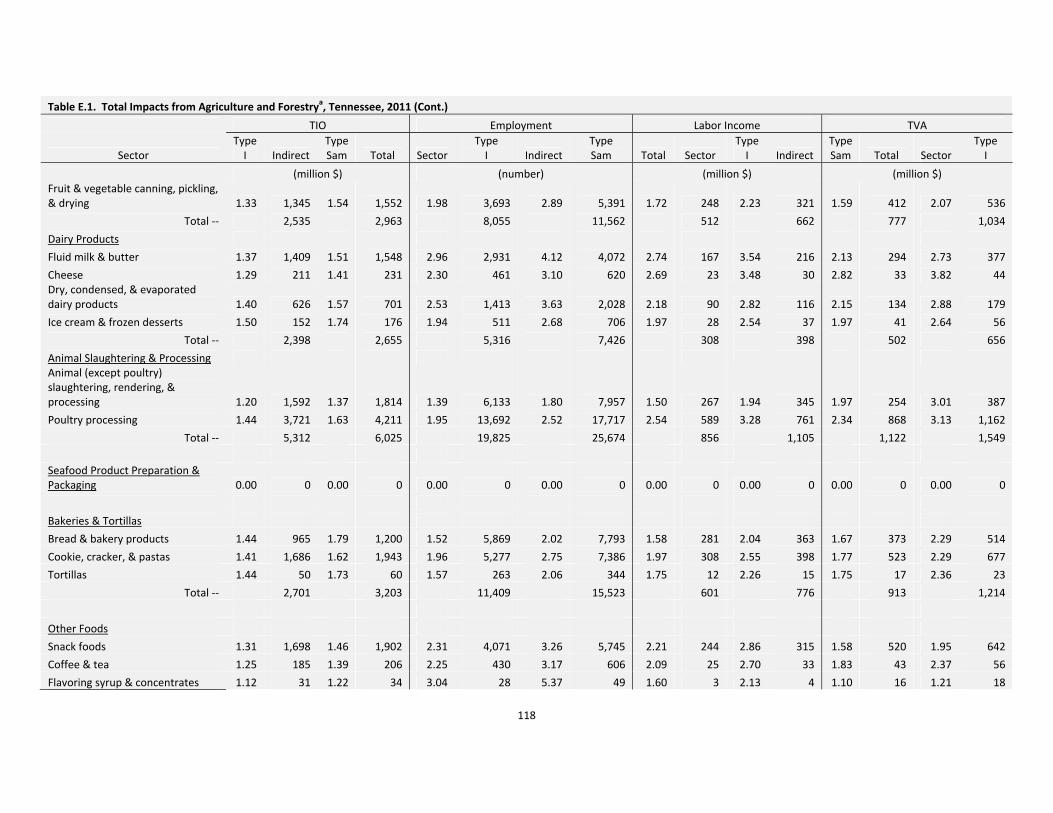
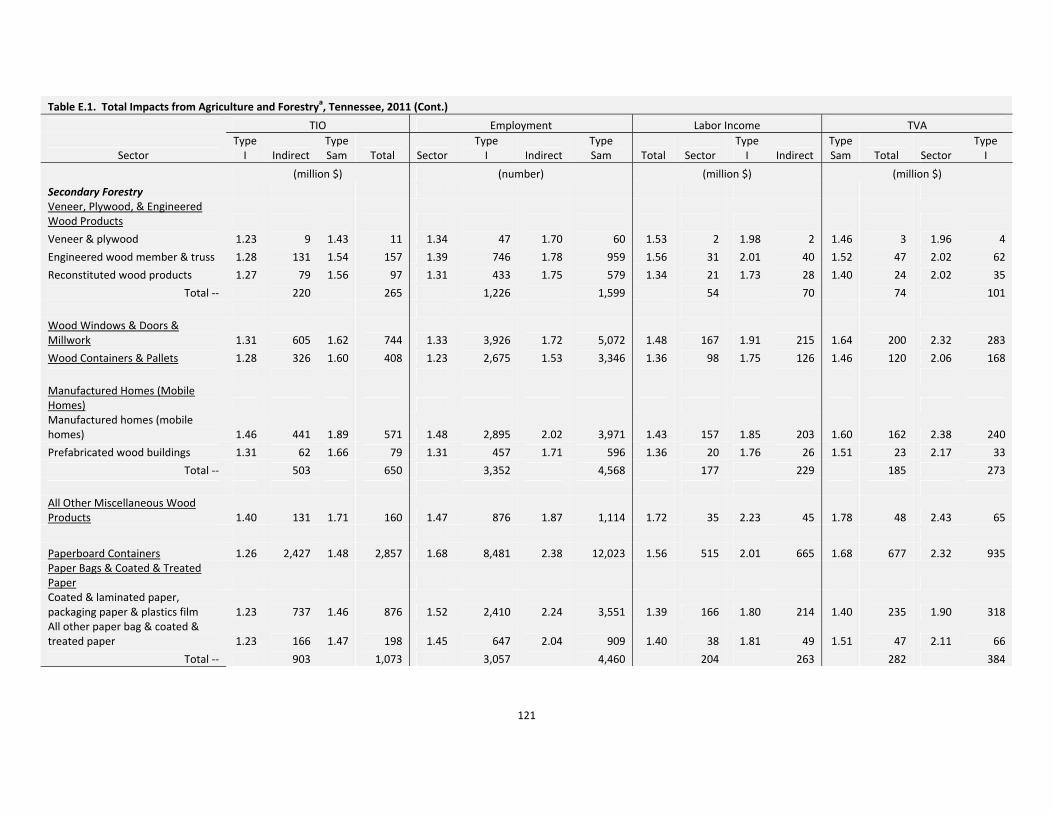
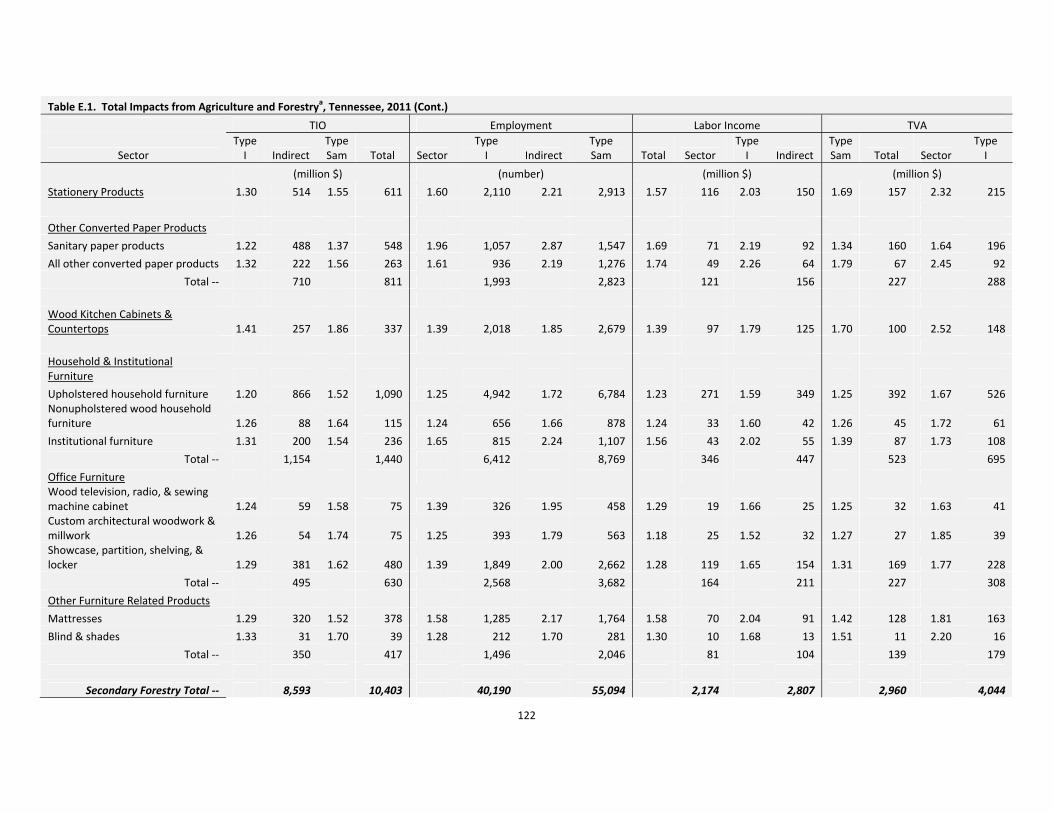
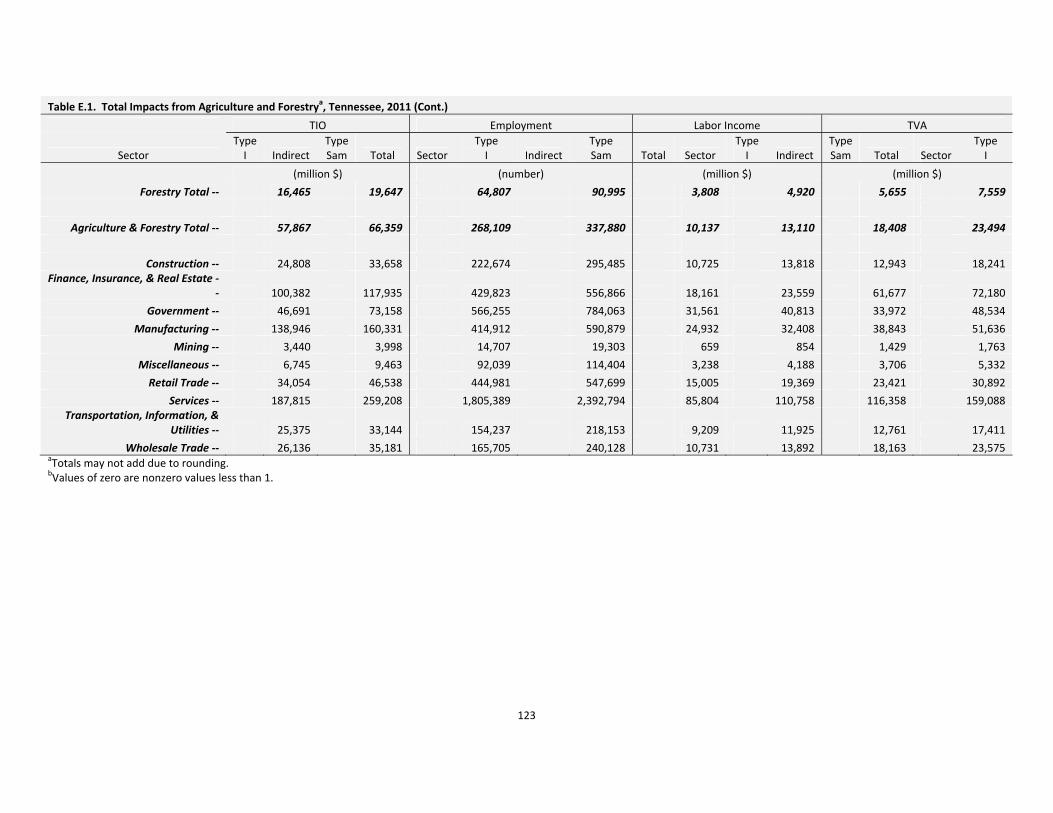
Value‐Added by Agriculture and Forestry Sectors for Tennessee, 2011 84 Appendix E: Total Impacts from the Agriculture and Forestry Sectors, Tennessee, 2011 115
v
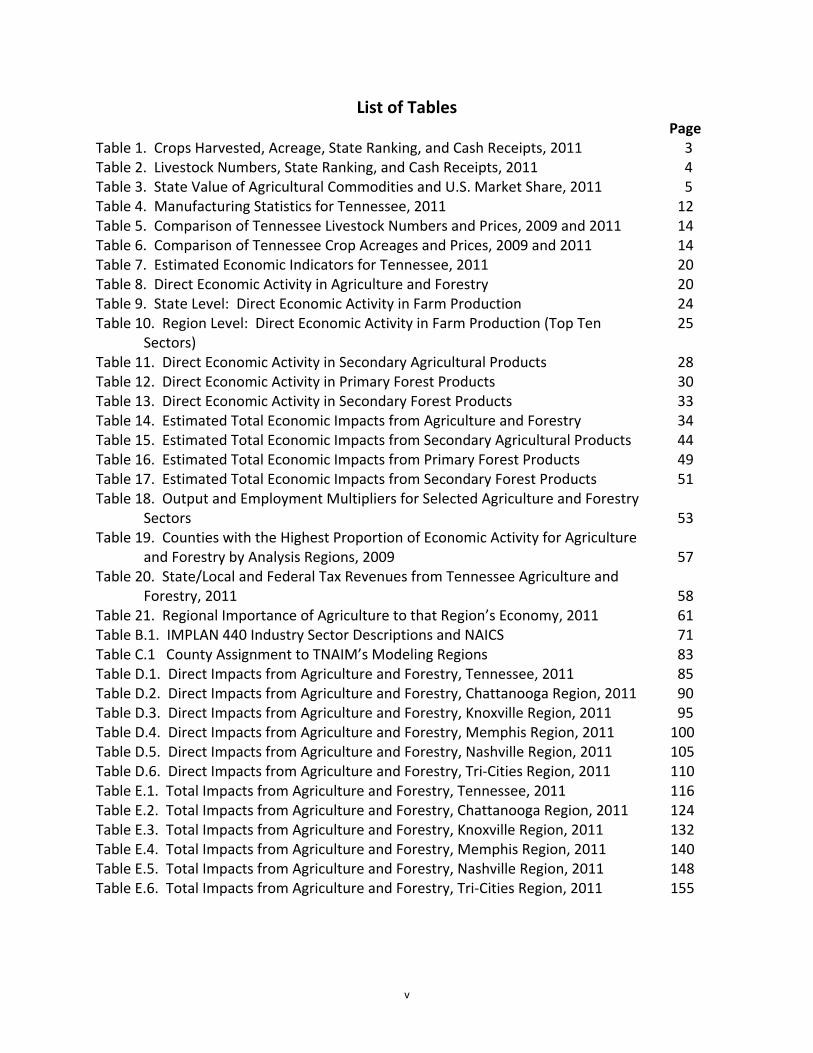
List of Tables Page Table 1. Crops Harvested, Acreage, State Ranking, and Cash Receipts, 2011 3 Table 2. Livestock Numbers, State Ranking, and Cash Receipts, 2011 4 Table 3. State Value of Agricultural Commodities and U.S. Market Share, 2011 5 Table 4. Manufacturing Statistics for Tennessee, 2011 12 Table 5. Comparison of Tennessee Livestock Numbers and Prices, 2009 and 2011 14 Table 6. Comparison of Tennessee Crop Acreages and Prices, 2009 and 2011 14 Table 7. Estimated Economic Indicators for Tennessee, 2011 20 Table 8. Direct Economic Activity in Agriculture and Forestry 20 Table 9. State Level: Direct Economic Activity in Farm Production 24 Table 10. Region Level: Direct Economic Activity in Farm Production (Top Ten 25 Sectors) Table 11. Direct Economic Activity in Secondary Agricultural Products 28 Table 12. Direct Economic Activity in Primary Forest Products 30 Table 13. Direct Economic Activity in Secondary Forest Products 33 Table 14. Estimated Total Economic Impacts from Agriculture and Forestry 34 Table 15. Estimated Total Economic Impacts from Secondary Agricultural Products 44 Table 16. Estimated Total Economic Impacts from Primary Forest Products 49 Table 17. Estimated Total Economic Impacts from Secondary Forest Products 51 Table 18. Output and Employment Multipliers for Selected Agriculture and Forestry
Sectors 53 Table 19. Counties with the Highest Proportion of Economic Activity for Agriculture
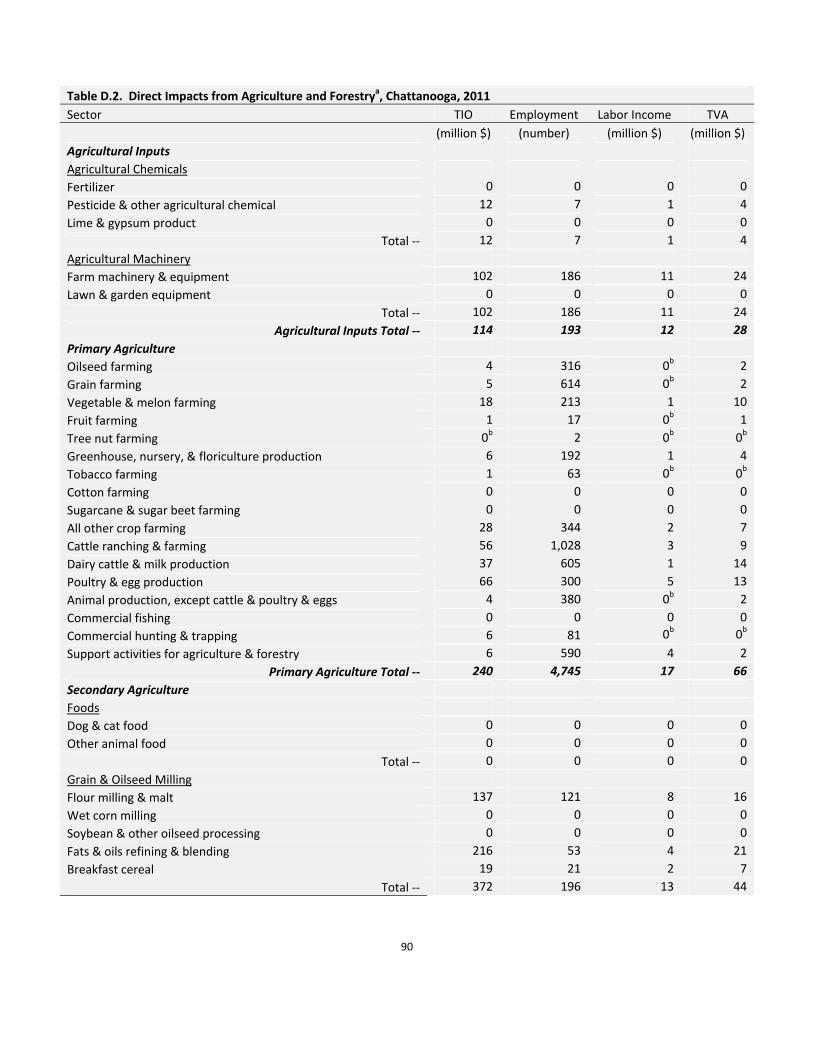
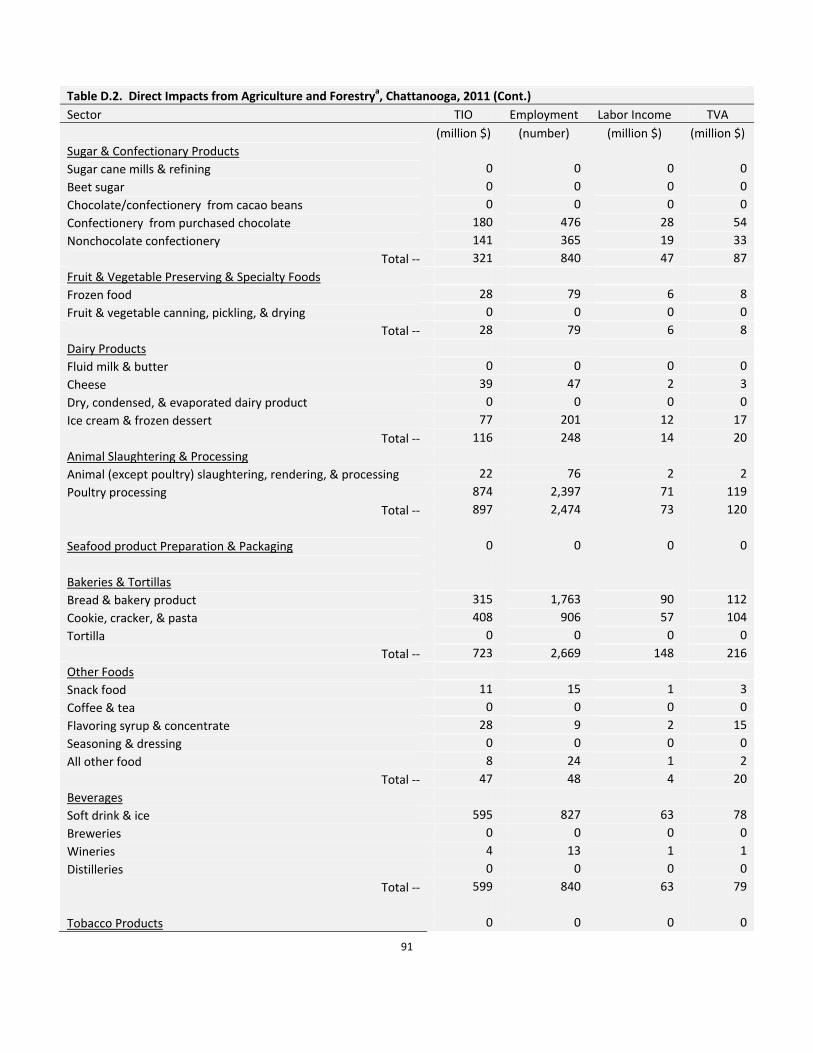
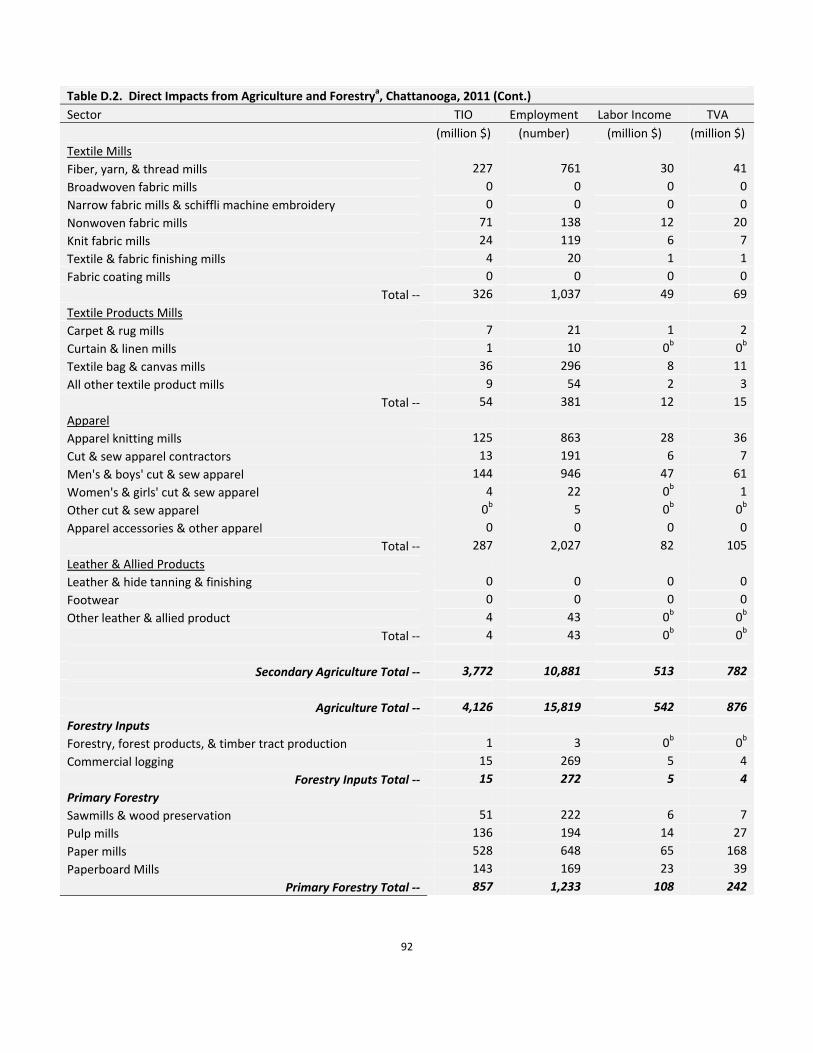
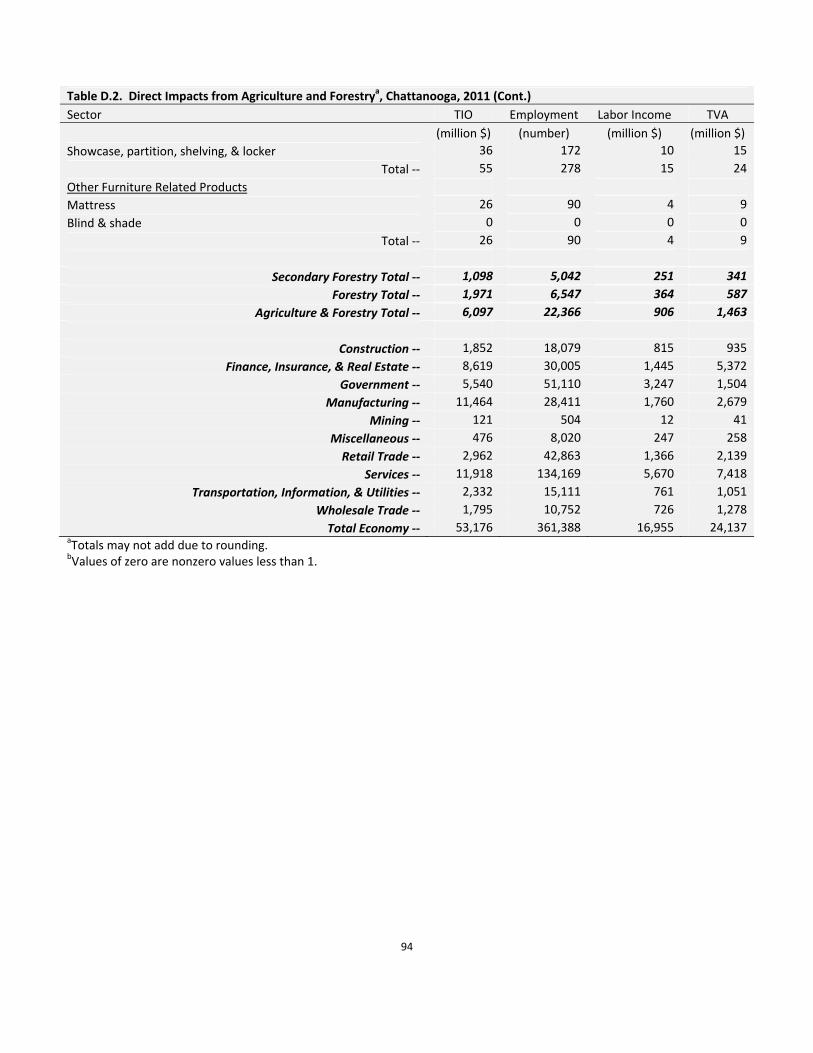
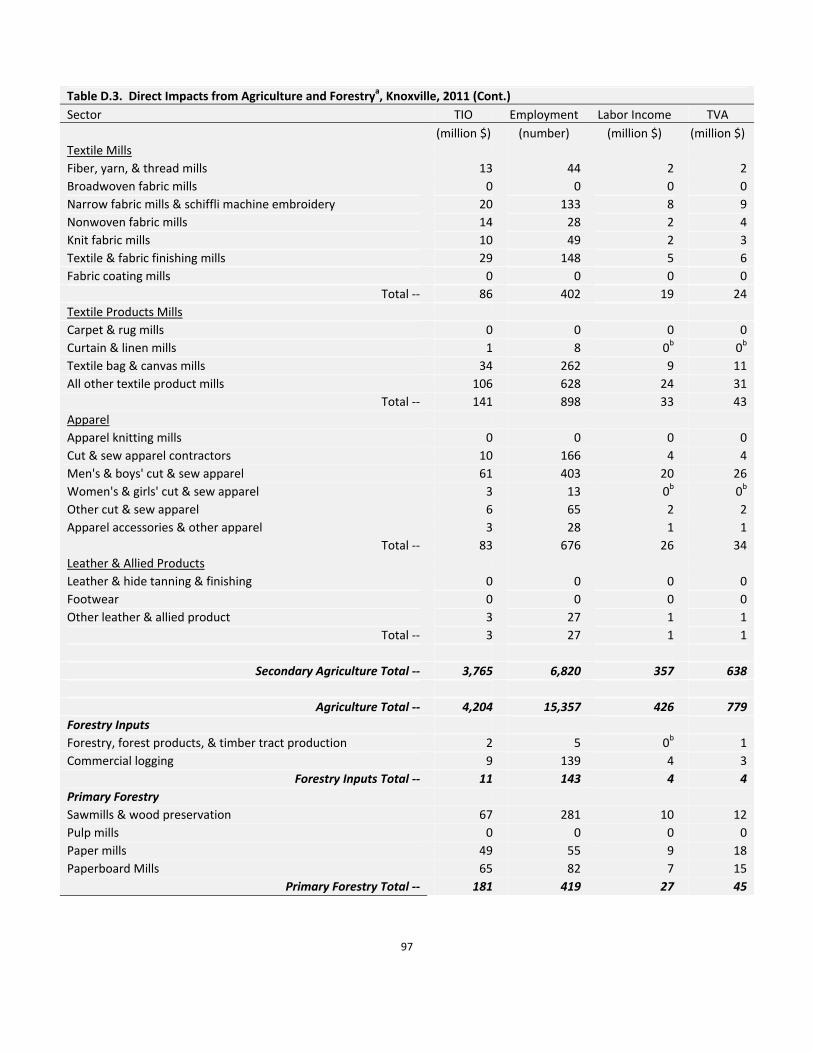
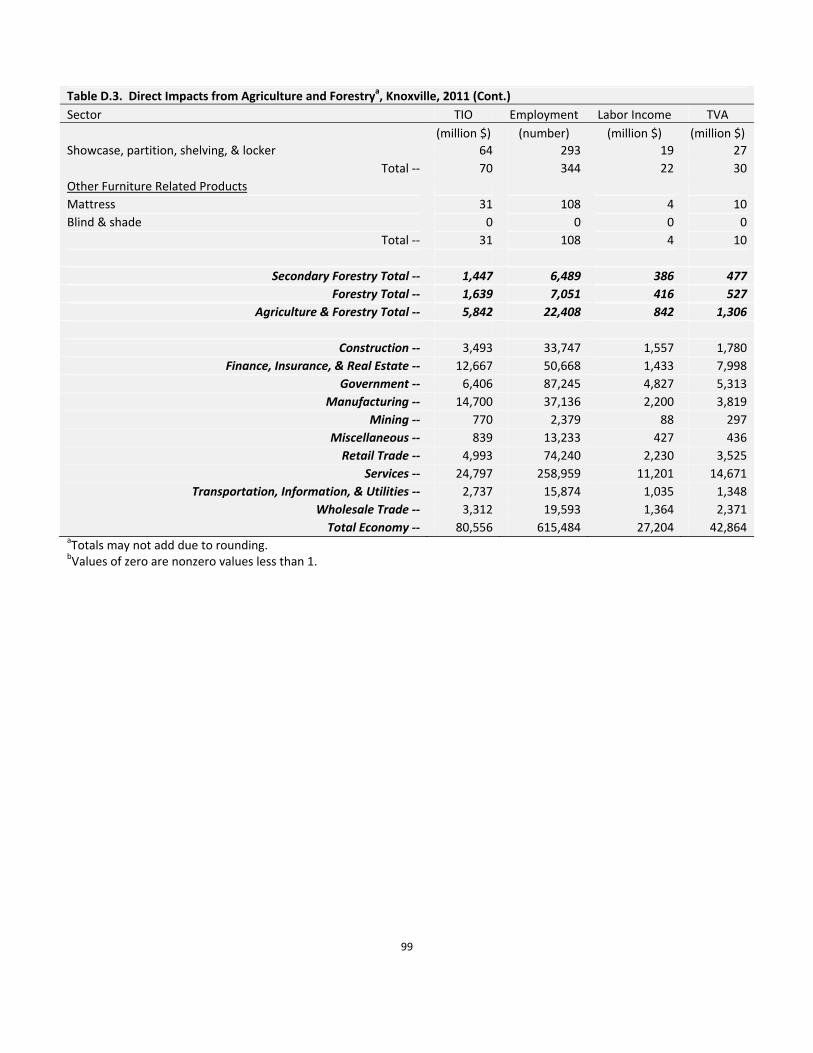
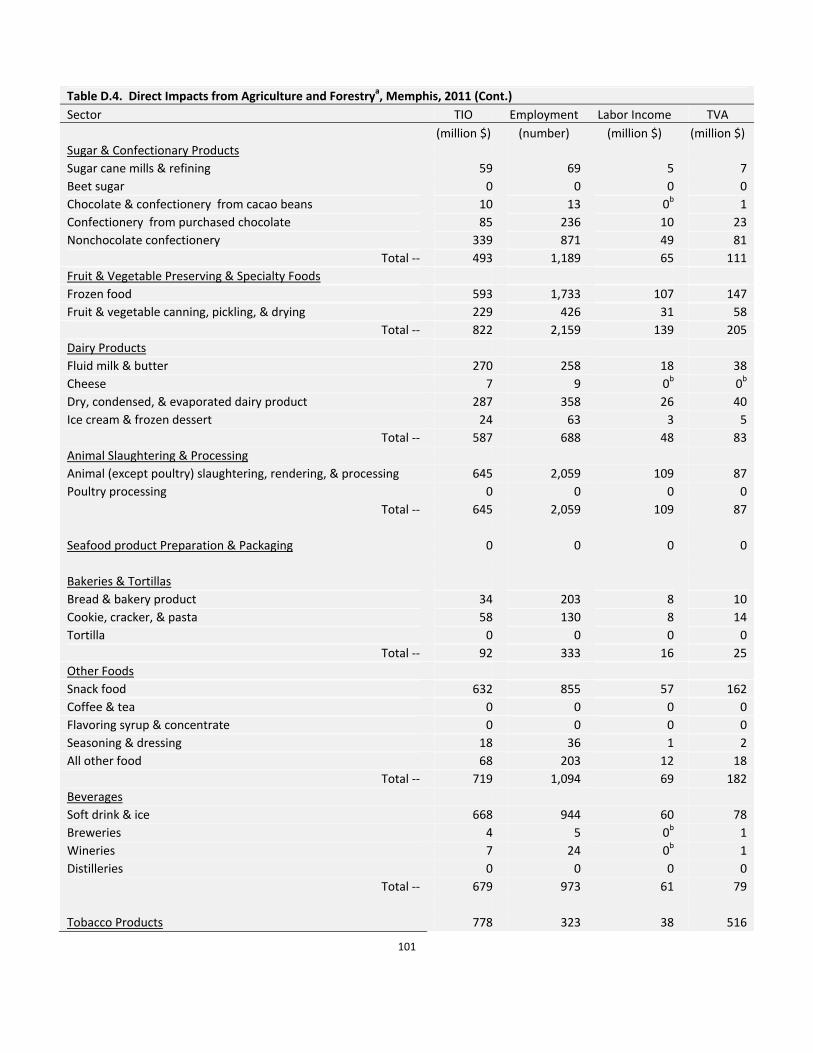
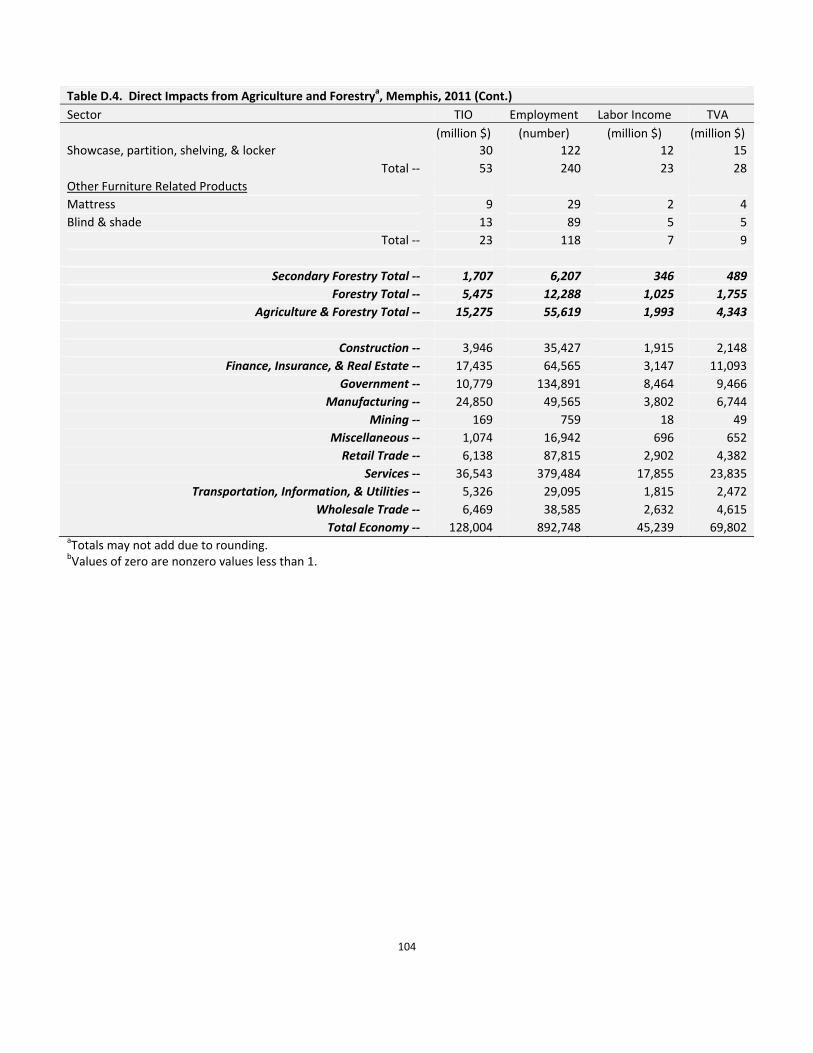
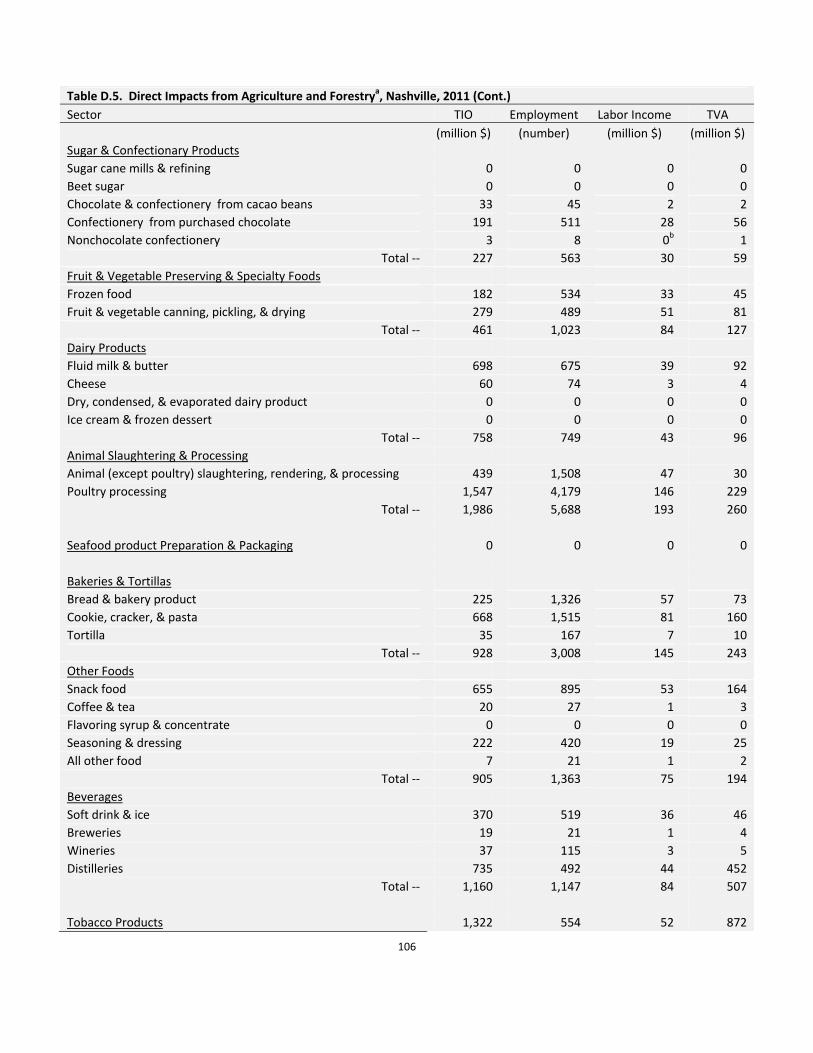
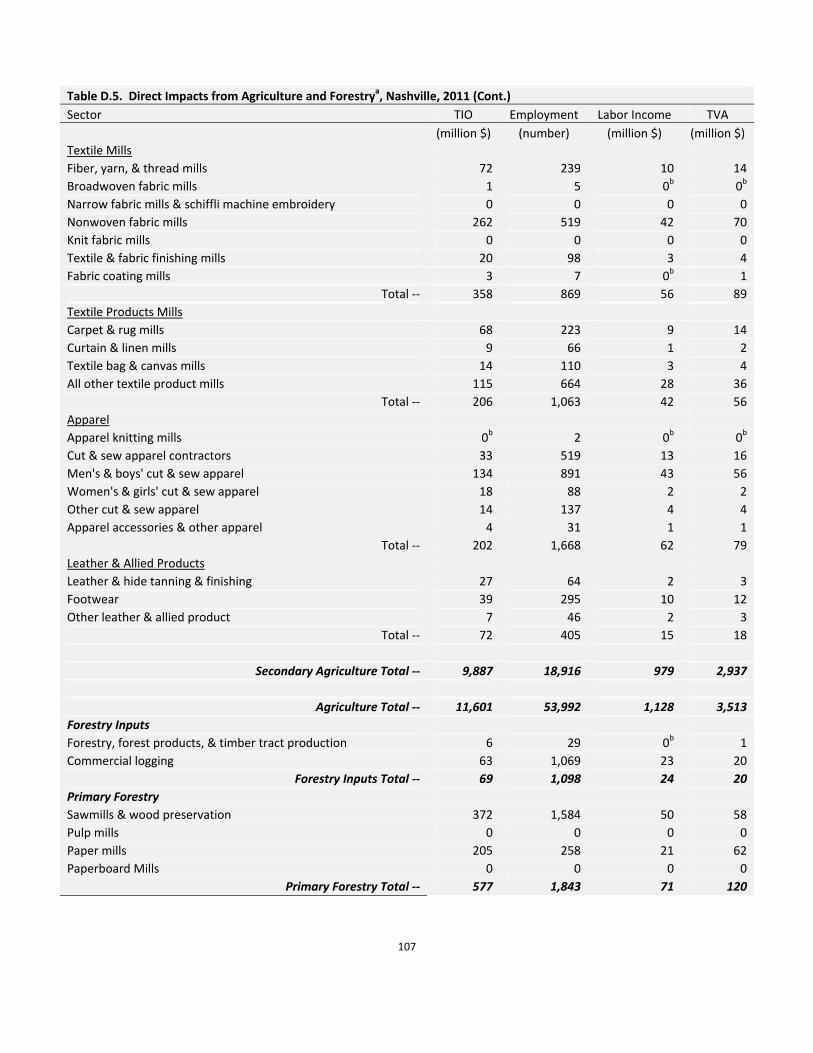
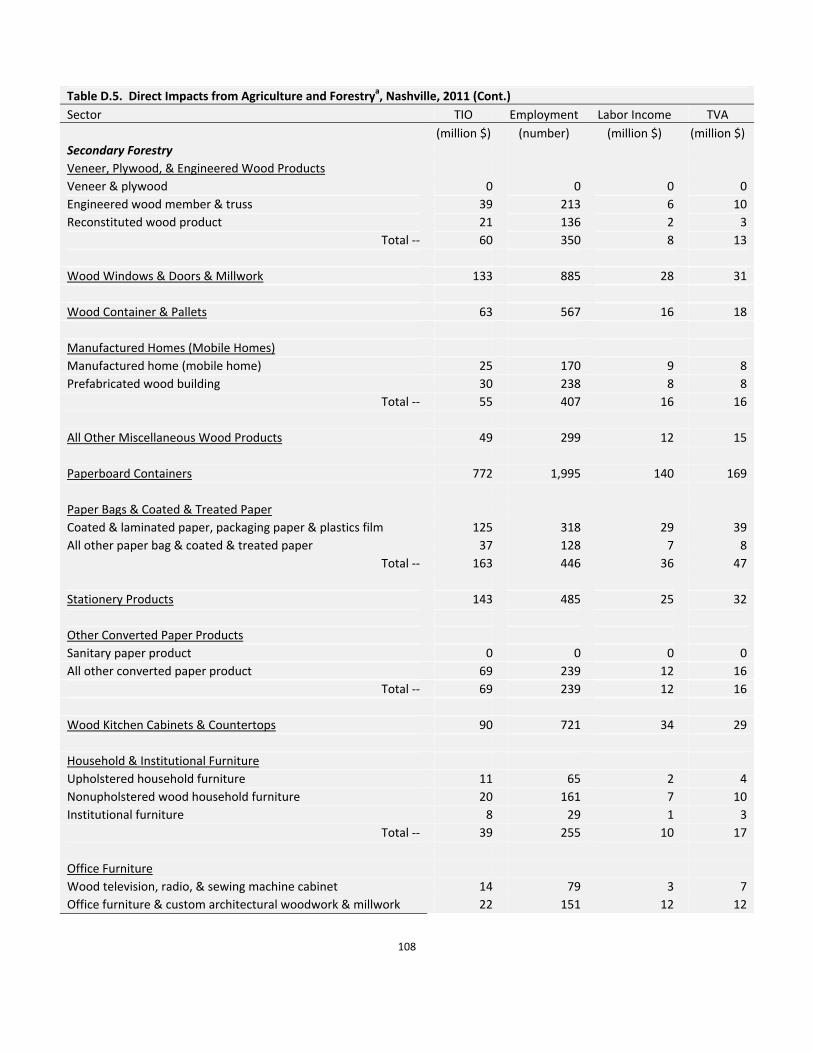
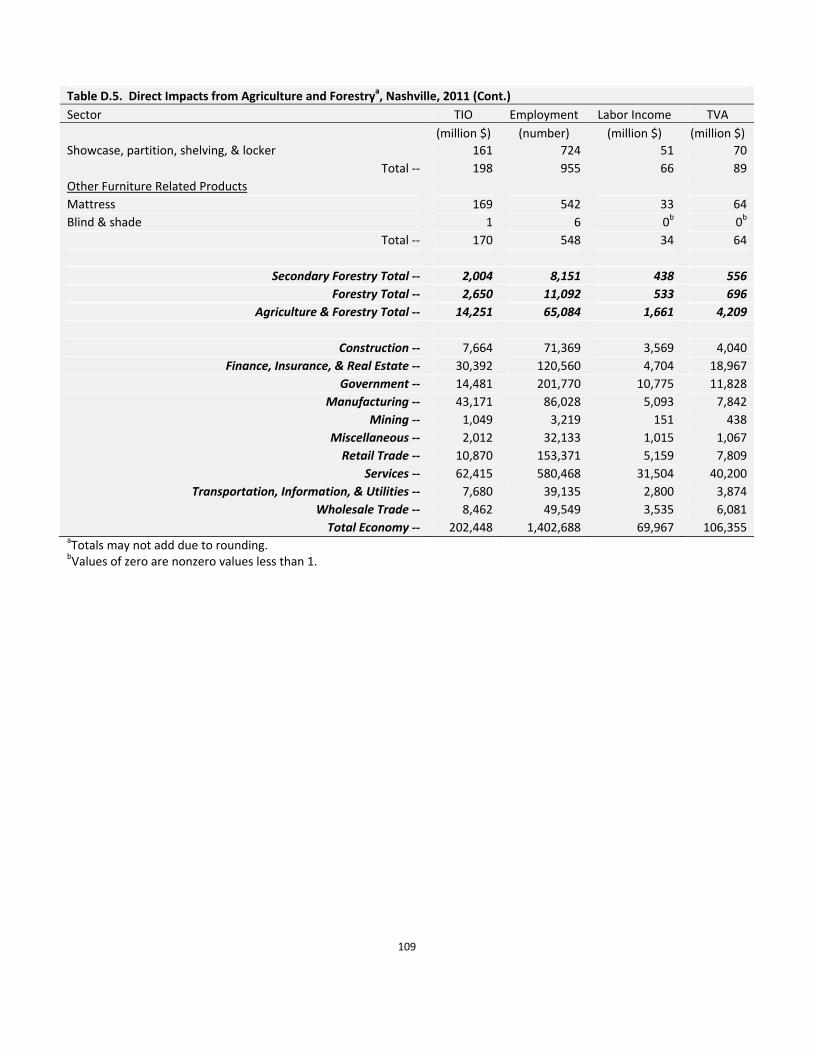
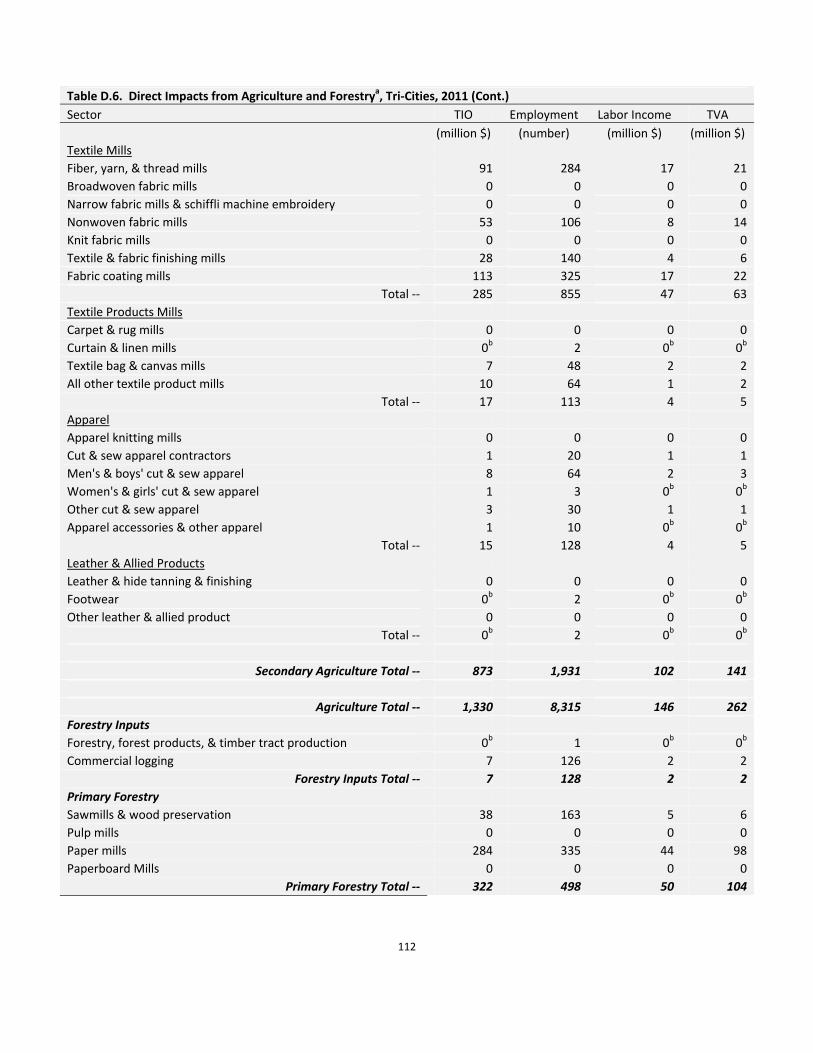
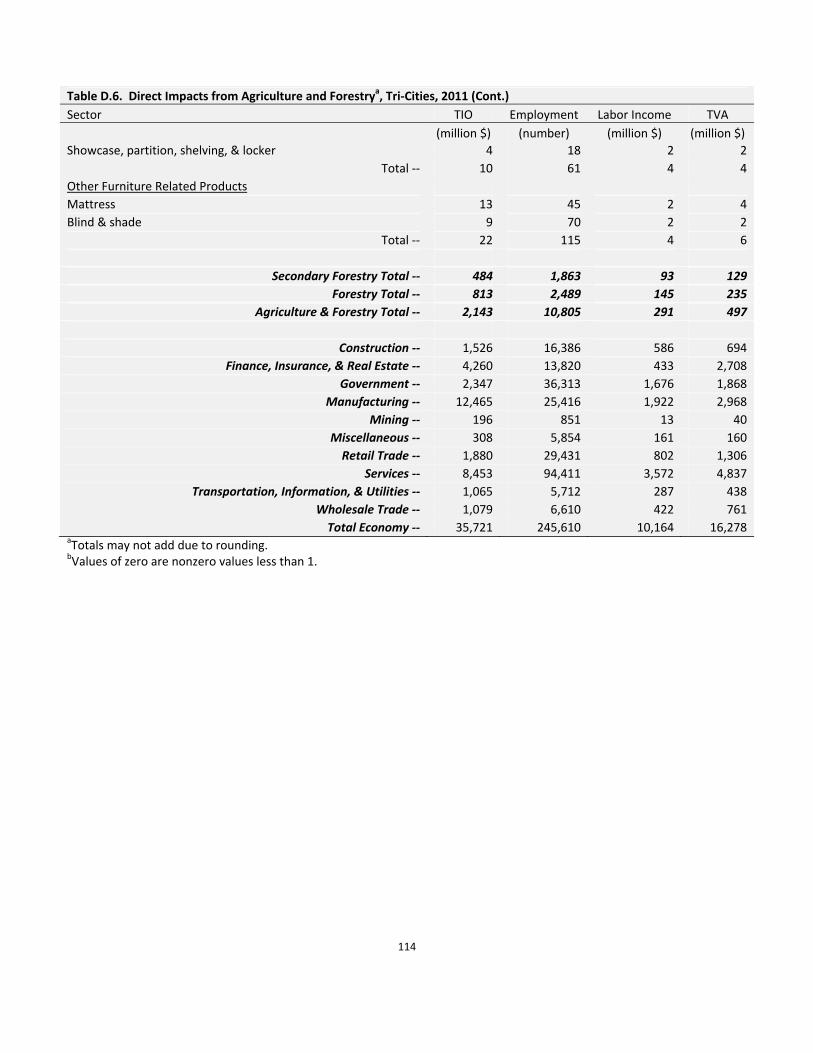
and Forestry by Analysis Regions, 2009 57 Table 20. State/Local and Federal Tax Revenues from Tennessee Agriculture and Forestry, 2011 58 Table 21. Regional Importance of Agriculture to that Region’s Economy, 2011 61 Table B.1. IMPLAN 440 Industry Sector Descriptions and NAICS 71 Table C.1 County Assignment to TNAIM’s Modeling Regions 83 Table D.1. Direct Impacts from Agriculture and Forestry, Tennessee, 2011 85 Table D.2. Direct Impacts from Agriculture and Forestry, Chattanooga Region, 2011 90 Table D.3. Direct Impacts from Agriculture and Forestry, Knoxville Region, 2011 95 Table D.4. Direct Impacts from Agriculture and Forestry, Memphis Region, 2011 100 Table D.5. Direct Impacts from Agriculture and Forestry, Nashville Region, 2011 105 Table D.6. Direct Impacts from Agriculture and Forestry, Tri‐Cities Region, 2011 110 Table E.1. Total Impacts from Agriculture and Forestry, Tennessee, 2011 116 Table E.2. Total Impacts from Agriculture and Forestry, Chattanooga Region, 2011 124 Table E.3. Total Impacts from Agriculture and Forestry, Knoxville Region, 2011 132 Table E.4. Total Impacts from Agriculture and Forestry, Memphis Region, 2011 140 Table E.5. Total Impacts from Agriculture and Forestry, Nashville Region, 2011 148 Table E.6. Total Impacts from Agriculture and Forestry, Tri‐Cities Region, 2011 155
vi
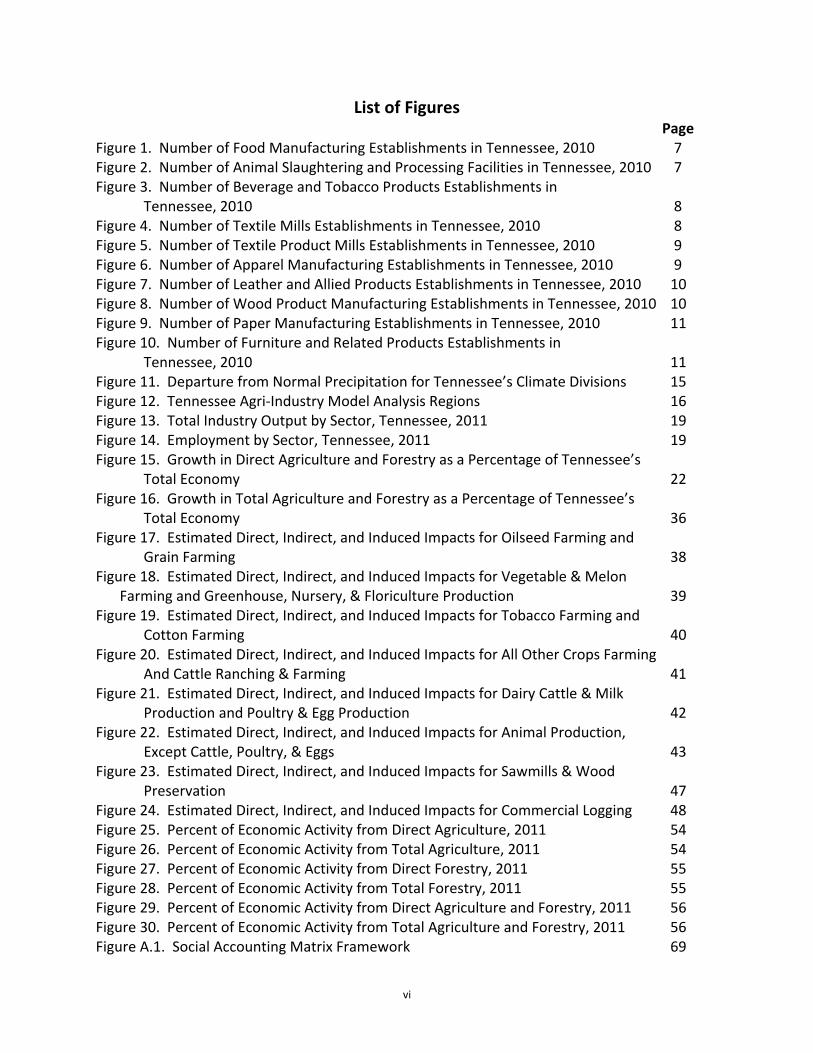
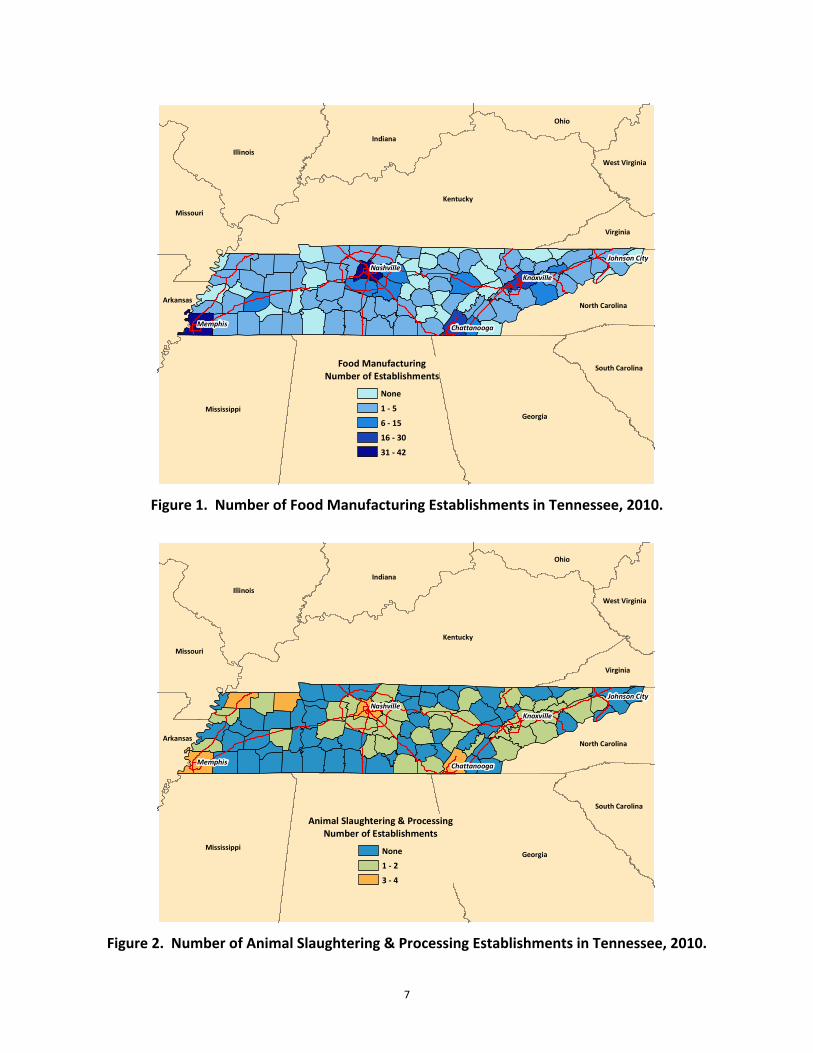
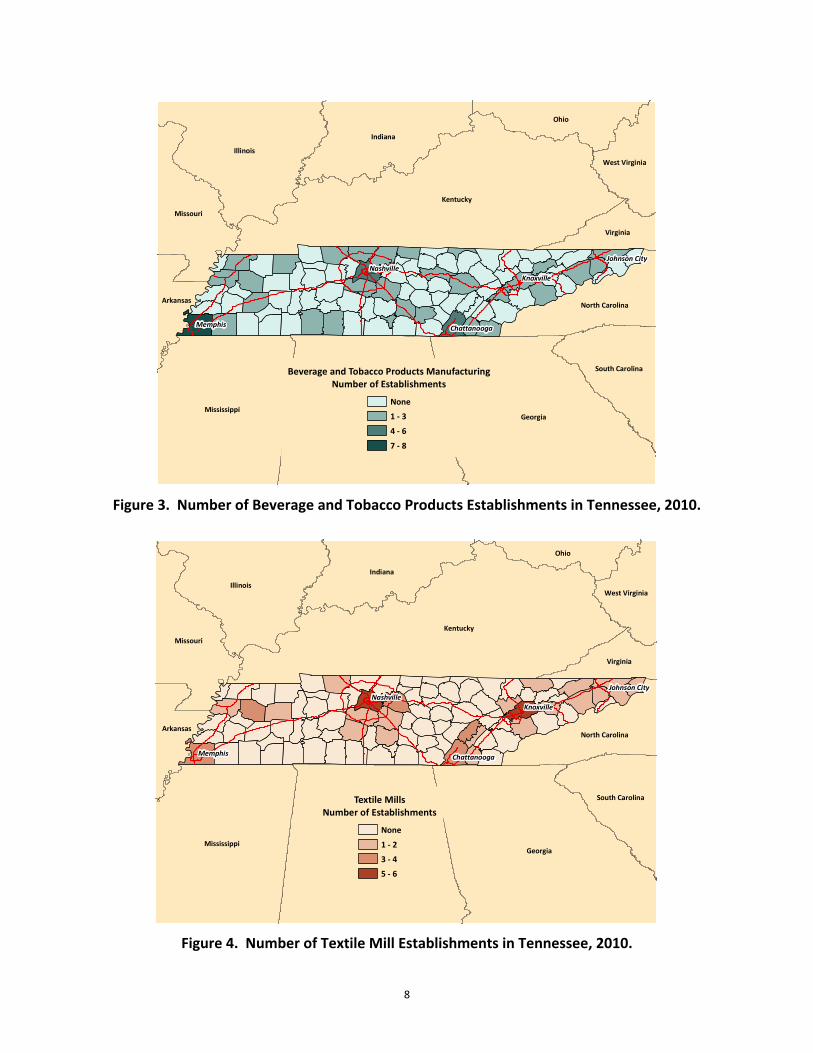
List of Figures Page Figure 1. Number of Food Manufacturing Establishments in Tennessee, 2010 7 Figure 2. Number of Animal Slaughtering and Processing Facilities in Tennessee, 2010 7 Figure 3. Number of Beverage and Tobacco Products Establishments in
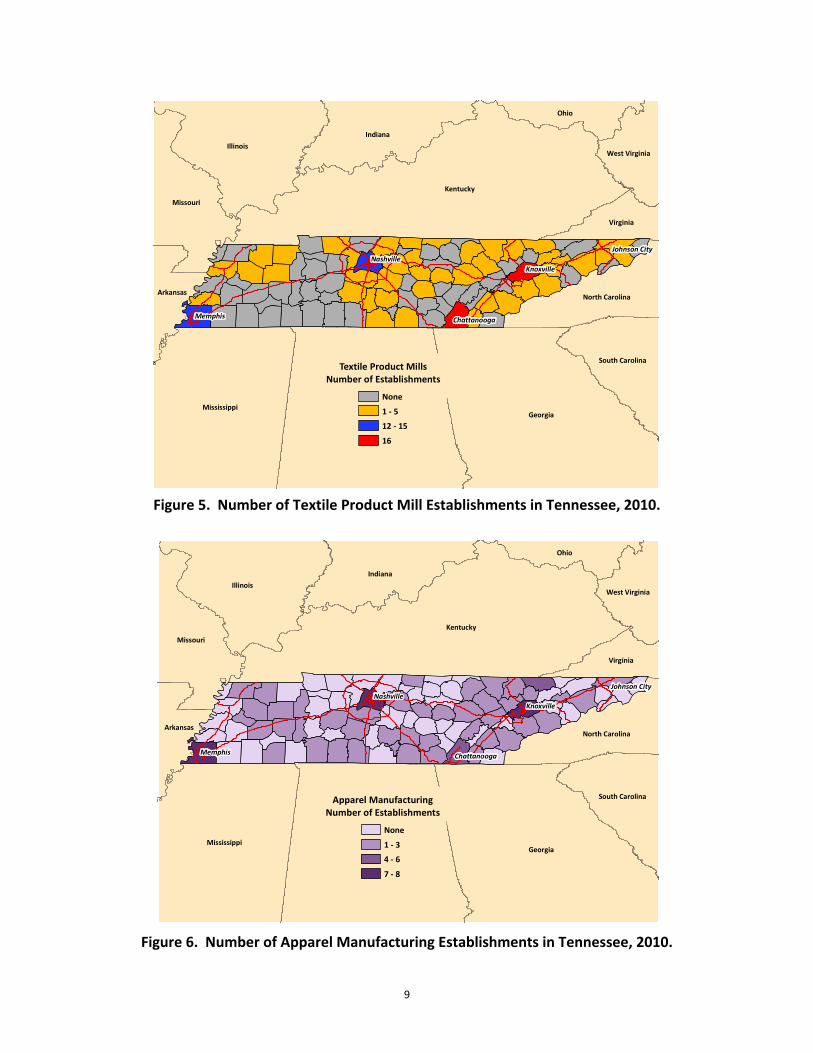
Tennessee, 2010 8 Figure 4. Number of Textile Mills Establishments in Tennessee, 2010 8 Figure 5. Number of Textile Product Mills Establishments in Tennessee, 2010 9 Figure 6. Number of Apparel Manufacturing Establishments in Tennessee, 2010 9 Figure 7. Number of Leather and Allied Products Establishments in Tennessee, 2010 10 Figure 8. Number of Wood Product Manufacturing Establishments in Tennessee, 2010 10 Figure 9. Number of Paper Manufacturing Establishments in Tennessee, 2010 11 Figure 10. Number of Furniture and Related Products Establishments in
Tennessee, 2010 11 Figure 11. Departure from Normal Precipitation for Tennessee’s Climate Divisions 15 Figure 12. Tennessee Agri‐Industry Model Analysis Regions 16 Figure 13. Total Industry Output by Sector, Tennessee, 2011 19 Figure 14. Employment by Sector, Tennessee, 2011 19 Figure 15. Growth in Direct Agriculture and Forestry as a Percentage of Tennessee’s Total Economy 22 Figure 16. Growth in Total Agriculture and Forestry as a Percentage of Tennessee’s Total Economy 36 Figure 17. Estimated Direct, Indirect, and Induced Impacts for Oilseed Farming and
Grain Farming 38 Figure 18. Estimated Direct, Indirect, and Induced Impacts for Vegetable & Melon
Farming and Greenhouse, Nursery, & Floriculture Production 39 Figure 19. Estimated Direct, Indirect, and Induced Impacts for Tobacco Farming and
Cotton Farming 40 Figure 20. Estimated Direct, Indirect, and Induced Impacts for All Other Crops Farming
And Cattle Ranching & Farming 41 Figure 21. Estimated Direct, Indirect, and Induced Impacts for Dairy Cattle & Milk
Production and Poultry & Egg Production 42 Figure 22. Estimated Direct, Indirect, and Induced Impacts for Animal Production, Except Cattle, Poultry, & Eggs 43 Figure 23. Estimated Direct, Indirect, and Induced Impacts for Sawmills & Wood
Preservation 47 Figure 24. Estimated Direct, Indirect, and Induced Impacts for Commercial Logging 48 Figure 25. Percent of Economic Activity from Direct Agriculture, 2011 54 Figure 26. Percent of Economic Activity from Total Agriculture, 2011 54 Figure 27. Percent of Economic Activity from Direct Forestry, 2011 55 Figure 28. Percent of Economic Activity from Total Forestry, 2011 55 Figure 29. Percent of Economic Activity from Direct Agriculture and Forestry, 2011 56 Figure 30. Percent of Economic Activity from Total Agriculture and Forestry, 2011 56 Figure A.1. Social Accounting Matrix Framework 69
Economic Impacts of Agriculture and Forestry in Tennessee
Introduction
This study measures the economic importance and impacts of agricultural and forestry
industrial complexes on Tennessee’s economy in 2011. An input‐output model reflecting the
state’s 2011 economy is used to determine direct impacts on related input industries, and
impacts through resulting expenditures by households at both the state and five‐region level.
The impacts are provided for four major indicators: total industry output, employment, labor
income, and value‐added. This study continues the series of previous reports (English, Jensen,
and Menard, 2001 and 2003; Menard, English, and Jensen, 2006, 2009 and 2011) where the
economic importance and impacts of agricultural and forestry industrial complexes on
Tennessee’s economy were examined using 1997, 2000, 2003, 2006, and 2009 data,
respectively (for additional details on the previous studies and the IMPLAN version used, see
Appendix A).
For the purpose of this analysis, agriculture1 and forestry includes the production and
processing of agricultural and forest products and the input suppliers of these products. The
objectives of this analysis are to: 1) provide an overview of Tennessee’s agriculture and
forestry resource base, 2) compare livestock and crop statistics for 2009 and 2011, 3) evaluate
the economic importance and impacts of the agricultural and forestry industrial complex for the
state and for specific consumption regions within the state, and 4) evaluate agriculture and
forestry’s tax contributions to the state.
1In this report, forestry and the production of forest products were incorporated in agriculture and agribusiness, respectively.
2
This document is structured along the same theme as the objectives. First, an overview
of Tennessee’s agriculture and forestry is presented. Crop and livestock cash receipts,
Tennessee’s rank in the United States based on the production of agricultural products, exports
for both agricultural and forestry products, plus agricultural and forestry manufacturing
statistics are discussed. Next, a review of state level changes in livestock and crops for the
years 2009 and 2011 is presented. Changes in livestock inventory, crop acreages, prices,
including a brief discussion of rainfall by climate divisions in the state are discussed in the
section. Finally, the remaining part of the document evaluates the economic impacts and
importance of the agricultural and forestry industrial complex for the state and specific
consumption regions within the state with an input‐output model. After the data and
methodology section discussion, direct and total economic impact results are summarized.
Overview of Agriculture and Forestry in Tennessee
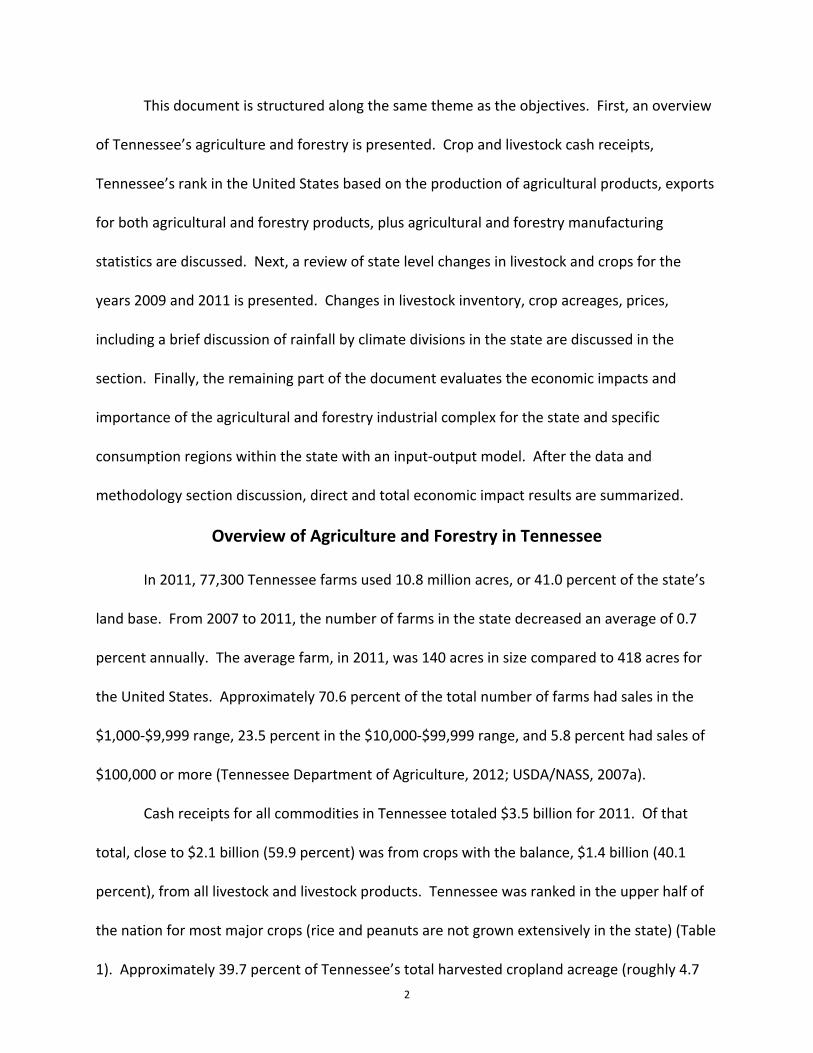
In 2011, 77,300 Tennessee farms used 10.8 million acres, or 41.0 percent of the state’s
land base. From 2007 to 2011, the number of farms in the state decreased an average of 0.7
percent annually. The average farm, in 2011, was 140 acres in size compared to 418 acres for
the United States. Approximately 70.6 percent of the total number of farms had sales in the
$1,000‐$9,999 range, 23.5 percent in the $10,000‐$99,999 range, and 5.8 percent had sales of
$100,000 or more (Tennessee Department of Agriculture, 2012; USDA/NASS, 2007a).
Cash receipts for all commodities in Tennessee totaled $3.5 billion for 2011. Of that
total, close to $2.1 billion (59.9 percent) was from crops with the balance, $1.4 billion (40.1
percent), from all livestock and livestock products. Tennessee was ranked in the upper half of
the nation for most major crops (rice and peanuts are not grown extensively in the state) (Table
1). Approximately 39.7 percent of Tennessee’s total harvested cropland acreage (roughly 4.7
3
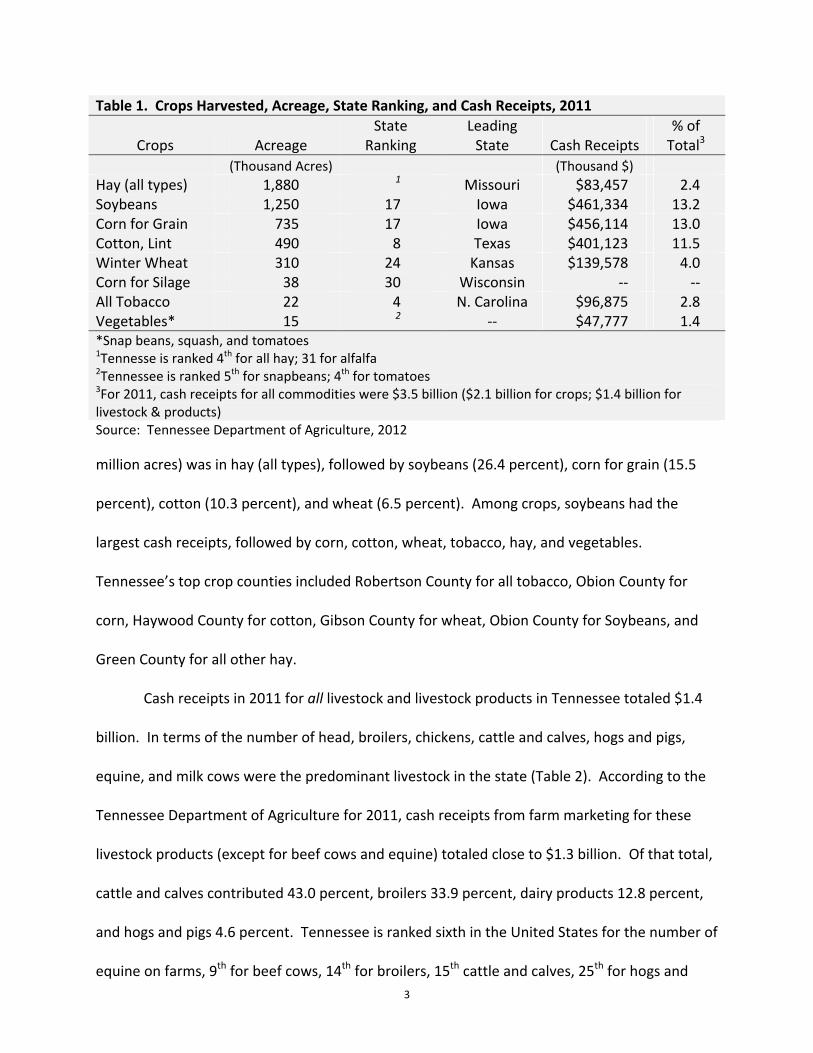
Table 1. Crops Harvested, Acreage, State Ranking, and Cash Receipts, 2011
Crops Acreage State
Ranking Leading State Cash Receipts
% of Total3
(Thousand Acres) (Thousand $)
Hay (all types) 1,880 1 Missouri $83,457 2.4 Soybeans 1,250 17 Iowa $461,334 13.2 Corn for Grain 735 17 Iowa $456,114 13.0 Cotton, Lint 490 8 Texas $401,123 11.5 Winter Wheat 310 24 Kansas $139,578 4.0 Corn for Silage 38 30 Wisconsin ‐‐ ‐‐ All Tobacco 22 4 N. Carolina $96,875 2.8 Vegetables* 15 2 ‐‐ $47,777 1.4 *Snap beans, squash, and tomatoes 1Tennesse is ranked 4th for all hay; 31 for alfalfa 2Tennessee is ranked 5th for snapbeans; 4th for tomatoes 3For 2011, cash receipts for all commodities were $3.5 billion ($2.1 billion for crops; $1.4 billion for livestock & products) Source: Tennessee Department of Agriculture, 2012
million acres) was in hay (all types), followed by soybeans (26.4 percent), corn for grain (15.5
percent), cotton (10.3 percent), and wheat (6.5 percent). Among crops, soybeans had the
largest cash receipts, followed by corn, cotton, wheat, tobacco, hay, and vegetables.
Tennessee’s top crop counties included Robertson County for all tobacco, Obion County for
corn, Haywood County for cotton, Gibson County for wheat, Obion County for Soybeans, and
Green County for all other hay.
Cash receipts in 2011 for all livestock and livestock products in Tennessee totaled $1.4
billion. In terms of the number of head, broilers, chickens, cattle and calves, hogs and pigs,
equine, and milk cows were the predominant livestock in the state (Table 2). According to the
Tennessee Department of Agriculture for 2011, cash receipts from farm marketing for these
livestock products (except for beef cows and equine) totaled close to $1.3 billion. Of that total,
and hogs and pigs 4.6 percent. Tennessee is ranked sixth in the United States for the number of
equine on farms, 9th for beef cows, 14th for broilers, 15th cattle and calves, 25th for hogs and
4
Table 2. Livestock Numbers, State Rankings, and Cash Receipts, 2011
Livestock Inventory State
Ranking Leading State Cash Receipts % of Total5
(Number) (Thousand $)
Broilers 190,300,000 14 Georgia $461,154 13.2 All Chickens 2,584,000 32 Iowa $77,3131 0.1 Cattle & Calves 1,990,000 15 Texas $586,3002 16.7 Beef Cows 990,000 9 Texas ‐‐ ‐‐ Hogs & Pigs 170,000 25 Iowa $62,300 1.8 Equine 142,0033 6 Texas ‐‐ ‐‐ Milk Cows 50,000 30 California $174,9004 5.0 1Includes eggs and farm chickens; excludes commercial broilers 2Includes beef cows; milk cows; replacement heifers; steers and bulls 500 pounds or greater; and calves under 500 pounds 32007 Census of Agriculture value 4Cash receipts from marketing milk and cream, plus value of milk used for home consumption and farm churned butter 5For 2011, cash receipts for all commodities were $3.5 billion ($2.1 billion for crops; $1.4 billion for livestock & products)
Source: Tennessee Department of Agriculture, 2012; USDA/NASS, 2007b & 2012 pigs, and 30th for milk cows. Tennessee’s top cattle county is Greene County for all cattle
(includes beef and dairy cows).
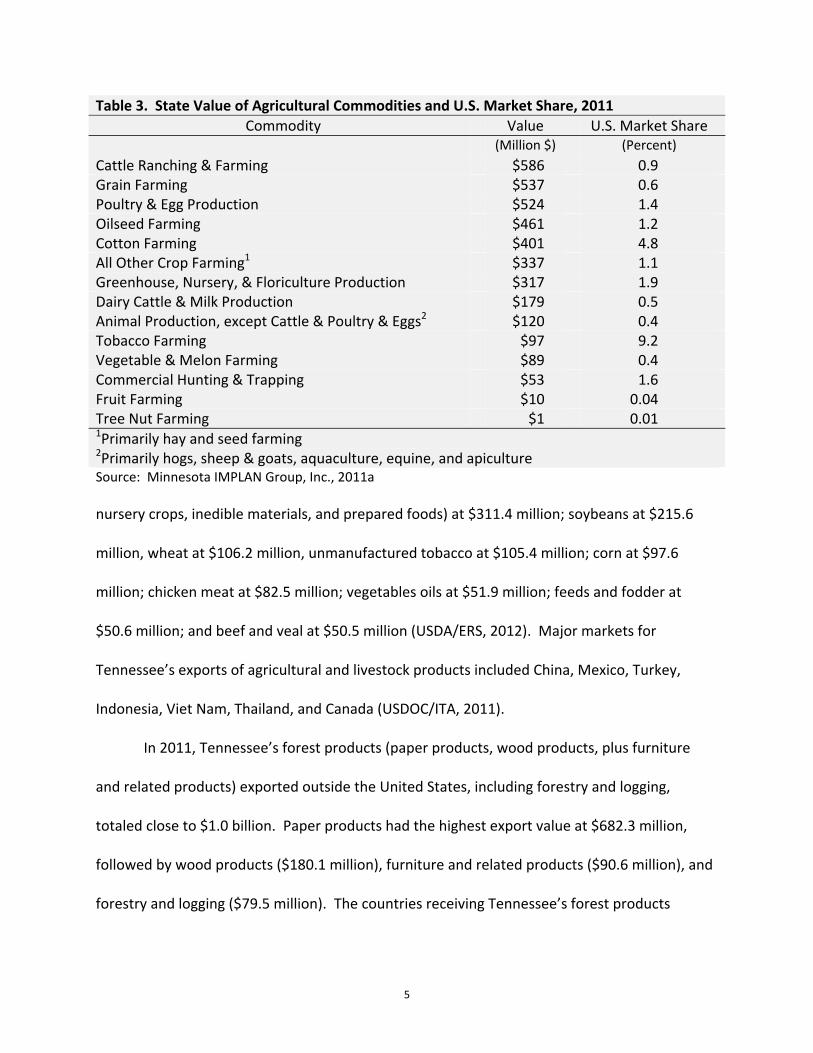
Tennessee’s more significant agricultural commodities in terms of dollar value, along
with their corresponding U.S. market share, are shown in Table 3. In descending order they
were cattle ranching and farming; grain farming (barley, corn, oats, sorghum, and wheat);
poultry and egg production; oilseed farming (primarily soybeans); cotton farming; all other crop
farming (primarily hay and seed); greenhouse, nursery, and floriculture production; cotton
farming; dairy cattle and milk production; animal production, except cattle, poultry, and eggs;
tobacco farming; and vegetable and melon farming. Tobacco and cotton had the largest U.S.
market share at 9.2 percent and 4.8 percent, respectively.
Tennessee’s 2011 agricultural commodity exports totaled $1.6 billion. The value of the
top ten commodities exported included cotton at $390.4 million, other products (defined at live
animals, other meats, animal parts, eggs, wine beer, other beverages, coffee, cocoa, hops,
5
Table 3. State Value of Agricultural Commodities and U.S. Market Share, 2011
Commodity Value U.S. Market Share
(Million $) (Percent)
Cattle Ranching & Farming $586 0.9 Grain Farming $537 0.6 Poultry & Egg Production $524 1.4 Oilseed Farming $461 1.2 Cotton Farming $401 4.8 All Other Crop Farming1 $337 1.1 Greenhouse, Nursery, & Floriculture Production $317 1.9 Dairy Cattle & Milk Production $179 0.5 Animal Production, except Cattle & Poultry & Eggs2 $120 0.4 Tobacco Farming $97 9.2 Vegetable & Melon Farming $89 0.4 Commercial Hunting & Trapping $53 1.6 Fruit Farming $10 0.04 Tree Nut Farming $1 0.01 1Primarily hay and seed farming 2Primarily hogs, sheep & goats, aquaculture, equine, and apiculture Source: Minnesota IMPLAN Group, Inc., 2011a
nursery crops, inedible materials, and prepared foods) at $311.4 million; soybeans at $215.6
million, wheat at $106.2 million, unmanufactured tobacco at $105.4 million; corn at $97.6
million; chicken meat at $82.5 million; vegetables oils at $51.9 million; feeds and fodder at
$50.6 million; and beef and veal at $50.5 million (USDA/ERS, 2012). Major markets for
Tennessee’s exports of agricultural and livestock products included China, Mexico, Turkey,
Indonesia, Viet Nam, Thailand, and Canada (USDOC/ITA, 2011).
In 2011, Tennessee’s forest products (paper products, wood products, plus furniture
and related products) exported outside the United States, including forestry and logging,
totaled close to $1.0 billion. Paper products had the highest export value at $682.3 million,
followed by wood products ($180.1 million), furniture and related products ($90.6 million), and
forestry and logging ($79.5 million). The countries receiving Tennessee’s forest products
6
exports included Mexico for paper products, China for wood products, and Canada for furniture
and fixtures and logging (USDOC/ITA, 2011).
Tennessee’s forest cover is primarily hardwoods (89 percent of the forest composition)
making it one of the top three hardwood lumber producing states in the United States. It is
estimated that over 120 tree species exist in Tennessee. White oak, red oak, hickory, yellow
poplar, and maple were some of the more predominant hardwood species. For softwoods,
loblolly pine, virginia pine, red cedar, and shortleaf pine were major species. The dominant
forest type in the state is oak‐hickory, accounting for an estimated 9.9 million acres. Of the
close to 14.0 million acres in forest, 83.7 percent is privately owned with Federal and state/local
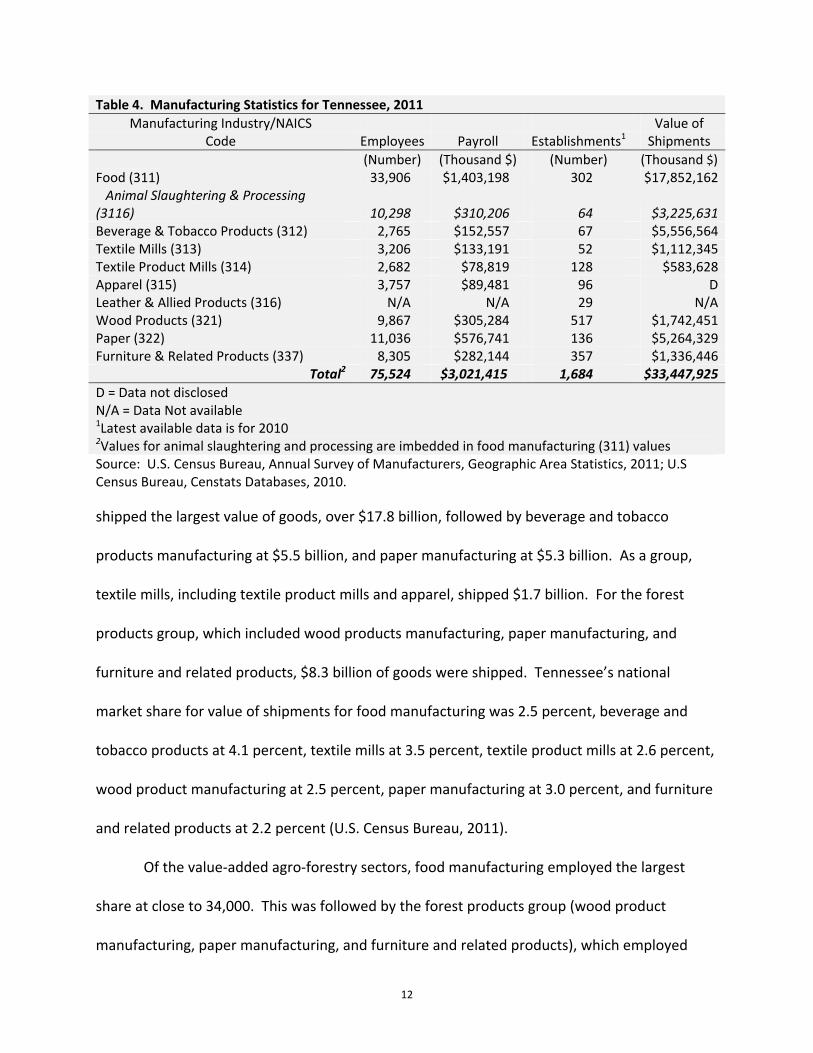
D = Data not disclosed N/A = Data Not available 1Latest available data is for 2010 2Values for animal slaughtering and processing are imbedded in food manufacturing (311) values Source: U.S. Census Bureau, Annual Survey of Manufacturers, Geographic Area Statistics, 2011; U.S Census Bureau, Censtats Databases, 2010.
shipped the largest value of goods, over $17.8 billion, followed by beverage and tobacco
products manufacturing at $5.5 billion, and paper manufacturing at $5.3 billion. As a group,
textile mills, including textile product mills and apparel, shipped $1.7 billion. For the forest
products group, which included wood products manufacturing, paper manufacturing, and
furniture and related products, $8.3 billion of goods were shipped. Tennessee’s national
market share for value of shipments for food manufacturing was 2.5 percent, beverage and
tobacco products at 4.1 percent, textile mills at 3.5 percent, textile product mills at 2.6 percent,
wood product manufacturing at 2.5 percent, paper manufacturing at 3.0 percent, and furniture
and related products at 2.2 percent (U.S. Census Bureau, 2011).
Of the value‐added agro‐forestry sectors, food manufacturing employed the largest
share at close to 34,000. This was followed by the forest products group (wood product
manufacturing, paper manufacturing, and furniture and related products), which employed
13
close over 29,000. The textile mills and related products, including apparel, employed over
9,600 workers.
State Level Changes in Livestock and Crops: 2009 to 2011
Comparing 2009 and 2011 agricultural data for the state revealed an increase in the
number of cattle and calves, broilers, and eggs, while the number of chickens (excluding
broilers), dairy cattle, and hogs decreased. Prices increased for all livestock products. Many of
the traditional row crops grown in the state experienced increased planted acreage except for
soybeans, wheat, and hay. Crop prices increased for all major crops grown including the
vegetable crops tomatoes and snap beans.
Precipitation for the state by climatic division for the timeframe reviewed in Figure 11.
Above average rainfall occurred across the state for the years 2009 and 2011. For 2008, below
normal rainfall occurred across most of the state, except for West Tennessee. For 2010, below
normal rainfall occurred across the entire state (U.S. Department of Commerce, 2011).
Livestock Changes in Inventory and Prices
Compared to 2009 production levels, eggs had the largest increase in numbers (12.4
percent), followed by cattle and calves and broilers (both under 1.0 percent) (Table 5). The
largest decrease in numbers was for hogs (17.1 percent), followed by milk cows (15.3 percent),
and all chickens (8.0 percent). Total milk production for the state declined 11.0 percent from
2009 (909 million pounds) to 2011 (810 million pounds). Livestock prices were higher for all
livestock products. Hogs had the greatest price increase at 63.4 percent, followed by eggs (36.8
percent), cattle and calves (29.9 percent), all chickens (3.0 percent), and broilers (2.2 percent)
(Tennessee Department of Agriculture, 2012).
14
Table 5. Comparison of Tennessee Livestock Numbers and Prices, 2009 and 20111
Commodity Inventory Change Units Price Change Units 2009 2011 2009 2011
% 1,000 (dollars/unit) % All Cattle & Calves 1,980 1,990 0.5 head $68.30 $88.70 29.9 100 pounds All Chickens 2,808 2,584 ‐8.0 no. $6.60 $6.80 3.0 head Broilers 189,700 190,300 0.3 no. $0.46 $0.47 2.2 pound Eggs 323,000 363,000 12.4 no. $1.44 $1.97 36.8 dozen Milk Cows 59 50 ‐15.3 head ‐‐ ‐‐ ‐‐ head All Hogs 205 170 ‐17.1 head $39.60 $64.70 63.4 100 pounds
Source: Tennessee Department of Agriculture, 2010 and 2012; USDA/NASS, 2012 1Data in nominal values.
Crop Changes in Acres Planted and Prices
With the exception of soybeans, wheat, tomatoes, and hay, acres of crops harvested
increased from 2009 to 2011 (Table 6). Cotton had the largest increase in acres harvested at
75.0 percent, followed by snap beans (58.8 percent), corn (24.6 percent), and tobacco (1.9
percent. Cotton harvested acres increased from 280 to 490 thousand acres. All the crop
commodities experienced higher prices for the timeframe examined. The largest price increase
was for corn, followed by wheat, cotton, soybeans, snap beans, tomatoes, hay, and tobacco.
Table 6. Comparison of Tennessee Crop Acreages and Prices, 2009 and 20111
tobacco had a decrease in gross receipts during this timeframe (Tennessee Department of
Agriculture, 2010 and 2012).
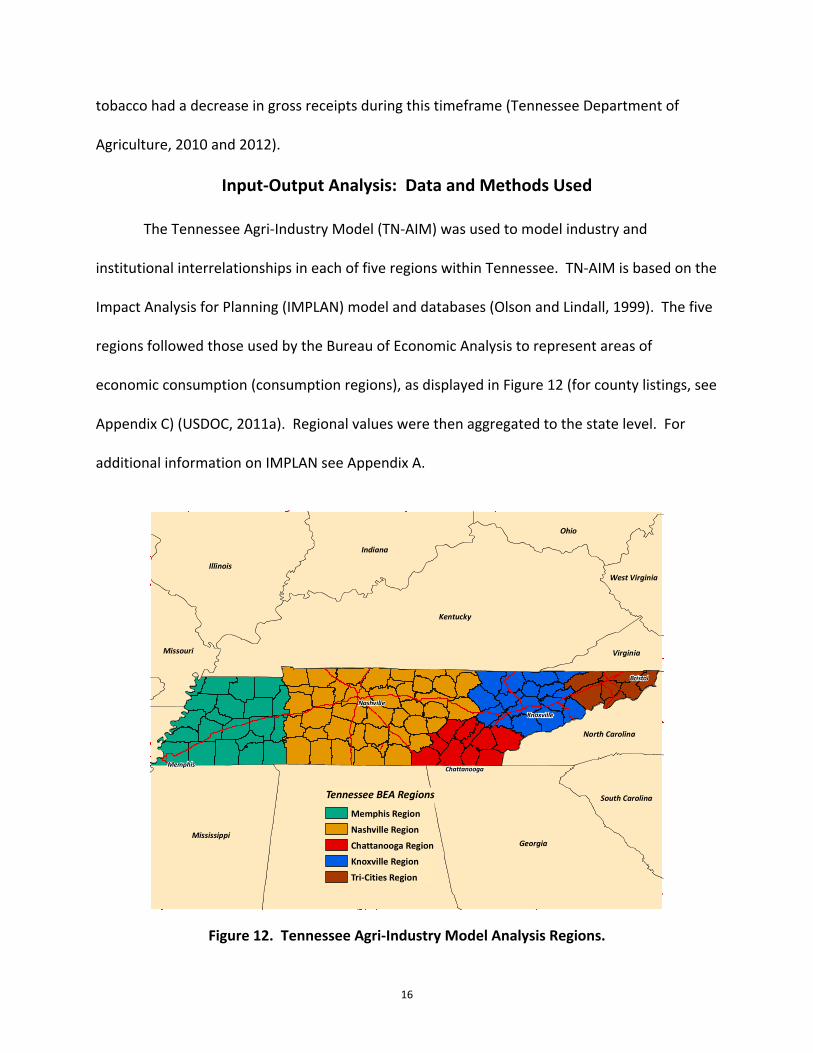
Input‐Output Analysis: Data and Methods Used
The Tennessee Agri‐Industry Model (TN‐AIM) was used to model industry and
institutional interrelationships in each of five regions within Tennessee. TN‐AIM is based on the
Impact Analysis for Planning (IMPLAN) model and databases (Olson and Lindall, 1999). The five
regions followed those used by the Bureau of Economic Analysis to represent areas of
economic consumption (consumption regions), as displayed in Figure 12 (for county listings, see
Appendix C) (USDOC, 2011a). Regional values were then aggregated to the state level. For
additional information on IMPLAN see Appendix A.
Figure 12. Tennessee Agri‐Industry Model Analysis Regions.
!
!
!
!
!
Kentucky
GeorgiaAlabama
Illinois
Mississippi
Indiana
Ohio
Missouri
North Carolina
South Carolina
Virginia
West Virginia
Bristol
Memphis
Knoxville
Nashville
Chattanooga
Tennessee BEA Regions
Memphis Region
Nashville Region
Chattanooga Region
Knoxville Region
Tri‐Cities Region
17
IMPLAN (Version 3.0) utilizes a National Trade Flows Model (NTFM) (doubly‐constrained
gravity model) to estimate a new set of regional purchase coefficients and other trade data that
predict local purchases based on a region’s characteristics (Lindall, Olson, and Alward, 2006).
Output from the model includes descriptive measures of the economy including total industry
output, employment, and value‐added for 440 industries in the Tennessee economy (Appendix
B). Total industry output is defined as the value of production by industry per year.
Employment represents total wage and salary employees, as well as self‐employed jobs in a
region, for both full‐time and part‐time workers. Total value added is defined as all income to
workers paid by employers; self‐employed income; interests, rents, royalties, dividends, and
profit payments; and excise and sales taxes paid by individuals to businesses. Not only can the
model describe a regional economy, but the model also can be used for predictive purposes by
providing estimates of multipliers.
Multipliers measure the response of the economy to a change in demand or production.
Multiplier analysis generally focuses on the impacts of exogenous changes on: a) output of the
sectors in the economy, b) income earned by households because of new outputs, and
c) employment (in physical terms) that is expected to be generated because of the new
outputs. The notion of multipliers rests on the difference between the initial impact of an
exogenous change (final demand) and the total impacts of a change. Direct impacts measure
the response of a given industry given a change in final demand for that same industry. Indirect
impacts represent the response by all local industries that occur as a result of a change in final
demand for a specific industry. Induced impacts represent the response by all local industries
caused by increased (decreased) expenditures of new household income and inter‐institutional
transfers generated (lost) from the direct and indirect impacts of the change in final demand for
18
a specific industry. This study uses Type I and Type SAM (Social Accounting Matrix) multipliers.
Type I multipliers are calculated by dividing direct plus indirect impacts by the direct impacts,
where the Type SAM multipliers = (direct + indirect + induced impacts)/direct impacts. The
Type SAM multipliers take into account the expenditures resulting from increased incomes of
households as well as inter‐institutional transfers resulting from the economic activity.
Therefore, Type SAM multipliers assume that as final demand changes, incomes also increase
along with inter‐institutional transfers. As consumers and institutions increase expenditures
this leads to increased demands from local industries.
Results
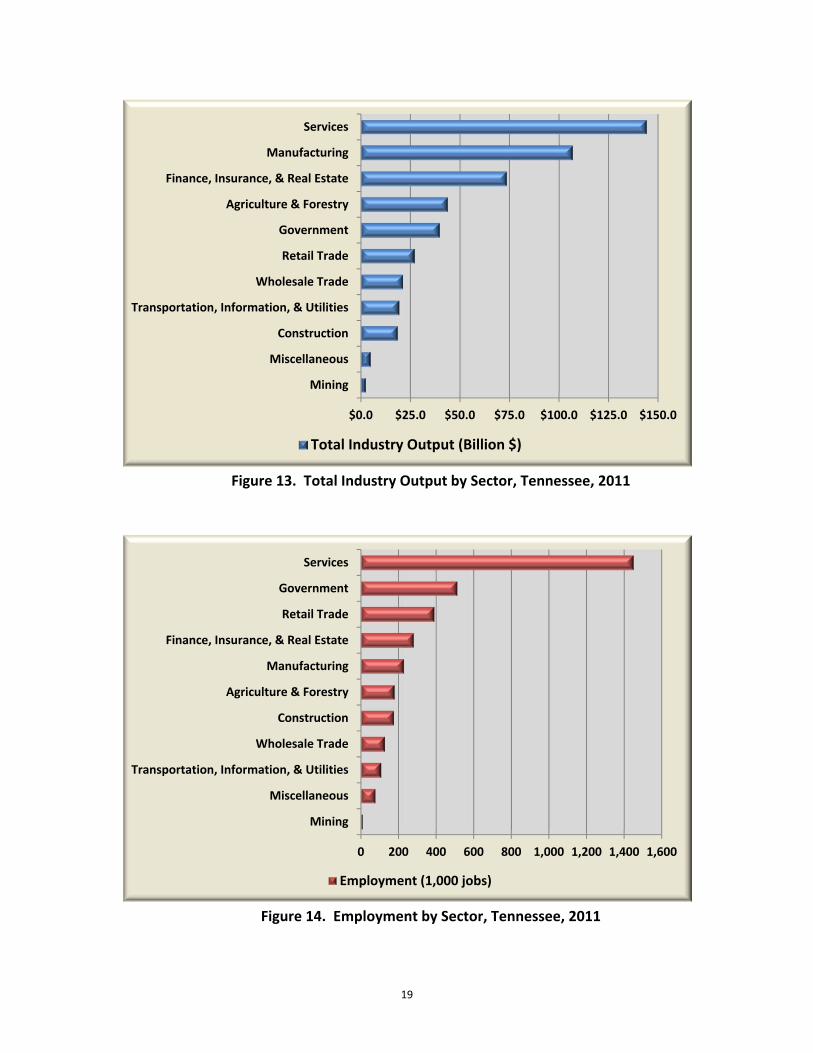
According to IMPLAN data, Tennessee had a $500 billion economy in 2011. The services
industry was the largest sector of the economy at $144.1 billion (Figure 13) and over 1.4 million
jobs (Figure 14). The agro‐forestry industrial complex ranked fourth in terms of total industry
output at $43.6 billion. The state’s value‐added, or state gross domestic product (GDP)2, is
estimated at $259.4 billion with the agro‐forestry industrial complex contributing $11.8 billion
towards the state’s GDP. For every dollar of sales, the agro‐forestry industrial complex
contributed $0.27 to the state’s GDP, which is less than all of the sectors except manufacturing
(Table 7).
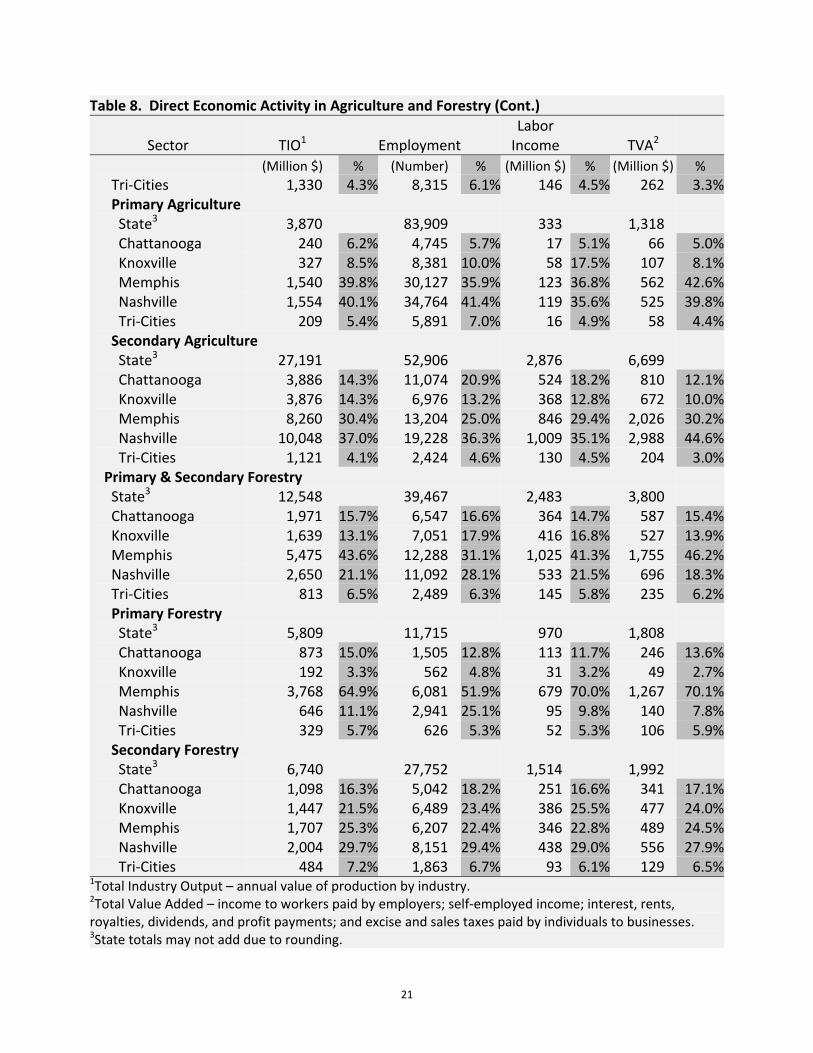
Economic Impacts at the State & In‐State Region Levels
Direct economic activity for total industry output (TIO), employment, labor income, and
total value‐added (TVA) for agriculture and forestry for the state and by analysis regions within
the state are presented in Table 8. In 2011, agriculture and forestry related industries
2 The state domestic product is measuring by summing employee compensation, proprietor income, other property type income, and indirect business taxes.
19
Figure 13. Total Industry Output by Sector, Tennessee, 2011
Figure 14. Employment by Sector, Tennessee, 2011
$0.0 $25.0 $50.0 $75.0 $100.0 $125.0 $150.0
Mining
Miscellaneous
Construction
Transportation, Information, & Utilities
Wholesale Trade
Retail Trade
Government
Agriculture & Forestry
Finance, Insurance, & Real Estate
Manufacturing
Services
Total Industry Output (Billion $)
0 200 400 600 800 1,000 1,200 1,400 1,600
Mining
Miscellaneous
Transportation, Information, & Utilities
Wholesale Trade
Construction
Agriculture & Forestry
Manufacturing
Finance, Insurance, & Real Estate
Retail Trade
Government
Services
Employment (1,000 jobs)
20
Table 7. Estimated Economic Indicators for Tennessee, 2011
Total3 $499.9 $259.4 3,517.9 1Total Industry Output – annual value of production by industry. 2Total Value Added – income to workers paid by employers; self‐employed income; interest, rents, royalties, dividends, and profit payments; and excise and sales taxes paid by individuals to businesses. 3State totals may not add due to rounding.
Table 8. Direct Economic Activity in Agriculture and Forestry
State3 6,740 27,752 1,514 1,992 Chattanooga 1,098 16.3% 5,042 18.2% 251 16.6% 341 17.1% Knoxville 1,447 21.5% 6,489 23.4% 386 25.5% 477 24.0% Memphis 1,707 25.3% 6,207 22.4% 346 22.8% 489 24.5% Nashville 2,004 29.7% 8,151 29.4% 438 29.0% 556 27.9% Tri‐Cities 484 7.2% 1,863 6.7% 93 6.1% 129 6.5%1Total Industry Output – annual value of production by industry. 2Total Value Added – income to workers paid by employers; self‐employed income; interest, rents, royalties, dividends, and profit payments; and excise and sales taxes paid by individuals to businesses. 3State totals may not add due to rounding.
22
Relatively Stagnant Agriculture and Forestry Growth
Growth in direct agriculture and forestry as a percentage of Tennessee’s total economy has remained relatively stagnant for the years depicted. For both agricultre and forestry, the largest growth as a percentage of the state’s total economy occurred in 2003. For 2009 and 2011, growth in the agro‐forestry industry has been relatively stagnant.
Figure 15. Growth in Direct Agriculture and Forestry as a Percentage of
Tennessee’s Total Economy.
contributed a total of $43.6 billion in direct economic activity to the state of Tennessee, or 8.7
percent of the state’s economy. Employment in agriculture and forestry related industries
were over 176 thousand persons, or 5.0 percent of the workforce. Total value added was $11.8
billion, with $5.7 billion in labor income. Much of the industry output generated from
agriculture and forestry was through secondary or manufactured products. For agriculture,
approximately 38.7 percent of the workforce was employed in secondary industries (agriculture
input supplying industries plus manufacturing) and the rest (61.3 percent) in primary industries
(crop and livestock commodities). For forestry, however, 70.3 percent of the forestry
workforce was employed in secondary industries (wood products manufacturing) and 29.7
23
percent in primary (commercial logging; pulp, paper, and paperboard mills; sawmills; and
nursery/timber tracts).
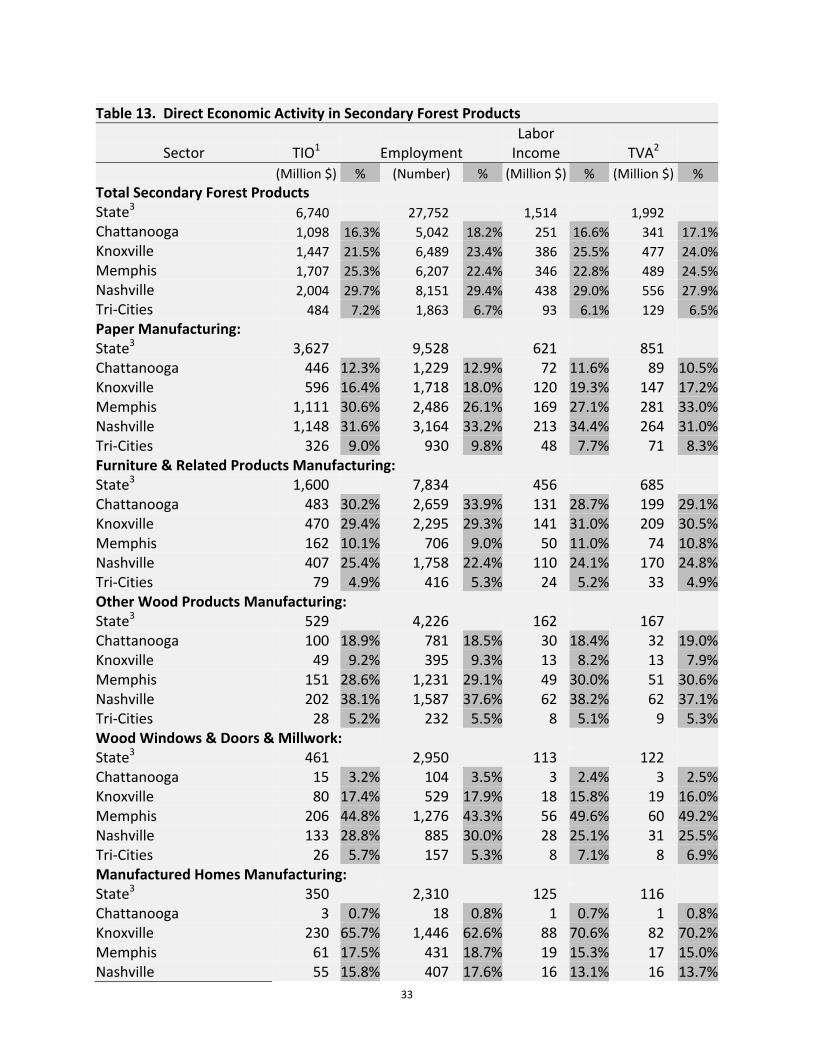
The largest value of output from primary agriculture, 40.2 percent, originated in the
Nashville Region (Figure 12 on page 17), followed by the Memphis Region at 39.8 percent. The
Nashville and Memphis Regions also have the largest value of outputs for secondary agriculture
at 37.0 percent and 30.4 percent, respectively. For both primary and secondary forestry, the
Memphis Region had the largest value of total industry output followed by the Nashville
Region. The Memphis Region dominates the economic activity for primary forestry for the
state followed by the Chattanooga and Nashville Regions. For secondary forestry, the Nashville
Region had more jobs followed by the Knoxville and Memphis Regions. Yet for total industry
output, the Memphis Region was larger than the Knoxville Region.
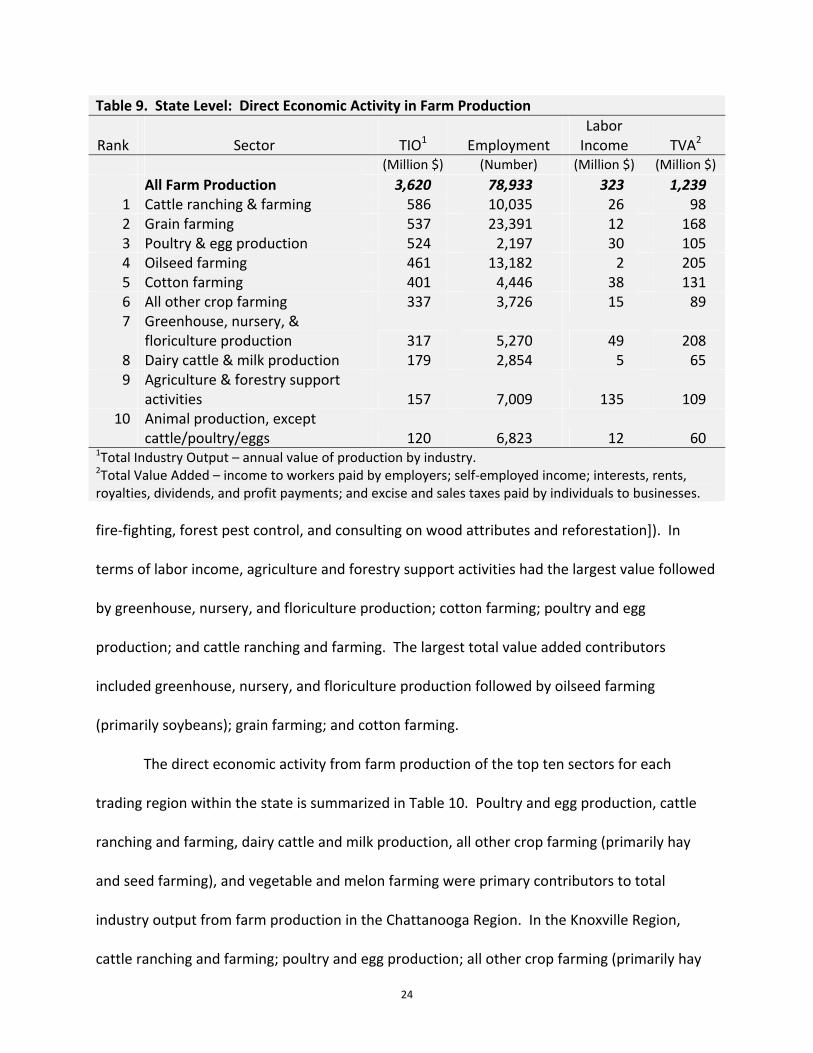
Primary Agricultural Products: The largest output value (16.2 percent) for the state from farm production was from
cattle ranching and farming (Table 9), followed by grain farming (14.8 percent); poultry and egg
cattle/poultry/eggs 120 6,823 12 60 1Total Industry Output – annual value of production by industry. 2Total Value Added – income to workers paid by employers; self‐employed income; interests, rents, royalties, dividends, and profit payments; and excise and sales taxes paid by individuals to businesses.
fire‐fighting, forest pest control, and consulting on wood attributes and reforestation]). In
terms of labor income, agriculture and forestry support activities had the largest value followed
by greenhouse, nursery, and floriculture production; cotton farming; poultry and egg
production; and cattle ranching and farming. The largest total value added contributors
included greenhouse, nursery, and floriculture production followed by oilseed farming
(primarily soybeans); grain farming; and cotton farming.
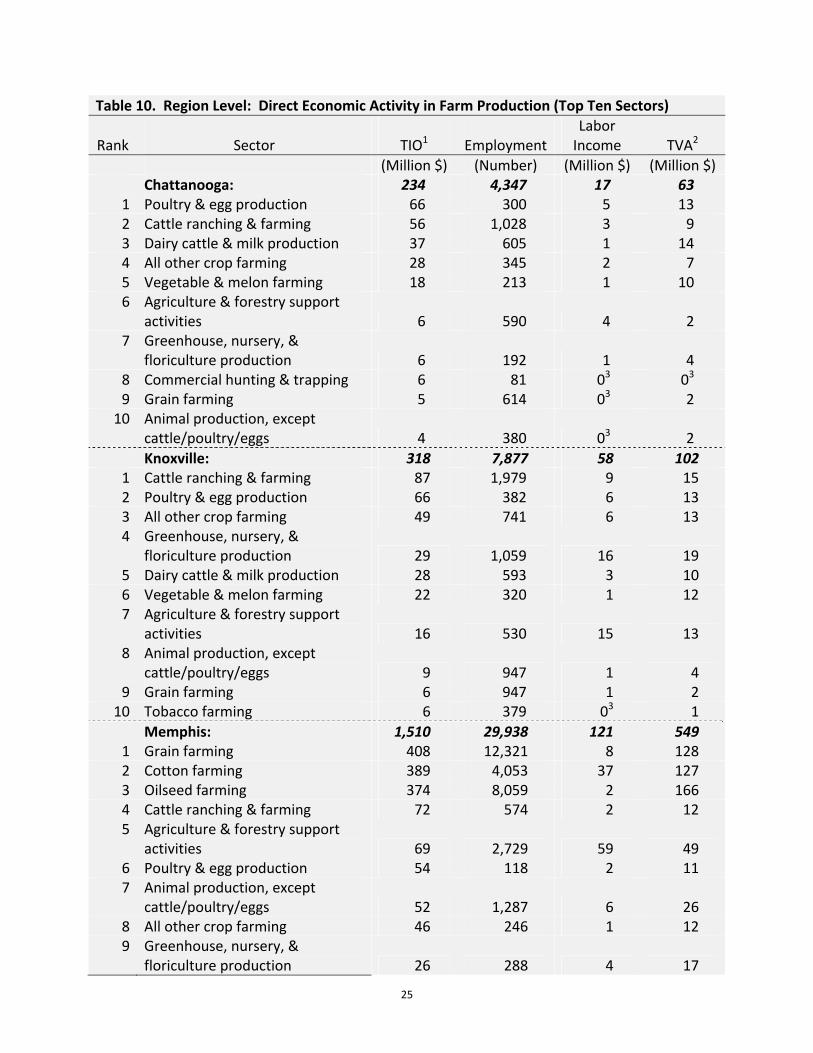
The direct economic activity from farm production of the top ten sectors for each
trading region within the state is summarized in Table 10. Poultry and egg production, cattle
ranching and farming, dairy cattle and milk production, all other crop farming (primarily hay
and seed farming), and vegetable and melon farming were primary contributors to total
industry output from farm production in the Chattanooga Region. In the Knoxville Region,
cattle ranching and farming; poultry and egg production; all other crop farming (primarily hay
25
Table 10. Region Level: Direct Economic Activity in Farm Production (Top Ten Sectors)
cattle/poultry/eggs 6 721 1 3 9 Agriculture & forestry support
activities 6 307 5 4 10 Grain farming 4 711 03 1
1Total Industry Output – annual value of production by industry. 2Total Value Added – income to workers paid by employers; self‐employed income; interests, rents, royalties, dividends, and profit payments; and excise and sales taxes paid by individuals to businesses. 3Values of 0 are nonzero values that are less than 1.
and seed farming); greenhouse, nursery, and floriculture production; dairy cattle and milk
production; and vegetable and melon farming were important sectors. For the Memphis
Region, grain farming, cotton farming, oilseed farming, cattle ranching and farming, and
agriculture and forestry support activities had the largest total industry output, while in the
27
Nashville Region the greatest total industry output values were from poultry and egg
production; cattle ranching and farming; greenhouse, nursery, and floriculture production; all
other crop farming (primarily hay and seed farming); and grain farming. Cattle ranching and
farming; all other crop farming (primarily hay and seed farming); poultry and egg production;
dairy cattle and milk production; tobacco farming; and greenhouse, nursery, and floriculture
production were important contributors to total industry output for the Tri‐Cities Region. For
all regions except Memphis and Nashville, cattle ranching and farming employed the largest
number of workers. For the Memphis Region, cotton farming employed the largest numbers,
followed by oilseed and cotton farming. For Nashville, grain farming employed the largest
numbers, followed by cattle ranching and farming and oilseed farming.
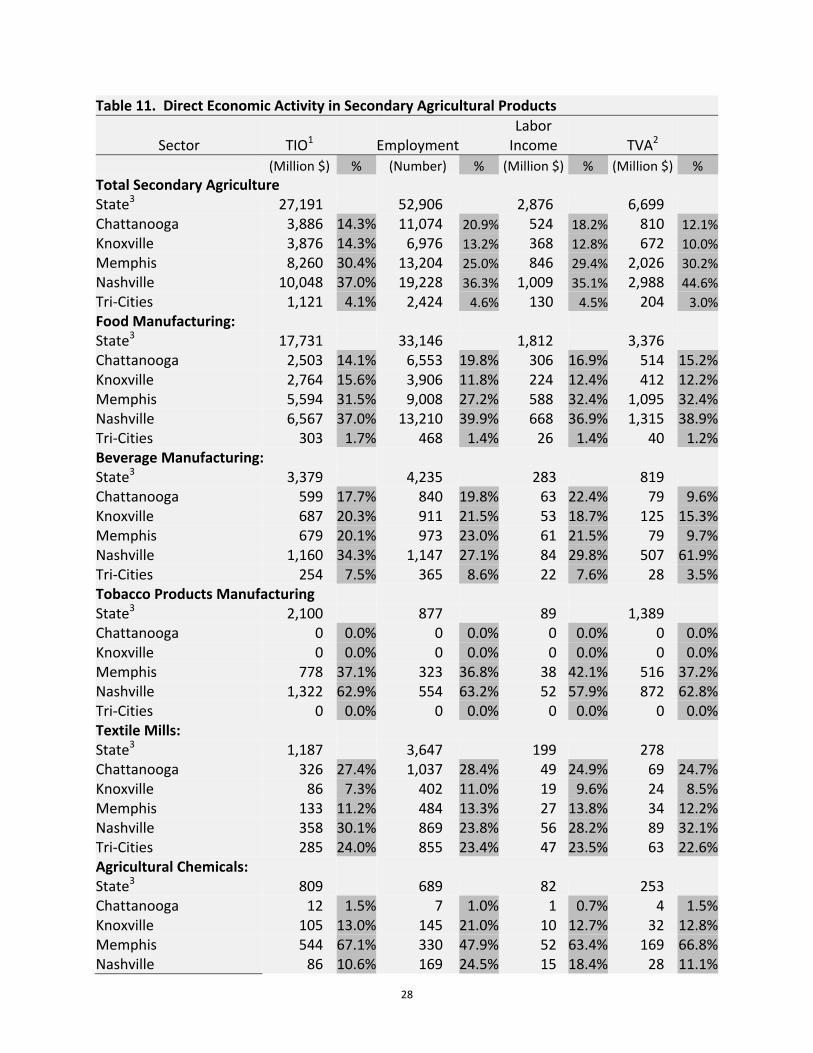
Secondary Agricultural Products:
Among secondary agricultural products, food manufacturing contributed the largest
total industry output, followed by beverage manufacturing, tobacco products manufacturing,
Tri‐Cities 1 0.3% 7 0.3% 04 0.3% 04 0.3%Veneer, Plywood, & Engineered Wood Products Manufacturing: State3 172 903 37 50 Chattanooga 51 29.8% 250 27.7% 15 41.0% 17 34.1%Knoxville 22 12.7% 106 11.8% 5 14.3% 7 14.9%Memphis 15 8.7% 76 8.4% 3 8.4% 5 9.3%Nashville 60 34.9% 350 38.7% 8 22.2% 13 26.4%Tri‐Cities 24 13.9% 121 13.4% 5 14.0% 8 15.3%1Total Industry Output – annual value of production by industry. 2Total Value Added – income to workers paid by employers; self‐employed income; interests, rents, royalties, dividends, and profit payments; and excise and sales taxes paid by individuals to businesses. 3State totals may not add due to rounding. 4Values of 0 are nonzero values that are less than 1.
35
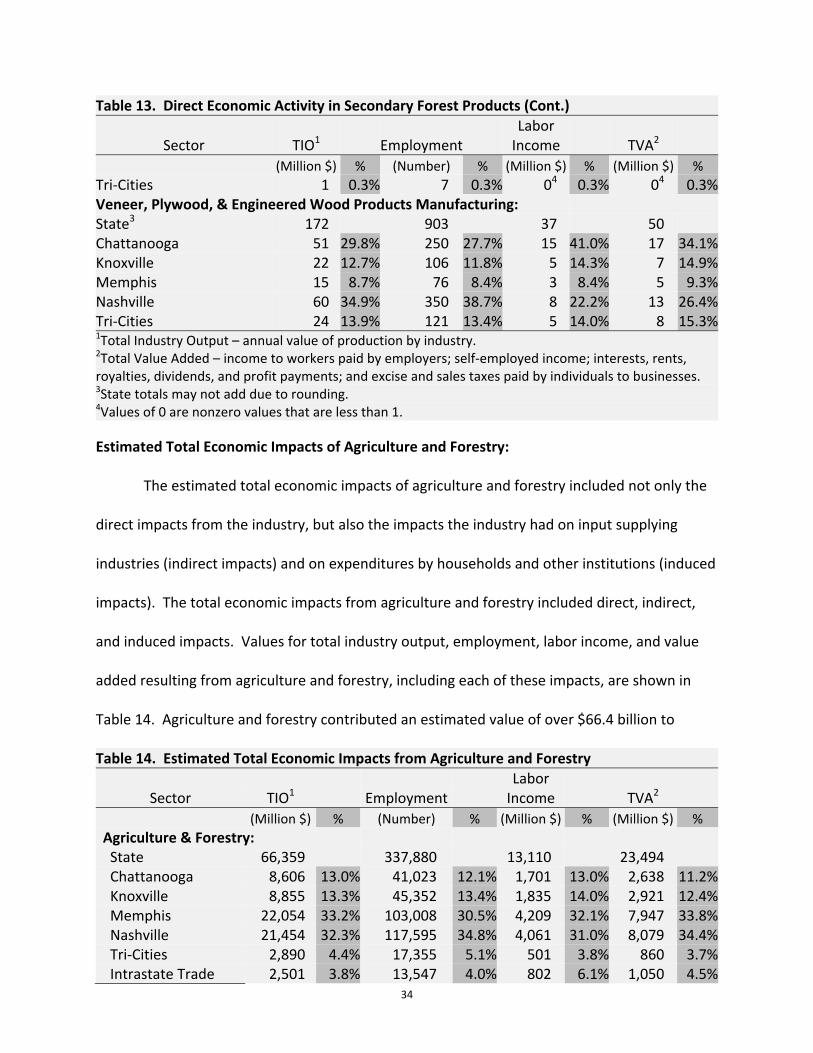
Table 14. Estimated Total Economic Impacts from Agriculture and Forestry (Cont.)
Secondary Forestry State 10,403 55,094 2,807 4,044 Chattanooga 1,514 14.6% 8,373 15.2% 396 14.1% 566 14.0% Knoxville 2,262 21.7% 12,974 23.5% 664 23.6% 937 23.2% Memphis 2,480 23.8% 11,878 21.6% 618 22.0% 929 23.0% Nashville 3,112 29.9% 16,393 29.8% 847 30.2% 1,207 29.9% Tri‐Cities 646 6.2% 3,198 5.8% 144 5.1% 217 5.4% Intrastate Trade 389 3.7% 2,278 4.1% 138 4.9% 187 4.6%1Total Industry Output – annual value of production by industry. 2Total Value Added – income to workers paid by employers; self‐employed income; interests, rents, royalties, dividends, and profit payments; and excise and sales taxes paid by individuals to businesses.
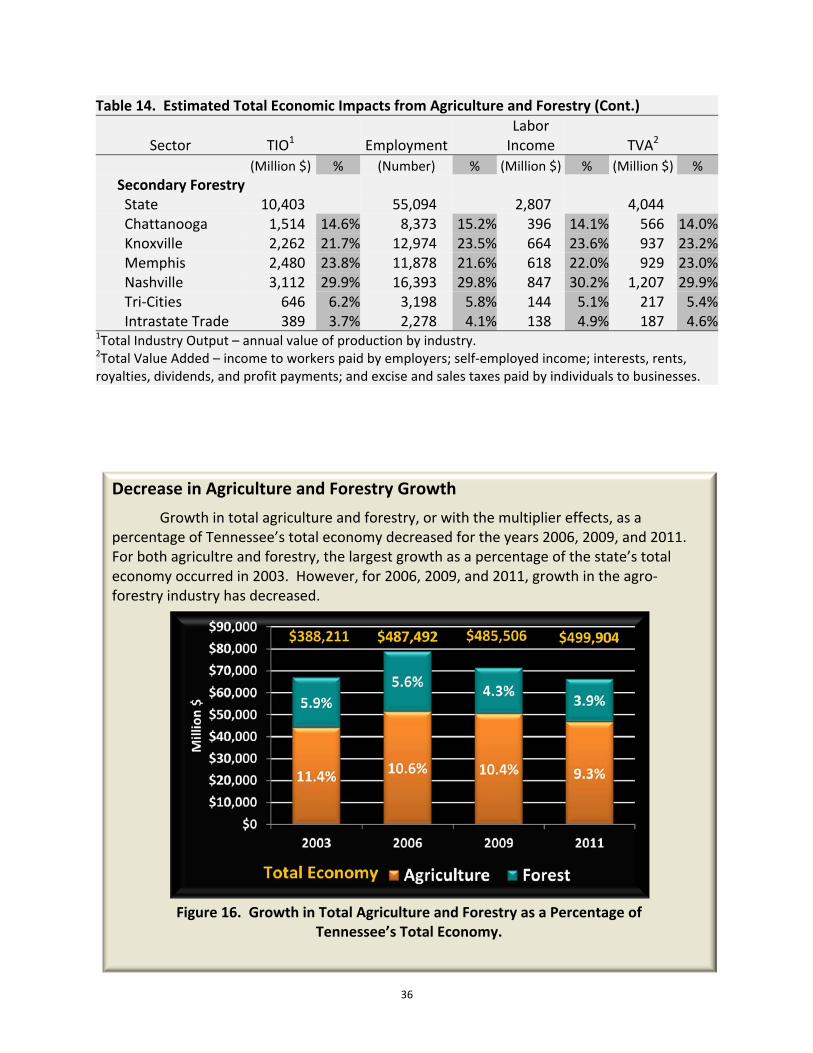
Decrease in Agriculture and Forestry Growth
Growth in total agriculture and forestry, or with the multiplier effects, as a percentage of Tennessee’s total economy decreased for the years 2006, 2009, and 2011. For both agricultre and forestry, the largest growth as a percentage of the state’s total economy occurred in 2003. However, for 2006, 2009, and 2011, growth in the agro‐forestry industry has decreased.
Figure 16. Growth in Total Agriculture and Forestry as a Percentage of
Tennessee’s Total Economy.
37
Tennessee’s close to $500.0 billion economy in 2011. An estimated 70.4 percent of the total
economic impacts came from primary and secondary agriculture, while forest operations and
forest products contributed about 29.7 percent. Employment in both agriculture and forestry
totaled close to 338 thousand workers. Of that value, 73.1 percent were related with primary
and secondary agriculture production, with 26.9 percent from primary and secondary forest
products production. Intrastate trade represented values purchased or imported from outside
the regions but within the state. A more detailed total impact presentation of output,
employment, labor income, and value added by sub‐sector is shown in Appendix E.
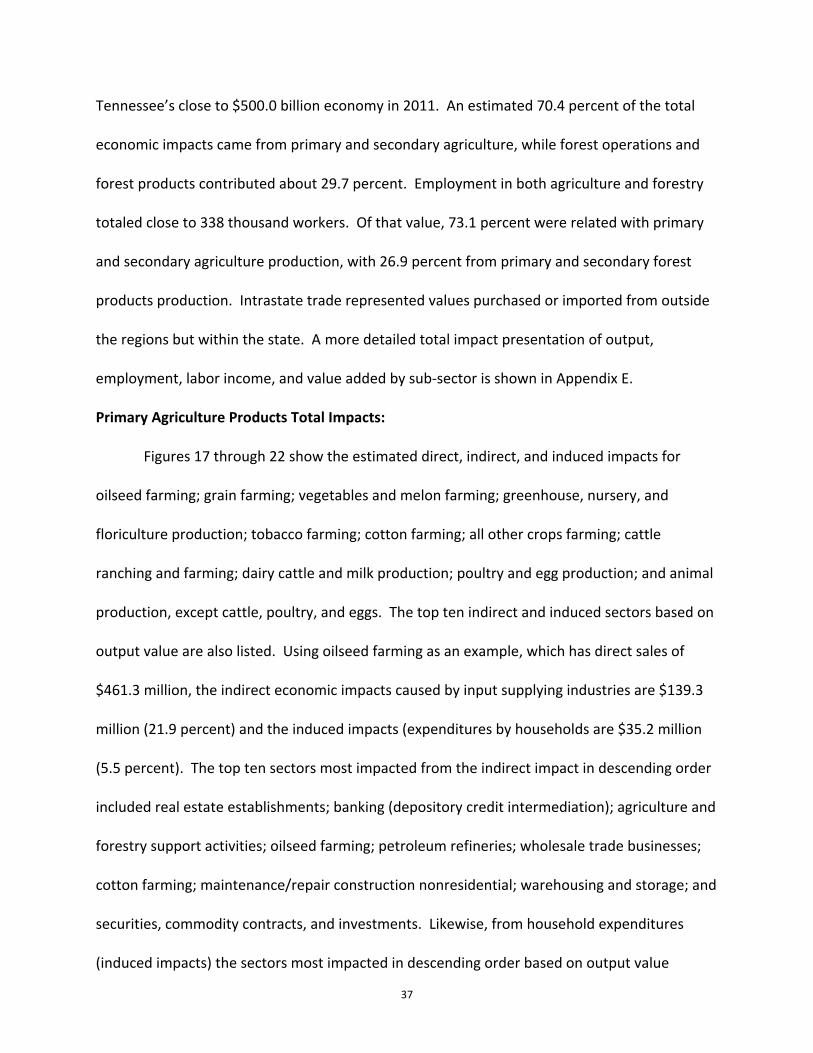
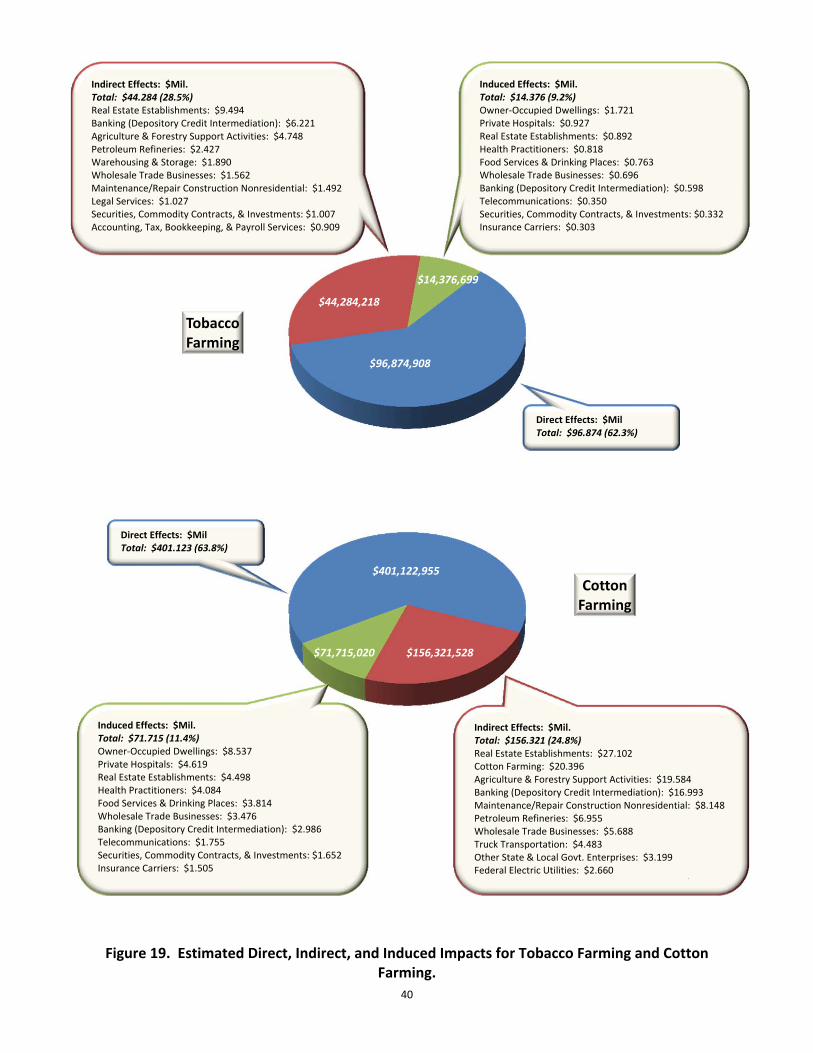
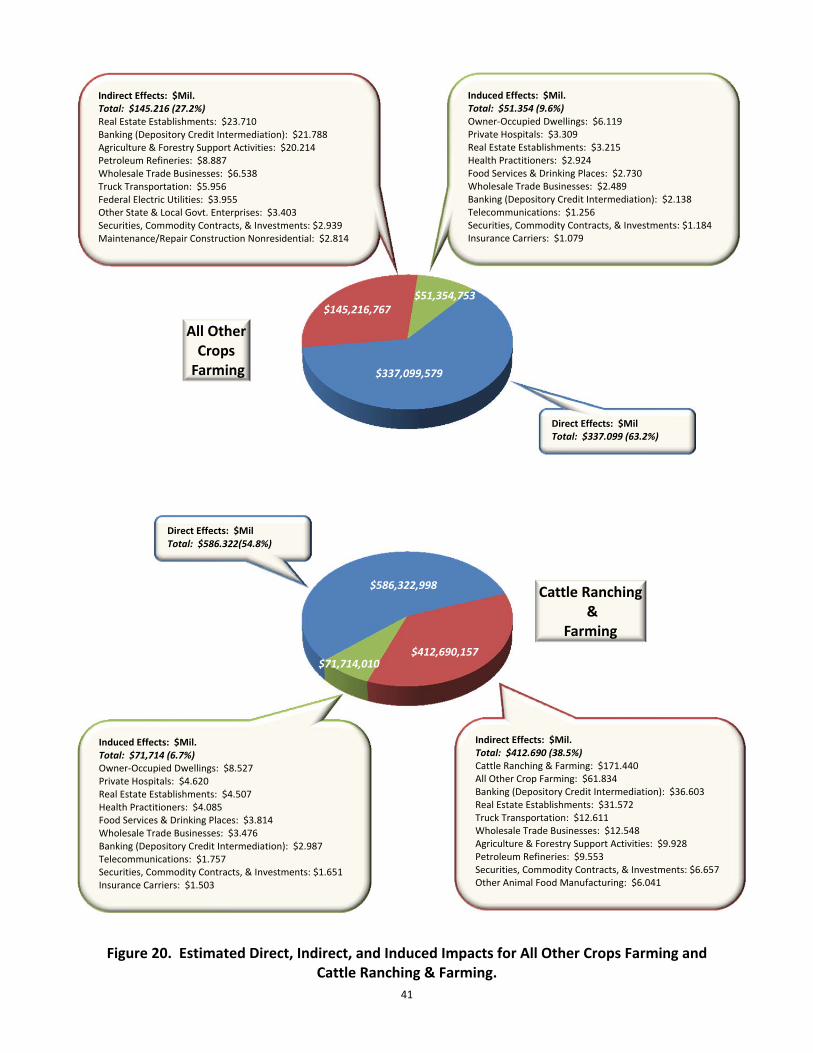
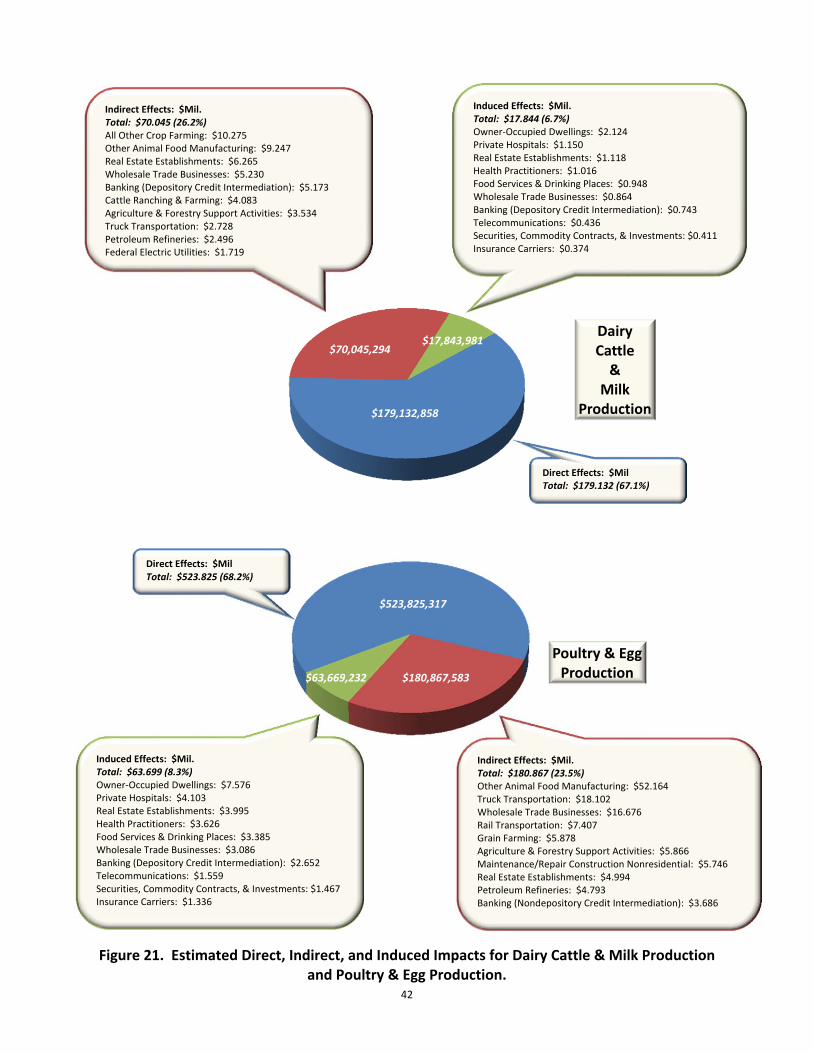
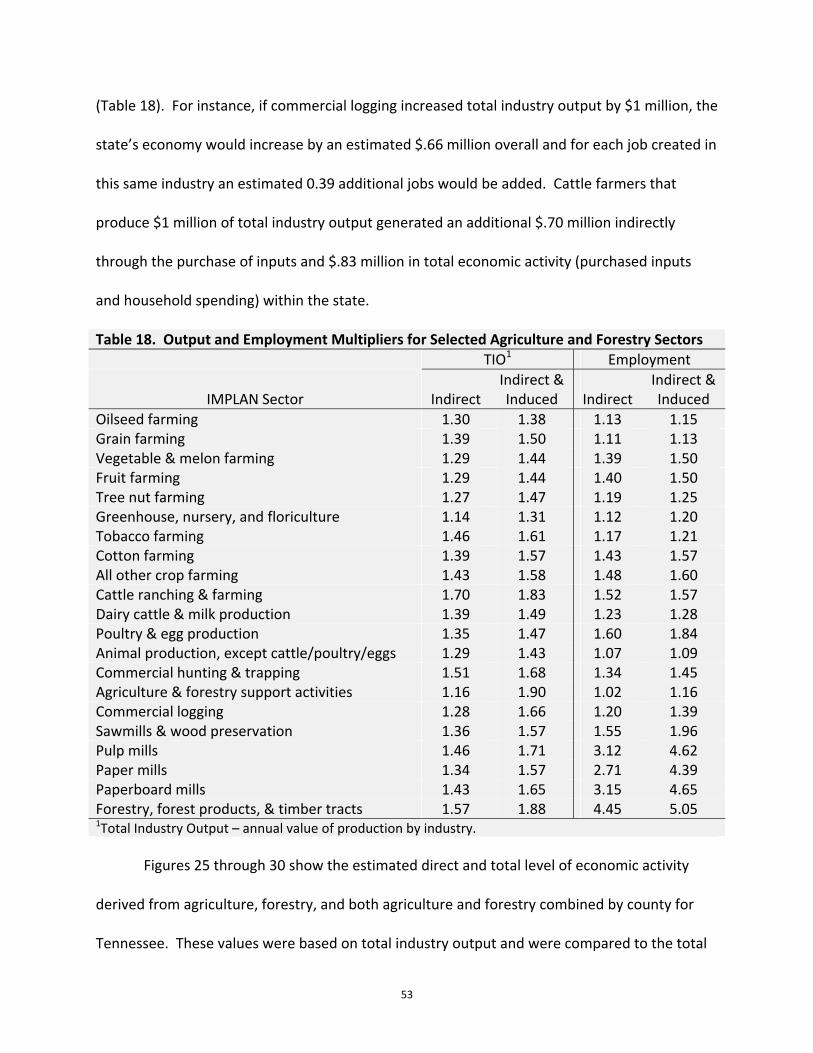
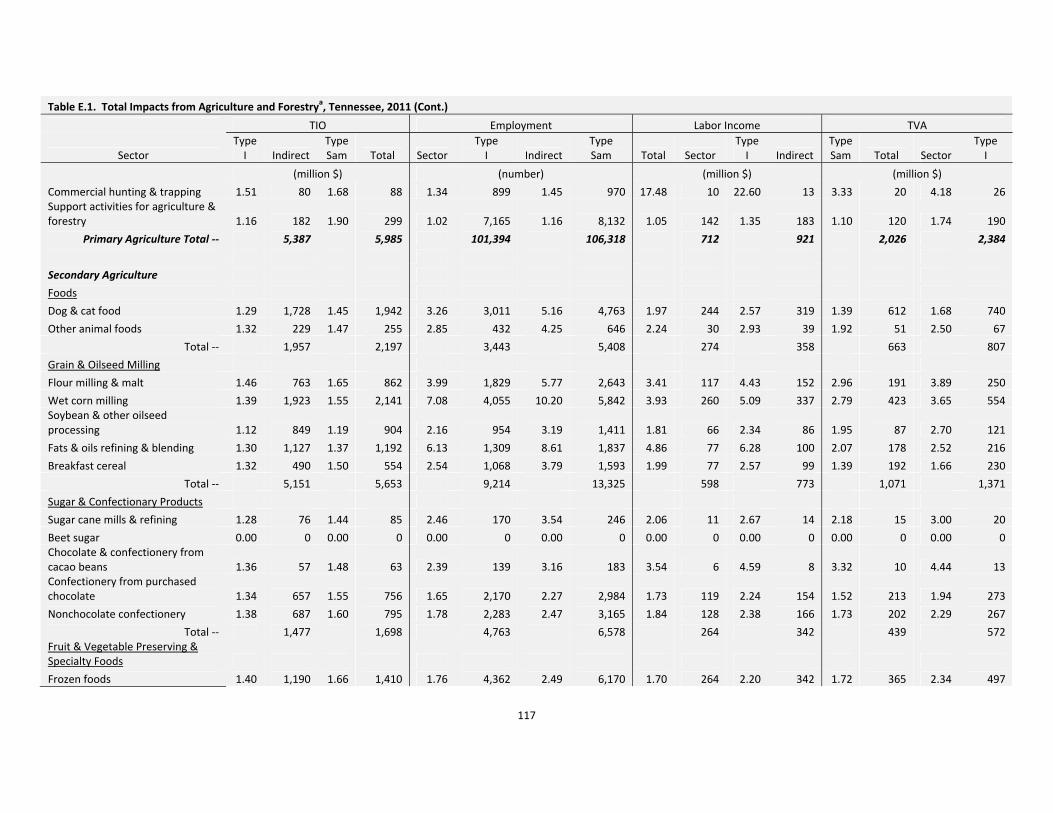
Primary Agriculture Products Total Impacts: Figures 17 through 22 show the estimated direct, indirect, and induced impacts for
oilseed farming; grain farming; vegetables and melon farming; greenhouse, nursery, and
floriculture production; tobacco farming; cotton farming; all other crops farming; cattle
ranching and farming; dairy cattle and milk production; poultry and egg production; and animal
production, except cattle, poultry, and eggs. The top ten indirect and induced sectors based on
output value are also listed. Using oilseed farming as an example, which has direct sales of
$461.3 million, the indirect economic impacts caused by input supplying industries are $139.3
million (21.9 percent) and the induced impacts (expenditures by households are $35.2 million
(5.5 percent). The top ten sectors most impacted from the indirect impact in descending order
included real estate establishments; banking (depository credit intermediation); agriculture and
forestry support activities; oilseed farming; petroleum refineries; wholesale trade businesses;
cotton farming; maintenance/repair construction nonresidential; warehousing and storage; and
securities, commodity contracts, and investments. Likewise, from household expenditures
(induced impacts) the sectors most impacted in descending order based on output value
38
Figure 17. Estimated Direct, Indirect, and Induced Impacts for Oilseed Farming and Grain Farming.
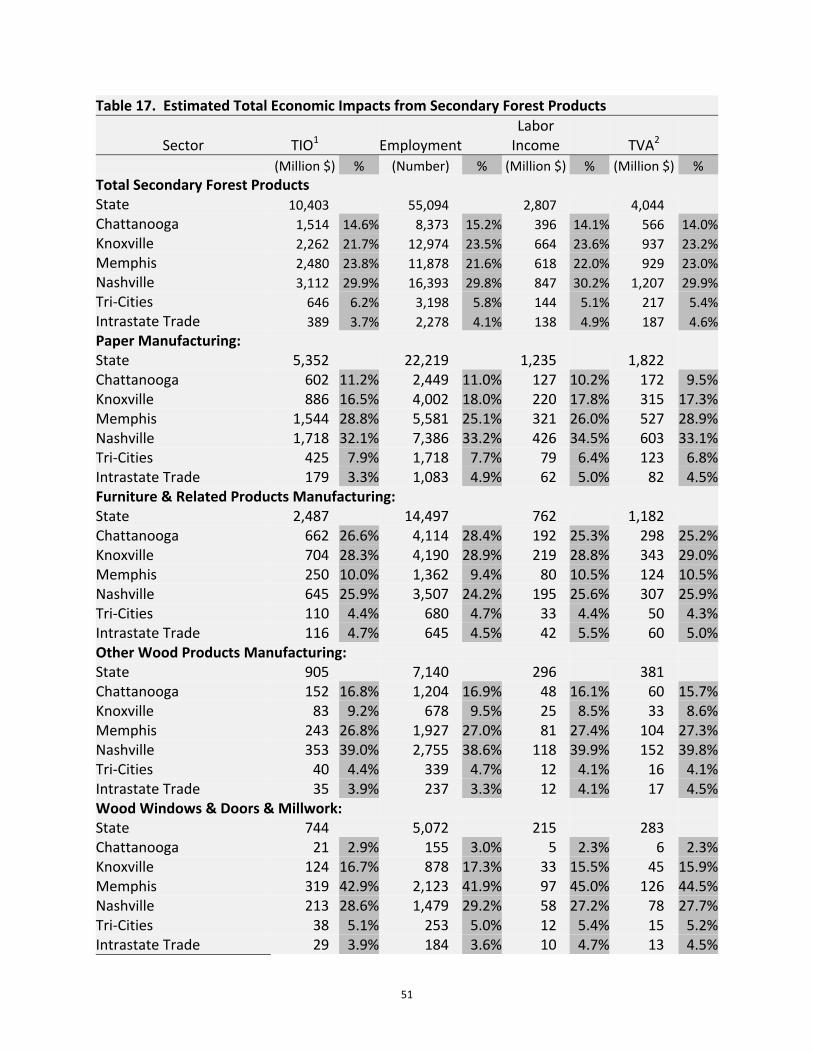
Table 15. Estimated Total Economic Impacts from Secondary Agricultural Products (Cont.) 1Total Industry Output – annual value of production by industry. 2Total Value Added – income to workers paid by employers; self‐employed income; interests, rents, royalties, dividends, and profit payments; and excise and sales taxes paid by individuals to businesses. 3Values of 0 are nonzero values that are less than 1. vegetable preserving and specialty foods (frozen foods), and other foods (snack foods). The
Nashville Region also had the largest output values for beverage manufacturing (primarily from
distilleries and soft drinks and ice), tobacco products, textile mills (nonwoven fabric mills),
apparel manufacturing (men’s and boy’s cut and sew apparel), textile product mills (all other
textile product mills and carpet and rug mills), and leather and allied product manufacturing
(footwear and leather and hide tanning and finishing). The Memphis Region had the largest
output values for agricultural chemicals (pesticides and other agricultural chemicals) and
agricultural machinery (lawn and garden equipment). Food manufacturing (primarily from grain
and oilseed milling (wet corn milling), fruit and vegetable preserving and specialty foods (fruit
and vegetable canning, pickling, and drying), animal slaughtering and processing, bakeries and
tortillas (break and bakery products), beverage manufacturing (soft drinks and ice) and textile
product mills (all other textile product mills) are important industries for the Knoxville Region.
The Chattanooga Region had significant economic activity for food manufacturing (primarily
from animal slaughtering and processing (poultry processing), bakeries and tortillas (cookies,
cracker, and pastas manufacturing), grain and oilseed milling (fats and oils refining and
blending), sugar and confectionary products (confectionery from purchased chocolate), and
beverage manufacturing (soft drinks and ice)), textile mills (fiber, yarn, and thread mills), and
apparel manufacturing (apparel knitting mills and men’s and boy’s cut and sew apparel). Food
manufacturing (primarily from dairy products (dry, condensed, and evaporated dairy products
and cheese) and beverages (soft drinks and ice), textile mills (fabric coating mills and fiber, yard,
47
and thread mills coating mills), and agricultural machinery (lawn and garden equipment) are
important industries in the Tri‐Cities Region.
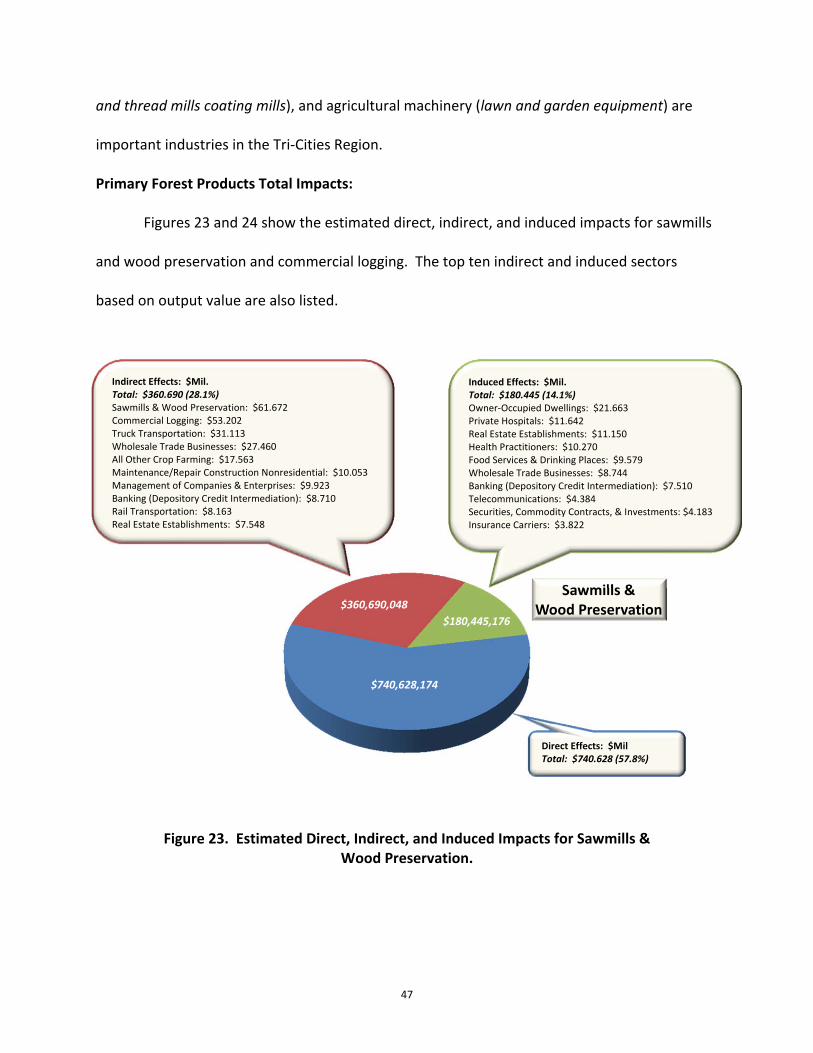
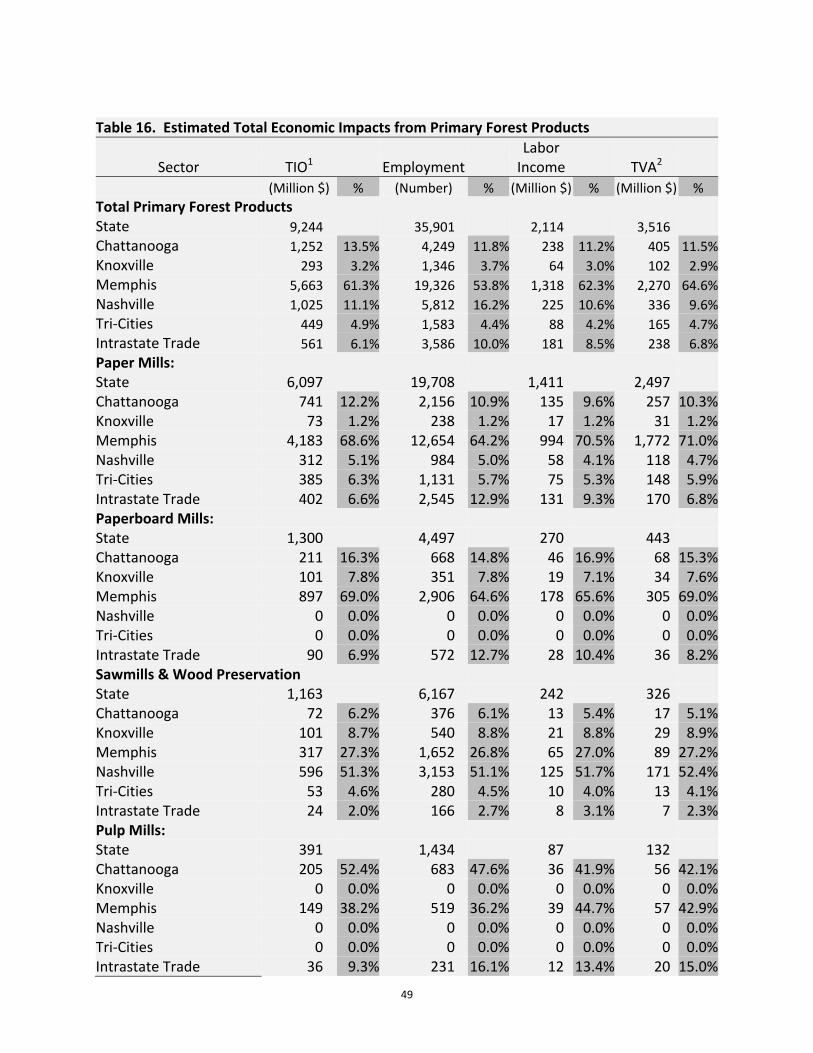
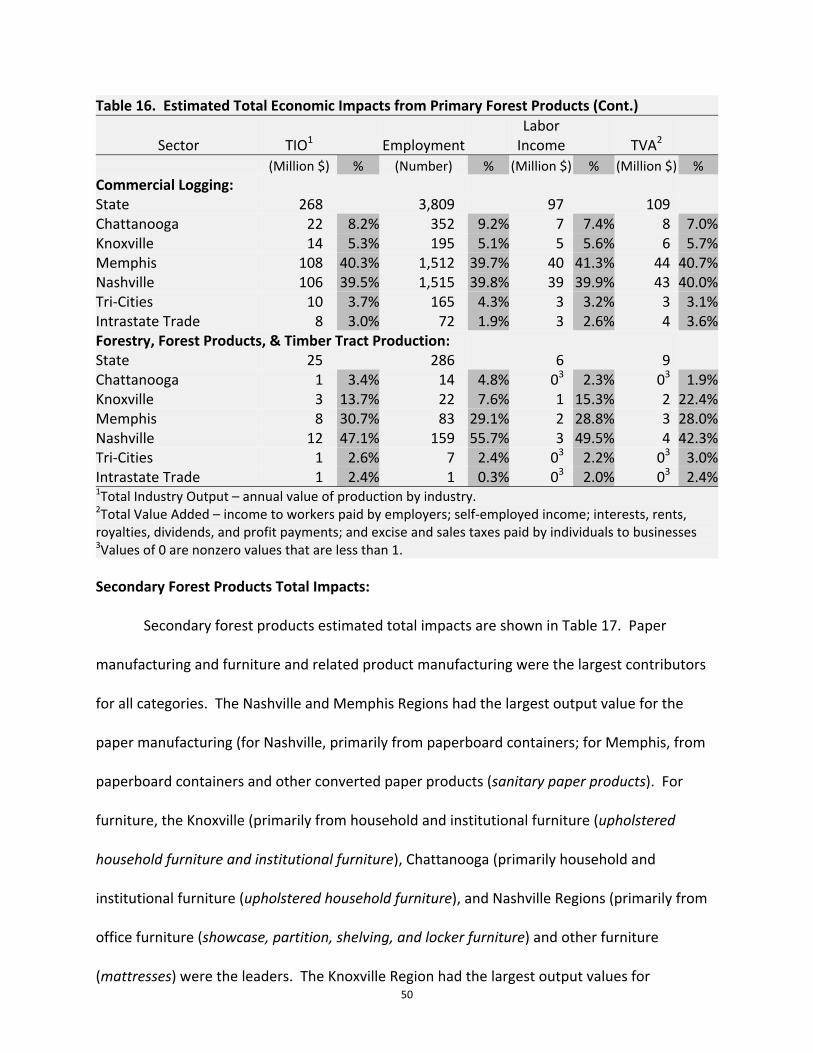
Primary Forest Products Total Impacts:
Figures 23 and 24 show the estimated direct, indirect, and induced impacts for sawmills
and wood preservation and commercial logging. The top ten indirect and induced sectors
based on output value are also listed.
Figure 23. Estimated Direct, Indirect, and Induced Impacts for Sawmills & Wood Preservation.
Sawmills &Wood Preservation$360,690,048
$740,628,174
$180,445,176
Direct Effects: $Mil Total: $740.628 (57.8%)
Indirect Effects: $Mil. Total: $360.690 (28.1%) Sawmills & Wood Preservation: $61.672 Commercial Logging: $53.202 Truck Transportation: $31.113 Wholesale Trade Businesses: $27.460 All Other Crop Farming: $17.563 Maintenance/Repair Construction Nonresidential: $10.053 Management of Companies & Enterprises: $9.923 Banking (Depository Credit Intermediation): $8.710 Rail Transportation: $8.163 Real Estate Establishments: $7.548
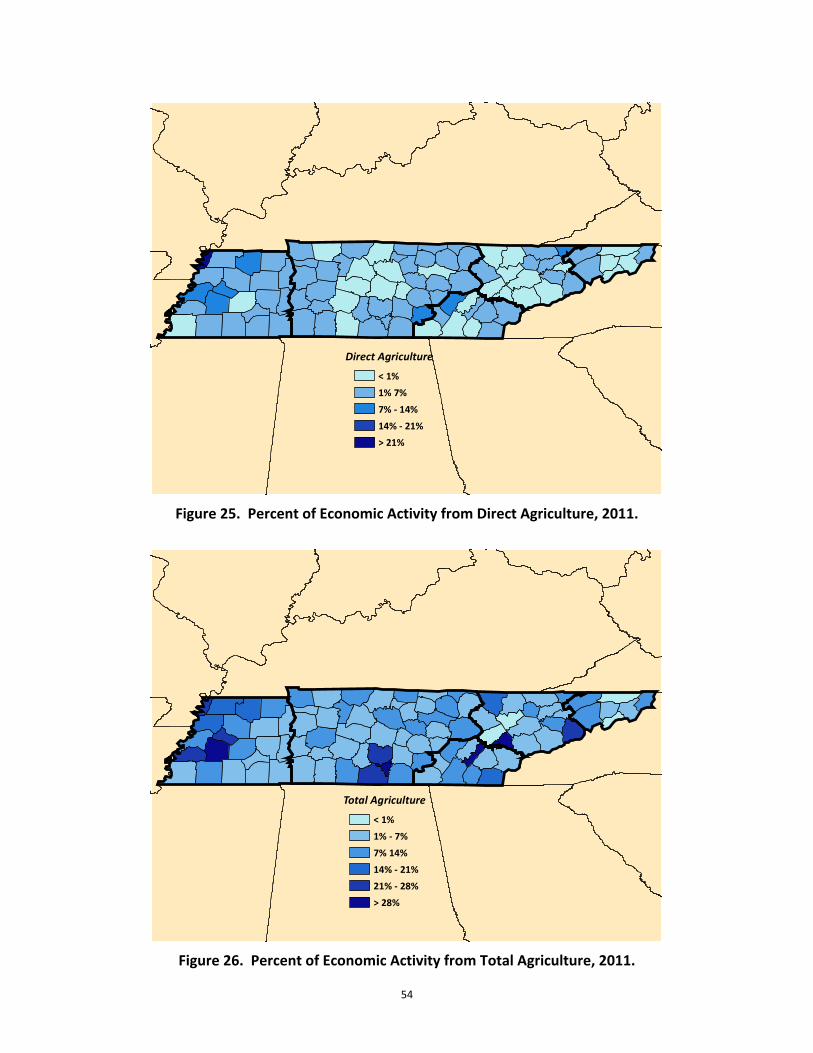
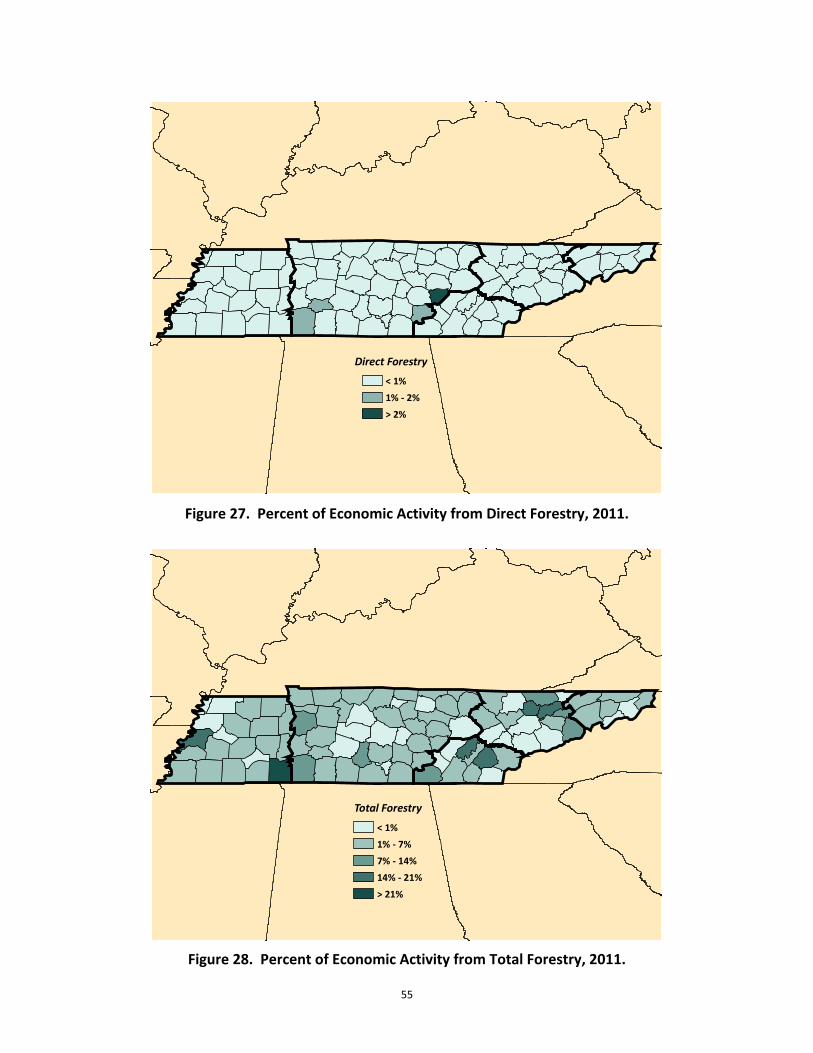
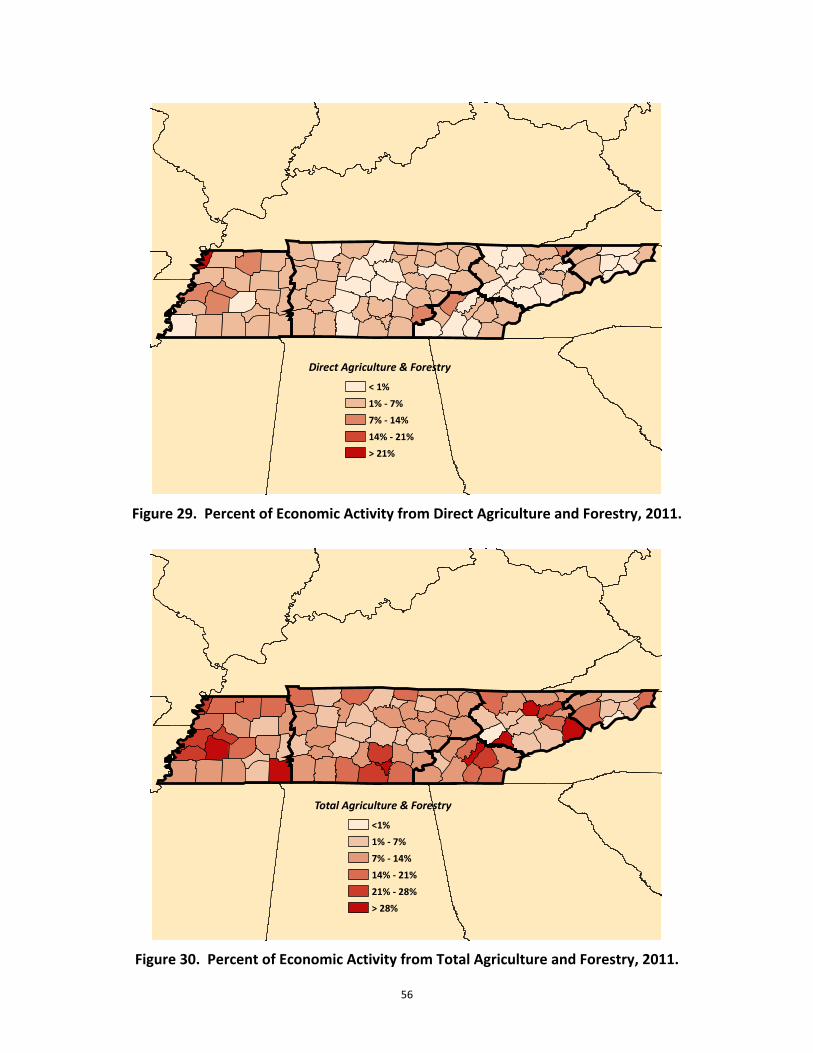
Total McMinn 15.2 Grainger 17.8 Hardin 33.0 Wayne 10.0 Greene 5.4Combined: Direct Bledsoe 9.5 Hancock 7.2 Lake 25.0 Grundy 10.4 Hawkins 1.6 Total Meigs 34.8 Loudon 38.3 Hardin 34.8 Moore 85.0 Greene 18.4
58
Tennessee Agriculture and Forestry Tax Impacts
Actual Tennessee revenue for 2010‐2011 was estimated at $10.5 billion in the form of
taxes, and $1.6 billion in the form of fees and fines (TN Department of Finance &
Administration, 2013). Based on the IMPLAN data for Tennessee in 2011, tax impacts at the
state and local level as a result of direct and multiplier effects for agriculture and forestry
(includes the production and processing of agricultural and forest products and the input
suppliers of these products) are estimated at $2.27 billion (Table 20). An additional $2.9 billion
is generated for the federal government. Agriculture tax revenues are estimated at $1.8 billion
for state/local and $1.9 billion for federal; for forestry, $0.5 billion in tax revenues are
generated for state/local and close to $1.0 billion in federal. For state/local tax revenues,
Table 20. Estimated State/Local and Federal Tax Revenues from Tennessee Agriculture and Forestry, 2011
State & Local Revenues Federal Revenues
(Million $) Agriculture1 Indirect Business Taxes2 $1,659.1 $169.5 Corporate Profits Taxes3 $75.0 $415.5 Personal (Household) Taxes4 $48.8 $1,327.2
Total $1,782.9 $1,912.2 Forestry1 Indirect Business Taxes2 $430.2 $43.9 Corporate Profits Taxes3 $27.1 $150.1 Personal (Household) Taxes4 $29.9 $802.3
Total $487.2 $996.3 Agriculture & Forestry Total $2,270.1 $2,908.5
1 Includes the production and processing of agricultural and forest products and the input suppliers of these products. 2 For state, sales taxes, property taxes, motor vehicle licenses taxes, severance taxes, other taxes, and state/local non‐taxes (rents, royalties, special assessments, fines, settlements, and donations); for federal, excise taxes, custom duty taxes, and non‐taxes. 3 Includes dividends and corporate profits tax. 4 For state, income taxes, non‐taxes (fines & fees), motor vehicle license taxes, property taxes, and other taxes (fishing/hunting); for federal, income taxes. Source: Source: Minnesota IMPLAN Group, Inc., 2011a and 2012
59
indirect business taxes for both agriculture and forestry have the largest value; for federal tax
revenues, personal taxes have the largest value.
Summary and Conclusion
Input‐output modeling is useful for evaluating and analyzing information on the
interrelationships of a regional economy and impacts of changes on that economy. The model
is a useful planning tool for policy‐makers in evaluating potential impacts of their decisions
concerning agriculture and forestry industries for the state. For this analysis, a baseline for
2011 was developed using Tennessee Agricultural Statistics Service information, along with the
Minnesota IMPLAN Group’s input‐output model information. The state was divided into five
trade regions. These five regions will be used in future analyses to gauge the performance of
individual sectors and the impacts of new sectors to the state’s agro‐forestry industrial
complex.
Comparing agricultural data for 2009 and 2011 revealed that most of Tennessee’s crops
harvested increased with the exception of soybeans, wheat, tomatoes, and hay. Crop prices
also increased for all the crops examined in this report (Table 6). Livestock and livestock
products increased for eggs and only slightly increased for cattle and calves and broilers during
that timeframe. Livestock prices also increased for livestock and livestock products examined
(Table 5). Below average rainfall occurred in the state for the years 2008 and 2010 followed by
above normal rainfall for the years 2009 and 2011 (Figure 11).
In 2011, agriculture and forestry contributed to 13.3 percent of Tennessee’s total
economy. The agro‐forestry industrial complex included the primary industries typically
associated with agriculture and forest operations such as crop production, livestock breeding
60
and feeding, and the management and logging of trees. Also included in the industrial complex
were the input supplying industries and value‐added subsectors, which included food and
beverage manufacturing, apparel and textiles, and forestry products manufacturing. In 2011,
the agro‐forestry industrial complex contributed $66.4 billion to the Tennessee economy and
employed an estimated 337,880 individuals.
Agriculture, a subset of Tennessee’s agro‐forestry industrial complex, included farming
and related industries, as well as value‐added food and fiber production, processing and
manufacturing. Agriculture accounted for 9.3 percent of the state’s economy and generated
$46.7 billion in output. Close to 247,000 Tennesseans, with over 106,000 in the production
sector (both full‐ and part‐time), were employed in agriculture.
Forestry included the management and logging of trees; sawmills (primary forestry
products), including pulp and paper mills, plus forestry products manufacturing (secondary
forestry products). Forestry accounted for 4.0 percent of the state’s economy, employed close
to 91,000 Tennesseans, and generated close to $20.0 billion in output.
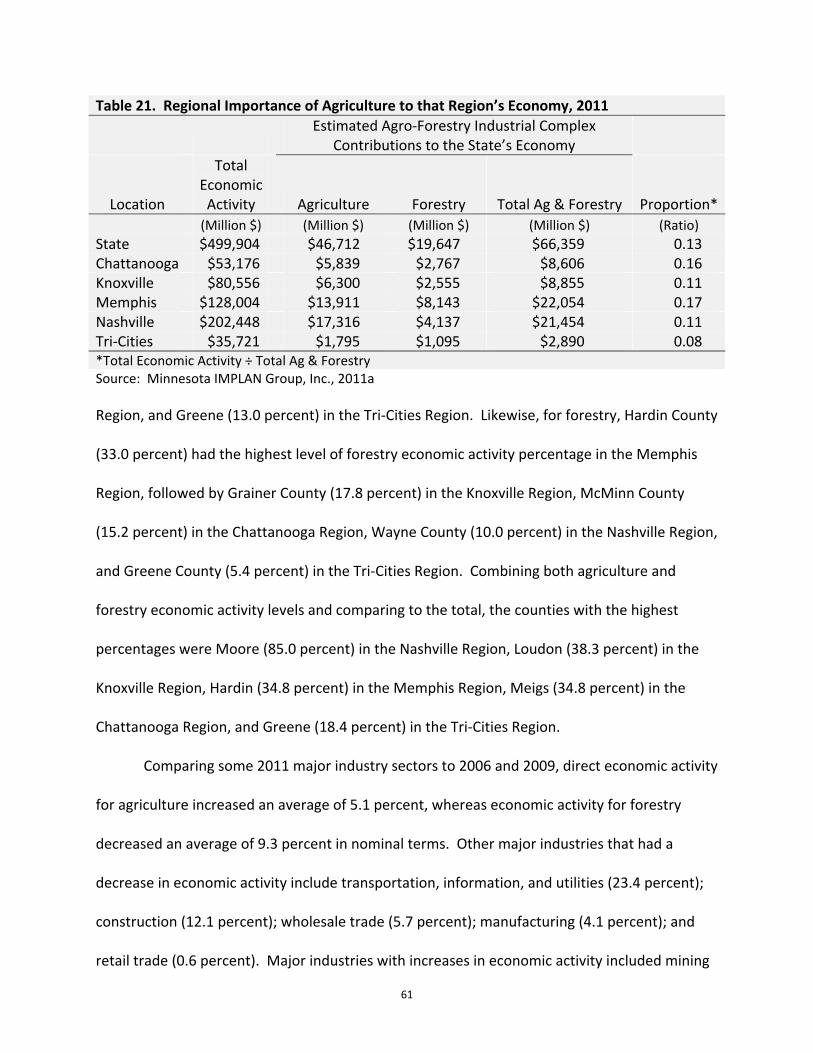
From a regional perspective, the agro‐forestry industrial complex was more important
to the Memphis and Chattanooga Regions relative to other regions in the state followed by the
Nashville, Knoxville, and Tri‐Cities Regions (Table 21). The Memphis Region contributed the
largest amount of economic activity, $22.1 billion, representing 17.2 percent of the total for the
region.
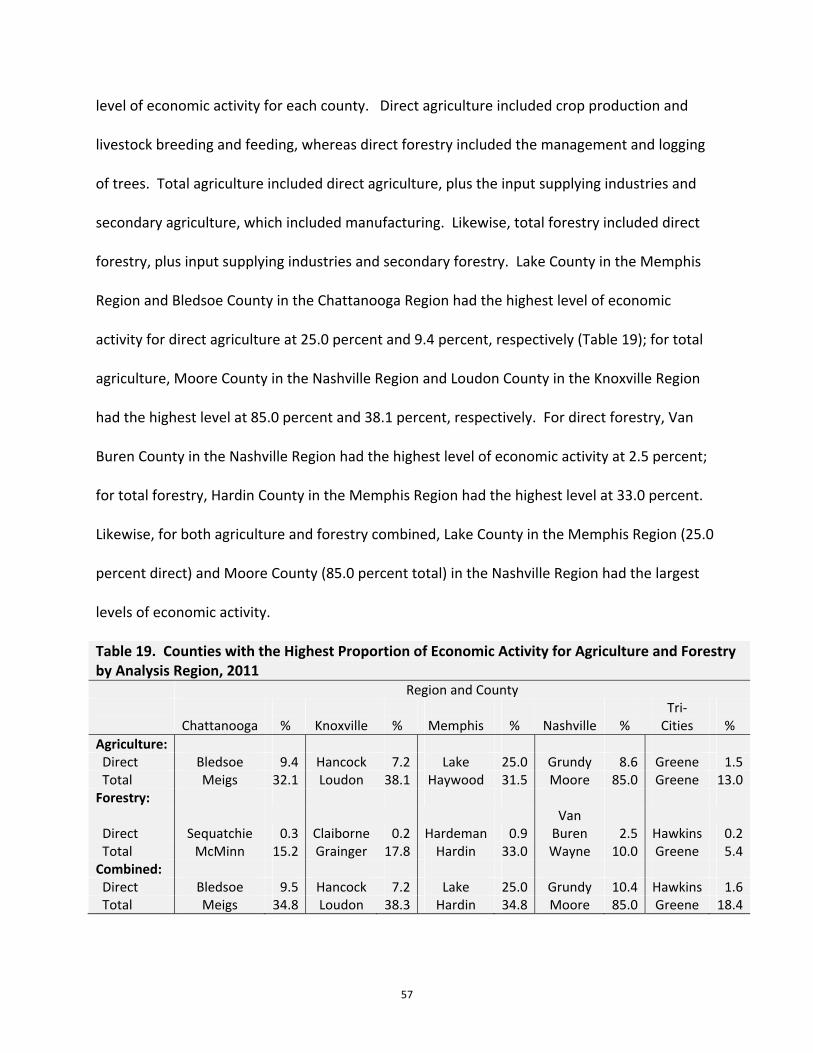
When comparing county level total economic activity (across all industries) with county
level agricultural economic activity, the counties with the highest percentage levels were
Moore (85.0 percent) in the Nashville Region, Loudon (38.1 percent) in the Knoxville Region,
Meigs (32.1 percent) in the Chattanooga Region, Haywood (31.5 percent) in the Memphis
61
Table 21. Regional Importance of Agriculture to that Region’s Economy, 2011
Estimated Agro‐Forestry Industrial Complex
Contributions to the State’s Economy
Location
Total Economic Activity Agriculture Forestry Total Ag & Forestry Proportion*
Region, and Greene (13.0 percent) in the Tri‐Cities Region. Likewise, for forestry, Hardin County
(33.0 percent) had the highest level of forestry economic activity percentage in the Memphis
Region, followed by Grainer County (17.8 percent) in the Knoxville Region, McMinn County
(15.2 percent) in the Chattanooga Region, Wayne County (10.0 percent) in the Nashville Region,
and Greene County (5.4 percent) in the Tri‐Cities Region. Combining both agriculture and
forestry economic activity levels and comparing to the total, the counties with the highest
percentages were Moore (85.0 percent) in the Nashville Region, Loudon (38.3 percent) in the
Knoxville Region, Hardin (34.8 percent) in the Memphis Region, Meigs (34.8 percent) in the
Chattanooga Region, and Greene (18.4 percent) in the Tri‐Cities Region.
Comparing some 2011 major industry sectors to 2006 and 2009, direct economic activity
for agriculture increased an average of 5.1 percent, whereas economic activity for forestry
decreased an average of 9.3 percent in nominal terms. Other major industries that had a
decrease in economic activity include transportation, information, and utilities (23.4 percent);
construction (12.1 percent); wholesale trade (5.7 percent); manufacturing (4.1 percent); and
retail trade (0.6 percent). Major industries with increases in economic activity included mining
62
(26.8 percent); services (16.6 percent); government (14.7 percent); and finance, insurance, and
real estate (3.0 percent).
63
Literature Cited
Clatterbuck, Wayne. 2013. “Tennessee Forest Resource Statistics, 2012.” Forestry, Wildlife & Fisheries Update Newsletter. The University of Tennessee Extension. January, 2013.
English, B., K. Jensen, and J. Menard. 2001. “Economic Impacts of Agriculture and Forestry in
Tennessee, 1997.” Research Series 04‐01. Available at http://aimag.ag.utk.edu/ pubimpact.html.
English, B., K. Jensen, and J. Menard. 2003. “Economic Impacts of Agriculture and Forestry in
Tennessee, 2000.” Research Series 02‐03. Available at http://aimag.ag.utk.edu/ pubimpact.html.
Leontief, Wassily. 1936. “Quantitative Input and Output Relations in the Economic System of
the United States.” Review of Economics and Statistics 18(3):105‐125. Lindall, S., D. Olson, and G. Alward. 2006. “Deriving Multi‐Regional Models Using the IMPLAN
National Trade Flows Model”. The Journal of Regional Analysis & Policy 36(1):76‐83. Menard, J., B. English, and K. Jensen. 2006. “Economic Impacts of Agriculture and Forestry in
Tennessee, 2003.” Available at http://aimag.ag.utk.edu/pubimpact.html. Menard, J., B. English, and K. Jensen. 2009. “Economic Impacts of Agriculture and Forestry in
Tennessee, 2006.” Available at http://aimag.ag.utk.edu/pubimpact.html. Menard, J., B. English, and K. Jensen. 2011. “Economic Impacts of Agriculture and Forestry in
Tennessee, 2006.” Available at http://aimag.ag.utk.edu/pubimpact.html. Minnesota IMPLAN Group, Inc. 2011a. “2011 County Level Data.” IMPLAN System (data and
software), 502 2nd Street, Suite 301, Hudson, WI 54016. Available at http://www. implan.com/.
Minnesota IMPLAN Group, Inc. 2011b. “Sectoring Schemes.” IMPLAN System (data and
software), 502 2nd Street, Suite 301, Hudson, WI 54016. Available at http://implan. com/V4/index.php?option=com_content&view=article&id=633%3A633&catid=241%3AKB23&Itemid=1.
Minnesota IMPLAN Group, Inc. 2012. “Tax Impact Report – Generation and Interpretation of
IMPLAN’s Tax Impact Report.” IMPLAN System (data and software), 502 2nd Street, Suite 301, Hudson, WI 54016. Available at http://implan.com/V4/index.php?option= com_docman&task=cat_view&gid=144&Itemid=60.
Olson, D. and S. Lindall. 1999. “IMPLAN Professional Software, Analysis, and Data Guide.”
Minnesota IMPLAN Group, Inc., 502 2nd Street, Suite 301, Hudson, WI 54016. Available at http://www.implan.com/.
64
Pyatt, G., and J. Round. 1985. “Social Accounting Matrices, A Basis for Planning.” The World Bank, Washington, D.C.
Tennessee Department of Agriculture, Division of Forestry. 2011. “Plan 2020: Harvest Plan for
Sustainable State Forests.” Available at http://www.tn.gov/agriculture/forestry/ sf2020plan.shtml.
Tennessee Department of Agriculture. 2010. “Tennessee Agriculture 2010.” Department
Report & Statistical Summary. Available at http://www.tennessee.gov/agriculture/ publications/annualreport/annualreport.pdf.
Tennessee Department of Agriculture. 2012. “Tennessee Agriculture 2012.” Department
Report & Statistical Summary. Available at http://www.tennessee.gov/agriculture/ publications/annualreport/annualreport.pdf.
Tennessee Department of Finance & Administration. 2013. “The Budget, Fiscal Year 2012‐
2013.” Budget Document Archive. Available at http://www.tn.gov/finance/bud/archive .shtml.
U.S. Census Bureau. 2002. North American Industry Classification System (NAICS). Available at
http://www.census.gov/eos/www/naics/. U.S. Census Bureau. 2007. North American Industry Classification System (NAICS). Available at
http://www.census.gov/eos/www/naics/. U.S. Census Bureau. 2010. “2010 County Business Patterns (NAICS).” Censtats Databases.
Available at http://censtats.census.gov/. U.S. Census Bureau. 2011. “Statistics for All Manufacturing by State: 2011 and 2010.” Annual
Survey of Manufacturers, Geographic Area Statistics. Available at http://factfinder2. census.gov/faces/tableservices/jsf/pages/productview.xhtml?pid=ASM_2011_31AS101&prodType=table.
U.S. Census Bureau. 2012. North American Industry Classification System (NAICS). Available at
http://www.census.gov/eos/www/naics/. U.S. Department of Agriculture, Economic Research Service. 2012. “State Export Data.”
Available at http://www.ers.usda.gov/data‐products/state‐export‐data.aspx. U.S. Department of Agriculture, Forest Service. 2013. “Forest Inventory Data Online (FIDO)”
Available at http://apps.fs.fed.us/fido/. U.S. Department of Agriculture, National Agricultural Statistical Service. 2007a. “Tennessee
State and County Data.” 2007 Census of Agriculture Report. Volume 1, Geographic Area Series, Part 42. Available at http://www.agcensus.usda.gov/Publications/2007/ Full_Report/Census_by_State/Tennessee/index.asp.
65
U.S. Department of Agriculture, National Agricultural Statistical Service. 2007b. “U.S. National Level Data.” 2007 Census of Agriculture Report. Volume 1. Available at http://www. agcensus.usda.gov/Publications/2007/Full_Report/Volume_1,_Chapter_1_US/.
U.S. Department of Agriculture, National Agricultural Statistical Service. 2012. “Poultry—
Production and Value, 2011 Summary.” Available at http://usda.mannlib.cornell.edu/ MannUsda/viewDocumentInfo.do?documentID=1130.
U.S. Department of Commerce, Bureau of Economic Analysis. 2011a. “BEA Economic Areas
(EAs).” Regional Economic Accounts, Component Counties. Available at http://www. bea.gov/regional/docs/econlist.cfm.
U.S. Department of Commerce, Bureau of Economic Analysis. 2011b. Industry Economic
Accounts, Benchmark Input‐Output Data, 2002 Data Files. Available at http://www.bea.gov/industry/io_benchmark.htm.
U.S. Department of Commerce, International Trade Administration (ITA). 2011. “TradeStats
ExpressTM Home.” State Export Data, Office of Trade and Industry Information, Manufacturing and Services. Available at http://tse.export.gov/TSE/TSEHome.aspx.
U.S. Department of Commerce. 2011. National Climatic Data Center, NOAA Environmental
Satellite, Data, and Information Service. Available at http://www7.ncdc.noaa.gov/CDO/ CDODivisionalSelect.jsp.
66
Appendix A: IMPLAN Methodology
67
Input‐output model results from previous studies (English, Jensen, and Menard, 2001
and 2003) in this series were based on the Standard Industrial Classification (SIC) system as
defined by the United States Census Bureau. Beginning in 2006 (Menard, English, and Jensen),
results are based on the North American Industrial Classification System (NAICS) (Census NAICS,
2002, 2007, 2012). The reader is cautioned to not compare industry sector level results from
the previous studies using the SIC system with the results from this most recent study using
NAICS. For readers who are interested in time series data, this creates a problem since many
industries are grouped in different or entirely new categories.
Like the previous analysis conducted for 2009, this analysis uses IMPLAN Version 3.0.
IMPLAN’s sectoring scheme relies on the Bureau of Economic (BEA) Analysis’s Benchmark input‐
output study (Minnesota IMPLAN Group, 2011b; USDOC, 2011b). When a new BEA Benchmark
is released, the IMPLAN sectoring scheme requires modification. Previous studies used IMPLAN
Pro 2.0 and had either a 528 or 509 industrial sectoring scheme. With the release of the 2002
Benchmark, which is what IMPLAN Version 3.0 uses and affects the IMPLAN 2007 data release
year, a 440 industrial sectoring scheme is used.
IMPLAN employs a regional social accounting system and can be used to generate a set
of balanced economic/social accounts and multipliers. The social accounting system is an
extension of input‐output analysis.3 Input‐output analysis can provide important and timely
information on the interrelationships in a regional economy and the impacts of changes on that
economy. Input‐output analysis has been expanded beyond market‐based transaction
accounting to include non‐market financial flows by using a social accounting matrix or SAM
3 Input‐output (I‐O) analysis, also known as inter‐industry analysis, is the name given to an analytical work conducted by Wassily Leontief (1936) in the late 1930’s. The fundamental purpose of the I‐O framework is to analyze the interdependence of industries in an economy through market‐based transactions.
68
framework (Pyatt and Round, 1985). The model describes the transfer of money between
industries and institutions and contains both market‐based transactions and non‐market
financial flows, such as inter‐institutional transfers (see Figure A.1). The ‘Make’ and ‘Use’
components of the SAM include the commodities made and used by industries. Factors
represent the value‐added by industries, including wages and compensation to workers,
interest, profits, and indirect business taxes. Capital includes expenditures made by industries
and institutions to obtain equipment and construction. The SAM takes into account corporate
profits as ‘Enterprises’. The SAM also accounts for non‐industrial financial flows, including
factor exports and imports, institution exports, factor distribution, and inter‐institutional
transfers. Factor exports include payments reimbursed from outside the region for exports less
the payments for imports. Institutional exports would include situations such as jobs
commuting outside the region. Factor distributions are payments from the factor sectors to
institutions, such as households or governments. Inter‐institutional transfers include payments
between institutions, such as federal government grants to state governments, welfare, social
security payments, and taxes paid to governments.
69
Total
Total Industry
Income
Total
Commodity
Income
Total Factor
Income
Total
Institutional
Income
Total
Enterprise
Income
Total Capital
Income
Total Trade
Income
Trad
e
Exports
Exports
Exports
Exports
Exports
Total
Trade
Exports
Cap
ital
Consumption
Transfers
Transfers
Total Capital
Outlay
Enterprises
Transfers
Total
Enterprise
Outlay
Institutions
Consumption
Transfers
Imports
Total
Institution
Outlay
Figure A.1. So
cial Accounting Matrix Fram
ework
Source: Olson and Lindall, 1999.
Factors
Transfers
Factor
Trade
Total
Factor
Outlay
Commodity
Make
Sales
Total
Commodity
Outlay
Industry
Use
Value
Added
Imports
Total
Industry
Outlay
Industry
Commodity
Factors
Institutions
Enterprises
Cap
ital
Trad
e
Total
70
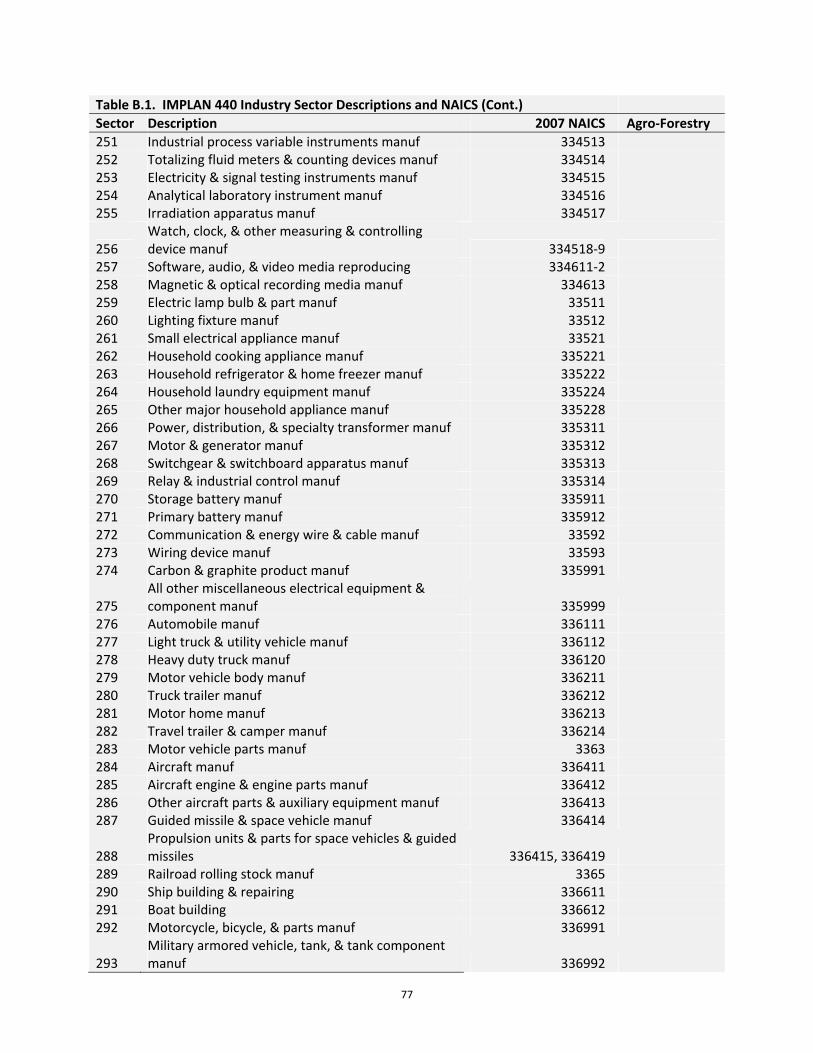
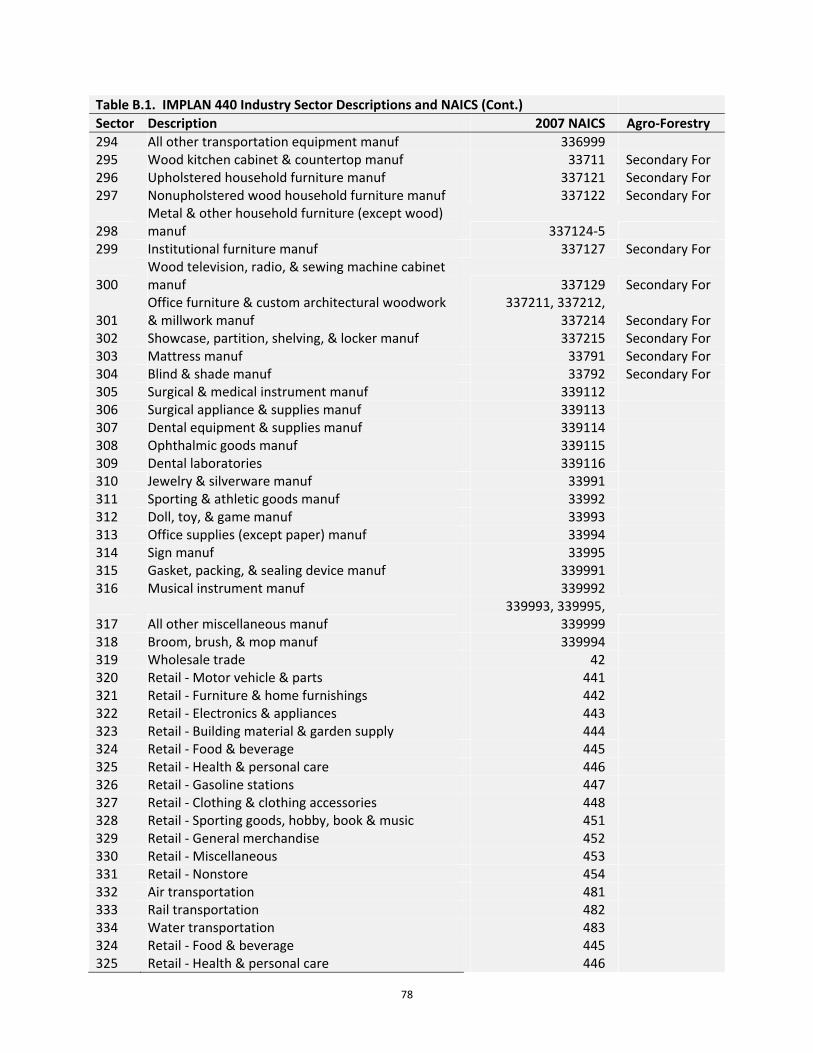
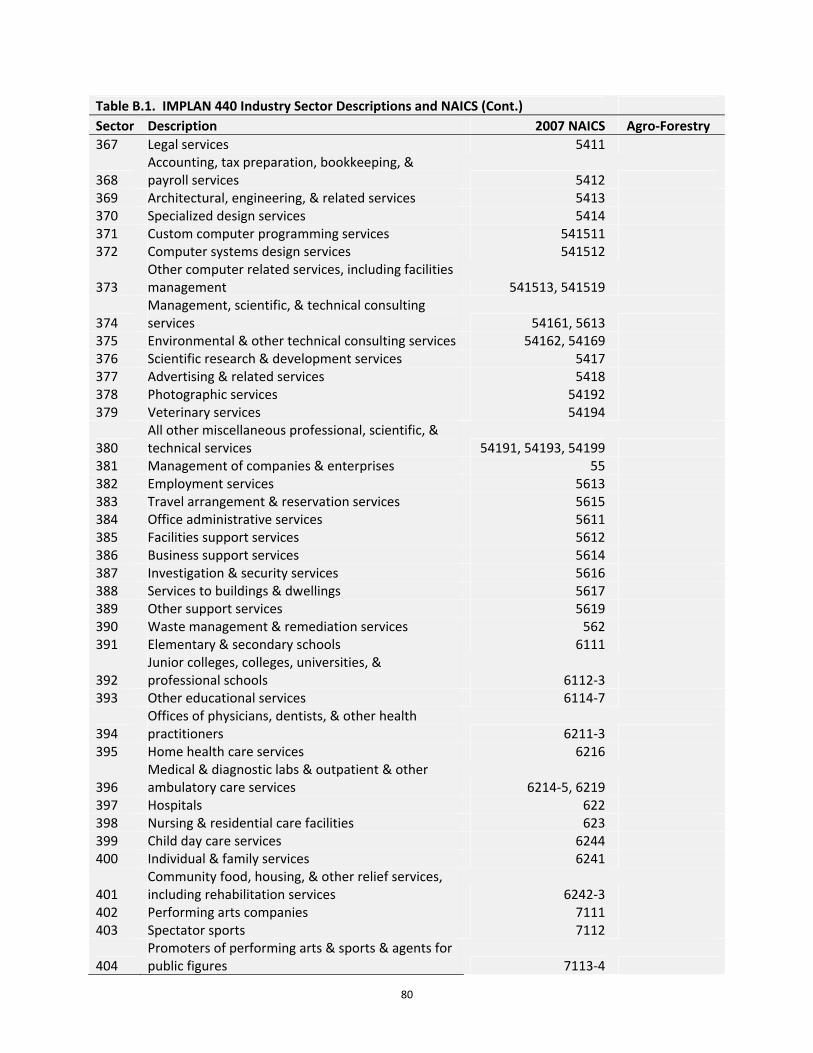
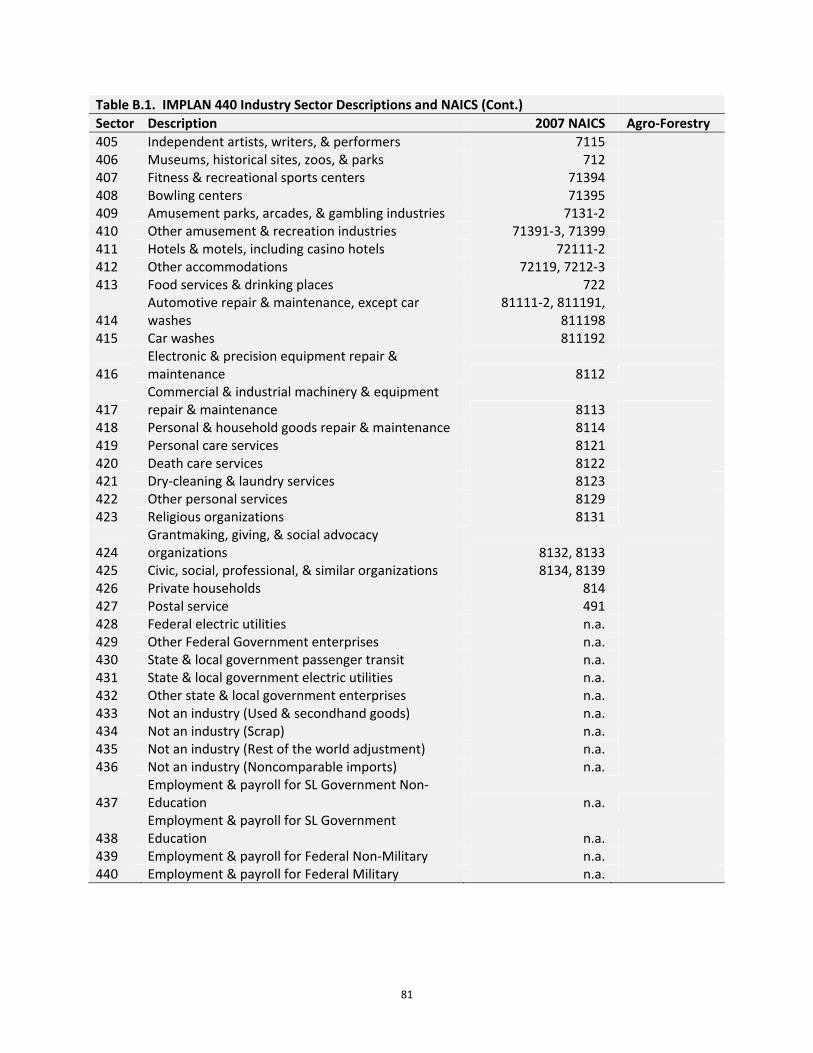
Appendix B: IMPLAN Sectors with Descriptions
71
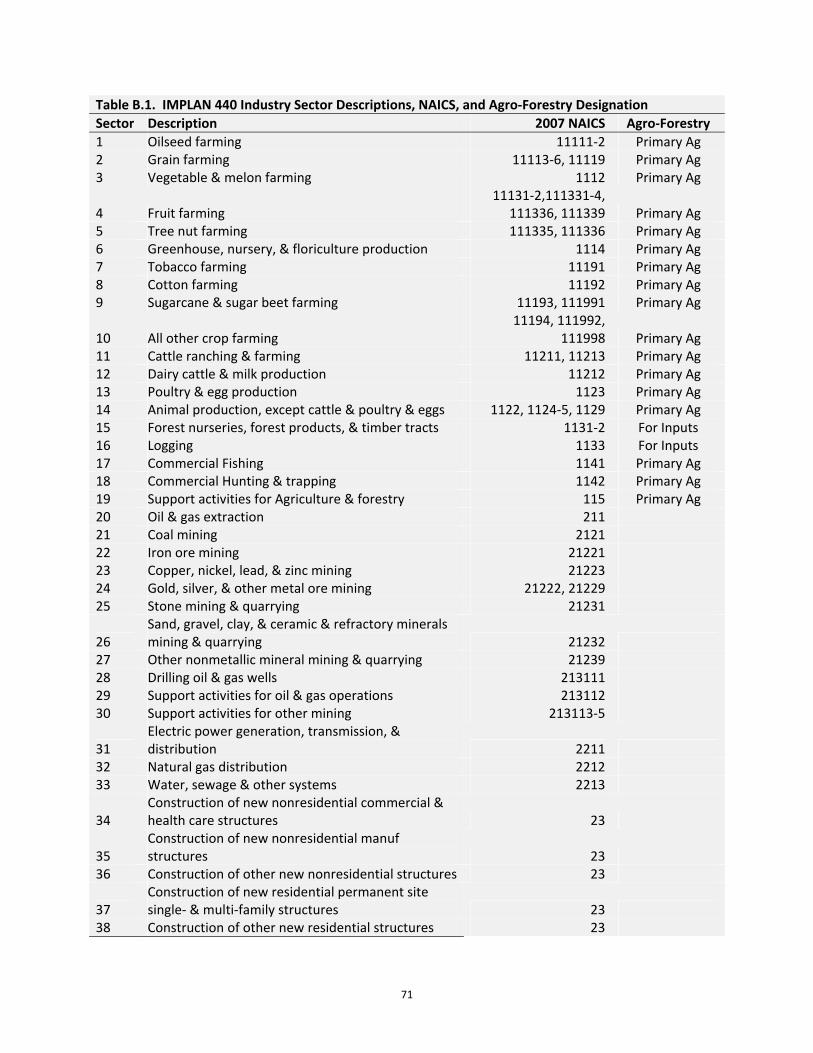
Table B.1. IMPLAN 440 Industry Sector Descriptions, NAICS, and Agro‐Forestry Designation
Sector Description 2007 NAICS Agro‐Forestry
1 Oilseed farming 11111‐2 Primary Ag 2 Grain farming 11113‐6, 11119 Primary Ag 3 Vegetable & melon farming 1112 Primary Ag
4 Fruit farming 11131‐2,111331‐4,
111336, 111339 Primary Ag 5 Tree nut farming 111335, 111336 Primary Ag 6 Greenhouse, nursery, & floriculture production 1114 Primary Ag 7 Tobacco farming 11191 Primary Ag 8 Cotton farming 11192 Primary Ag 9 Sugarcane & sugar beet farming 11193, 111991 Primary Ag
10 All other crop farming 11194, 111992,
111998 Primary Ag 11 Cattle ranching & farming 11211, 11213 Primary Ag 12 Dairy cattle & milk production 11212 Primary Ag 13 Poultry & egg production 1123 Primary Ag 14 Animal production, except cattle & poultry & eggs 1122, 1124‐5, 1129 Primary Ag 15 Forest nurseries, forest products, & timber tracts 1131‐2 For Inputs 16 Logging 1133 For Inputs 17 Commercial Fishing 1141 Primary Ag 18 Commercial Hunting & trapping 1142 Primary Ag 19 Support activities for Agriculture & forestry 115 Primary Ag 20 Oil & gas extraction 211 21 Coal mining 2121 22 Iron ore mining 21221 23 Copper, nickel, lead, & zinc mining 21223 24 Gold, silver, & other metal ore mining 21222, 21229 25 Stone mining & quarrying 21231
27 Other nonmetallic mineral mining & quarrying 21239 28 Drilling oil & gas wells 213111 29 Support activities for oil & gas operations 213112 30 Support activities for other mining 213113‐5
31 Electric power generation, transmission, & distribution 2211
32 Natural gas distribution 2212 33 Water, sewage & other systems 2213
34 Construction of new nonresidential commercial & health care structures 23
35 Construction of new nonresidential manuf structures 23
36 Construction of other new nonresidential structures 23
37 Construction of new residential permanent site single‐ & multi‐family structures 23
38 Construction of other new residential structures 23
72
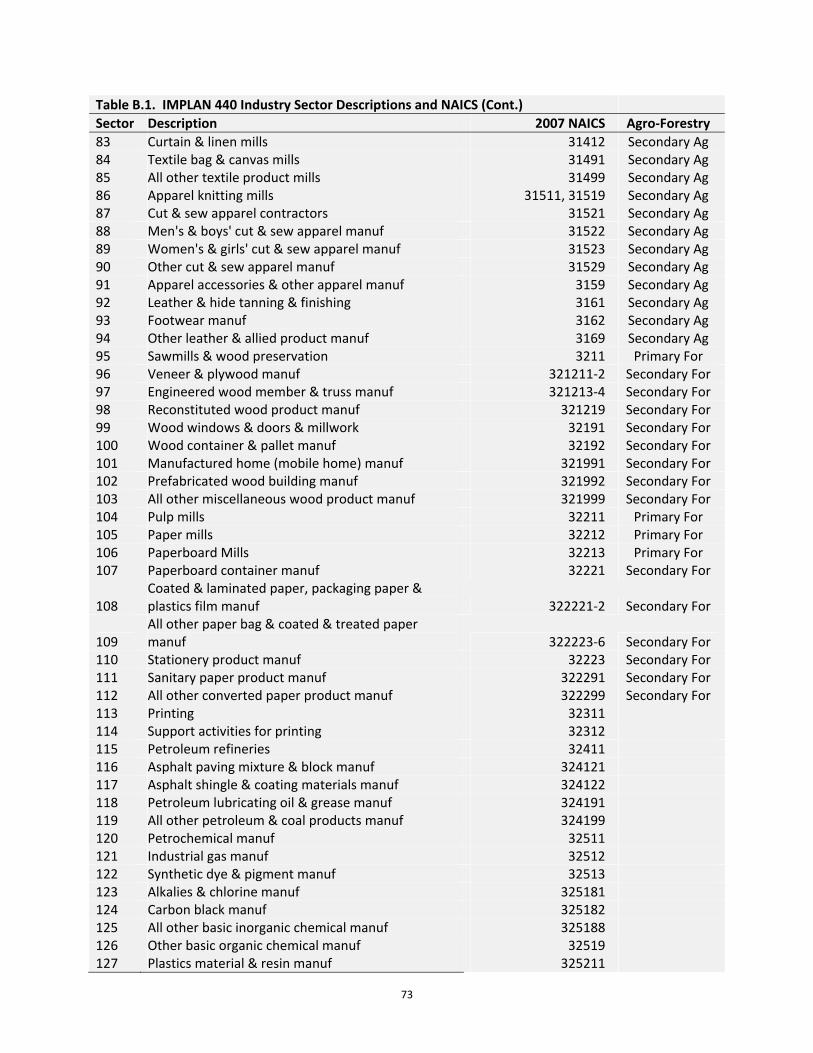
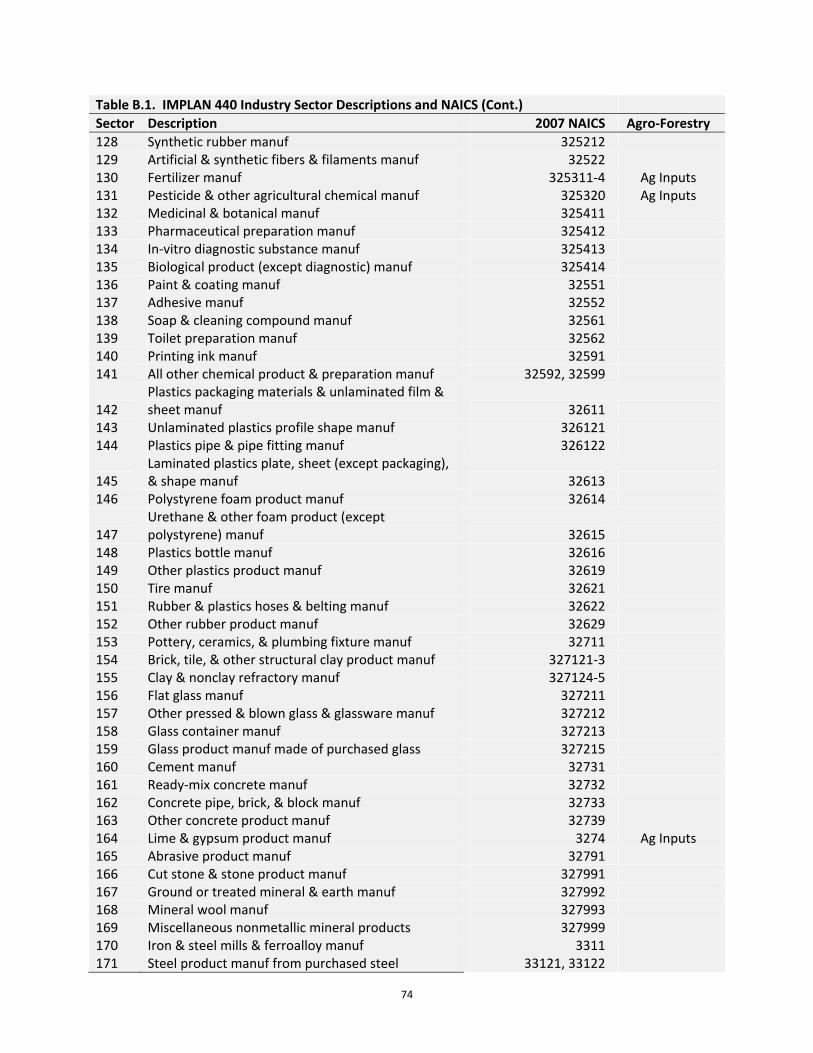
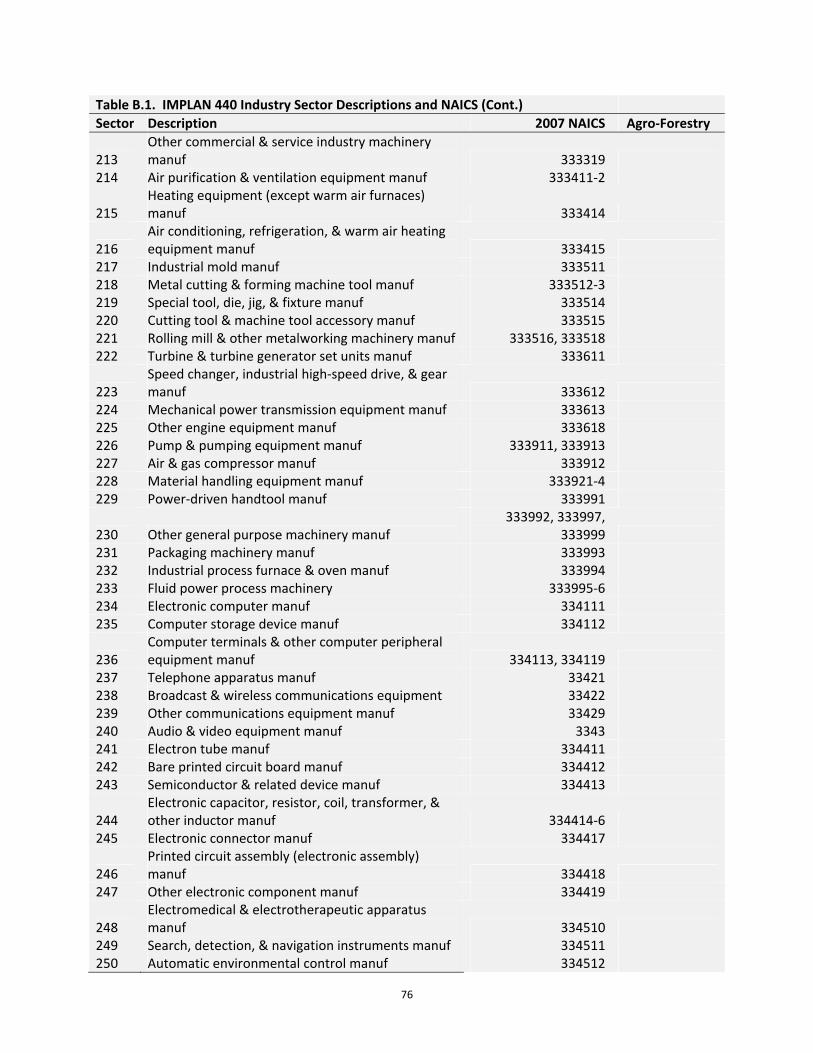
Table B.1. IMPLAN 440 Industry Sector Descriptions and NAICS (Cont.)
Sector Description 2007 NAICS Agro‐Forestry
39 Maintenance & repair construction of nonresidential maintenance & repair 23
40 Maintenance & repair construction of residential structures 23
41 Dog & cat food manuf 311111 Secondary Ag 42 Other animal food manuf 311119 Secondary Ag 43 Flour milling & malt manuf 31121 Secondary Ag 44 Wet corn milling 311221 Secondary Ag 45 Soybean & other oilseed processing 311222‐3 Secondary Ag 46 Fats & oils refining & blending 311225 Secondary Ag 47 Breakfast cereal manuf 311230 Secondary Ag 48 Sugar cane mills & refining 311311‐2 Secondary Ag 49 Beet sugar manuf 311313 Secondary Ag 50 Chocolate & confectionery manuf from cacao beans 31132 Secondary Ag 51 Confectionery manuf from purchased chocolate 31133 Secondary Ag 52 Nonchocolate confectionery manuf 31134 Secondary Ag 53 Frozen food manuf 31141 Secondary Ag 54 Fruit & vegetable canning, pickling, & drying 31142 Secondary Ag 55 Fluid milk & butter manuf 311511‐2 Secondary Ag 56 Cheese manuf 311513 Secondary Ag 57 Dry, condensed, & evaporated dairy product manuf 311514 Secondary Ag 58 Ice cream & frozen dessert manuf 311520 Secondary Ag
418 Personal & household goods repair & maintenance 8114 419 Personal care services 8121 420 Death care services 8122 421 Dry‐cleaning & laundry services 8123 422 Other personal services 8129 423 Religious organizations 8131
424 Grantmaking, giving, & social advocacy organizations 8132, 8133
425 Civic, social, professional, & similar organizations 8134, 8139 426 Private households 814 427 Postal service 491 428 Federal electric utilities n.a. 429 Other Federal Government enterprises n.a. 430 State & local government passenger transit n.a. 431 State & local government electric utilities n.a. 432 Other state & local government enterprises n.a. 433 Not an industry (Used & secondhand goods) n.a. 434 Not an industry (Scrap) n.a. 435 Not an industry (Rest of the world adjustment) n.a. 436 Not an industry (Noncomparable imports) n.a.
437 Employment & payroll for SL Government Non‐Education n.a.
438 Employment & payroll for SL Government Education n.a.
439 Employment & payroll for Federal Non‐Military n.a. 440 Employment & payroll for Federal Military n.a.
82
Appendix C: County Region Identification Table
83
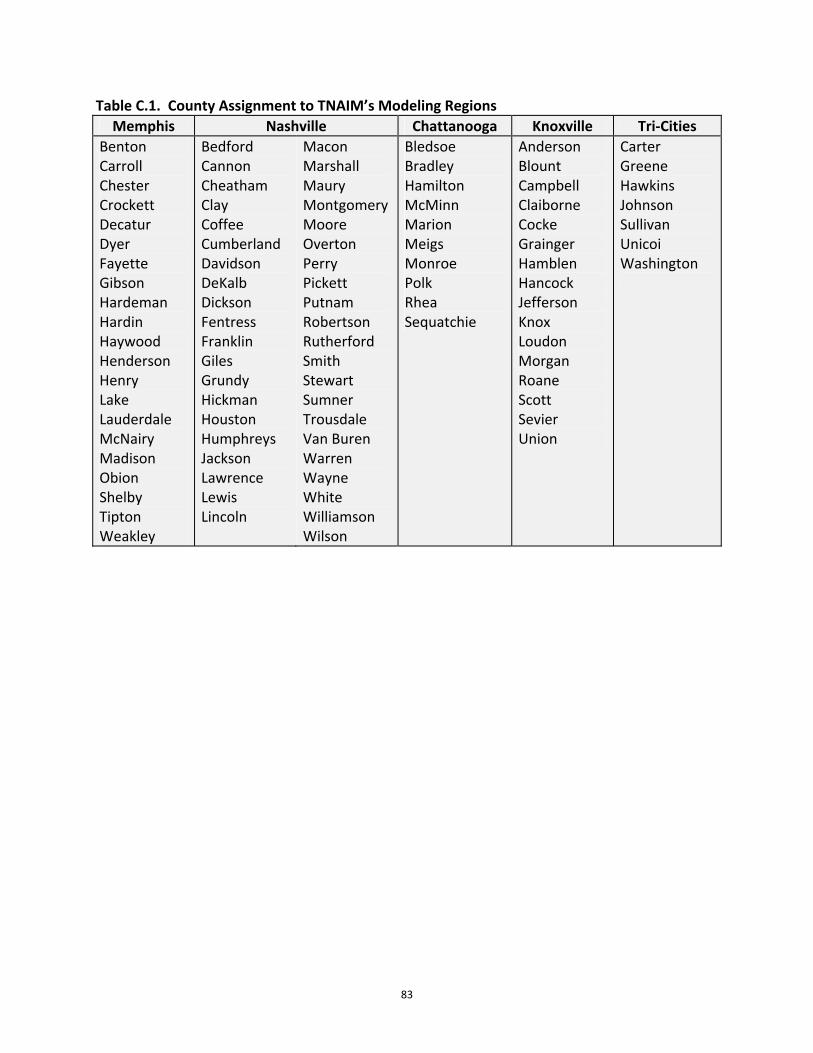
Table C.1. County Assignment to TNAIM’s Modeling Regions
Benton Carroll Chester Crockett Decatur Dyer Fayette Gibson Hardeman Hardin Haywood Henderson Henry Lake Lauderdale McNairy Madison Obion Shelby Tipton Weakley
Bedford Cannon Cheatham Clay Coffee Cumberland Davidson DeKalb Dickson Fentress Franklin Giles Grundy Hickman Houston Humphreys Jackson Lawrence Lewis Lincoln
Macon Marshall Maury Montgomery Moore Overton Perry Pickett Putnam Robertson Rutherford Smith Stewart Sumner Trousdale Van Buren Warren Wayne White Williamson Wilson
Bledsoe Bradley Hamilton McMinn Marion Meigs Monroe Polk Rhea Sequatchie
Anderson Blount Campbell Claiborne Cocke Grainger Hamblen Hancock Jefferson Knox Loudon Morgan Roane Scott Sevier Union
Carter Greene Hawkins Johnson Sullivan Unicoi Washington
84
Appendix D: Total Industry Output, Employment, Labor Income, and Total Value‐Added by Agriculture and Forestry Sectors for Tennessee, 2011
85
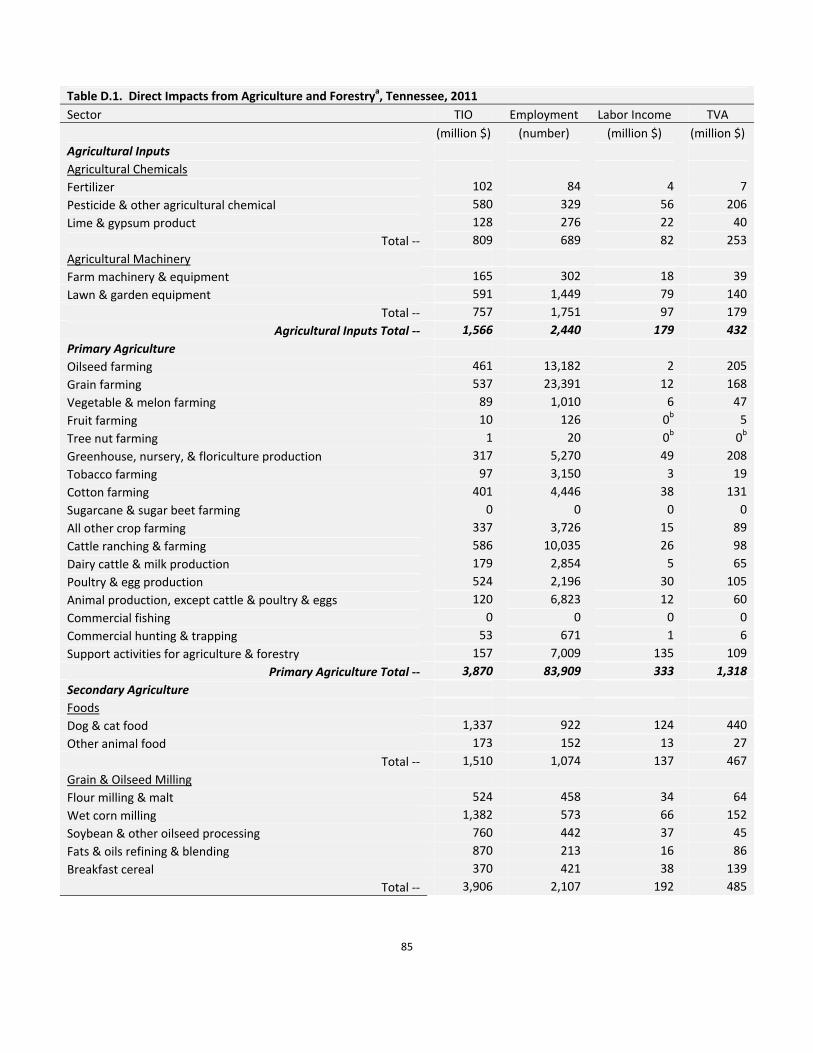
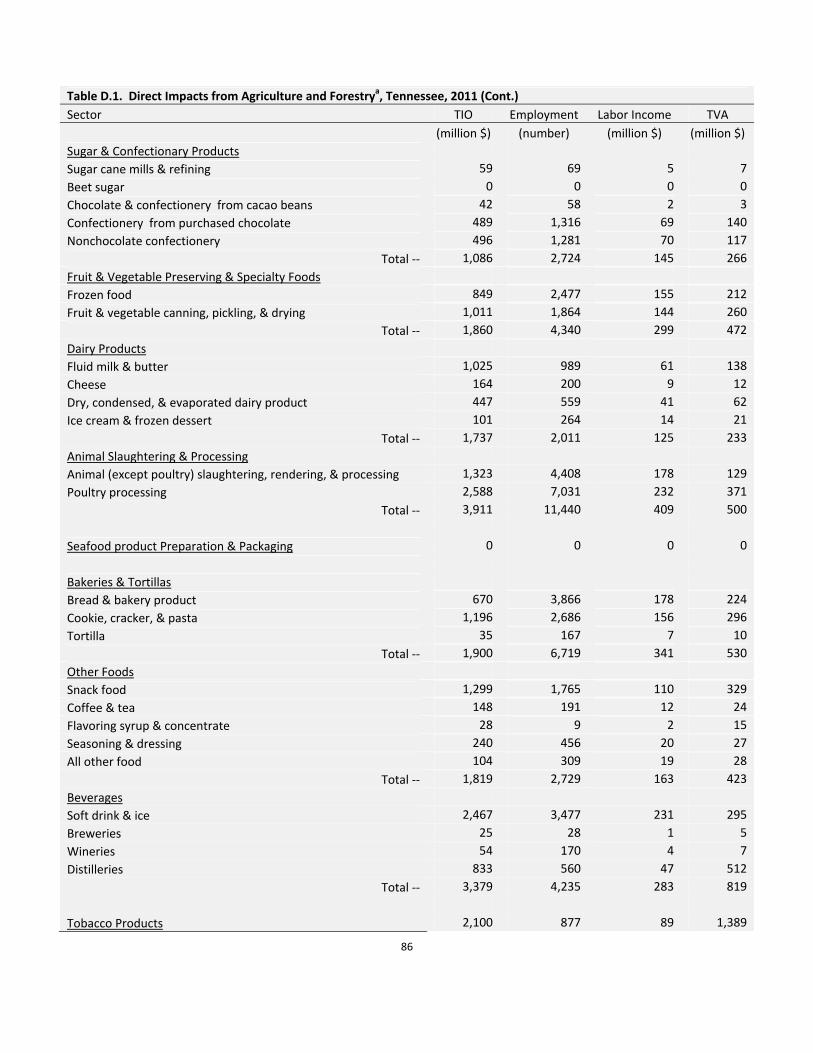
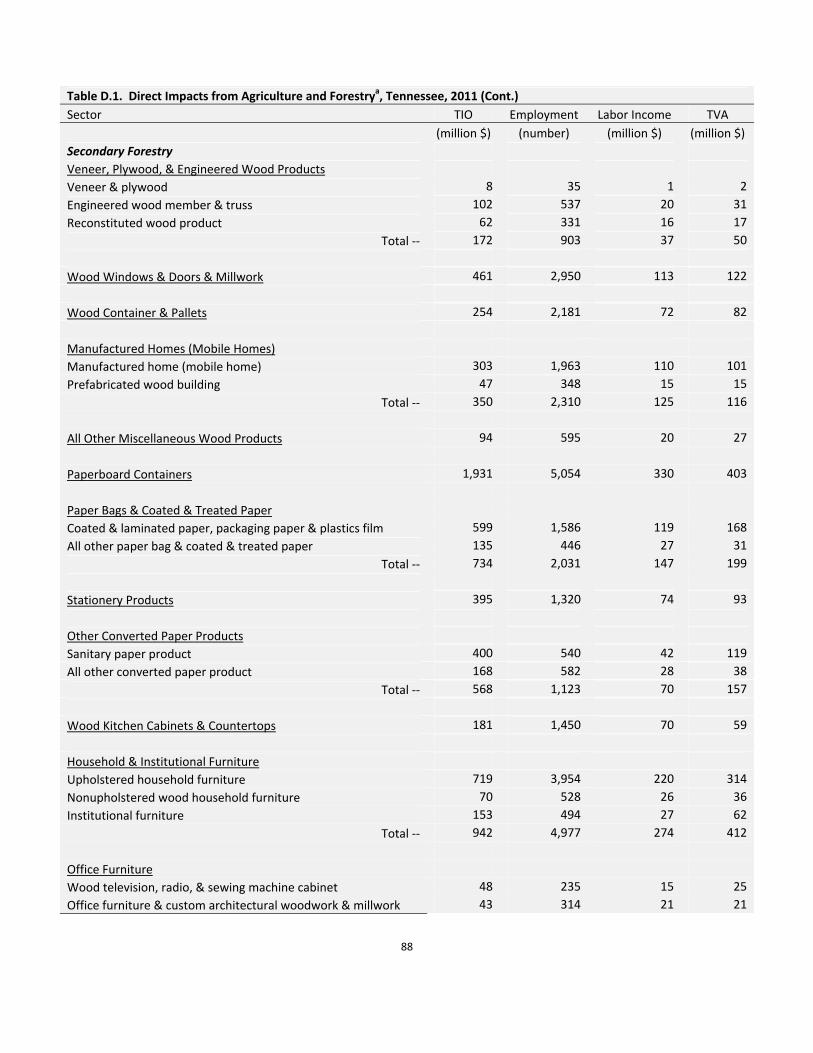
Table D.1. Direct Impacts from Agriculture and Forestrya, Tennessee, 2011
Sector TIO Employment Labor Income TVA
(million $) (number) (million $) (million $)
Agricultural Inputs
Agricultural Chemicals
Fertilizer 102 84 4 7
Pesticide & other agricultural chemical 580 329 56 206
Lime & gypsum product 128 276 22 40
Total ‐‐ 809 689 82 253
Agricultural Machinery
Farm machinery & equipment 165 302 18 39
Lawn & garden equipment 591 1,449 79 140
Total ‐‐ 757 1,751 97 179
Agricultural Inputs Total ‐‐ 1,566 2,440 179 432
Primary Agriculture
Oilseed farming 461 13,182 2 205
Grain farming 537 23,391 12 168
Vegetable & melon farming 89 1,010 6 47
Fruit farming 10 126 0b 5
Tree nut farming 1 20 0b 0b
Greenhouse, nursery, & floriculture production 317 5,270 49 208
Wholesale Trade ‐‐ 26,136 35,181 165,705 240,128 10,731 13,892 18,163 23,575 aTotals may not add due to rounding. bValues of zero are nonzero values less than 1.
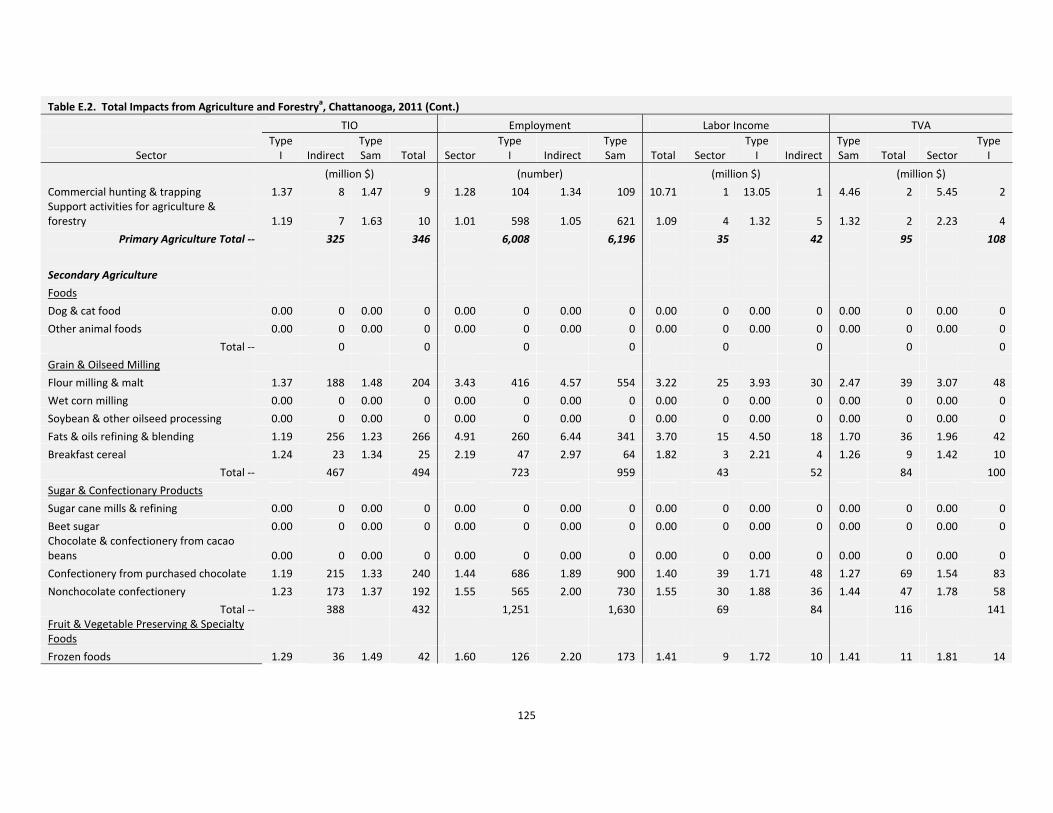
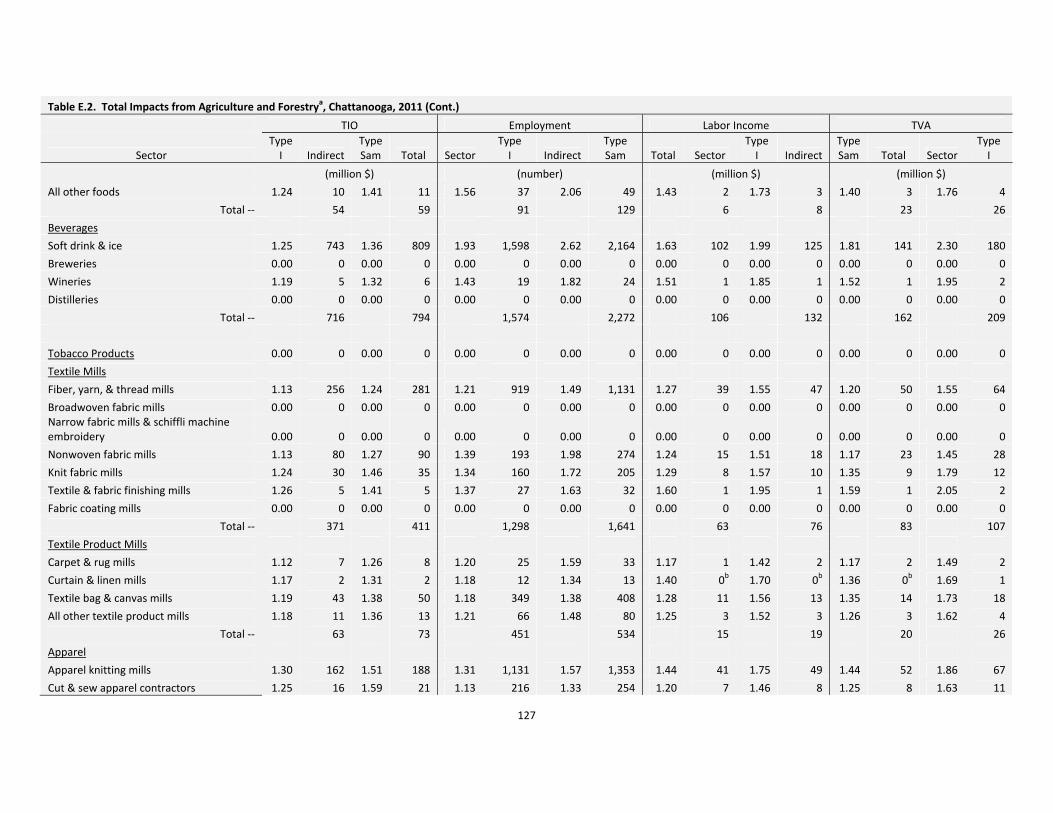
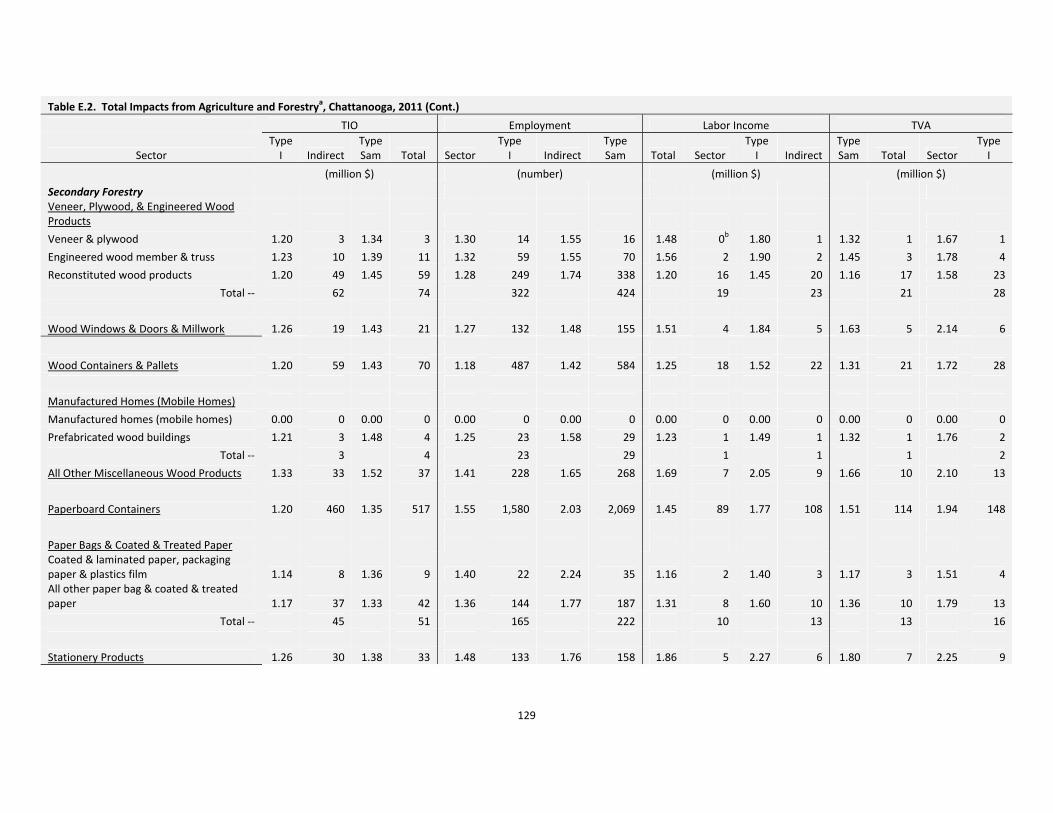
124
Table E.2. Total Impacts from Agriculture and Forestrya, Chattanooga, 2011
Wholesale Trade ‐‐ 2,141 2,697 13,864 18,659 863 1,052 1,481 1,806 aTotals may not add due to rounding. bValues of zero are nonzero values less than 1.
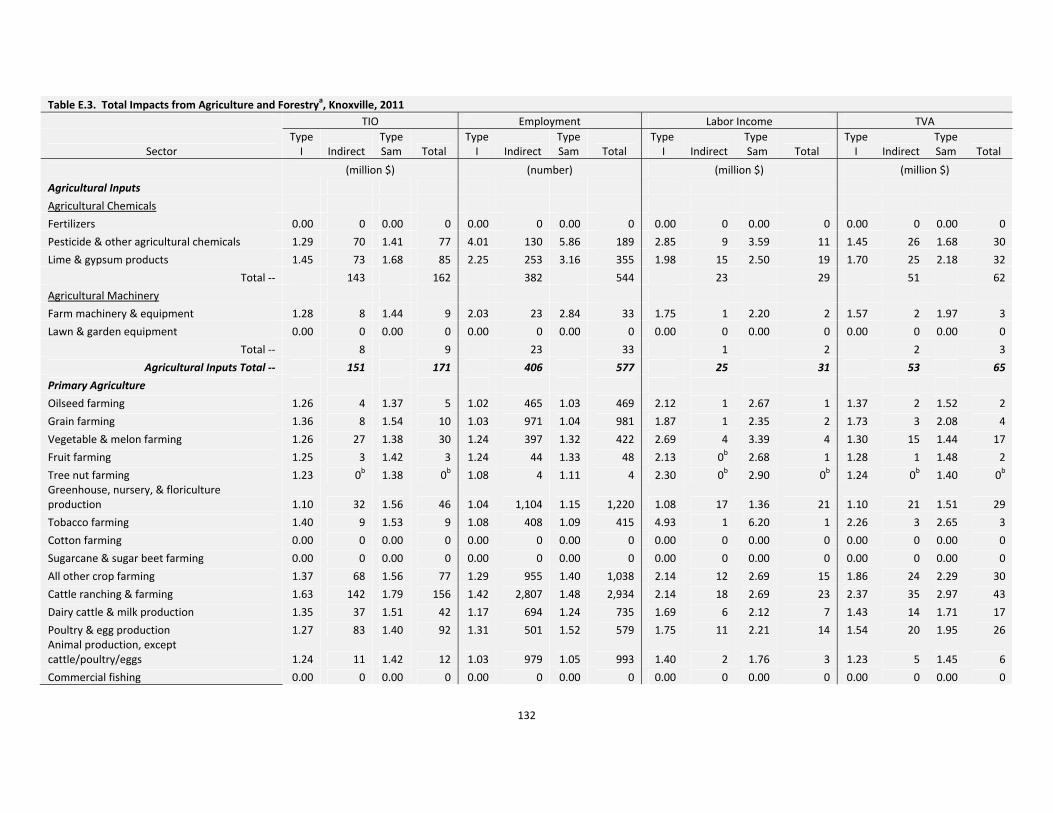
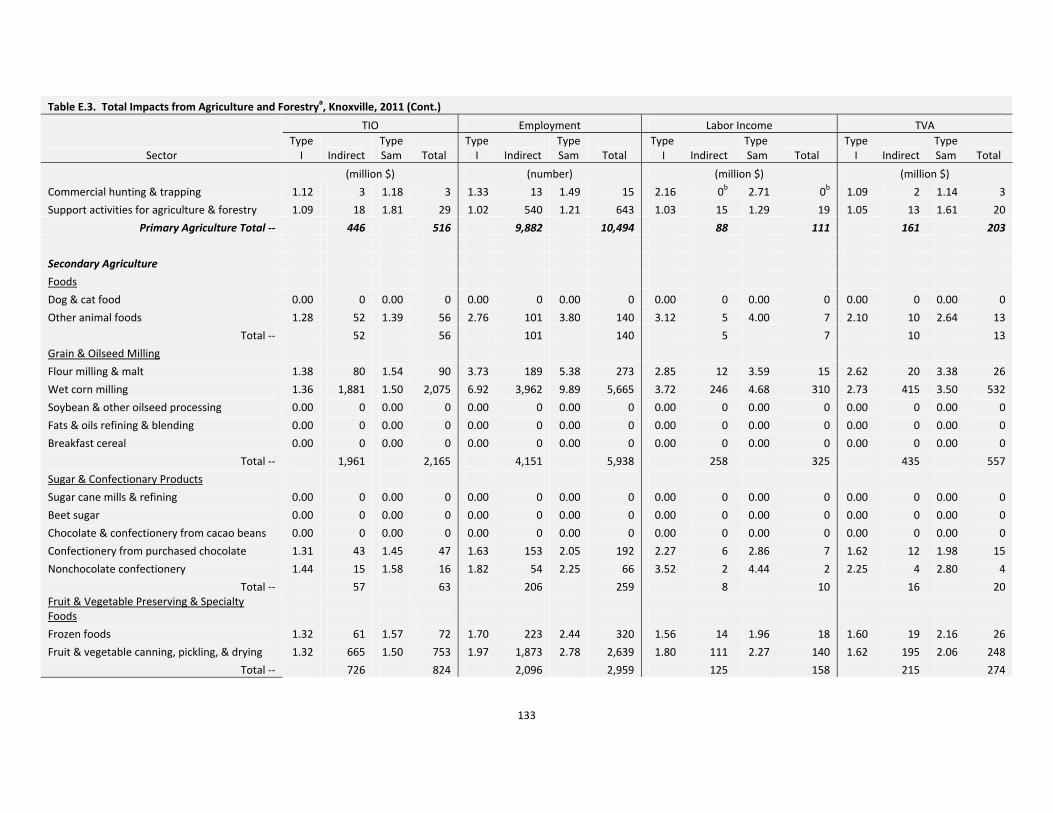
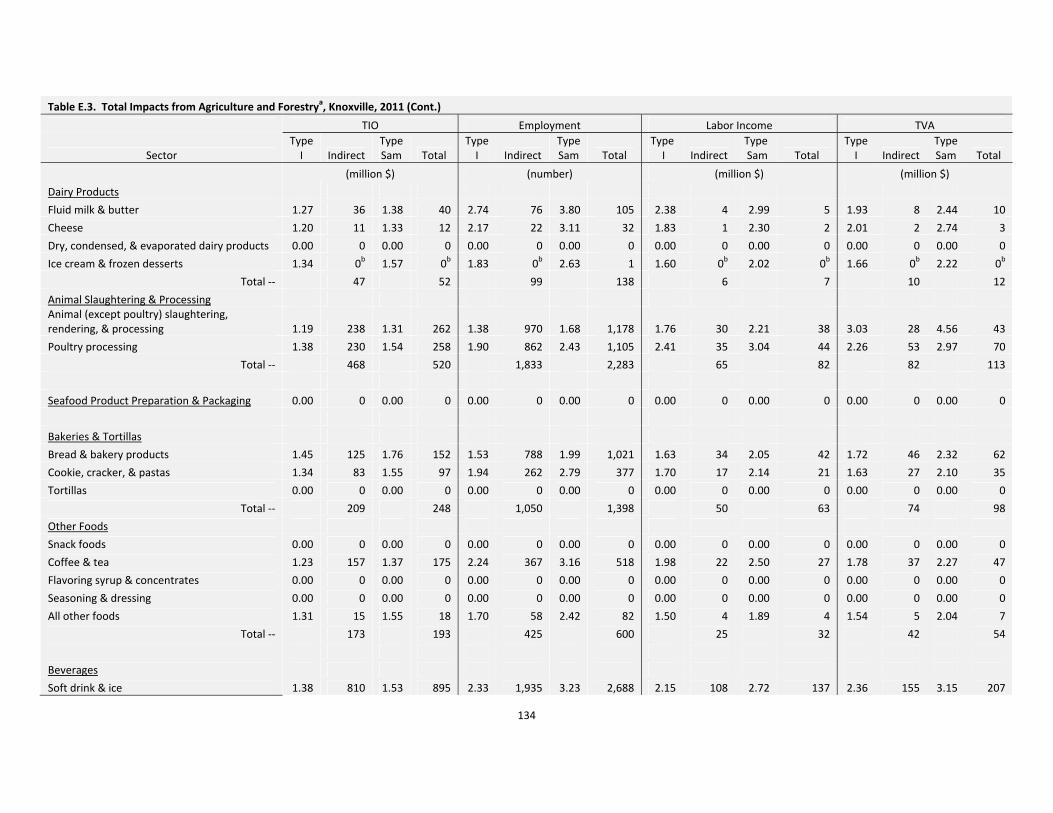
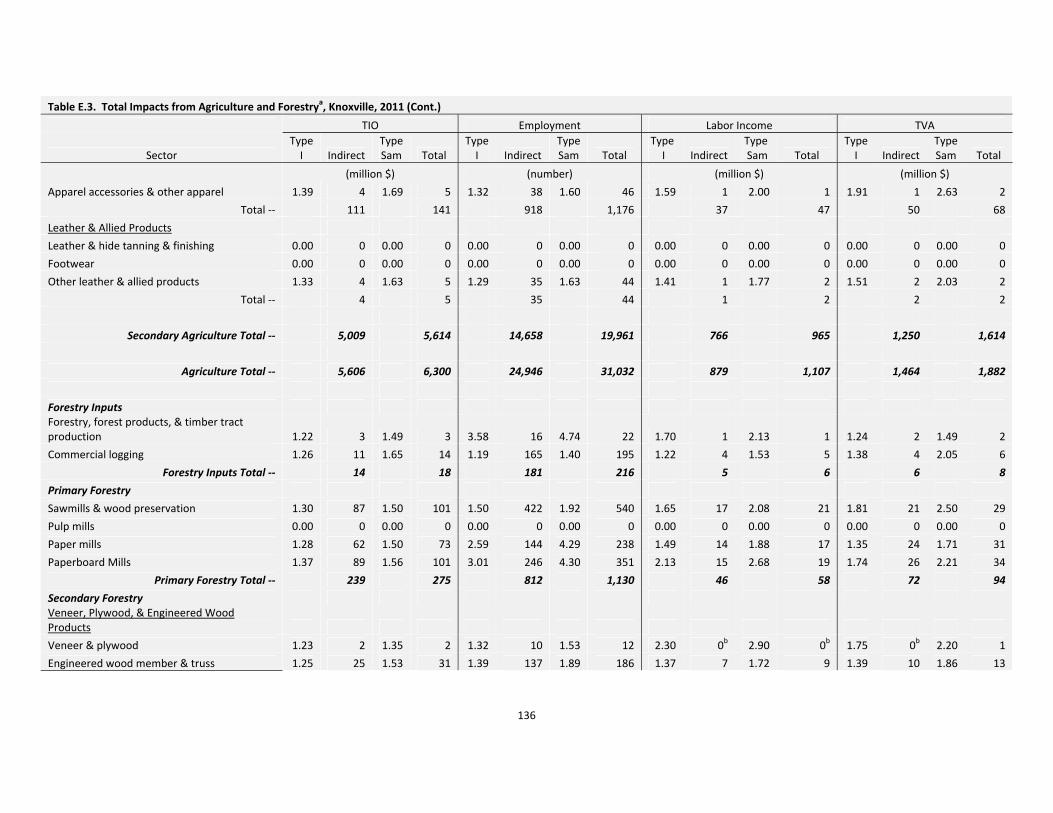
132
Table E.3. Total Impacts from Agriculture and Forestrya, Knoxville, 2011
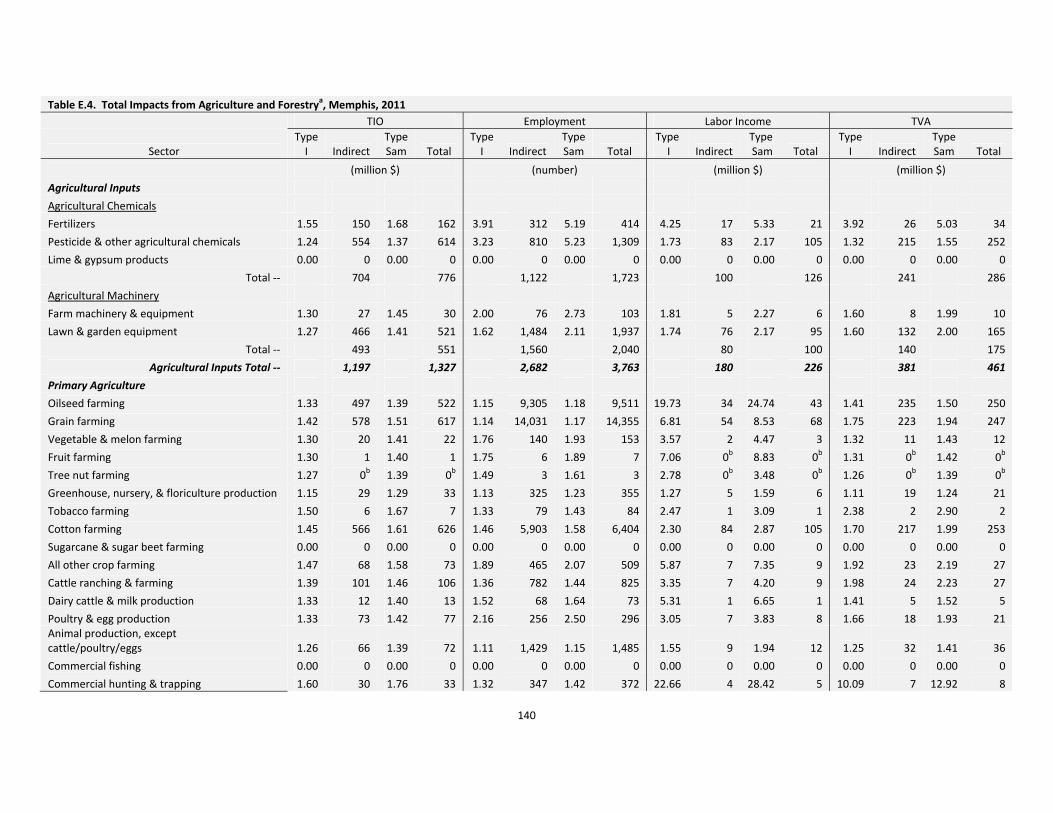
Wholesale Trade ‐‐ 4,065 5,379 25,977 37,529 1,655 2,087 2,824 3,615 aTotals may not add due to rounding. bValues of zero are nonzero values less than 1.
140
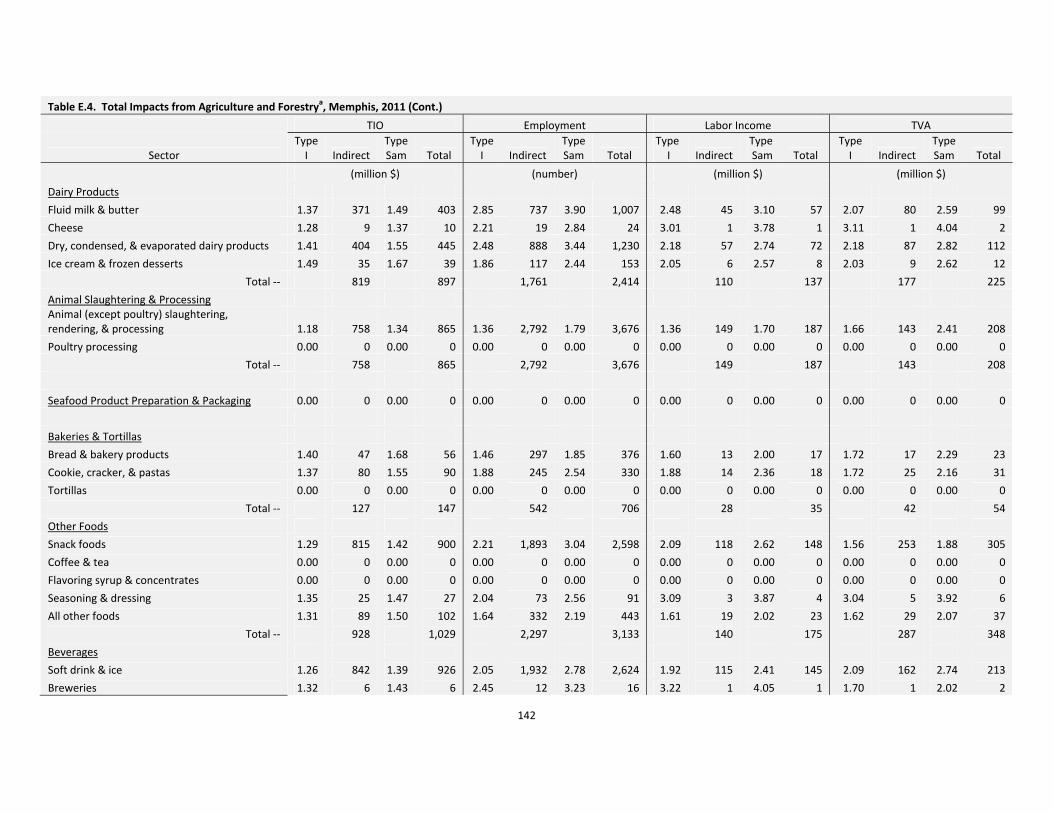
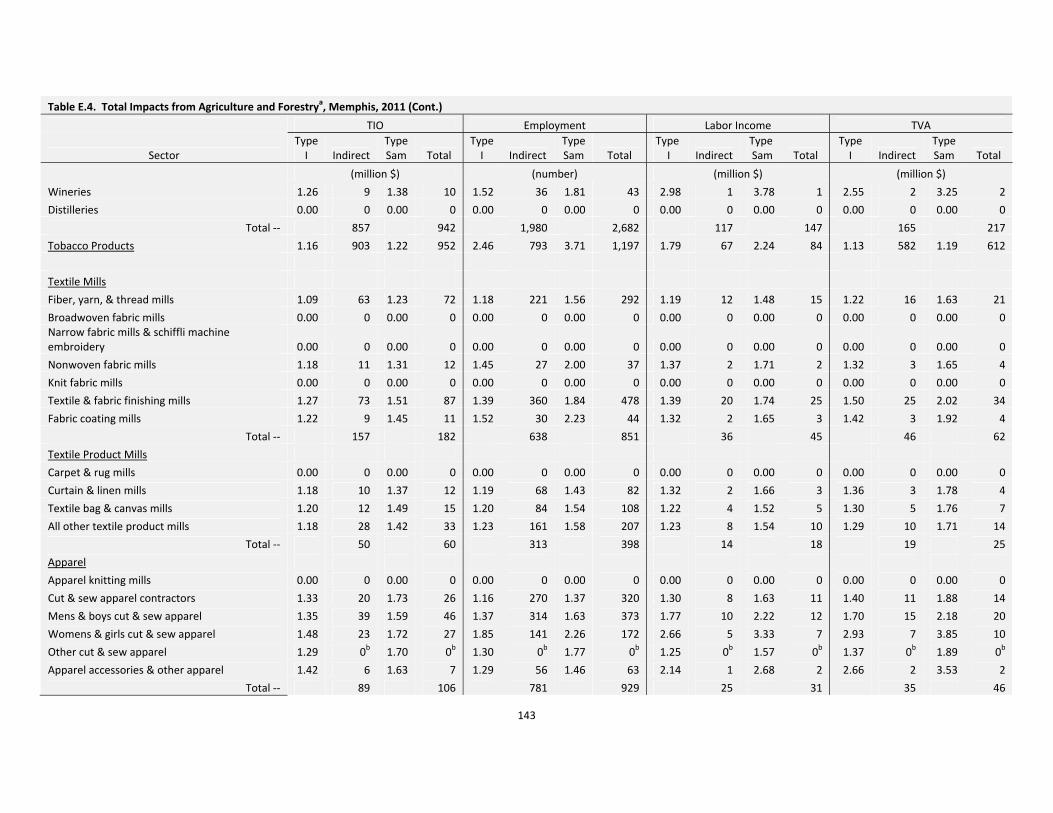
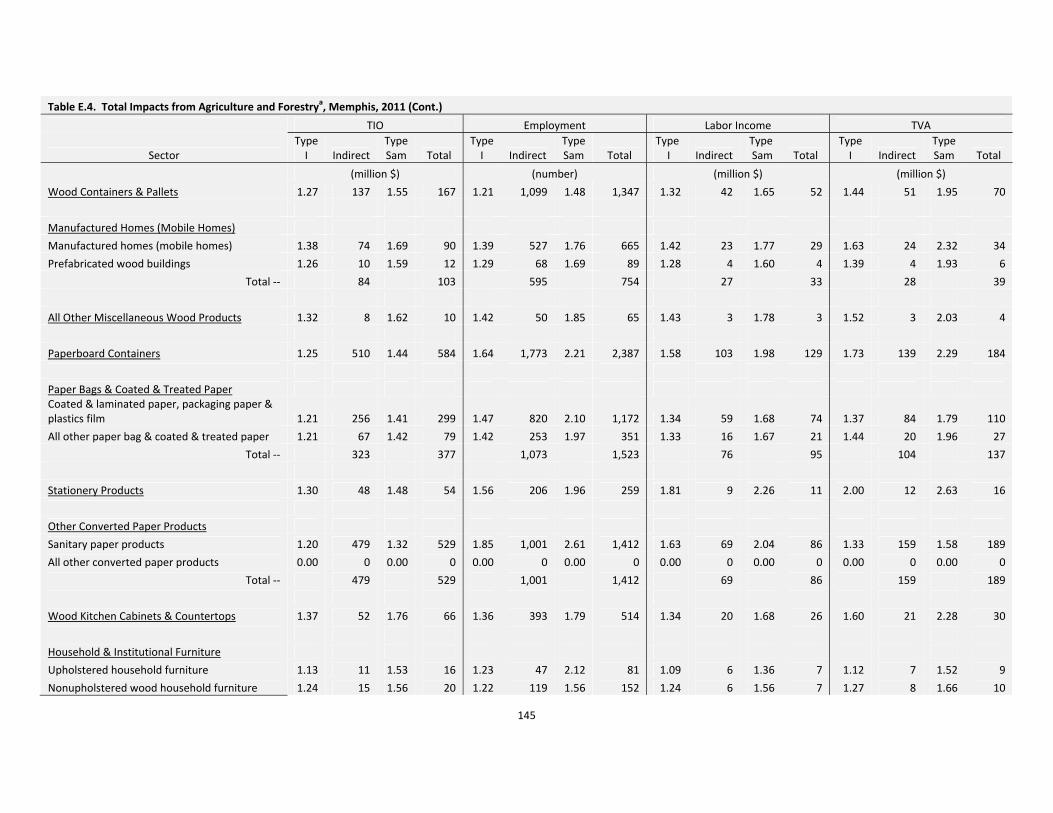
Table E.4. Total Impacts from Agriculture and Forestrya, Memphis, 2011
Wholesale Trade ‐‐ 7,942 10,285 50,272 69,721 3,235 4,057 5,525 6,952 aTotals may not add due to rounding. bZero values are nonzero values less than one.
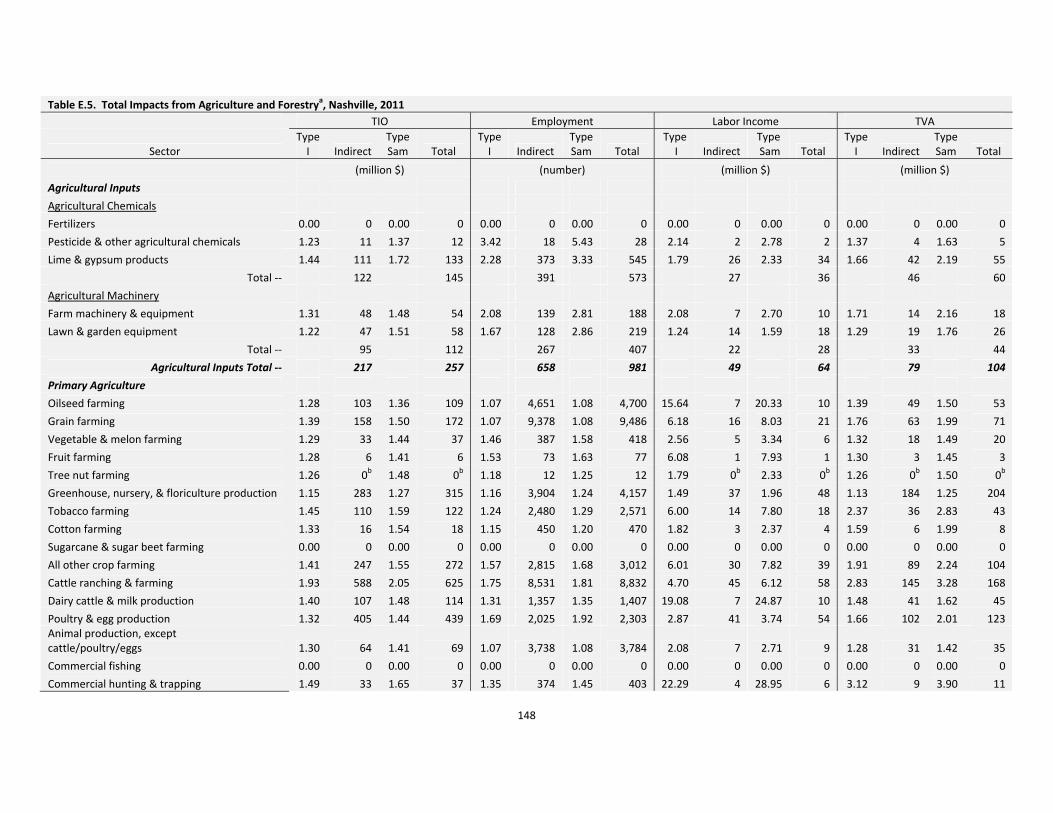
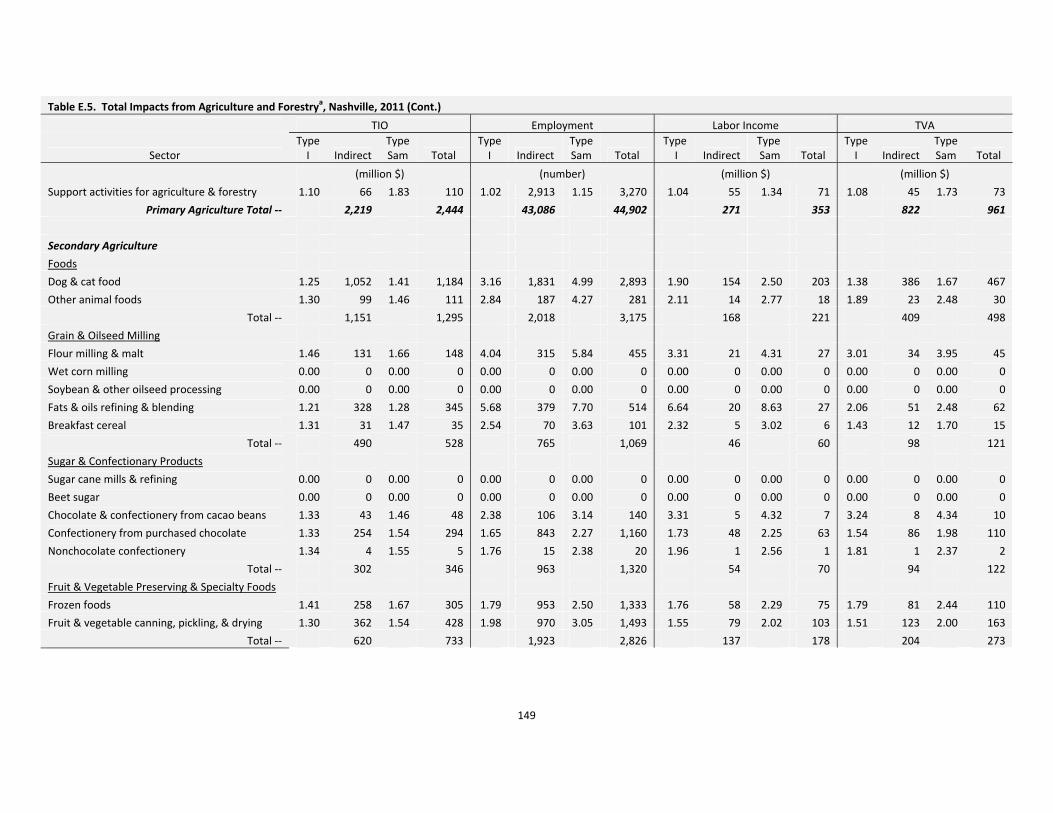
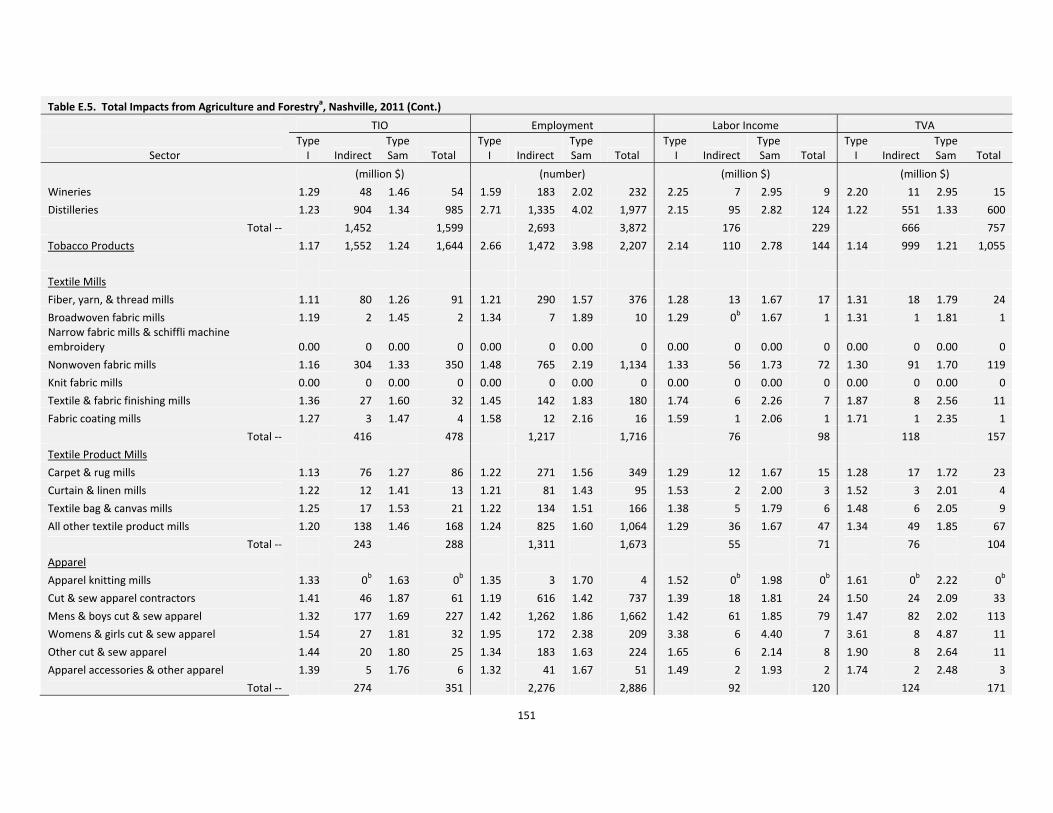
148
Table E.5. Total Impacts from Agriculture and Forestrya, Nashville, 2011
Wholesale Trade ‐‐ 10,518 14,157 66,240 95,503 4,377 5,696 7,366 9,605 aTotals may not add due to rounding. bValues of zero are nonzero values less than 1.
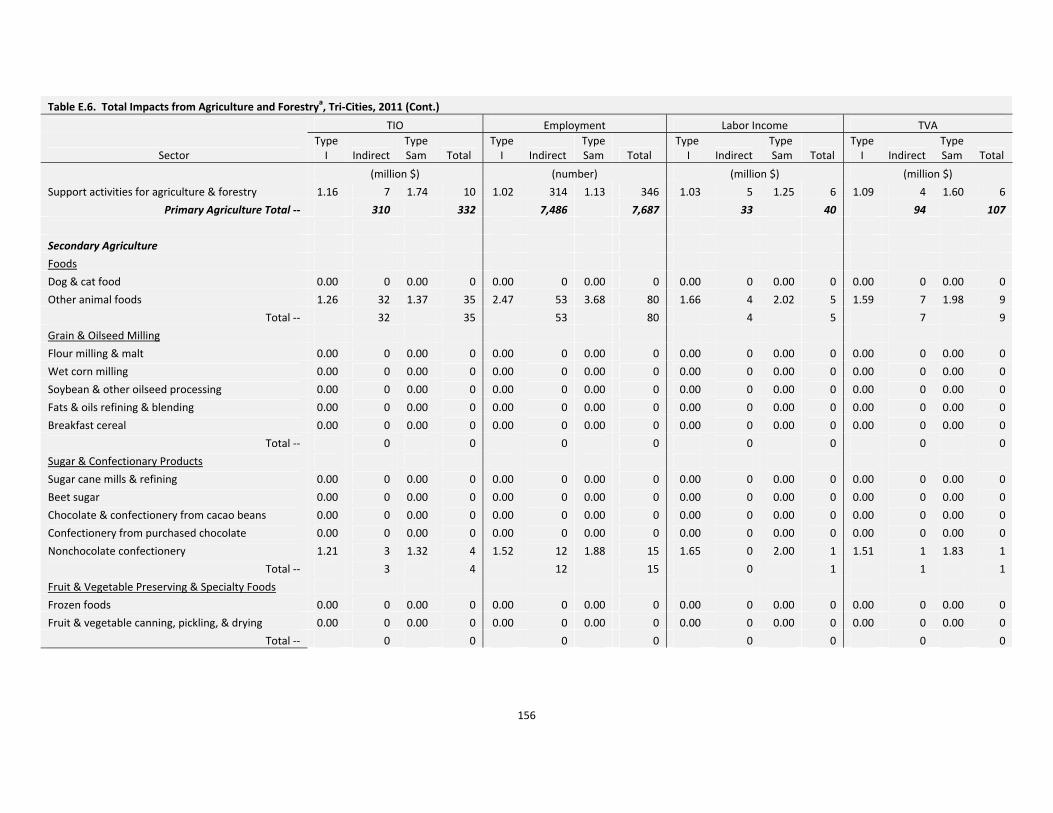
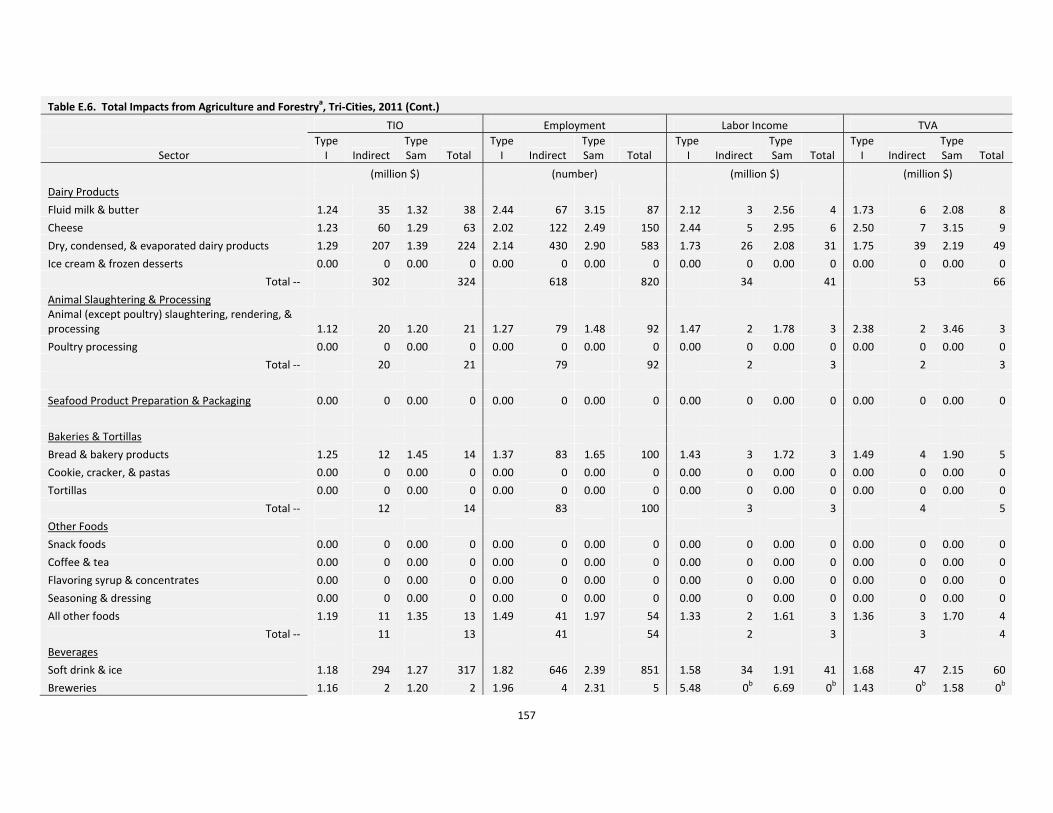
155
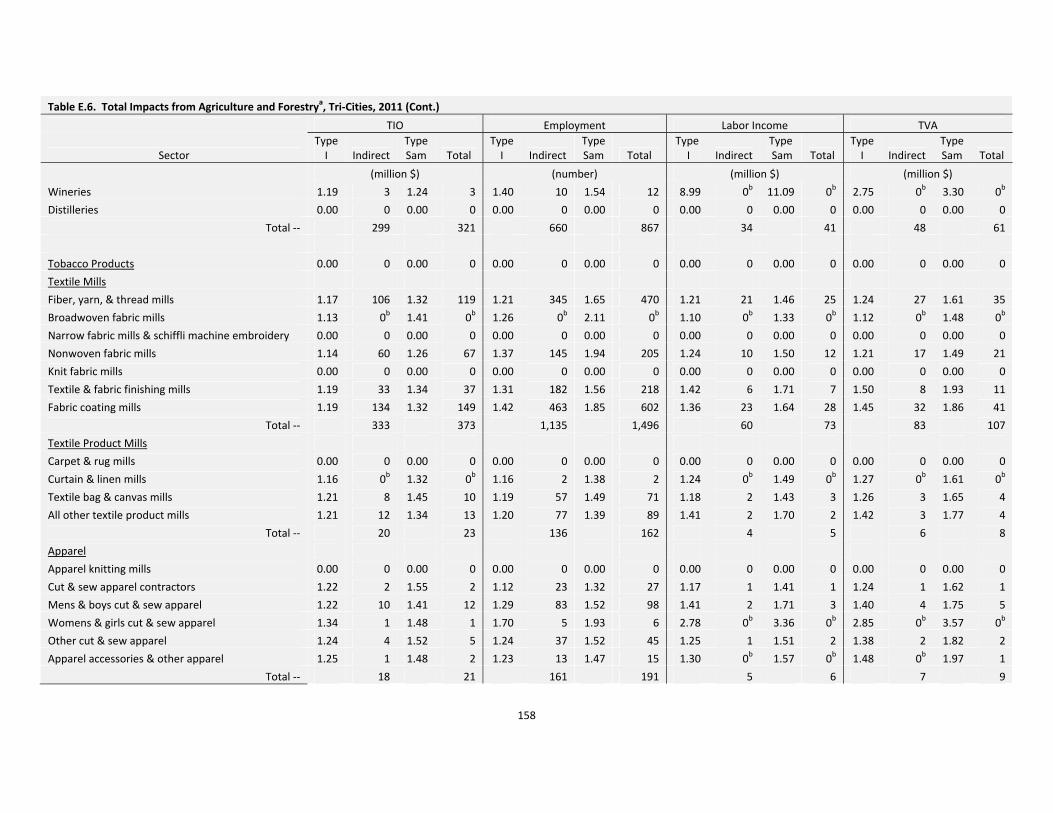
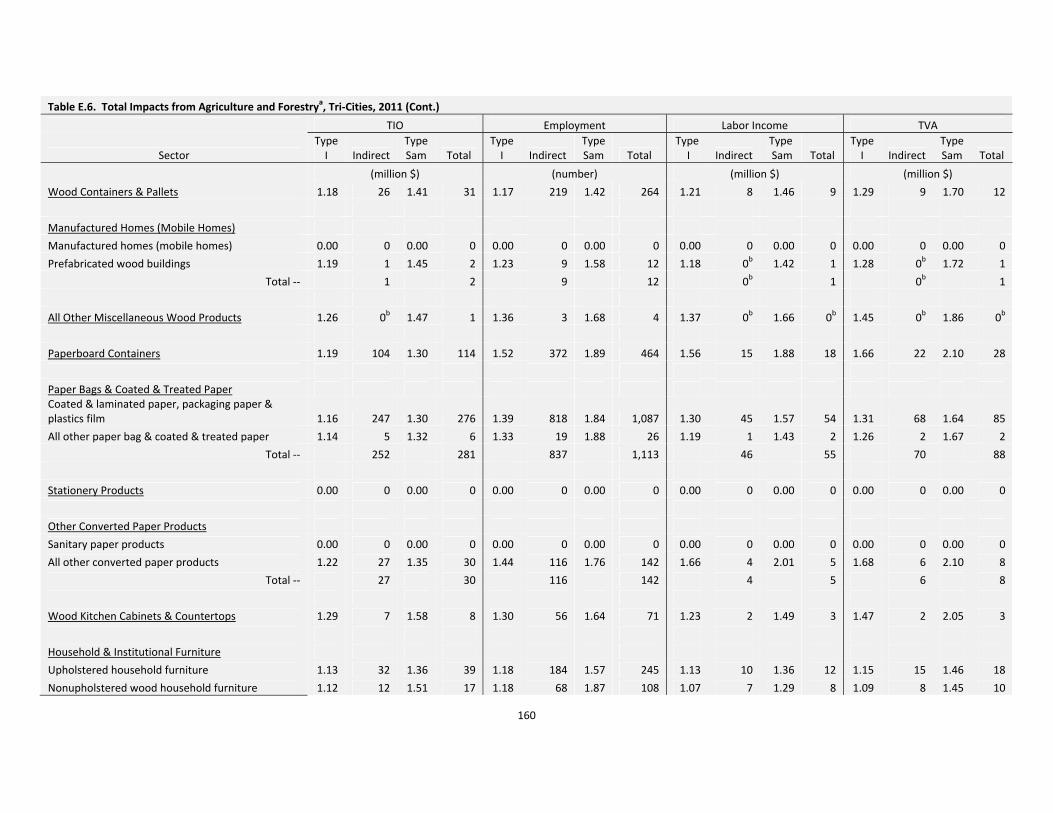
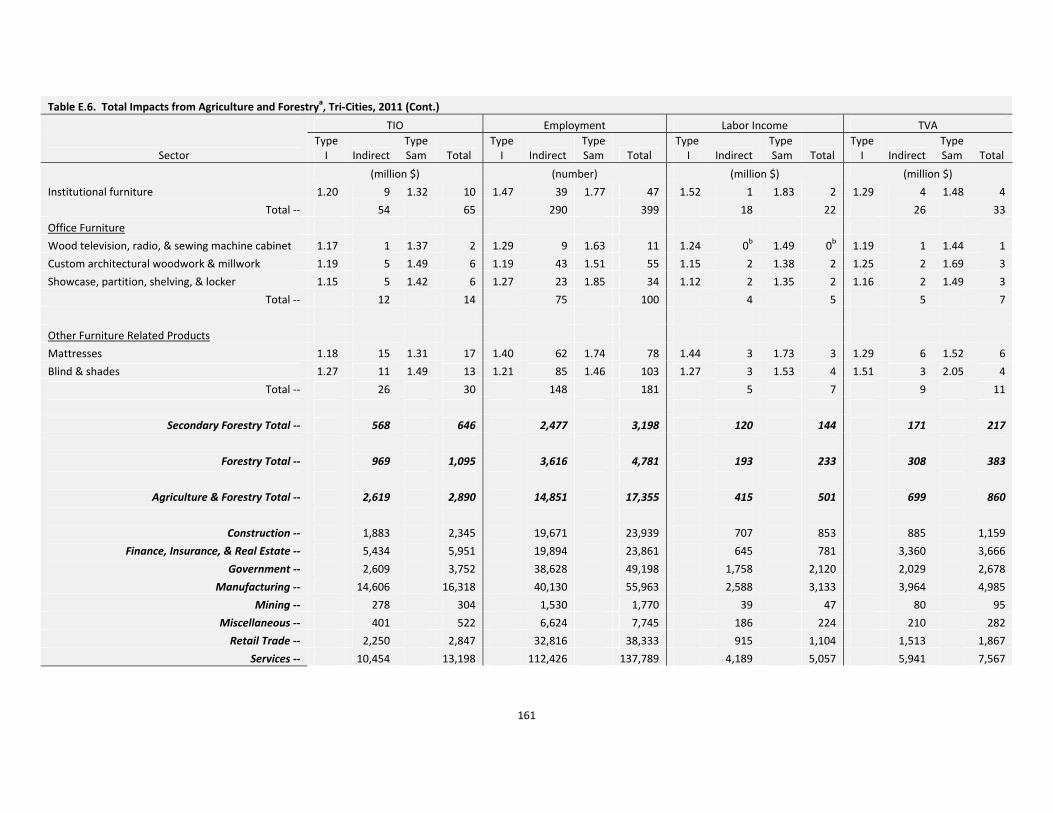
Table E.6. Total Impacts from Agriculture and Forestrya, Tri‐Cities, 2011