14
Economic Impacts of Irrigation Scheduling Decisions Carla Muller, Mark Neal, MS Srinivasan, Richard Measures NZARES, 30 August 2018, Wellington

Economic Impacts of Irrigation Scheduling DecisionsCarla Muller, Mark Neal, MS Srinivasan, Richard Measures
NZARES, 30 August 2018, Wellington

Irrigation Insight
• Collaborative research programme- including NIWA, DairyNZ, Fonterra, AgResearch, LIC and IrrigationNZ.
• Focus on developing knowledge, tools and confidence in better managing irrigation, precisely applying the water needed—where, when and how much.
• Aims to use improved weather forecast, drainage and economic impact estimations to inform on-farm water management on irrigated dairy farms, ideally at a marginal level.

Hydro-Economic model
• A model which estimates the environmental and economic impacts of various irrigation scheduling practices.
• This presentation includes altering the application depth and frequency, and test the direct and indirect economic benefits and costs in a basic scenario.
• Future iterations:
• Vary soil type• Include weather forecasts • Include nutrient losses • More complex scheduling decisions

Hydrology
• The hydrological model calculates changes in root zone soil moisture each day using a water balance approach accounting for rainfall, irrigation, evapotranspiration and drainage.
• Uses 18 seasons, results are an average over these seasons.

Economics Economic impacts
Direct costs
Pumping ($/m3)
R&M ($/day)
Labour ($/day)
Indirect costs
(changes in PGR)
Soil moisture
Wastage
Pugging
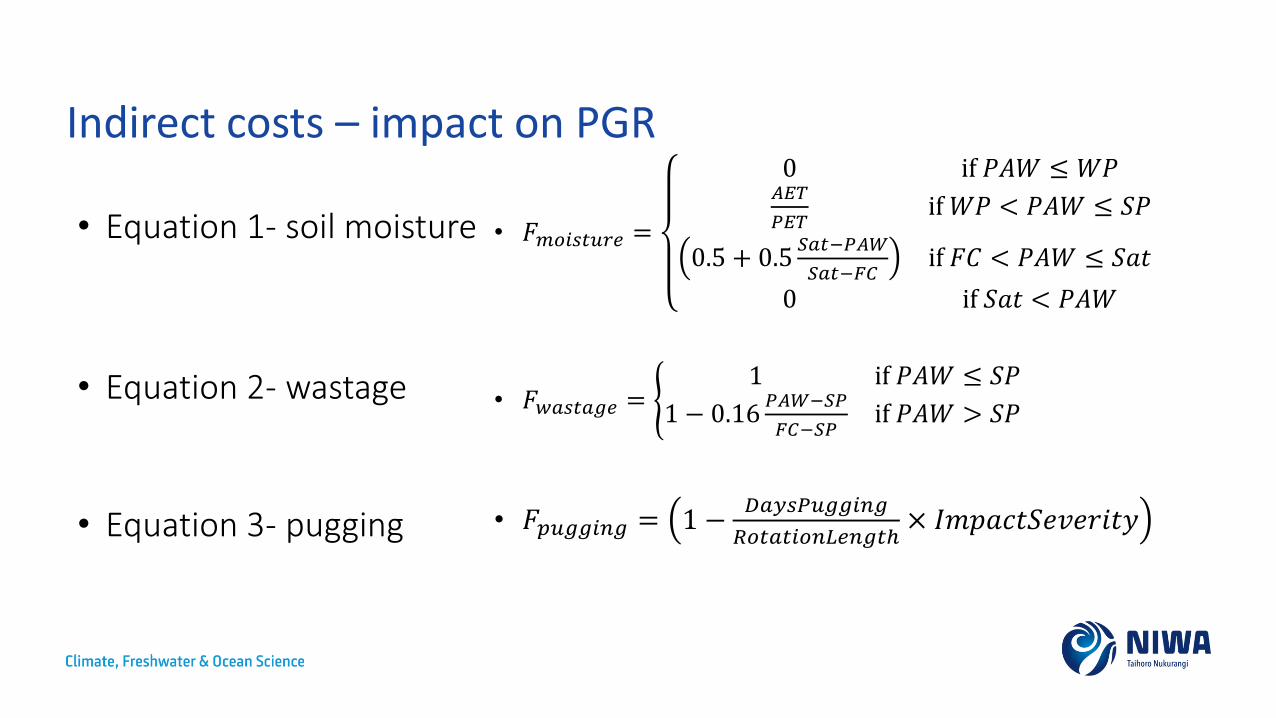
Indirect costs – impact on PGR
• 𝐹𝑚𝑜𝑖𝑠𝑡𝑢𝑟𝑒 =
0 if 𝑃𝐴𝑊 ≤ 𝑊𝑃𝐴𝐸𝑇
𝑃𝐸𝑇if 𝑊𝑃 < 𝑃𝐴𝑊 ≤ 𝑆𝑃
0.5 + 0.5𝑆𝑎𝑡−𝑃𝐴𝑊
𝑆𝑎𝑡−𝐹𝐶if 𝐹𝐶 < 𝑃𝐴𝑊 ≤ 𝑆𝑎𝑡
0 if 𝑆𝑎𝑡 < 𝑃𝐴𝑊
• 𝐹𝑤𝑎𝑠𝑡𝑎𝑔𝑒 = ൝1 if 𝑃𝐴𝑊 ≤ 𝑆𝑃
1 − 0.16𝑃𝐴𝑊−𝑆𝑃
𝐹𝐶−𝑆𝑃if 𝑃𝐴𝑊 > 𝑆𝑃
• 𝐹𝑝𝑢𝑔𝑔𝑖𝑛𝑔 = 1 −𝐷𝑎𝑦𝑠𝑃𝑢𝑔𝑔𝑖𝑛𝑔
𝑅𝑜𝑡𝑎𝑡𝑖𝑜𝑛𝐿𝑒𝑛𝑔𝑡ℎ× 𝐼𝑚𝑝𝑎𝑐𝑡𝑆𝑒𝑣𝑒𝑟𝑖𝑡𝑦
• Equation 1- soil moisture
• Equation 2- wastage
• Equation 3- pugging

Scenario- Farm A Name Irrigators Irrigation
approach
Frequency limitation logic
2-JM 2 Guns Just in time Minimum return interval
2-AM 2 Guns Always Minimum return interval
2-JR 2 Guns Just in time Rostered
2-AR 2 Guns Always Rostered
3-JM 3 Guns Just in time Minimum return interval
3-AM 3 Guns Always Minimum return interval
3-JR 3 Guns Just in time Rostered
3-AR 3 Guns Always Rostered
Just in time: Irrigate when
soil storage reaches user set
threshold
Always: Irrigate whenever water is available
Minimum return interval: Cannot irrigate until a set number of days after the last irrigation
Roster: Irrigate on pre-set days
2 Guns: 45mm depth & 11 day return
3 Guns: 35mm depth & 9 day return
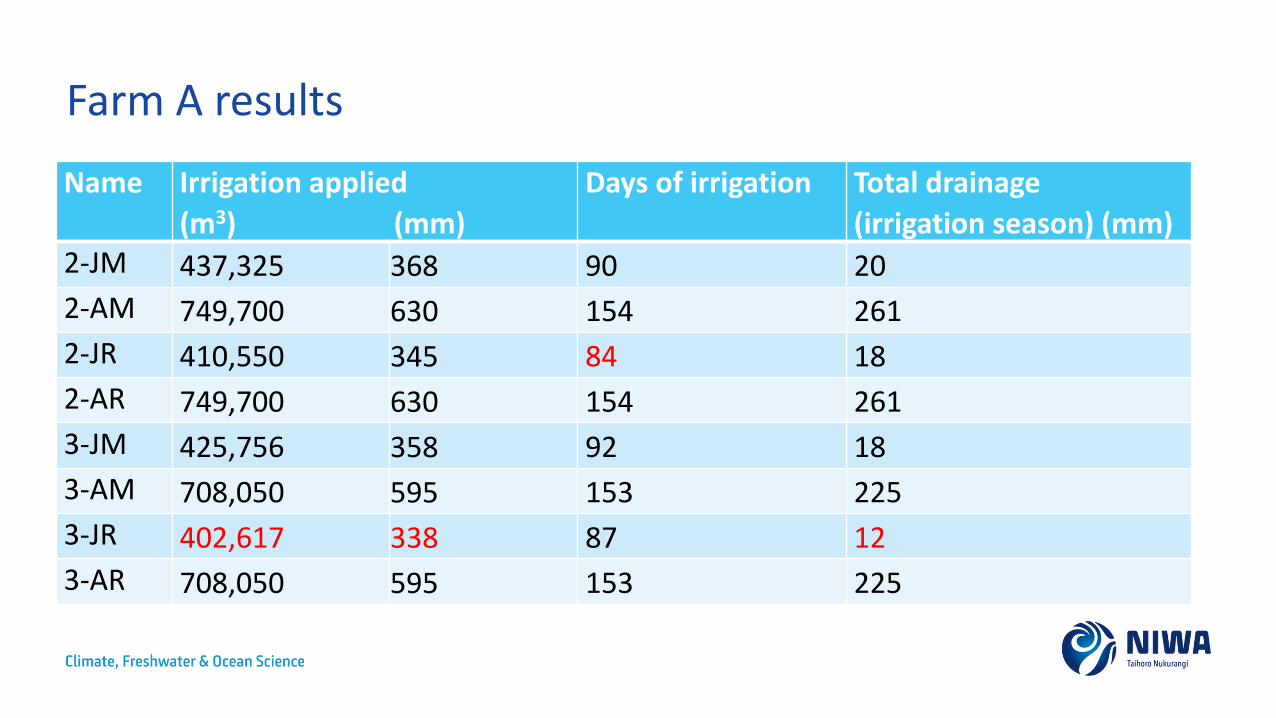
Farm A results
Name Irrigation applied
(m3) (mm)
Days of irrigation Total drainage
(irrigation season) (mm)2-JM 437,325 368 90 20
2-AM 749,700 630 154 261
2-JR 410,550 345 84 18
2-AR 749,700 630 154 261
3-JM 425,756 358 92 18
3-AM 708,050 595 153 225
3-JR 402,617 338 87 12
3-AR 708,050 595 153 225

Farm A results Name Total direct
costs
$/ha/yr
Pasture
grown
Kg DM/ha/yr
Pasture value
$/ha/yr
Total value
(value of pasture minus
direct costs) $/ha/yr
2-JM $429 13,732 $3,116 $2,688
2-AM $735 11,311 $2,646 $1,911
2-JR $402 13,997 $3,172 $2,770#
2-AR $735 11,311 $2,646 $1,911
3-JM $431 13,960 $3,165 $2,733#
3-AM $718 11,360 $2,642 $1,924
3-JR $408 14,150 $3,207 $2,799
3-AR $718 11,360 $2,642 $1,924

Farm A results- Direct costs & value from PG
-$1,000
-$500
$-
$500
$1,000
$1,500
$2,000
$2,500
$3,000
$3,500
2-JM 2-AM 2-JR 2-AR 3-JM 3-AM 3-JR 3-AR
$/h
a/ye
ar
Pumping costs Maintenance costs Labour cost Value from pasture grown Total value

Farm A results- Water use and total value
2-JM
2-AM
2-JR
2-AR
3-JM
3-AM
3-JR
3-AR
$-
$500
$1,000
$1,500
$2,000
$2,500
$3,000
0 100 200 300 400 500 600 700
Tota
l val
ue
($/h
a/ye
ar)
Irrigation applied (mm/ha/yr)

Farm A conclusions • Theoretical best option = purchase the new irrigation gun, reduce their irrigation
application depth and return length, and utilise a just in time irrigation approach and a roster.
• However, there is not a significant difference between the top four options (scenarios 3-JR, 2-JR, 3-JM, 2-JM).
• The difference in roster and minimum return is generally driven by type of infrastructure on farm.
• So no significant economic benefit in purchasing additional irrigation infrastructure-in this case.
• Significant benefit in using a just in time approach relative to the always irrigation approach.
• The top four scenarios economically also had lower total drainage, indicating a positive environmental outcome as well.

Conclusions• Farm A shows that there is a significant positive economic and
environmental benefit from using soil storage based scheduling rather than a rostering system.
• However, there is no significant difference between reducing irrigation application depth by 10mm and rotation length by 2 days.
• While these results aren’t ground breaking, they tested the model, proving its validity and mean we can continue further development.
• This research provides an important first step in understanding the economic impact of marginal irrigation scheduling decisions.

Thank you
Carla Muller [email protected]
Carla Muller, Mark Neal, MS Srinivasan, Richard Measures
The Irrigation Insight programme is funded by the Ministry of Business, Innovation and Employment (MBIE).
Programme partners:• NIWA, • DairyNZ, • Fonterra, • AgResearch, • LIC and • IrrigationNZ.


