29
Economic Impacts of Remediating the Portland Harbor Superfund Site January 3, 2012 David Sunding Steven Buck

Economic Impacts of Remediating the
Portland Harbor Superfund Site
January 3, 2012 David Sunding
Steven Buck

1
EXECUTIVE SUMMARY
Portland Harbor was placed on the National Priority List (NPL) in 2000. The Environmental Protection Agency (EPA) has identified 142 potentially responsible parties (PRPs) at the Portland Harbor Site, and among these PRPs, a group was organized to coordinate remediation planning activities. The Lower Willamette Group (LWG) was organized to prepare the Remedial Investigation (RI) Report and Feasibility Study (FS) for Portland Harbor. This report uses information presented in the RI to measure the potential economic impacts of remediating Portland Harbor.
We begin by considering the potential cost of remediation. Because the EPA has not announced the target clean-up thresholds for the Portland Harbor Site, it is impossible to say with certainty what the costs of clean-up will be. However, the Portland Harbor Site is similar to other Superfund sites around the country, and data from these locations can be used to infer a range of potential costs based on assumed clean-up standards. Using available information developed by LWG on the range and extent of contamination with polychlorinated biphenyls (PCBs, the primary contaminant driving the risk calculations), we estimate a range of possible remediation costs depending on the sediment contamination concentration threshold used to designate dredging areas, and assuming certain dredging costs and depths. For the low estimate we assume that the EPA will require remediation of all locations with surface sediment PCBs contamination above 1,000 parts per billion (ppb); for the mid-range estimate we assume a remediation action level (RAL) of 300 ppb; and, for the high estimate we assume a remediation action level of 150 ppb. All estimates assume that dredging costs are $500 per cubic yard (including all associated indirect costs) and dredging will occur to an average depth of 2.5 yards. Using those assumptions, the range of estimated costs is $440 million to over $2 billion. Costs could be reduced substantially if dredging is limited to “hot spots” with higher contamination levels, if dredging is not required to remediate subsurface contamination to an average depth of 2.5 yards, or if capping of contaminated sediment is allowed instead of dredging. The available records from other Superfund sites contains instances where such measures are allowed, and shows that other Superfund sites have required far less stringent remediation standards than 300 ppb or even 1,000 ppb.
The economic benefits of remediation at the Portland Harbor Site relate almost exclusively to reductions in human health risk resulting from consumption of fish caught in the harbor area. For example, the LWG has shown, and the EPA has acknowledged, that remediation of the Portland Harbor would produce few ecosystem benefits. While the RI contains evidence of multiple possible exposure pathways (e.g., beach visitors, dockside workers, and transients) which may lead to increased risk of cancer, these pathways lead to small incremental changes. Further, the incremental changes in risk due to these pathways are orders of magnitude below the assumed risk due to consumption of fish caught in the Portland Harbor.
We measure the benefits of remediation of the Portland Harbor Site by comparing the level of health risks before and after an assumed level of clean-up. That is, we measure the incremental benefits of remediation in order to evaluate them in relation to the incremental costs. We follow standard practice in environmental economics and calculate the benefits of remediation as the monetary value of an expected number of avoided cancer cases resulting from clean-up.

2
The EPA calculates the health risks of fish consumption by multiplying an assumed lifetime average daily intake of PCBs by a slope factor taken from the toxicology literature. PCBs are a suspected carcinogen so we measure health outcomes in terms of cancer risks. We measure benefits by computing the monetary value of reduced incidence of cancer.
Fishing and fish consumption patterns vary across segments of the population. To calculate the incremental benefits of remediation we distinguish between children and adults, tribal and non-tribal populations, and ingestion levels among people who consume fish from Portland Harbor. Our benefits estimation is highly conservative, that is, highly protective of human health in that we assume that all cancer cases are fatal, that remediation is successful in achieving and maintaining the EPA’s goal of a one in a million risk of excess cancer, that the population at risk exceeds 75,000 people, and that all fish consumed by this population consists entirely of fish caught near Portland Harbor. We also assume fish is eaten raw although it is established that cooking fish reduces the level of carcinogenic PCBs. Further, we assume that fish consumers ignore fish advisories for the entire mainstem of the Willamette River from the Oregon Health Authority (OHA) based on methylmercury contamination in fish tissues1. For example, the OHA advises high risk groups such as children under six and women between 18-45 to consume no more than one meal per month of resident fish, and advises healthy adult males to consume no more than two meals a month. Based on the LWG’s Baseline Human Health Risk Assessment we assume that there are tribal adults residing in Portland Harbor who consume 175 grams/day of fish of which 37.2% is assumed to be derived from resident fish. This is equivalent to 8.5 meals per month of resident fish or over four times OHA’s advised consumption level. Even under these highly conservative assumptions, the incremental benefits of remediation are far lower than the costs of achieving a clean-up target of 150 ppb or even 300 ppb for surface sediments. For example, if anglers and their families consume fillets from fish caught in the Portland Harbor and fish are contaminated at mean levels, then the benefits of remediation we calculate are less than $13 million over a 70 year period.
Comparing the economic benefits of dredging to the costs, it is clear that costs far outweigh the value of reduced public health risks if all surface sediments exceeding 300 parts per billion are targeted for remediation. This comparison does not even take into consideration the regional economic impacts of imposing the huge remediation cost burden on local companies. Using the IMPLAN analysis tool we estimate that $1.2 billion cleanup could result in the loss of approximately 9,000 jobs over ten years. Other Superfund sites have been remediated based on PCBs concentration levels above 10,000 parts per billion, and in fact, most sediment superfund sites have remedial action levels that are less stringent than the pre-clean-up conditions in the Portland Harbor. Remediating based on a less stringent sediment concentration threshold may preserve most of the benefits of clean-up while avoiding a substantial share of the costs. Implementing other, less expensive remediation options such as capping may have a similar effect.
1 While mercury levels in Portland Harbor sediments are likely to be reduced as a result of remediation, there
is not evidence that clean-up will be broad enough to address most mercury sources impacting the river. There is no indication that the mercury-related fish consumption advisory will be lifted as a result of Portland Harbor remediation.

3
While the LWG has developed an enormous quantity of information to characterize the Portland Harbor Site, there remain significant gaps in the data required to accurately measure the benefits and costs of clean-up. In particular, there is no reliable information on the number of consumers in the Portland area who are actually eating fish and shellfish caught in the harbor. Nor is there information on the quantities or types of fish being consumed, and there is no information on the parts of fish being consumed or their method of preparation for consumption. There is no reliable information on the number of recreational users exposed through in-water and beach activities, nor is it known how long or how frequently they are in contact with the water or beach sediment. It is not known how many dockside workers are employed at job sites along the Portland Harbor. These data are essential to calculate the value of reducing risk.
I BACKGROUND ON PORTLAND HARBOR REMEDIAL INVESTIGATION
Portland Harbor lies along the Lower Willamette River. In the early part of the 20th century Portland had established itself as a timber and manufacturing center, and so the city supported the deepening and widening of the Lower Willamette River to accommodate cargo ships. This made Portland Harbor an even more attractive base for manufacturers; the city’s industrial sector grew significantly over the subsequent decades. Today, the river and adjacent land are used in a variety of ways including industrial activities, commercial operations, transportation, recreation and cultural events. Taken together these activities are the foundation for the local economy.
Past economic activities in the Portland Harbor area have resulted in discharges of various pollutants to the Lower Willamette River. These pollutants have entered the Lower Willamette River through direct discharges and spills from manufacturers, stormwater and wastewater overflow and via upstream sources. Historically, ship building, wood treatment, gas production, manufacturing, sewage and agricultural run-off were common sources of pollution. Based on sediment samples the main pollutants are heavy metals, PCBs, pesticides, PAHs and phthalates. In more recent decades, stricter waste management policies and cleaner production technologies have worked to curtail pollution. Despite these efforts, contamination levels in river sediment were still sufficiently high in 2000 that Portland Harbor was placed on the Environmental Protection Agency’s (EPA) National Priorities List (NPL) to comply with the Comprehensive Environmental Response, Compensation, and Liability Act (CERCLA).
In the EPA’s initial assessment of Portland Harbor it was determined that there were 69 potentially responsible parties (PRPs), and now there are nearly 150 identified PRPs. The EPA entered into a consent order with a group of these PRPs known as the Lower Willamette Group (LWG). The group was tasked with preparing the Remedial Investigation Report (RI) and Feasibility Study (FS) for Portland Harbor to structure the site clean-up. Both the RI and FS studies are funded by the LWG, although they are overseen by the EPA with input from the Oregon Department of Environmental Quality (DEQ), several Native American Tribes, and other partners. The RI is intended to be a comprehensive characterization of site contamination which is used to evaluate all human and ecological health risks posed by the site. The RI is the basis used to consider clean-up options in the FS.
The study area for the RI stretches 10 miles from Willamette River Mile (RM) 1.9 to RM 11.8, just north of the city center of Portland, Oregon. The RI itself is comprised of multiple data

4
collection efforts between 2001 and 2008. The focus of the RI’s first stage was to collect data on contamination levels in biota, especially fish and shellfish tissues. In the second stage the RI collected data to characterize contamination in the surface and subsurface sediment. Data was also collected to model the flow of contaminants in case of erosion, earthquake and other hydrodynamic phenomena. The third and final round of data collection obtained samples of biota and sediment in the areas up and downstream as well as in surrounding stormwater origins inland from the harbor2.
The results of the RI indicate that the main chemicals of concern are polychlorinated biphenyls (PCBs), and to a lesser extent dioxins/furans, polycyclic aromatic hydrocarbons (PAHs), and the pesticide dichlorodiphenyltrichloroethane (DDT). An important component of the RI is the Baseline Human Health Risk Assessment (BHHRA), which characterizes the risk posed by the contaminants to humans. The RI indicates that PCBs are by far the most significant contributors to human health risk; fish consumption is the most important exposure pathway and produces the highest estimated risk. Risks to people from other exposure pathways, such as direct contact with sediment or water, are orders of magnitude lower. Well-defined areas of elevated PCBs concentrations in bottom sediments were identified at locations throughout the study area. Chemical concentrations in sediment are generally higher in deeper sediments than in the surface layer, indicating that chemical inputs have been decreasing in recent times. The results of the BHHRA are used to refine remedial action objectives and to inform decisions about clean-up of the site.
II DESCRIPTION OF POTENTIAL DREDGING SCENARIOS AT PORTLAND
HARBOR
Remediation of the Portland Harbor Site is intended to reduce human health risks by reducing sediment concentrations of PCBs (and other contaminants), thereby reducing PCBs present in fish tissue. At this time, the EPA has not yet selected the remedial action level target (RAL), the contaminant concentration level used to designate areas requiring dredging. Therefore it is difficult to estimate how much sediment will need to be dredged in order to meet targets. Absent this information we use the RI and remedial action levels at other U.S. remediation sites as a guide. Section 10.2.1.1 of the RI discusses the distribution of PCBs and presents the maps shown in figures 1 and 2 of this report (Panel 10.2-1A and Panel 10.2-1B) depicting areas with PCBs concentration levels between 0-34 ppb, 34-75 ppb, 75-150 ppb, 150-300 ppb, 300-1000 ppb and areas with concentrations above 1000 ppb. Based on the map one might infer that candidate RALs are 34, 75, 150, 300 and 1000 ppb. In a review of other U.S. remediation sites, the strictest RAL found for PCBs was 450 ppb; a summary of thresholds is presented in table 1. Consistent with these findings, we generate an estimate of dredging costs associated with a remedial action level of 300 ppb as a possible scenario—this is the criteria closest to the 450 ppb threshold used at Commencement Bay in Washington State, and for which data on the distribution of PCBs in the Portland Harbor study site are available. To put a range around the costs of dredging we also consider a stricter RAL criteria of 150 ppb and a more lenient RAL criteria of 1000 ppb, a level similar to thresholds found at other sites summarized in table 1.
2 The RI is still a draft; subsequent references to the RI mean the “Draft RI”.

5
Figure 1. Total PCBs – Surface Sediment and Abiotic Media

6
Figure 2. Total PCBs – Subsurface Sediment and Abiotic Media

7
Table 1. Summary of PCBs Contamination Thresholds at U.S. Remediation Sites
Remediation Sites PCBs Concentration Thresholds
Commencement Bay Nearshore/Tideflats 450 ppb
Fox River 1,000 ppb
Little Lake Buttes de Morts 1,000 ppb
New Bedford Harbor - Project 2 10,000 ppb
Outboard Marine - Slip #3 500,000 ppb
Outboard Marine - Upper Harbor 50,000 ppb
Reynolds Metals 1,000 ppb
Sangamo-Weston 1,000 ppb
Sheboygan River/Harbor Project 26,000 ppb
Ten-Mile/Lange/Revere Canal 1,000 ppb
White Lake - Project 2 2,000 ppb
York Oil 1,000 ppb
Source: For Fox River and Little Lake Buttes de Morts: Lower Fox River Operable Unit 1 Post-Remediation Executive Summary, Wisconsin Dept. Natural Resources Mar. 29, 2011. http://www.dnr.wi.gov/org/water/wm/foxriver/documents/OU1_Executive_Summary2011-03-29.pdf The remaining sites: Report Project Overall Status MCSS Database. Sept. 17, 2004. http://yosemite.epa.gov/r10/CLEAN-UP.NSF/PH/Technical+Documents/$FILE/Overall_Status_Summary.pdf.
The map presented in figure 1 (Panel 10.2-1A) shows the distribution of surface sediment contamination in terms of Total PCBs concentration; surface sediment is defined as the top 30 cm of sediment on the river bed. The map presented in figure 2 (Panel 10.2-1B) shows the distribution of subsurface sediment contamination in terms of Total PCBs concentration, where subsurface sediment is defined as the sediment immediately beneath the riverbed’s surface sediment. Each map is divided into polygons, and each polygon is shaded a color to denote the average total PCBs concentration within the polygon. Both figures also include a bar chart reporting the share of the study site with sediment contamination levels falling between a given range of total PCBs concentration. The RI reports that the study area covers approximately 10,777,778 square yards3. According to figure 1, 3.3% of the study area has surface sediment concentrations above 1000 ppb—this represents an area of 355,667 square yards; 5.5% of the study area has a total PCBs concentration between 300-1000 ppb, which represents an area of 592,778 square yards; and 7.5% of the study area has a total PCBs concentration between 150-300 ppb, which represents and area of 808,333 square yards.
Similarly, figure 2 shows that, 4.4% of the study area has subsurface sediment concentrations above 1000 ppb—this represents an area of 474,222 square yards; 8.7% of the study area has a total PCBs concentration between 300-1000 ppb, which represents an area of 937,667 square yards; and 12.4% of the study area has a total PCBs concentration between 150-300 ppb, which represents an area of 1,336,444 square yards.
3 Draft Final Remedial Investigation, Appendix E, Section 6.2, p. E-49.

8
To assess the volumetric quantity of sediment to be dredged, we multiply the surface area of the riverbed to be dredged by the depth to which dredging will occur. At the current time, depth to dredging remains to be determined. Absent this information we consider the depth to which other remediation sites with PCBs contamination have been dredged. We summarize the results in table 2. We observe sites dredged between ten centimeters to five feet of sediment.
Table 2. Summary of Dredging Depths at U.S. Remediation Sites
Remediation Site Dredging Depth
Fox River Top 10 cm of surface sediment
New Bedford Harbor - Project 2 1.7 - 4 ft.
Sheboygan River/Harbor Project 1 ft. where water depth > 5 ft., and top 2
ft., where water depth <5 ft.
Manitowoc River Basin 1-5 ft.
Fields Brook 2 ft.
Grand Calumet River 2 ft.
Source: Project Overall Status Report. MCSS Database. Sept. 17, 2004. http://yosemite.epa.gov/r10/CLEAN-UP.NSF/PH/Technical+Documents/$FILE/Overall_Status_Summary.pdf.
Using the surface area and depth information discussed above, we consider dredging costs under RALs of 150 ppb, 300 ppb and 1000 ppb. In all three scenarios we use total PCBs concentration level in the surface sediment layer to define dredging areas. The logic for basing the assumed RAL on surface sediment as opposed to the subsurface sediment is that most areas with surface sediment contamination have subsurface contamination; however, there are areas with subsurface contamination without surface contamination. In the latter instances dredging will disturb otherwise healthy surface sediment and so might be better served by non-dredging remediation activities. Similarly, we assume an average depth to dredging to be two and a half yards since the presence of subsurface contamination requires dredging deeper than in cases summarized in Table 2. Below we summarize the three dredging scenarios we consider:
Scenario 1: Areas with surface sediment PCBs concentration levels above 1,000 ppb are dredged to a depth of two and a half yards. This represents 889,167 cubic yards. Scenario 2: Areas with surface sediment PCBs concentration levels above 300 ppb are dredged to a depth of two and a half yards. This represents 2,371,111 cubic yards. Scenario 3: Areas with subsurface sediment concentration levels above 150 ppb are dredged to a depth of two and a half yards. This represents 4,391,945 cubic yards.

9
III REVIEW OF REMEDIATION COSTS AT OTHER SITES
A review of available information on actual and planned dredging projects across the country suggests that dredging costs will be substantial. While the average marginal cost of dredging might be as low as $70 per cubic yard, the average costs of dredging inclusive of all remediation activities may be far greater. Other costs include the cost of equipment and set-up infrastructure, cost of disposal and mitigation costs; engineering and project management costs can also be substantial. With this in mind, in this section we review the total costs of remediation sites from across the United States with PCBs as the main chemical of concern. We use the quantity dredged at each site as an indicator of the project size, and calculate the average cost of dredging, inclusive of all indirect costs.
Hudson River, NY
The Hudson River Remediation Site is one of the largest dredging projects ever undertaken. PCBs are the main contaminant and dredging is the main remediation method as the EPA placed a cap of 11% of the total project area allocated for capping. Phase I of the project took place in 2009, and dredged 283,000 cubic yards of contaminated sediment over a period of six months. According to General Electric (GE), the main Potentially Responsible Party (PRP), they have spent $560.9 million on Phase I alone, which dredged only 10.6% of the target removal level of 2.65 million cubic yards from a 40 mile section of the Upper Hudson River. Between 1947 and 1977 GE dumped approximately 1.3 million pounds of PCBs into the river.4,5,6 Lower Passaic River, NJ
The Lower Passaic River Site is contaminated with PCBs, dioxins, mercury, pesticides and heavy metals. Launched in 2011, Phase I of the remediation is planned to remove 40,000 cubic yards of contaminated sediment (the top 12 feet) and is estimated to cost $45 million. 7,8,9 Lower Fox River, WI
Between the mid-1950s and 1970, discharges from the manufacturing and recycling of carbonless copy paper contaminated this site with approximately 250,000 pounds of PCBs. Some hotspots had contamination levels in the sediment of up to 3,000 ppm. Remediation began in 2007 and continues today. So far 1.5 million cubic yards of sediment have been removed and
4 United States Environmental Protection Agency. 15 Sept. 2011. <http://www.epa.gov/hudson/>
5 Revkin, Andrew C. "G.E. Begins to Dredge Hudson for PCBs." The New York Times. 15 May 2009. Web. 15
Sept. 2011. 6 "GE Reports Cost of First Phase of Dredging." Hudson River PCBs Dredging Project. 10 May 2010. Web.
15 Sept. 2011 7 "Lower Passaic River Restoration Project." US Environmental Protection Agency. Web. 15 Sept. 2011.
8 Kluesner, David. "EPA Makes Clean-up Decision Final For First Phase of Passaic River Clean-up." US
Environmental Protection Agency. 12 Jan. 2009. Web. 21 Oct. 2011. 9 Web. 15 Sept. 2011. http://passaicremovalaction.com/.

10
150 acres of river bottom have been covered with sand. The total costs so far were estimated in March 2011 at $700 million.10,11,12,13 Little Lake Buttes de Morts, WI
This site underwent remediation from 2004 through 2009 using a combination of remediation methods: dredging, covering, and capping. In 2002 a Record of Decision (ROD) required that all sediment with PCBs concentrations greater than 1.0 ppm be removed with the goals of achieving a sediment-weighted average concentration (SWAC) of .25 ppm and eliminating PCB-related fish consumption advisories for anglers within ten years and high intake consumers within thirty years. In total, 370,000 cubic yards of contaminated sediment were removed. Prior to remediation, Walleye tissues had contamination levels of PCBs greater than 3.5 ppm. Following remediation, there was a markedly accelerated decline of PCBs levels in fish, water, and sediment. In 2010, concentrations in walleye fillets were down 73%, and 89% of the walleyes sampled had less than .05 ppm – the threshold the Wisconsin Department of Natural Resources sets for unlimited consumption. According to an estimate in 2007, the total project cost was $90-110 million. 14,15,16 Housatonic River, MA & CT
This site underwent remediation from 2002 through 2006 as a result of contamination from PCBs and other hazardous substances dumped by General Electric (GE). Prior to remediation, the average surficial concentration (0-1 ft. deep) was 21 ppm, the average concentration at all depths was 29 ppm, and the maximum was 8,635 ppm. The remediation successfully removed 92,000 cubic yards of sediment and bank soils from a 1.5 mile area of the river. By 2007, sediment concentrations were reduced by 99%, benthic invertebrate tissue concentrations were reduced 99.5%, and there was a marked increase in diversity, abundance, and biomass (including pollution-intolerant species). The clean-up cost is $84 million.17
10
Hans, Mick. "EPA Order: Begin Clean-up on Remaining Stretch of Fox River." US Environmental
Protection Agency. 14 Nov. 2007. Web. 15 Sept. 2011. 11
"Lower Fox River Operable Unit 1 Post-Remediation Executive Summary." Wisconsin Department of
Natural Resources. 29 Mar. 2011. Web. 15 Sept. 2011. 12
Hunsucker, Philip. "Federal Court Shifts $700 Million Clean-up Costs of Nation’s Largest Superfund Site to NCR and Appleton Papers." Hunsucker Goodstein & Nelson. 3 Mar. 2011. Web. 15 Sept. 2011.
13 Pastor, Susan. "Dredging Stops, Capping Continues." Fox River Current. US Environmental Protection
Agency. Summer, 2011. Web. 15 Sept. 2011. 14
"Lower Fox River Operable Unit 1 Post-Remediation Executive Summary." Wisconsin Department of
Natural Resources. 29 Mar. 2011. Web. 15 Sept. 2011. 15
Naidl, Kris. "Sixth & Final Season of Little Lake Clean-up Project to Begin in Mid-April." Little Lake Clean-up Team, 12 Mar. 2009. Web. 15 Sept. 2011.
16 "EPA Proposes Revision to Clean-up Plan for Little Lake Butte Des Morts." US Environmental Protection
Agency. Nov. 2007. Web. 15 Sept. 2011. 17
"GE/Housatonic River Site." US Environmental Protection Agency. Web. 15 Sept. 2011. <http://www.epa.gov/region1/ge/>.

11
Table 3 reports for various remediation sites the total sediment dredged or planned to be dredged, the total cost or estimated total cost of dredging, and the cost per cubic yard dredged. The median cost per cubic yard dredged across the sites considered is $807 with a range between $276/cy and $1,980/cy.
While it is difficult to evaluate the effectiveness of remediation, there are cases of successful and cost-effective remediation that shed light on best practices. The clean-up of Little Lake Buttes de Morts, for example, has one of the lowest costs per cubic yard from our sample of dredging sites, yet is also one of the most effective. A key feature of this particular remediation is that it included a balanced approach of capping, sand covering, and dredging in order to bring down
Table 3. Summary of Dredging Costs at U.S. Remediation Sites
National Sites Sediment Removed in
cubic yards
Total Cost in
millions
Cost per
cubic yard
New Bedford Harbor, MI a 14,000 $20 $1,435
Sheboygan River, WI 3,800 $2.6 (w/o disposal)
$700
Ruck Pond/Cedar Creek, WI 7,500 $7 $935
St. Lawrence River, NY 13,250 $7 (w/o disposal) $460
Waukegan Harbor, IL 32,000 and 18,000(soil)
$21 $420
Grasse River, NY 2,600 + 400 boulders $5 $1,635
Manistique Harbor, MI 117,000 – 130,000 $48 $276
Hudson River, NY Phase 1 b 283,000 $561 $1,980
Lower Passaic River, NJ c 40,000 $45 $1,125
Lower Fox River, WI d 1,500,000 $700 $450
Little Lake Buttes de Morts, WI e 370,000 $110 $300
Housatonic River, MA & CT f 92,000 $84 $913
Source: a: Nadeau, S., A National Contaminated Sediment Update, Presentation to the American Chemistry Council, May 19, 2005; b: http://www.hudsondredging.com/2010/05/10/ge-reports-cost-of-first-phase-of-dredging-2/ ,also http://www.epa.gov/hudson/; c:http://yosemite.epa.gov/opa/admpress.nsf/d10ed0d99d826b068525735900400c2a/5fb4c0a63a2388808525753c00657e01!OpenDocument; d: see table 1a, also http://www.hgnlaw.com/700millioncoststonrc.asp; e: http://www.littlelakeclean-up.com/images/2009_News_Release.pdf, also www.epa.gov/region5/clean-up/foxriver/pdf/foxriver_fs_200711.pdf; f: http://www.epa.gov/region1/ge/publiceventsandmeetings/20071128/2833330.pdf

12
estimated costs from the original proposed plan that solely involved dredging. The choice between the various remediation methods was guided by the following rules18:
1. Dredge contaminated sediment in areas with PCBs levels greater than 50,000 ppb and areas with average PCBs levels more than 10,000 ppb.
2. Place a 13-inch engineered cap over undredged sediment with average PCBs levels between 2,000 and 10,000 ppb.
3. Place a 6-inch sand cover over undredged sediment with average PCBs levels between 1,400 and 2,000 ppb.
4. Place a 3-inch sand cover over undredged sediment with average PCBs levels between 1,000 and 1,500 ppb.
5. Sample after the dredging activities are complete and either re-dredge or place a 13-inch engineered cap in areas where PCBs remain at levels greater than 5,000 ppb.
Using the data presented in table 3 as a guide we assume the cost per cubic yard dredged at Portland Harbor will be $500. We intentionally selected a cost that was less than the median value reported in Table 3 to avoid the possibility of overestimating total costs. Next, we calculate an estimate for the total cost of dredging under each scenario. The results are presented in table 4. Under scenario 1 the total estimated cost of dredging is nearly $445 million; under scenario 2 the cost of dredging is roughly $1.2 billion; and under scenario 3 the cost of dredging is over two billion dollars.
Table 4. Summary of Estimated Costs by Dredging Scenario for Portland Harbor
Scenario Contamination
layer
Threshold
(ppb)
Percentage
of
riverbed
surface
area
Depth
to be
dredged
(yards)
Total
sediment
to be
dredged
(cubic
yards)
Estimated
Costs
1 Surface 1000 3.3% 2.5
889,167 $444,583,343
2 Surface 300 8.8% 2.5
2,371,111 $1,185,555,580
3 Surface 150 16.3% 2.5
4,391,945 $2,195,972,268
IV INCREMENTAL BENEFITS OF RISK REDUCTION
The vast majority of health benefits of remediating the Portland Harbor Site are derived from a change in the risk of fish consumption. According to the remedial investigation, risks to public
18
"EPA Proposes Revision to Clean-up Plan for Little Lake Butte Des Morts." US Environmental Protection
Agency. Nov. 2007. Web. 15 Sept. 2011.

13
health from beach sediment, in-water sediment and other non-consumptive sources are extremely low19. The analysis of health benefits in the RI is measured in terms of the cancer deaths avoided by reducing excess risk from fish consumption under current contamination levels to fish consumption under target contamination levels.
Excess risk is defined as the increased risk of cancer due to the presence of a risk factor; in this analysis the risk factor is a diet including fish from Portland Harbor. Once excess risk measures are calculated for a particular fish diet, the health benefits of dredging are measured using the multiplicative product of the reduction in excess risk and the population at risk20:
���������������= ����������������������� − ����������������������× ���������������. �1�
The actual calculation of health benefits is more complicated than the above formula suggests because different segments of the population consume different quantities of fish, different types of fish, and may be more vulnerable to chemical exposures than other portions of the population. Naturally, segments of the population consuming higher levels of contaminated fish tissue will face greater excess risk of cancer from fish consumption. Likewise, excess risk from fish diets comprised of mainly resident fish will be greater than diets including migratory fish. For example, tribal fishers are assumed to consume more migratory fish, particularly salmon, than non-tribal fishers21. Finally, children are more vulnerable to chemical exposures than adults, that is, they face a higher level of excess risk from the same level of fish consumption. We account for these differences by breaking down the population at risk into subgroups based on race-ethnicity (tribal/non-tribal), age group (adult, child) and ingestion level (low, low-moderate, moderate, and high); these subgroups are enumerated in table 5.
We use eq. (1) to compute the avoided cancer cases for each subgroup, and then aggregate across subgroups to measure the total number of avoided cancer cases. The calculation can be replicated using the following formula:
��������������� = ������ !"# − �#$ %!#� × ���������&'
�(&��. �2�
Where � indicates the relevant subgroup in table 4; ���� !"# is the current level of excess risk for
the �#* subgroup; �#$ %!# is the target level of excess risk (one in a million); ��������� is the
population count of individuals in the �#* subgroup; and ∑&'�(& is a mathematical operator that sums the avoided cancer cases across all � subgroups (� = 1,… , 16�. In the subsequent sections we explain how current excess risk and the population at risk are determined for each of the sixteen subgroups.
19
Portland Harbor RI/FS, Draft Final Remedial Investigation Report. May 2, 2011. Appendix F: Baseline Human Health Risk Assessment, Table 5-199 to Table-203.
20 Excess risk at the target level is based on the EPA’s one in a million criteria.
21 Draft Remedial Investigation Report. September 23, 2009. Appendix F: Baseline Human Health Risk
Assessment. Table 3-29.

14
Calculating excess risk for each of the sixteen subgroups
The BHHRA component of the RI takes a comprehensive approach to calculating current excess risk from exposure to chemicals of concern in Portland Harbor. The first part of the BHHRA characterizes contaminant concentration levels in different mediums including beach sediment, in-water sediment, surface water, groundwater seep, fish tissue and shellfish tissue. Based on these levels, potential chemicals of concern were identified. In the second part of the BHHRA, exposure pathways were enumerated and exposure levels were calculated for each potential chemical of concern. The ultimate purpose of an exposure assessment is to evaluate the level of human contact with chemicals of concern, which can then be used to calculate current excess risk posed by the different exposure pathways. Completing such an assessment requires information on chemical concentration levels for each medium in which chemicals of concern are present, and information on the frequency and duration of contact a person will have with the media.
Table 5. Enumeration of Risk Subgroups
Subgroup Race-ethnicity Group Age Group Percentile
Ingestion
Rate
(grams/day)
1 Tribal Adult 23% 17.5
2 Tribal Adult 81% 73
3 Tribal Adult 92% 142
4 Tribal Adult 95% 175
5 Tribal Combined Child, Adult 23% 7, 17.5
6 Tribal Combined Child, Adult 81% 31, 73
7 Tribal Combined Child, Adult 92% 60, 142
8 Tribal Combined Child, Adult 95% 73, 175
9 Non-tribal Adult 90% 17.5
10 Non-tribal Adult 95% 50
11 Non-tribal Adult 97% 73
12 Non-tribal Adult 99% 142
13 Non-tribal Combined Child, Adult 90% 7, 17.5
14 Non-tribal Combined Child, Adult 95% 21, 50
15 Non-tribal Combined Child, Adult 97% 31, 73
16 Non-tribal Combined Child, Adult 99% 60, 142
Source: Percentiles and Ingestion rates were imputed based on Portland Harbor RI/FS, Draft Final Remedial Investigation Report. May 2, 2011. Appendix F: Baseline Human Health Risk Assessment: Table 5-67 to Table 5-169; and "A Fish Consumption Survey of the Umatilla, Nez Perce, Yakama and Warm Springs Tribes of the Columbia River Basin", Technical Report 94-3, October, 1994, Columbia River Inter-Tribal Fish Commission. Note: Some of these ingestion levels were not considered in the RI. Groups were added in order to more accurately estimate the health benefits of dredging.
15
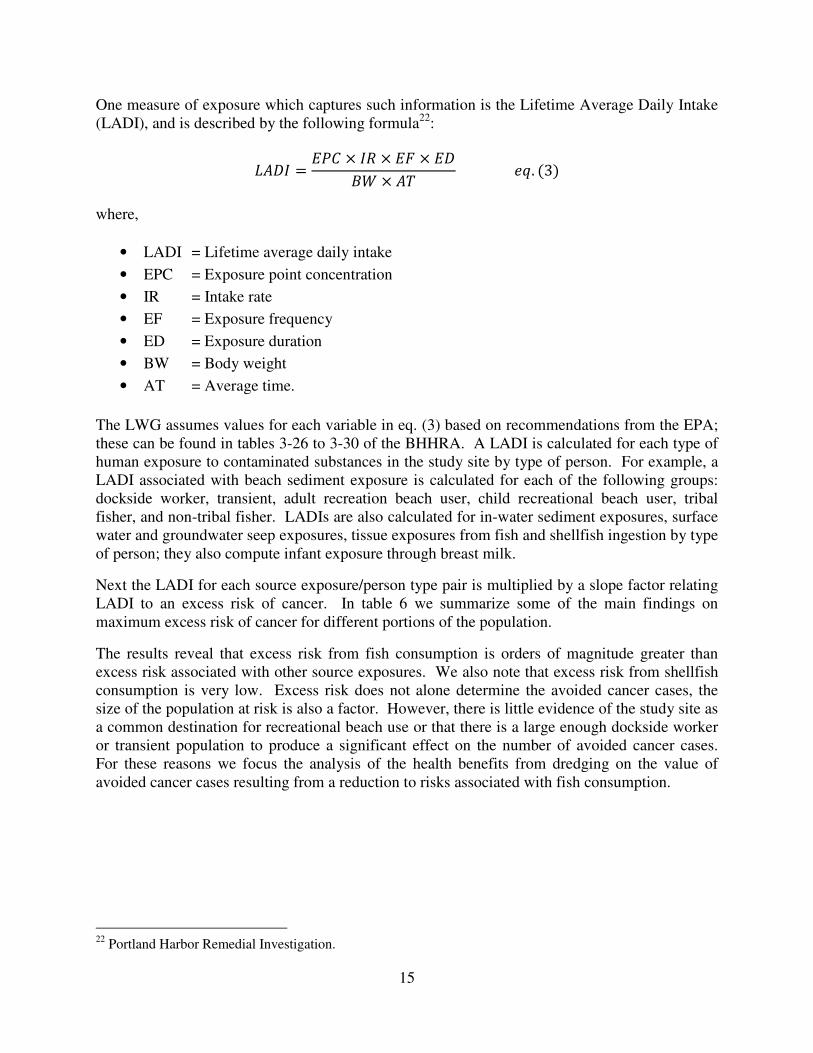
One measure of exposure which captures such information is the Lifetime Average Daily Intake (LADI), and is described by the following formula22:
/�01 = 234 × 15 × 26 × 2078 × �9 ��. �3�
where,
• LADI = Lifetime average daily intake
• EPC = Exposure point concentration
• IR = Intake rate
• EF = Exposure frequency
• ED = Exposure duration
• BW = Body weight
• AT = Average time.
The LWG assumes values for each variable in eq. (3) based on recommendations from the EPA; these can be found in tables 3-26 to 3-30 of the BHHRA. A LADI is calculated for each type of human exposure to contaminated substances in the study site by type of person. For example, a LADI associated with beach sediment exposure is calculated for each of the following groups: dockside worker, transient, adult recreation beach user, child recreational beach user, tribal fisher, and non-tribal fisher. LADIs are also calculated for in-water sediment exposures, surface water and groundwater seep exposures, tissue exposures from fish and shellfish ingestion by type of person; they also compute infant exposure through breast milk.
Next the LADI for each source exposure/person type pair is multiplied by a slope factor relating LADI to an excess risk of cancer. In table 6 we summarize some of the main findings on maximum excess risk of cancer for different portions of the population.
The results reveal that excess risk from fish consumption is orders of magnitude greater than excess risk associated with other source exposures. We also note that excess risk from shellfish consumption is very low. Excess risk does not alone determine the avoided cancer cases, the size of the population at risk is also a factor. However, there is little evidence of the study site as a common destination for recreational beach use or that there is a large enough dockside worker or transient population to produce a significant effect on the number of avoided cancer cases. For these reasons we focus the analysis of the health benefits from dredging on the value of avoided cancer cases resulting from a reduction to risks associated with fish consumption.
22
Portland Harbor Remedial Investigation.

16
Summary of excess risk from fish consumption
We calculate benefits of excess risk reduction from multi-species fish consumption for tribal adults, tribal children, non-tribal adults and non-tribal children under four different scenarios. The assumptions defining each scenario are twofold. First, consumers can eat the whole fish body or just the fish fillet. Second, we assume the contamination level in the fish consumed equals the fish specific sample mean or we assume the contamination level equals the 95% upper confidence limit (UCL) of the fish specific sample mean. These four scenarios are presented in table 7.
Table 6. Summary of Maximum Excess Risk Factors for Source Exposure-Person Type
Receptor Population Exposure Media
Maximum
Estimated
Cancer Risk
Adult recreational beach user a Beach Sediment, Surface Water 4 x 10⁻⁶
Child recreational beach user a Beach Sediment, Surface Water 4 x 10⁻⁵
Dockside worker b Beach Sediment 9 x 10⁻⁵
Transient a Beach Sediment, Surface Water,
Groundwater Seep 1 x 10⁻⁶
Adult fisher non-tribal c Multi-Species Fish Consumption 1 x 10⁻²
Child fisher non-tribal c Multi-Species Fish Consumption 1 x 10⁻²
Adult fisher tribal c Multi-Species Fish Consumption 2 x 10⁻²
Child fisher tribal c Multi-Species Fish Consumption 2 x 10⁻²
Any shellfisher a Shellfish Consumption 7 x 10⁻⁴
Breastfeeding infant of a tribal fisher a
In-Water Sediment, Fish Consumption
2 x 10⁻²
Transient a In-Water Sediment, Surface Water 4 x 10⁻⁵
Sources: a: Portland Harbor RI/FS, Draft Final Remedial Investigation Report. May 2, 2011. Appendix F: Baseline Human Health Risk Assessment: Table 5-199 to Table 5-203. b: Same source as 'a': Table 20. c: Portland Harbor RI/FS, Draft Final Remedial Investigation Report. May 2, 2011. Appendix F: Baseline Human Health Risk Assessment: Table 5-67 to Table 5-169.
Table 7. Fish Consumption Scenarios
Scenario Fish Parts
Consumed
Exposure
Level
A Whole Body 95 % UCL
B Whole Body Mean
C Fillet 95% UCL
D Fillet Mean

17
A number of assumptions are common to each scenario. We summarize the main assumptions here:
• Daily ingestion levels: The EPA recommends using the National Fish Consumption
Survey as a basis for imputing the 90th, 95th, 97th, and 99th percentiles of
freshwater/estuarine fish and shellfish consumption among non-tribal fishers. For non-
tribal adults these percentiles correspond to 17.5 g/day, 50 g/day, 73 g/day23 and 142
g/day, respectively. For non-tribal children the corresponding consumption levels are 7
g/day, 21 g/day, 31 g/day and 60 g/day.
To determine reasonable Portland Harbor fish consumption among Portland tribal residents, the RI utilizes 175 grams/day as the 95th percentile. This is based on the EPA’s recommendation of using the results of a 1994 survey conducted by the Columbia River Inter-Tribal Fish Commission (CRITFC): “A Fish Consumption Survey of the Umatilla, Nez Perce, Yakama, and Warm Springs Tribes of the Columbia River”
In addition to risk reduction experienced by consumers who eat more than 175 g/day of fish from Portland Harbor, the benefits of remediation will accrue to tribal fish consumers who eat less than 175 g/day. To account for this we also consider tribal daily ingestion levels of 17.5 g/day, 73 g/day and 142 g/day. Based on the CRITFC survey these daily consumption levels translate into the 95th, 92nd, 81st, and 23rd percentiles of fish consumption among American Indians in Oregon. For tribal children the corresponding consumption levels are 7 g/day, 31 g/day, 60 g/day, and 73 g/day. For each of non-tribal adults, non-tribal children, tribal adults and tribal children we reference consumption levels in ascending order as the low, low-moderate, moderate and high ingestion levels. To put these consumption levels in perspective consider their equivalency in terms of ounces and meals per month as presented in table 8.
23
The RI uses 73 g/day based on a creel study in the Columbia Slough. This figure corresponds to the 97 percentile in the National Fish Consumption Survey [see p. 5-6 and 5-9].
Table 8. Consumption levels in terms of ounces & meals per month
Ingestion Level
(grams/day)
Amount Consumed
in a Month (oz.)
# of 8 ounce
Meals/ Month
175 188 23
142 152 19
73 78 10
60 64 8
50 54 7
31 33 4
21 23 3
17.5 19 2
7 8 1

18
• Lifetime patterns of consumption: Non-tribal adults are assumed to consume their designated daily ingestion level every day for thirty years. Non-tribal children are assumed to consume their designated daily ingestion level every day for six years, and then consume the designated adult daily ingestion level every day for twenty-four years.
Tribal adults are assumed to consume their designated daily ingestion level every day for seventy years. Tribal children are assumed to consume their designated daily ingestion level every day for six years, and then consume the designated adult daily ingestion level every day for sixty-four years.
• Composition of multispecies diet: The non-tribal fisherman’s diet for both adults and children is assumed to be 25% for each of brown bullhead, black crappie, carp and smallmouth bass. Tribal fisherman’s diet for both adults and children is assumed to be 12.4% for each of brown bullhead, black crappie, carp and smallmouth bass, 38% salmon, 7% lamprey and 5% sturgeon.
Using these sets of assumptions potential excess cancer risks were estimated for each of the sixteen subgroups by each chemical and fish combination. The fish species considered are those comprising the multispecies’ diets. The chemicals considered include but are not limited to metals, phthalates, semi-volatile organic compounds, phenols, polychlorinated biphenyls (PCBs), dioxin/furans, and pesticides. In a first step, the chemical concentration found in sampled fish was used to form an exposure point concentration (EPC) estimate, and subsequently a LADI estimate. To calculate the excess risk, each chemical’s LADI was multiplied by a slope factor obtained from the medical literature, the formula is given by:
2��������� = /�01 × �����;������. �4�
The estimates of the excess cancer risk were summed across chemicals to obtain an aggregate measure of excess risk for each of the sixteen subgroups from multi species fish consumption. The cumulative excess risks are presented in table 9.
Individuals at highest risk are tribal adults and children in Scenario A who consume the whole fish with the 95% UCL contamination level. Those least at risk are non-tribal adults and children in Scenario D who consume the fillet with the mean exposure level. Target excess risk is based on historical background levels of excess risk or, if no reliable background excess risk estimate is available, then the default target of one in a million is used. The remedial investigation has no background measures of exposure to carcinogenic contaminants so the latter target is used in the calculation of target excess risk.

19
Table 9. Summary of Subgroup Excess Risk by Consumption Scenario
Age group Subgroup Ingestion Rate
(grams/day) Excess
risk Subgroup
Ingestion Rate
(grams/day) Excess
risk
Tribal Non-tribal
Scenario A: Whole Body, 95% UCL
Adult
1 17.5 0.002 9 17.5 0.002 2 73 0.008 10 50 0.006 3 142 0.016 11 73 0.007 4 175 0.02 12 142 0.01
Combined Child & Adult
5 7, 17.5 0.002 13 7 , 17.5 0.001 6 31, 73 0.008 14 21, 50 0.004 7 60, 142 0.016 15 31 , 73 0.006 8 73, 175 0.02 16 60, 142 0.01
Scenario B: Whole Body, Mean
Adult
1 17.5 0.0005 9 17.5 0.0004 2 73 0.002 10 50 0.001 3 142 0.004 11 73 0.002 4 175 0.02 12 142 0.01
Combined Child & Adult
5 7, 17.5 0.0005 13 7 , 17.5 0.0004 6 31, 73 0.002 14 21, 50 0.001 7 60, 142 0.004 15 31 , 73 0.002 8 73, 175 0.005 16 60, 142 0.004
Scenario C: Fillet, 95% UCL
Adult
1 17.5 0.001 9 17.5 0.001 2 73 0.004 10 50 0.003 3 142 0.008 11 73 0.005 4 175 0.01 12 142 0.009
Combined Child & Adult
5 7, 17.5 0.001 13 7 , 17.5 0.001 6 31, 73 0.004 14 21, 50 0.004 7 60, 142 0.008 15 31 , 73 0.006 8 73, 175 0.01 16 60, 142 0.01
Scenario D: Fillet, Mean
Adult
1 17.5 0.0002 9 17.5 0.0002 2 73 0.0008 10 50 0.0006 3 142 0.002 11 73 0.001 4 175 0.002 12 142 0.001
Combined Child & Adult
5 7, 17.5 0.0003 13 7 , 17.5 0.0002
6 31, 73 0.001 14 21, 50 0.001
7 60, 142 0.002 15 31 , 73 0.001
8 73, 175 0.003 16 60, 142 0.002
Source: Portland Harbor RI/FS, Draft Final Remedial Investigation Report. May 2, 2011. Appendix F: Baseline Human Health Risk Assessment: Table 5-67 to Table 5-169.

20
Calculating population at risk for each of the sixteen subgroups
Health benefits are also dependent on the size of the population at risk. In this section we describe how we estimate the number of individuals who may be at risk for each of the sixteen subgroups.
We start with our method of estimating the size of each tribal subgroup. Based on the 2010 Census, Portland, Oregon there were 14,262 persons identified as American Indian and Alaskan Native; and 19.1% of the general population was under 18 years old24. Assuming the same percentages in 2011, the current population of American Indians and Native Alaskans living in Portland is estimated to be 11,538 adults and 2,724 children. We assume the distribution of fish consumption among Portland American Indians follows that described in table 10. From this table we can compute the share of the American Indian adults and children consuming at the low, moderate, moderate-high, and high ingestion levels. For example, the share of tribal adults consuming at the low ingestion level is the difference between the percentiles associated with low and moderate-low consumption, that is, 0.58 (=.81-.23). The population of Portland American Indians consuming at the low ingestion level is simply the product of the total American Indian population in Portland and the share consuming at the low ingestion level. We report the relevant tribal populations by ingestion levels in table 10.
24
The combined child, adult calculation relies on consumption as child for six years. We err on the conservative side and use 18 as a cut-off. For example, under the EPA’s framework someone who is 17 will only benefit from one year of risk reduction as a child, not six years.
Table 10. Tribal Population at Risk Based on CRITFC Survey
Age group Ingestion level
subgroup
Share of population
by ingestion level
subgroup
Population at risk by
ingestion level
subgroup
Adult pop.: 11,538
Low 0.584 6,738
Moderate-Low 0.11 1,269
Moderate 0.028 323
High 0.05 577
Child pop.: 2,724
Low 0.584 1,591
Moderate-Low 0.11 300
Moderate 0.028 76
High 0.05 136
Source: Data is based on the 2010 Census; weights are based on the CRITFC survey.

21
The estimation of non-tribal fishers is slightly more complicated. We assume that Portland anglers and their families are the only people who potentially consume fish and/or shellfish from Portland Harbor since in the ten mile stretch where dredging would occur there is currently no commercial fishing. To catch fish in Portland Harbor requires a license, and fines are levied if an angler is caught fishing without one. Therefore, the number of individuals with fishing licenses living in the Portland Harbor vicinity plus their family members serve as a proxy for the number of individuals who potentially consume fish from Portland Harbor. One concern with this approach is that there are transients and others who will not bother to purchase a fishing license. However, transients and other unlicensed anglers may be far less likely to use fish from the Portland Harbor as a regular food source over their lifetimes. Further, our assumptions are sufficiently conservative so that transients and unlicensed anglers are not cause for concern. For instance, a report prepared for the Oregon Department of Fish and Wildlife on a 2005-06 Licensed Angler survey25 indicates that only 77% of licensed anglers had actually fished in the past 12 months. The same reports records that warmwater game fish anglers more often release than keep the warmwater game fish26 they catch. In this report we assume that all licensed anglers have actually fished in the past twelve months, and that all licensed anglers are catching for consumption.
According to the Oregon Department of Fish and Wildlife there were on average 43,445 licensed anglers in Multnomah County from 2001 to 2010 - the county in which Portland Harbor resides. In our calculation of the number of avoided cancer cases, the minimum number of licensed anglers (40,329 persons) of all years between 2001 and 2010 is utilized because the cancer risk scenarios are only applicable to individuals consuming over a long period of time. In other words, if someone only held a license for a year or two, they are not consuming over a period of time long enough to be considered at risk of cancer.
The data for the number of licensed anglers includes all anglers in Multnomah County so we multiply 40,329 by the share of the Multnomah County population residing in Portland to estimate the number of anglers in Portland. This results in an estimate of 32,263 licensed anglers in Portland. We multiply the total number of Portland licensed anglers by the average household size in Portland (2.27 persons per household) and obtain an estimate of 73,237 people who potentially regularly consume fish from Portland. To separate this population into adults and children we assume this subpopulation has the same distribution as the year 2010 general population in Portland—19.1%. Therefore, 19.1% of potential Portland Harbor fish consumers are assumed to be children. Based on this assumption, there are 59,249 potential adult fish consumers and 13,988 potential child fish consumers. These counts are inclusive of tribal adult and tribal child fish consumers. To avoid double counting of tribal fish consumers in our health benefits calculation we subtract the number of tribal adult fish consumers estimated in table 10 from the total number of potential adult fish consumers in Portland; our estimate of potential
25
“Oregon Licensed Angler Survey” (2006) by Responsive Management for the Oregon Department of Fish and Wildlife, p. 10.
26 Includes fish such as largemouth and smallmouth bass, sunfish, carp, perch, and crappie. Notably,
warmwater game fish are the resident fish in Portland Harbor with the highest PCBs levels. The RI assumes these warmwater game fish constitute a relatively large share of fish diets. If these fish are commonly released rather than kept for consumption then cancer risks reported in the RI may be over-estimated.

22
adult non-tribal fish consumers is 47,711. Similarly, we subtract the number of tribal child fish consumers from the total number of potential child fish consumers in Portland; our estimate of potential child non-tribal fish consumers is 11,264.
We assume the distribution of fish consumers among Portland anglers and their households is the same as the distribution found in the EPA’s National Survey of Fish Consumption. As done for the tribal groups, we can compute the total number of non-tribal adults and non-tribal children consuming at the low, moderate, moderate-high, and high ingestion levels. For example, the share consuming at the low ingestion level is the difference between 0.90 and 0.95, that is, 0.05. The population of Portland anglers and their families consuming at the low ingestion level is simply the multiplicative product of their population in Portland and the share consuming at the low ingestion level. We report the relevant non-tribal populations by ingestion levels in table 11.
Calculating incremental benefits of risk reduction
Using the results in tables 9, 10 and 11 we compute the total number of avoided cancer cases under different sets of assumptions as reported in table 12. These cancer cases are avoided over a lifetime so we divide the avoided cancer cases by 70 to obtain the average annual cancer cases avoided. In table 13 we report the total avoided cancer cases and the average annual avoided cancer cases.
To monetize the health benefits of risk reduction, we assume all cancer cases are fatal, and based on the EPA’s 2011 value of $8,238,540 per life, assign a value to deaths averted. We assume a discount rate of 5% to compute a Present Value (PV), and assume risk reduction occurs in 2020. To summarize, the formula to calculate benefits for each subgroup is given by the expression:
Table 11. Non-tribal Population at Risk Based on National Survey
Age group Ingestion level
subgroup
Share of population
by ingestion level
subgroup
Population at risk
by ingestion level
subgroup
Adult pop.: 47,711
Low 0.05 2,386
Moderate-Low 0.02 954
Moderate 0.02 954
High 0.01 477
Child pop.: 11,264
Low 0.05 563
Moderate-Low 0.02 225
Moderate 0.02 225
High 0.01 113
Source: Data is based on the 2010 Census and administrative data from the Oregon Fish and Wildlife Service.

23
� � 11 + ��
�>!$ ?@A&&� ∗ ����������ℎ����D��� ∗ 8,238,540��. �5�@AHA
>!$ (@A@A
The total benefit of avoided cancer deaths from remediation of the Portland Harbor Site is the sum of these benefits across all subgroups. Table 13 reports the PV of avoided cancer deaths by group. These PVs display a large range which illustrates the uncertainty associated with health benefits from dredging.
Table 12. Total Avoided Tribal Cancer Cases by Scenario
Ingestion Rate
Low Low-
Moderate Moderate High
Avoided
Cancer
Cases
Scenario A: Whole Body, 95% UCL
Tribal Adult 13.47 10.59 5.24 11.54 40.84
Tribal Combined Child/Adult 3.18 2.50 1.24 2.72 9.64
Non-tribal Adult 2.38 3.82 5.72 4.77 16.69
Non-tribal Combined Child/Adult 1.13 1.35 1.58 1.13 5.18
Scenario B: Whole Body, Mean
Tribal Adult 3.36 2.65 1.31 2.88 10.20
Tribal Combined Child/Adult 0.79 0.62 0.31 0.68 2.41
Non-tribal Adult 0.95 0.95 1.91 1.43 5.24
Non-tribal Combined Child/Adult 0.22 0.23 0.45 0.45 1.35
Scenario C: Fillet, 95% UCL
Tribal Adult 6.73 5.29 2.62 5.77 20.41
Tribal Combined Child/Adult 1.59 1.25 0.62 1.36 4.82
Non-tribal Adult 2.38 2.86 4.77 4.29 14.31
Non-tribal Combined Child/Adult 0.56 0.90 1.35 1.13 3.94
Scenario D: Fillet, Mean
Tribal Adult 1.34 1.06 0.52 1.15 4.08
Tribal Combined Child/Adult 0.48 0.37 0.19 0.41 1.44
Non-tribal Adult 0.47 0.57 0.67 0.48 2.19
Non-tribal Combined Child/Adult 0.11 0.16 0.20 0.23 0.70

24
V. DISCUSSION OF NON-HUMAN HEALTH BENEFITS
There exist other potential sources of incremental benefits from a remediation. For example, one might consider the value of increased biodiversity and ecosystem quality, improved recreational opportunities, and higher property values in the vicinity of clean-up. For several reasons, we argue that these other potential benefits are inconsequential in terms of the magnitude of welfare benefits from remediation; or they are already included in our benefits analysis.
In terms of biodiversity and ecosystem improvements there is little evidence that plant or animal species counts would be affected by remediation. Oregon species that would face health risk in Portland Harbor include the mink, river otter, osprey, hooded merganser, spotted sandpiper and the benthic invertebrate community; of these, the mink and river otter would face the greatest health risk according to the Baseline Ecological Risk Assessment prepared by the LWG. The Portland Harbor study area is not an important habitat for these species. The Baseline Ecological Risk Assessment reports that mink and river otter have not been reported in heavily urbanized study area, although both species have been collected in other parts of the Multnomah Channel27 where more natural bank and upland conditions exist. Ultimately, there is no evidence that counts of these species would change much with remediation. In summary, the fact that there is other habitat for these species greatly reduces the value of Portland Harbor in terms of species conservation. Furthermore, the considerable uncertainty in how remediation would affect species’ counts implies a significant discount on whatever species conservation value does exist.
Another potential form of benefits comes through incremental changes in the value of recreational use of Portland Harbor. However, the study area has historically been and continues to be an industrial area, which makes it less desirable as a swimming destination even if remediation occurs. As such, other natural swimming holes have been utilized, or swimming pool facilities have been developed. Access to these swimming alternatives reduces the incremental value of Portland Harbor as a swimming destination. Moreover, there are currently no restrictions or Oregon Health Authority advisories on swimming in the Portland region of the Willamette River except when rainfall events have caused overflows from municipal combined
27
Appendix E: Baseline Ecological Risk Assessment, Portland Harbor RI/FS Remedial Investigation Report Draft. Oct. 27, 2009.
Table 13. Present Value of Total Avoided Cancer Death by Scenario
Scenario
Total
Avoided
Cancer
Cases
Annual
Avoided
Cancer
Cases
Present Value
of Avoided
Cancer
Deaths
Scenario A: Whole Body, 95% UCL 72.35 1.03 $111,663,124
Scenario B: Whole Body, Mean 19.21 0.27 $29,639,882
Scenario C: Fillet, 95% UCL 43.48 0.62 $67,108,765
Scenario C: Fillet, Mean 8.41 0.12 $12,975,072
25
sewers28. Thus, the remediation will not affect the opportunity to swim in the Willamette River near Portland Harbor. All considered, there is considerable uncertainty in how a Portland Harbor remediation would affect swimming utilization at the site—this uncertainty acts to discount the incremental value of recreational use.
Finally, one might argue that a Portland Harbor remediation would realize a benefit through higher property values. This argument is empirically unfounded. Research published in the Quarterly Journal of Economics, one of the leading economics journals, has shown that Superfund clean-ups have uncertain impacts on property values, and the average effect of clean-up on property values is not statistically distinguishable from zero29. This is not an argument that Superfund clean-ups cannot have positive impacts—residential properties immediately adjacent to Superfund clean-up sites can benefit. However, much of the Portland Harbor Site is lined with land that is in industrial or other non-residential uses; therefore, residential properties are not likely to accrue benefits from remediation. It is also important to recognize that property values are a function of local amenities. Even if Superfund clean-up has an impact on property values, then it is through its effect on the local amenities provided by Portland Harbor. As we have argued, the only probable economically significant benefit to local amenities from remediation is through the health benefits of risk reduction from fish consumption. If there are changes in property values as a result of clean-up, then it would reflect benefits to local amenities such as the health benefits for which we have already explicitly accounted.
VI. REGIONAL ECONOMIC IMPACTS
The cost of remediation will be borne by firms in the Portland area. The potential cost of remediation is significant; Section II of this report indicates that cleanup costs will be between $440 million and $2.2 billion depending on the dredging requirements ultimately selected by the EPA. In this section we consider how these expenditures will affect hiring by the firms paying the costs of remediation, as well as spillover effects into the regional economy.
Potential sources of job loss are important to consider anywhere, but are especially salient in the Portland Metro Area. According to a 2010 report published by the Portland Business Alliance, the Portland-Vancouver-Hillsboro regional economy has lagged behind other similar metropolitan areas across the U.S. For example, average wages in the area have steadily fallen in past decades in a way that mimics rustbelt cities such as Cleveland and Pittsburgh.30 Since 1997, the same study reports that the Multnomah County has lost over 26,000 private sector jobs, mainly in the manufacturing sector.
To assess the job losses associated with assigning cleanup expenditures to local firms, we use the regional economic impact analysis tool, IMPLAN. The IMPLAN model relies on a mathematical representation of the economy that describes the relationships among industries,
28
“Fact Sheet: Is it safe to swim in the Willamette River in Portland?”. 2011. State of Oregon, Department of Environmental Quality. http://www.deq.state.or.us/wq/pubs/factsheets/willamette/09NWR003.pdf.
29 Greenstone, Michael and Justin Gallagher. 2008. “Does hazardous waste matter? Evidence from the housing
market and the Superfund Program”. Quarterly Journal of Economics. Vol. 123(30), p. 951-1003. 30
Portland Business Alliance. (2010). 2010: A Check-Up on the Portland Region’s Economic Health.

26
consumers, government and foreign suppliers in order to derive the economy-wide impacts of changes in a specific industry. Embedded in the model are average input purchase coefficients that describe the mix of goods, services and labor that are required to produce a unit of output; that is, how the output of one industry is used as an input in other related industries. The resulting input-output coefficients represent what economists refer to as production functions.31
The IMPLAN model disaggregates the US economy into 440 unique sectors and allows for regional detail down to the county level. The model can be used to estimate the direct, indirect and induced impacts on employment and other regional economic impacts as a result of changes generated from new investments or costs in a particular industry or compilation of industries.32 The direct effect captures the initial change in economic activity resulting from the new investment or cost. The indirect effect reflects changes in economic activity that are stimulated by the direct costs in industries that supply inputs to the sector of initial change. For example, decreased spending on the synthesis of chemicals used in manufacturing goods would be an indirect effect of decreased final output of manufacturing goods using the chemicals. The induced effect captures the changes in economic activity that occur when decreased earnings resulting from the direct and indirect changes in economic activity are not available for local goods and services; for instance, when workers at a production facility spend less money on groceries, clothing, financial services, real estate, and healthcare. The total economic impact is the sum of these direct, indirect and induced effects.
An argument can also be made that the remediation effort will be a stimulus to the local economy. However, it is difficult to quantify these impacts without knowing if money spent on the remediation will go to the regional economy. For instance, construction equipment and workers as well engineering firms may be sourced from outside the Portland community. In such a scenario there would be a relatively small regional stimulus effect relative to the costs borne by companies in the community.
For the purpose of generating an approximate magnitude of losses facing firms paying for remediation, we assume a remediation scenario based on scenario 2 in table 4. In this scenario, areas of Portland Harbor with PCBs concentration levels above 300 ppb will be dredged to a depth of 2.5 yards at an estimated cost of $500/cubic yard. This scenario results in costs of $1.2 billion, and we assume these costs are spread evenly over a ten year period. In the IMPLAN analysis this cost burden is assumed to result in an equivalent reduction in spending on production inputs.
As suggested, the IMPLAN tool accounts for relationships underlying different sectors of the economy. For example, a cost to the ship building and repairing sector results in different economic impacts than would result from the same cost to the semiconductor manufacturing sector. We assume the composition of sectors which will face remediation costs in Portland is
31
The production functions used in IMPLAN are based on the U.S. Bureau of Economic Analysis’ (BEA’s ) Benchmark Input-Output Accounts.
32 Final Demand is the demand of units external to the industrial sectors that constitute the producers in the
economy, e.g., households, government and foreign trade. (Miller and Blair, 1985). Output represents the value of industry production.

27
represented by the firms forming the Lower Willamette Group33. Under these assumptions we report the regional economic impacts generated by reducing output in terms of jobs lost.
Table 14. Annual Employment Impact of Remediation Expenditures
Source Change in Employment
Direct -421
Indirect -286
Induced -206
Total -913
Notes: Employment numbers are based on permanent full-time positions.
The results of table 14 suggest that over 900 full-time jobs will be lost in Multnomah County each year the remediation is underway. Of this total, 421 jobs are lost in the firms directly responsible for funding the cleanup, 286 jobs are lost in industries providing inputs to the PRPs, and 206 are lost in the region as a result of lost household income.
To the extent that firm managers finance cleanup expenditures by reducing investments in new technologies or lines of business (or even in deferred maintenance), there could be longer-term productivity losses that are not captured in the IMPLAN analysis. These productivity losses would be a lasting drag on the regional economy, and could even affect the competitive position of the PRPs and the firms with which they do business.
A large-scale dredging and cleanup program in the Portland Harbor would also create temporary positions that would, to some degree, offset the losses described in Table 14. However, these job gains would last only as long as the cleanup, and would be filled to some degree by firms located outside the Portland region. It is important to note that there are economic impacts relating to government entities who are PRPs—these entities include the City of Portland, Port of Portland and the U.S. Government. The cost of cleanup will have a significant effect on these entities through its impact on taxpayers.
VII. CONCLUDING REMARKS
The economic benefits of remediation at the Portland Harbor Site result predominantly from reductions in human health risks associated with consumption of fish caught in the area. We measure the benefits of remediation by comparing the level of health risks before and after clean-up. That is, we measure the incremental benefits of remediation in order to evaluate them in relation to costs. Our measure of benefits is the value of reduced incidence of cancer.
33
The LWG is formed of 12 firms, the City of Portland and the Port of Portland; we exclude the latter two when constructing the composition of sectors that would be affected by the remediation.

28
Benefits of remediation due to human health risk reductions do not accrue to all segments of the population in identical amounts because fishing and fish consumption patterns vary across segments of the population. When calculating benefits we distinguish between children and adults, tribal and non-tribal, and ingestion levels among people who consume fish from Portland Harbor. Our benefits estimation is highly conservative in that we assume that all cancer cases are fatal, that remediation is successful in achieving the EPA’s one in a million excess cancers, that the population at risk exceeds 75,000 people and all fish consumed by this population consists entirely of fish caught in Portland Harbor and is either prepared in a manner that does not reduce tissue contaminant levels or eaten raw. We also assume that fish consumers ignore fish advisories regarding the consumption of resident fish. Even under these highly conservative assumptions, the incremental benefits of remediation are far lower than the costs. In the extreme scenario in which we assume all fish consumers eat the whole body rather than fillets, and all fish have contamination levels at the 95% upper confidence limit, the monetized health benefits of dredging due to reduced cancer incidence is only $112 million. However, if individuals consume fish fillets with mean contamination levels then benefits of remediation are just under $13 million over a 70 year period.
Our analysis of remediation costs suggests that dredging expenditures could be as high as two billion dollars under an assumed clean-up threshold of 150 ppb. Under a less stringent RAL of 300 ppb, the cost estimate is still over one billion dollars. This estimate, though uncertain, suggests a wide disparity between projected costs and benefits of a dredging based remediation targeting all areas with surface contamination exceeding 300 ppb. There may be ways to reduce the costs of remediating Portland Harbor that achieve nearly the same level of health benefits. Reducing the depth of dredging or targeting dredging to areas of high contamination are two clear ways to reduce costs. Other approaches to clean-up such as capping contaminated areas could also reduce costs, and may be sufficient to reach remediation objectives.
From a policy perspective, economic analysis should be used to inform the choice of remediation strategy in Portland Harbor. Only through economic analysis is it possible for decision makers to compare the costs of remediation with the actual benefits being produced by remediation. To measure benefits, it is necessary to know how many and what types of people participate in activities that expose them to contaminants. While the LWG has developed an enormous quantity of information to characterize the Portland Harbor Site, there remain significant gaps in the data required to accurately measure the benefits and costs of clean-up. In particular, there is no reliable information on the number of consumers in the Portland area who are actually eating fish and shellfish caught in the harbor. Nor is there information on the quantities or types of fish being consumed, and there is no information on the parts of fish being consumed or their method of preparation for consumption. There is no reliable information on the number of recreational users exposed through in-water and beach activities, nor is it known how long or how frequently they are in contact with the water or beach sediment. It is not known how many dockside workers are employed at job sites along the Portland Harbor. Gathering such information is vital to knowing what will actually be achieved from remediation.


