+ All Categories
Home > Documents > Economic Importance of Agriculture for Sustainable Development and Poverty Reduction

Economic Importance of Agriculture for Sustainable Development and Poverty Reduction

Date post: 03-Feb-2022
Category:
Upload: others
View: 5 times
Download: 0 times
Share this document with a friend
42
This paper was first presented to the Working Party on Agricultural Policy and Markets, 17-20 May 2010. Reference: TAD/CA/APM/WP(2010)22. Global Forum on Agriculture 29-30 November 2010 Policies for Agricultural Development, Poverty Reduction and Food Security OECD Headquarters, Paris Economic Importance of Agriculture for Sustainable Development and Poverty Reduction: The Case Study of Vietnam Dalila Cervantes-Godoy, OECD Secretariat, [email protected] ; Joe Dewbre, OECD Secretariat, [email protected]
Transcript

This paper was first presented to the Working Party on Agricultural Policy and Markets, 17-20 May 2010. Reference: TAD/CA/APM/WP(2010)22.

Global Forum on Agriculture

29-30 November 2010

Policies for Agricultural Development, Poverty Reduction

and Food Security

OECD Headquarters, Paris

Economic Importance of Agriculture for Sustainable Development and Poverty Reduction: The Case Study of Vietnam Dalila Cervantes-Godoy, OECD Secretariat, [email protected]; Joe Dewbre, OECD Secretariat, [email protected]

2

3

TABLE OF CONTENTS

ECONOMIC IMPORTANCE OF AGRICULTURE FOR SUSTAINABLE DEVELOPMENT AND

POVERTY REDUCTION: THE CASE STUDY OF VIETNAM .................................................................. 5

1. Economic and policy context ................................................................................................................... 5 Macroeconomic and trade policy reforms ................................................................................................ 6 Economic performance ............................................................................................................................ 7

2. Agricultural policy reforms and sector performance ............................................................................. 10 Land tenure reforms ............................................................................................................................... 11 Market reforms ....................................................................................................................................... 13 Agricultural research and development .................................................................................................. 15 Agricultural performance ....................................................................................................................... 16

3. Poverty in Vietnam ................................................................................................................................ 18 What is poverty? ..................................................................................................................................... 18 Poverty trends in Vietnam ...................................................................................................................... 19

4. Agriculture‟s contribution to poverty reduction in Vietnam.................................................................. 27 Method of analysis and data ................................................................................................................... 28 Analysis .................................................................................................................................................. 28

5. Conclusions and implications ................................................................................................................ 31

ANNEX ......................................................................................................................................................... 34

REFERENCES .............................................................................................................................................. 40

Tables

Table 1. Macroeconomic indicators ............................................................................................................. 7 Table 2. Trends in agricultural R&D ......................................................................................................... 15 Table 3. Production and productivity trends – selected commodities, 1988-2006 .................................... 17 Table 4. Food and general poverty lines, VND/Person/Year..................................................................... 19 Table 5. Poverty headcount rates (%) in Vietnam at national and regional levels .................................... 20 Table 6. Proportion of head of households with zero and 12 or more schooling years,

1993-2006 .................................................................................................................................................. 24 Table 7. Poverty Gap Index ....................................................................................................................... 25 Table 8. Gini coefficients ........................................................................................................................... 27 Table 9. Evolution of income per worker by source, ‟000 VND ............................................................... 28 Table 10. Regression results, semi-log functions ...................................................................................... 30 Table 11. Regression results, log-log functions ......................................................................................... 30 Table A.1. Exports and imports in Vietnam, USD 000 ............................................................................. 34 Table A.2. Vietnam Living Standard Surveys (VLSSs) and Vietnam Household Living Standard Survey

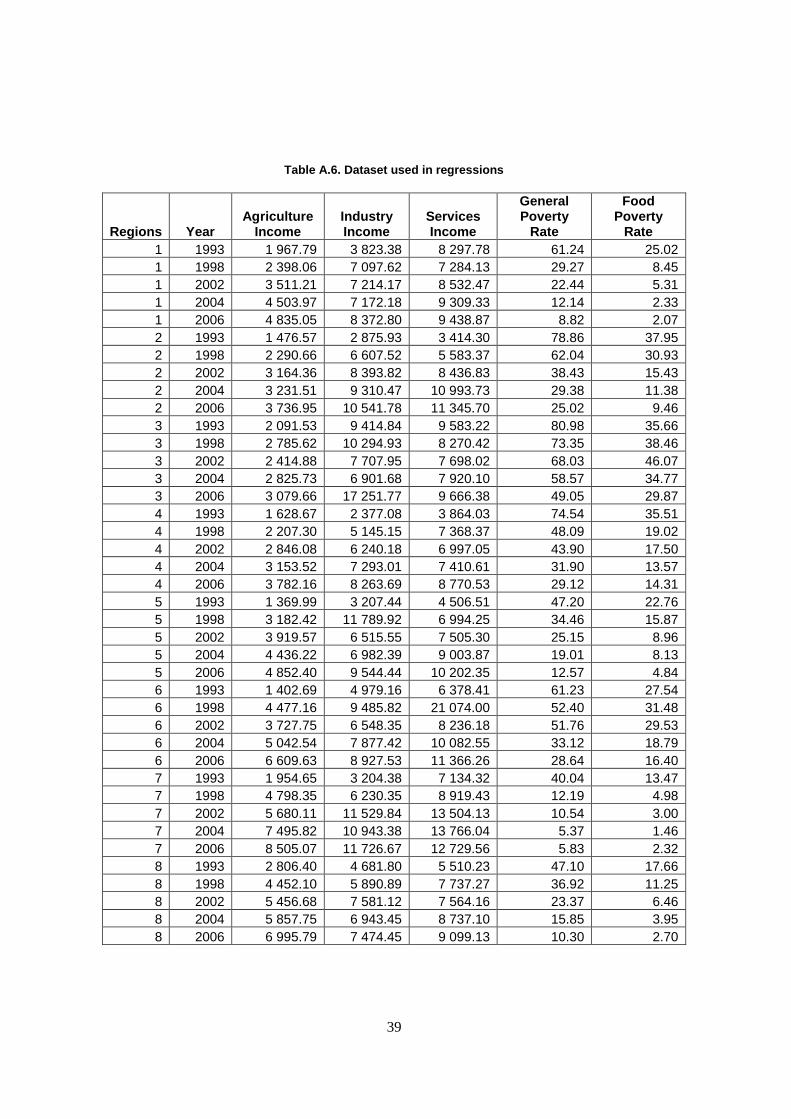
(VLHSSs) ................................................................................................................................................... 35 Table A.3. General characteristics of the households ................................................................................ 36 Table A.4. Land size structure in 2006 ...................................................................................................... 36 Table A.5. Percentage of households with different years of schooling, by survey year .......................... 36 Table A.6. Dataset used in regressions ...................................................................................................... 39

4

Figures

Figure 1. Vietnam‟s evolution of trade, 1997-2008 ..................................................................................... 8 Figure 2. Agricultural employment and GDP trends 2000-08 ..................................................................... 9 Figure 3. Evolution of agricultural GDP in Vietnam ................................................................................. 10 Figure 4. Evolution of coffee, maize and rice planted area in Vietnam ..................................................... 13 Figure 5. Trends in aggregate outputs and inputs used in agricultural production (1981=100) ................ 16 Figure 6. Evolution of the agro-food trade in Vietnam .............................................................................. 17 Figure 7. Regional poverty rates for 1993 and 2006 .................................................................................. 21 Figure 8. Distribution of the poor in Vietnam in 2006 .............................................................................. 22 Figure 9. Poverty rates for farm and non-farm households ....................................................................... 23 Figure 10. Evolution of poverty for landed and landless farm households................................................ 23 Figure 11. Poverty rates and levels of education in Vietnam .................................................................... 25 Figure 12. Trends in expenditures by quintile of the population, 1993-2006 ............................................ 26 Figure 13. Poverty rates and earnings from sources .................................................................................. 29 Figure 14. Evolution of farm household income by source ....................................................................... 31 Figure A.1. Changes in level of expenditures various years in Vietnam ................................................... 37 Figure A.2. Gini-coefficient in total, urban and rural areas in Vietnam .................................................... 38

5

ECONOMIC IMPORTANCE OF AGRICULTURE FOR SUSTAINABLE DEVELOPMENT AND

POVERTY REDUCTION: THE CASE STUDY OF VIETNAM

1. Economic and policy context

1. Vietnam‟s rapid economic and social development in the past quarter century has few parallels in

economic history. In the early 1980s the country was one of the poorest in the world, suffering from

hyperinflation, stagnating per capita income growth, declining food production per capita and widespread

famine. By the mid-1990s however, the government had restored macroeconomic stability, GDP growth

had accelerated and the country had become a major exporter of rice, coffee and many other agricultural

and industrial products.

2. Success in reducing poverty was even more amazing. In 1993, nearly 60% of the population fell

below the international dollar a day poverty line. Latest data (2006) place that rate at under 16%. Not even

neighbouring economic growth powerhouses Thailand and China achieved such swift progress against

poverty. Indeed only two or three countries in the entire world posted faster rates of poverty reduction than

Vietnam over that period. Already by 2002 Vietnam had fully achieved the Millennium Development Goal

of halving, by 2015, that dollar a day poverty rate.

3. What explains Vietnam‟s impressive economic and social achievements? Most credit goes to a

package of policy reforms implemented beginning in 1988 called the Doi Moi policy. Literally translated,

Doi Moi means change and renewal, and is the label the Vietnamese government adopted for economic

reform and renovation. At the heart of those reforms was the near abandonment of central planning in

favour of a progressive move towards a regulated, but market-based, economy – sometimes referred to as

market socialism.

4. Following the introduction of the Doi Moi policy Vietnam gradually evolved from a closed and

moribund command economy to a rapidly growing market economy highly integrated with global markets.

The reforms were comprehensive, affecting almost all aspects of economic life in the country. However it

was the profound changes to agricultural policy that have garnered most attention, providing both the

initial impetus for the reforms and, later, vindicating them.

5. Vietnam is well-endowed with the land and water resources suitable for food production. Yet,

under collectivized agriculture, production languished. In 1986 amid widespread food shortages and fears

of famine the country had to import nearly 500 thousand tonnes of rice to meet food requirements. The

consequent social unrest weakened political resistance to reform, setting the stage for the country‟s

economic transformation.

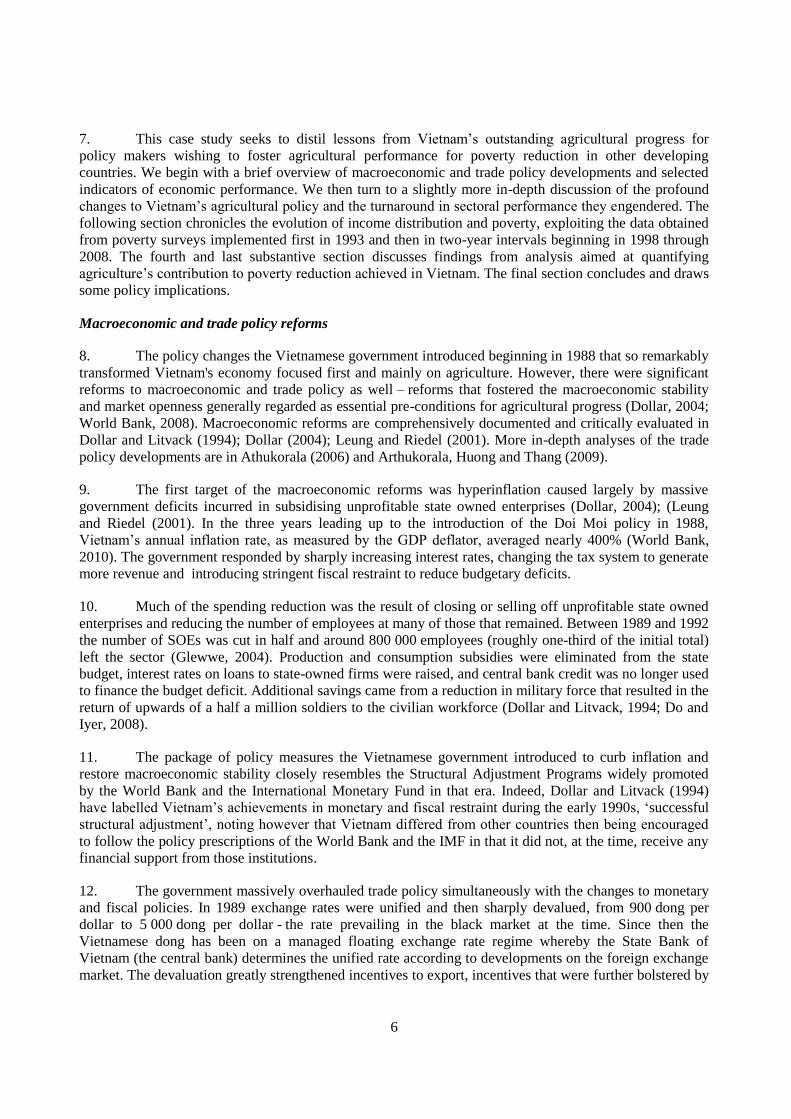
6. Agricultural progress has also been the hallmark of economic success attributed to Doi Moi. The

pervasive land and market reforms in agriculture fostered a transition away from a system of production

based on public ownership and control towards one in which farm households possess effective property

rights over land and farm assets and make production decisions guided by market signals. This transition

significantly increased production incentives and output. In 2009 the country exported over 5 million

tonnes of rice placing Vietnam second only to Thailand in the world rice market.

6

7. This case study seeks to distil lessons from Vietnam‟s outstanding agricultural progress for

policy makers wishing to foster agricultural performance for poverty reduction in other developing

countries. We begin with a brief overview of macroeconomic and trade policy developments and selected

indicators of economic performance. We then turn to a slightly more in-depth discussion of the profound

changes to Vietnam‟s agricultural policy and the turnaround in sectoral performance they engendered. The

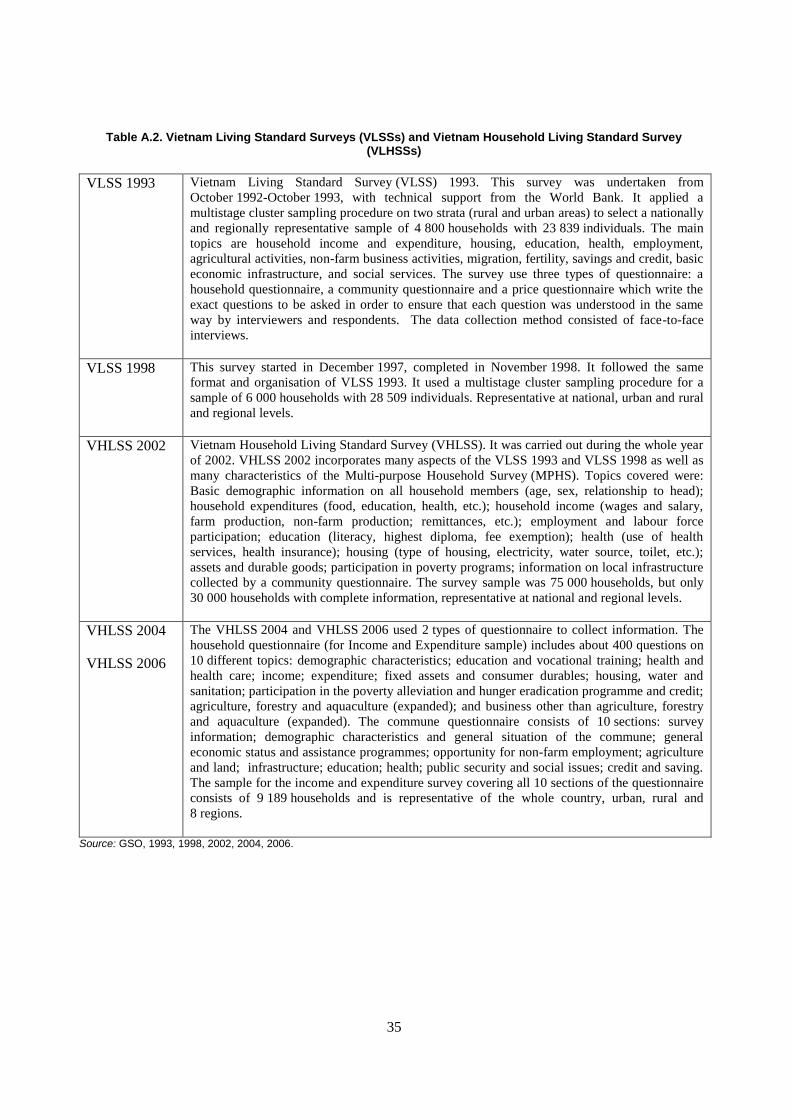
following section chronicles the evolution of income distribution and poverty, exploiting the data obtained

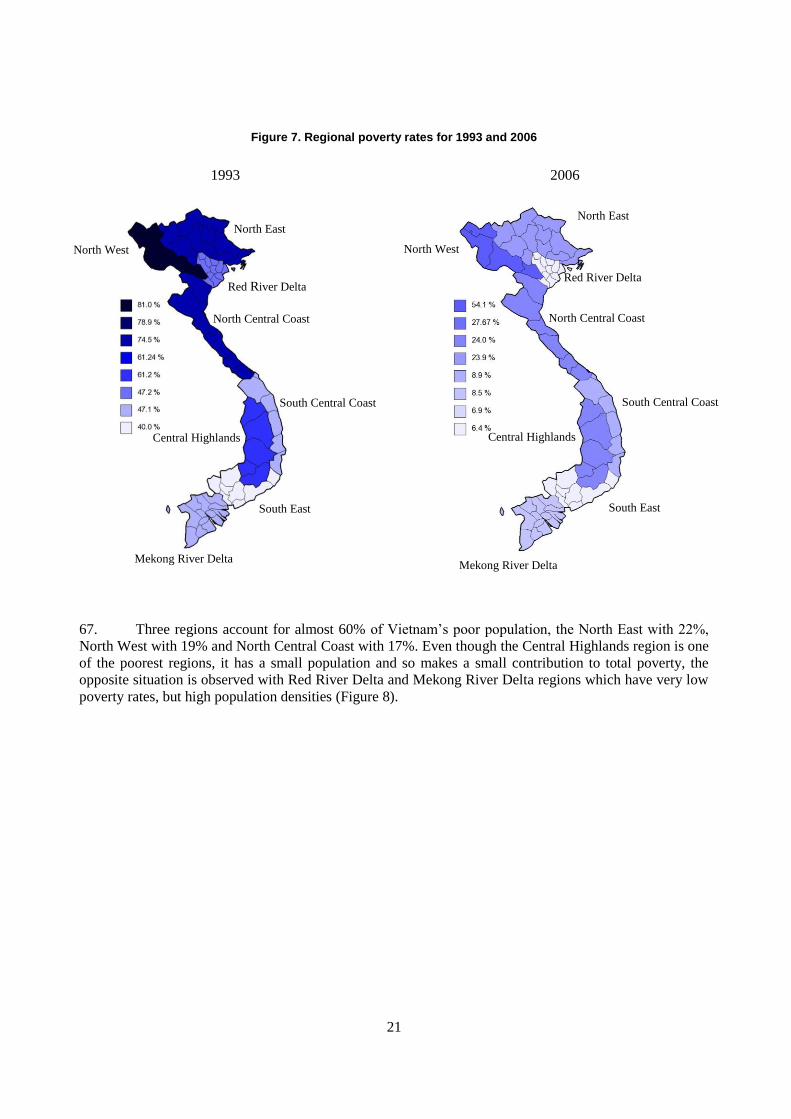
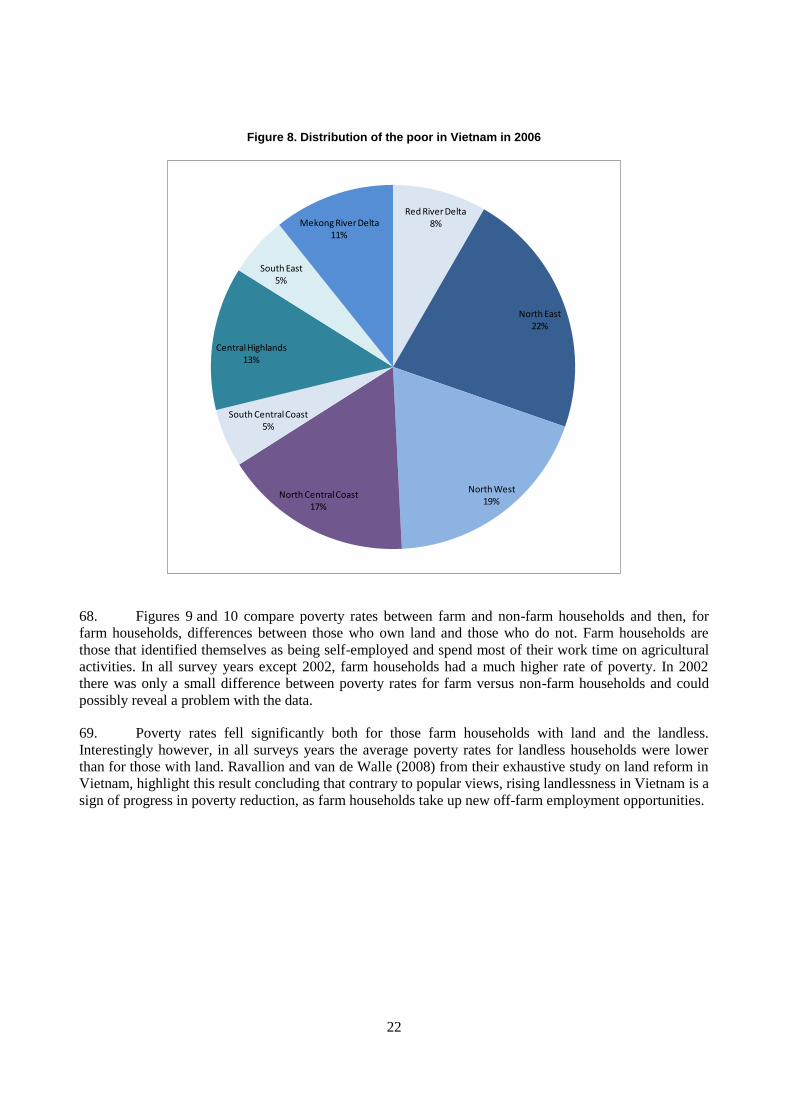
from poverty surveys implemented first in 1993 and then in two-year intervals beginning in 1998 through

2008. The fourth and last substantive section discusses findings from analysis aimed at quantifying

agriculture‟s contribution to poverty reduction achieved in Vietnam. The final section concludes and draws

some policy implications.

Macroeconomic and trade policy reforms

8. The policy changes the Vietnamese government introduced beginning in 1988 that so remarkably

transformed Vietnam's economy focused first and mainly on agriculture. However, there were significant

reforms to macroeconomic and trade policy as well – reforms that fostered the macroeconomic stability

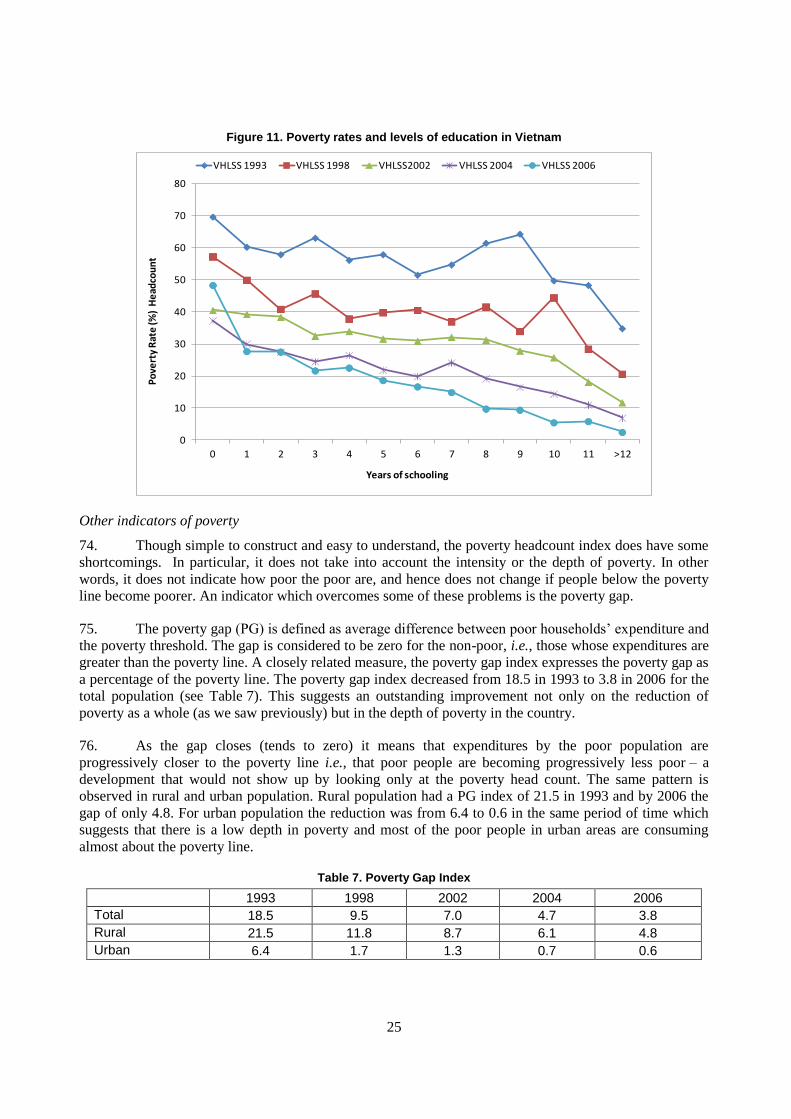
and market openness generally regarded as essential pre-conditions for agricultural progress (Dollar, 2004;

World Bank, 2008). Macroeconomic reforms are comprehensively documented and critically evaluated in

Dollar and Litvack (1994); Dollar (2004); Leung and Riedel (2001). More in-depth analyses of the trade

policy developments are in Athukorala (2006) and Arthukorala, Huong and Thang (2009).

9. The first target of the macroeconomic reforms was hyperinflation caused largely by massive

government deficits incurred in subsidising unprofitable state owned enterprises (Dollar, 2004); (Leung

and Riedel (2001). In the three years leading up to the introduction of the Doi Moi policy in 1988,

Vietnam‟s annual inflation rate, as measured by the GDP deflator, averaged nearly 400% (World Bank,

2010). The government responded by sharply increasing interest rates, changing the tax system to generate

more revenue and introducing stringent fiscal restraint to reduce budgetary deficits.

10. Much of the spending reduction was the result of closing or selling off unprofitable state owned

enterprises and reducing the number of employees at many of those that remained. Between 1989 and 1992

the number of SOEs was cut in half and around 800 000 employees (roughly one-third of the initial total)

left the sector (Glewwe, 2004). Production and consumption subsidies were eliminated from the state

budget, interest rates on loans to state-owned firms were raised, and central bank credit was no longer used

to finance the budget deficit. Additional savings came from a reduction in military force that resulted in the

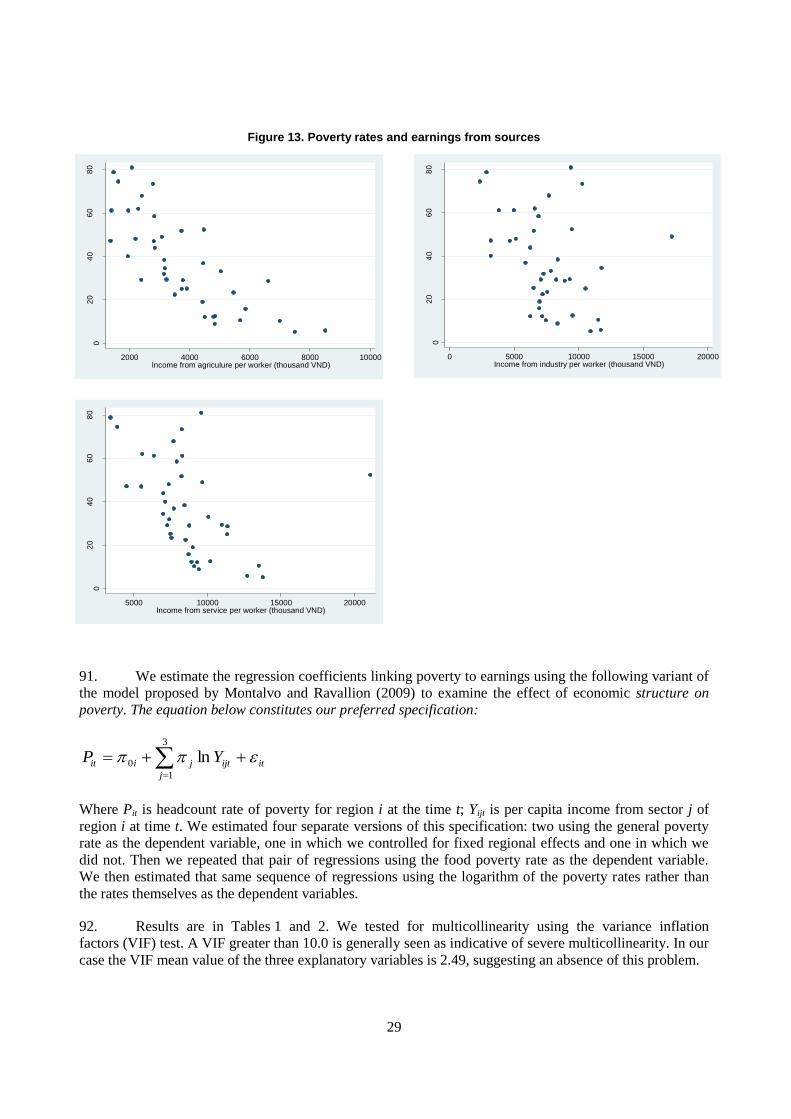
return of upwards of a half a million soldiers to the civilian workforce (Dollar and Litvack, 1994; Do and

Iyer, 2008).

11. The package of policy measures the Vietnamese government introduced to curb inflation and

restore macroeconomic stability closely resembles the Structural Adjustment Programs widely promoted

by the World Bank and the International Monetary Fund in that era. Indeed, Dollar and Litvack (1994)

have labelled Vietnam‟s achievements in monetary and fiscal restraint during the early 1990s, „successful

structural adjustment‟, noting however that Vietnam differed from other countries then being encouraged

to follow the policy prescriptions of the World Bank and the IMF in that it did not, at the time, receive any

financial support from those institutions.

12. The government massively overhauled trade policy simultaneously with the changes to monetary

and fiscal policies. In 1989 exchange rates were unified and then sharply devalued, from 900 dong per

dollar to 5 000 dong per dollar - the rate prevailing in the black market at the time. Since then the

Vietnamese dong has been on a managed floating exchange rate regime whereby the State Bank of

Vietnam (the central bank) determines the unified rate according to developments on the foreign exchange

market. The devaluation greatly strengthened incentives to export, incentives that were further bolstered by

7

the progressive lifting of barriers to exports and imports beginning in the late 1980s, continuing through

1990s.

13. Before the reform, Vietnam‟s trade policy featured both high tariffs and quantitative restrictions

applying to both imports and exports. Twenty-five years on, tariffs constitute the main instrument used in

regulating imports and restrictions on exports apply to only a few items (Athukorala, 2006). Import tariffs

gradually decreased from an average of over 20% in the early 1990s to just under 12% in 2006 (MFN trade

weighted basis). Quantitative restrictions applied to only 1.2% of total imports in 2006.

14. Vietnam further signalled its commitment to trade liberalisation by entering into a number of

regional, bilateral and multilateral trade agreements. In 1992, the country signed a preferential trade

agreement with the European Economic Community. It joined Association of South East Asian

Nations (ASEAN) and the ASEAN Free Trade Area (AFTA) in 1995. In 2002, the country entered into a

bilateral trading agreement with the United States – the most comprehensive bilateral agreement the United

States has ever signed with a developing country (Athukorala, 2006). Latest WTO data (2007) show the

United States as Vietnam‟s most important trading partner, ranking just ahead of the European

Communities in its total imports from Vietnam. Japan, Australia and China are the other main destinations

for the Vietnam‟s exports. Vietnam became the WTO's 150th member on 11 January 2007.

Economic performance

15. Did the macroeconomic and trade policy reforms work? The general consensus from the various

studies cited above is that they did. Table 1 contains indicators lending support to such a conclusion. The

first column compares Vietnam‟s annual per capita GDP growth for the period 1985 to 2005 to that of

neighbouring countries in the region: China, Indonesia, Malaysia and Thailand - four countries posting

some of the fastest rates of economic growth in the world over those years. Vietnam out-performed all of

them except China.

Table 1. Macroeconomic indicators

Country GDP per capita annual

growth, 1985-2007

Composite macroeconomic Trade Openness (Trade as % of GDP) stability index

1985 2005 Annual growth 1986 2005

Annual change

China 8.61% 7.77 8.50 2.39% 26.33 75.32 1.76

Indonesia 3.21% 5.60 8.00 0.99% 39.97 54.85 0.95

Malaysia 4.00% 7.07 8.50 1.37% 104.95 200.08 4.92

Thailand 4.30% 6.57 9.00 1.53% 49.17 144.15 4.63

Vietnam 5.51% 4.60 8.00 4.93% 23.22 167.01 6.13

Source: World Bank, 2010; PRS-Group, 2009.

16. The next set of columns compares those countries using an indicator of overall economic health

and based on data from the International Country Risk Guide (PRS-Group, 2009). A country‟s overall

score on this indicator is the average of its scores on three sub-measures: budget balance, inflation and

exchange rate stability. In 1985 when Vietnam‟s economy was at the worst of its crisis the country‟s score

was at the bottom of the range. After posting a rate of progress faster than any other country on the list it

was in 2005 very near the top.

17. The final three columns indicate Vietnam‟s progressive opening to trade following reforms. In

1985 trade volume (sum of exports and imports) was only 23% of GDP, lowest among all the countries for

8

which figures are reported in Table 1. By 2005, having risen at a pace faster than any other countries in the

list, that figure had risen to 167%, second only to Malaysia. Figure 1 illustrates this growing importance of

trade for Vietnam. The dollar volume of imports and exports increased nearly eight-fold between 1997 and

2008.

Figure 1. Vietnam’s evolution of trade, 1997-2008

-40 000

-20 000

0

20 000

40 000

60 000

80 000

100 000

1997 1998 1999 2000 2001 2002 2003 2004 2005 2006 2007 2008

Total Exports Total Imports Total Trade BalanceUSD million

Source: UN Comtrade, 2010.

18. In developing countries returns to labour employed in agriculture are typically below, often

substantially below, returns to labour in other sectors. A characteristic feature of successful development is

the re-allocation of labour from low return agricultural occupations to more financially rewarding

employment in other sectors. With rare exception, as economies develop the share of the workforce

employed in agriculture declines. Frequently, as is the case now in Vietnam, the absolute number of

workers in agriculture falls. Figure 2 presents these trends. The total size of the agricultural workforce has

been declining at just under 1% per year since 2000, the earliest year of official employment data.

Agriculture‟s share of total employment fell even more sharply, from nearly two-thirds of the total

workforce in 2000 to less than half in 2008.

9

Figure 2. Agricultural employment and GDP trends 2000-08

21000

21500

22000

22500

23000

23500

24000

0

10

20

30

40

50

60

70

19

96

19

97

19

98

19

99

20

00

20

01

20

02

20

03

20

04

20

05

20

06

20

07

20

08

Agricuture share GDP Agricuture share EMPL Workers in agriculture% '000

Source: GSO, 2010.

19. Several inter-related factors underlie these employment trends. First, as seems likely, productivity

advance in agriculture may have strongly favoured the adoption of techniques of production that were

labour-saving thereby freeing up labour time for off-farm work. Similarly, as noted below, being able to

transfer land use rights added further to the flexibility of farmers and their families to allocate work time

among alternatives. Additionally, not only were the wage gaps large in absolute terms but with wide-

spread economic growth in Vietnam off-farm wages have continued to climb.

20. As the number of people employed in the sector falls, earnings per worker must rise – except as

the total value of sector income falls. In fact however, agricultural GDP has grown at a steady pace of more

than 4% per year since 1996 (Figure 3). That is, a growing sector-wide income was available for

distribution among fewer workers thereby enabling the increase in per worker earnings.

10

Figure 3. Evolution of agricultural GDP in Vietnam

0

10 000

20 000

30 000

40 000

50 000

60 000

70 000

80 000

90 000

100 000

1996 1997 1998 1999 2000 2001 2002 2003 2004 2005 2006 2007 2008

1994 Billion Dong

Source: GSO, 2010.

2. Agricultural policy reforms and sector performance

21. When Vietnam was reunified following the defeat of the government in south in 1976 the

government launched an effort to extend nation-wide the system of collectivized agriculture then operating

in the north. Under that system the fundamental units of economic organization of agriculture were

agricultural cooperatives. These held responsibility for deploying labour, land and materials in pursuit of

production plans developed by central governing authorities. They also controlled marketing functions,

collecting and selling surplus product to the state at state-controlled prices and, when called upon to do so,

implementing mandatory procurement of selected essential commodities (Athukorala, Huong and Thanh,

2009).

22. However, there was resistance to the collective system by farmers in the south and growth in total

output slowed soon after the attempt to introduce it began (Che, Kompas and Vousden, 2006). Per capita

rice production actually fell in both 1977 and 1978 and the country was forced to import to meet food

needs. As shortages of food developed, serious doubts arose amongst the population and in some policy

circles about the efficiency of collectivized agriculture (Ravallion and van de Walle, 2008). The

government responded by introducing in 1981 a contract system for agriculture, similar to the household

responsibility system in China. In this first tentative move to limited property rights and reliance on

markets, the cooperatives allotted plots of land to households and allowed them greater responsibility in

making land management and production decisions (Leung and Reidel, 2006). Under the new rules,

households contracted to deliver set amounts to the cooperatives at below-market, regulated prices but

were freed to sell any surplus above the contracted quantities at substantially higher market prices.

11

23. Though apparently successful in boosting production in the early years of the 1980s, the reform

movement lost momentum amid renewed efforts by hard-liners within the Communist Party of Vietnam to

enforce the collectivization of agriculture (Athukorala, Huong and Thanh, 2009). Food production again

slowed, leaving many parts of the country once more suffering food shortages and near-famine conditions.

Per capita rice production was significantly below trend in 1986 and fell in both 1987 and 1988; imports in

1986 were nearly half a million tonnes. Collectivization was widely deemed a failure. The decision to

finally abandon central planning in favour of a market-based economy was officially taken at the Sixth

Congress of the Vietnamese Communist Party (VCP) in 1986.

24. With the adoption of the Doi Moi reforms the government signalled a sea change in agricultural

policy perspective. The earlier experiment with output contracts had been an attempt to fix collective

agriculture to make the system work better. However, in accepting Doi Moi, the government rejected the

system altogether. The transformative idea was that households rather than cooperatives should be the key

economic agents in the sector. Individual farmers, not cooperatives, were to make decisions over farm

inputs and outputs guided by free market signals.

25. Implemented in phases beginning in 1988 the reforms fundamentally changed both the structure

of property rights and the market environment in which farmers operated. The most important changes,

both substantively and symbolically, were to laws governing land tenure. These created the enabling

environment needed for farmers to respond to incentives created by the accompanying and far-reaching

domestic market price reforms. With these land and market reforms Vietnam transitioned in a relatively

short few years from a highly centralized collectivized agriculture to a type of free-market agriculture not

unlike that found in many non-socialist countries.

Land tenure reforms

26. Freeing up Vietnam‟s agricultural land markets has been termed one the most radical land

reforms in modern times (Ravallion and van de Walle, 2008). The first major step was taken with the

introduction of 1988 Land Law. That law called for individual households to be assigned the use rights to

some 80% to 85% of the country‟s agricultural land area – comprising about 4 million hectares. In the

initial phase of implementation, farm households were granted conditional rights to use private land for a

period of 10-15 years. However, the land remained the property of the state to be reverted to government

control when a household moved or stopped farming. This limited the potential effectiveness of the

reforms since they ruled out the possibility of trading tenure rights thus forestalling the development of a

land market.

27. In 1993, the government took the second big step towards privatization of land rights with the

introduction of a new land law and issuance of land use certificates. Although land still remained the

property of the state, under the new law usage rights could legally be transferred, sold, leased, bequeathed

and used as collateral for loans. The duration of tenure rights was extended to 20 years for the production

of annual crops and to 50 years for perennials.

28. Vietnam‟s land titling process was one of the most ambitious ever attempted in the developing

world both in scale (nearly 11 million land titles had been issued to rural households by the year 2000) and

the speed with which it was implemented (Do and Iyer, 2008). Not surprisingly, these dramatic changes in

land tenure rights have attracted much attention from development economists resulting in the publication

of numerous economic studies in recent years. (Annex Table A.4 contains data showing the structure of

land holdings in Vietnam in 2006.)

29. Using a model of household consumption and data from the Vietnam Living Standard

Surveys (VLSS) Ravallion and van de Walle (2008) compare the realized land allocation with two

12

counterfactuals: 1) an egalitarian allocation whereby each eligible household is given the same irrigated-

land equivalent per person and 2) a consumption-efficient allocation whereby the aggregate gain in

consumer welfare is maximized.

30. They conclude that the observed allocations correspond most closely to the first of those two, i.e.,

an egalitarian allocation. The consumption-efficient allocation would have yielded somewhat higher

aggregate welfare gains but the benefits would not have been as great for the poor. They then examine the

efficiency and equity benefits of the broadening of tenure rights under the 1993 change to the law. Here

they conclude that despite some popular opinion to the contrary, the efficiency gains achieved subsequent

to those reforms have not come at the expense of increased inequality. Although there was an apparent rise

in landlessness subsequent to the reforms there has been no rise in poverty attributable to the land market

reforms. They conclude that, on the contrary, rising rural landlessness appears to have been poverty

reducing as farm households take up new opportunities in the off-farm labour market.

31. Do and Iyer (2008) use data from the 1993 and 1998 VLSS to estimate the impact of land rights

on real household expenditures and on the per hectare value of agricultural output. They find that the

reforms had positive but statistically insignificant and relatively minor impacts on both these variables. In

separate regressions they estimate the effects of the reforms on long-term agricultural investments and on

decisions by farmers to allocate time to off-farm work. Such effects may not show up directly and

immediately in earnings per worker but could lay the ground work for long term improvements. Here, they

found statistically significant and positive but small effects.

32. Using data from the same two surveys, Deininger and Lin (2003) find that the existence of

markets allowing rental and sale of land had positive effects on productivity and provided opportunities for

farm households with higher levels of ability to access land. They attribute this result to the combination of

a relatively egalitarian distribution of tenure rights and rapid growth of off-farm earning opportunities.

33. Van de Broeck, Newman and Tarp (2007) studied the effects of land titles on rice yields that that

yields on plots for which there is a formal title are significantly higher than on plots with no defined land

rights leading them to conclude that granting full and exclusive ownership rights to land had a significant

productivity enhancing effect. However, they were unable to establish that connection in cases where the

land title grants joint ownership rights.

34. Markussen, Tarp and Van den Broek (2009) also highlight the connection between the existence

of an effective system of land rights and potential growth in non-farm employment. They found that the

1993 expansion of land tenure rights increased supply of off-farm work. The main focus of the latter study

was however the unfinished agenda for land reform in Vietnam, concluding that remaining land use

restrictions lead to sub-optimal crop choices and efficiency losses.

35. Cropping area began expanding at a faster than usual pace (dramatically so in the case of coffee)

beginning almost immediately following the first reforms to the land laws and continued unabated

throughout the 1990s (Figure 4). There seems little doubt that the land reforms contributed substantially to

the observed increase in plantings as well as to the changing composition of land use.

13

Figure 4. Evolution of coffee, maize and rice planted area in Vietnam

0

100

200

300

400

500

600

1976 1978 1980 1982 1984 1986 1988 1990 1992 1994 1996 1998 2000 2002 2004 2006

Coffee'000 ha

0

200

400

600

800

1000

1200

1976 1978 1980 1982 1984 1986 1988 1990 1992 1994 1996 1998 2000 2002 2004 2006 2008

Maize'000 ha

4000

4500

5000

5500

6000

6500

7000

7500

8000

1976 1978 1980 1982 1984 1986 1988 1990 1992 1994 1996 1998 2000 2002 2004 2006 2008

Rice'000 ha

Source: GSO, 2010.

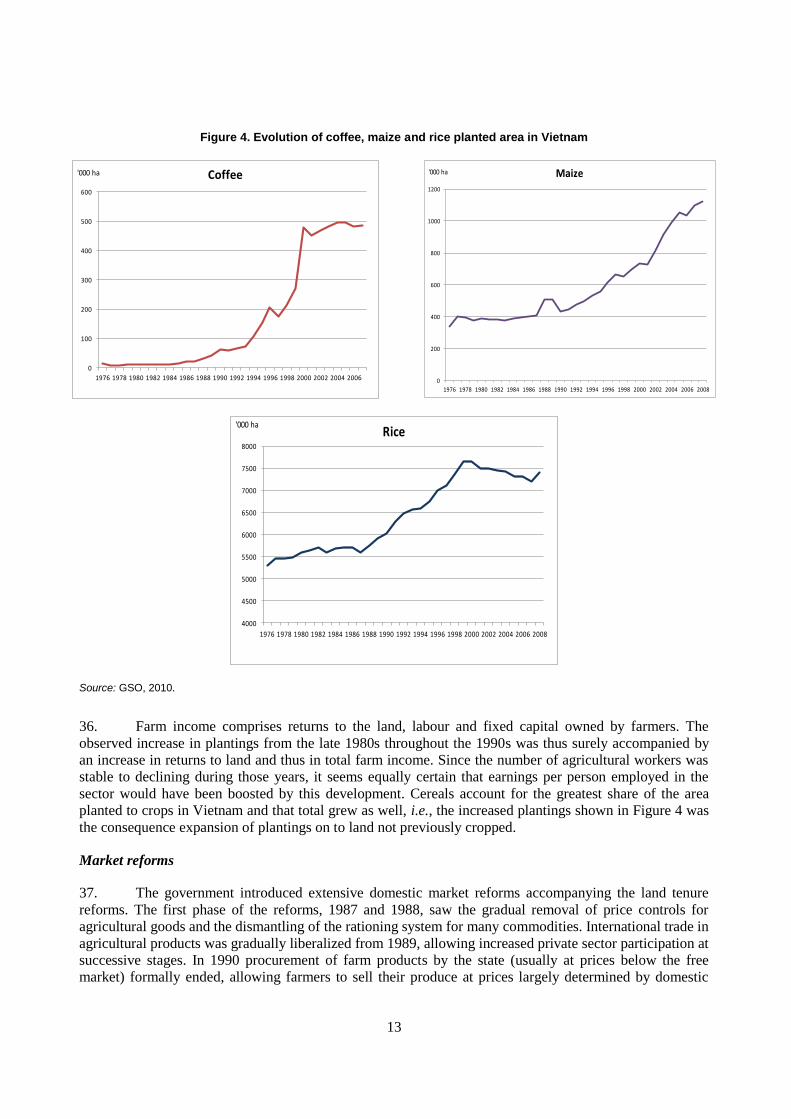
36. Farm income comprises returns to the land, labour and fixed capital owned by farmers. The

observed increase in plantings from the late 1980s throughout the 1990s was thus surely accompanied by

an increase in returns to land and thus in total farm income. Since the number of agricultural workers was

stable to declining during those years, it seems equally certain that earnings per person employed in the

sector would have been boosted by this development. Cereals account for the greatest share of the area

planted to crops in Vietnam and that total grew as well, i.e., the increased plantings shown in Figure 4 was

the consequence expansion of plantings on to land not previously cropped.

Market reforms

37. The government introduced extensive domestic market reforms accompanying the land tenure

reforms. The first phase of the reforms, 1987 and 1988, saw the gradual removal of price controls for

agricultural goods and the dismantling of the rationing system for many commodities. International trade in

agricultural products was gradually liberalized from 1989, allowing increased private sector participation at

successive stages. In 1990 procurement of farm products by the state (usually at prices below the free

market) formally ended, allowing farmers to sell their produce at prices largely determined by domestic

14

market conditions. The weakening of the state trading system at the local level not only permitted private

traders to develop local markets but state trading enterprises also became more responsive to market

opportunities.

38. Before the reforms fertilizer supply was constrained by restrictive policies regulating imports. In

1991 however import quota rights for fertilizer were granted to central and state-owned enterprises that

earned foreign exchange. Then, in 2001, the import quota system for fertilizer was abandoned altogether.

Following these developments imports rose sharply and fertilizer market prices fell (Benjamin and Brandt

(2004). The total tonnage of fertilizer imports nearly doubled between 1995 and 2004, before high world

prices apparently began to choke off demand (Benson and Brandt, 2002).

39. As elsewhere in the region, rice is a profoundly important crop in Vietnam – culturally,

politically and economically. It is the main source of calories for food consumers and the main source of

income for most food producers. Political crises provoked by rice production shortfalls in the late 1970s

and again in the late 1980s, triggered the policy reforms that changed Vietnam‟s entire economy and

society. Correspondingly, the dramatic turnaround in rice productivity, production and exports following

their implementation is widely interpreted as evidence of the success of those reforms (Che, Kompas and

Vousden, 2006; Kompas et al., 2009).

40. In addition to the progressive dismantling of government control over rice pricing and

procurement there were also important changes to rice trade policy. The most important was the

progressive relaxing of restrictions on both internal and external trade in rice (Benjamin and Brandt, 2004).

With a return to robust production levels in 1989 the country began exporting rice. However those exports

were subject to licensing to ensure adequate domestic supplies and reduce price volatility on the domestic

market. There were at the same time barriers to internal trade that had restricted flows of rice from rice

surplus regions in the south to rice deficit regions in the north. Those restrictions on internal and external

trade had kept rice prices artificially low in the south and impeded the transmission of price signals.

41. Initially, licenses to export rice were issued to only a few state-owned enterprises. Athukorala,

Huong and Thanh (2009) point to intense lobbying efforts by these enterprises to share in the export quota

as evidence that the quotas were probably binding and thus pushed domestic market prices below

corresponding border prices. However, with rice production and marketable surpluses continuing to

increase sharply throughout the 1990s, concerns about food security could no longer justify the system of

internal and external restrictions. A law passed in 1997 lifted internal barriers to trade and the system of

export quotas was abolished in 2001. Beginning then, enterprises were required only to possess a general

license to trade in agricultural products in order to export rice.

42. One way of measuring Vietnam‟s progress in reforming agricultural markets is to examine trends

in domestic price distortions using an indicator called the Nominal Rate of Assistance (NRA), typically

obtained by comparing the border and domestic prices of the same commodity. A negative NRA indicates

that government interventions in agricultural markets depress domestic market prices below corresponding

world price levels. This is often interpreted to mean that the government is, in effect, taxing the sector.

Symmetrically, a positive NRA indicates that domestic market prices are higher than the corresponding

world market levels and that government is, in effect, subsidising the sector.

43. Athukorala, Huong and Thanh (2009) estimate annual NRA‟s for five of Vietnam‟s exportable

commodities: rice, rubber, coffee, pigmeat and poultry and for one of its importables – sugar for the period

1986 to 2004. Combined, those commodities represent around two-thirds of the value of agricultural

production. The annual average NRA for all covered commodities trended upward throughout the study

period, albeit with a high degree of variability across years and individual commodities. That average was

substantially negative in the first ten years of their study period, before the market reforms had been fully

15

implemented. In the second ten years of that study period however, the all-commodity average was

positive. That turnaround indicates that reforming Vietnam‟s agricultural markets substantially reversed

the price depressing effects of the Vietnam‟s former system of state-owned control of processing and trade

of agricultural commodities.

Agricultural research and development

44. There are numerous studies devoted to explaining and analyzing Vietnam‟s pervasive land and

market reforms. Surprisingly little attention has been paid to the concurrent rapid growth in government

investment in agricultural research and development (R&D). Such investments are known to yield high

social returns and undoubtedly have contributed partly to Vietnam‟s astonishing progress in agriculture.

45. The table below presents trends in two indicators: 1) total investment in real (2005 PPP)

international dollars and 2) the ratio of that total to agricultural GDP expressed as a per cent. The table

includes comparable data for China, Indonesia, Malaysia and Thailand taken from the Agricultural Science

and Technology (ASTI) online database.

46. In 1991, the first year for which ASTI reports data for Vietnam, total expenditures amounted to

USD 8.2 million (2005, PPP USD), an amount constituting less than one-third of one per cent of

agricultural GDP, a score placing Vietnam well behind neighbouring China and Malaysia. By 2002

however, thanks to a near seven-fold increase in spending the country had begun to close the gap, an

increase that is especially noteworthy as over that same time period agricultural GDP was rising rapidly.

Nonetheless, the country remains well behind the other countries listed in the table in the share of

agricultural GDP spent on research and development.

Table 2. Trends in agricultural R&D

Total expenditures Million 2005 PPP USD

Research Intensity Total expenditures as % of Ag

GDP Growth

% change in total

1991 2002 1991 2002 1991-2002

China 1 178.0 2 582.5 0.35 0.48 5.35%

Indonesia n/a 184.4 n/a 0.18 -7.28%

Malaysia 238.5 446.5 1.25 1.92 4.44%

Vietnam 8.2 55.9 0.03 0.17 19.06%

Source: ASTI-IFPRI, 2009.

47. From the farmer‟s perspective, higher total factor productivity (TFP) means either that the same

output can be produced at lower costs or that more output can be produced at the same costs. Thus, a

higher TFP would normally lead to an increase in net farm incomes. It is theoretically possible however

that, if productivity gains boost production by enough, output prices and farm incomes could fall (Alston

and Martin, 1994). This seems unlikely in Vietnam‟s case since the rapid expansion of agricultural output

was due to increased productivity and production of commodities highly tradable on world markets – rice,

maize and coffee. Although the country is presently the world‟s second largest exporter of rice and coffee,

its share of world production of even those commodities is probably not great enough for variations in

Vietnam‟s production to have much impact on world market prices.

48. Growth in TFP is largely attributable to technological changes enabled by public investments in

agricultural research extension and education. There is an extensive literature showing high social payoffs

to those investments (Alston, Beddow and Pardey, 2009). Figure 5 compares the evolution of indexes of

aggregate output and input use in Vietnamese agriculture for 1981-2006 using data taken from Fuglie

16

(2008). TFP is that part of the increase in aggregate output not explained by an increase in total input use.

Thus the trend in the gap between the output and input indexes tracks developments in the TFP. Notice that

beginning in the early 1990s that gap began to grow. Since then TFP growth has averaged around 3% per

year, a pace that is on a par with the best-performing agricultural economies in the world. (See, for

examples, comparisons in Fuglie, 2008.)

Figure 5. Trends in aggregate outputs and inputs used in agricultural production (1981=100)

0

50

100

150

200

250

300

350

19

81

19

82

19

83

19

84

19

85

19

86

19

87

19

88

19

89

19

90

19

91

19

92

19

93

19

94

19

95

19

96

19

97

19

98

19

99

20

00

20

01

20

02

20

03

20

04

20

05

20

06

Outputs Inputs

Source: Fuglie, 2008.

Agricultural performance

49. Agricultural sector performance improved quickly in the wake of the policy reforms described

above. Rice production, which stagnated during the latter part of the 1980s, has grown at an annual average

rate of over 4% per year during the twenty years following the launching of the reform process. That pace

of growth easily outstripped the growth in demand for domestic consumption permitting Vietnam‟s rise

from its net importer status to that of major exporter.

50. Coffee output growth was more spectacular, averaging nearly 18% per year over that twenty year

period, lifting Vietnam from a minor role in the world market to that of a major player. Although, maize

accounts for a much smaller share of the value of Vietnam‟s total agricultural production there has been a

sharp rise in production levels (growth averaging more than 10% per year) – an important development

given the growing importance of this highly tradable commodity in international markets. Overall,

Vietnam‟s agricultural output as measured by FAO‟s index has been growing at over 5% per year, a rate

nearly double the rate of growth in Vietnam‟s population.

17

Table 3. Production and productivity trends – selected commodities, 1988-2006

Production Area harvested

Total factor productivity Labour productivity

Rice 4.2% 1.3% 3.5% n/a

Coffee 17.8% 16.8% n/a n/a

Maize 10.8% 5.0% n/a n/a

Total Agriculture 5.3% 1.9% 2.7% 0.0%

Source: Production data from FAOSTAT (2010); Rice TFP from Kompas, et al. (2009); Labour productivity (Ag GDP/worker) from GSO (2010); Agriculture TFP from Fuglie (2008).

51. Expansion in land area explains almost all of the increase in coffee production and half that of

increased maize production. Although most of the increase in rice production was due to increased

productivity, there was a significant increase in area devoted to this crop as well. The overall increase in

cropped area is quite high by OECD standards where there has been little increase in most countries and

reductions in some during the past twenty-five years. Undoubtedly that expansion was partly due to the

inducements to invest in land attributable in one way or another to the land reforms. Improvements in

market access brought about by the market reforms and buoyant prices on world markets would have

further boosted incentives to increase plantings.

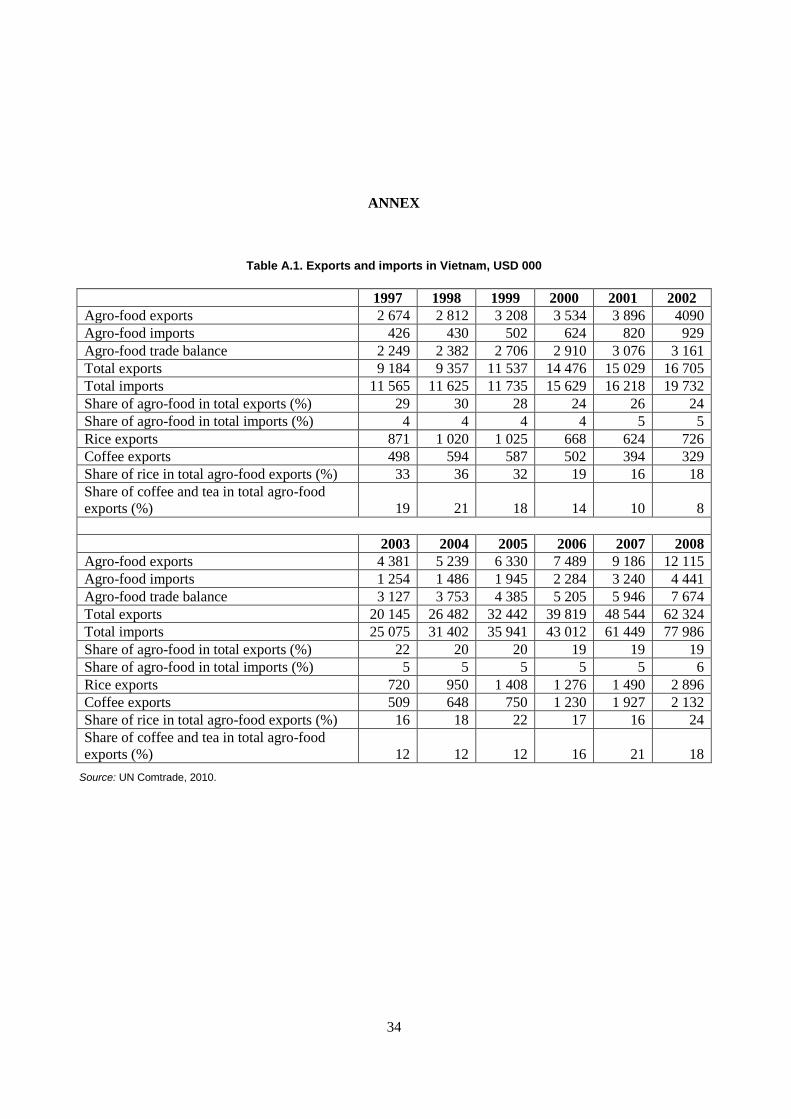
52. Growth in the value of Vietnam‟s agricultural exports, driven largely but not exclusively by the

sharply rising rice and coffee exports, has continued without pause into present times (Figure 6, see

table A.1 in the annex for more details). While the value of agro food imports has also grown the gap

between the two - the net trade balance has steadily widened.

Figure 6. Evolution of the agro-food trade in Vietnam

0

2 000

4 000

6 000

8 000

10 000

12 000

14 000

1997 1998 1999 2000 2001 2002 2003 2004 2005 2006 2007 2008

Agro-food exports Agro-food imports Agro-food trade balanceUSD million

Source: UN Comtrade, 2010.

53. As analysis in the next section shows, an important source of Vietnam‟s success in reducing

poverty came about because of increased farm incomes. Agricultural GDP/worker grew at an annual rate

of 4% per year after 1988, a pace of increase considerably faster than that of economy-wide per capita

18

income. These gains were partly due both to an increase in agricultural value added in total and a stable or

slowly declining number of people employed in sector (i.e., increasing total incomes to be spread among

fewer people).

3. Poverty in Vietnam

54. Vietnam‟s astonishingly rapid progress in reducing the national poverty rate is widely attributed

to the economic growth triggered by the Doi Moi reforms. While most development economists accept that

growth is essential in combating poverty (see for example, World Bank, 2008) there is long-standing

concern that the growth process need not spread its benefits evenly geographically, sectorally or

demographically. Some segments of society may gain more than others perhaps exacerbating an initially

inequitable income distribution. This section discusses findings from in-depth analysis of microeconomic

survey data addressing these dimensions.

What is poverty?

55. The Copenhagen Declaration issued at the UN‟s World Summit on Social Development in 1995,

described poverty as “…a condition characterised by severe deprivation of basic human needs, including

food, safe drinking water, sanitation facilities, health, shelter, education and information”. While evocative

as a description of the human condition of those suffering from poverty, such definitions do not provide a

quantitative basis for tracking progress in reducing it (World Bank, 2005; Tuan, 2008; AusAID, 2002).

56. Working definitions of poverty are based on the notion of a poverty line. Generally, each country

defines its own national poverty line based on the cost of a basket of goods necessary to cover basic needs.

Basic needs typically mean enough food for adequate nutrition plus other essentials such as clothing and

shelter. A person is considered poor if his or her actual consumption expenditure falls below that which is

necessary to cover the cost of that basket of essentials. However, the definition of what is necessary to

satisfy basic needs varies across time and societies. Therefore, poverty lines vary in time and place as each

country uses lines which are appropriate to its level of development, societal norms and values (World

Bank 2005; Tuan, 2008).

57. In the early 1990s the World Bank developed a way of measuring poverty using a common

international definition. This definition splits poverty into two categories, food poverty and general

poverty. The food poverty line is based on the World Health Organisation (WHO) standard average of

2 100 Kcal daily intake per capita. People whose consumption expenditures are lower than that required to

achieve this minimum level are classified as food poor. The general poverty line is based upon the food

poverty line but allows for minimum non-food basic consumption expenditures. The basket of goods that is

used to calculate poverty lines is the same from year to year (but varies from country to country) with

adjustments only made to the prices to estimate the expenditures required to purchase that basket.

58. To estimate consumption expenditures and consequently poverty rates, Living Standard Surveys

are carried out systematically in developing countries. In measuring progress against the MDGs the Bank

uses a reference line set at USD 1.25 (2005 Purchasing Power Parity terms). This corresponds to the mean

of the national poverty lines for the 10-20 poorest countries of the world (Ravallion and Chen, 2008).

Vietnam‟s General Statistic‟s Office (GSO) with technical assistance from the Bank tracks poverty

developments using the USD 1.25 per day international standard and that is the poverty line we used in

doing all of the analysis reported in this section. For analysis reported in the following section we used

both the USD 1.25 line, also called the general poverty line, and the food poverty line.

59. In a separate activity, Vietnam‟s Ministry of Labour Invalids and Social Affairs (MOLISA) uses

it own survey and definition of poverty to track poverty trends in the country to determine the level of

19

financial resources to be committed to its poverty reduction programs. The MOLISA poverty line is based

on per capita income adjusted for regional differences and expressed in number of kilograms of rice. In

terms of both level and trend it most closely resembles the GSO food poverty line, tracing almost exactly

the same pace of decline from 1994 to 2005.

60. Data used to estimate consumption expenditures and consequently the GSO poverty rates, come

from the Vietnam Living Standard Surveys (VHLSS) conducted in 1993, 1998, 2002, 2004 and 2006.

Table 4 presents the levels of the two poverty lines for each of those survey years along with the number of

households surveyed. These surveys provide data on a wide range of topics, including expenditures and

incomes, education, health, fertility and nutrition, employment, migration, housing, agricultural activities,

among others. These survey samples were selected to be representative of the national as well as regional

levels (See more details in Annex Table A.3.)

Table 4. Food and general poverty lines, VND/Person/Year

Poverty 1993 1998 2002 2004 2006

General Poverty 1 160 000 1 790 000 1 917 000 2 077 000 2 560 000

Food Poverty 750 000 1 287 000 1 382 000 1 500 000 1 915 000

No. of households surveyed 4 800 6 000 29 530 9 189 9 189

Source: GSO, 2010. More details are presented in Annex Table A.4.

Poverty trends in Vietnam

61. The poverty headcount ratio is the proportion of the population living in households with

consumption expenditures per capita falling below the poverty line. The headcount ratio is defined as:

Where H is poverty headcount rate; N is total population; I (.) is an indicator function that takes a value of

1 (poor) if the bracketed expression is true and 0 (non poor) otherwise; yi is the expenditure and Z the

poverty line.

62. Table 5 presents estimates of the headcount index of poverty, nationally and by region for each of

the five survey years. (The information contained in this and all subsequent Tables and Figures were

calculated from VHLSS survey data for all survey years 1993, 1998, 2002, 2004 and 2006, using the

ADEPT interface of the World Bank Group).

63. Judging according to the general poverty rate, in 1993 58.1% of the entire Vietnamese population

was in poverty; by 2006 only 15.9% were. The country had by 2002 already achieved the MDG of halving

poverty, a goal whose achievement was slated for 2015.

N

i

p

iN

NzyI

NH

1

,)(1

20

Table 5. Poverty headcount rates (%) in Vietnam at national and regional levels

1993 1998 2002 2004 2006

National 58.1 37.4 28.9 19.5 15.9

Urban 24.9 9.2 6.7 3.6 3.6

Rural 66.4 45.5 35.6 25.0 19.8

North West 81.0 73.4 68.0 58.6 54.1

Central Highlands 61.2 57.9 51.7 33.1 27.7

North Central Coast 74.5 48.1 43.9 31.9 24.0

North East 78.9 55.8 38.4 29.4 23.9

South Central Coast 47.2 34.5 25.2 19.0 8.9

Mekong River Delta 47.1 36.9 23.4 15.8 8.5

Red River Delta 61.2 28.7 22.5 12.1 6.9

South East 40.0 13.5 10.7 5.4 6.4

64. In Vietnam, as elsewhere in the developing world, both the incidence and the absolute number of

people in poverty is higher in rural than in urban areas. In 1993 the urban poverty rate was 25% but rural

poverty in that year was, at 66.4%, nearly two and one-half times that. By 2006, poverty in urban areas

decreased to 3.6% and in rural areas to around 20%. These developments in percentage rates mask the

underlying changes in numbers of people in poverty. Overall, the declining number of poor people

nationally was overwhelmingly due to the reduction in rural poverty.

65. Poverty rates also vary quite substantially across regions. The North West, North East and

Central Highlands have persistently shown higher poverty incidence than the rest of the country. Regions

exhibiting the lowest poverty incidence are South East and Red River Delta in which the main cities of Ho

Chi Minh and Hanoi are located respectively. Figure 7, shows the poverty incidence by regions for two

years 1993 and 2006.

66. The North East, the Red River Delta and the North Central Coast regions achieved the fastest

reductions in their poverty rates, each posting reductions of more than 50 percentage points from 1993 to

2006. The North West region succeeded in reducing its poverty by relatively modest 26.8 percentage

points over those same years, leaving this region substantially poorer than the rest of the country. The high

levels of poverty in the North West and in the North East, and Central Highland regions as well, reflects

constraints they face in participating in the growth process due to a difficult physical environment limiting

agricultural development and a restricted access to infrastructure, markets and social services (AusAID,

2002; World Bank, 2004).

21

Figure 7. Regional poverty rates for 1993 and 2006

1993

2006

67. Three regions account for almost 60% of Vietnam‟s poor population, the North East with 22%,

North West with 19% and North Central Coast with 17%. Even though the Central Highlands region is one

of the poorest regions, it has a small population and so makes a small contribution to total poverty, the

opposite situation is observed with Red River Delta and Mekong River Delta regions which have very low

poverty rates, but high population densities (Figure 8).

Central Highlands

South East

Mekong River Delta

North East

North West

Red River Delta

North Central Coast

South Central Coast

Central Highlands

South East

Mekong River Delta

North East

North West

Red River Delta

North Central Coast

South Central Coast

22

Figure 8. Distribution of the poor in Vietnam in 2006

Red River Delta8%

North East22%

North West19%

North Central Coast17%

South Central Coast5%

Central Highlands13%

South East5%

Mekong River Delta11%

68. Figures 9 and 10 compare poverty rates between farm and non-farm households and then, for

farm households, differences between those who own land and those who do not. Farm households are

those that identified themselves as being self-employed and spend most of their work time on agricultural

activities. In all survey years except 2002, farm households had a much higher rate of poverty. In 2002

there was only a small difference between poverty rates for farm versus non-farm households and could

possibly reveal a problem with the data.

69. Poverty rates fell significantly both for those farm households with land and the landless.

Interestingly however, in all surveys years the average poverty rates for landless households were lower

than for those with land. Ravallion and van de Walle (2008) from their exhaustive study on land reform in

Vietnam, highlight this result concluding that contrary to popular views, rising landlessness in Vietnam is a

sign of progress in poverty reduction, as farm households take up new off-farm employment opportunities.

23

Figure 9. Poverty rates for farm and non-farm households

30.8

19.5

29.5

9.0

6.8

69.6

48.2

31.4

26.2

21.1

0

10

20

30

40

50

60

70

80

1993 1998 2002 2004 2006

Po

vert

y R

ate

s (%

) He

adco

un

t

Non-FarmHH FarmHH

Figure 10. Evolution of poverty for landed and landless farm households

70.5

48.5

34.7

27.9

21.8

64.5

38.4

13.8 15.8 14.5

0

10

20

30

40

50

60

70

80

1993 1998 2002 2004 2006

Po

vert

y R

ate

s (%

) H

ead

cou

nt

With land Landless

24

70. Improvements in education have proven in many countries to be an important way by which

workers can improve their employment prospects and standard of living. Moock, Patrinos, and

Venkataraman (1998) report estimated private rates of return to primary and university education in

Vietnam of 13% and 11%, respectively. Glewwe, Gragnolati and Zaman (2000) find that an additional year

of schooling of household heads raises household consumption per capita by around 3%.

Table 6. Proportion of heads of households with zero and 12 or more schooling years, 1993-2006

Urban Rural Farm

Survey year Zero 12 or more zero 12 or more zero 12 or more

1993 8.3 19.4 13.7 7.5 13.8 6.3

1998 5.9 33 10.8 11.9 10.9 11.3

2002 6.9 29.9 11 9.8 8.3 15.1

2004 4.6 33.8 8.5 11.5 6.7 11.0

2006 4.1 35.6 9.2 11.1 7.3 10.5

Note: See more details in Table A.5 in the annex.

71. Public spending on education in the country has steadily increased with the share of the budget

spent on education increasing from 14.0% in 1994 to 18% in 2005, reaching over 5% of GDP, a spending

level higher than the average of Asia (SRV, 2006). This investment seems to have paid off. Table 6

contains average literacy rates for the heads of urban, rural and farm households. These data show

substantial reductions across all household categories in the proportion of the population having no

education and a corresponding sharp increase in the proportion having twelve or more years of education.

72. Especially striking in the context of this study is the near halving of the proportion of farm

household heads that was illiterate and a corresponding near doubling of the proportion having more than

12 years of education. Equally impressive is the near doubling of the proportion of highly educated

amongst urban heads of household. Balisacan, Pernia and Estrada (2003) suggest that the economic

opportunities created by Doi Moi could have strengthened the role of, and induced investment in,

education.

73. Figure 11 plots the average poverty rates and the levels of education of the head of household for

each of the five survey years, showing clearly both the fall in poverty rates the strongly negative

relationship that was as important in 2006 as in 1993.

25

Figure 11. Poverty rates and levels of education in Vietnam

0

10

20

30

40

50

60

70

80

0 1 2 3 4 5 6 7 8 9 10 11 >12

Po

vert

y R

ate

(%)

He

adco

un

t

Years of schooling

VHLSS 1993 VHLSS 1998 VHLSS2002 VHLSS 2004 VHLSS 2006

Other indicators of poverty

74. Though simple to construct and easy to understand, the poverty headcount index does have some

shortcomings. In particular, it does not take into account the intensity or the depth of poverty. In other

words, it does not indicate how poor the poor are, and hence does not change if people below the poverty

line become poorer. An indicator which overcomes some of these problems is the poverty gap.

75. The poverty gap (PG) is defined as average difference between poor households‟ expenditure and

the poverty threshold. The gap is considered to be zero for the non-poor, i.e., those whose expenditures are

greater than the poverty line. A closely related measure, the poverty gap index expresses the poverty gap as

a percentage of the poverty line. The poverty gap index decreased from 18.5 in 1993 to 3.8 in 2006 for the

total population (see Table 7). This suggests an outstanding improvement not only on the reduction of

poverty as a whole (as we saw previously) but in the depth of poverty in the country.

76. As the gap closes (tends to zero) it means that expenditures by the poor population are

progressively closer to the poverty line i.e., that poor people are becoming progressively less poor – a

development that would not show up by looking only at the poverty head count. The same pattern is

observed in rural and urban population. Rural population had a PG index of 21.5 in 1993 and by 2006 the

gap of only 4.8. For urban population the reduction was from 6.4 to 0.6 in the same period of time which

suggests that there is a low depth in poverty and most of the poor people in urban areas are consuming

almost about the poverty line.

Table 7. Poverty Gap Index

1993 1998 2002 2004 2006

Total 18.5 9.5 7.0 4.7 3.8

Rural 21.5 11.8 8.7 6.1 4.8

Urban 6.4 1.7 1.3 0.7 0.6

26

77. Although the poverty head count and derivative measures such as the poverty gap constitute

popular choices for poverty analysis some analysts, e.g., Ligon and Sadoulet (2008), use estimated

consumption expenditure data directly. Figure 12, presents the evolution of average real expenditures by

quintile for each year of the survey data. Each quintile represents 20%, or one-fifth, of all households. All

categories of households increased their consumption expenditures continuously over the survey years.

Figure 12. Trends in expenditures by quintile of the population, 1993-2006

0

10 000

20 000

30 000

40 000

50 000

60 000

Lowest quintile Quintile 2 Quintile 3 Quintile 4 Highest quintile

Mea

n R

eal E

xpen

dit

ure

s p

er y

ear

1993 1998 2002 2004 2006'000 VND

Note: See more details of expenditures in Figure A.1. in the annex.

78. An interesting question to pose in this connection is whether those increases were uniform, i.e.,

did the relatively rich, those in the top quintile, expand their consumption faster or slower than the

relatively poor, those in the bottom quintile. Depending on the answer to that question, the expenditure,

and presumably the underlying income distribution as well, would have worsened or improved. Balisacan,

Pernia and Estrada (2003) examined provincial panel data collected in the 1993 and 1998 poverty surveys

finding that those households who in 1993 were in the lowest expenditure quintile increased their spending

faster than households in any other quintile. They conclude that Vietnam‟s economic growth spurt over

those years was decidedly „pro-poor‟.

79. An indicator that helps to answer income distributional questions is the Gini coefficient -

probably the most commonly used measure of income or wealth inequality. The Gini coefficient indicates

how evenly the income (or wealth) is distributed throughout a country. Its value varies between 0, which

reflects complete equality and 1 indicating complete inequality (one person has all the income or

consumption, all others have none).

80. Developing countries have Gini coefficients that fall over a quite wide range, from e.g., 0.30 for

Ethiopia to 0.74 for Namibia (UNDP, 2009). Developed countries typically have relatively low Gini

coefficients, averaging around 0.25 in, e.g., Denmark, Japan and Sweden and around 0.40 in, e.g., Portugal

and the United States. It is common in many developing countries that as incomes grow, the income gap

between the rich and poor widens and the Gini coefficient increases. In fast growing China for example the

Gini coefficient increased from 0.3 in 1993 to 0.42 in 2007 (UNDP, 2009).

27

81. The Gini coefficients we estimated from the survey data for Vietnam (Table 8) show that the

income distribution was relatively even to begin with – generally in the range of developed countries and

did not deteriorate with rapid economic growth. In fact, if anything, the data suggest a slight improvement

in the distribution of income over time. Household incomes average lower for rural than for urban

households but are more evenly distributed, an outcome possibly associated with the egalitarian

distribution of land rights achieved under the Doi Moi policy (Ravallion and van de Walle, 2008).

Table 8. Gini coefficients

1993 1998 2002 2004 2006

Total 0.36 0.35 0.37 0.37 0.35

Urban 0.36 0.35 0.36 0.34 0.32

Rural 0.32 0.28 0.29 0.30 0.31

Note: See more details of 2006 Gini coefficient in Figure A.2 in the annex.

4. Agriculture’s contribution to poverty reduction in Vietnam

82. This section examines directly the main research question motivating our study of Vietnam –

how important was agricultural progress for the country‟s remarkable progress in reducing poverty. It is

generally accepted that the only sustainable cure for poverty is economic growth and most empirical

studies indeed find that poverty tends to fall with growth. But some kinds of growth reduce poverty more

than others and many studies document that a given rate of growth can deliver diverse outcomes for the

poor, suggesting that the pattern of growth (sectoral and/or geographical) matters independently of the

overall growth.

83. Montalvo and Ravallion (2009) explain that if economic growth is very intense in sectors that do

not benefit poor people then inequality will rise, holding back the gains to the poor. For example, if the

poor live mostly in rural areas and depend mainly on agriculture for living, a booming high-tech sector in

major metropolitan areas may not have much of an impact on poverty. Additionally, the initial distribution

of income is known to be important for the subsequent effect of economic growth on poverty (Ravallion

1997; Bourguignon, 2003). When the poor have a low initial share of total income they will consequently

have a lower share of the gains in aggregate income during the growth process.

84. Christiaensen and Demery (2007) emphasize the importance of the geographic pattern of growth.

The contribution of economic growth to poverty reduction might differ across sectors because the benefits

of growth might be easier for poor people to obtain if growth occurs where they are located. This reasoning

implicitly assumes that transferring income generated in one economic sector or geographic location to

another sector or location is difficult because of market segmentations or considerations of political

economy. They find that growth originating in agriculture is on average significantly more poverty

reducing than growth originating outside agriculture.

85. Montalvo and Ravallion (2009) find that the primary sector rather than the secondary or tertiary

sectors was the real driving force in China‟s spectacular success against absolute poverty. They conclude

that the idea of a trade-off between these sectors in terms of overall progress against poverty in China is

moot, given how little evidence they found of any poverty impact of non-primary sector growth.

86. Rural economic growth has been found to have more impact on poverty in India than urban

economic growth. However, growth in the services sector has had more impact than the primary

(agriculture) sector, while the secondary (manufacturing) sector appears to have brought little direct gain to

India‟s poor (Ravallion and Datt 1996, 2002; Datt and Ravallion, 2002).

28

87. While most empirical studies show that agricultural growth is relatively more important for

poverty reduction than growth in other sectors, there are exceptions. This underscores the existence of

potentially important differences in the sectoral GDP elasticities of poverty across countries depending on

the structure and institutional organization of their economies (Loayza and Raddatz, 2006). A common

finding is that the poverty reducing powers of agriculture declines as countries get richer (Christiaensen

and Demery, 2007; Ligon and Sadoulet, 2008).

Method of analysis and data

88. Our approach follows closely that used by Montalvo and Ravallion (2009) in assessing the

contribution to poverty reduction of the sectoral and geographic pattern of China´s growth using provincial

data. Here we construct a time series, cross-section dataset by aggregating survey results from the eight

regions of Vietnam: 1-Red River Delta, 2-North East, 3-North West, 4-North Central Coast, 5-South

Central Coast, 6-Central Highlands, 7-North East South, 8-Mekong River Delta. That dataset comprises

regional averages for the general and food poverty lines and of household earnings per worker by category

of employment (agriculture, services and industry) by region and for each survey year, 1993 to 2006. That

is to say, for each variable in the dataset we have five years by eight regions or 40 observations. See

dataset in Table A.6 of the annex. Note that in creating the income variables we counted only earnings

from wages and self-employment in each of sectors respectively. This excludes other potential sources of

incomes that could also help to reduce poverty such as rents, remittances, subsidies and other kinds of

financial transfers to households.

89. Table 9 presents national averages and growth in earnings by source. These data reveal a pattern

of earnings and of growth typical of successful developing economies in two important respects:

1) earnings per worker from agricultural sector are lower than those from non-agricultural sectors and

2) they grew faster. In 1993 earnings per worker from agriculture were just over one-third of the average of

earnings per worker who made their living in the industry and services sectors. By 2006 earnings from

agriculture were on average more than half that of the other two sectors. Though still large by developed

country standards the gap between earnings from agricultural and non-agricultural seems to be closing

rapidly. It is interesting to note in passing that the initially significant gap between earnings of workers in

industry versus services had virtually disappeared by 2006.

Table 9. Evolution of income per worker by source, ’000 VND

Agriculture Industry Services

000 VND/year

VHLSS 1993 1 837 4 320 6 086

VHLSS 1998 3 324 7 818 9 154

VHLSS 2002 3 840 7 716 8 559

VHLSS 2004 4 568 7 928 9 653

VHLSS 2006 5 300 10 263 10 327

Growth (%) 8.5 6.9 4.2

Analysis

90. The three panels of Figure 13 exhibits plots of the time-series, cross-section observations for the

general poverty rate (vertical axes) against the three earnings variables respectively (horizontal axes). Each

dot in these figures pairs a year by region observation for the poverty rate and the associated earnings

variable. These plots reveal the expected negative relationships between poverty and earnings from

agriculture but the connection between poverty and earnings from the other two sources is much less

apparent. However, more precise attribution requires regression analysis.

29

Figure 13. Poverty rates and earnings from sources

02

04

06

08

0

Pe

rcen

tage

of po

or

peo

ple

2000 4000 6000 8000 10000Income from agriculure per worker (thousand VND)

02

04

06

08

0

Pe

rcen

tage

of po

or

peo

ple

0 5000 10000 15000 20000Income from industry per worker (thousand VND)

02

04

06

08

0

Pe

rcen

tage

of po

or

peo

ple

5000 10000 15000 20000Income from service per worker (thousand VND)

91. We estimate the regression coefficients linking poverty to earnings using the following variant of

the model proposed by Montalvo and Ravallion (2009) to examine the effect of economic structure on

poverty. The equation below constitutes our preferred specification:

it

j

ijtjiit YP

3

1

0 ln

Where Pit is headcount rate of poverty for region i at the time t; Yijt is per capita income from sector j of

region i at time t. We estimated four separate versions of this specification: two using the general poverty

rate as the dependent variable, one in which we controlled for fixed regional effects and one in which we

did not. Then we repeated that pair of regressions using the food poverty rate as the dependent variable.

We then estimated that same sequence of regressions using the logarithm of the poverty rates rather than

the rates themselves as the dependent variables.

92. Results are in Tables 1 and 2. We tested for multicollinearity using the variance inflation

factors (VIF) test. A VIF greater than 10.0 is generally seen as indicative of severe multicollinearity. In our

case the VIF mean value of the three explanatory variables is 2.49, suggesting an absence of this problem.

30

93. The regression equations explain a relatively high percentage of variation in the time-series,

cross-section poverty rate data. Regression results indicate that agriculture has been the most important

earnings source for poverty reduction in Vietnam, and this applies to all eight regressions estimated,

although the levels of significance vary according to the regression specification. Indeed, the only earnings

variable to show statistical significance is agriculture, although the others are generally positive.

94. The OLS regressions or pooled regressions, present the highest levels of significance for

agricultural earnings but at the sacrifice of some reductions in the R2. However, the fixed-effects

regressions that control for the regional effects also show earnings from agriculture as being significant.

Table 10. Regression results, semi-log functions

Independent variables Dependent variable: headcount rate of general poverty

Dependent variable: headcount rates of food poverty

OLS Fixed-effect OLS Fixed-effect

ln agriculture earnings per worker -42.37*** -24.90*** -23.22*** -6.99*

(6.79) (5.62) (4.16) (3.15)

ln industry earnings per worker 6.30 -11.95 7.04 -8.01

(8.15) (10.06) (5.53) (6.38)

ln services earnings per worker 3.57 1.50 2.67 -1.72

(13.52) (15.76) (9.73) (10.94)

Constant 294.05*** 332.41*** 119.44** 160.52**

(72.78) (80.99) (48.96) (53.42)

Observations 40 40 40 40

R-squared 0.6507 0.7674 0.4973 0.6498

Notes: Robust standard errors in brackets * significant at 10%; ** significant at 5%; *** significant at 1%.

Table 11. Regression results, log-log functions

Independent variables Dependent variable: ln headcount rate of general poverty

Dependent variable: ln headcount rate of food poverty

OLS Fixed-effect OLS Fixed-effect

ln agriculture earnings per worker -1.44*** -1.08** -1.85*** -1.09*

(0.22) (0.32) (0.30) (0.46)

ln industry earnings per worker 0.23 -0.20 0.47 -0.28

(0.20) (0.32) (0.30) (0.46)

ln services earnings per worker 0.10 0.22 0.20 0.16

(0.44) (0.32) (0.64) (0.51)

Constant 12.10*** 11.90*** 11.58*** 12.41***

(2.25) (1.61) (3.14) (2.44)

Observations 40 40 40 40

R-squared 0.6656 0.7703 0.5699 0.6759

Notes: Robust standard errors in brackets * significant at 10%; ** significant at 5%; *** significant at 1%.

95. The coefficients of log-log regression can be interpreted as elasticities (Table 11). For instance, in

the first OLS regression we have that an increment of one per cent in agricultural earnings will decrease

poverty rates by 1.4% (not percentage points), ceteris paribus. The same kind of interpretation holds for the

other three specifications.

96. The general finding that neither industry nor services earnings were statistically significant

contributors to poverty reduction in Vietnam echoes similar findings for China in the Montalvo and

Ravallion (2009) study. Care must be taken however in reading too much into this finding. As noted

31

elsewhere in the report, the number of people employed in agriculture has been declining, not only as a

share of total employment but also in absolute numbers of workers.

97. Moreover, as the data plotted in Figure 14 show, farm households in Vietnam are increasingly

diversifying their income sources with an increasing share coming from off-farm sources. In 1993 farm

sourced income accounted for over 70% of total incomes of farm households. By 2006, that proportion had

fallen to under 60%. Both migration to off-farm jobs and the increasing diversification of income sources

are consequences of farm people responding to the attraction of higher paying work off the farm. This pull

of higher paying off-farm jobs reduces the supply of workers and puts upward pressure on their earnings

rates in agriculture. Do we attribute this development to growth in agriculture or in other sectors? Be that

as it may, it seems clear that growth in agricultural earnings per worker are the overwhelmingly most

important proximate if not underlying cause of the poverty reduction observed in Vietnam.

Figure 14. Evolution of farm household income by source

70.7 71.8

65.0

60.4 59.5

29.3 28.2

35.0

39.6 40.5

0

15

30

45

60

75

VHLSS 1993 VHLSS 1998 VHLSS 2002 VHLSS 2004 VHLSS2006

Agricultural Income Non-Agricultural Income%

5. Conclusions and implications

98. Vietnam‟s economic recovery since the late 1980s lifted nearly one-half the population from

below to above the international dollar a day poverty line. The country which could not produce enough

rice to feed its own population in those years is now a major supplier to world markets. Sustained growth

boosted the incomes of workers in all economic sectors and geographic regions, with no apparent

deterioration in the distribution of incomes. In less than two decades, the country transformed itself from a

closed, centrally-planned and failing economy to an open, widely successful market economy. Although

still a poor country, the pace and breadth of Vietnam‟s economic achievements over the past two decades

is virtually unmatched elsewhere in the developing world.

32

99. Credit for Vietnam‟s economic success is widely attributed to a package of policy reforms that

appear remarkably similar to “free market” policy prescriptions generally associated with the International

Monetary Fund, the World Bank and the OECD. These include macroeconomic stabilisation, privatization

of state owned enterprises, deregulation of markets, reduction of barriers to internal and external trade, and

so on. However, in sharp contrast with many other countries implementing those policy prescriptions,

Vietnam did so independently of the „conditionality‟ provisions for access to grants and loans imposed by

the international financial institutions.

100. At the core of Doi Moi policy was a total makeover of agricultural policy. In effect, the

government changed its mind about what constituted appropriate policy for the sector. Individual farmers

were granted rights to land and other assets that formerly belonged to the state-controlled cooperatives.

Regulations limiting farmer access to internal and external markets were lifted, boosting demand and

prices received. Unprofitable state-run marketing and input supply organizations were shut down and

efficiency gains achieved by the private firms that replaced them showed up in both higher effective output

prices and lower input costs. While cutting back on budgetary expenditures elsewhere the government

substantially ramped up investments in agricultural research and technology transfer.

101. Of course, developments in these factors did not occur independently of each other or of other

important changes in the economic environment within which farm households make decisions. For

example, part of the gains in total factor productivity achieved in rice was induced by improvements in

market conditions sparked by the policy reforms. The land reforms not only spurred increased output,

productivity and farm incomes but also freed some workers to sell or rent their land in order to take higher

paying jobs off the farm. Production enhancing technical change fostered by government investments in

agricultural research and development would not have paid off so well; indeed could have been counter-

productive except for improvements in market access that came with relaxation of administrative barriers

restricting trade.

102. Thus the proper perspective in evaluating the reforms should be the same as the government took

in implementing them – that is, to view them as a package. That package surely contributed substantially to

Vietnam‟s achievements in reducing poverty. The main reason poverty rates fell was increased earnings of

agricultural workers. It seems impossible that poverty in other countries in the developing world can be

alleviated except through increasing the incomes of those who depend on agriculture for a living. Here

again however we run the risk of single factor attribution. Growth in agricultural incomes may explain

poverty reduction but multiple factors explain that growth.

103. Agricultural policy today bears little resemblance to that of twenty years ago. But the change did

not occur overnight. The overall process was deliberate and gradual. There were, for example, major

changes to the laws governing land tenure in 1988, 1993, 1998 and 2003, gradually transitioning from a

system of collective ownership to one of near complete private ownership of the rights to use land by

individual farmers. That same deliberateness characterizes the near complete but progressive liberalization

of the rice market.

104. The government of Vietnam changed, and quite dramatically, its role in the agriculture sector.

But it did not abandon agriculture. The focus now is more squarely on provision of public goods that

enable the private sector, of which farmers are the most important agents, to flourish. This is clear from the

sharply rising trends in public investments in agricultural research.

105. Few countries in the world, developing or developed, posted improvements in agricultural

productivity at a pace as fast as Vietnam over the past twenty years. Some credit goes to that highly

laudable increase in public investments in agricultural research. But, the payoff to such investments is

typically only in the medium to long term. Moreover, even though growing rapidly, those investments still

33

constitute only a tiny share of sector GDP. There must have been some other factor at play. The likely

candidate seems to be induced innovation. That is, the reason farmers were able to so rapidly increase their

productivity must have been by applying improved techniques of production already on the shelf.

106. What are the policy lessons from Vietnam‟s success? There are numerous countries in the

developing world where agriculture‟s potential is thwarted by inappropriate agricultural policy. Yet, it is

easy to find examples where the same policy prescriptions that were so fruitfully applied in Vietnam failed

to deliver. What makes Vietnam different? That mystery justifies more effort to solve than could be

devoted to it here. However some characteristics of the Vietnam experience stand out. Much credit goes to

the evident fairness of the reforms. Equity considerations seemingly trumped efficiency concerns. While

radical, the phasing in of the reforms help to assure political buy in, reinforcing the perceptions of fairness

of the process. These characteristics may help to explain much of the rare achievement embodied in rapid

economic growth with no or with positive income distributional outcomes.

34

ANNEX

Table A.1. Exports and imports in Vietnam, USD 000

1997 1998 1999 2000 2001 2002

Agro-food exports 2 674 2 812 3 208 3 534 3 896 4090

Agro-food imports 426 430 502 624 820 929

Agro-food trade balance 2 249 2 382 2 706 2 910 3 076 3 161

Total exports 9 184 9 357 11 537 14 476 15 029 16 705

Total imports 11 565 11 625 11 735 15 629 16 218 19 732

Share of agro-food in total exports (%) 29 30 28 24 26 24

Share of agro-food in total imports (%) 4 4 4 4 5 5

Rice exports 871 1 020 1 025 668 624 726

Coffee exports 498 594 587 502 394 329

Share of rice in total agro-food exports (%) 33 36 32 19 16 18

Share of coffee and tea in total agro-food

exports (%) 19 21 18 14 10 8

2003 2004 2005 2006 2007 2008

Agro-food exports 4 381 5 239 6 330 7 489 9 186 12 115

Agro-food imports 1 254 1 486 1 945 2 284 3 240 4 441

Agro-food trade balance 3 127 3 753 4 385 5 205 5 946 7 674

Total exports 20 145 26 482 32 442 39 819 48 544 62 324

Total imports 25 075 31 402 35 941 43 012 61 449 77 986

Share of agro-food in total exports (%) 22 20 20 19 19 19

Share of agro-food in total imports (%) 5 5 5 5 5 6

Rice exports 720 950 1 408 1 276 1 490 2 896

Coffee exports 509 648 750 1 230 1 927 2 132

Share of rice in total agro-food exports (%) 16 18 22 17 16 24

Share of coffee and tea in total agro-food

exports (%) 12 12 12 16 21 18

Source: UN Comtrade, 2010.

35

Table A.2. Vietnam Living Standard Surveys (VLSSs) and Vietnam Household Living Standard Survey (VLHSSs)

VLSS 1993 Vietnam Living Standard Survey (VLSS) 1993. This survey was undertaken from

October 1992-October 1993, with technical support from the World Bank. It applied a

multistage cluster sampling procedure on two strata (rural and urban areas) to select a nationally

and regionally representative sample of 4 800 households with 23 839 individuals. The main

topics are household income and expenditure, housing, education, health, employment,

agricultural activities, non-farm business activities, migration, fertility, savings and credit, basic

economic infrastructure, and social services. The survey use three types of questionnaire: a

household questionnaire, a community questionnaire and a price questionnaire which write the

exact questions to be asked in order to ensure that each question was understood in the same

way by interviewers and respondents. The data collection method consisted of face-to-face

interviews.

VLSS 1998 This survey started in December 1997, completed in November 1998. It followed the same

format and organisation of VLSS 1993. It used a multistage cluster sampling procedure for a

sample of 6 000 households with 28 509 individuals. Representative at national, urban and rural

and regional levels.

VHLSS 2002 Vietnam Household Living Standard Survey (VHLSS). It was carried out during the whole year

of 2002. VHLSS 2002 incorporates many aspects of the VLSS 1993 and VLSS 1998 as well as

many characteristics of the Multi-purpose Household Survey (MPHS). Topics covered were:

Basic demographic information on all household members (age, sex, relationship to head);

household expenditures (food, education, health, etc.); household income (wages and salary,

farm production, non-farm production; remittances, etc.); employment and labour force

participation; education (literacy, highest diploma, fee exemption); health (use of health

services, health insurance); housing (type of housing, electricity, water source, toilet, etc.);

assets and durable goods; participation in poverty programs; information on local infrastructure

collected by a community questionnaire. The survey sample was 75 000 households, but only

30 000 households with complete information, representative at national and regional levels.

VHLSS 2004

VHLSS 2006

The VHLSS 2004 and VHLSS 2006 used 2 types of questionnaire to collect information. The

household questionnaire (for Income and Expenditure sample) includes about 400 questions on

10 different topics: demographic characteristics; education and vocational training; health and

health care; income; expenditure; fixed assets and consumer durables; housing, water and

sanitation; participation in the poverty alleviation and hunger eradication programme and credit;

agriculture, forestry and aquaculture (expanded); and business other than agriculture, forestry

and aquaculture (expanded). The commune questionnaire consists of 10 sections: survey

information; demographic characteristics and general situation of the commune; general

economic status and assistance programmes; opportunity for non-farm employment; agriculture

and land; infrastructure; education; health; public security and social issues; credit and saving.

The sample for the income and expenditure survey covering all 10 sections of the questionnaire

consists of 9 189 households and is representative of the whole country, urban, rural and

8 regions.

Source: GSO, 1993, 1998, 2002, 2004, 2006.

36

Table A.3. General characteristics of the households

VHLSS 1993 VHLSS 1998 VHLSS 2002 VHLSS 2004 VHLSS 2006

Age of head of household (years) 45 48 48 49 49

Household size (No. of people per family)

5.0

4.8

4.5

4.4

4.3

Table A.4. Land size structure in 2006

2006 <0.2 ha 0.2-0.5 ha 0.5-2 ha >2 ha Total

No. of households by agricultural production land size 3 753 454 4 259 744 2 956 742 683 538 11 653 478

Percentage 32% 37% 25% 6%

No. of households by paddy production land size 4 398 933 3 436 289 1 266 347 228 921 9 330 490

Percentage 47% 37% 14% 2%

Source: Agricultural Census 2006.

Table A.5. Percentage of households with different years of schooling, by survey year

Schooling years VHLSS 1993 VHLSS 1998 VHLSS 2002 VHLSS 2004 VHLSS 2006

Rural households

0 13.7 10.8 11.0 8.5 9.2

1 2.4 1.5 2.4 2.1 1.7

2 6.0 5.8 6.0 6.0 5.0

3 8.9 8.6 7.2 7.8 7.1

4 7.5 7.4 7.9 7.1 7.2

5 12.7 14.0 11.0 11.4 12.0

6 5.3 4.9 6.7 6.1 5.9

7 4.1 4.0 7.2 6.0 5.6

8 5.0 3.9 3.9 4.4 4.4

9 22.1 18.3 22.9 24.8 26.3

10 2.1 6.1 2.3 2.5 2.4

11 2.8 2.8 1.8 1.8 1.9

>=12 7.5 11.9 9.8 11.5 11.1

Urban households

Schooling years VHLSS 1993 VHLSS 1998 VHLSS 2002 VHLSS 2004 VHLSS 2006

0 8.3 5.9 6.9 4.6 4.1

1 1.5 1.0 1.4 1.3 1.0

2 4.4 4.1 2.8 3.7 3.3

3 6.2 5.6 4.5 4.9 4.4

4 5.6 4.4 4.7 5.0 4.1

5 10.4 9.8 8.4 9.2 7.9

6 7.7 4.6 5.5 4.8 4.9

7 5.0 3.9 6.1 3.9 4.3

8 4.2 3.8 3.4 3.0 3.8

9 19.0 15.7 19.4 19.1 19.6

10 3.5 4.7 4.3 3.5 3.8

11 4.9 3.4 2.8 3.3 3.3

>=12 19.4 33.0 29.9 33.8 35.6

37

Mean

0

.05

.1

.15

Pro

babili

ty d

ensity function

0 6 12 18 24 30

Real expenditures, VND 000, '000

Total

Urban

Rural

1993

Mean

0

.02

.04

.06

.08

.1

Pro

babili

ty d

ensity function

0 15 30 45 60 75

Real expenditures, VND 000, '000

1998

Mean

0

.02

.04

.06

.08

Pro

babili

ty d

ensity function

0 15 30 45 60 75

Real expenditures, VND 000, '000

2002

Mean

0

.02

.04

.06

Pro

babili

ty d

ensity function

0 15 30 45 60 75

Real expenditures, VND 000, '000

2004

Mean

0

.01

.02

.03

.04

.05

Pro

babili

ty d

ensity function

0 20 40 60 80 100

Real expenditures, VND 000, '000

2006

Figure A.1. Changes in level of expenditures various years in Vietnam

Source: VHLSS 1993, 1998, 2002, 2004, 2006.

38

0

.2

.4

.6

.8

1

Lore

nz

curv

e

0 .2 .4 .6 .8 1

Cumulative population proportion

1993, Gini=36.43

2006, Gini=35.26

Total

1993, Gini=36.55

2006, Gini=32.72

0

.2

.4

.6

.8

1

Lore

nz

curv

e

0 .2 .4 .6 .8 1

Cumulative population proportion

Urban

1993, Gini=32

2006, Gini=31.6

0

.2

.4

.6

.8

1

Lore

nz

curv

e

0 .2 .4 .6 .8 1

Cumulative population proportion

Rural

Figure A.2. Gini-coefficient in total, urban and rural areas in Vietnam

Source: VHLSS 1993, 1998, 2002, 2004, 2006.

39

Table A.6. Dataset used in regressions

Regions Year Agriculture

Income Industry Income

Services Income

General Poverty

Rate

Food Poverty

Rate

1 1993 1 967.79 3 823.38 8 297.78 61.24 25.02

1 1998 2 398.06 7 097.62 7 284.13 29.27 8.45

1 2002 3 511.21 7 214.17 8 532.47 22.44 5.31

1 2004 4 503.97 7 172.18 9 309.33 12.14 2.33

1 2006 4 835.05 8 372.80 9 438.87 8.82 2.07

2 1993 1 476.57 2 875.93 3 414.30 78.86 37.95

2 1998 2 290.66 6 607.52 5 583.37 62.04 30.93

2 2002 3 164.36 8 393.82 8 436.83 38.43 15.43

2 2004 3 231.51 9 310.47 10 993.73 29.38 11.38

2 2006 3 736.95 10 541.78 11 345.70 25.02 9.46

3 1993 2 091.53 9 414.84 9 583.22 80.98 35.66

3 1998 2 785.62 10 294.93 8 270.42 73.35 38.46

3 2002 2 414.88 7 707.95 7 698.02 68.03 46.07

3 2004 2 825.73 6 901.68 7 920.10 58.57 34.77

3 2006 3 079.66 17 251.77 9 666.38 49.05 29.87

4 1993 1 628.67 2 377.08 3 864.03 74.54 35.51

4 1998 2 207.30 5 145.15 7 368.37 48.09 19.02

4 2002 2 846.08 6 240.18 6 997.05 43.90 17.50

4 2004 3 153.52 7 293.01 7 410.61 31.90 13.57

4 2006 3 782.16 8 263.69 8 770.53 29.12 14.31

5 1993 1 369.99 3 207.44 4 506.51 47.20 22.76

5 1998 3 182.42 11 789.92 6 994.25 34.46 15.87

5 2002 3 919.57 6 515.55 7 505.30 25.15 8.96

5 2004 4 436.22 6 982.39 9 003.87 19.01 8.13

5 2006 4 852.40 9 544.44 10 202.35 12.57 4.84

6 1993 1 402.69 4 979.16 6 378.41 61.23 27.54

6 1998 4 477.16 9 485.82 21 074.00 52.40 31.48

6 2002 3 727.75 6 548.35 8 236.18 51.76 29.53

6 2004 5 042.54 7 877.42 10 082.55 33.12 18.79

6 2006 6 609.63 8 927.53 11 366.26 28.64 16.40

7 1993 1 954.65 3 204.38 7 134.32 40.04 13.47

7 1998 4 798.35 6 230.35 8 919.43 12.19 4.98

7 2002 5 680.11 11 529.84 13 504.13 10.54 3.00

7 2004 7 495.82 10 943.38 13 766.04 5.37 1.46

7 2006 8 505.07 11 726.67 12 729.56 5.83 2.32

8 1993 2 806.40 4 681.80 5 510.23 47.10 17.66

8 1998 4 452.10 5 890.89 7 737.27 36.92 11.25

8 2002 5 456.68 7 581.12 7 564.16 23.37 6.46

8 2004 5 857.75 6 943.45 8 737.10 15.85 3.95

8 2006 6 995.79 7 474.45 9 099.13 10.30 2.70

40

REFERENCES

Alston, J. and W. Martin (1995), “Reversal of Fortune: Immiserizing Technical Change in Agriculture”,

American Journal of Agricultural Economics, Vol. 77, No. 2 (May, 1995), pp. 251-259.

Alston, J., J. Beddow and P. Pardey (2009), “Mendel versus Malthus: Research, Productivity, and Food

Prices in the Long Run”, InSTePP Working Paper, St Paul: University of Minnesota, January 2009.

Athukorala (2006), “Trade Policy Reforms and the Structure of Protection in Vietnam”, World Economy

29(2): 161-87.

Arthukorala, P., P. Huong and V. Thanh (2009), “Distortions to Agricultural Incentives in Vietnam,

Agricultural Distortions Research Project Working Paper 26. The World Bank Group.

ASTI-IFPRI (2010), Database on Agricultural Science and Technology Indicators, IFPRI.

AusAID (2002), “Vietnam Poverty Analysis”, Australian Agency for International Development by the

Centre for International Economics.

Balisacan, A. M., E. M. Pernia, G.E.B. Estrada (2003), “Economic Growth and Poverty Reduction in Viet

Nam”, ERD Working Paper Series No. 42, Economic and Research Department, Asian

Development Bank, June 2003.

Benjamin, D. and L. Brandt (2002), "Agriculture and Income Distribution in Rural Vietnam under

Economic Reforms: A Tale of Two Regions", Working Papers benjamin-02-01, University of

Toronto, Department of Economics.

Bourguignon (2003), “The growth elasticity of poverty reduction: explaining heterogeneity across

countries and time periods”, Working Paper No. 2002-03. Centre Bational de la Recherche

Scientifique. École des Hautes Études en Sciences Sociales. École Normale Supérieure.

Che, T. N.; Kompas, T. and Vousden, N. (2006), "Market reform, Incentives and Economic Development

in Vietnamese Rice Production", Comparative Economic Studies, Vol. 48, 277-301.

Christiaensen, L. and L. Demery (2007), Down to Earth Agriculture and Poverty Reduction in Africa, The

World Bank Group.

Deininger, K. and J. Songqing (2003), “Land Sales and Rental Markets in Transition: Evidence from Rural

Vietnam”, World Bank Policy Research Working Paper 3013, April 2003.

Do, Q. T. and L. Iyer (2002), "Land Rights and Economic Development: Evidence from Vietnam",

Department of Economics.

Dollar, David (1994), “Macroeconomic Management and the Transition to the Market in Vietnam”,

Journal of Comparative Economics 18(3): 357–75, World Bank, Policy Research Department,

Washington, DC.

Dollar, David, and Jennie Litvack (1998), “Macroeconomic Reform and Poverty Reduction in Vietnam”,

in D. Dollar, P. Glewwe, and J. Litvack, eds., Household Welfare and Vietnam’s Transition,

Washington, DC.

FAOSTAT (2010), FAO online database, FAO.

Fuglie, K. (2008), “Is a Slowdown in Agricultural Productivity Growth Contributing to the Rise in

Commodity Prices”, Agricultural Economics 39 (2008) Supplement 431-441.

41

Glewwe, Paul, Michele Gragnolati, and Hassan Zaman (2000), “Who Gained from Vietnam‟s Boom in the

1990s? An Analysis of Poverty and Inequality Trends”, Policy Research Working Paper 2275,

World Bank.

Glewwe, P. (2004) in P. Glewwe, N. Agrawal, and D. Dollar, eds., “Economic Growth, Poverty, and

Household Welfare in Vietnam”, Washington, DC: World Bank.

GSO (2006), Agricultural Census 2006.

GSO (2010), General Statistics Office of Vietnam, Online Database.

Kompas, T., Che, T. N. Che, H. Q. Nguyen and J. T. M. Nguyen (2009), "Productivity, Net Returns and

Efficiency: Land and Market Reform in Vietnamese Rice Production", Crawford School of

Economics and Government Working Papers 09-02, Australian National University, Canberra.

Leung and Riedel (2001), “The Role of the State in Vietnam‟s Economic Transition”, Asia Pacific School

of Economics and Government, Working Papers 01-1, Australian National University, Canberra.

Ligon, E. and E. Sadoulet (2008), “Estimating the Effects of Aggregate Agricultural Growth on the

Distribution of Expenditures”, Background paper for the World Development Report 2008, World

Bank.

Loayza, N. and N. Raddatz (2006), “The Composition of Growth Matters for Poverty Alleviation”,

WPS-4 077, The World Bank Group.

Moock, Peter R. & Patrinos, Harry Anthony & Venkataraman, Meera (1998), "Education and earnings in a

transition economy (Vietnam)," Policy Research Working Paper Series 1920, The World Bank.

Montalvo and Ravallion (2009), “The Pattern of Growth and Poverty Reduction in China”, Policy

Research Working Paper 5069. World Bank.

PRS-Group (2009), International Country Risk Guide, www.icrgonline.com.

Ravallion, M. (1997), “Can High-inequality Developing Countries Escape Absolute Poverty?", Economic

Letters 56 (1997) 51-57.

Ravallion, M. and G. Datt (1996), “How Important to India‟s Poor is the Sectoral Composition of

Economy Growth?”, The World Bank Economic Review, 10 (1), 1-25.

Ravallion, M. and G. Datt (2002), “Why Has Economic Growth Been More Pro-Poor in Some States of

India Than Others?”, Journal of Development Economics, 65: 381–400.

Ravallion, M. and S. Chen (2007), “China‟s (Uneven) Progress Against Poverty”, Journal of Development

Economics.

Ravallion and van de Walle (2009), “Land in Transition: Reform and Poverty in Rural Vietnam”, The

World Bank Group.

SRV (2006), Socialist Republic of Vietnam (SRV) (2006), The Five-Year Socio-Economic Development

Plan 2006-2010.

Tuan A. P. (2008), Vietnam Country Case Study: Background Paper for the Chronic Poverty Report 2008-

09, Chronic Poverty Research Centre.

UN Comtrade (2010), UN-Comtrade database.

UNDP (2009), “Human Development Report”, 2009.

Van den Broeck, K., C. Newman and F. Tarp (2007), “Land Titles and Rice Production in Vietnam”,

Trinity Economic Papers, TEP Working Paper No. 1207, Vietnamese Academy of Social

Sciences (VASS), 2006, “Vietnam Poverty Update Report 2006: Poverty and Poverty Reduction in

Vietnam 1993-2004”, Hanoi, Vietnam.

42

World Bank (2004), “Economic Growth, Poverty, and Household Welfare in Vietnam”, Regional and

Sectoral Studies. Edited by Glewwe, P. Agrawal, and Dollar, D., The World Bank Group.

World Bank (2005), “Introduction to Poverty Analysis”, World Bank Group.

World Bank (2008), “World Development Report: Agriculture for Development”, The World Bank Group.

World Bank (2010), World Development Indicators (WDI), online database accessed in 2010.


Recommended