Guido Alfani PAM - Bocconi University Dondena Centre and IGIER Via Roentgen 1, 20136 Milan - Italy [email protected]Economic inequality in northwestern Italy: a long-term view (fourteenth to eighteenth centuries) (provisional version – please ask for author’s consent to quote) 1
Economic inequality in northwestern Italy: a long-term view
(fourteenth to eighteenth centuries)
(provisional version – please ask for author’s consent to quote)
1
Abstract
This article provides a comprehensive picture of economic inequality in northwestern Italy
(Piedmont), focusing on the long-term developments occurred during 1300-1800 ca. Regional
studies of this kind are rare, and none of them has as long a timescale. The new data proposed
illuminate many little-known aspects of wealth distribution and general economic inequality in
preindustrial times, and support the idea that during the Early Modern period, inequality grew
everywhere: both in cities and in rural areas, and independently from whether the economy was
growing or stagnating. This finding challenges earlier views that explained inequality growth as the
consequence of economic development. The importance of demographic processes affecting
inequality is underlined, and the impact of severe mortality crises, like the Black Death, is analyzed.
Keywords
Economic inequality; wealth concentration; middle ages; early modern period; Piedmont; Sabaudian States; Italy; plague; Black Death
Acknowledgements
The research leading to these results has received funding from the European Research Council
under the European Union’s Seventh Framework Programme (FP7/2007-2013)/ERC Grant
agreement No. 283802, EINITE-Economic Inequality across Italy and Europe, 1300-1800.
2
The history of long-term trends in economic inequality is still largely to be written. After decades of
research, mostly generated by Simon Kuznets' seminal 1955 article which introduced the notion that
inequality would follow an inverted-U path through the industrialization process (the so-called
‘Kuznets curve’)1, we now have a good knowledge of the developments in inequality through the
last couple of centuries, although only for selected countries like Britain, France, Italy, Spain, and
the U.S. (Williamson 1985; Piketty, Postel-Vinay, Rosenthal 2006; Rossi, Toniolo, Vecchi 2001;
Prados de la Escosura 2008; Lindert, Williamson 1980). The picture is an entirely different one if
we consider the earlier epochs. For the Middle Ages and Early Modern period, the only published
work covering a large area in the long run is still Van Zanden's study of the provinces of Holland
and Overijssel in the Low Countries (Van Zanden 1995; Soltow, Van Zanden 1998). However, in
recent years a growing number of mostly European scholars have been busy collecting new archival
data useful to reconstruct long-term trends in economic inequality. Also due to the very time-
consuming nature of archival research in this specific field, these works have focused on single
cities or small areas, like Ivrea and the Canavese in northern Italy (Alfani 2009; Alfani 2010a;
2010b), Nivelles, Aalst and Hertogenbosch in the Low Countries (Ryckbosch 2010; 2012; Hanus
2012), and some rural regions around Madrid in Spain (Santiago-Caballero 2011; Santiago-
Caballero and Fernández, 2013). To these, a recent study of Bursa in Anatolia can be added
(Canbakal 2013). Older works tended to depend on exceptional sources and consequently focused
on one year or very short time periods only. The most celebrated examples are surely Herlihy's
works on the Florentine catasto of 1427 (Herlihy 1977; Herlihy, Klapisch-Zuber 1985).
All the above-mentioned studies have one thing in common: they focused on hard data, dug from
the archives, to produce direct measures of inequality. Recently, more theoretical/interpretative
paths have also been followed, with works relying on a large number of hypotheses to supplement a
serious lack of data - actually even proposing, like in the case of Williamson's recent study of Latin
American inequality since 1491, to write a ‘History without Evidence’ (Williamson 2009). In other
cases, the evidence used was simply scarce and scattered in time. It was enough, however, to allow
Milanovic, Williamson and Lindert to introduce the exciting new idea of the ‘inequality possibility
frontier’, to be considered as the reference level for estimating the actual degree of ‘extraction’ of
inequality characterizing a given society (Milanovic, Williamson, Lindert 2011). The authors listed
among their sources just eight observations or studies for all the centuries from the fourteenth to the
eighteenth, of which six involved just the final century (admittedly, they used even less material
1 According to Kuznets, inequality (of income) would increase at the beginning of industrialization, starting from relatively low pre-industrial levels. It would then decrease during the first stages of the industrialization process (Kuznets 1955).
3
than was available at the time of publication). This was enough, however, to deeply change the way
in which we consider long-term changes in inequality; I will develop the matter in greater detail
later. Finally, a recent paper by Alfani and Frigeni focused on the changes in how inequality was
perceived, attempting to infer them from the (very slow and rather late) development in time of a
discourse on economic equality/inequality, and suggesting that such changes interacted in complex
ways with actual changes in inequality levels (Alfani and Frigeni 2013).
These theoretical works are essential to provide us with a proper conceptual and interpretative
framework to capture the real meaning of long-term changes in inequality levels - but they are no
substitute for actual data, unless in those cases (like Latin America) in which the necessary
information cannot be produced. At least in the case of central and western Europe, and possibly
also for other areas of the world, the information, while not being currently available, can be
obtained from new archival research. Given the conditions of this scholarly field, in which the
available data have never been abundant and exciting new ideas in need of empirical confirmation
are flourishing, the call for new research and the publication of new data is a particularly strong
one. This paper intends to answer to such a call, by proposing the second only study of a large area
over a long period of time ever attempted after Van Zanden's seminal work on the Low Countries.
That area is northwestern Italy, and in particular the domains of the House of Savoy which today
broadly correspond to the Piedmont region. This is a very important part of Italy, as starting from
their Piedmontese domains, the Savoy played a fundamental role in the process of unification of the
country. While this process was completed only during the nineteenth century (1861), in the earlier
centuries the House of Savoy continually increased its domains, acquired the title of kings, and built
what was probably, by the eighteenth century, the most powerful and ‘modern’ of the independent
states present in the Peninsula. From the point of view of the information available, Piedmont is
also a particularly interesting area due to the relatively abundant and fairly complete documentation
about economic inequality, starting from quite ancient times. The earlier documentation used by
this article dates to the first half of the fourteenth century (pre-Black Death) and the latest to the
beginning of the nineteenth century. As a consequence, the time series of inequality measures
presented here are the longest to have ever been published, spanning up to four-five centuries.
The first section of the article provides a general overview of Piedmont and the Savoy domains
during the late Medieval and Early Modern period. The second details the sources used, the estimi
(property tax registers), which are informative of different components of wealth. The third
provides a descriptive analysis of inequality changes in the long run. The fourth develops a specific
4
topic, that is the impact on inequality levels of severe mortality crises, particularly due to plague,
from the Black Death up until the last plagues in the seventeenth century. The fifth section moves
on from community-level time series to propose an estimation of trends in inequality in the whole
of Piedmont. The sixth section provides a general discussion, also in the light of a comparison
between northwestern Italy and Holland.
1. Piedmont under the House of Savoy: an overview
Today the Italian region of Piedmont, which occupies the northwestern corner of the Peninsula, is
delimited by the Alps and the Apennines to the West, North and South, while to the East its
boundaries closely match those of the maximum expansion reached by the Savoy domains in the Po
Plain before the nineteenth century. Until recently, this area had been relatively neglected by
international scholarship, partly due to the fact that it was not among the main protagonists, neither
economically nor culturally, of the Italian Renaissance. However, a new wave of ‘Sabaudian
studies’ seems currently in full development (see in particular Vester 2013). In their turn, Italian
historians are well aware of the importance of Piedmont, as during the late Medieval and Early
Modern period it saw the development of what was, by the eighteenth century, the most advanced
and powerful regional state of Italy, one which had managed to preserve its independence and
which later played a fundamental role in the process of national unification culminating with the
proclamation of the Kingdom of Italy in 1861.
From the late Middle Ages and through the Early Modern period, the history of this area is very
much the history of the expansion of the Italian domains of the House of Savoy, which at that time
also ruled over parts of present-day France and Switzerland and controlled many key transalpine
transit routes. Count Amedeus VI (1334-83) was the first ruler of the family to look at Piedmont as
the area where expansion was most viable (as to the West, the development of the Kingdom of
France made territorial acquisitions extremely difficult, if not altogether impossible) gaining control
over a number of territories and cities, including Ivrea - one of the cases studied here. His
grandchild, Amedeus VIII (1383-1451) further extended the Sabaudian domains in Italy, creating
the so-called Principality of Piedmont which incorporated cities like Chieri, also comprised in this
study (Amedeus VIII was the first Savoy to enjoy the title of Duke, since 1416). During the Italian
Wars (1494-1559), Piedmont was a much-contested land, and subject to French occupation from
1536 until the Peace of Cateau-Cambrésis (1559) which ended the conflict; Ivrea is one of the few
5
cities that the Savoys managed to preserve from occupation, thanks to their Spanish allies (for
details about the Italian Wars in Piedmont, see Alfani 2013a, 17-8, 29-32). The third city considered
by this article, Cherasco, was acquired in this period (1529).
In 1563, the Savoy moved their capital from Chambéry to Turin, a further step in defining the
increasingly Italy-orientated politics of the family. In 1588, the Marquisate of Saluzzo was seized
and incorporated into the Sabaudian domains. The last two cities considered by this article, Saluzzo
(the marquisate's capital) and Carmagnola, were acquired on this occasion. Consequently, and also
considering the rural communities comprised in the database (see next section), all the cases
developed here relate to places which have been not only Piedmontese, but also 'Sabaudian' since
fairly ancient times. It will suffice then, to mention the next main steps into the eastwards expansion
of the House of Savoy, that, as already clarified, also was the process through which present-day
Piedmont was created: the War of the Mantuan Succession (1628-31), when much of the Montferrat
was acquired (as well as the castle of San Giorgio, another of the communities studied here); the
War of the Spanish Succession (1701-13), when the rest of Montferrat and the Lomellina were
acquired (as well as Sicily and the connected title of Kings, which the Savoys had long desired); the
War of the Polish Succession (1733-38) when Langhe and the territory of Novara were acquired;
and finally the War of the Austrian Succession (1741-48) when the territories of Vigevano and
Voghera were acquired2.
It would be impossible to detail here the characteristics of such a complex territory as Piedmont and
of a state as complex as that ruled by the House of Savoy; for these, reference should be made to
general literature (Merlin et al. 1994; Barbero 2008; Vester 2013). However, something more
should be said about one specific aspect: the fiscal system in use in the region in the period covered
by this article, as it is crucial to understand the nature of the sources used. In fact, 'systems', plural,
would be more accurate, not only because for part of the period the communities considered did not
belong to the Sabaudian domains, but also because well into the eighteenth century local rules
continued to be fundamental in defining the distribution of the tax burden among taxpayers. In the
agreements with which every newly acquired city accepted the rule of the House of Savoy, the right
to distribute the tributes due to the central authority on the grounds of the local statutes was usually
recognized to the community. The statutes included rules about what precisely had to be considered
for calculating the share of local and supra-local taxes due by each household; in other words, the
statutes defined the rules according to which was to be redacted the estimo (the property tax record).
2 Vigevano and Voghera are the only areas which were 'given back' to Lombardy after the national unification and are not part of present-day Piedmont.
6
During the Early Modern period, the fiscal reform introduced by the duke Emanuel Filibert (1553-
80) had at its core a new tribute, the tasso, imposed for the first time in 1562. It was a direct tax,
levied on each community, which was originally presented as an extraordinary tribute but which in
time became, de facto, an 'ordinary' tribute. The overall revenue was fixed, but the exact amount
due by each community could change and was the object of negotiation (Vester 2001; Alfani
2013c). Each community decided by itself how to pay the Tasso, and most of them ended up
distributing the burden proportionally to each household's share of the local estimo, that is
proportionally to the value of the household's taxable possessions. The tasso was strengthened
under Emanuel Filibert's son, Charles Emanuel I (1580-1630), becoming the main fiscal instrument
of the Sabaudian domains. It has been argued that the presence of the tasso, which quickly came to
be levied each year, required that the Piedmontese communities kept up-to-date property tax
records, to ensure that the burden was distributed fairly among taxpayers. This would explain the
relative abundance of estimi available for this area during the Early Modern period (Alfani 2010a,
519-20)3. As a final note, it should be noticed that the fiscal system which developed in Piedmont
during the Early Modern period is widely considered one of the most advanced in the Italian
peninsula, crucial in allowing the House of Savoy to build its considerable military power (Stumpo
1979; Pezzolo and Stumpo 2008; Pezzolo 2012). The fundamental role that the estimi played in this
system, providing the matrix which transferred the burden from communities as a whole to single
households, has largely been overlooked by the literature and will be the object of future
publications.
2. The sources and the database
Even after the introduction of state-level ordinary tributes during the sixteenth century the
communities of Piedmont continued to make use of detailed books recording taxable property (the
estimi or catasti) in order to distribute the fiscal burden among households. These books were
usually renewed every few decades; updates were often made directly on the original, or books of
‘corrections’ to the estimi were kept. Of the latter, very few survived and/or allow to reconstruct
wealth distribution on a yearly basis4. In general, this situation is common throughout Italy, more
clearly in the centre and North as well as in those areas of the South where feudal property was not
3 Of course, apart from the tasso many other tributes were levied, but they are not very relevant for the aims of this article; about them, see Stumpo 1979; Vester 2001; Alfani 2013c. 4 As a matter of fact, just one study of this kind exists, involving the city of Ivrea and covering yearly the period 1620-74: Alfani 2010a; 2010b.
7
dominant. The estimi are particularly convenient for conducting large-scale studies, as they show an
impressive stability through space and time. Through time, they tend to preserve the original
characteristics conferred by the Medieval city statutes up until the introduction of the ‘modern
cadastre’ and the connected fiscal reforms. This happened no earlier than the eighteenth century and
in fact, the Kingdom of Sardinia was the first to introduce a modern cadastre in Italy. Even after this
innovation imposed by the central state, many communities continued to update their estimi,
sometimes up until the early nineteenth century. Through space, not only are the estimi fairly
homogeneous sources across Italy, but they also exist for a larger European area including southern
France, Catalunia and other northeastern Spanish regions, much of Germany, and possibly others.
This is a reason why large-scale comparative projects on European inequality should pay particular
attention to these sources, as is the case with the project EINITE - Economic Inequality across Italy
and Europe, 1300-1800 which is also the research framework within which most of the data used
by this article was produced.
The Italian estimi can be distinguished in two broad categories: estimi ‘per property’ (per capitale),
and estimi ‘per yield’ (per reddito). The registers falling into the first category record only real
estate (lands and building), while those in the second category also include capitals, credits and
other movables (Pini 1981; Alfani and Caracausi 2009). The famous Florentine catasto of 1427
falls into the second category, however the first one is much more common. All of the sources used
in this article are estimi per property. Consequently, they track only one of the many components of
wealth - although it is by far the main one. For preindustrial societies, in which most of the product
was agrarian, wealth inequality is a good proxy of income inequality, not only because the property
of land (or more precisely, the right to the use of land) was of great importance in defining how the
total product was distributed, but also because it is very unlikely that, in such a society, income and
wealth inequality could move in different directions - a particularly important circumstance as the
way in which inequality changes is more relevant, in the long run, than its level; see discussion in
section 3. What is more, even for the period of the Industrial Revolution it has been argued that
concentration of wealth followed the same path as that of income (Lindert 1991, 215). Finally, in
most circumstances wealth inequality is the only possible proxy for preindustrial income inequality.
As a rule, the Italian estimi include only taxable property, consequently they omit feudal property
and the property owned by the Church (more specifically, by religious institutions such as
monasteries or cathedral chapters) ab antiquo ('since ancient times'). However they include the
property acquired by the Church after the estimi were introduced, as this was not, or not fully,
8
exempt (see for example the case study of Ivrea, Alfani 2010a). Sometimes, however, exempt
property was included in the registers but it was not considered when calculating the tax
distribution. Among the cases analysed here, the city of Saluzzo recorded exempt Church property
in 1685, and in 1772 recorded exempt feudal and Church property, while in 1577, 1729 and 1739
the records only involve taxable property. As usual in these cases, in 1685 and 1772 exempt
property was listed and described, but not given a value5. For this reason, and also for building a
series of inequality measurements as homogeneous as possible, exempt property has simply been
ignored.
A clarification is also needed about what an estimo value is: the value given to taxable property was
not a market value, but a measure of the fiscal capacity generated by each piece of property (which
is also why in some instances the house where the family lived was not subject to taxation6). While
we can reasonably assume that the estimo value was proportional to the market value, it is difficult
to convert it into market values (and consequently, to compare directly values found in the estimi of
different communities) as it was expressed in lire d'estimo, which were local in nature (each
community had its own lira d'estimo) and were pure units of measurement, not corresponding to
any coined money nor used in any kind of transaction. This did not create any problem in their use7
at the time, nor is it a problem when comparing local measures like the Gini index, which is a pure
number. It has, however, consequences when attempting to combine the local series into aggregate
series; see section five.
The estimi available for Piedmont are exceptionally ancient. In fact, like Tuscany this is one of the
Italian regions where the most ancient documentation of this kind has survived - although for no
other area of Italy (or Europe) have time series as long as those presented here ever been published.
After a thorough check of the Piedmontese archives, the case studies to include in the database have
been selected according to these requirements: 1) antiquity of the earlier usable sources; 2)
completeness of the time series; 3) territorial coverage; 4) representation of both cities and rural
communities. While most of the data are new, the database integrates some pre-existing
information, particularly for the city of Ivrea and the surrounding rural area (the Canavese) (Alfani
2009; 2010a). Overall, the database includes 16 communities - but just 12 time series, as 7 rural
communities of the Canavese are grouped by the sources in three aggregates. The database includes
5 About the estimi of Saluzzo, also see Ammannati, De Franco and Di Tullio 2013. 6 Among the communities considered here, this is the case only for Cherasco, and only from 1548. 7 The estimi values allowed easy definition of the tax that every owner had to pay: given that the total value, as expressed in lire d’estimo, of the taxable estate of each community was known, the value of the taxable estate of each owner could be used to define his share of the overall estimo, and consequently to determine his tax burden.
9
five cities of varying size: Chieri (from 1311), Cherasco (from 1347), Carmagnola (from 1461),
Ivrea (from 1466) and Saluzzo (from 1577). On average, the time series related to rural
communities begin later, and include Vigone (from 1454), Cumiana (from 1496), San Giorgio
(from 1523). The time series for the Canavese villages all start in 1629, and involve three
aggregates: Bollengo and Borgofranco; Palazzo and Piverone; Samone, Salerano and Banchette.
Figure 1 shows the position of each community within Piedmont and the domains of the House of
Savoy.
10
Figure 1. Communities comprised in the database (political boundaries of the Kingdom of Sardinia,
ca. 1750)
11
For each community, all or almost all the available documentation has been used. When over-
abundant information was available, the general rule has been to take, for each community, the
observation closer to 50-years breakpoints (1300, 1350, 1400, etc.), when available. In some
instances, like that of Ivrea for which much data for the sixteenth and especially the seventeenth
century has been published (Alfani 2010a), only breakpoints have been considered. In some other
instances, and especially for those cities that elaborated the estimo on a quarter-per-quarter basis,
we had to recompose a single observation from sources having slightly different dates. For example,
the observation for Cherasco 1395-1415 is the merger of the four estimi redacted for each of the
quarters of St. Iffredo (1395); St. Martino (1395); St. Margherita (1402); St. Pietro (1415). Table 1
summarizes the observations available for each community and also provides additional
information, in particular about their estimated demographic size in time.
Table 1. Composition of the database
Community Urban
/
Rural
Estimi used (year) Population
(year of reference between
parentheses)
Bollengo and
Borgofranco
R 1629; 1649 Bollengo: 1,573 (1612);
Borgofranco: 587 (1612)
Carmagnola U 1461; 1491; 1579; 1734 7,205 (1612); 8,856 (1734)
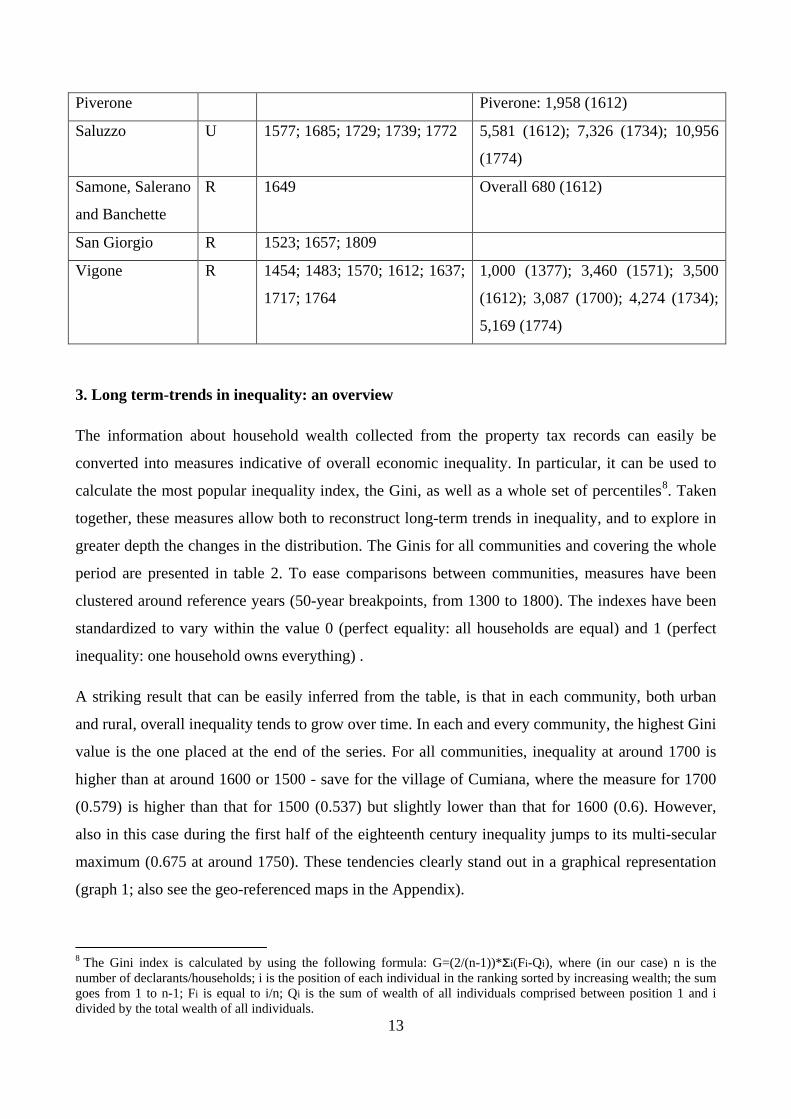
The information about household wealth collected from the property tax records can easily be
converted into measures indicative of overall economic inequality. In particular, it can be used to
calculate the most popular inequality index, the Gini, as well as a whole set of percentiles8. Taken
together, these measures allow both to reconstruct long-term trends in inequality, and to explore in
greater depth the changes in the distribution. The Ginis for all communities and covering the whole
period are presented in table 2. To ease comparisons between communities, measures have been
clustered around reference years (50-year breakpoints, from 1300 to 1800). The indexes have been
standardized to vary within the value 0 (perfect equality: all households are equal) and 1 (perfect
inequality: one household owns everything) .
A striking result that can be easily inferred from the table, is that in each community, both urban
and rural, overall inequality tends to grow over time. In each and every community, the highest Gini
value is the one placed at the end of the series. For all communities, inequality at around 1700 is
higher than at around 1600 or 1500 - save for the village of Cumiana, where the measure for 1700
(0.579) is higher than that for 1500 (0.537) but slightly lower than that for 1600 (0.6). However,
also in this case during the first half of the eighteenth century inequality jumps to its multi-secular
maximum (0.675 at around 1750). These tendencies clearly stand out in a graphical representation
(graph 1; also see the geo-referenced maps in the Appendix).
8 The Gini index is calculated by using the following formula: G=(2/(n-1))*Σi(Fi-Qi), where (in our case) n is the number of declarants/households; i is the position of each individual in the ranking sorted by increasing wealth; the sum goes from 1 to n-1; Fi is equal to i/n; Qi is the sum of wealth of all individuals comprised between position 1 and i divided by the total wealth of all individuals.
13
Table 2. Gini indexes of wealth concentration in northeastern Italy, fourteenth-early nineteenth century (Ginis clustered around reference years; actual year between parentheses)
Year Cities Rural communities Carmagnol
a Cherasco Chieri Ivrea Saluzzo Bollengo
and Borgofran
co
Cumiana Fiorano Palazzo and
Piverone
Samone, Salerano
and Banchette
San Giorgio
Vigone
1300
0.715 (1311)
1350
0.63 (1347-54)
1400
0.546 (1395-1415)
1450
0.567 (1461)
0.521 (1447-50)
0.669 (1437)
0.638 (1466)
0.633 (1454)
1500 0.599 (1491)
0.744 (1514)
0.673 (1518)
0.537 (1496)
0.513 (1523)
0.708 (1483)
1550
0.627 (1530-48)
0.658 (1544)
0.572 (1558)
0.661 (1570)
1600 0.616 (1579)
0.682 (1585)
0.76 (1582)
0.657 (1593-94)
0.652 (1577)
0.72 (1629)
0.6 (1614)
0.615 (1629)
0.733 (1612)
1650
0.755 (1648)
0.697 1649)
0.747 (1685)
0.734 (1649)
0.588 (1664)
0.699 (1649)
0.641 (1649)
0.599 (1649)
0.576 (1657)
0.704 (1637)
1700
0.796 (1711)
0.847 (1707)
0.734 (1729)
0.579 (1694)
0.733 (1717)
1750 0.764 (1734)
0.742 (1739)
0.675 (1749)
0.809 (1764)
1800
0.771 (1772)
0.734 (1809)
14
Graph 1. Long-term trends in economic inequality (Gini indexes of wealth concentration)
An analysis of all inter-decile ratios (comprising those not chartered in table 3) shows clearly that
the share of wealth of the top 10% rises to the detriment of the share owned by all other groups,
including the next-richest (D9 and D8). However, the relative decline is sharper as one moves to the
lower social-economic strata. In cities, if we compare the share of wealth owned by the tenth decile
to that owned by the fifth (D10/D5) we discover that, while at around 1450 the top rich were 6 to 16
times richer than the middle ranks of society, by 1700 or 1750 they were at least 33 times richer -
even 74 times richer in Chieri (in the rural communities the situation is more varied). Increases
within this range could seem enormous, if not for the fact that they look modest compared to what
happens to the D10/D1 ratio: in the same period, in cities it moves from a range of 48-124, to one of
118-1,327 (the record value again being, predictably, that of Chieri).
The enormous increase in the share of wealth owned by the top rich compared to all other groups is
only part of the story. Not only were the top rich leaving all others behind, also the poorest strata
were distancing themselves from all others, as shown by the D5/D1 ratio. While in cities around
1450 the middle ranks were 6 to 10 times richer than the poorest strata, by 1700 or 1750 they were
between 10 and 18 times richer, with the only exception of Saluzzo which however fell into line by
around 1800. Presumably, these overall changes in the distribution reflect a continuous increase in
the mass of poor with little or no property residing in cities whose population was growing. As most
of this demographic growth was made possible by steady fluxes of rural dwellers migrating to the
cities, we can expect that the process was absent or less acute in rural areas. The ratios chartered in
the second part of table 3 confirm our expectations, as for rural communities D5/D1 is no higher is
the eighteenth century than in the sixteenth or seventeenth. However in the countryside, too, the
ratio of the top rich was outstripping all other sections of the distribution.
Something more should be said about variance in Gini levels across the communities considered.
All currently available evidence for preindustrial Europe suggests that inequality, of both income
and wealth: 1) was higher in cities than in rural areas; 2) was higher in large cities compared with
smaller ones. What is more, on a city-per-city basis, as a urban centre grew it also became more
unequal. This final observation was first made by Van Zanden (1995) and was later confirmed by
Alfani (2009, 148-50; 2010a, 528-9) on the grounds of more evidence from across the continent.
Overall, our data confirm all the above points, although more clearly regarding the cities. There is
no reason to develop the matter in detail here, as the mentioned surveys are acceptably updated. It
will suffice to mention some Italian cases, first of all that of Tuscany in 1427, where the capital city
of Florence was considerably more unequal (Gini value of 0.785) than the middling cities under its
19
rule like Pisa, Arezzo, Cortona, Prato and Volterra (Gini values about 0,75) (Herlihy 1977; Herlihy,
Klapisch-Zuber 1985). In the rural areas (countryside of Pistoia) the Ginis varied between about
0.634 in the plain, and just 0.515 in the mountain (note that the city of Pistoia itself was relatively
egalitarian, with a Gini of 0.713. Herlihy 1967). About urban dynamics, we know that in
northwestern Italy inequality grew hand-in-hand with demographic size in important cities like
Padua (Alfani and Caracausi 2009), Imola (Rotelli 1966) and Bergamo (unpublished EINITE data).
As mentioned above, the same tendencies are to be found in northwestern Italy. On the one hand, if
we compare the larger city of our database, Chieri, which in the early seventeenth century was close
to 11,000 inhabitants, throughout the period it had a Gini significantly higher than all other cities,
whose population was about half its own. For example around 1600, the only reference date for
which we have information for all cities, the Gini was 0.76 in Chieri against just 0.616 in
Carmagnola, 0.682 in Cherasco, 0.657 in Ivrea and 0.652 in Saluzzo. On the other hand, in each of
these cities demographic growth is associated to inequality growth, as results from a comparison of
tables 1 and 2. However the opposite is not true, at least not during the Early Modern period. This
interesting finding will be discussed in detail in section 6, while in section 5 something more will be
said about city-country differentials in Gini levels. Now, the analysis of long-term trends needs to
be completed by factoring in the impact of severe mortality crises, starting with the worst of all: the
Black Death.
4. Plague and inequality from the Black Death to the seventeenth-century epidemics
In the last few years, the impact of plague on economic structures has been the object of a
considerable amount of research. Most scholars focused on the first and most severe epidemic of the
Middle Ages, the Black Death affecting Europe in 1347-50 (for example, Clark 2007, pp. 99-102;
Cohn 2007; Pamuk 2007; Malanima 2012; Voigtländer and Voth 2012). Recently, however, it has
been argued that also the last great plagues, during the seventeenth century, had deep consequences
for European economies (albeit of a very different kind compared to the Black Death), favouring
the North and contributing to the ‘little divergence’ within the continent (Alfani 2013b). A few
works specifically explored the impact plague had on economic inequality, and particularly Alfani's
study of Ivrea (Alfani 2010b). These works extended into the early modern period a reflection on
the way in which mass mortality influenced distribution of wealth and income, which was started by
Herlihy some decades ago (Herlihy 1967).
20
According to Herlihy, who developed his ideas on the grounds of data for Medieval Tuscany, at the
time of the Black Death an unprecedented mass fragmentation of patrimonies occurred, because the
prevailing system of inheritance was that of partible inheritance among sons, with daughters
penalised but still entitled to a share of the inheritance. Such fragmentation made patrimonies
fragile and allowed those who had the willingness and the means to buy, to hoard property during
the years following the epidemic. As a result, the Black Death would have had short-term
egalitarian consequences (distribution of property due to mass mortality and inheritance rules), to be
followed soon after by medium- to long-term anti-egalitarian effects, due to the conditions of the
house and land market and also to the psychological situation of a population taken by surprise by a
new disease. This last point is particularly relevant, as it is one of the premises leading Alfani
(2010b) to argue that by the time of the last great epidemics in the seventeenth century, plague
could have had a very different impact on patrimonies and wealth distribution. For while the Black
Death affected a virgin soil population and, since plague afterwards became endemic in Europe,
changed in a lasting way the human environment, in the following centuries adaptation to the new
environment occurred - and for the human species, adaptation also means institutional adaptation.
Indeed, recent research has shown how, after the Black Death, Italian families started making fairly
systematic use of social and juridical institutions aimed at preventing fragmentation of patrimonies;
fideicommissum9 is probably the most common (Leverotti 2005; 2007). If one considers the post-
Black Death decades, these institutions made the newly-constituted large patrimonies more
resilient, thus helping to make the increase in inequality triggered by the plague non-reversible.
However, if one considers the last great plagues, the frequent recourse to fideicommissa and other
means of preventing patrimonial fragmentation, like the in solido inheritance common in Ivrea,
seemingly prevented the unwanted consequences of the Black Death from constantly re-occurring:
as a result of institutional adaptation patrimonies were more able to weather severe mortality crises,
although the ability to improve the survival of individual human beings was somewhat more
limited. When, during the seventeenth century, Italy was struck by plague epidemics which were
probably the worst since the Black Death (Alfani 2013b), their potential impact on property
structures was kept in check by pre-existing institutions. As shown by Alfani's detailed study of
Ivrea (in which it was possible to follow each single patrimony year per year, before, during and
after the crisis), the 1630 plague had mostly short-term consequences on overall inequality levels
(Alfani 2010b). In the long run, steady immigration from the surrounding rural areas to fill the gaps
9 Goods, usually real estate, that were the subject of a fideicommissum could not be sold, donated, or diminished in any way, save in very exceptional circumstances, and could therefore be transmitted unaltered from one generation to the next.
21
opened by the plague determined a certain increase in the inequality levels as relatively poor people
not only settled within the city walls, but also entered the property tax registers; however the plague
did not change a trend already orientated towards an increasingly unequal distribution of wealth
(see further discussion below).
In Herlihy's view, the Black Death altered for good the relatively egalitarian economic structures of
fourteenth century Europe. According to him, the high levels of wealth inequality characterizing the
late Middle Ages had no equivalent before 1348. However, he based this far-reaching hypothesis on
a very limited amount of evidence: basically, his own work on the Tuscan city of Pistoia, and little
else (Herlihy 1967). To my knowledge, since his original study no other has been published
providing measures of inequality before and after the Black Death, or any other appropriate
information to test Herlihy's fascinating hypothesis. The reason lies partly in the rarity of pre-Black
Death estimi, and in the complex and time-consuming nature of such a study. This paper, however,
provides exactly what we need to test whether Herlihy was right, as the time series reconstructed for
Chieri begins in 1311, and for Cherasco it begins in the immediate aftermath of the epidemic. In
fact, for one of the four quarters of the city, St. Martino, the series actually begins on the eve of the
epidemic, in 1347. What is more, inheritance systems in Piedmont were also partible, as in Tuscany,
so that there is no obvious reason to think that different institutions predating the plague could
determine different results10.
It is sufficient to give a quick look at graph 1, to realize that the Piedmontese data do not support
Herlihy's conclusions. For Chieri, the Gini value for 1311 (0.715) is considerably greater than that
calculated for the first post-plague observation, in 1437: 0.669. The two estimi used are complete
and excellently preserved, so this is high quality information; unfortunately no complete estimo
survived for the in-between years. For Cherasco, the Gini value for around 1350 is 0.63, declining
to 0.546 in 1395-1415 and to 0.521 in 1447-50. Only after 1450 would inequality start to rise after a
century-long decline and in fact, as already noticed, 1450 seems a real turning point for wealth
distribution in Piedmont (see further discussion in section 6). As the Cherasco time series has been
built from quarter-level estimi with slightly different dates, and as the 1347-54 and 1447-50, as well
as both observations available for the sixteenth century are incomplete missing one of the four
quarters, a quarter-per-quarter analysis is required: the more so, considering that in this way at least
one time series (St. Martino) begins immediately before the Black Death. Graph 3 charters the
10 About inheritance systems in late Medieval and Early Modern Piedmont, Levi 1985a; Alfani 2010b. 22
quarter-level Ginis for all the estimi used (exact dates, not reference dates, are used for placing
values in the graph).
Graph 3. Wealth Inequality per quarter in Cherasco, 1347-1585 (Gini indexes)
Overall, quarter-level Ginis closely follow the reconstruction for the whole city discussed in section
3: in each quarter, inequality declined from the middle of the fourteenth century up until about
1450. No observation is available for around 1500, however by the middle of the sixteenth century
in all quarters inequality was well above the 1400-1450 levels. The differences between quarter-
level measures reflect differences in the social and economic composition of the population of each
quarter. For example, the quarter of St. Iffredo was the area of the city where the poor were more
abundant, but also where some very rich families had seized the opportunity of building sumptuous
houses; such polarization tends to increase the Gini value over the city average. The case of the
quarter of St. Martino, which was the political and manufacturing centre of Cherasco including the
palace of the comune (the town hall), the market, artisan shops and the homes of many of the local
merchants, is particularly interesting also due to the density of information available around the
plague years. In 1347, the Gini index for St. Martino was 0.614. About fifty years later, in 1395, it
had declined to 0.557. The decline continued well into the fifteenth century, as in 1447 the Gini had
00,10,20,30,40,50,60,70,80,9
1
1300 1350 1400 1450 1500 1550 1600
S. Martino S. Pietro S. Margherita S. Iffredo
23
shrunk to 0.521. The share of the top wealthy (10%) declined accordingly: from 45.83 per cent in
1347, to 41.47 per cent and 34.38 per cent respectively in the other two dates.
It seems probable that the decline in inequality levels which occurred in the century 1350-1450 is
connected to the impact of the Black Death. Seemingly, in Piedmont (or at least, in Chieri and
Cherasco) the short-term consequences of the epidemic, which were bound to be egalitarian (due
both to the intrinsic re-distributive consequences of mass mortality, and to the presence on an
unmitigated partible inheritance system), were not upturned in the medium and long run by the kind
of speculation and hoarding postulated by Herlihy for Tuscany and Western Europe in general. This
is an extremely interesting finding, which cries out for further research and new case studies to be
developed (and in this field, any new case study would dramatically increase the amount of
information available). In fact, Herlihy's fascinating theory could have to be rejected entirely, or
regional differences could appear which would require us to look for convincing explanations about
which currently no speculation is possible - especially considering that relevant institutions, and
particularly inheritance systems, were similar in Tuscany and Piedmont.
In 1630, Piedmont was affected by what was probably the worst plague to strike Italy since the
Black Death. The epidemic covered the whole of the North, minus Liguria, plus Tuscany (the latter,
however, was only mildly affected). Only in the North, the most recent estimate places the victims
caused by the disease at about 2 million, that is 30-35 per cent of the overall population (Alfani
2013b, pp. 3-4). Piedmont was badly affected by the plague, which had entered the peninsula
through the Susa valley in 1629, following the French armies involved in the War of the Mantuan
Succession. Only few communities were spared the epidemic, all of them placed in well-protected
Alpine valleys or in the Piedmontese side of the Ligurian Apennines. Of all the cities included in
the database11, only Cherasco was spared, and in fact during the epidemic it hosted the Savoy court
which had fled the infected capital city of Turin; this is the reason why the treaty ending the war
was signed in this city, in 1631. As far as we know, also all the rural communities in the database
were infected, however some incertitude remains so that the analysis will be focused on cities.
Graph 4 compares pre-plague Gini values (around 1600) with post-plague ones (around 1650 and
1750).
11 Of all cities considered here, detailed studies of the 1630 plague exist for Carmagnola (Abrate 1972) and Ivrea (Alfani 2010b).
24
Graph 4. The impact of the 1630 plague on inequality (Gini indexes)
In all four cities considered (Carmagnola was dropped as there was no post-plague information),
inequality in pre-plague years was inferior to that found after the plague. The steady decline in
inequality found after the Black Death did not occur after the 1630 epidemic. Did the contrary
happen, that is, did plague ‘cause’ or at least contribute to the seventeenth-century rise in inequality
after the equilibrium characterizing the sixteenth century? The case of Cherasco, which was not
affected by the plague but where inequality increased continuously from about 1600 to 1700,
suggests that the trend was already orientated towards a growth in inequality. However, the fact that
the plague did not invert the direction of the trend does not mean that it did not affect it. As already
mentioned, the case of Ivrea is exceptional as it permits a year per year study of the period around
the plague. The case is discussed in detail elsewhere (Alfani 2010a; 2010b); here it will suffice to
present graphically the Ginis for the period 1620-49.
00,10,20,30,40,50,60,70,80,9
1600 1650 1700
Ivrea Cherasco Chieri Saluzzo
25
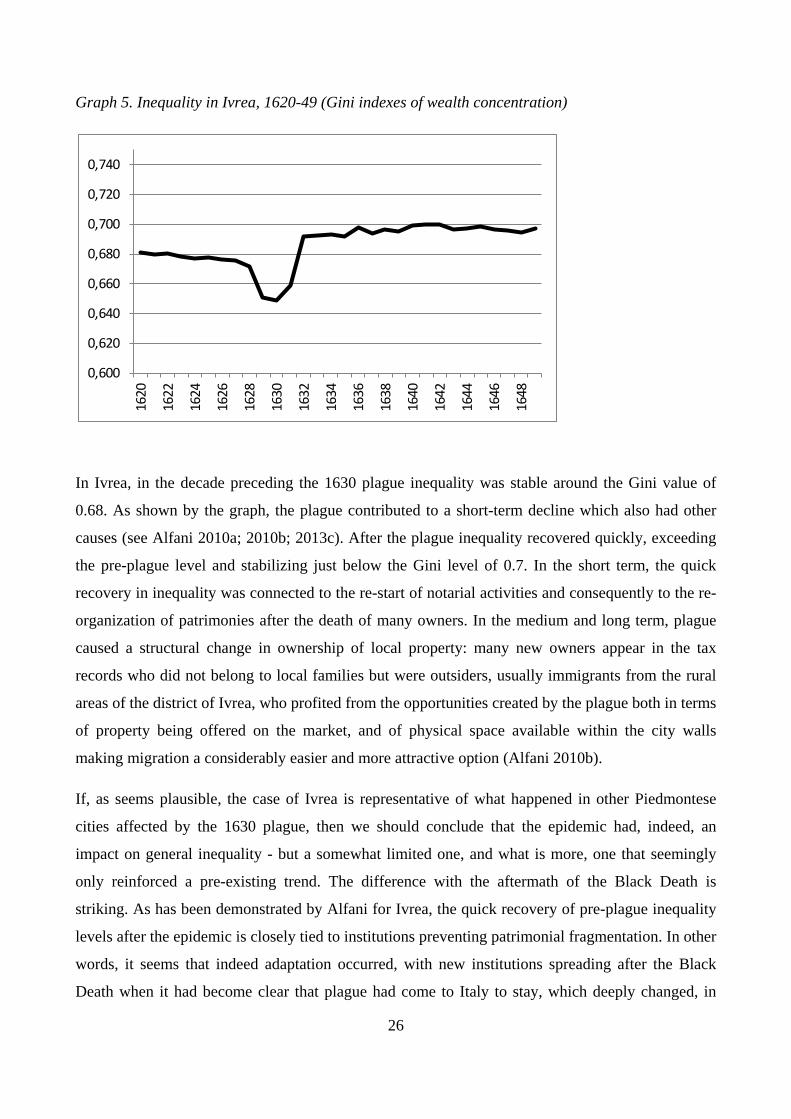
Graph 5. Inequality in Ivrea, 1620-49 (Gini indexes of wealth concentration)
In Ivrea, in the decade preceding the 1630 plague inequality was stable around the Gini value of
0.68. As shown by the graph, the plague contributed to a short-term decline which also had other
causes (see Alfani 2010a; 2010b; 2013c). After the plague inequality recovered quickly, exceeding
the pre-plague level and stabilizing just below the Gini level of 0.7. In the short term, the quick
recovery in inequality was connected to the re-start of notarial activities and consequently to the re-
organization of patrimonies after the death of many owners. In the medium and long term, plague
caused a structural change in ownership of local property: many new owners appear in the tax
records who did not belong to local families but were outsiders, usually immigrants from the rural
areas of the district of Ivrea, who profited from the opportunities created by the plague both in terms
of property being offered on the market, and of physical space available within the city walls
making migration a considerably easier and more attractive option (Alfani 2010b).
If, as seems plausible, the case of Ivrea is representative of what happened in other Piedmontese
cities affected by the 1630 plague, then we should conclude that the epidemic had, indeed, an
impact on general inequality - but a somewhat limited one, and what is more, one that seemingly
only reinforced a pre-existing trend. The difference with the aftermath of the Black Death is
striking. As has been demonstrated by Alfani for Ivrea, the quick recovery of pre-plague inequality
levels after the epidemic is closely tied to institutions preventing patrimonial fragmentation. In other
words, it seems that indeed adaptation occurred, with new institutions spreading after the Black
Death when it had become clear that plague had come to Italy to stay, which deeply changed, in
0,600
0,620
0,640
0,660
0,680
0,700
0,720
0,740
1620
1622
1624
1626
1628
1630
1632
1634
1636
1638
1640
1642
1644
1646
1648
26
practice, the inner workings of a system that was theoretically still one of partible inheritance.
Fourteenth century Piedmont, like Tuscany, was virgin soil population for the plague: and in the
case of human beings, this means also the absence of institutions to keep a specific environmental
hazard in check. From this point of view, fideicommissa and others were no different from
quarantines, permanent health boards (which spread in Italy between the late fourteenth and the
early fifteenth century) and plague wards (the first was built by the Venetians in 1423) in slowly
contributing to re-establish human control over an environment which had gone awry.
While this study provides much evidence to support the idea that in time successful institutional
adaptation changed the way in which plague and mass mortality in general affected property
structures and overall economic inequality, more research is needed about the specific impact of the
Black Death. Both Herlihy and this study argue in favor of short-term egalitarian effects of that
epidemic - but Herlihy suggests that they were the prelude of an unprecedented and irreversible rise
in inequality, while this study provides evidence that the decline continued for at least one century
after the epidemic. As Herlihy based his hypotheses on a very limited amount of data, some new
Tuscan case study would be particularly helpful, which would either prove him wrong also at the
regional level (the counter-examples presented here suffice to claim that there is no reason to accept
a generalization of his conclusions to the 'West' anymore), or, were his finding for Tuscany
confirmed, would raise many interesting questions about which factors could have caused the same
event to affect economic inequality in contrasting ways, and more generally about the (possible)
differential impact of the Black Death.
5. Estimating inequality at the regional level: Piedmont and the Sabaudian State
Up until now, community-level data have been considered. In general, this kind of information is
adequate to discover broad tendencies over the long run, while also preventing local/subregional
variations to be overlooked. However, there is a distinct interest in transforming local-level
measures into regional measures, for example in order to ease comparisons at a broader scale like
will be attempted in the next section. For this reason, a simple method for data aggregation has been
developed, which with limited adaptation might also be applied to other areas and databases. The
method will be briefly discussed here, and the outcome will be presented in the light of what
already resulted from the analysis of community-level data. The ‘regional’ time series produced can
be interpreted in two ways: either as representative of northwestern Italy or Piedmont (in the
27
boundaries of the current administrative region), or as representative of a specific political-
institutional entity, the Sabaudian State, or at least its Italian part.
The first point to underline, is that it is not proper simply to average Ginis for different communities
around the same year, because doing this we would lose all information about between-
communities inequality, as well as limiting our ability to explore the distribution in meaningful
ways. In general, the proper way to aggregate information about wealth or income distributions, is
either to build directly an overall distribution by listing together the details of each household, or to
build what I will call a ‘fictitious distribution’ which approximates the best way we can the actual
distribution. The first option is usually impossible to pursue due to lack of information about each
and every household. What is more, in our case information about households residing in different
communities is not directly comparable, as their taxable wealth is expressed in lire d'estimo which
cannot be easily converted into market values expressed in a common currency.
To get round these problems, a fictitious distribution has been built starting with the information
about deciles, thus modeling for each community a distribution of 100 elements, or ‘fictitious
households’: 10 fictitious households per decile, each having the same share of wealth (1/10 of the
decile each). The tenth decile (the rich) was modeled in greater detail, using information about the
top 5% and top 1% wealthy, as it has been found empirically that what happened to the top rich
determined the overall trend (see section 3). This procedure presents two additional advantages: 1)
it automatically provides an equal weight for communities having different size (useful to maximize
territorial representation of the sample: each community can be considered an ‘observation point’
on par with all others); 2) it allows to make full use of the data being produced by projects like
EINITE, or which have been produced by recent studies that usually published them in the form of
percentiles.
Reasoning in terms of fictitious distributions also considerably eases the task of resolving some
critical issues of weighting and comparison of community-level data. Regarding comparisons, and
considering that in general it is not possible to directly compare wealth measured in different lire
d'estimo, the key issue was to clearly distinguish between cities and rural communities, as in the
structural differences in wealth (or income) levels between city and country lies a fundamental
component of region- or state-level inequality. However it has been assumed that between the
28
sample cities, the average wealth of owners was about the same12. A similar assumption has been
made for rural communities. Under this hypothesis, it can be easily demonstrated that percentiles
can be used to build the fictitious distribution instead of actual property values (as percentiles relate
to shares of individuals, not to a specific number of individuals; and the average wealth of all
individuals of different communities is assumed to be the same). The times series for cities and
rural areas presented in graph 6 has simply been calculated on the base of such fictitious
distributions.
A more complex task is to build a regional distribution which includes both cities and rural areas.
The first problem to solve, is to compare average wealth levels, which it would definitely be
unrealistic to assume were the same in the two environments. Luckily enough, for at least one area -
the Canavese - the fact that rural and urban data come from the same sources and consequently are
expressed in the same lira d'estimo, allowed to calculate differences in average wealth of rural and
urban owners. It has been found that on average, in year 1628 village owners were 31% less
wealthy than the urban owners. This ratio has been used to weight the urban-rural differences for all
the period considered here (future refinements will improve on this, based on the availability of
data). The second weighting issue to be solved, involves giving the correct 'demographic'
representation to data about cities and rural areas. The most recent estimate of urbanization rates for
central-northern Italy, places it at 14.5% around 1600 (Malanima 2005, 106). However, this
estimate relates only to cities with more than 10,000 inhabitants: a threshold that it has been argued
to be too high to correctly represent the urban population of late Medieval and Early Modern Italy
(Alfani 2007, 571-2; 2013a, 145-8), the more so for a region like Piedmont which while comprising
many cities, did have very few over the 10,000 threshold: according to a consegna delle bocche (a
census) dated 161213, only five, one of which was Chieri14. For Piedmont, and arguably also for the
rest of northern Italy up until the early eighteenth century at least, a lower threshold of 4,000 people
is better apt at capturing the share of population living in places which were cities from all points of
view: functional, juridical, and social-economic (Alfani 2013a, 146). The aforementioned consegna
delle bocche allowed to measure exactly the urbanization rate in Savoy Piedmont in year 1612: 25%
(the urbanization rate calculate for cities with more than 10,000 inhabitants would be just 9.9%).
12 This assumption makes sense in the light of the characteristics of the Piedmontese cities included in the database. Were the method propose here be applied to other areas, cities with different specialization or much different size would need to be distinguished. See for example the discussion of the case of Holland by Van Zanden (1995, 651-3). 13 Turin State Archive, Camerale Piemonte, Art. 532 Mazzo ½, ‘Consegna delle boche dai doi anni in sù, et delle vittuaglie’, Ordine del 28 febbraio 1612. 14 Four of the five were just above 10,000: Chieri (10,710); Cuneo (10,566), Vercelli (10,257) and Mondovì (10,903). The only larger city to be found in Piedmont was the capital, Turin, which counted 24,420 inhabitants.
29
This ratio has been used to build ‘weighted’ fictitious distributions, which practically required
cloning elements related to rural areas the number of times needed to keep the 1:3 urban-to-rural
ratio about constant over time, taking into account the different number of urban and rural
communities available at different points in time (a procedure similar in many aspects to that
described by Milanovic for calculating 'weighted international inequality'. Milanovic 2005).
Many aspects of this reconstruction could be refined, in particular by improving the weighting
criteria if more information will be discovered in the Piedmontese archives. However, as it is the
method seems perfectly capable of representing in a synthetic way the phenomena discussed,
community per community, in the earlier sections. Graphs 6 shows the different behaviour of urban
and rural environments, also confirming the general idea that on average, inequality was greater in
the city than in the country (but in Piedmont, this difference seems not to have been as sharp as
elsewhere, possibly due to the prevalence of relatively small cities). The graph also clearly shows
that, due to purely demographic reasons, the overall inequality level follows more closely the trend
of the rural areas, than that of the cities. Graph 7 confirms the ability of the synthetic representation
to capture another key finding described with reference to the community-level data: the overall
trend (either of the whole region, or of the urban and rural environments) is determined by the trend
of the share of the top rich. Further discussion is provided in the next section, where the
Piedmontese data are also placed in the context of a broader international comparison.
30
Graph 6. Inequality in Piedmont, 1300-1800 (Gini indexes of wealth concentration)
Graph 7. Share of wealth owned by 10% and 5% top rich in Piedmont, 1300-1800
6. The broader picture: searching for the sources of inequality change
Both at the local level, and at the regional level, during the Early Modern period long-term trends in
inequality in Piedmont were orientated towards growth. This does not stand true for the late
Medieval period, as in this area the Black Death seems to have triggered a long phase of inequality
decline. The turning point can be placed around 1450, when all the data we have, down to each
local time series and even to within-cities, quarter-level time series, suggest that a phase of quick
inequality growth started, which lasted up until the beginning of the next century. This is a
particularly interesting finding, as 1450 is also a turning point in all reconstructions of the Italian
long-run demographic trend: after a long period of stagnation, closely connected to high and
recurrent epidemic mortality mostly caused by plague, all areas of the Peninsula started to recover
their pre-1348 demographic size (Alfani 2010c, 29-30; Pinto 1996, 60-61). Such recovery would be
completed only by the end of the sixteenth century. Interestingly, the most recent evaluation of the
northern Italian demographic trend in the Early Modern period suggests that overall, the period of
the Italian Wars (1494-1559) was, again, one of demographic stagnation, characterized by flat
population change. The considerable demographic growth of the sixteenth century was almost
entirely comprised in about thirty years (1560-89) (Alfani 2013a, 149-65; see in particular the time
series for Piedmont 1550-1628 at p. 161). Looking at the local times series, and particularly at those
which include data for all the three references dates 1500-1550-1600 like Ivrea and Cumiana (graph
1), there is some reason to hypothesize that inequality might have been stable or slightly declining
in the first half of the century, showing greater dynamism (and a tendency to resume growing) in
the second half; the Piedmontese time series captures such trend (graph 6). However, overall the
sixteenth century was one of stability in inequality levels, whose tendencies still seem to be
connected to demographic trends, although not as much as in the earlier century (as will be
discussed below, this inequality-demography connection would entirely disappear in the
seventeenth century).
The demographic growth of the second half of the fifteenth century went hand in hand with
economic growth, just as the stagnation during the Italian Wars had both an economic and
demographic character, as well as the growth of the second half of the sixteenth century - a period
which Cipolla once labeled the ‘Indian Summer’ of the Italian economy (Cipolla 1993, 243), but
which recent research has re-established as one of ‘solid recovery’ (Alfani 2013a, 165-8). The only
other published regional study of long-term trends in preindustrial economic inequality based on
hard data suggested that in Holland, economic and demographic growth went hand in hand with
inequality growth: ‘On the whole inequality increased in proportion to the prosperity and size of 32
towns and villages. The results suggest that there was a highly uneven distribution of the benefits of
economic development. The case study of Holland also showed that economic growth during the
golden age led to a more unequal distribution of income’. Van Zanden also proposed different
explanations of why economic growth could foster inequality growth (urbanization; increasing skill
premium; changes in functional distribution of income) and concluded that the increase in
inequality experienced by Holland during the Early Modern period was even ‘over-explained’ (Van
Zanden 1995, 661).
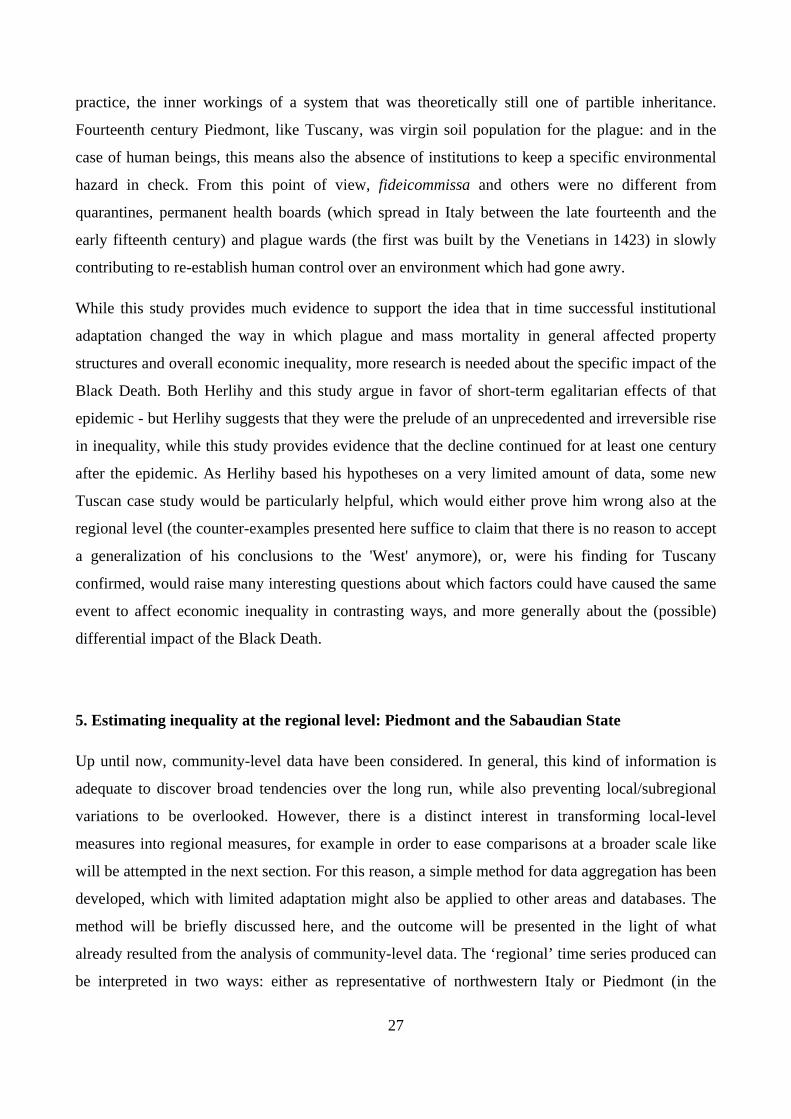
Graph 8 places the inequality trends in Piedmont and Holland side by side. As was the case when
comparing the community-level time series, it should be remembered that inequality trends, not
inequality levels, are what we should primarily compare; in this case, a key difference in the kind of
data used (records of taxable wealth for Piedmont; rents of houses for Holland) could easily explain
structural differences in Gini values. Both series, however, can be reasonably assumed to reflect
overall changes in income distribution (Van Zanden himself interpreted house rent values as a
proxy for income; regarding Piedmont see discussion in section 2). It is easy to notice that the series
show a very similar tendency throughout the Early Modern period, and in particular that both are
clearly orientated towards a long-term growth.
Graph 8. Long-term trend in inequality in Holland and Piedmont, 1300-1800 (Gini indexes)
Sources: for Holland, own elaboration from data published by Van Zanden (1995, 652-3).
0,3
0,4
0,5
0,6
0,7
0,8
0,9
1500 1550 1600 1650 1700 1750 1800
Holland Piedmont
33
In northwestern Italy and in the main province of the Dutch Republic, then, inequality seems to
have behaved in much the same way. As mentioned above, Piedmontese tendencies during the late
Medieval period and the sixteenth century well correspond to demographic and economic
tendencies. The picture becomes much more complex if we consider the seventeenth and eighteenth
centuries. On the one hand, it is well known that the seventeenth century was the 'Golden Age' of
the Dutch Republic, which for a period became the centre of the European economy - basically
replacing Northern Italy in that role. On the other hand, the seventeenth century has traditionally
been considered one of crisis for the Italian states. Although in the last decades this view has been
much softened, and the notion of 'relative decline' has been introduced (Sella 1997; Lanaro 2006), it
is clear that the situation of the Peninsula had changed. Recently, Alfani (2013b) suggested that the
last great plagues of the seventeenth century, which affected much more severely Italy than its main
northern European competitors, caused a shock to the Italian economies that might have been the
real starting point of their relative decline: 'Italy was forced on a path which led it to become, by the
eighteenth century, an economic backwater' (Alfani 2013b, 19). Whatever one might think about
the Italian economies during the seventeenth century, few would deny that during the eighteenth
they became increasingly backward and sluggish; Malanima in particular made a strong case that
this was really the Italian 'Age of Decline' (Malanima 2006). However, if we look at northwestern
Italy, we discover that inequality continued to grow during the 'Age of Relative Decline' (the
seventeenth century) which, demographically, was beyond doubt a full-fledged age of decline,
essentially due to the 1629-30 plague which caused a drop in population that took the rest of the
century to be recovered (Alfani 2013b). Inequality also grew during the eighteenth century, the 'Age
of [Real] Decline' which on the contrary was characterized by vigorous demographic growth, with
Italy exceeding for the first time population limits that had constrained it since the times of the
Roman Empire (Alfani 2013d).
And still, one could make the case that the Sabaudian State, which grew to become the Kingdom of
Sicily in 1713 (of Sardinia since 1720) but whose heart always was Piedmont, is the exception in
the Italian landscape. Having participated in a relatively limited way to the Renaissance, Piedmont
flourished during the Age of Baroque, not only culturally but also institutionally and as a military
power. Its territorial expansion continued throughout the seventeenth and the eighteenth century,
and its capital (Turin) grew to become one of the most admired cities of continental Europe.
However, economically the picture was quite bleaker, at least if we consider the seventeenth
century. Especially in 1630-1660, plague and war heavily damaged trades and productive activities
(Barbero 2008, 203-4). The situation improved in the last part of the century, and during the
34
eighteenth the region would show an impressive agrarian, commercial and proto-industrial
dynamicity, but overall it would be difficult to argue that the seventeenth century was one of
significant economic development. If we look closer at the cities analyzed in this article, they all
seem to be suffering, partly from the demographic attraction and the competition exerted by Turin
(Levi 1985b), and partly due to the crisis of commerce and of the textile sector, like in Chieri
(Barbero 2008, 293). For the city of Ivrea, a detailed case study of the connection between
inequality change and economic dynamics strongly made the point that in this city, inequality
growth cannot be simply explained with economic growth, as it occurred also in times of acute and
long-lasting crisis (Alfani 2010a, 546-7). What is more, recent research on other areas of Europe
which experienced difficult economic conditions during the seventeenth century, like central Spain
(Santiago-Caballero and Fernandez 2013), is also providing evidence for inequality increases
occurring even in times of economic stagnation or decline. Some older works provide further
support to this view, like Le Roy Ladurie’s study of Languedoc (France) in 1680-1750, a period of
crisis during which increasing concentration of wealth (lands) resulted from a kind of ‘sélection
naturelle’ (natural selection) favouring the main owners (Le Roy Ladurie 1966, 567-581).
Recently, Milanovic, Williamson and Lindert (2011) introduced the concept of the inequality
possibility frontier, which basically postulates that the maximum inequality that a society can
achieve corresponds to a perfectly unequal distribution not of the whole product, but only of the
surplus above subsistence15 (redistributing the share of product necessary for subsistence is not
compatible with a stable society). Consequently, we should be interested not only in overall
inequality levels, but also in how much ‘extractive’ a society is, that is, how close to the inequality
possibility frontier it places itself. This concept is perfectly compatible with the long-term trends
described above for Piedmont and Holland. For Holland, Van Zanden could well be right in
assuming that economic growth fully ‘explains’ inequality growth: the regional maximum possible
inequality increases due to economic development, thus inequality can increase with no need to
postulate that the Dutch society was becoming more extractive (in fact, by using Van Zanden’s
data, Milanovic, Williamson and Lindert estimate that Holland grew less extractive in time). For
15 ‘Suppose that each society has to distribute income in such a way as to guarantee subsistence minimum for its poorer classes. The remainder of the total income is the surplus that is shared among the richer classes. When average income is very low, and barely above the subsistence minimum, the surplus is small. Under those primitive conditions, the level of inequality will be quite modest. But as average income increases with economic progress, this constraint on inequality is lifted; the surplus increases, and the maximum possible inequality compatible with that higher average income is greater. In other words, the maximum attainable inequality is an increasing function of mean overall income.’ (Milanovic, Williamson and Lindert 2011, 256).
35
Piedmont instead, while it might be that extraction rates were not changing in the period 1450-1600
(and one could wonder if they were, in fact, decreasing in the century following the Black Death)
and inequality growth was due solely to economic growth, since 1600 it seems probable that most
of the inequality growth was due to the Piedmontese/Sabaudian society becoming more extractive,
particularly during the seventeenth century. Growing extraction rates would make a stagnating
economy compatible with the steady increase in inequality suggested by our empirical evidence.
If we consider the history of the Sabaudian state during the Early Modern period, it is quite easy to
accept the idea that it was becoming more extractive. Since they recovered full control of their
domains, in 1559, the Savoys fostered intense institutional development, strengthening their
authority over the disparate territories they ruled and progressively building a ‘unified’ state.
Surely, their fiscal policy, especially after the introduction, in 1562, of the tasso (the new tribute
described in section 1), became more extractive in the sense of allowing the central authority to
syphon in more resources from the local communities (Stumpo 1979): a crucial development, which
is key in understanding how the Sabaudian state could grow to become a respectable military
power, in an age in which waging war was becoming a much costlier affair. In fact, the Sabaudian
state was simply participating in a particularly intense way (to counter-balance its somewhat limited
size) to a process involving all of Western Europe: the so-called ‘rise of the fiscal state’ (Bonney
1999; O’Brian and Yun-Casalilla 2012). If we look at this process from the point of view of
households (the units of measurement of our wealth/income distributions), we can easily accept the
hypothesis that, in the Early Modern period, lucky few profited (and considerably) from more
extractive ‘public’ institutions.
While institutional change probably played an important role in making the Piedmontese society
more economically unequal, that is only part of the story. Another fundamental factor is
demography. As has been shown on the grounds of micro-level data for the case of Ivrea, in urban
environments immigration from rural areas could act as a kind of perpetual generator of inequality,
a process which became markedly more intense in the years immediately following demographic
shocks of the kind of the seventeenth-century plagues (Alfani 2010a; 2010b; also see discussion in
section 4). In rural areas, the impact of out-migration on inequality levels is less clear, and more
generally urban-rural interaction as a factor influencing inequality is worthy of being researched
deeper and will be the object of future publications16. Overall it seems that, to understand properly
preindustrial long-term inequality trends, demography matters more than is usually acknowledged
16 For an early analysis of the Canavese area, see Alfani 2009. 36
by the (few) scholars who assessed this topic. The only demographic process which has been often
pointed out as a driver of inequality is the growth of urban populations (see discussion above and in
section 3). Other demographic processes very probably also played a role: for example the
population pressure that, between the late sixteenth and the seventeenth century, in many parts of
continental Europe determined the crisis of small holdings, with a large share of the peasants having
to resort to sell their land to great landowners (for example, Alfani 2013a, 76-7; Kamen 1976; Le
Roy Ladurie 1966). In Piedmont, too, this process was presumably responsible for at least part of
the increase in inequality to be found in rural areas. Also in this case, though, more comparative
research is needed.
All in all, the newly acquired evidence, including that provided by this article, suggests that any
explanation of long-term inequality change solely focused on economic development is, at best,
seriously incomplete. The increasing evidence supporting the idea that inequality grew also in
stagnating or declining areas, especially during the Early Modern period, suggests that we should
look hard for different explanations. The new concept of the inequality possibility frontier provides
a useful intellectual framework to understand how inequality could increase also in the absence of
economic development (and consequently, of generation of a greater surplus): a stagnating society
could simply become more efficient at extracting inequality, getting closer to the boundary. This is
not, however, a true explanation of the causes of inequality growth. A promising path of enquiry
seems that of looking into inertial processes, primarily of a demographic nature, as continuous
generators of inequality. However this, too, could be insufficient to explain what possibly was a
multi-secular process spanning the whole of the European continent; also in this respect, then, more
research is needed. As a final reflection, it could be useful to provide a different interpretation of
what the inequality possibility frontier was: not just a theoretical upper boundary to inequality, but a
de facto attractor of inequality. In other words, during the Early Modern period if a society could
become more unequal, then it did – and the only way it had to avoid becoming more extractive, too
(that is, to redistribute more efficiently income and wealth from the lower to the upper echelons of
society), was to develop economically quick enough to escape falling into a kind of ‘inequality
trap’.
37
Conclusion
This article presented a comprehensive picture of economic inequality in northwestern Italy
(Piedmont), focusing on the long-term developments occurred during the five centuries from about
1300 up until 1800. This is a significant contribution to our knowledge of the tendencies of
economic inequality in preindustrial times, as Piedmont is just the second region of the European
continent, after Holland, to have ever been researched systematically from this perspective, and
over a much longer time period.
The new data proposed for Piedmont provide considerable support to some ‘stylized facts’ that
stand out from research carried out worldwide on the topic, such as the connection between urban
demographic growth and inequality, the greater inequality levels experienced by cities in
comparison to rural areas, or the fact that inequality changes were determined by the tendencies of
the share of income or wealth of the top rich. Even more interestingly, the Piedmontese case
strongly supports the idea that during the Early Modern period, inequality was growing everywhere
in Europe: both in cities and in rural areas, and independently from whether the economy was
growing or stagnating. This is a new finding, which directly challenges earlier views that tended to
explain inequality growth as the consequence of economic development. Such finding, if confirmed
by further, much-needed new research about other areas, would also require some theoretical re-
elaboration to be fully accounted for. This article pointed out at a number of paths worthy of being
followed, in particular the importance of demographic processes which could have acted as
continuous generators of inequality. The recently-introduced concept of the inequality possibility
frontier was used to explain how a society could become more extractive, and consequently also
more unequal, also in times of economic stagnation (Piedmont was one such case). The article also
suggested that we might have to think differently at the inequality possibility frontier: not as much
as an upper boundary to inequality, but as an attractor of inequality to higher levels, exerting its
pressure even in times of economic crisis or stagnation.
The article also made a strong case for the need of more empirical research on inequality trends in
preindustrial times. In fact, while broad tendencies stand out at the continental scale, much
interesting local or regional variation has also emerged. Here, particular attention was given to the
impact of the most severe mortality crises, like the fourteenth-century Black Death. Also in this
respect, this case study of Piedmont is the second-ever to have covered the topic and, very
interestingly, it did not confirm earlier hypotheses based on Tuscan data – as in this area, the
century following the Black Death was one of declining, not growing inequality. Variation was
38
found also in time, as seemingly by the seventeenth century even very severe mortality crises had
consequences deeply different from the Black Death, probably due to the institutional adaptation
occurred in-between. More generally, in the Early Modern period the way in which demographic
and economic growth interacted with inequality trends seems to be significantly different from the
Middle Ages. This is another empirical finding which would be worthy of being researched further.
As a final comment, many of the findings of this article present interesting similarities with those
produced by research on the contemporary world. For example, the fact that the general inequality
trend is driven by the top wealthy is an empirical regularity which seems to be constant from the
Middle Ages until today. More generally, this article suggests that in the very long term, inequality
has almost always been orientated towards growth, with declining phases being the exception. Were
this picture confirmed by further research, which for Italy as well as for some other areas of Europe
is already under way, it would probably affect the way in which we consider current tendencies. In
relation to this, we could wonder if the time has come to re-think the significance of the ‘Kuznets
curve’: no longer a general tool for interpreting the link between economic development and
inequality, with its implicit promises, but (at most) a description of what happened during a
relatively short phase, the Industrial Revolution. However, like Kuznets himself had to point out in
his 1955 article, for now this is mostly speculation in search for some solid empirical support.
39
Bibliography
ABRATE, M. (1972), Popolazione e peste del 1630 a Carmagnola, (Torino: Biblioteca di Studi
Piemontesi)
ALFANI, G. (2007), ‘Population and Environment in Northern Italy during the XVIth Century’,
Population, 4/2007, 1-37
ALFANI, G. (2009) ‘Prima della curva di Kuznets: stabilità e mutamento nella concetrazione di
ricchezza e proprietà in età moderna’, in G. Afani and M. Barbot (eds), Ricchezza, valore, proprietà
in Età Preindustriale. 1400–1850 (Venice: Marsilio), 143–68.
ALFANI, G. (2010a), ‘Wealth Inequalities and Population Dynamics in Northern Italy during the
Early Modern Period’, Journal of Interdisciplinary History, XL, 4, 2010, 513-549.
ALFANI, G. (2010b), ‘The effects of plague on the distribution of property: Ivrea, Northern Italy
1630’, Population Studies, 64, 1, 61-75.
ALFANI, G. (2010c) 'Climate, population and famine in Northern Italy: general tendencies and
Malthusian crisis, ca. 1450-1800', Annales de Démographie Historique, 2, 23-53.
ALFANI, G. (2013a). Calamities and the Economy in Renaissance Italy. The Grand Tour of the
Horsemen of the Apocalypse (Basingstoke: Palgrave).
ALFANI, G. (2013b), ‘Plague in seventeenth century Europe and the decline of Italy: an
epidemiological hypothesis’, in European Review of Economic History (online-first version), doi:
10.1093/ereh/het013
ALFANI, G. (2013c), 'Fiscality and territory. Ivrea and Piedmont between the Fifteenth and
Seventeenth Centuries', in M. Vester (ed.), Sabaudian Studies. Political Culture, Dynasty, &
Territory 1400-1700 (Kirksville: Truman State University Press), 213-239.
ALFANI, G. (2013d), ‘Population dynamics, Malthusian crises and Boserupian innovation in pre-
industrial societies: the case study of Northern Italy (ca. 1450-1800) in the light of Lee’s «dynamic
synthesis»‘, in P. Malanima, B. Chiarini (eds.), From Malthus's Stagnation to Sustained Growth
(Basingstoke: Palgrave), 18-51.
ALFANI, G. and BARBOT, M. (eds.) (2009), Ricchezza, valore, proprietà in Età preindustriale.
1400-1850 (Venice, Marsilio).
40
ALFANI, G. and CARACAUSI, A. (2009), ‘Struttura della proprietà e concentrazione della
ricchezza in ambiente urbano: Ivrea e Padova, secoli XV-XVII’, in G. Alfani, M. Barbot (eds.),
Ricchezza, valore, proprietà in Età preindustriale. 1400-1850 (Venice: Marsilio), 185-209
ALFANI, G. and FRIGENI, R. (2013), 'Inequality (un)perceived: The emergence of a discourse on
economic inequality from the Middle Ages to the Age of Revolutions', Dondena Working Paper n.