121
Economic Integration in South Asia NEPAL RASTRA BANK Research Department International Finance Division
Economic Integrationin
South Asia
NEPAL RASTRA BANKResearch Department
International Finance Division
Economic Integration in South Asia
1
Economic Integration in
South Asia
NEPAL RASTRA BANK Research Department
International Finance Division

Economic Integration in South Asia
2
Preface
long with the globalization process, countries have been increasing their regional economic links through Regional Trade Agreements (RTAs). Regional integration has become an important
policy dilemma that is to be addressed by economists, policy makers and politicians. It is increasingly believed that the regional economic integration can be instrumental for investment and thereby growth for the member countries. However, most importantly broad liberalization programs including domestic as well as external sectors program should be seriously implemented so as to reap the fruits of regionalisation.
Economic cooperation in South Asia has started in 1985 with the establishment of SAARC in 1985. Since its inception regional cooperation has further advanced and extended especially in preferential trade areas. The establishment of South Asian Preferential Trading Agreement provides the preferential treatment to reduce import tariff on preferential items within the member countries. Now, south Asia is stepping beyond preferential trade to free trade area. The 12th SAARC Summit held in Islamabad in 2004 adopted the South Asia Free Trade agreement (SAFTA). This is expected to open up the regional economies for the betterment of the lives of the people and reduce the regional poverty.
Against this backdrop, we believe, our attempt to bring out this publication "Economic Integration in South Asia", is in right time. We consider it to be useful to academics, economists, and policy makers. The objective of this publication is to highlight and explore the importance and benefits of economic integration with special reference to South Asia. The book contains the article contribution from scholars/researchers on the above mentioned disciplines.
It is an immense pleasure for me to bringing out this publication on the auspicious occasion of the Golden Jubilee Anniversary of Nepal Rastra Bank. I would like to thank to all the valued contributors without whose support, this publication would not even be conceived. In the mean time, I would like to acknowledge the hard work of the International Finance Division team; Deputy Director, Mr. Rajendra Pandit and Assistant Director Mr. Hem Prasad Neupane. I would also like to thank Chief Manager, Dr. Dandapani Paudel; Deputy Director Dr. Bamadev Sigdel, and Computer Supervisor Mr. Amar Ratna Bajracharya, for their support in bringing out this publication.
Finally, let me mention that the views and opinions expressed in this publication are those of the contributors themselves and do not necessarily reflect and represent the views and policies of the Bank.
Keshav Prasad Acharya April 27, 2005 Executive Director
A
Economic Integration in South Asia
3
Contents
The Process of Economic Integration in South Asia International Finance Division, Research Department Regional Economic Cooperation in SAARC Rajiv K. Chander Current Status of Doha Development Agenda: South Asian Perspective Ratnakar Adhikari SAPTA and SAFTA: Implications for Nepal Deependra Bahadur Kshetry South Asia Regional Energy Cooperation: Opportunities and Challenges Anup Kumar Upadhyay SAARCFINANCE : A Regional Economic Forum Dr. Dandapani Paudel Financial Sector Regulation in SAARC Countries Binod Atreya, Ph.D Common Currency Area: Prospects for South Asia Nephil Matangi Maskay, Ph.D. Prospects and Endeavours of Intra-Regional Trade and Investment in South Asia Dr. Bamadev Sigdel and Hem Pd. Neupane The Proliferation of RTAs with Special Reference to South Asia Dr. Bhubanesh Pant Regional Integration, Economic Growth and Welfare Rajendra Pandit A Comparative Analysis of WTO Related Financial Services Sector Commitments by SAARC Member States Nephil Matangi Maskay, Gunakar Bhatta, Rajan Krishna Panta SAPTA, SAFTA and Beyond Hem Prasad Neupane

Economic Integration in South Asia
4
The Process of Economic Integration in South Asia
International Finance Division, Research Department
INTRODUCTION
conomic integration in general is a process of removing progressively the discriminations which occur at borders. Such discrimination may affect the flow of goods and services, and the movement of factors of production either directly or through economic activity via the factor of
production. The theories of economic integration based on the works of Viner, Mende, Lipsey and others, have predicted two opposite outcomes, arguing that in short run, trade creation effects must outweigh trade diversion effects in order to achieve beneficial trade liberalization.1 However, apart from short run benefits, there are also the long run benefits such as greater technical efficiency due to greater competition, larger markets, higher consumer surpluses, and more foreign investment. Balassa identified five main stages of regional integration as free trade areas, custom unions, common market, economic union and total economic integration. Such stages are the outcome of policy decisions taken by regional intergovernmental fora and/or supranational institutions in order to affect the depth and breadth of regional integration.2
The meaningful integration through increased participation in the world economy, generates a lot of benefits. They include efficient allocation of resources due to the changing production patterns at near to at par with comparative advantage, domestic competition gains international standards of efficiency, wider options for consumers, the ability to tap international capital markets for smoothing consumption in the face of short-term shacks (as well as to achieve higher long-term growth), and exposure to new ideas, technologies, and products.3 The ultimate objective of economic integration particularly among the developing countries given their limited amount of scarce resources is either to achieve an acceleration of economic growth, expansion of social welfare in the partner countries or alternatively to minimize the cost in terms of the use of the scarce resources for realizing a given level of growth and social welfare.4
North American Free Trade Association (NAFTA), the European Union (EU), Association of South East Asian Nations (ASEAN), and South Asian Association of Regional Cooperation (SAARC) are the examples of the regional or sub-regional integration process. The new "Asian Regionalism" is being driven by the members (Brunei, Cambodia, Indonesia, Laos, Malaysia, Myanmar, the Philippines, Singapore, Thailand and Vietnam) of ASEAN. They are working to have meaningful partnership with China, Japan and South Korea, grouping known as the ASEAN+3.5Economic Integration among a group of countries is rightly viewed as a process that includes various types of measures that are aimed at abolishing discrimination between economic units from different countries. The kind of discrimination abolished and the extent of the degree of cooperation among the integration partners can be found in various categories of integration (see box).
1 Tongzon, Jose L; The Challenges of Regional Economic Integration: The Vietnamese Perspective, in 'Developing Economics', Institute of Developing Economics, Vol. XXXVII-2, June 1999, Tokyo, P. 142. 2 Dorrucci, Etture (et.al.), European Integration: What Lesson for Other Regions: A Case of Latin America, European Central Bank Working Paper Series, October 2002, P. 7. 3 Miria Pigato, T.G. Srinivasan (et.al.), South Asia's Integration in to the World Economy, The World Bank, 1997, pp. 7. 4 Panchamukhi, Op.cit., P. 18. 5 http://www.wfmagazine.com/Features/Markets_update/economic integration_asia.html, 2004.
E

Economic Integration in South Asia
5
STAGES OF REGIONAL INTEGRATION Regional
Integration Definition Some Examples
Free Trade Area (FTA)
An area where tariffs and quotas are abolished for imports from area members, which, however, retain national tariffs and quotas against third countries
- In 1992 ASEAN countries launched the ASEAN Free Trade Area (AFTA) plan. On 1 January 2002 six out of ten ASEAN countries reduced internal tariffs on most goods to levels ranging between zero and five percent. The whole ASEAN area is scheduled to become a full-fledged free trade area in the coming years.
- The USA, Canada, and Mexico are in the process of completing a North-American FTA (NAFTA): many tariffs were eliminated already in 1994, with others being phased out over periods of 5 to 15 years
Customs union (CU)
A FTA setting up common tariffs and quotas for trade with non-members
- European Economic Community since 1968
- The MERCOSUR (Southern Common Market: Argentina, Brazil, Uruguay, Paraguay) aims at becoming a fully-fledged CU by 2006
Common Market (CM)
A CU abolishing non-tariff barriers to trade (product and services markets integration) as well as restrictions on factor movement (factor market integration)
- European Community since 1993 (establishment of the European Single Market). The CM was already set up as an objective under the Treaty of Rome
Economic Union (EUN)
A CM with a significant degree of coordination of national economic policies and/or harmonization of relevant domestic laws
- European Union nowadays
Total Economic Integration (TEI)
An EUN with all relevant economic policies conducted at the supranational level, possibly in compliance with the principle of subsidiarity. For this, supranational laws need to be in place.
- The euro area (i.e., 12 out of 15 countries of the European Union) can be currently classified somewhere between an EUN and TEI. Supranational authorities and rule making were established already with the Treaty of Rome in 1957, and subsequently enhanced
PREFERENTIAL TRADE AGREEMENTS Preferential trade agreements (PTAs) are the agreements between two or more countries in which tariffs imposed on goods produced in the member countries are lower than on goods produced outside. PTAs include regional trading agreements (RTAs are PTAs where countries are from the same geographic region). There are several types of PTAs in terms of their level of trade and economic integration. The most modest form of PTA involves preferential tariffs which does not necessarily mean complete elimination of tariffs between two or more countries on certain goods. This term differs from the most favored nation (MFN) trade liberalization which means each country lowers its trade barriers for all the trading partners regardless of the trade policies of other countries. Free trade agreements (FTAs) also refers to the PTAs in which tariffs are eliminated entirely on the goods produced in member countries and can maintain their tariff structures with nonmembers. Customs unions (CUs) are also PTAs in which all members adopt a common external tariff structure. CUs adopt common external trade policies and act as a single body in all trade negotiations with non-members.
WTO PROVISIONS FOR PTAS/RTAS World Trade Organization (WTO) members (previously GATT members) are bound to notify the regional trade agreements (RTAs) in which they participate and their provisions are subject to review by the WTO. Most of the WTO members have notified participation in one or more RTAs (some members are party to twenty or more). In the period 1948-1994, the GATT received 124 notifications of RTAs (relating to trade in goods), and since the creation of WTO in 1995, over 130 additional

Economic Integration in South Asia
6
arrangements covering trade in goods or services have been notified. Since RTAs represent a fundamental departure from the core WTO principles, it has provided its members a large degree of flexibility in entering RTAs. WTO has given mandate to its member that they may join agreements by meeting the requirements of the GATT Article XXIV covering the information of customs unions and free trade areas in merchandise trade; the General Agreement on Trade in Services (GATS) Article V on agreements in services; or the Enabling Clause of dealing with trade in goods between developing countries.
ECONOMIC COOPERATION IN SOUTH ASIA The common features of south Asia, among others, are the shared underdevelopment, manifested in many development indicators. South Asia's GDP growth was 7.0 percent in 2003 and remained at 7.1 percent in 2004. It is projected to grow by 6.5 percent in 2005.6 India, Pakistan, Sri Lanka and Bangladesh are emerging economies in South Asia. Almost all of the south Asian countries have abandoned the import substitution policy as a failed strategy. Orientation towards economic liberalization and greater reliance on private sector development is now more strongly rooted in sub-regional countries' economic policies.7 Economically, South Asia is the poorest region in the world and is home to the largest number of people. In terms of certain vital social development indicators, the region is still behind the countries of the Sub-Sahara. Four of the seven member states are among the least developed countries. As for intra-regional trade, the share is no more than 5 percent of the total extra-regional trade conducted by the seven countries.8
THE SAARC
The SAARC which emerged in December 1985 is a regional organization. It aims to accelerate the process of economic and social development in member states through joint-actions in the agreed areas of cooperation. The Association comprises of seven south Asian countries including Bangladesh, Bhutan, India, Maldives, Nepal, Pakistan and Sri Lanka. The Association firmly believes in increased interdependent world with the objectives of attaining peace, freedom, social justice and economic prosperity in the region by fostering mutual understanding, good neighborly relations and meaningful cooperation among the member states which are bound by ties of history and culture. The twenty-fourth Session of the Council of Ministers held in Islamabad, January 2-3, 2004, adopted the Regional Integrated Program of Action (RIPA) namely Agriculture and Rural Development; Health and Population; Women, Youth and Children; Environment and Forestry; Science, Technology and Meteorology; Human Resource Development; and Transport and constituted a Technical Committee on each of the Program of Action. High level Working Groups have also been established to strengthen cooperation in the areas of Information and Communications Technology, Biotechnology, Intellectual Property Rights, Tourism, and Energy.
The objectives of the SAARC as mentioned in the SAARC Charter are as follows:9
– Promoting the welfare of the peoples of South Asia and to improve their quality of life,
– Accelerating economic growth, social progress and cultural development in the region and to provide all individuals the opportunity to live in dignity and to realize their full potential,
– Promoting and strengthening collective self-reliance among the countries of South Asia,
– Contributing to mutual trust, understanding and appreciation of one another's problems,
– Promoting active collaboration and mutual assistance in the economic, social, cultural, technical and scientific fields,
6 IMF, The World Economic Outlook - 2005, International Monetary Fund, Washington, D.C., April 2005, Table 1.7, P. 33. 7 ADB, Asian Development Outlook - 2004, Asian Development Bank, Manila, April 28, 2004, P. 32. 8 Zimba, Lyonpo Yeshey, A South Asian Panorama for the Twenty-First Century, in 'South Asian Survey', Sage Publication, New Delhi, Vol. 9, No. 1, January–June 2002. 9 SAARC Secretariat, SAARC - A Profile, SAARC Secretariat, Kathmandu, July 2003, pp. 2-3.

Economic Integration in South Asia
7
– Strengthening cooperation among themselves in international forums on matters of common interests, and
– Cooperating with international and regional organizations with similar aims and purposes.
SOUTH ASIAN PREFERENTIAL TRADING AGREEMENT (SAPTA) The SAPTA is an agreement of trade whereby the SAARC member countries provide each other the preferential treatment by way of reducing import tariffs on eligible items. This arrangement provides special and the most favorable treatment to the least developed countries in the region. During the sixth SAARC Summit in 1991, the Sri Lankan Government, with a view to expand intra-regional trade, proposed the arrangement of SAPTA by 1997.10 The agreement on SAPTA was signed on April 11, 1993. The agreement came into force on December 7, 1995. SAPTA has twin goals aiming at:
– Promoting regional cooperation, and
– Stimulating national economic growth and national employment levels and living standard of South Asian nations.
So far, four rounds of trade negotiations have been signed under SAPTA covering over 5,500 commodities. Each round of negotiation contributed an additional number in the product coverage and deepening of tariffs concessions over previous rounds. The fourth round of trade negotiation was concluded at the second Meeting of Inter-Governmental Group on Trade Liberalization held at the SAARC Secretariat on October 30, 2002 to November 1, 2002.
SOUTH ASIAN FREE TRADE AREA (SAFTA) SAFTA was first mooted at the 8th SAARC Summit in Delhi, 1995, with a expectation of making it operational by 2005. This date was revised at the 9th SAARC Summit in Male, 1997, which declared that SAFTA should come into operation by 2001.11 The 12th SAARC Summit adopted the SAFTA framework agreement in Islamabad on January 6, 2004 that has expected to open up the regional economies for the betterment of the lives of more than 1.4 billion people, with a significant chunk living under the absolute poverty.12 Agreement on SAFTA by the governments of the SAARC is motivated by the commitment to strengthen intra-SAARC economic cooperation to maximize the realization of the region's potentiality of trade and development for the benefit of their people, in a spirit of mutual accommodation, with full respect for the principles of sovereign equality, independence and territorial integrity of all States.13 The objectives of SAFTA agreement are to promote and enhance mutual trade and economic cooperation among contracting states by, inter-alia:14
– Eliminating barriers to trade in, and facilitating the cross-order movement of goods between the territories of the contracting states,
– Promoting conditions of fair competition in the free trade area, and ensuring equitable benefits to all contracting states, taking into account their respective levels and pattern of economic development,
– Creating effective mechanism for the implementation and application of this Agreement, for its joint administration and for the resolution of disputes; and
– Establishing a framework for further regional cooperation to expand and enhance the mutual benefits of this agreement.
The SAFTA was signed to cut down the trade barriers in the region by January 1, 2006 whereby the free trade area will come into effect partially. However, it will be fully realized by 2016. Member
10 Shrestha, Shyam, K.; Preferential Trading Agreement in South Asia: Nepalese Perspective, Vidyarthi Pustak Bhandar,
Kathmandu, 1999, P. 28. 11 Kalegame, Saman, SAFTA: A Critique, in 'South Asian Journal' (Quarterly), Free Media Foundation, Lahore, April-June
2004, P. 11. 12 Yadav, Rameshwar, SAFTA Realities, in 'Business Age' (Monthly), Vol. 6, No. 1, January 2004, pp. 37-38. 13 SAARC Secretariat, Agreement on South Asian Free Trade Area (SAFTA), SAARC Secretariat, Kathmandu, 2004, P. 1. 14 Ibid, P. 3.

Economic Integration in South Asia
8
of the Association will bring down tariffs to 0 to 5 percent from 25 to 30 percent over the next decade. It has set deadline for developing countries like India, Pakistan and Sri Lanka to set their custom tariff under 5 percent within 2006 and the least developed countries like Nepal, Bhutan and Bangladesh until 2009 and the Maldives before the agreement becomes operational until 2016.15 Obviously, it is expected that free trade will facilitate the establishment of Customs Union, and ultimately to result into full-fledged Economic Union by 2020. SAFTA being a full-fledged South Asian Economic Union, conclusively, makes the region second largest market of the world until 2016.
SAARCFINANCE The SAARC Central Bank Governors and Finance Secretaries' network i.e., SAARCFINANCE was established on 5 October 1998 at the Tenth SAARC summit in Colombo, Sri Lanka with a view to bring up issues on macroeconomic policies to Finance Ministries and Central Bank Governors of the SAARC region. In this regard, correspondence with the relevant bodies in the SAARC region was initiated which culminated in the first inaugural meeting (called the “preliminary meeting”) of the Finance officials of the SAARC region which was held on October 5, 1998 in Washington D.C.
The Terms of Reference of the SAARCFINANCE were approved by the 22nd Session of Council of Ministers held in Kathmandu in January 2-3, 2002. The Council also accorded approval of the SAARCFINANCE as a formal SAARC body and decided that the Chairperson of the SAARCFINANCE would be invited to the future sessions of the Council of Ministers to make a presentation on the SAARCFINANCE activities.
The SAARCFINANCE meets twice a year concurrently with the IMF/WB annual and spring meetings. The SAARCFINANCE Chair moves in rotation with the change of the SAARC Chair. Mr. Ishrat Husain, Governor of State Bank of Pakistan, took over the Chair of the SAARCFINANCE with the change of the SAARC Chair to Pakistan from Nepal in January 2004.
FUTURE COURSE OF ECONOMIC COOPERATION SAARC region contains more than one-fifth of the total world population and two-thirds of the world's poor. The region shares some common features: high population growth, low per capita income, high unemployment and illiteracy, poor economic infrastructures, and untapped resources. The list goes long. These countries have common goal of transforming their agro-based industry to industrial economy and to better the quality of life. The 24th Session of the SAARC Council of Ministers held in Islamabad during January 2-3, 2004 recommended SAARCFINANCE to examine the concept of a South Asian Development Bank (SADB) and to study and make recommendations on early and eventual realization of a South Asian Economic Union (SAEU). Accordingly, SAARCFINANCE is working closely for its actualization.
15 Yadav, Op, cit., P. 37.

Economic Integration in South Asia
9
Regional Economic Cooperation in SAARC
Rajiv K. Chander*
he Charter establishing the South Asian Association for Regional Cooperation (SAARC) was signed on 8 December 1985. Article 1 of the Charter lists the acceleration of economic growth as one of the objectives of the Association. At the very first SAARC Summit (Dhaka, December
1985), the Leaders, in their Declaration (paragraph 13), expressed the conviction that SAARC would “play an important role in accelerating the pace of economic and social development of their countries…” This was in the backdrop of the continuing crisis in the global economy over which the Leaders voiced their deep concern. They listed the steep decline in commodity prices, deterioration in the terms of trade, intensification of protectionist measures, increasing debt burden and decline in external concessional assistance as some of the areas requiring the attention of the international community. In order to harmonize the views of the Member States on these and other issues a SAARC Ministerial Meeting on International Economic Issues was convened in 1986.
In order to base regional economic cooperation on a solid foundation a comprehensive SAARC Study on Trade, Manufactures and Services (TMS) was undertaken and finalized in June 1991. It provided the basis for identification of measures and specific work programmes in the areas covered to promote cooperation among the Member States. The Study considered economic cooperation among the countries of the SAARC region as an imperative for promoting all-round development of the region. The SAARC Council of Ministers at its Ninth Session (Malé, July 1991) endorsed the Study and established, as per its recommendations, the Committee on Economic Cooperation (CEC) comprising Commerce/Trade Secretaries of Member States. Economic cooperation in SAARC received a fillip with the setting up of the CEC.
COMMITTEE ON ECONOMIC COOPERATION (CEC) The CEC is mandated to formulate and oversee implementation of specific measures, policies and programmes to strengthen and enhance intra-regional cooperation in the fields of trade and economic relations. With the creation of the CEC, regional economic cooperation was formally institutionalised as an integral component of the SAARC process.
Over the years, the CEC has emerged as the central group within SAARC addressing economic and trade-related issues. It has provided recommendations and guidance in identifying new areas of cooperation as well as considering reports of specially constituted groups. Its specific functions include analysing inter-regional and global developments which impact on intra-regional cooperation; evolving joint strategies and common approaches at international forums; and recommending policies and measures for promoting intra-regional trade, joint ventures, industrial complementarity and investments. The recommendations of the CEC are submitted through the Standing Committee to higher SAARC bodies, namely the Council of Ministers and the Summit. Twelve Meetings of the CEC have been held so far. The Twelfth Meeting of the CEC was held in Islamabad in November 2004.
SAARC PREFERENTIAL TRADING ARRANGEMENT (SAPTA) In December 1991, the Sixth Summit (Colombo) approved the establishment of an Inter-Governmental Group (IGG) to formulate an agreement to establish a SAARC Preferential Arrangement (SAPTA) by 1997. However, given the consensus amongst the Member States, the
* Director, Trade, Economic & Transport Division, SAARC Secretariat
T

Economic Integration in South Asia
10
Agreement on SAPTA was signed on 11 April 1993 and entered into force on 7 December 1995, well in advance of the date stipulated by the Colombo Summit. The Agreement reflected the desire of the Member States to promote and sustain mutual trade and economic cooperation within the SAARC region through the exchange of concessions. Four Rounds of negotiations were held under SAPTA with a view to widening the coverage of products on which concessions were to be exchanged. The Fourth Round was completed in December 2003.
MEETINGS OF COMMERCE MINISTERS Recognizing the important role economic cooperation plays in South Asia and the need to give policy directives at Ministerial level, meetings of the SAARC Commerce Ministers have been convened on four occasions commencing with the meeting in New Delhi (January 1996). The Fourth Meeting was held in Islamabad in November 2004. These meetings focused on enlarging the scope and coverage of regional economic cooperation. Separate meetings of SAARC Commerce Ministers were also held to evolve common positions on issues before several of the WTO Ministerial Meetings.
TRADE FACILITATION MEASURES With the entry into force of SAPTA (December 1995), action was also initiated on a series of practical measures to facilitate the process of economic integration.
In 1996, a Group on Customs Cooperation was set up and entrusted with the mandate, inter-alia, to harmonise customs rules and regulations; to simplify documentation and procedural requirements; to upgrade infrastructure facilities; and to provide training facilities. Four meetings of the Group have been held so far and a Customs Action Plan has been agreed upon. The Fourth Meeting of the Group on Customs Cooperation (Faridabad – India, August 2004) considered the Report of the Customs Consultant engaged to study and make recommendations on measures to be taken for simplification of procedures and standardization of customs documents and declarations. At the first meeting of its Sub-Group (SAARC Secretariat, September 2004) consensus was reached on a Draft SAARC Agreement on Mutual Administrative Assistance in Customs Matters.
A Standing Group on Standards, Quality Control and Measurements was also established by the SAARC Commerce Ministers in May 1998. The Group has met thrice so far. The key elements of the Regional Action Plan on Standards, Quality Control and Measurements have been agreed upon. With a view to facilitating intra-regional trade, particularly with the scheduled entry into force of the South Asian Free Trade Area (SAFTA) from January 2006, the Standing Group, at its Third Meeting (New Delhi, May 2004) made important recommendations in the area of harmonization of standards, conformity assessment procedures, testing and metrology as well as accreditation.
A draft SAARC Agreement on Promotion and Protection of Investment within the SAARC Region is under the consideration of Member States and is meant to create conditions favourable for promoting and protecting investments in Member States by investors from other Member States. In order to speed up the process of negotiations, the Twelfth Summit (Islamabad, January 2004) decided that an Inter-Governmental Expert Group (IGEG) be constituted to consider the following:
(i) Agreement on Promotion and Protection of Investment;
(ii) Establishment of a SAARC Arbitration Council; and
(iii) Multilateral Tax Treaty with a limited scope with regard to Avoidance of Double Taxation
Several meetings were held in 2004 and substantial progress was registered in finalizing the Draft SAARC Agreements on Investment as well as Arbitration. There was broad agreement on the Draft SAARC Limited Multilateral Agreement on Avoidance of Double Taxation and Mutual Administrative Assistance in Tax Matters. Some of the Draft Agreements referred to in the foregoing paragraphs may be ready for signatures during the next SAARC Summit.
At the Twelfth SAARC Summit (Islamabad, January 2004) the Leaders emphasized the importance of strengthening transportation, transit and communication links across the region in

Economic Integration in South Asia
11
order to have accelerated and balanced economic growth. A SAARC Regional Multimodal Transport Study is to be undertaken shortly in this connection. A Technical Committee on Transport addresses transportation issues on a regular basis.
Given the backdrop of the East Asian financial crisis of 1997, the Tenth SAARC Summit (Colombo, July 1998) realized the need to strengthen individual financial systems of the SAARC countries through enhancement of their institutional capacity and surveillance mechanisms. The need was also felt for closer consultations on and coordination of macroeconomic policies where appropriate. In order to enhance SAARC’s collective capacity in respect of policy analysis with specific emphasis on international financial, monetary, trade and investment issues, the Leaders decided on setting up SAARCFINANCE – a grouping consisting of the Governors of Central Banks and the Finance Secretaries of Member States. The meetings of SAARCFINANCE are held on the margins of the IMF and World Bank Meetings. The SAARC Council of Ministers has in the recent past requested SAARCFINANCE to conduct studies in the areas of its competence.
At the Tenth Summit (Colombo, July 1998) a decision was taken to establish a SAARC Network of Researchers on Global Financial and Economic Issues comprising members of the Private Sector, Central Banks, Planning Ministries, Research Institutes and eminent economists nominated by the Member States to identify, analyze and assist Member States in tackling the global, financial and economic developments affecting the region.
The SAARC Council of Ministers (Islamabad, July 2004) has approved cooperation in the field of Statistics. The first meeting of the Heads of Statistical Organisations of Member States is scheduled to take place later this year.
The SAARC Chamber of Commerce and Industry (SCCI), set up in 1992 as a SAARC-recognized Apex Body, has played a significant role in this regard by bringing together under one umbrella the national chambers of commerce and industry of Member States. Its activities range from promoting trade and interaction of the business community within the SAARC region to providing inputs for SAPTA and SAFTA. The SCCI frequently organises Economic Cooperation Conferences in different Member States to focus on building stronger partnership and collaboration between Governments and Industry. Under the SAARC Visa Exemption Scheme (March 1992) visa requirements are waived for specified categories of persons to travel within the SAARC region. The Scheme includes a category for businessmen.
Since 1996 SAARC Trade Fairs have become a regular feature. Six Trade Fairs have been held so far in different Member States. These help in showcasing the business potential of the region and promote the networking of the South Asian Business community.
SAFTA
The signing of the Agreement on South Asian Free Trade Area (SAFTA) at the Twelfth SAARC Summit (Islamabad, 6 January 2004) marked a major milestone in the history of economic cooperation in SAARC. The Agreement is to enter into force on 1 January 2006 and over a ten-year period the Member States are to reduce customs tariffs to 0 – 5 % for goods from other Member States. The Agreement contains many provisions that provide for special and differential treatment for the LDC Member States viz. Bangladesh, Bhutan, Maldives and Nepal. For example, the non-LDC Member States viz. India, Pakistan and Sri Lanka, are to reduce customs tariffs to 0-5 % with effect from 1 January 2009 for goods from the LDC Member States whereas the latter are required to bring down their customs tariffs to such levels only by 1 January 2016. Currently the four outstanding areas which are under negotiation and will form an integral part of the Agreement as Annexes are – Sensitive Lists, Rules of Origin, Revenue Loss Compensation Mechanism for LDC Member States and Technical Assistance for LDC Member States. SAFTA represents an important step in the direction of greater regional economic integration and when it enters into force in January 2006 it will establish one of the biggest free trade areas in the world in terms of the population covered.

Economic Integration in South Asia
12
SOUTH ASIAN ECONOMIC UNION At the Eleventh Summit (Kathmandu, January 2002) the Leaders agreed to accelerate cooperation in the core areas of trade, finance and investment to realize the goal of an integrated South Asian economy in a step-by-step manner. They also agreed to the vision of a phased and planned process eventually leading to a South Asian Economic Union. At the Twelfth SAARC Summit (Islamabad, January 2004) the Leaders reiterated their commitment for the creation of a South Asian Economic Union (SAEU).
CONCLUSION Thus, right from its inception the leaders of SAARC have been cognizant of the fact that regional economic cooperation would be instrumental in promoting the welfare of the peoples of South Asia. The institutionalization of economic cooperation in the early 1990s with the establishment of the Committee on Economic Cooperation saw a steady growth in the scope and pace of economic cooperation. With the scheduled entry into force of SAFTA on 1 January 2006, SAARC is poised to enter into a qualitatively different phase of significantly deeper and wider economic cooperation.
Economic Integration in South Asia
13
Current Status of Doha Development Agenda:
South Asian Perspective
Ratnakar Adhikari
BACKGROUND orld Trade Organisation (WTO), which came into being in 1995, provides a platform for the conduct of international trade on the basis of its rules-based architecture. Though this institution has faced a number of challenges in the past 10 years of its existence due to the
failure of its two out of five ministerial conferences, its members are committed to overcome them. The major breakthrough was achieved when the trade ministers of 142 member countries succeeded in launching a new round of multilateral trade negotiations in Doha in November 2001. The round was christened the Doha Development Agenda (DDA), which was essentially a compromise between the concerns of the developing countries and developed countries. These two groups were clearly divided on a number of issues, but not on all.
Inclusion of two separate declarations on the main declaration on “Implementation Related Issues and Concerns” and “TRIPS and Public Health” was a major achievement for the developing countries. Other areas, in which eventual agreement was reached despite serious contention, were agricultural liberalisation and negotiations on Singapore issues (which includes competition, investment, transparency in government procurement and trade facilitation).16 Liberalisation of services and those of manufactured goods were not all that contentious, because both the group of countries had something or the other to gain from the liberalisation of these sectors. Other issues, such as the rules of the trading system (subsidies, anti-dumping, regional arrangements and dispute settlement), special and differential treatment for developing countries, trade and the environment, trade-related intellectual property, and providing assistance to developing countries in implementing previous decisions also found the place they deserved in the DDA. Two completely new issues – trade and technology transfer and trade, debt and finance – were also included in the DDA, albeit as ‘soft’ topics.
This entire list of issues forms a part of single undertaking, i.e., they should be treated as a package. In other words, ‘nothing is agreed, unless everything is agreed’. January 2005 was considered the end date for the completion of negotiations. Despite the fact that WTO operates by consensus, setting of such agenda is ambitious. Given the time it took to complete the two previous rounds-seven years for the Uruguay Round (1986-93) and five for the Tokyo Round (1973-78) termination by this date was never credible.17
The Fifth Ministerial Conference, which was to be held in Cancun in September 2003, was supposed to provide a platform for a mid-term review of the progress made in the DDA. However, all the deadlines, which would have become milestones for the achievements of objectives of DDA, were missed. Ministers went to Cancun with limited hope to achieve any major breakthrough. This was further complicated not only by a sharp division over two major issues (agriculture and Singapore issues), but also due to the formation of multiple groupings with entrenched positions. Cancun Conference deservedly failed, amidst these irreconcilable differences.
16 These issues are bundled as “Singapore Issues” because they were included in the WTO proscenium during the first ministerial conference of the WTO held in Singapore in December 1996. During the Doha Ministerial Conference, it was agreed to launch negotiations on these issues subject to ‘explicit consensus’ on modalities of negotiations. See WTO (2001) 17 See Lawrence (2003), Cf Pandey (2004), Infra note 7
W

Economic Integration in South Asia
14
Fortunately, the failure of Cancun was not of the order of the debacle at Seattle, where the ministers had to abandon the entire proceeding. Though the meeting abruptly ended, the Ministers managed to issue a Ministerial Statement towards the end of the Cancun Ministerial. The wordings of the paragraph 5 of the Statement makes it clear that in those areas where the Ministers had reached a high level of convergence on texts, they would undertake to maintain convergence while working for an acceptable overall outcome. The instruction given to the trade officials was to “continue working on outstanding issues” at the General Council. Notwithstanding the setback, Ministers reaffirmed all their Doha Declarations and Decisions and re-committed themselves to working to implement them fully and faithfully.
JULY PACKAGE Though it was agreed to start negotiations in Geneva by 15 December 2003, it took while for the members to get their acts together. The negotiations that finally resumed in March/April 2004, culminated in the adoption of the 1 August General Council Decision (WT/L/579), known as “July Package” (JP). The Package sets the stage for negotiations to be conducted among the member countries during the run up to Hong Kong Ministerial Conference and beyond. Five issues have been identified by JP as priority areas of negotiations: agriculture, non-agricultural markets access, services, trade facilitation and development dimension. They are discussed below.
Agriculture Agriculture not only remains the most contentious issue in the WTO negotiations, but is also considered a deal maker or deal breaker in most cases. Though Cancun failure could be mainly ascribed to agriculture, Singapore issues were made the scapegoats. During the July Meeting too, differences among various groups of countries on agriculture issues was threatening to derail the process of achieving consensus. However, the last minutes agreement reached between so called five interested parties (FIPs) – which included Australia, Brazil, India, the EU and the US – saved the meeting from collapse. They hammered out a deal, which was later accepted by the then 147 member countries the WTO.
Though the process of five countries making a decision on behalf of rest of the membership cannot be considered a healthy practice, this should still be considered as a move in the right direction compared to the past when Quad (Canada, Japan, the EU and the US) used to call the shots. Though the major decisions were made by FIPs, other groups were also active in shaping and influencing the final outcomes. They have become even more active in the post-July period. Annex A of the JP contains modalities for negotiations on agriculture, the contours of which are discussed below.
Market Access In the JP, Members agreed to use a tiered formula, which classifies tariffs into various bands for subsequent reduction from bound rates, with higher tariffs being cut more than lower ones. The actual modalities – the number of bands, threshold for defining bands and type of tariff reductions within each band – remain subject to negotiation. Overall, the negotiations must lead to ‘substantial improvement’ in market access for all products.18 Annex A also addresses the issue of tariff rate quota, tariff escalation, and tariff simplification. In order to address other concerns, side decisions were made on the following three issues:
Sensitive products: Developed countries as well as developing counties can designate an ‘appropriate number’ of tariff lines to be treated as sensitive without “undermining the overall objective of the tiered approach”. Specific rules and criteria are to be developed in future negotiations.
Special products: Only developing countries will be able to designate Special Products (SPs) for more flexible treatment, based on criteria of food security, livelihood security and rural development needs. The decision on the selection criteria are to be made later.
18 See WTO (2004)

Economic Integration in South Asia
15
Special safeguard mechanism: Developing countries will also have recourse to a Special Safeguard Mechanism (SSM) to take measures against sudden import surges. Like SPs, these will also be fleshed out later.
Domestic Support The JP includes concrete targets for the reduction of overall domestic support and specifies that Blue Box levels will be capped. In the first year of implementing the agreement, the text requires Members to reduce by 20 percent their overall trade distorting support, which comprises the final bound total AMS (aggregate measure of support), the permitted de minimis levels and the permitted Blue Box levels. The reduction will be made under a tiered formula that cuts subsidies progressively – higher levels of trade-distorting domestic support are subject to greater reductions.
The Annex also caps product-specific AMS at average levels, based on a methodology to be agreed, in order to prevent circumvention of obligations through transfer of subsidies between different support categories. However, even the 20 percent reduction would not change existing levels of support significantly as the reductions will be made from bound rather than applied levels.19
Export Competition The JP, in addition to providing for a ‘credible end date’ for the elimination of export subsidies – to be agreed upon – also includes within its ambit export credits and credit guarantees or insurance programmes. Trade-distorting practices of exporting state trading enterprises (STEs) and the provision of food aid “not in conformity with operationally effective disciplines to be agreed” in order “...to prevent commercial displacement” will be disciplined.
Non-agricultural Market Access (NAMA) Since developed countries maintain very low (roughly 3.8 percent on an average) tariffs on manufactured products and developing countries either maintain very high bound tariff or have not bound a significant portion of their tariff lines at all, developed countries’ insistence to negotiate NAMA is understandable.
Annex B of the JP titled Framework for Establishing Modalities in Market Access for Non-Agricultural Products states that WTO Members should continue to work on a ‘non-linear formula applied on a line-by-line basis’. However, its emphasis on taking into account the ‘special needs and interests’ of developing countries, including through less than full reciprocity in reduction commitments, provides developing countries some leeway to insist on only linear cuts for certain tariffs lines and perhaps none for others.20
The Annex also specifies that flexibilities for developing countries will include applying ‘less than formula cuts’ to up to a certain percentage of tariff lines, or keeping “as an exception, tariff lines unbound, or not applying formula cuts for up to [5] percent of tariff lines provided they do not exceed [5] percent of the total value of a Member’s imports”. The bracketed figures are open to negotiations.21
Like Agriculture Modalities, NAMA framework ‘contains the initial elements for future work on modalities’ leaving the formula for tariff reduction, the issues concerning the treatment of unbound tariffs, the flexibilities for developing country participants, the issue of participations in the sectoral tariff component and the preferences for future negotiation. It also addresses the issues of non-tariff barriers and requests members to make notifications of NTBs by 31 October 2004 and to proceed with identification, examination, categorisation and ultimate negotiations on NTBs.22
The text also stipulates that the non-ad valorem duty should be converted into ad valolem ones. This is not only expected to make tariff protection more transparent, but also helps exporting countries which face higher level of protection when prices of their exportable products fall.
19 See ICTSD and ÏISD (2004a) 20 See ICTSD and IISD (2004b) 21 Ibid 22 Pandey, Posh Raj (2004)

Economic Integration in South Asia
16
Since most developing countries still have a substantial portion of their industrial tariff unbound, they are expected to bind substantial portion of their tariff lines. Annex B also appears to suggest that newly acceded countries may not be required to undertake any major tariff cuts given the fact that they have already made extensive market opening commitments.
Like in agricultural text, duty free quota free market access to LDCs’ has been left at the discretion of the developed-country participants and ‘other’ participants, without timeline for the same having been agreed.
In relation to non-tariff barriers (NTBs), which are becoming the major market access barriers these days, the General Council, through JP, while recognising that NTBs are an integral and equally important part of these negotiations; instructs participants to intensify their work on NTBs.
Services There are two important issues about the services liberalisations. First, when the General Agreement on Trade in Services (GATS) was prepared during the UR, GATT members adopted a positive list approach – allowing members to pick and choose the sectors which they would like to liberalise. Second, GATT members also agreed that there would be further liberalisation in this sector in a progressive manner – like agriculture. During the run up to the Doha Ministerial, two types of interests had clearly emerged. First, developed countries wanted to see hitherto protected sectors in the developing countries for being extremely sensitive such as water, health, education services liberalised. Second, developing countries wanted to see hitherto protected mode of service delivery, i.e. service delivery through the movement of natural persons (so called Mode 4) liberalised.
Accordingly, DDA mandated negotiations on trade in services with a view to promoting the economic growth of all trading partners and the development of developing and LDCs. Following this mandate, the focus of services negotiations has been on bilateral request-offer exercise. JP too supports this mandate and aims to achieve progressively higher levels of liberalisation with no a priori exclusion of any services or mode of supply. Since the offers submitted so far have not been upto the expectations of the members, JP sets the deadline to submit revised offer as May 2005.
Trade Facilitation Developing countries, despite their willingness, were not able to autonomously implement trade facilitation measures. While there could be several political economy factors that have contributed to this state of affairs, one major reason is the lack of resources. Though studies have indicated that one time investment in such measures could help country save tremendous amount of recurring expenses and even provide streams of benefits to the traders, it is difficult for the government to mobilise the resource required for upfront investment.
The inclusion of this issue for negotiations, “subject to explicit consensus on the modalities of negotiations”, as agreed during the Doha Ministerial Conference of the WTO, had created a sharp division between the WTO the North and the South in the run up to Cancun Ministerial. However, the JP has laid all the speculations to rest on whether or not negotiations will begin on this issue. It is the only Singapore issue in which members have reached an agreement to conclude negotiations as a part of Single Undertaking under the DDA. The Annex D of the July Package, which elaborates the modalities for negotiations on trade facilitation states that negotiations “shall aim to clarify and improve relevant aspects of Articles V, VIII and X of the GATT 1994 with a view to further expediting the movement, release and clearance of goods, including goods in transit.”23
Development Dimension The implementation related problems in relation to the WTO agreements, and the special and differential treatment are being discussed ever since the launching of the DDA in the various committees of the WTO as well as in the special session of the Trade and Development Committee. However, there has not been significant progress in most issues under the discussion. These issues are being relegated to back seat in the elevated discussions on other issues. 23 WTO (2004), Supra note 3.

Economic Integration in South Asia
17
The JP calls for the review of all outstanding agreement specific proposals and reporting to the General Council for clear recommendations on decisions. More vaguely, the Committee on Trade and Development was instructed to report to the General Council ‘as appropriate’ on all other outstanding work, such as a mechanism to monitor the implementation of S&D obligations and the incorporation of S&D into the architecture of WTO rules. Further, the use of the hortatory language such as: “The Council instructs the Trade Negotiations Committee, negotiating bodies and other WTO bodies concerned to redouble their efforts to find appropriate solutions as a priority” shows the lack of seriousness on the part of the trade negotiators to take these issues forward.
On the whole, JP too falls short of addressing issue/agreement specific S&DT. Among the issues agreed for negotiations by JP, trade facilitation text is the only text which contains relatively strongly worded technical assistance language. This text provides the leeway to the developing countries not to implement their part of the commitments in the absence of technical assistance. On the area of agriculture S&D provisions are mostly related to higher transition period and lower level of reduction coefficients. S&DT language, as in the past, are non-binding best endeavour nature.24 Moreover, though the LDCs are not required to participate in any reduction commitment, the non-binding language relating to duty free quota free access25 have further weakened their bargaining position in their efforts to obtain such facilities from the developed countries. The text on NAMA is similar to that of agriculture. As per Annex C of JP titled Recommendations of the Special Session of the Council for Trade in Services “Members shall strive to ensure a high quality of offers, particularly in sectors and modes of supply of export interest to developing countries, with special attention to be given to least-developed countries.” This language does not mean anything to the developing countries as there is a vast difference between “shall strive to ensure” (existing text) which is not mandatory and “shall ensure” which would have been mandatory. Members, as per the text, “note the interest of developing countries as well as other members on Mode 4”. However, noting the interest and actually making a commitment to liberalise this mode of supply are two entirely different issues.
OTHER ISSUES Some other issues, which had become equally contentious if not more than the five priority issues mentioned above, did not find much space in the JP. However, this does not negate their importance. The foregoing discussion focuses on those issues.
TRIPS Agreement The issue of TRIPS and public health, which created a major furor during the Doha Ministerial is as important today. This is because the issue of whether or not countries with TRIPS complaint patent regime can export generic drugs to countries without sufficient manufacturing capacity still begs clarifications. Similarly, the study on the relationship between TRIPS Agreement and Convention on Biological Diversity (CBD) is still being hotly debated at almost every session of TRIPS Council meetings. Countries are divided on whether or not to include a mandatory requirement to disclose the source of origin of genetic resources and associated traditional knowledge while applying for patent. Should the members decide to include such a requirement what should be the modalities for prior informed consent and benefit sharing is another issue that is being discussed in the TRIPS Council.
A third issue which is important from the perspective of the DDA as well as from JP is the possibility of initiation of trade dispute even if there has been no violation of TRIPS Agreement. While the Dispute Settlement Understanding of the WTO allows initiation of such complaints in the case of other “covered” agreement, Article 64.3 of TRIPS Agreement had provided initial exception to this rule. This exception was extended for two years by DDA, but due to failure to reach consensus on this issue during the Cancun Ministerial, the future of this issue remained uncertain for a while. JP has
24 For example, the S&DT text on Export Competition mentions: “S&D will be granted to developing countries, and disciplines on export support will be developed with consideration of the impacts on least-developed and net food-importing developing countries.” 25 The actual language is as follows: Developed Members, and developing country Members in a position to do so, should provide duty-free and quota-free market access for products originating from least-developed countries. See paragraph 45 of Annex A.

Economic Integration in South Asia
18
laid all the speculations to rest by explicitly extending the moratorium until the Sixth Ministerial to be held in December 2005 (read Hong Kong Ministerial).
Finally, the issue of establishment of a multilateral system of protection for wines and spirits as provided for in the Article 24.3 of the TRIPS Agreement, which was reiterated by DDA, too is being discussed in the TRIPS Council. There is a sharp division between the EU-led group the US-led group on over the issue of whether the protection should be voluntary or mandatory and whether the legal effect depends on members’ participation in such a scheme or it applies across the board to all the members. Through JP, the GC requests the Director-General to continue with his consultative process including on issues related to the extension of the protection of geographical indications to products other than wines and spirits.
Trade and Environment Though the demandeurs would have liked to initiate a full-fledged negotiations on trade and environment issues, trade ministers agreed to conduct negotiations on only three areas: a) the relationship between existing WTO rules and specific trade obligations set out in multilateral environmental agreements (MEAs); b) procedures for regular information exchange between MEA Secretariats and the relevant WTO committees, and the criteria for the granting of observer status; and c) the reduction or, as appropriate, elimination of tariff and non-tariff barriers to environmental goods and services.26
Ministers also instructed the Committee on Trade and Environment in pursuing their work to give particular attention to: a) the effect of environmental measures on market access issues; b) the relationship with the relevant provisions on the TRIPS Agreement; and c) labeling requirements for environmental purposes.27
Since a vast majority of the WTO members were not too keen on pursuing negotiations on these issues and procedural issues have taken the centre stage, it is not likely to reach too far.
Only the negotiations on environmental goods have seen some movement with some countries proposing lists of environmental goods although many, in particular developing countries, have yet to put forward their positions.28 The JP also made a passing remark on, among others, environmental issues by simply reaffirming members' commitment to progress the negotiations in line with the Doha mandates.29
Trade, Debt and Finance Developing countries deemed a study on the inter linkage between trade, debt and finance desirable in the context of far reaching liberalisation commitments they had made at the WTO. They were also equally concerned about the access to trade finance to enable them enhance their trade performance. The demandeurs for examining this relationship are countries seeking ways to reduce their external debt burden in the context of the multilateral trading system and countries that have experienced financial crises.30
Ministers agreed in Doha to an examination of the relationship between trade, debt and finance, and of any possible recommendations on steps that might be taken within the mandate and competence of the WTO to enhance the capacity of the multilateral trading system to contribute to a durable solution to the problem of external indebtedness of developing and least-developed countries. The main objective was to strengthen the coherence of international trade and financial policies, with a view to safeguarding the multilateral trading system from the effects of financial and monetary instability. It was also agreed that the General Council shall report to the Fifth Session of the Ministerial Conference on progress in the examination. However, due to divergence of opinion between the members, the GC could not prepare any recommendation for the Cancun Ministerial.
26 WTO (2001) 27 Ibid 28 ICTSD (2004c) 29 WTO (2004), Supra note 3 30 ICTSD (2004d)

Economic Integration in South Asia
19
Neither did JP mention anything other than urging the GC and other relevant bodies to “report in line with their Doha mandates to the Sixth Session of the Ministerial Conference.”
Trade and Technology Transfer Since developing countries, LDCs in particular, felt that technology transfer provisions contained in various WTO Agreements have not been materialised as was promised, they demanded that a negotiations on this issue be held. The Doha Declaration contained the following language: “We agree to an examination, in a Working Group under the auspices of the General Council, of the relationship between trade and transfer of technology, and of any possible recommendations on steps that might be taken within the mandate of the WTO to increase flows of technology to developing countries. The General Council shall report to the Fifth Session of the Ministerial Conference on progress in the examination.”
Besides, Declaration on Implementation Related Issues and Concerns, contained a language to reinforce the mandatory nature of Article 66.2 of TRIPS Agreement and urged the developed countries to submit the progress made. Due to the failure of the Cancun Ministerial, the WGTTT will now have to present its recommendations to the Hong Kong Ministerial Conference in 2005.31
Dispute Settlement The dispute settlement understanding (DSU) of the WTO is working reasonably well. However, particular problems were encountered in relation to time taken to settle the dispute and implementation of remedies proposed by the Dispute Settlement Body (DSB). Though it was decided during the UR itself that the review of DSU would be conducted from 1999 itself, this was not taking place. Therefore, DDA agreed to negotiations on improvements and clarifications of the DSU. It was also decided that DSU review and negotiations on this issue would not form a part of single undertaking.
However, due to apathy of the members, two deadlines post-Doha have been already missed. Now there is no deadline for the settlement of this issue, even though there are a number of proposals on the table.
Technical Assistance and Capacity Building Due to the problems encountered by the majority of the developing countries, in particular LDCs, to implement the commitments made at the WTO mainly due to capacity constraints as well to take advantage of the market access opportunities offered by the WTO agreements, these countries demanded that issue technical assistance and capacity building be discussed under the DDA. The relevant issues identified by the Ministerial Declaration between Paragraphs 38 and 43 were: a) mainstreaming trade into the national development and poverty reduction strategies; b) implementation of WTO commitments; c) coordinated delivery of technical assistance; d) long terms funding for WTO technical assistance; e) market access and export diversification; and f) endorsement of Integrated Framework for Trade Related Technical Assistance (IF) as a viable model for LDCs.
As per the Doha Mandate, the Director-General was supposed to report to the Fifth Ministerial Conference the implementation and adequacy of technical assistance and capacity building commitments identified in different paragraph of the declaration. The December 2002 deadline for the submission of the interim report the GC was missed. During the run up to Cancun Ministerial Conference this issue was sidelined, as other major issues took major portion of negotiating time. There is no mention of this issue in the JP. Technical assistance is now focused on organising regional trade policy courses for training the government officials under what is known as Technical Assistance and Training Plan (TATP). However, it is necessary to understand that trade policy course alone is not what the developing countries are demanding. They need much more than that. For example, they need resources not only to implement their WTO obligations, as noted above, but also help them enhance their supply capacity in order to take advantage of the predictable market access opportunities offered by the WTO.32
31 ICTSD (2004e) 32 See Adhikari (2005)

Economic Integration in South Asia
20
IMPLICATIONS FOR SOUTH ASIA AND THE WAY FORWARD South Asian region has bestowed full faith on the multilateral trading system and all the six member countries of the region (Bangladesh, India, Maldives, Nepal, Pakistan and Sri Lanka), have made public their support to the DDA. They have realised that DDA offers tremendous prospects for these countries to achieve their overarching objective of sustainable development and poverty alleviation. Therefore, they have a high stake in successful completion of DDA.
While it is an imperative for the South Asian countries to join hands together and form a common position in the run up to the Hong Kong Ministerial Conference, there are several impediments inhibiting common approaches. First, there are different priorities and focus of the countries in the region, reflecting their stage of their economic development. While developing countries are in a position to make reciprocal commitments, LDCs would still like to take shelter under the special and differential treatment provisions including availability of preferential market access to developed countries markets. Developing countries feel that the LDCs would be gaining incremental market access at the cost of the former. Second, there are sector specific concerns such as in the case of Agreement on Agriculture (AoA), which is discussed below. One of the major issues, which used to divide South Asian countries, was the Agreement on Textile and Clothing (ATC). However, after the expiry of the agreement in December 2004, this issue no more remains contentious. Moreover, this issue does not form the part the DDA.33
However, despite the above mentioned impediments South Asian member countries of the WTO would do well to move concertedly so that they can create better impact on negotiations. The challenge is to identify the areas of common interest, articulate the common approach and strategy to be pursued in the WTO negotiations, and in the process resolve conflict of interest through a proactive policy of regional cooperation.34 Recognising imperative, the trade and commerce ministers of South Asian countries met in Delhi in August 2001 to prepare and articulate common positions in the run up to Doha Ministerial Conference on a number of issues. This was done as per the mandate of the 11th SAARC Summit held in Kathmandu in January 2001. What follows is an analysis of the likelihood of common positions, or otherwise, on the issues being discussed as a part of the DDA.
Since majority of South Asian are farmers and live in rural areas, their interest lies in protecting their agricultural sector from the onslaught of trade liberalisation and import of subsidised products from the developed countries. While this generalised statement may be true for all the countries of the region, but not for Bangladesh. It has been projected by an International Monetary Fund (IMF) Study that India stands to gain tremendously from the removal of agricultural subsidies in the developed countries, but Bangladesh is slated to lose out because of the increased food import bill. Countries like Sri Lanka and Nepal will also lose out in the process, but their losses are not that high. However, the study also reveals that if India also reduces its subsidies and tariff barriers – rest of South Asia will unambiguously gain. Given this scenario, it might be in the interest of South Asian region as a whole to have a common position on the elimination of subsidies in the developed countries, but maintaining the MFN tariff protection. Then South Asian countries could liberalise tariff on agricultural products among themselves under the South Asian Free Trade Agreement (SAFTA) negotiations. This will continue to protect Indian market from the import of cheap agricultural products, but by providing market access opportunities for the rest of South Asia, it will help enhance regional welfare.
Similarly at the time of reducing tariffs and designating sensitive products, special products and preparing the modalities for SSM, they need to develop common positions. They would do well to consult with each other even at the time of submitting proposal in alliance with other groups. It was not without reason that the above mentioned Delhi meeting of the trade and commerce minister had, among other, underscored the needs for more close collaboration and consultation amongst the SAARC policy makers, and ambassadors accredited to the WTO in Geneva. They were also asked to
33 For a detailed discussion see SACEPS (2002), Post-Doha Negotiations in the WTO: Advancing the Interests of South Asian Countries, Report of the South Asian Centre for Policy Studies, Dhaka 34 Ibid

Economic Integration in South Asia
21
keep each other abreast of country positions, interact and discuss pertinent issues.35 This is applicable not only to agriculture, but all other issues being discussed at the WTO.
On the issue of NAMA, it is proven beyond doubt that two South Asian countries – India and – which maintain one of the highest industrial tariffs in the world are going to be hit hard due to non-linear formula for tariff reduction. Sri Lanka is not likely to lose much because its tariffs are already low on industrial products. NAMA negotiations may have some impact on Bangladesh and Maldives – despite their LDC status which allows them to opt out of tariff reduction exercise – because they will be asked to bind more than 90 percent of their industrial tariff. These negotiations may not have any impact on Nepal not only by the virtue of being an LDC, but also having bound almost 100 percent industrial tariffs at the time of its accession to the WTO. Therefore, it would be in the interest of all the South Asian countries to lend support to India and Pakistan to operationalise whatever little S&DT provisions that is there in the NAMA text of the JP.
On the issue of services negotiations, liberal service regime along with sufficient infrastructure needs to be complemented by facilitated and favourable access to market, technology, information network and distribution channels and market information.36 South Asian countries need to raise the issue under JP in the negotiation on rules. Given the role of remittances in the South Asian economies, there are tremendous gains to be had by all these countries from the liberalisation of mode 4 across the globe particularly on labour intensive services such as construction services. Similarly, they should also press for the liberalisation of outsourcing services, which is covered under Mode 1 of GATS (cross-border supply of services using ICT), since this is clearly an area of comparative advantage for most South Asian countries.
On trade facilitation negotiations, all the South Asian countries should have a common position on most issues being discussed/negotiated. The only South Asian member of the WTO which may have a slightly different approach to trade facilitation negotiation is Nepal. Given the fact that Nepal is a landlocked country, the negotiation on transit freedom is crucial to secure transit rights. Customs and transshipment delays which account for as much as 55 per cent of the logistic costs of sending certain types of goods from Kathmandu to Kolkata, the outcome of negotiation would help to reduce the cost.37 However, given the cost of implementing the measures, which will be eventually proposed after the full negotiations, all the South Asian countries should be extremely careful to ensure that they need sufficient and targeted technical assistance from their development partners to implement these measures. At the individual country level, it is worthwhile for them to conduct studies to map out their technical assistance requirements.
On the issue of negotiations relating to implementation issues and S&DT, South Asian countries should have a common position to ensure that these issues are expeditiously settled, preferably within the new deadlines proposed by the JP. If not these countries should join hand with other countries to block the negotiations on other issues – after all DDA is a single undertaking and nothing can be considered as agreed unless there is an agreement on everything, development related issues included.
Apart from the five core issues identified by July Package, South Asian countries should make best possible effort to ensure that they have common positions on other issues as well. On the three issues relating to TRIPS, they should have the following positions. First, they should aim at clarifying the spirit of the Doha Declaration so that countries with limited manufacturing capacity on pharmaceutical products are free to import generic medicines from other countries, such as India and Pakistan in order to address their public health concerns. Second, they should develop a position that would help them not only prevent piracy of their genetic resources and associated traditional knowledge by emphasising on the disclosure, prior informed consent and benefit sharing as the pre-condition for patenting of invention based on genetic resources and/or traditional knowledge. Third, they should demand that discussions on geographical indications should be broadened to include their products (such as Ceylon Tea, Darjeeling Tea, Ilam Tea and Jamdani Saree) as well.
35 SAARC (2001) 36 Pandey (2004), Supra note 7 37 Pandey (2004), Supra note 7

Economic Integration in South Asia
22
On the issue of trade and environment, there is no harm for South Asian countries in discussing issues that are on the table as a part of Doha Development Agenda. However, care should be taken to ensure that environmental standards are not legitimised within the WTO framework, because this could be used for protectionist purposes by the developed countries. On the issue of trade, development and finance, South Asian countries may not have major interest because of the relatively sound macroeconomic fundamentals they have been able to maintain so far. Trade and technology transfer is a major issue for the South Asian countries, which are net importer of technologies. Therefore, they should make informed intervention at the WGTTT such that their concerns are reflected in the Working Group’s submission to the Hong Kong Ministerial Conference. One area in which they should press for binding commitment is relates to preparing monitoring mechanism within the WTO for the effective operationlisation of the provision of Article 66.2 of TRIPS.
DSU review might not be a priority for South Asian countries at present because of the limited number of dispute in which these countries are involved. Moreover, non-implementation of DSU rulings, which is a major bone of contention, has not been a problem for South Asian countries. The issue of technical assistance and capacity building is a major issue for these countries. They should collectively press for binding commitment on provision of technical assistance to help the LDCs in the region in particular to improve their supply capacity. Investments in upgrading infrastructure and customs administration are the twin priorities are the needs of the hour.
CONCLUSION Since the DDA offers tremendous prospects for the developing countries in general and South Asian countries in particular, they have a high stake in its successful completion.
Despite the failure of the Cancun Ministerial Conference, agreement reached among WTO membership on JP has once again raised hope for the successful completion of DDA. However, given the current state of play and divergence of position among the developed and developing countries, completion of DDA is bound to be a long drawn process with a great deal of acrimony.
South Asian countries have divergent interests and views on some issues, but that does not preclude the possibility of reaching to common positions other issues. Fortunately, it makes prefect sense for them to have common position on most of the issues being discussed as a part of DDA. The differences on two issues – agriculture and NAMA – too can be ironed out through consultations and discussions. However, given the limited negotiating resources at the disposal of most South Asian countries, there is a need to prioritise the issues on the basis of their importance to the region so as to create better impact. At the same time it is necessary for all the countries in the region to be proactively engaged in the WTO discussions so as to ensure that those issues that have been not received as much prominence as they deserve, should be brought into a much sharper focus.
REFERENCES Adhikari Ratnakar (2005), “Putting money where mouth is” in The Kathmandu Post, 18 February, for detailed
discussion on fallacy of technical assistance programmes
Fernandez de Cordoba, F., and D. Vanzetti (2005), Coping with trade reforms: implications of the WTO industrial tariff negotiations for developing countries, United Nations, Geneva.
ICTSD and ÏISD (2004a) Doha Round Briefing Series: Agriculture, Vol. 3, No.2, December, International Centre for Trade and Sustainable Development, Geneva and International Institute for Sustainable Development, Winnipeg.
ICTSD and IISD (2004b) Doha Round Briefing: Market Access for Non-agricultural products, Vol. 3. No. 4, Centre for Trade and Sustainable Development, Geneva and International Institute for Sustainable Development, Winnipeg.
ICTSD and ÏISD (2004c) Doha Round Briefing: Environment, Vol. 3, No.9, International Centre for Trade and Sustainable Development, Geneva and International Institute for Sustainable Development, Winnipeg.
ICTSD and ÏISD (2004d) Doha Round Briefing: Trade, Debt and Finance, Vol.3, No. 10, International Centre for Trade and Sustainable Development, Geneva and International Institute for Sustainable Development, Winnipeg.

Economic Integration in South Asia
23
ICTSD and ÏISD (2004e) Doha Round Briefing: Trade and Technology Transfer, Vol.3, No. 11, International Centre for Trade and Sustainable Development, Geneva and International Institute for Sustainable Development, Winnipeg.
Lawrence Robert (2003), Cancun Collapse Won’t Halt Global Trade Reform. JP Morgan Securities Inc.
Pandey, Posh Raj (2004), “Reflections on the July Package: A Nepalese Perspective”, a paper presented at Thirteenth Forum on Globalisation and WTO organised by SAWTEE and ActionAid Nepal, 9 November, Kathmandu.
SAARC (2001) Joint Statement by the SAARC Commerce Ministers on the Forthcoming Fourth WTO Ministerial Conference at Doha, 23 August, New Delhi
SACEPS (2002), Post-Doha Negotiations in the WTO: Advancing the Interests of South Asian Countries, Report of the South Asian Centre for Policy Studies, Dhaka
WTO (2001) Doha Ministerial Declaration WTO (2001a), Doha Ministerial Declaration, WT/MIN(01), DEC/1, 20 November 2001, World Trade Organization, Geneva.
WTO (2001), Doha Ministerial Declaration, WT/MIN(01), DEC/1, 20 November 2001, World Trade Organisation, Geneva.
WTO (2004) Doha Work Programme: Decision Adopted by the General Council on 1 August, WT/L/579, World Trade Organisation, Geneva.

Economic Integration in South Asia
24
SAPTA and SAFTA: Implications for Nepal
Deependra Bahadur Kshetry*
rade in the context of global economic integration, has become the lynchpin for economic growth of most of the Nation-States. Economies pushing free trade policy no doubt have gained faster
growth than those reluctant to open up the external sector. Though beginning of 90s witnessed the liberalization process of economies in most of the developing nations, the mid 90s with the establishment of world trade organization (WTO), the world has been focusing in expansion of trade under the rule based system. The WTO is encouraging regional trading arrangements with the anticipation of quick realisation of its ideals. It was possible through the pursuit of international trading norms by the regional trading organisations after all, one of the goals of the WTO being to integrate the world trade into single rule based system, the regional trading arrangements facilitate to integrate trade of the region quickly, hence achieving those cherished goals.
Nations bound by the age-old culture, traditions and geographical opportunity feel comfortable to get organised within the region whether the motive may be political or economic. South Asian Association for Regional Cooperation (SAARC) is one of such organisations of the world that endeavors to discuss issues of the region for mutual benefit contributing to world as well. SAARC opted the vehicle for cooperation of the region through preferential trading arrangement among member countries. Since the concept of SAARC preferential trading arrangement (SAPTA) emerged Nepal has remained strong supporter, in fact pioneered to ratify the document. The SAARC leaders were enthusiastic over the development of SAPTA, therefore wanted to step up further by prescribing SAARC as free trade area. Some countries floated the idea of economic union, which bears far-reaching economic and political consequences.
The objective of this article is to enumerate the implications SAPTA and SAFTA on Nepalese economy. The second section touches upon the multilateral trade for Nepal. Third section deals with the current position where Nepal is in, and the matters related to SAPTA and SAFTA agreement. The fourth section contains discussion about the implications that would have in various economic and social sectors of Nepal. A brief conclusion is given at the last section.
NEPAL'S INVOLVEMENT IN MULTILATERAL TRADE AGREEMENTS Confronted by the trade related economic difficulties emerged in 1989, Nepal applied for the membership of General Agreement on Tariffs and Trade (GATT) where working party to was constituted examine the application. Political change of that time overshadowed the issue and hence took some years to revitalise the case of membership in a complete new set up. In 1995, WTO has came into existence succeeding the GATT following most of its legacies. Nepal applied for accession to WTO in 1997 as a continuation of the GATT and working party constituted under GATT to submit to the General Council recommendations which may include a draft Protocol of Accession (WTO-2003). As demanded by Nepal in the capacity of less developed country and also a landlocked country special and differential treatment on different issues were granted for transitional arrangements. To be able to make trade regime fully consistent with the WTO agreements, Nepal was justified and granted different time frame to fulfil the obligations accordingly. Technical areas like costume valuations, Technical Barriers to Trade, Sanitary and Phytosanitary measures and Trade Related Intellectual Property Rights related legal frameworks deserved restructuring. Besides the above issues Nepal assured the WTO not to introduce non-tariff barriers including quantitative restrictions, quotas, ban or other restriction of equivalent effect. Specific time schedules were set in different issues such as
* Executive Director, Currency Management Department, Nepal Rastra Bank.
T

Economic Integration in South Asia
25
completing the enactment of customs valuation consistent with the relevant agreement and implement it by January 2007. Similarly, under TRIPs, industrial Property (protection) Act would be implemented by December 2005. Thus the accession of Nepal to WTO brought obligations of multilateral agreements.
Bay of Bengal Initiative for Multi-Sectoral Technical and Economic Cooperation (BIMESTEC) is another forum where Nepal has been intensely involved in matters of trade in goods, services and investment. By its very name, it is a regional trading agreement which is required to be notified in the WTO so that the provisions enshrined in the agreements are ensured for application. Some corners concerned with trade and investment in the region point out some lacunae in the part of BIMESTEC negotiation particularly in relation to the benefits accrual to least developed countries. BIMESTEC existing provisions lack the special and differential treatment, the compensatory provision due to loss of revenue in course of tariff elimination by 2017 while liberalising trade. (Adhikari-2005). Non-existence of redressing measures available to LDCs under multilateral agreements like in WTO and SAPTA such as allowance of restrictive measures in trade, although for limited period, in times of balance of payments difficulty, lack in BIMESTEC. The question of sharing the benefit out of liberalized trade arises particularly among members with distinctly differing level of economic development. LDCs incurring revenue loss and losing market by relatively infant industries compared to those of developing countries are not perceived well in the BIMESTEC agreement. Yet it has been decided that free trade will be in operation from July 2006.
SAPTA is the third forum that Nepal has been actively participating into multilateral agreements in relation to trade and investment. With the population of 1.4 billion which accounts 21.9 percent of the global population, SAARC intra-region trade comes out to be around 6 billion US dollars, GDP share is 2 percent. Of the global export, the share of SAARC is 1.07 percent. With almost a quarter of the global population but share of GDP and export trade being infinitesimal, SAARC's potentiality in service trade is higher than in goods. Need of the region is to make the SAARC and economic forum witnessing the fact that poverty is largely concentrated in the region, the tendency of the leaders handling the institution tend to be more political. High goals are often set, but materialization lacks extremely. Marching ahead from SAPTA to free trade area SAFTA may furnish proof of its ambitious plan. Besides that other socio-economic plans framing SAARC development goals in the areas of poverty alleviation, health, education, environment etc, are also in the agenda.
NEPAL'S CURRENT POSITION Less than fifty percent of the foreign trade of Nepal takes place with SAARC countries but overwhelmingly skewed with India. Of the total trade of Rs. 154.3 billion of Nepal in 2001/2, 47.6 percent was with SAARC countries amounting Rs. 74.4 billion, in which India's share within the SAARC group during the year was Rs. 72.0 billion, almost 98.1 percent. Considering the geographic proximity and socio-political relationship with India, economy remains Indo-centric. Taking into consideration of export intensity of Nepal with India is about twenty times higher than those with other SAARC countries. Contrary to exports intensity, Nepal's import trade with India and Bangladesh are almost at par (Karmacharya–1998). Trade share of other SAARC member countries with Nepal may be insignificant in volume terms, but by commodity, promotion of trade is highly potential. Mangla port built in Bangla bandh may be instrumental to scale up the trade among member countries like India, Nepal, Banglagesh and Bhutan, hence contributing to reduce poverty. For Nepal, the Mangla port is the outlet to export primary agricultural products to Bangladesh and importing basic items such as liquefied gas and chemical fertilizer. It may help to break the monopoly chain of supplying essential commodities similar to mentioned earlier. Pakistan has shown keen interest in Nepalese tea and herbs, though transit problem exists.
Within the framework of SAPTA, member countries opted to announce commodities that attract preferential treatment. First announcement included 226 commodities while in 1997 additional 2000 items were brought under preferential norms. Modality of entering into preferential trading arrangement on the basis of commodities to be included by the member countries at their sweet will did not fruit well. The pace remained terribly slow and the commodities normally traded did not appear in the list at all.
Economic Integration in South Asia
26
Nepal being the first country to ratify the preferential trading arrangement of SAPTA, had very short list if commodities to be included. It was but natural in the sense that Nepal has limited manufactured items for export and her needs are catered through import that also are circumscribed by level of income, economic activities including industrialization within the country. Gradual opening of trade has left limited avenues for deflection of trade.
The twelfth SAARC summit targeted the implementation of SAFTA accord by January 2006. In this endeavor, remaining exercises of SAFTA rules of origin, sensitive list, technical support and compensation for the loss of revenue to LDCs were to be finalised by the committee of experts before the agreement comes into force. Landlocked and LDCs, because of their economically disadvantageous position are required to be compensated by developing member countries. Nepal's active and constructive role in this regard helps to accelerate the pace of executing the free trade framework agreement. Nepal as a member of BIMESTEC has agreed to implement the free trade accord from July 2006. Both of the accords- the SAPTA and BIMESTEC will be implemented in the same year 2006, if things go smoothly and preparation takes place with the same vigour and spirit as announced.
IMPLICATIONS FOR NEPAL Being the enthusiast advocate of liberalised trade, Nepal has been extending every support for the SAPTA and SAFTA provisions. Benefits however, depend on the nature and level of expansion of supply of items. Nepalese foreign trade possesses unique characteristic. It is commodity and country specific and in some cases contingent upon trade policy of neighbouring country. Long open border with India, though regarded by many, a symbol of friendship and long cherished good neighborliness, in price even of very small margin tend to flow goods either way benefiting the unscrupulous vendors. Even in the formal trade, the policy adopted by either of the country on specific commodities, to name some – pulses and leather, direct effects are observed. It occurs specially at the time of presenting the annual budget. Illiberal export policy in either of the country results in slipping away the commodities through porous border finding way to third countries.
Similarly, certain products of Nepal are destined to a particular country. More than eighty percent of woolen carpet is exported to Germany from where the commodity finds way to other European countries. Almost ninety percent of readymade garment is being exported to the USA. On being dependent on particular country, it becomes hard to get benefit because question of competitiveness in price as well as quality does not arise. Presently problem faced by Nepal is due to expiry of the quota system on garment export. Issues confronted by Nepal in export sector like these have very little to do with regional trading arrangements.
SAPTA is a regional pact the benefits are to be exchanged at reciprocal basis, though the distinction among members lies due to level of economic development. Process of awarding preference on SAPTA is very slow. The tariff preferences exchanged in four rounds of negotiations were of insignificant degree mainly due to small product coverage, narrow margin of preferences. There is no provision to address non-tariff barrier (Kumar-2005). Nepal falling into the category of LDC is entitled to preference reducing tariff at higher rate but the products of exports are few. Most of the items exported to SAARC member countries are primary products the value of which are relatively low.
Industry is the area directly affected by free trade arrangement. Industrial undertakings are not based on competitive edge rather cushioned through protection by tariff wall. The din't manufacturing products are comparatively expensive by din't of geographical position of landlockedness. Transporting raw materials from abroad and again taking back the finished product by the same surface route makes the transportation cost expensive to compete with the coastal producers. Providing preference to products from least developed countries like Nepal is a theoretical premise, in practice whether it may be on the ground of finishing or packaging, products from LDCs prove to be inferior to similar products from developing countries. On this account manufacturing industries suffer in member LDCs compared to those of developing countries. As a result, competition becomes so lopsided that industries in LDCs suffer severe set back to the extent of closure of the enterprises.

Economic Integration in South Asia
27
Competition though beneficial to consumers, it seldom becomes costly to job seekers who are subjected to disappointment due to unfavourable climate to stay in business.
One of the areas the provisions of SAPTA and SAFTA keep mum about is trade in services. Low level of technological know-how and expertise does not supply trained manpower against rest of the member states. Liberalization in services sector again draws attention of the technologically advanced member countries. Telecommunications, Insurance business and like areas are highly technical and sophisticated. Equipment as well as the technicians have to be imported in order to get good service. The only advantage LDCs like Nepal can gain is the supply of skilled manpower. On balance exporting raw manpower while importing the technical and skilled one leaves the situation against the interest of the country. So far the services sector, in the balance of payment presentation, has been recorded in favor of the country. It is the situation where no easy access exist at the job market to the foreigners. Equally important fact is that establishing enterprise in the services sector also has not been totally opened. At a situation when no restriction lies in the services sector, unskilled manpower outpours bringing too little an amount than what the nation pays to the skilled and high paid managerial jobs from foreign member countries. It is but natural that native entrepreneurs either because of lack of knowledge /capital or entrepreneurial capacity, do not venture to run business in the services sector in LDCs . Whatever they have run, they are confronted with heavy investment and modern technology which locals cannot afford to.
Opportunities to reap high rate of return from investment are available in those economies where factors of productions bear prospects of economical use. Preferential and/or free trade provisions assist in making scale of economies operational. In Nepal's case greatest potential for foreign investment lies in the hydropower sector both from size of investments required and its lumpiness. But the geographical constrain to construct transmission lines from the point of production makes the proposition costly. The internal market for the power thus generated is limited while export potential is constrained from external factors. Similarly, considered from the point of view of SAPTA and SAFTA, no provision as such seems to have made to enhance investment in the area. Owing to these reasons the net effect of the existing regional trading arrangements bear natural results at least at the existing conditions. Nepal could benefit from investment in ever-expanding services sector like tourism. Bilateral free trade agreements of India with SriLanka and Bangladesh have benefited the latter two countries in exploiting economic potentials. Indian investment in rubber industries in SriLanka has successfully reduced the trade deficit from 8.6:1 to 4.9:1 in two years of time. Similarly gas industry in Bangladesh attracted $2 billion investment from India (Kumar-2005). Bilateral agreements within SAARC if have demonstrated this potentiality, why such provisions should be incorporated into SAFTA, remains a question to be pondered.
Infrastructure in SAARC region is poor and hence requires improvement. The road, rail and waterway links that bounds the sub-continent into a vast connected web of economic and commercial links remains severed and transit routes enabling to create mutual benefits have fallen prey too narrow political calculations (Sharan-2005). India has proposed a SAARC infrastructure funds of $10 billion to improve port efficiency in member countries. Coastal countries may require to improve airports. According to an estimate Bangladesh requires $782 million, India $1149 million, Pakistan $336 million and Srilanka $ 377 million for the improvement of ports to make them efficient to handle cargoes. Since such provisions lack in the SAPTA/SAFTA agreements, benefiting from it in improving infrastructure remains elusive in Nepal.
Free trade enables to create trade while sometimes it may divert also, but it is sure that overtime revenue collection is affected due to tariff reduction. Contribution of tariff in the total revenue comes around 35 percent. The shares of Nepalese total trade to intra-region trade within SAARC is small, and moreover bilateral agreements with neighbouring countries contain preferential trading arrangement, the loss in revenue from SAFTA may not be high as considered. The average tariff rate also has declined gradually specially after Nepal obtained membership of the World Trade Organisation. Compensatory provisions to the LDCs for revenue loss due to free trade agreement have been made in the SAFTA but the modalities are yet to be arrived at. It is believed that opportunities to accelerate the economy under free trade arrangements are fairly better than the revenue loss incurred. Tariff
Economic Integration in South Asia
28
reduction will provide inducement to expand business of private enterprises, which will come into income tax net.
Trade not aid, a common slogan often heard in economic fora inclines to assist developing countries by encouraging to accelerate trade rather than granting financial assistance by developed countries. In fact emphasising on trade facilitates to activate different wings of economic activities, which may give stimuli to enhance employment and income.
Consciousness to preserve enrollment finds way when trading partners show their concern as per the international standard to be maintained while meeting export needs. Even primary products meant for export have to meet the basic environments requirements of trade relations between two trading partners, have to be continued for secular period. In case of some manufacturing units environmentalists have shown grave concern over the poor arrangements made to address the effluence. Environmental degradation of such mature hardly can compensate the damage done by the export proceeds.
Poverty has been the endemic problem faced by all the member states of SAARC. Two fifth of the South Asian population falls under the category of absolute poverty line. To address the problem properly SAARC has constituted an Independent South Asian commission on goals related to poverty alleviation, besides others. Nepalese workers abroad have provided cushion to lessen poverty by remitting their hard-earned income from foreign employment. But free trade arrangement will support indirectly by allowing to produce cash crops in the agricultural field and employing manpower who have been the victim of disguise unemployment.
Nepal has bilateral trade agreements with several countries including India-the member of SAARC. SAFTA has exemption clause that the provisions enshrined in the bilateral agreements will have no effect due to the regional agreement e.g. SAFTA. Therefore the preferences prevailing between two SAARC member countries-Nepal and India are not bound to scrap the existing provisions so long as both the parties are satisfied.
CONCLUSION A march from SAPTA to SAFTA in SAARC has no doubt become rather a slow step. Slated to start from 2006, SAFTA has emerged as a common platform to share economic benefits emanating from trade in the region. Nepal has been joining multilateral regional and bilateral for a related to trade in order to provide inertia generated by preferential as well as free trade in the SAARC region. Obligations, no doubt will differ depending upon the fora in which a country lands. Under bilateral agreements, the responsibility in either side becomes limited to the parties. But in regional and multilateral agreements, all the member states are required to fulfil the agreements fully. By doing so only the obligations arising from such agreements are fulfilled.
Falling into the category of least developed country Nepal lags behind to compete with other member states specially in the manufacturing sector because of the lack of infrastructure and geographic positions. Being a landlocked country, Nepal is bound to bear higher transport costs, which ultimately is added into cost structure of the item produced. Owing to these facts, export potentiality specially in manufacturing side is bleak but under services sector prospect seems fair.
Liberal trade creates opportunities to export which ultimately is seen creating employment and using raw materials. Such activities help raise income and hence uplift the living standard of the people. It is however necessary to admit that in comparison to the matured industries of the other member states, Nepalese industries are at infancy stage and therefore cannot face competition. Higher cost of production and incapable to withstand the pressure exerted by products of matured industries, Nepal is bound to direct her production process in other sector elsewhere. The overall impact of SAPTA and SAFTA theoretically seems sound to lead the economy to liberal frame and integrate with rest of the world. Since regional trading arrangements ultimately serve the purpose of multilateral trading arrangements, question is of time duration. Following the liberal path of trade specially multilateral one, Nepal also can prove herself as prominent member of the world community.
REFERENCES

Economic Integration in South Asia
29
Adhikari, R(2005); 'LDCs' concerns in BIMSTEC FTA, The Kathmandu Post, March 5, 2005.
Karmacharya, B(1998); Nepal in SAARC: Trade Potentials for Nepal Paper presented in a workshop on Nepal and SAARC organised by coalition for Action on South Asian Cooperation (CASAC), Nov 25-26. 1998.
Kumar, N(2005);Integrating Economies with Growth, The Financial Express, February 1, 2005.
Sharan, S(2005);India and its Neighbours, statement made by foreign secretary at India International Center, Feb 14, 2005.
WTO(2003); 'Working party on the Accession of Nepal', Nepal Rajpatra, Jesta 7, 2061.

Economic Integration in South Asia
30
South Asia Regional Energy Cooperation: Opportunities
and Challenges
Anup Kumar Upadhyay♣
South Asia is important to world energy markets because it contains over 1.4 billion people -- more than one-fifth of the world’s population -- and is experiencing rapid energy demand growth.
BACKGROUND he South Asian region (Bangladesh, Bhutan, India, the Maldives, Nepal, Pakistan, and Sri Lanka) is notable for its large and rapidly growing population (more than one-fifth of the world total).
Despite rapid economic growth during the 1990s, the nations in the region have the lowest per capita incomes in the world. India experienced a growth rate in real GDP of 8.2%, while Pakistan and Bangladesh experienced growth rates of 5.5% and 5.2%, respectively. India’s GDP is expected to grow 6.4% in 2004, with Pakistan’s growth at 5.1% and Bangladesh’s growth at 5.3%.
South Asia is in a period of transition as it strives to implement effective economic, political, social, and legal structures to support sustained growth. The Donor community has prescribed such measures as cuts in subsidies (especially energy subsidies), deregulation, anti-poverty efforts, and increased privatization in the near future.
ENERGY OVERVIEW It is estimated that primary energy consumption in South Asia increased by nearly 64% between 1992 and 2002 (only “commercial” energy sources and not animal waste, wood, or other biomass, which account for more than half of South Asia’s total final energy consumption). In 2002, South Asia accounted for approximately 4.1% of world commercial energy consumption, up from 2.8% in 1991. Despite this growth in energy demand, however, South Asia continues to average among the lowest levels of per capita energy consumption in the world, but among the highest levels of energy consumption per unit of GDP.
Discounting “non-commercial” sources of energy including animal waste, wood, and other biomass, South Asia's commercial energy mix in 2002 was 46% coal, 34% petroleum, 12% natural gas, 6% hydroelectricity, 1% nuclear and 0.3% “other.” Bangladesh’s energy mix, for example, is dominated by natural gas (66.4% in 2002), while India relies heavily on coal (54.5% in 2002). Sri Lanka and the Maldives are overwhelmingly dependent on petroleum (82% and 100%, respectively); Pakistan's mix is diversified among petroleum (42.7%), natural gas (42.2%), and hydroelectricity (10%). Bhutan and Nepal have the highest shares of hydroelectric power in their energy consumption mix at 80% and 31%, respectively. South Asian nations are faced with rapidly rising energy demand (about 10 % per annum) coupled with increasingly insufficient energy supplies. Most of South Asia is already grappling with energy shortfalls, typically in the form of recurrent, costly, and widespread electricity outages. Because of the economic ramifications arising from such shortfalls, improving the supply of energy, particularly the supply of electricity, is an important priority of the respective governments. The countries of South Asia are looking to diversify their traditional energy supplies, promote additional foreign investment for energy infrastructure development, improve energy efficiency, reform and privatize energy sectors, and promote and expand regional energy trade and investment.
♣ Director General, Electricity Development Department, HMG
T
Economic Integration in South Asia
31
OIL South Asia contains reserves of only 5.7 billion barrels of oil, around 0.5% of world reserves. In 2002, the region consumed around 2.72 million barrels per day (bbl/d) of oil, and produced approximately 0.70 million bbl/d, making the region a net oil importer of around 2.0 million bbl/d. The vast majority (around 819,000 bbl/d in 2003) of South Asia’s oil production comes from India. Most of the remainder of oil production comes from Pakistan (around 62,000 bbl/d in 2003). South Asia’s oil imports are projected to more than double by 2020. In an effort to reduce oil import dependence, a number of South Asian countries have sought to expand domestic petroleum exploration by attracting private and foreign investors. In July 2003, the Sri Lankan government approved the Petroleum Resources Act to allow for private and foreign investment in its offshore oil and gas fields. Similarly, Pakistan recently executed Production Sharing Agreements (PSA) with exploration companies based in France, Malaysia and Austria. India is making attempts to better implement its 1997 New Exploration Licensing Policy (NELP) to increase foreign involvement in exploration, most recently by awarding 15 exploration blocks in February 2004.
In Nepal, presently, eight blocks of nearly 5000 sq. km area each are available for exploration by local or foreign oil companies. Recent discovery of oil showings in some of the wells drilled in India situated close to Nepal border is encouraging for petroleum exploration activity in Nepal. The southern Terai plains and the adjoining Siwalik Range have been divided into ten different blocks, each of nearly 5000sq.km, for the petroleum exploration and development.
The Shell Company from the Netherlands conducted exploration work in block no.10 situated in eastern Nepal in 1985. In December 1998, His Majesty's Government awarded the Texana Resources Company of USA the right to carry out the seismic and geological studies in block Nos.3 (Nepalgunj) and 5 (Chitwan). The other blocks remain open to potential investors for exploration bidding.
Growing demand for transportation fuels and industrial power has been a major factor behind recent growth in South Asian oil consumption. Between 1990 and 2000, South Asian oil consumption -- led by India -- grew by about 75%. India’s oil consumption is forecast to grow another 33% by 2010, reaching 2.8 million bbl/d (up from 2.2 million bbl/d in 2002). In Sri Lanka, where oil is the dominant source of energy, oil consumption roughly doubled between 1991 and 2000. In 2002, Sri Lanka’s oil consumption was 75,000 bbl/d. Sri Lanka imports all of its crude oil and uses it largely for electricity generation and transportation. The country has a refining capacity of 50,000 bbl/d. In recent years, Sri Lanka has further increased oil imports in an effort to avoid over reliance on hydroelectricity.
In September 2004, UK oil firm Cairn Energy confirmed the potential of its Mangala field at between 100 and 320 million barrels. Both Mangala and the nearby N-A fields are expected to yield 60,000 to 100,000 bbl/d by late 2007. In early 2004, Cairn Energy discovered another oil reserve in Rajasthan at the N-V-1 well. The reserve is expected to hold anywhere between 300 to 500 million barrels.
REFINING AND TRANSPORTATION In the face of growing oil demand, several South Asian countries have responded with plans to expand their refining and transportation capacities. Since 1998, India's total refining capacity has increased by 86% to 2.1 million bbl/d as of January 2004. India’s largest project in recent days, the Reliance Industries refinery at Jamnagar, began operation in late summer 1999 and has a capacity of 540,000 bbl/d. In August 2003, Bharat Petroleum Corp. Ltd. (BPCL) announced plans to expand its Mumbai refinery from 180,000 bbl/d to 240,000 bbl/d by late 2004. Petronet India is in the process of building product pipelines that will add approximately 500,000 bbl/d to the existing 325,000 bbl/d of pipeline capacity, thereby displacing rail as the main mode of transportation for petroleum products.
In Pakistan, the 100,000-bbl/d “Pak-Arab” refineries came online in late 2000, helping to alleviate the country’s dependence on refined product imports. Two additional planned refinery projects near Karachi and an “Iran-Pak” partnership project near the border with Iran include a private venture. The

Economic Integration in South Asia
32
project has yet to reach financial closure. If constructed, the two refineries will add an estimated 160,000 bbl/d to Pakistan’s refining capacity
NATURAL GAS In January 2004, South Asia’s proven natural gas reserves were estimated at 67.5 trillion cubic feet (Tcf), approximately 1% of the world total. India’s and Pakistan’s reserves are roughly equal in size at 30.14 Tcf and 26.83 Tcf, respectively, while, Bangladesh, reserves contains approximately 10.6 Tcf. The US Geological Survey estimates that Bangladesh contains 32.1 Tcf in additional “undiscovered reserves.” If the higher estimates prove to be correct, Bangladesh could become a major gas producer and supplier to the potential market in neighbouring countries.
At present, all natural gas production in South Asia is consumed domestically. Natural gas is seen as playing an important part in supplying new power plants in the region and diversifying from expensive oil imports. As a result, natural gas usage has increased rapidly in South Asia over the last decade, growing about 59% between 1992 and 2002. In 2002, the region produced and consumed around 2.1 Tcf of natural gas. Around 42% was consumed by India, 39% by Pakistan, and the remaining 19% by Bangladesh.
Indian consumption of natural gas has risen faster than that of any other fuel in recent years and accounts for approximately 6.5% of the country’s energy demand. While it was about 0.9 Tcf in 2002, Indian gas demand is expected to reach 2.5 Tcf in 2025. Increased use of natural gas in power generation will account for much of the change. Like India, Pakistan plans to increase the use of natural gas for future electric power generation projects, a move that will necessitate a sharp rise in production and/or imports of natural gas. Because natural gas is already Bangladesh’s primary source of commercial energy, gas exports are a controversial topic within Bangladesh, as many people feel that Bangladeshi gas resources should be used for domestic purposes before exporting.
Although India’s Foreign Investment Promotion Board (FIPB) approved 12 prospective LNG import terminal projects, several were delayed or cancelled in 2001 following the government’s decision not to extend payment guarantees to power projects which would have been the largest LNG consumers. An import terminal at Dahej received India's first cargo of LNG in January 2004. Construction ofS LNG projects in Gujarat and Kerala have proceeded, with completion dates extending through 2007. The nearly complete Dabhol LNG plant was delayed due to a cancellation of the second stage of the Dabhol Power Project and financial concerns. Pakistan expects recent discoveries, including one in January 2004, to add about 1 billion cubic feet per day (Bcfd) to its natural gas production. Bhutan, the Maldives, Nepal, and Sri Lanka do not currently produce or consume any natural gas.
COAL South Asia contains coal reserves of 95.5 billion short tons or approximately 9% of the world total. Although coal accounts for 43% of South Asia’s energy consumption, nearly all of the coal in this region is produced and consumed by India, the only South Asian country with significant coal reserves (93 billion short tons).Pakistan has limited coal reserves of 2.5 billion short tons.
Power generation accounts for about 70% of India’s total coal consumption, followed by steel and other industries. Despite the fact that Indian coal is generally of poor quality -- i.e., low in calorific content and high in ash -- and primarily located far from major consuming centres, Indian coal consumption is expected to increase to 510 million short tons (Mmst) by 2020.South Asia’s carbon emissions are expected to increase sharply in coming years as a result of increased coal consumption.
Coal currently plays a relatively minor role in Pakistan's energy mix (5% in 2002), but the discovery of large volumes of low ash, low sulphur lignite in the Tharparkar Desert in the Sindh province is expected to have a positive impact on consumption levels by fueling large electric power plants. Bangladesh began commercial coal production in April 2003 with the opening of the Barapukuria Coal Mine, in part to fuel a proposed coal-fired power plant to be developed with Chinese assistance. The project is expected to produce one million short tons of coal per year, principally for

Economic Integration in South Asia
33
electricity generation.Sri Lanka has also approved the development of its first coal-fired plant (300 MW) on its northern coast but plans to use imported coal for fuel.
BIOMASS (NON-COMMERCIAL FUEL) As is the case in many developing regions, South Asia continues to rely heavily on biomass (i.e., animal waste, wood, etc.) for residential energy consumption, particularly in rural areas. Because the primary end uses of biomass are cooking and heating and electricity is mainly used for lighting purpose only. The expansion of grid electricity is not expected to have a significant effect on biomass use in the near future.
ELECTRICITY In 2002, South Asia generated 642 billion kilowatt hours (Bkwh) of electricity. Of this, around 81% was from conventional thermal power plants, 16% from hydroelectric plants, 3% from nuclear, and less than 1% from “other renewable sources” (wind and solar). Also in 2002, India accounted for the vast majority (85%) of the region's electricity generation, followed by Pakistan (11%), Bangladesh (3%), Sri Lanka (1%), Nepal, Bhutan, and the Maldives (1% total).Natural gas is expected to displace some coal-fired generation in India, although recently there have been delays in importing natural gas. Regardless, the net level of coal-fired generation in South Asia is expected to rise. Hydroelectricity is expected to fuel new generations, primarily in Nepal and Bhutan. Non-hydroelectric “renewable” capacity (i.e., wind, solar, ocean, biomass, geothermal) is small at present, but it is increasing, with solar and wind power considered most promising.
Electricity demand in most of South Asia is currently outstripping supply, and the region is characterized by chronic shortages. Reasons for this situation include: shortfalls in generating capacity; low plant load factors due to aging generators and poor maintenance of equipment at existing plants (plus low-quality coal in many cases); and losses of power due to poor-quality transmission lines and theft. South Asia’s rapidly rising electricity demand has heightened the need for additional investment by independent power producers (IPPs). Electricity rates are widely subsidized in South Asia, and state electricity companies are faced with the challenge of paying IPPs their asking price for power while providing lower rates to their customers. Electricity companies also lose a substantial percentage to theft. The IMF and the World Bank have encouraged liberalization of South Asian power sectors, including the reduction of subsidies.
Discussions have been underway for some time among South Asian nations to develop a regional electricity grid connecting India, Bhutan, Nepal and Bangladesh. Such a grid would lead to increased efficiencies and reduced power generation and transmission costs. Nepal and Bhutan have substantial untapped hydroelectricity potential that could be consumed domestically or exported to India, Pakistan, and Bangladesh.
India accounts for about four-fifths of the electricity generated in South Asia. As of 2002, total generating capacity in India was 120 gigawatts (GW). India generates approximately 84% of its electricity from conventional thermal power plants, around 12% from hydroelectric plants , and 3% from nuclear plants. India is facing serious power supply problems, with the Indian government citing current generation at 30% below demand. Although 80% of India's population has access to electricity, power outages and brownouts are common. In 2002, India generated 547 BkWh of electricity. The International Energy Outlook 2004 projects more than a doubling of Indian power demand from 554 BkWh in 2001 to 1,216 BkWh in 2025.
The majority of power generated in India (approximately 55% in 2002) is fuelled by coal. Much of India's new generation is fuelled by natural gas. The Indian government has a target of capacity additions of 100,000 MW over the next 10 years, but recent trends suggest that this target will not be met. In June 2003, the government approved an electricity bill to eliminate controls on generation, transmission and distribution and reduce two major problems plaguing the sector: cross-subsidies and high accounts receivable.
As of 2002, Pakistan had 18 GW of installed electric generating capacity. Thermal plants (oil, gas, and coal) make up 70% of this capacity, with hydroelectricity constituting 28% and nuclear plants 2%.

Economic Integration in South Asia
34
Pakistan currently maintains excess generation capacity, but because few of Pakistan's rural areas have access to electricity and less than half of the population is connected to the national grid, significant demand growth is expected in the long term. Rotating “load shedding” are necessary in some areas, and transmission losses are approximately 30% due to poor infrastructure and significant power theft. Recent power project developments include completion of the 1,450-MW Ghazi Barotha hydropower project and an agreement with China to develop two 600-MW coal plants in the Sindh province by exploiting coal reserves in Tharkparkar. A new hydro plant, the Kalabagh project( 2,400 to 3,600 MW), is pending as a result of environmental concerns.
Bangladesh maintains 3.6 GWh of electricity generation capacity. As a result, only around 18% of the population (25% in urban areas and 10% in rural areas) has access to electricity, and per capita commercial energy consumption is among the lowest in the world (4.0 million Btu). Because power demand grew over 60% from 1991 to 2000, Bangladesh's Power System Master Plan (PSMP) foresees a doubling of required generating capacity by 2005 at a cost of $4.4 billion. Bangladesh generates its electricity mainly at thermal power plants (93%), but also has some hydroelectric projects (7%).
Net electricity consumption in Sri Lanka doubled between 1992 and 2002. In 2002, the country's installed generating capacity grew to 2.1 GW from 1.6 GW in 2001. The government aims to provide electricity to 80% of the population by 2010. Sri Lanka relies on hydropower for most of its electricity, making it vulnerable to fluctuations in rainfall. In an effort to diversify, the Sri Lankan government is working to attract foreign investors to build independent thermal power plants. A 168-MW combined-cycle power project was recently completed in the southern part of Sri Lanka.
Nepal relies almost exclusively on hydroelectricity to meet its power requirements, and at the end of 2004, its installed capacity was 609 MW. Nepal has large untapped hydroelectric potential (estimated at 43,000 MW), which could be developed to provide for the 60% of the population without electricity, as well as for export. In October 2002, Australia’s Snowy Mountains Hydro (SMEC) signed a memorandum of understanding (MOU) for the development of the 750-MW West Seti hydroelectric Project. It will export power primarily to India. SMEC is awaiting approval from Central Electricity Regulatory Commission on "Power Purchase Agreement". Renewable power sources are increasing in Nepal through rural electrification programs which aim to lessen the disparity in electricity access between rural (30%) and urban (90%) areas.
Bhutan's hydropower potential is estimated at 30,000 MW. Hydropower is the dominant source of commercial energy for the country and sales of hydroelectricity exports to India provided 45% of the government's revenues and constituted an 11.6% share of GDP in 2001. India's Tata Power Company and the Power Grid Corporation of India Ltd. have formed a partnership to construct the 1,020-MW Tala hydropower project in Bhutan and a 750-mile transmission line to export power produced by the Tala project to New Delhi and surrounding areas of India. The Tala project is scheduled to be operational by 2005.
POTENTIAL FOR REGIONAL ENERGY CO-OPERATION Harnessing the hydro-electricity potential in the Himalayan region can contribute immensely to the development of South Asia, particularly the countries in the growth quadrangle- India, Nepal, Bhutan and Bangladesh. The development of power plants (combining thermal power and hydropower) through regional cooperation would allow Himalayan water resources to be utilized more efficiently for the benefit of the people in the region.
There is also great potential in the region for the development of regional electricity grid as well as gas and oil pipelines. The economic and technical advantages of a network of electricity grid and regional gas pipeline are numerous. Such networks increase the reliability and security of energy in the region, reduce the required reserves capacity to meet peak demand, reduce cost through large economies of scale, reduce cost of fuel transportation, and allow regional resources to be harnessed more efficiently. In addition, such a system will bring substantial benefits in terms of environmental protection through reduced consumption of fuel wood and low quality coal.

Economic Integration in South Asia
35
BARRIERS TO ENERGY CO-OPERATION The following barriers are identified for an underdeveloped regional power market. Energy cooperation can be successful in South Asia if all parties adhere to the broad principles of gradualism, equity of benefits, and mutual understanding. Energy cooperation may be achieved through proper handling of the following:
a) Larger perspective while planning: Synergy among the neighbouring countries to be developed to optimally exploit the resources and proper understanding to be developed among participating countries in the spirit of mutual trust and cooperation.
b) Tariff issues: Presently power exchange between India, Bhutan and Nepal is decided at the government level. It is high time to formulate sound, commercially-founded, and commonly agreed principles for determining the rates for different types of exchange including long-term contracts.
c) Energy database: There is an urgent need to create a comprehensive energy database to enable the analysis of energy production, consumption, export, import, demand forecasts and elasticity values for the development of a regional energy market.
d) Economic and financial models: There is also a need to develop economic and financial models to carry out economic/ financial analyses of the cost of power delivered from one country to another, including wheeling charges from intermediary systems.
e) Commercial issues: Analysis of ownership and contractual arrangements that allow fair allocation and management of risk.
f) Legal and regulatory issues: Analysis of the adequacy of existing legal and regulatory provisions and desirability of amendment of the laws and regulations.
g) Energy standards: Establishment of uniform energy codes, technical specifications and standards for all the countries in the region to streamline the regional energy trade.
h) Other issues:
• Need to improve arbitration, regional banking (payment securities) • Contract enforcement and payment risks • Harmonize subsidy and pricing policies • Harmonize infrastructure access regulation and remove infrastructure bottlenecks • Improve regional pricing, risk sharing • Transparency in the balance of payment • Supply security (due to import/transit dependency)
WAY FORWARD There is a necessity to launch a program to create awareness among the political establishments/ decision makers and media regarding the benefits of regional co-operation and cross border sale of electricity. Countries in the region need to exhibit a strong will to maintain a spirit of cooperation to fight their common problems and exploit the available opportunities. Creating a SAARC power grid that connects the cooperating countries of the region to ensure reliable and economical power supply is an attractive way for future cross-border power trade. A regional coordination committee under the auspices of SAARC could be constituted to take a lead role in developing an action plan for such regional cooperation. Suitable cross border energy projects that can be taken up as pilot projects could also be identified to create a commercially viable environment for power exchange in the region.
CONCLUSION Energy is a major input that determines the speed and the nature of economic activities. South Asia is a region not only with low per capita GNP but also with extremely low per capita energy consumption. The present level of energy consumption is far below the world average commensurate

Economic Integration in South Asia
36
with current per capita GNP. Access to commercial energy is highly inadequate in south Asia, particularly among the rural poor. This has far-reaching implications in low productivity, environmental degradation, poor health and poverty.
All south Asian governments have embraced market reforms as a necessary step in meeting the energy demand. These reforms, if properly implemented, can have a snowballing effect on the investment climate and pave the way for harnessing hitherto unexploited resources. Within this process, regional cooperation can play a catalytic role in bringing diverse actors - governments, the business community, multilateral agencies and foreign investors - together. Regional cooperation by itself is not a sufficient condition for harnessing resources more efficiently; a necessary precondition is market reforms in individual countries, which would remove existing bottlenecks and create a more conducive climate for attracting investment into the energy sector.
REFERENCES Sources: Crude Oil and Natural Gas Reserves: PennWell Publishing Co., Oil & Gas Journal,
12/22/03;Energy Information Administration, International Energy Database, October 2004;CIA World Factbook; Dow Jones News wire service; Economist Intelligence Unit ViewsWire; International Energy Agency World Energy Outlook; Oil and Gas Journal; U.S. Commerce Department, International Trade Administration -- Country Commercial Guides; U.S. Energy Information Administration; WEFA Asia Economic Outlook. Lowell Feld.; www.sari-energy.org
Note: All information contained in this report is the best available as of October 2004 is subject to change.

Economic Integration in South Asia
37
SAARCFINANCE : A Regional Economic Forum
Dr. Dandapani Paudel∗
he regional network of the Central Banks governors and secretaries of the Ministries of Finance, by the name of SAARCFINANCE, of the South Asian Association of Regional Cooperation
(SAARC), after a long gap of about thirteen years of the establishment of SAARC (8 December, 1985), was established on 5 October 1998 upon the decision of the tenth SAARC Summit in Colombo, Sri Lanka in view to bring up issues on macroeconomic policies to governors and finance secretaries of the region. The members of the SAARC region include Bangladesh, Bhutan, India, Maldives, Nepal, Pakistan and Sri Lanka.
STRUCTURE AND TERMS OF REFERENCE The structure and the terms of reference of SAARCFINANCE was approved by the 22nd Session of the Council of Ministers, which was held in Kathmandu during 2-3 January 2002. The Council also accorded approval of the SAARCFINANCE as a formal SAARC body and decided that the Chairperson of the SAARCFINANCE would be invited to the future sessions of the Council of Ministers to make a presentation on the SAARCFINANCE activities.
STRUCTURE The structural themes of the SAARCFINANCE are as follows:
• SAARCFINANCE will be a permanent body at the level of governors of Central Banks and secretaries of Ministries of Finance of SAARC member States.
• SAARCFINANCE shall submit its report to the SAARC Council of Ministers through SAARCFINANCE Chairperson.
• Each Central Bank will establish a Cell to coordinate the activities of SAARCFINANCE.
• The SAARC Secretariat would assist and coordinate activities of SAARCFINANCE. The Cell in the Central Bank of the country holding the Chairpersonship of SAARC could function as the SAARCFINANCE Secretariat.
• SAARCFINANCE meetings of Central Banks governors and the secretaries of Ministries of Finance shall be held at least twice a year at the time of the annual and spring Meetings of the International Monetary Fund (IMF) and the World Bank Group.
• SAARC Secretary-General or his/her representative(s) will attend the SAARCFINANCE Meetings of Central Banks governors and secretaries of Ministries of Finance whenever they are held within the SAARC region.
TERMS OF REFERENCE/OBJECTIVES The terms of reference cum the broad objectives of the SAARCFINANCE are as follows:
• To promote cooperation among Central Banks and Ministries of Finance in SAARC member states by staff visits and regular exchange of information.
• To consider and promote harmonization of banking legislations and practices within the region.
∗ Chief Manager, Nepal Rastra Bank, Birgunj
T

Economic Integration in South Asia
38
• To work towards a more efficient payments mechanism within the SAARC region and strive for higher monetary and exchange cooperation.
• To forge closer cooperation on macroeconomic policies of SAARC member states and to share experiences and ideas.
• To study global financial developments and their impact on the region including discussions relating to emerging issues in the financial architecture, IMF and the World Bank and other international lending agencies.
• To monitor reforms of the international financial and monetary system and to evolve a consensus among SAARC member states in respect of the reforms.
• To monitor international currency and capital flows and to work towards a common SAARC position.
• To evolve, wherever feasible joint strategies, plan and common approaches in international forum for mutual benefits particularly in the context of liberalization of financial services.
• To undertake training of staffs of the Ministries of Finance, Central Banks and other financial institutions of the SAARC member states in subjects relating to economics and finance.
• To explore networking of the training institutions within the SAARC region specializing in various aspects of monetary policy, exchange rate reforms, bank supervision and issues on capital markets.
• To promote research on economic and financial issues for the mutual benefits of SAARC member states.
• To consider any other matter(s) on the direction/request of the SAARC Finance Ministers, Council of Ministers or other SAARC bodies.
The governor of the Central Bank of Sri Lanka chaired the SAARCFINANCE forum from its establishment until the SAARC Chair was moved to Nepal in January 2002. Subsequently, the governor of Nepal Rastra Bank chaired the SAARCFINANCE till January 2004 when the Chair of SAARC shifted to Pakistan. However, the formal handover of the Chair of SAARCFINANCE from Nepal to Pakistan took place during the spring meetings of IMF and the World Bank group in April 2004 in Washington D.C. Since then, the governor of the State Bank of Pakistan has been chairing the SAARCFINANCE until the postponed SAARC Summit will take place in Bangladesh.
The chronology of the SAARCFINANCE meetings from its establishment has shown a regular event except the year 2001 due to 9/11 event in the United States.
Meeting No. Dates Venue
1st October 5, 1998 Washington, D.C. 2nd April 28, 1999 Washington, D.C. 3rd September 27, 1999 Washington, D.C. 4th September 25, 2000 Prague, Czech Republic. 5th April 30, 2001 Washington, D.C. 6th April 21, 2002 Washington, D.C. 7th September 30, 2002 Washington, D.C. 8th April 12, 2003 Washington, D.C. 9th September 22, 2003 Dubai, UAE. 10th April 24, 2004 Washington, D.C. 11th October 4, 2004 Washington, D.C. 12th April 15, 2005 Washington, D.C.
Looking at the venues, most of the meetings were held in Washington, D.C., which was but natural that the SAARCFINANCE meeting is a concurrent event of the IMF and the World Bank group meetings.
Economic Integration in South Asia
39
The SAARCFINANCE meeting of the of 30th April 2001 in Washington D.C., decided in establishing a SAARCFINANCE Cell in each Central Bank to review the SAARCFINANCE activities, prepare and update the SAARCFINANCE progress report, make recommendations on the future work programs et al. As such, the head of the SAARCFINANCE Cell is called the SAARCFINANCE Coordinator (s). Later on, the issue was raised and decided to put a Coordinator in each Ministry of Finance and some of the Central Banks have also nominated such Coordinators whereas some Central Banks finally did not see it practical keeping in view of the work load, unnecessary additional layer of bureaucracy, duplication of work nature, etc. Presently, there is a consensus that it is up to the concerned member states to decide voluntarily and the Coordinator of the Central Bank may duly report to the Ministry of Finance as and when necessary about the SAARCFINANCE matters.
The SAARCFINANCE Coordinators meet once in a year sometime before the IMF and the World Bank group annual meeting to review the SAARCFINANCE activities and prepare the agenda for the SAARCFINANCE meeting of the Central Bank governors and secretaries of the Ministries of Finance. To date, the Coordinators met four times, the 1st one in Colombo, Sri Lanka, the 2nd and the 3rd ones in Kathmandu, Nepal and the 4th one on 23 September 2004 in Islamabad, Pakistan.
The 10th SAARC Summit, Colombo realizing the importance of economic cooperation in the region showed serious concern over the challenges and opportunities facing the region. As such, it was noted that in the wake of globalization and liberalization the SAARC region could achieve mutual benefit establishing the link with different economic unions and trading groups. Also the summit acknowledged the need for strengthening financial system of SAARC region through enhancing institutional capacity, surveillance mechanisms as well as with a closer consultation and coordination of macroeconomic policies. Similarly issues of enhancing collective capacity in respect of policy analysis with special focus on international finance, money, trade and investment were also acknowledged. Nevertheless, the 10th SAARC Summit pitched a broad way for shaping the roadmap for the SAARCFINANCE then after.
Staff exchange program, trainings / seminars, research studies on various issues have been the major events undertaking since the establishment of SAARCFINANCE and also these agendas will remain continue in the future also. Apart from trainings and seminars the staff exchange programs have been very much successful benefiting to more than 135 central Bank officials across the member states. It was but natural the flow of staff was concentrated to India due to vast experience sand well institutional arrangements.
The trainings / seminars basically were organized on:
• Supervision of Financial Institution • E-commerce, Global Financial Crisis and Recession. • Micro-credit operations, issues in Exchange Rate Management. • Financial Sector Assessment. • The year 2000 (Y2K) Problem and Regional Cooperation for Business Community in the
Banking Sector. • Issues in External Sector Management. • Promoting Financial Stability: The Role of Central Banks, et al.
The research studies were conducted on the contemporary topical issues including:
• Impact of the Global Financial Crisis and the Recessionary Conditions in the Region. • Reforms of the International Financial and Monetary System. • Impact of the Euro on South Asia. • The Feasibility of Using National Currencies in SAARC Trade • Integration of Rural Commodity and Financial markets. • Contractual Savings. • Impact of Oil Prices, et al.

Economic Integration in South Asia
40
The SAARCFINANCE activities include the regular meetings of the SAARCFINANCE and SAARCFINANCE Coordinators, in which, the member states share each others experience, review and update the global and regional economic issues. The SAARCFINANCE meetings also share views from outside the region, basically from the multinational financial agencies like IMF, World Bank BIS Asian Development Bank (AsDB) etc, on immensely useful issues mostly on technical matters in the trainings and seminars program with the leadership of SAARCFINANCE itself. On behalf of the ASDB, there were two presentations on (i) the Regional Economic Monitoring Unit (REMU), Its Role, Responsibility and Potential Benefits for the SAARC Region and (ii) Asia's Integration with Focus on Monetary and Financial Cooperation focusing on emerging trends in integration, monetary and financial cooperation in East Asia, REMU and outline of SAARCFINANCE/AsDB cooperation.
The major issues, which have been discussed and most of them have already been materialized in the SAARCFINANCE meetings are as follows:
• Establishment of the SAARC Regional Center for Banking and Finance, • Integration of Rural Commodity and Financial Markets, • Vulnerability Indicators and Codes of Standard. • Surveillance of International Currency and Capital Flows and Evolution of a Common
SAARC Position. • Marrying Macro and Micro Aspects of Financial Stability. • South Asian Monetary Institute, et al.
The 24th session of the Council of Ministers recommended the SAARCFINANCE to study and make recommendation on the establishment of the South Asian Development Bank (SADB) and South Asian Economic Union (SAEU). As such, with a close consultation and coordination with the member central banks, Nepal Rastra Bank (NRB), on behalf of the then chairing country initiated and prepared the preliminary discussion drafts of SADB and SAEU and circulated them to the member Central Banks. Also the SAARCFINANCE meetings noted and discussed on the theme of the concept papers and decided to undertake further studies. However in the case of SAEU, the SAARCFINANCE realized that it was eventual and early realization and somewhat immature to materialize immediately. Needless to emphasis, such arrangements will help to enhance the economic integration with the developments of the converging environment.
As elsewhere in the regional integration process, the future agenda will automatically involve, among others, the convergence criteria. Theoretically and practically, the emergence of convergence criteria with a set of bench mark is both the necessary and sufficient condition for the successful operation of regional economic union, common currency, single Central Bank, free flow of labor and goods, etc. For this, SAARCFINANCE will need to work very hard since the region has a divergence economic standard among the member states. Obviously, India, Pakistan and Sri Lanka are with the developing status whereas Bangladesh, Bhutan, Nepal and Maldives are relatively underdeveloped in the region.
It is but natural for the SAARC and specifically for the SAARCFINANCE to have a forward looking vision with medium to long term targets to move and mar beyond the regular ceremonial types of events to more dynamic aggression keeping in mind the ground reality of the region. It is natural to expect that it may take a longer time to develop the convergence criteria, if the SAARC moves in a slow speed.

Economic Integration in South Asia
41
Financial Sector Regulation in SAARC Countries
Binod Atreya, Ph.D*
INTRODUCTION t is increasingly believed that a sound and healthy financial system contributes to economic growth and development. In order to create a sound and healthy financial system, prudent and efficient
regulation is important. Finance is central to the development of any economy. The financial sector is primarily the means for transforming and transferring the savings of an economy into its investment. It means those institutions that hold financial assets (such as loans, mortgage, share of stocks, etc) and that obtain the funds for these investments by issuing liabilities (such as deposits, mutual fund shares, insurance obligations, etc.). These would include banks, development banks, finance companies, insurance companies and so on. The financial intermediaries normally perform three important functions. They are: channeling funds from savers to investors; providing a payment system for transactions, and distributing risks across space and time to those best able to bear them (Chami et al, 2003). The financial sector exists to facilitate the allocation of resources in an environment of uncertainly and risks. Risks are involved when the financial system channels resources from savers to investors. Therefore, a well functioning financial sector tries to make the most productive use of savings, and monitors closely to ensure that the productivity is ascertained.
The present financial environment, which depends more on market factors and less on the government intervention, does require a sound and prudent regulation. The best operation of financial market do need financial regulation. According to White (1999) “ the operation of an efficient financial sector is dependent, however, on efficient financial regulation, because finance involves an unavoidable time sequencing that creates special problems. Finance always involves an initial conveyance of funds – a loan, an investment – and then a later reversal of flow of funds-the loan repayment (plus interest), a stream of dividends, etc.” Financial regulation arguably has welfare benefits and determines how financial institutions and markets work and operate in practice. It is also important to safeguard from the market imperfections and failures in the financial system. Establishment of a sound financial system is contingent upon the establishment of strong regulatory framework that guides and directs the financial system to operate effectively. Financial regulations - economic regulation and prudential regulations, aims at ensuring financial sector sustainability and efficiency.
The aim of this paper is to describe the regulatory framework in SAARC countries. It appears that the financial systems across the SAARC region show considerable diversity calling the need for harmonization of policies. Efforts made towards harmonizing the banking policy are explored. It concludes with raising future challenges for the SAARC countries in the task of ensuring effective and efficient financial system.
BANKING SECTOR IN SOME SAARC COUNTRIES The financial system in SAARC countries is composed of both, banks and non-banks financial institutions. In Bangladesh, the banking sector includes 49 commercial banks; 4 Nationalized Commercial Banks (NCBs); 5 Specialized Development Banks (SDBs); 30 Private Commercial Banks (PCBs) and 10 Foreign Commercial Banks (FCBs). These institutions share 46.83 percent, 10.12
* Director, Bank and Financial Institutions Regulation Department, Nepal Rastra Bank. The author can be contacted at [email protected]
I

Economic Integration in South Asia
42
percent, 35.35 percent and 7.7 percent respective of the total banking sector’s assets (World Bank 2004). Banking sector holds 89 percent (as of December 2001) of the financial sector’s assets.
In India, banking sector holds 58.4 percent of the total financial assets and non-banking finance companies, insurance companies, thrift credit societies and rural banks, pension funds, and other non-bank financial institutions share the rest percent. According to World Bank (2004) the banking sector includes 27 public sector banks, eight state banks, 19 nationalized banks, 21 old private banks, nine new private banks and 36 foreign banks. The public sector banks (including state banks and nationalized banks) hold 75.7 percent of the banking sector’s total assets.
As of October 2004, the financial system in Nepal is composed of 17 commercial banks, 25 development banks, 58 finance companies, 44 non-governmental micro credit institutions, and 22 non-governmental cooperative societies authorized to do limited banking activities. All these institutions are under the regulatory framework of NRB. Beside these institutions, the financial system is composed of 117 postal banks, 15 insurance companies, Employee Provident Fund, Citizen Investment Trust, Deposit Insurance and Credit Guarantee Corporation, Security Board, and Nepal Stock Exchange. The banking sector includes 17 commercial banks, with two public banks holding about 39 percent asset share, six foreign banks with a 17.14 percent assets share and nine local banks with a 43.96 percent share of the total sector assets.
As of September 2003, the banking sector in Pakistan holds 96.3 percent of the total financial assets. The banking sector includes 37 commercial banks, including five public banks, 17 private banks and 15 foreign banks taking the share of 38.8 percent, 45.6 percent, and 11.5 percent respectively of the sector’s total assets (World Bank 2004).
In Sri Lanka, the banking sector holds 63.7 percent (as of December 2002) of the total financial assets. The banking sector includes 22 licensed commercial banks including two state banks, 9 private banks, 11 foreign banks, and 14 licensed specialized banks (eight national banks and six regional development banks) that hold 36 percent, 33 percent, 9.7 percent and 21.3 percent respectively of the banking sector’s assets.
The central banks are responsible for establishing regulatory and supervisory framework for the smooth operations of banking and financial institutions in these countries. Central banks, i.e., Bangladesh Bank, Reserve Bank of India, Nepal Rastra Bank, State Bank of Pakistan and Central Bank of Sri Lanka have issued prudential norms to guide the operations of banks and financial institutions. The task of creating a sound, healthy and efficient financial system is a great challenge for central banks because the financial markets are emerging dramatically in its various forms and shape making it complex and difficult to govern in this globalized world.
THE NEED FOR FINANCIAL REGULATION The recent trend observed in the international financial system shows considerable diversity and pose threats to the financial sector regulation. The regulatory trend seems to move away from command and control regulations to greater reliance on assessing the internal risk-management systems, the supervision of banks and more effective market discipline. Some important points that have implications to the financial sector regulation are as follows:
1. There is a growing linkage among different segments of the financial systems - banks, development banks, financial institutions, insurance business, capital markets, etc. These linkages are complex in nature due to conglomeration and new methods of risk transfers. The relationship among the financial players is getting blurred due to liberalization and globalization.
2. Improvements in technology and lower costs of information and communications and financial liberalization in the late 1980s facilitated the growth of cross-border business in various forms worldwide. Its impacts have been seen in the international trade, Foreign Direct Investment (FDI) and capital inflows in this planet. The World Bank38 estimates that between 1990 and 2001, the share of international trade in total output (exports plus imports of goods relative to GDP) rose
38 refer World Bank briefing papers on Globalization

Economic Integration in South Asia
43
from 32.3 to 37.9 percent in developed countries, and from 33.8 to 48.9 percent in the developing countries. As financial openness increased across the world, global flows of foreign direct investment have more than doubled relative to GDP. The World Bank estimates that FDI increased from US$324 billion in 1995 to US$1.5 trillion in 2000. Although in the last few years, FDI has fluctuated due to global economic slowdown and political and economic instability in some regions, such as Latin America and Argentina; FDI has remained a strong force in the economic development of many Asian countries. It is estimated that developing countries received approximately a quarter of world FDI inflows in 2001. Internationalization of financial market poses threats to financial regulation, making it difficult to work.
3. The universal banking practices, deregulation pursued in response to macro economic pressures, banking crisis in the 1990s and an encouragement of more competitive behavior resulted in the expansion of banking risks across the boarder.
4. It is observed that due to increase in conglomeration there could be conflicts of interest in the ownership structure. Moreover, the financial safety nets can be de facto extended to non-bank financial firms, if banking activities are not effectively ring fenced and public expectations are not carefully managed. This create challenges for supervision, increases the opportunities for regulatory and supervisory arbitrage with firms channeling more risky activities to areas with relatively less developed or stringent regulation and supervision (IMF 2004).
5. The increasing internationalization of financial sectors, liberalization of cross-boarder capital in the context of many countries have become the member of World Trade Organization (WTO), deregulation of exchange rates regime- could be termed as ‘economic globalization’, requires new regulatory framework that could coordinate cross-boarder transactions, supervisory framework, cross-boarder mergers and acquisitions and foreign direct investment.
6. Another important trend in the financial system has been a substantial increase of de facto dollarization, which means the domestic use of foreign currency. It is argued that this increasing trend of dollarization may increase the financial vulnerability of financial systems to solvency and liquidity risks. It is noted that (IMF, 2004) the principles relating to capital adequacy and risk management, and regulations regarding solvency and liquidity, can help national authorities to deal with potential vulnerabilities posed by dollarization by, for instance (a) including capital requirements for exchange-rate–related risks; (b) imposing adequate regulatory limits on banks’ open foreign exchange positions; (c) imposing adequate reserve requirements; (d) setting out adequate requirements for evaluating asset quality and the adequate of loss provisions and reserves for loans on foreign currency; (e) establishing adequate systems for the granting and managing of dollar loans and investments; and (f) requiring banks to have in place proper systems to measure, monitor, and control foreign-currency-related market and material risks.
7. Inherent weaknesses in infrastructure underpinning regulatory system are posing threats to the proper functioning of financial system. Recent assessments carried out by IMF (2002) revealed that (a) unstable macroeconomic conditions; (b) obsolete bankruptcy laws, long judicial delays in loan collection and procedures for collateral foreclosure; (c) weak accounting standards, lack of meaningful financial reports; (d) inefficient resolution of bank problems; and (e) a widespread presumption were some weaknesses found in the banking sector. Poor financial transparency due to opaque financial statements and problems in accounting and auditing, problems in the actual application of International Accounting Standards (IAS) and weak corporate governance are problems in the developing countries.
8. In many countries, the financial system structure is characterized by the state domination or ownership. It is often the case, like in Nepal that state ownership creates additional regulatory problems, such as to manage weak corporate governance structure and management, political interference, conflict of interest, difficulties in enforcing precursory or remedial regulatory measures etc.
9. Financial liberalization not only brings opportunities but also risks to many countries. The East Asian crisis in 1997, the result of the liberalization of capital markets and the globalization of the

Economic Integration in South Asia
44
financial markets, not only led to massive inflows of capital into the Asian countries, but also created financial fragility in the region. Huge capital inflows, lending booms, asset price bubbles, high domestic interest rates, an open capital account and relatively a fixed nominal exchange rate in these countries encouraged large amount of borrowings from abroad. The retreat of capital flows created problems in the banking sector. The poor institutional capacity, and weak regulatory and supervisory structures could not cope with the unanticipated problems, resulting in further deterioration of the situation, which later on transformed into a political crisis in some countries. The lessons learnt from the Asian crisis were that financial crises in individual countries have significant spillover effects on neighboring countries, and that countries need to cooperate on monetary and regulatory frameworks to provide a mechanism for preventing such crisis from repeating in the region. It was also realized that a policy dialogue among the regional countries could play a significant complementary role to national level policy making in such situation. Managing cross-boarder operations is a great challenge in the emerging financial markets.
10. Banking business is no longer a national phenomenon. The growth of international lending and the establishment of multinational banks and their branches in the domestic arena; the likely impacts or spillover effects from one jurisdiction to another because of the close linkage between banks and financial institutions in different countries; the possibility of competitive distortions arising from the cross-border competition due to uneven regulatory and supervisory frameworks, underscore the importance of regulation at the regional and global levels.
All these points suggest that the financial markets are complex and to govern such a market requires regulations and standards so that it would help to ensure financial stability and promote economic growth in the country. Realizing this important fact, international communities are working on to establishing prudential regulation and standards to govern the financial systems. The Basel Committee on Banking Supervision (BCBS), the International Association of Insurance Supervisors (IAIS), and the International Organization of Securities Commission (IOSCO) are collectively involved in developing internationally agreed-upon standards of best practice. The Basel Core Principles has laid out fundamental principles for banking supervision. The BASEL II is to be implemented by 2007. In October 2003 new guidance ‘Insurance Core Principles and Methodology’ was adopted by the IAIS. Similarly, IOSCO adopted a methodology for assessing implementation of securities regulations in October 2003. The International Accounting Standards Board (IASB) has established international accounting standards to ensure the financial sector follow the best accounting procedures and standards. In the areas of audit, the International Auditing and Assurance Standard Board (IAASB) of the International Federation of Accountants have contributed in establishing audit standards and audit risks assessment. In spite of all these efforts, financial regulation in developing countries suffers from inadequate legal systems, lax accounting standards, limited ability to contend with market volatility, poor corporate governance, etc. SAARC region is not the exception.
REGULATORY FRAMEWORK IN THE SAARC COUNTRIES Banking regulation was thought to be a prerogative of the central banks before 1980s. Central banks used to direct activities for banks and financial institutions. Both deposit and lending rates were controlled by central banks. Banks and financial institutions had limited freedom in exercising banking business in their countries. This situation was reversed when the forces of liberalization and globalization took pace in the late 1980s.
Banking regulatory practices differ significantly in the SAARC countries. This is revealed from a study done by the World Bank (2004) on capital adequacy, asset quality, provisioning requirements, liquidity management, and directed lending program in these countries. Let us review them in brief.
Capital Adequacy Although all South Asian countries have introduced prudential norms based on the Basel guidelines, some of the regulatory measures implemented by these countries are different. All commercial banks are required to maintain capital adequacy on the basis of risk-weighted assets, which range from 8 percent in Pakistan to 11 percent in Nepal. In Sri Lanka, commercial banks maintain 10 percent and in Bangladesh it is 9 percent. There are also differences in calculating tier one

Economic Integration in South Asia
45
capital and tier two capital composition. It has been revealed that deviations from the international best practices are due to divergent practices in computing core and supplementary capitals in the region. The World Bank (2004) argued that ‘overall the region’s capital adequacy requirements are more lax than international standards-largely due to items included in computation of capital’.
Asset Quality As to classification of loans, the international best practices suggest that loan principle and /or interest that are three months or more in arrears be classified as non-performing loans. Time limits set by international standards for classification of loans are three, six, and one year for 'doubtful', 'sub-standard' and 'bad' loans respectively. However, countries in the region, except than Nepal, India and Sri Lanka, consider advances in arrear for 6 months or more as non- performing loans. The World Bank (2004) argued that ‘the international practice of classifying non-performing loans using a three-month standard is not practiced across the South Asia region. …. Overall the region’s banks follow loan classification schedules that are lenient compared to international best practices. Having different types of credit facilities under different types of classifications further complicates the picture. Both factors contribute toward reduction of provisioning requirements, thus increasing the possibility of losses’. This reveals that SAARC countries present classification of loans differently.
Provisioning Requirements Among the SAARC countries, divergent practices exist in provisioning requirements. In Pakistan and Sri Lanka, there is no need to make provisions for performing loans. However, a minimum loan provision of 1 percent, 0.25 percent, and 1 percent has to be made in Bangladesh, India and Nepal, respectively. Provisions for substandard loans vary from 10 percent in India, 20 percent in Sri Lanka and 25 percent in Nepal. Provisioning of 100 percent is required for bad loans in India, Sri Lanka, Pakistan, Nepal and Bangladesh. In Nepal additional provisioning of 20 percent is required for unsecured loans with only personal guarantees.
Directed Lending Prudential regulations in India require commercial banks to direct their lending to the priority sector and weaker section, whereas such provision is not made in Bangladesh, Pakistan and Sri Lanka. In India, all banks must lend 40 percent of their net loans to the priority sector, out of which 18 percent to agricultural sector, 10 percent to the ‘weaker sections’. In Nepal, commercial banks are required to invest 40 percent of their total advances to productive sector, of which 12 percent in the priority sector, and 3 percent in the deprived sectors. Recently, in an effort to avoid directed lending practices, NRB has issued directive to phase out the priority sector-lending program by 2007. Thereafter it will not be a mandatory on the part of commercial banks to lend in the priority sector.
Risk Diversification Commercial banks in Nepal can extend fund-based advances up to 25 percent of core capital and up to 50 percent for non-fund based facilities to a single borrower. In India, single obligor limit is 15 percent of capital funds and 40 percent in case of group. Provision to extend 10 percent has been made for infrastructure projects in India. In Bangladesh, commercial banks can lend 50 percent of their total capital. In Pakistan the total outstanding to a single borrower should not exceed 30 percent of the bank’s unimpaired capital and reserves, subject to the condition that the maximum outstanding against fund-based financing facilities do not exceed 20 percent of the capital and reserves.
Liquidity Management On the issues of liquidity management, prudential regulations require all banks to maintain Statutory Liquidity Ratio (SLR) in all SAARC countries, except Nepal. The ratio of SLR ranges from 15 percent of time and demand deposits in Pakistan to 25 percent in India. Nepal liberalized the financial system by abolishing SLR requirements in 1993. All countries in the region do maintain Cash Reserve Ratio (CRR), but the ratio differs among the countries.
Beside these points, it can be generalized that public sector banks like in Nepal are performing less satisfactorily compared to foreign and joint venture banks in all SAARC countries. Overstaffing is a

Economic Integration in South Asia
46
common problem in public sector banks. Intermediation costs is high compared to foreign and joint venture banks and many public sector banks are operating at loss. Countries have issued policy directives taking into account their local requirements.
The above explanations show that there exists diversity in the regulatory framework in the SAARC countries. Countries might have adopted regulatory measures to suit their national circumstances. However, the Basle Committee and other bilateral lending institutions are gearing towards creating competitive equality through harmonizing regulatory and supervisory arrangements. While many of the regulatory provisions have to be adjusted taking into account the national financial systems and left to national discretion, no doubt the SAARC countries could benefit from the harmonization or exchange of regulatory and supervisory arrangements.
THE NEED FOR POLICY INTEGRATION The growing trade interdependence, rapid expansions in capital flows, fundamental shifts towards market-based open policy, economic liberalization and internationalization of capital and production network have given rise to the need for policy integration among the countries, regions or at the global level. International organizations, such as the World Bank, IMF and other bilateral lending institutions, have advocated a global regulatory framework to strengthen the international financial system. The Committees of the Bank for International Settlement (BIS), the G-20, consisting of finance ministers from developed and emerging economies, and the Financial Stability Forum (FSF) established in 1999, are geared towards strengthening the international financial system. Harmonization of policies and strengthening of institutional arrangements in such areas as fiscal, monetary, and financial policy transparency; banking regulation and supervision; data dissemination; securities and insurance regulation; accounting, auditing, and bankruptcy; and corporate governance are vital for building a sound financial system. The case for the global policy framework and initiatives of the World Bank, IMF and other agencies to cope with the forces of global markets, call for global response. If markets are global, so must be their regulation and the institutions through which that regulation takes place. Issues of prudential bank supervision and monetary-cum-exchange-rate policies are critical not only to the initiating country but also to the rest of the world. Domestic policies cannot be isolated from the global trends and policies, and therefore, it is advantageous for countries to join hands and work together to create a sound and harmonious financial environment.
While the move for global policy framework in a world of interdependence seems logical, it would limit the independence of member countries to design regulatory framework and institutions that are responsive to their individual countries. A blueprint supplied by international organizations may no longer serve the needs of many member countries. Moreover monitoring and ensuring compliance with established standards could be a big task, and if this has to be done by member countries, the objectivity of the whole process could be threatened. Multilateral agreements would put pressures on member countries, which are at different stages of development and would pose problems in meeting set targets. For example, although the Basle Capital Accord established an 8 percent minimum (weighted) capital adequacy standard for international banks, it is evident that in SAARC countries this standard varies from one country to another. Countries are debating the successful implementation of Basle Capital Accord II. Global initiatives to change national policies and practices could be a subject of great debate and any policy formulation has to be dealt with thorough vigorous discussions and consultations with member countries to make sure that it indeed will reduce risks and will increase financial stability.
Along with the global initiatives to strengthening the financial system, there is also an increasing trend of regional and intraregional economic cooperation initiatives. Regional organizations such as European Union (EU), the Association of Southeast Asian Nations (ASEAN), the South Asian Association for Regional Cooperation (SAARC), Asia-Pacific Economic Cooperation (APEC) are some good examples. Similarly, cross-subregional cooperation agreements are also becoming popular. One good example is Bangladesh-India-Mynmar-Sri Lanka Economic Cooperation (BIMST-EC) established in 1997 with the objective to enhance regional development by promoting cooperation and optimizing complementarities between member countries in the areas of trade and investment, technology, transport and communication, energy, tourism and fisheries. As we know, at the 6th

Economic Integration in South Asia
47
BIMST-EC Ministerial Meeting, held in Thailand in February 2004, Bhutan, Mynmar, India, Nepal, Sri Lanka and Thailand signed the Framework Agreement for the BIMST-EC Free Trade Area as part of an economic cooperation to boost trade and investment in South and Southeast Asia.
Another important trend across the globe is the growing regional and intra-regional economic cooperation initiatives39, calling the need for coherent policy framework. Regional cooperation through Free Trade Agreements (FTAs) is also gaining momentum as WTO recognizes the liberalization of trade between countries without imposing barriers for others. In this context, the India-Thailand FTA was signed in October 2003 and is targeted for 2010. The Framework Agreement on Comprehensive Economic Cooperation between the ASEAN and India was signed in 2003. The Asia Cooperation Dialogue established in 2002 has opened up partnerships in monetary and financial areas for Bangladesh, India, and Pakistan with East Asia and Middle Eastern countries. Countries find regional agreement more focused and easier to comply with than multilateral agreements. It is also viewed that problem spillover such as that of the ASEAN crisis, affects the region more.
INITIATIVES TO INTEGRATE POLICY FRAMEWORK IN SAARC COUNTRIES While some countries in Asia have capitalized on the opportunities created by WTO and globalization, the SAARC region has not been able to do so. As a result, it is one of the least economically integrated regions in the world. The South Asian countries suffer from the structural problems like the increased fiscal deficits, price uncertainties, weaknesses in the export sector and the financial system, etc. Thus, to reduce the risk of financial contagion and boost the economic development in the region in this increasingly globalized and integrated financial and economic system, there is a need for greater financial cooperation and integration in the region.
Policy integration is an important agenda for all SAARC member countries. The beginning of a formal economic cooperation could be attributed to the establishment of South Asian Association for Regional Cooperation (SAARC) in 1985. SAARC is a tangible manifestation of determination to cooperate regionally, to work together towards finding solutions to common problems of member States in a spirit of friendship, trust and mutual understanding and agreements.
The operationalization of South Asian Preferential Trade Agreement (SAPTA) established in 1993 and the signing of South Asian Free Trade Area (SAFTA) in Islamabad 2004 are solid foundation in pitching the economic cooperation in the region. Positive steps have already been taken to facilitate regional trade by reducing tariffs barriers, removing quantitative restrictions, dismantling industrial licensing, liberalizing investment regime, decontrolling foreign exchange reserves and streamlining financial sector and banking regulations. Once this historic adoption of SAFTA treaty becomes operational in 2006 for 10 years period, it is believed that it will open a new vista of regional economic cooperation and integration among the SAARC countries and it will also open the door for further cooperation with other regional partners in the Asian continent.
Another important milestone set towards regional cooperation and integration is the establishment of SAARCFINANCE in 1998. This has created a forum for regional integration in the areas of macro economic policies among the member countries. The prime objectives of the SAARCFINANCE are promoting cooperation among the central banks and Finance Secretaries and Ministries in SAARC member countries, maintaining regular exchange of information and staff, establishing monetary and exchange cooperation, and forging closer ties on macroeconomic policies of the SAARC member countries. Under the aegis of SAARCFINANCE, a number of training and seminars have been held; and a large number of publications and other documents have been disseminated. These publications and training programs have facilitated the exchange of information, and have fostered close relationships among central banks at various levels.
Realizing the significance of regional integration for the development of member countries, the 24th session of the Council of Ministers recommended that SAARCFINANCE examine the concept of a South Asian Development Bank (SADB) and the establishment of South Asia Economic Union (SAEU). It is expected that the establishment of SADB would help to mobilize financial resources
39 For detail refer http://aric.adb.org

Economic Integration in South Asia
48
across the member countries and meet the investment demand for infrastructure development and other projects in the region. Similarly, SAEU, through a centrally regulated interest rate and common currency in the region, would be instrumental in reducing the transactions costs, reducing economic uncertainty caused by exchange rate fluctuations and currency volatilities. SAEU is also expected to increase trade in the region, strengthen the monetary and fiscal policies, and enhance output level in the region. No doubt, to make the SAEU operational will require discussions at various levels. Our experience from EU suggests that, in order to make SAEU effective and sustainable, member countries need to address existing constraints in the economies in the region. The SAARC member countries should also open their economies to the rest of the world, remove restrictions on investment, if any, and move towards capital account convertibility.
Asian Clearing Union (ACU), established in 1974, has been instrumental in providing a facility to settle, on a multilateral basis, payments for current international transactions among the participating countries. This has provided an avenue for promoting monetary cooperation among the participants and closer relationship among the ACU banking systems, in which the central banks of the SAARC member countries, except Maldives, along with Mynmar and Iran are members. Technical Service Agreements (TSAs) among the banks in the SAARC region are also gaining momentum. For example, Laxmi Bank in Nepal has entered into TSA with Hutton National Bank, in Sri Lanka. Everest Bank in Nepal has entered into TSA with Panjab National Bank in India. Nepal SBI Bank Ltd has made TSA with State Bank of India. Himalayan Bank Ltd of Nepal has entered into TSA with Habib Bank Limited in Pakistan. Banking institutions should join hands and together explore the possibilities of entering into TSA with other regional banking institutions outside the SAARC region to learn from the experiences of developed nations that could be valuable for strengthening the financial system.
CHALLENGES AND RECOMMENDATIONS There are enormous challenges for the banking sector in this globalized world. Some of them are as follows:
1. The shift in banking regulation from imposing capital adequacy to strengthened supervision and market discipline is a great challenge for the SAARC countries since the central banks are constrained with resources for moving from Basel Accord I to II. In a situation where many of the provisions of Basel Accord I is not fulfilled, moving to Basel Accord II is a challenging task given the shortage of skilled manpower in all countries.
2. It has to be acknowledged that banking sector in these countries suffers from poor accounting and legal systems, excessive government involvement, poor banking environment, weak corporate governance, poor banking culture, corruption, limited financial information to the general public and so on. Problems emanating from these weaknesses pose a great threat to the stability of financial system in these countries. Therefore, privatizing the state owned banks, strengthening the central banks and empowering them to enable them to control the banking sector, creating a sound legal base for the financial sector to grow and flourish and help them operate in this competitive world and developing capability of staff are some important steps to strengthen the financial systems in these countries.
3. Innovations in financial instruments, (such as ATMs, Debit Card, electronic transfer, etc,.), the blurring relationships between the financial players, cross-boarder relationships and the emergence of large financial institutions have shown the need for new regulations to ensure trust among the financial players. It is becoming hard to define the risks factor due to complexity in this globalized financial systems. All these factors are complicating the definition and operation of the financial system’s safety net. It can be argued that given the complex banking environment, the regulatory emphasis is on ensuring the market discipline.
4. Harmonization and economic cooperation is a necessity in light of ever expanding global competition, globalization and liberalization of the financial markets. It is evident that countries that have kept pace with globalization have made significant progress more than those, which have not gone along with it. Although the SAARC member countries are facing some economic problems, the collective efforts would help to solve some of these problems in the region. For
Economic Integration in South Asia
49
example, SAARC countries have embarked upon financial sector reform program with the objective of making the financial system sound and effective. These countries have lots of experiences to share with other countries. Sharing of information and success stories would provide a learning opportunity to other member countries, which could be valuable in the efforts of accelerating reform programs in these countries.
5. It is important that market structure should be developed in order to boost the financial sector in these countries. Central banks' regulatory and monetary policies for the financial sector, creation of competitive environment, and the degree of government control over the financial institutions affect the development of markets in these countries. It is therefore important that the central banks determine easy entry policy, allow the market to determine the interest rates, eliminate directed lending practices, adopt indirect monetary control measures, restructure the market to ensure that financial intermediaries have sound managerial practices, systems equipped with modern technology served by best talent people.
6. It is imperative that liberal economic and monetary policies would enhance the vulnerability and could create threats to many banks and financial institutions. This calls the need for the financial sector to take advantage from the increased globalization through improving the quality of service, ensuring flexibility and innovative behavior in their operations, adhering to the guidelines issued by central banks and establishing good corporate governance.
7. There is a need to expedite the role of SAARCFINANCE so that it could play a catalyst role in strengthening the regional financial sector cooperation. Similarly, efforts are needed to achieve the common goal of establishing SAEU and SADB and the implementation of SAFTA agreement by 2006. Despite the recent global economic slowdown, adverse weather patterns, and political instability in the region, the opportunities that is available in the areas of tourism development, hydropower and energy, irrigation and transportation, human resources should be explored through the economic cooperation to ensure higher economic growth in the region.
8. SAARC countries should try to forge economic cooperation with development partners in the region or with other regional associations. In spite of having huge natural resources in the region, the pace of development is rather slow in these countries. This could be due to slow in responding to the forces of globalization as these countries started opening the economies in the 1990s only. It is increasingly believed that harmonizing banking policies and regulatory and supervisory frameworks in the region will help to minimize the financial contagion in interdependent economies, minimize financial sector vulnerabilities and strengthen regional relations for domestic and global policy dialogue. Efforts must be geared up toward this direction by these countries.
9. Strengthening corporate governance is very important in the banking profession. This is evident from the ASEAN crisis in 1997. Disclosure of significant financial information, transparency in accounting practices, establishment and compliance with financial, accounting and auditing standards, are very important for strengthening the financial system. The implementation of Basle Accord I and II, although pose some challenges to these countries, the central banks in the region should work collectively to chalk out plans and strategies for the implementation of Basel Accord II by 2007.
CONCLUSIONS The effectiveness of intermediation role played by the banking sector ultimately contributes to the economic development of a country. No doubt, the monetary and regulatory measures adopted by central banks to regulate and supervise the banks and financial institutions determine the extent of banking sector development. The trend thus far has been towards a more open and liberal policies that help the banking sector to grow and flourish. Results visualized are increased competition, internationalization of banking business, economic cooperation and innovation in financial instruments. Banking is no longer a national phenomenon now. The banking business has crossed the national boundaries and this has created more risks and challenges to the regulatory bodies. Available literature suggests that diversity exists in the regulatory framework in the SAARC countries and this call the needs for harmonization of banking policies to manage the banking business in this globalized

Economic Integration in South Asia
50
world. The establishment of SAARC, economic cooperation initiatives through SAPTA and SAFTA, establishment of SAARCFINANCE, the concepts of SADB and SAEU are all geared towards building mutual cooperation and development in the SAARC countries. Although some efforts have been made in this direction, more efforts are needed to strengthen the banking environment in the SAARC countries. SAARC countries must develop their human resources to make them capable to implement Basel Accord II, strengthened corporate governance systems, develop regulatory framework to manage cross-boarder banking operations, forge partnerships and economic cooperation for better understanding and development and establish system for learning from the rich experience of each other.
IMPORTANT REFERENCES Chami, R, Khan, M. and Sharma, S. (2003) 'Emerging Issues in Banking Regulations' International
Monetary Fund, Working Paper, WP/03/101.
White, L (1999) the role of Financial Regulation in a World of Deregulation and Market Forces, Stern School of Business, New York University.
International Monetary Fund (2004) Financial Sector Regulation: Issues and Gaps – Background Paper, Monetary and Financial Systems Department.
World Bank (2004) ‘Financial Performance and soundness Indicators of South Asia’, Finance and Private Sector Unit, South Asia Region, The World Bank.
ADB (2004) ‘A presentation on ‘Asia’s Integration with Focus on Monetary and Financial Cooperation’ Regional Economic Monitoring Unit, Asian Development Bank, http://aric.adb.org
A paper by Richard Dale on ‘Issues in International Banking Regulation: Global Policies for Global Markets’, University of Southampton.

Economic Integration in South Asia
51
Common Currency Area: Prospects for South Asia
Nephil Matangi Maskay, Ph.D.*
here has been growing worldwide interest in higher levels of economic integration particularly with the achievement of a European economic union. It is natural that this issue has also
gravitated to South Asia and the seven member states of the South Asian Association for Regional Cooperation (SAARC) viz. Bangladesh, Bhutan, India, Maldives, Nepal, Pakistan and Sri Lanka. This regional organization, while only established in 1985, has voiced the objective for greater regional identity and targets eventually for a South Asian Economic Union (SAEU; SAARC, 2002, para 1). It will be argued that for achieving this goal, it is essential to have greater monetary cooperation – this will produce a more stable financial environment and facilitate the process of economic integration. In addition to this, earlier experiences have shown the critical importance of political commitment among members to ensure the success of this process. While the prerequisite of political commitment on a sustainable basis is presently absent in South Asia (SA), it is assumed, maybe optimistically, that in the long-term this will be achieved. This is because the benefits of higher economic integration, as will be mentioned in the course of the paper, is also being driven by the regional feeling of being marginalized in face of developments outside the region.41 Further, to achieve higher levels of regional economic integration, it is important for there also be a similar level of monetary integration. In regard to the later point, the present paper puts forward some thoughts on: the necessity of higher levels of economic integration in SA and the importance of monetary cooperation for this process; is SA presently a currency area?; the appropriate sequencing of regional monetary cooperation; and ending with an observation on the prospects of a regional common currency.
SOME STYLIZED FACTS SAARC is a fairly young organization established in 1985 by the seven member states mentioned above, whose characteristics are given in Table 1. This table shows the similarity in economic and human development but indicates the large diversity in size, population and GDP. For example of the later, India is over ten thousand times larger, three thousand times more populous and has GDP over eight hundred times greater than the smallest country in SAARC, Maldives. It is also important to point out a salient feature of SAARC, the significant presence of India, which changes the dynamics of interaction among members. This needs to be seen not only in terms of India’s physical size but also its geographical location making it ‘central’ to the region. While there is great diversity in the region, which houses over a fifth of the world’s population and has similar economic development, SA has, unfortunately, a disproportionate amount of people living in poverty (Human Development Report, 2002).
40* Deputy Director, Research Department, Nepal Rastra Bank, Baluwatar, Kathmandu, NEPAL. Remarks: I would like to thank Mr. NB Thapa for providing his valuable comments. This invited submission is based on a published article in Economic and Political Weekly. Standard disclaimers apply with the views expressed in the paper being solely those of the author’s and not necessarily the views of Nepal Rastra Bank or that of any other author associated institutions. 41 There are many examples such as in the 1997/98 SAARC Group of Eminent Persons (GEP) report.
T

Economic Integration in South Asia
52
RATIONALE FOR HAVING HIGHER LEVELS OF ECONOMIC INTEGRATION IN SA It is mainly due to this situation of economic “under” development that SAARC desires to have an integrated market to accelerate growth and thereby address the prevalent poverty in the region. It is hoped that an integrated market in SA would provide numerous microeconomic benefits such as transparency and allocative efficiency of goods, services and capital. The Association has acknowledged these benefits by targeting for an economic union in the 11th SAARC Summit held in Kathmandu (citation as above) and reiterated in the last SAARC Summit (SAARC, 2004a). This goal was given a road map with time bound targets by the summit endorsed report of the SAARC Group of Eminent Persons (SAARC, GEP, 1997/98, 20-21) for every higher levels of economic integration: a South Asia Free Trade Area, whose framework agreement had been signed on January 6, 2004 in Islamabad (SAARC, 2004b), a South Asian Customs Union by 2015 and a SAEU by 2020. These milestones on the continuum of economic integration indicate the higher levels of labor and capital mobility as well as the coordination of domestic macroeconomic and external policy.42 However, the ambitious target for a SAEU must be put into perspective given that economic union in Europe had taken almost a half-century to be achieved, with the starting point in SA is presently not comparable with that of Europe in the 1950’s. As such, the discussion focuses on one method for aiding the process of regional economic integration: monetary cooperation.
IMPORTANCE OF MONETARY COOPERATION FOR FACILITATING THIS PROCESS Monetary cooperation, i.e. coordinating monetary and exchange rate policy, among nations is necessary for producing a more stable financial environment that will facilitate economic integration. To understand this statement, consider that the domestic monetary policy affects money growth, inflation and thereby the value of goods in the country. However, in an integrating world, the value of the domestic currency (which also includes the exchange rate vis-à-vis other currencies) is important for influencing the transactions of the domestic and foreign goods. Thus, the domestic monetary policy will have an effect on both internal and external trade with the same being true for a foreign country. Given this situation, if countries were to independently derive their monetary policy, it will likely be conflicting and would lead to volatile pricing of each other’s currency (reflected in volatile exchange rate movement). Given standard assumptions, this uncertainty would reduce regional trade and investment. To lessen the likelihood of this scenario, there is scope for monetary cooperation where countries coordinate their monetary policy to limit uncertainty in the movement of the exchange rate.43
The necessity of greater levels of monetary cooperation had been acknowledged in Europe where countries had greater levels of monetary cooperation harmonized with the level of economic integration. This environment of monetary and exchange rate stability provided much of the above-mentioned benefits for Europe, further, it is expected that these benefits would be magnified in SA since there does not exist a developed currency futures market. The presence of currency futures market would allow traders to hedge against the risk of unexpected changes in the exchange rate, and provide some certainty to the value of transactions – this would certainly act as an accelerator to trade and other inter-linkages. In other words, greater monetary cooperation would be supportive of a stable financial environment, which would facilitate the process of economic integration.
ACKNOWLEDGEMENT OF ITS IMPORTANCE IN SA The necessity of greater monetary cooperation in SA had likewise been acknowledged by the SAARC GEP (1997/98, p. 21) which, in addition to SAEU, had also mentioned target for a “single monetary system, including a common currency”, although not elaborating it in great detail as done earlier for economic integration. The process for attaining this had been hinted at later on in the report by having “greater coordination of monetary and exchange rate policy” (SAARC, GEP, 1997/98, p.33). Some initial steps had been made in this direction with the establishment of SAARCFINANCE,
42 The target or economic union, such as in Europe, would entail labor and capital mobility as well as a unified economic policy. 43 There is a positive effect on international trade due to stability in exchange rates. For example, Rose (2000) has stated that the effects of a currency union on international trade are “three times as much as they would with different currencies”.

Economic Integration in South Asia
53
a network of SAARC Central Bank Governors and Finance Secretaries and its subsequent formal recognition as a SAARC body at the 11th Summit in Kathmandu. However, the vital questions are: is SA a currency area; and how should monetary cooperation be further sequenced in SA?
IS SA A CURRENCY AREA? The first question regional policy makers should ask is whether SA is a currency area? This would provide answers as to the speed for regional monetary cooperation. There are a number of methodologies which attempt to assess this,44 however a presently popular methodology is to use the criteria of patterns of shocks as it combines the “net influence of several traditional criteria” of optimum currency area criterion (Masson and Taylor, 1993); specifically if the region faces symmetric patterns of shocks they are candidates for a currency area and vice versa for asymmetric patterns of shocks. Most recently Maskay (2003) examines the SA region for the period 1980 – 2000 using this criterion through a time series model where the growth of real output was regressed upon its own lags.45 Both one- and two-period lags were used, since the data could not produce a consensus optimal lag length,46 with the residuals taken to represent the underlying disturbances. Running the above regression provides a time series of disturbances for SAARC member countries. Tables 2 and 3 below show the correlations of those disturbances with a single and double lag. In both cases, the regional patterns of shocks in general are not symmetric, suggesting that SA is presently not a candidate for a common currency.
This conclusion that SA is presently not a currency area is not surprising given the low level of regional economic integration that can be seen through the proxy of intra-SAARC trade, which is presently below 4%. To put this figure in perspective, in Europe in 1995 it had been over 50%, while in NAFTA and other regional organizations such as ASEAN and MERCOSUR, it was greater than 20%, at that time. As such, the low level of intra-SAARC trade and thereby economic integration, suggests that rudimentary monetary cooperation should only take place at the current time.
THE SEQUENCING OF REGIONAL MONETARY COOPERATION However, the above conclusion does not say anything about the future. As Frankel and Rose (1998) suggest, the criterion for a common currency is endogenous. In other words, targeting for a common currency moves one toward meeting the common currency criteria. Taking this observation into mind, Maskay (2003) suggests SA, absent a clear road map for monetary cooperation, should move monetary cooperation consistent with real integration. In this regard, SAARCFINANCE has taken some initial steps that are in line with it being a young institution, with the activities limited to regular meetings and staff exchange for information sharing, as well as workshops and seminars. Those activities are enhancing the cooperation among the SAARC monetary authorities and suggest that the process toward monetary cooperation is proceeding forward, consistent and harmonized with the low level of regional economic integration.
A CAUTIONARY NOTE IN REGARD TO THE SPEED OF MONETARY COOPERATION It must be accepted that this process for greater monetary cooperation would be a long-term goal (which may take at least half a century, as with Europe, if not more) with many pitfalls given the present turbulent situation in SA. Because of this, the process should not be rushed without necessary preparation.47 Further, there has been some discussion for having rigid time-bound targets, such as in the report by the SAARC GEP (1997/98) mentioned earlier. However, this line of discussion is inadvisable since the present situation in SA weights towards unexpected (both political and otherwise) situations, which reduces the probability of meeting targets. Missing targets would damage credibility of the policy makers that would increase the costs of monetary cooperation and adjustment.
44 For a recent review see Willett (2002) and citations therein. 45 This had been used by Bayoumi and Ostry (1997). 46 From both the Akaike and Schwarz criteria. 47 This view has been expressed on 12 December 2003 by India Prime Minister AB Vajpayee in his key note address delivered at the first Hindustan Times Leadership Initiative on the “Peace Dividend – Progress for India and South Asia.” Further, consider the proposal by Bhowmik (1998); for an alternative and cautionary note, see Maskay (1998/99).

Economic Integration in South Asia
54
As such, and in the initial stage, policy makers should have the flexibility for harmonizing monetary cooperation with the actual level of economic integration in the region, in line with the SA situation. This form of commitment would be more appealing and credible.
THE CRITICAL INGREDIENT FOR SUSTAINABLE MONETARY INTEGRATION However, the critical ingredient, as seen most saliently in Europe (Cohen and Wyploz, 1989), is for political solidarity, which, unfortunately, is not present on a sustainable basis in SA. This can largely be reflected by the turbulent relationship between the two largest members of SAARC, India and Pakistan. It would thus be unlikely and inadvisable for monetary cooperation to accelerate at this time, especially since this process may necessitate costs to member states reflected in higher unemployment or inflation. This is because a coordinated policy may require a nation to respond inconsistent with domestic stabilization; this is especially likely as the SA region faces dissimilar (i.e. asymmetric) economic disturbances (Maskay, 2001 & 2003).48 If political commitment to having monetary cooperation is absent, then monetary policy may diverge or, more dangerously, speculators may have an incentive to test the commitment; this scenario had happened with the European Exchange Rate Mechanism (ERM) in the early 1990’s where speculators tested the resolve of member countries to follow a similar policy as Germany – the end result was the breakdown of the ERM. In other words, the present regional situation is more fragmented than it was in Europe even during the early stages, thus it is essential that the pace toward monetary cooperation in SA continue its cautious a gradual forward movement.
A POSSIBLE PERSPECTIVE FROM MEMBER STATES OF SAARC The member states of SAARC, as mentioned above, are quite disparate in economic size. This may at time provide the relatively smaller member states the perception of being economically dominated – i.e. being forced to follow monetary and exchange rate policies which are not appropriate for their respective economies. In this regard, it is natural to ask, what perspectives will they have regarding a common currency? In answering this question, it should be first made clear the form of this regional common currency. Will it be the currency of one member state; or, will it be a composite currency made up the member state currencies like the Euro, as initially proposed by Bhowmick (1998) for SA; or, tied to some commodity such as gold, oil... etc. Further and on a similar note, how will monetary and exchange rate policy in this unified currency area be determined? Will it perhaps be through a system such as the European Central Bank? Etc. These are important questions which will determine the perspective of each member state, as the form and modicum of control of currency in circulation is of great import to guarantee members states sustainabile participation.
SOME RECOMMENDATIONS This does not mean that the concept for greater monetary cooperation has to be shelved in the near term. On the contrary, it may be better that it proceed forward vigilantly in two distinct lines: (1) put forward necessary preparation to minimize potential costs which arise during this process (2) increase interaction to lay the foundation for greater political commitment. The first may entail detailed studies to strengthen the institutional coordination and monitoring between members (i.e. supernational or otherwise), detailed discussion on the process (i.e. convergence criteria, target zones, bands etc.) and on financing for adjustment to external imbalances (as mentioned earlier), as well as the form which the regional common currency will take [as highlighted above]. In this regard, it should be noted that Dasgupta and Maskay (2003) feel that development of SAARCFINANCE sets forth the necessary foundation for greater monetary cooperation in SA. The second, and likely more essential component, can be achieved through more frequent interactions, at all levels of society, as reflected in the SAARC process.
CONCLUSION – PROSPECTS OF A COMMON CURRENCY IN SA
48 This highlights the need for a financing mechanism especially with higher levels of monetary cooperation. Seen Hennings (2002) for a review, in this regard.
Economic Integration in South Asia
55
By ending, it is important to emphasize how the process of monetary cooperation and economic integration should necessarily be led by greater regional unity and identity. While the economic factors may make the case for or against this process, it is certain that political solidarity will ensure its sustainability. In other words, efforts should be made to foster greater levels of regional political commitment to ensure that SA will be able to attain higher levels of economic integration and achieve its immense regional potential. Such desire had been reflected in the last SAARC Summit Declaration held in Islamabad entitled “Enhancing Political Cooperation” (SAARC, 2004, para 40 & 41). If activities in this regard are put forward sincerely, it is felt that economic cooperation will accelerate and prospects of a common currency will indeed be brighter.
REFERENCE Bayoumi, Tamim, and Jonathan D. Ostry, 1997, “Macroeconomic Shocks and Trade Flows within
Sub-Saharan Africa: Implications for Optimum Currency Arrangements,” Journal of African Economies (UK). 6, pp. 412–44.
Bhowmik, Debesh. “Monetary Cooperation of SAARC: A Plan for a Single Currency.” Indian Economic Journal. Volume No. 45 No. 1 (1998) 138 - 145.
Cohen, Daniel and Charles Wyploz, “The European Monetary Union “An Agnostic Evaluation” in Macroeconomic Policies in an Interdependent World. Edited by Ralph C. Bryan et al. Washington D. C.: International Monetary Fund (1989) 311 - 317.
Dasgupta, Amit and Nephil Matangi Maskay. “Financial Policy Cooperation in SAARC - A First Step Towards Greater Monetary Integration in South Asia; Lessons from the European Experience.” South Asia Economic Journal. 4:1 (January – June 2003) 133 - 143.
Frankel, Jeffrey A., and Andrew K. Rose, “The Endogeneity of the Optimum Currency Area Criteria.” The Economic Journal. (1998) 108, pp. 1009-25.
Henning, C. Randall. “East Asian Financial Cooperation”. Policy Analysis in International Economics 68 (Institute for International Economics). (2002).
Maskay, Nephil Matangi. “Patterns of Shocks and Regional Monetary Cooperation in South Asia”. IMF Working Paper (2003) WP/03/240.
____. “South Asian Monetary Integration in Light of the Optimum Currency Area Criteria Patterns of Shocks.” South Asia Economic Journal. 2:2 (2001) 203 – 2194.
____. “A Note on a Single Currency for SAARC.” Indian Economic Journal. 46 (1). ( July - Sept 1998/99). 118 - 210.
Masson, Paul R. and Mark P. Taylor, eds., Policy Issues in the Operation of Currency Unions”. Cabridge: Cambridge University Press. (1993).
Romano, Albert, 1970, Applied Statistics for Science and Industry (Boston: Allyn and Bacon Inc.).
Rose, Andrew. “Currency Unions: Their dramatic effect on international trade”. Economic Policy. (April 2000). 8 – 45.
SAARC. Charter. (1985).
____. “Report of the SAARC Group of Eminent Persons.” 1997/1998.
____. “Terms of Reference for SAARCFINANCE.” Available on SAARC homepage.
____. Declaration of the 11th SAARC Summit in Kathmandu. (January 6, 2002).
____. Declaration of the 12th SAARC Summit in Islamabad. (January 6, 2004).
____. “Agreement of South Asian Free Trade Area (SAFTA). (January 6, 2004).
____. SAARC home page. www.saarc-sec.org .

Economic Integration in South Asia
56
United Nations Development Programme. Human Development Report 2002: Deepening democracy in a fragmented world. New York: Oxford University Press. (2002).
Vajpayee, AB. Key note address at the Hindustan Times Leadership Initiative on the “Peace Dividend – Progress for India and South Asia.” 12 December 2003.
Willett, Thomas D. “The OCA Approach to Exchange Rate Regimes: A Perspective on Recent Developments” in The Dollarization Debate, ed. By James Dean, Dominick Salvatore and Thomas Willett (Oxford: Oxford University Press). 2002.
World Almanac and Book of Facts. NY: Press Pub. Co. 1997
World Bank. World Development Indicators 2002. Washington: 2002.

Economic Integration in South Asia
57
Table 1
Some of Characteristics of SAARC Member Countries are Presented Below
Area (sq. mile) GDP (USD mill.)
Population (mil.)
GDP per capita (PPP USD) 2000
HDI Value
Bangladesh 56,977 $47,106 140.37 $1,602 0.478
Bhutan 18,150 $482* 2.09* $1,412 0.494
India 1,222,243 $456,970 1,017.54 $2,358 0.577
Maldives 115 $561* 0.28 $4,485 0.743
Nepal 53,827 $5,497 23.59 $1,327 0.490
Pakistan 307,374 $61,638 144.97 $1,928 0.499
Sri Lanka 25,332 $6,305 19.10 $3,530 0.741
SAARC 1,684,014 $578,559 1,347.94 *** ***
Source: For the first column: The World Almanac and Books of Facts 1998; for the second column GDP at producer prices with the average exchange rate applied taken from the IMF from World Development Indicators 2002; “*” indicates author’s own calculations from International Financial Statistics using GDP – 99b, and average exchange rate vis-à-vis the USD - rf; for the third column from IFS statistic for population – 99z from IFS Yearbook 2002; the values for GDP per capita for purchasing power parity in 2000 and Human Development Index (HDI) are taken from Human Development Report 2002.
Table 2
Correlation of Disturbances (single lag)
BAN BHU MAL IND NEP PAK SRI
BAN 1.00
BHU 0.09 1.00
MAL -0.43 0.24 1.00
IND -0.87 0.04 0.31 1.00
NEP -0.29 -0.39 -0.17 -0.13 1.00
PAK -0.34 -0.41 -0.54 0.56 -0.02 1.00
SRI 0.49 0.37 -0.19 -0.69 0.38 -0.54 1.00 Note: Output growth is taken as the log change in real GDP (IFS code = f99b.p); highlighted portions are those values statistically significant at the 5% level of confidence.49
49 The formula Z N r r= − + − − +
12
3 1 1 1 1{ln[( )( ) / ( )( ]}ρ ρ is used to test the significance of correlations
(Romano 1970: 156-160), with H0 0:ρ = versus H A:ρ ≠ 0 , using α = 0 05 0 01. , . . The rejection region is
Z N r r= − + − >| {ln[( ) / ( )]}| . , .12
3 1 1 196 2 58 .

Economic Integration in South Asia
58
Table 3 Correlation of Disturbances (double lag)
BAN BHU IND MAL NEP PAK SRI
BAN 1.00
BHU 0.03 1.00
IND -0.17 0.03 1.00
MAL 0.00 0.06 0.00 1.00
NEP -0.01 -0.21 0.03 -0.39 1.00
PAK -0.34 -0.06 0.19 0.21 -0.11 1.00
SRI 0.57 -0.48 -0.19 0.00 -0.04 -0.56 1.00 Note: As mentioned above.

Economic Integration in South Asia
59
Prospects and Endeavours of Intra-Regional Trade and
Investment in South Asia
Dr. Bamadev Sigdel* and Mr. Hem Pd. Neupane**
INTRODUCTION conomic regionalism in the developed world manifested through the formation of new economic groupings like NAFTA and APEC and depending of the existing arrangements, like EU's single European market. These new regional arrangements are indicative of the trend towards the
division of the world into three economic centers of power: OECD countries; North America; and East Asia.50 Normally, the formation of regional groupings in the shape of an economic block is the manifestation of regional cooperation is a loose construction which embraces any or all coordination, harmonization and integration process. It denotes a willingness on the part of countries to work together in achieving regional economic interests that will result in enhancing national economic interests and welfare.
Developed countries of all hues-be they at the America or Europe, have been and are organizing themselves into new trade blocks, along with their conventional multilateral arrangements. The United States of America has growing interests in NAFTA - The Free Trade Area of the Americas (FTAA) mooted after Miami Summit of America. In heading for affirmative action after 2010; APEC or Asia Pacific Economic Cooperation is going to exploit the Asia rim. European Union (EU) has acquired new strength after Euro was officially launched on January 1, 1999.51 The enlarged European Community and ASEAN are moving ahead for recognition and responsibilities. Hence, regionalism has come of age. Economist Nicholas Stern opines that globalization had positive impact on the growth of the majority of the developing countries in 1990's. He Writes, "so in 1990s, for the first time, the majority of the population of the developing world was living in the economies that were growing distinctly faster than the member economies of the Organization for Economic Cooperation and Development (OECD) - that is, they were catching up. One of the distinctive features of these developing economies that they did well and there was their greater participation in trade and investment themselves." 52
South Asia is one of the poor regions and the most overpopulated one (1,401 million) in the world. It is estimated that about 43 percent of the region's population live below poverty line.4 India alone represents 80 percent of the region's population and also its GDP. The growth of South Asia in 2002 remained at 4.3 percent with her per capita income growth 2.6 percent.54 Similarly, per capita income of South Asia remained at US$ 2390 (PPP), comparatively low in comparison to East Asia, i.e., US$ 4,160 in 2002. More than one sixth (nearly 17.5 percent) of world's labor force is in South Asia. Economic growth in most South Asian countries accelerated in 1980s, and targeted programmes for the poor were adopted, the percentage of population in absolute poverty has been declining in recent years in almost all the South Asian countries. The economic structure of the region is mixed,
* Dr. Sigdel is Deputy Director in Research Department. ** Mr. Neupane is Assistant Director in Research Department. 50 Rao, P.V.; Globalization and Regional Cooperation: South Asian Experience, in B.C. Upreti (edt.) "SAARC: Dynamics of Economic Cooperation", Kalinga Publication, New Delhi, 2000, P. 32. 51 The Hindu, February 23, 2002. 52 Stren, Nicholas, A Strategy for Development, The World Bank, Washington D.C., 2002, P. 71. 4 Hussain, A.; Poverty, Growth and Governance in South Asia, in V.A. Pai Panandiker (edt.) "Problems of Governance in South Asia", Konark Publishing House, New Delhi, 2002, P. 366. 54 See, WB, World Development Report - 2004, The World Bank, Washington D.C., USA, 2003, Table 1, P. 253.
E

Economic Integration in South Asia
60
with predominance of agriculture. In Nepal and Bhutan, agriculture continues to be dominant, contributing nearly about 40 percent of GDP and providing employment opportunities to a majority of the workforce.
ECONOMIC INTEGRATION: TRADE AND INVESTMENT LIBERALIZATION EFFORTS IN SOUTH ASIA Asian developing countries made a number of attempts at regional economic cooperation in the 1970s at the initiative of ESCAP. These included the Bangkok agreement in 1975, which covered the exchange of tariff concessions between five members, namely, Bangladesh, India, the Lao People's Democratic Republic, the Republic of Korea and Sri Lanka.55 The Asian Clearing Union (ACU) with seven members in the region; Bangladesh, India, the Islamic Republic of Iran, Myanmar, Nepal, Pakistan and Sri Lanka, came into force in 1974. It is generally agreed, however, that those early experiences have not been very successful. Infact, Bangkok Agreement suffered from its limited membership as well as products covered, preference margins not being deep enough and its scope not extending to non-tariff barriers.56 Over the past decades, all South Asian countries have undertaken substantial trade liberalization as a essential component of structural adjustment programmes undertaken at the behest of the Britton Woods Institutions in the early 1980s.57 For some countries, the pace of liberalization was slow and halting in the early 1980s, but gathered momentum in the 1990s. Currently, the peak tariffs in most South Asian countries have been brought around 20 percent (excluding agriculture) from the very high levels exceeding 100 percent in the seventies and eighties.
Successful experiences with regional economic integration in the industrialized countries since the mid-1980s in Europe and North America have also prompted South-East and South Asian countries to adopt economic integration strategies. The historic 1992 decision to establish an Asian Free Trade Area (AFTA) is by far the best reflection of the determination on the part of the ASEAN6 (i.e., Brunei, Indonesia, Malaysia, the Philippines, Singapore and Thailand) to deepen their level of economic cooperation.58 AFTA's vision is to integrate the market of ASEAN individual members by reducing intra-ASEAN tariffs to 0-5 percent and eliminating quantitative restrictions and other non-tariff barriers among member countries themselves.
The SAARC countries discussed trade cooperation in the second summit in Banglore in 1986 was an important agenda. But in the Islamabad summit, a step was taken when the study on SAARC trade, manufactures and services was commissioned in 1988.59 This study recommended for inclusion of trade and other economic issues such as plan to meet basic needs, to end discrimination against women and to break all psychological barriers among the people of the region in SAARC agenda. Actually speaking, need for expanding intra-regional trade was realized only during the sixth SAARC summit held in Colombo in 1991, when the Sri-Lankan government called for establishing SAPTA.60 After ratification the Agreement by the respective countries, the SAARC Preferential Trading Arrangement (SAPTA) came into force formally in 1995, the year in which economic cooperation through multilateral agreements also got strengthened with the advent of World Trade Organization (WTO).61 After the inducement of SAPTA in 1995, it initiated trade liberalization, by reducing tariff and non-tariff barriers, but the output has been extremely small-intra-regional trade which still accounts for less
55 Kumar, Nagesh, Foreign Direct Investment, Regional Economic Integration and Efficiency - Seeking Industrial Restructuring in Asia: Trends, Pattern and Prospects, in UN, "Industrial and Technical Development News for Asia and Pacific", United Nations (ESCAP), Thailand, 2002, P. 21. 56 Ibid. 57 Mukherji, Indra Nath, Trade Liberalization and Human Security in South Asia, A Paper Presented in Regional Conferences on Comprehensive Security in South Asia, Institute of Foreign Affairs, Kathmandu, Nov. 19-20, 2004. 58 Tongzon, Jose, E.; The Challanges of Regional Economic Integration: The Vietnamese Perspective, in "The Developing Economics", Institute of Developing Economics, Vol. XXXVII-2, Tokyo, June 1999, P. 139. 59 Gupta, Ivy, Growth Structure and Problems in Trade Among SAARC Countries, in B.C. Upreti (edt.) "SAARC: Members of Regional Cooperation in South Asia, Areas and Dymensions Cooperation", Kalinga Publication, New Delhi, 2000, P. 67. 60 Shrestha, Shyam, Preferential Trading Arrangement in South Asia (Nepalese Perspective), Vidyarthi Pustak Bhandar, Kathmandu, 1999, P. 23. 61 Gupta, Anshuman, SAARC: SAPTA to SAFTA, Shipra Publication, New Delhi, 2002, P. 11.

Economic Integration in South Asia
61
than 5 percent.62 SAPTA is motivated by the commitment to promote regional cooperation for the benefit of the people of SAARC nations, in a spirit of mutual accommodation, with full respect for the principles of sovereign equality, independence and territorial integrity of all SAARC member states.
The principal objective of SAPTA was to expand the scope of tariff concessions and thereby promote regional trade. Following three negotiating rounds held during 1990s, the proportions of traded and tradable commodities covered by regional tariff concession was extremely low: for all seven countries, on average only 8.4 percent of 5300 tariff lines in the case of imports from India, Pakistan and Sri Lanka and 6.2 percent and average in the case of imports from the four LDCs (Bangladesh, Nepal, Maldives and Bhutan).63 It is generally agreed that SAPTA has had a minimal impact on intra-regional trade. The reason for the low level of intra-regional trade was not the absence of trade preferences but the absence of liberal trade policies in general.64 Most of the observed increases intra-regional trade can be attributed to the unilateral liberalization effects of the individual SAARC countries and during the late 1980s up to about 1992, the appreciations of the currencies of the later peripheral countries vis-à-vis the Indian Rupees. Furthermore, a significant portion of the increases came from increased India's exports to Bangladesh and Sri Lanka which had little or nothing to do with SAFTA concessions. In a recent initiative, SAARC member countries agreed that SAPTA would begin the transformation into a South Asian Free Trade Area (SAFTA) by the beginning of 2006, with full implementation completed between 2009 and 2013.65 The initiatives for SAPTA and SAFTA are a departure from previous accords that had narrower mandates to increase regional trade and protracted negotiations on the removal of barriers to trade.
The share of South Asia in world trade in 1990s has remained to the level of one percent. However, the market share of South Asia in world trade increased remarkably in the late eighties and early 1990s.66 Since the beginning of 1990's intra-regional trade expanded gradually and demonstrated upward trend for every country of the region. The region share less than 1.5 percent in the World GDP67 and countries having comparative advantage in similar products. It is expected that with the meaningful enactment of SAFTA along with trade policy reforms in South Asian countries, intra-regional trade would increase significantly in the years to come.
Trade and Investment Policy Reforms: The Case of Selected South Asian Nations Like most developing countries, the South Asian countries also pursued a development strategy based on import substituting industrialization in the early years of their independence. As a part of this development policy, a protectionist trade policy regime and selective foreign direct investment policy had been evolved to encourage and nurture domestic industries. However, in 1980s the South Asian countries started rethinking their development strategy and a process of policy reforms was initiated in different countries.68 In 1990s this economic reform process was expedited and made more comprehensive. The decade of 1990s thus proved to be a turning point for a number of South Asian countries. It was marked by the adoption of economic reforms as a part of which a significant emphasis was laid on the process of liberalization particularly in the trade and investment regimes to intensify their integration with the world economy.
BANGLADESH: In Bangladesh, a number of steps towards liberalization have taken in the recent past. Prior to 1986, there were 24 tariff slabs, which have been rationalized to 12 by 1993/94; 6 by 1996/97; and 4 by 1999/00.69 Tariff reform was accelerated significantly in FY 1992/93 by
62 Pyakuryal, Bishwambher, SAARC and Emerging Issues in Trade, in "New Business Age", Kathmandu, January 2002, P. 47. 63 WB, Trade Policies in South Asia: An Overview, World Bank, Washington D.C., Vol. II, September 2004, P. 133. 64 Panagaria, Arvind, South Asia: Does Preferential Trade Liberalization Make Sense?, Centre for International Economics, University of Maryland, USA, 2003, P. 4. 65 Pitigala, Nihal, What Does Regional Trade in South Asia Reveal about Future Trade Integration?, World Bank Policy Research Working Paper 3497, Washington D.C., February 2005, pp. 1-2. 66 Mehta, Rajesh, South Asian Integration in the World Economy, in K.V. Keshavan (edts.) "Japan and South Asia: Security and Economic Perspective", Lancer Books, New Delhi, 2000, pp. 426-427. 67 Pitigala, Nihal, Op.cit. 68 RIS, South Asian Development and Cooperation Report - 2002, RIS, New Delhi, 2002, P. 49. 69 Metha, Rajesh, Op.cit.; P. 427.
Economic Integration in South Asia
62
compression of custom duty rates into a range of 7.5-100 percent for most of the products, accompanied by the removal of many end-users defined distinctions. To enhance export competitiveness, Bangladesh shifted from a fixed exchange rate regime to a managed system of floating exchange rate in 1979. In 1996/97, Bangladesh government accepted the conditions of Article VIII of IMF by making Taka fully convertible for current account transaction. The 2002/03 budget reduced the basic maximum custom duty and abolished one of the para-tariffs, and there was further reduction in the basic maximum custom duty in 2003/04 budget. In addition to trade liberalization, restrictions on movement of foreign capital were removed. FDI flows were also encouraged by setting up special economic zones. In 1991, FDI policy was revised and removed the limit on foreign equity participation and obligation for joint-venture.
BHUTAN: About 80 percent of Bhutan's merchandise trade is with India, approximately three quarter of its imports and 95 percent of its exports. In addition, its hydro-electricity exports, which are the principal driving force in its economy, are entirely to India. For a tiny economy, some of Bhutan's tariffs are rather high and protection is further increased by a sales tax which is applied to imports but not to the production of local import substitution firms.70 Prior, these arrangements appear to be economically inefficient in some ways, by diverting imports from third countries to higher cost suppliers in India, and by providing excess protection to local import substitution production. Bhutan's monetary authority is taking step to increase the flexibility of financial institutions in setting their interest rates to promote competition in the financial sector and to encourage private investment. Bhutan has decided to join WTO and hope to complete the process of accession by 2007.
INDIA: The trend towards liberal trade policy in India was started in mid-eighties but found full expression during the years of 1991/92 onwards. In the pre-reform period, India's trade policy was highly complex and cumbersome. There were many categories of importers, different types of import licenses, and alternative ways of importing.71 Infact, almost all the India's imports (more than 95 percent) was subject to one or more types of restrictions in the pre-reform period. The reality of period from July 1991 to December 1994 was that economic reforms were at work in India. The transition from "socialist pattern economy" to "market economy" and integrating Indian economy with the global market were practiced at through "economic reforms".72 Successive rounds of tariff reduction brought maximum tariff levels from over 300 percent in 1990/91 to 65 percent by 1995/96.73 These facilities provided India an increased exposure to foreign competition for her industry.74
The import-licensing system was abolished, with the exception of import of most consumer items. The cash compensatory scheme for exports, which had been a major subsidy item on the federal budget, was withdrawn as an effort to both restore fiscal discipline and promote a greater degree of allocative efficiency. The 1997/98 Budget reduced the maximum tariff to 40 percent and import-weighted average tariff to 20.3 percent. It also eliminated licensing requirements for about a third of consumer goods.75 In the early 1998, RBI decided to allow foreign institutional investors to bring funds that could later be repatriated, while Indian companies were permitted to borrow on international capital market with fewer RBI's restriction.76
Several measures were announced during 1990s as a part of the on-going reform process in the external sector of India. The focus of Indian Government's EXIM policy announced on the 31st March 2001 was on formulating a medium-term export strategy to boost exports so as to achieve 1 percent share in global trade.77 This policy removed quantitative restrictions on 715 items. Out of these, 342 were textile products, 147 were agricultural products including alcoholic beverages and 226
70 WB, Trade Policies in South Asia: An Overview, The World Bank, Washington D.C.; September 7, 2004, P. 6. 71 Mehta, Rajesh, Op.cit., P. 428. 72 Gedam, Ratnakar, Economic Reform in India: Experience and Lessons, Deep and Deep Publications, New Delhi, 1996, P. 57. 73 Rob, Ienkins, Democratic Policies and Economic Reforms in India, Cambridge University Press, United Kingdom, 1999, P. 16. 74 Panandiker, V.A. Rai, Fifty Years of Sworaj, Centre for Policy Research, Konark Publishing House, New Delhi, 1998, P. 14. 75 T.G. Srinivasan (edts.), South Asia's Integration into the World Economy, The World Bank, Washington D.C., USA, 1997, pp. 8-9. 76 Economist Intellegence Unit, Country Forecast - India, 1st Quarter, London, 1998. 77 SBI, Export-Import Policy 2001/02, Reserve Bank of India, in "Monthly Review", Vol. XXXX, No. 5, May 2001, P. 214.

Economic Integration in South Asia
63
were other manufactured products including automobiles. The EXIM policy completed the process of QRs on BOP grounds by dismantling restrictions on the remaining 715 items.78
As a part of her commitments under the WTO Agreements, India has bound her tariff rates to lower levels than those prevailing at the time when the Agreement (1994) was signed for a large number of commodities. Although India's tradable economy is still very heavily protected, it is also considerably more diversified, flexible and competitive than it was 12 or 13 years ago.79 India made the foreign investment regime much more liberal by allowing foreign investment in virtually every sector of the economy. A high level Foreign Investment Promotion Board (FIPB) was setup for speedy or clearances of FDI proposals. FIPB is empowered to approve up to 100 percent foreign ownership. India has already initiated second generation reforms, as her implementation proceeds, acceleration in economic growth can be expected in the years to come.
NEPAL: The significant measures introduced so far for diversifying Nepalese exports by the Exporter's Exchange Entitlement Scheme (EEES) and the Dual Exchange Rate System (DRS).80 The EEE scheme also known as the Bonus Scheme, introduced in 1961 and operating till 1978 was the first principal measure directed towards promoting and diversifying Nepalese exports to overseas countries. With the objective to diversify further Nepal's export trade and restrict luxury goods import from overseas, HMG induced Dual Exchange Rate System in 1978. Similarly, Single Exchange Rate (SER) system and The Basket System were introduced in 1981 and 1986 so as to make Nepalese exports more competitive and reliable. The Trade Policy of 1982 was induced with the objective to generate employment opportunities by enhancing production, productivity, and qualitative standards of exportable goods; to establish a wide international market for indigeneous products; to expand the scope of Nepalese foreign trade and to build up contracts with the international market for promoting modern technology, skill and management capabilities. In November 1985, the Nepalese currency was devaluated by 14.7 percent against both the US dollar and the Indian Rupees. Consequently, the exchange rate of IC Rs. 100 soared from NC Rs. 145 to Rs. 170.81
With the introduction of Structural Adjustment Programme (SAP) in 1985/86, several changes were made, including a massive tariff reduction from 450 percent to 110 percent.82 In 1990, His Majesty's Government gave special priority to the development of export oriented industries by making specific arrangements for setting up an Export Processing Zone (EPZ) and also by providing maximum incentives and facilities for export in New Industrial Policy (1991).83 All round economic liberalization process took momentum after the elected government installed in 1991. The reform encompassed all sectors - trade, industry, service, foreign investment, exchange rate and fiscal and monetary policy.84 The changes made aimed at a shift in the focus of development strategy, from inward import-substituting industrialization (ISI) to an export-led growth so as to benefit from the globalization process. The trade weighted average rate of protection declined from about 111 percent in 1989 to 16.0 percent in 1992. In a similar manner, number of slabs subject to protection fell from more than 100 percent in the 1980s to 5 percent in 1996. Additional measures initiated to promote international trade include the introduction of a bonded warehouse, duty-drawback scheme and initiation of the dry-port facilities.
In Nepal, emphasis to foreign investment was given since the Sixth Plan (1980-85). Separate rules and regulation and some lucrative incentives have been provided to the foreign investors especially since 1981 and this was done to enhance foreign investment in Nepal.85 The Foreign
78 The Economic Times, New Delhi, February 2002. 79 WB, Trade Policies in South Asia, Op.cit.; P. 8. 80 Poudyal, S.R.; Foreign Trade, Aid and Development in Nepal, Common Wealth Publisher, New Delhi, 1988, P. 109. 81 Pant, Bhubanesh, Trade and Development: Nepal's Experience, Oxford and IBM Publishing Company, New Delhi, 1994, P. 98. 82 IIDS, Impact of Economic Liberalization in Nepal, Institute for Integrated Development Studies, Kathmandu, 1996, P. 14. 83 Dahal, Madan K.; Future of Nepal Economy, Nepal Foundation for Advanced Studies, Kathmandu, 1993, P. 123. 84 Acharya, Meena and Khatiwada, Yuba Raj (edts.), Structural Adjustment Policies and Poverty Eradication, Institute for Integrated Development Studies, Kathmandu, 2003, P. 78. 85 K.C., Phatta Bahadur, Foreign Private Investment in Nepal and South Asia, in Anand P. Shrestha (edts.) "Issues of Governance in Nepal", NEFAS/FES, Kathmandu, 2001, P. 43.

Economic Integration in South Asia
64
Investment and Technology Act (FITA) was promulgated in 1981 and it accorded various facilities and provisions for foreign investors. For example, industries with 25 percent to 50 percent value added in their productions were granted full exemption from income tax for the five years.86 Furthermore, facilities of convertible foreign currencies were also provided for joint-venture industries under FITA for the importation of necessary machineries, equipment and tools, spare parts and components, raw materials, technical consultancy and assistance and so forth. The Foreign Investment and Technology Act-1981 was replaced by the foreign Investment and Technology Transfer Act-1992, with amendments made in 1993 and 1996. The basic tenet of this act were the provision of 100 percent equity investment; full remittances of profits, dividends and repatriations of capital; facilities and concessive to foreign investors through 'one window system'; tax exemptions, etc. In July 2000, HMG formed a Fast Tract Committee (FTC) with a view to make quick decisions on foreign investment related projects.87 Any foreign investors could send a proposal relating foreign investment (joint-venture) directly to the FTC and decisions would be made in less than two weeks in consultation with concerned ministries regarding the building, operating and transfer (BOT) of the project. PAKISTAN: Pakistan has also undertaken a number of steps towards trade policy reforms. The maximum tariff reduced from 225 in 1988 to 45 percent in 1998.88 A new, comprehensive trade liberalization programme commenced in 1997 and continued until 2002/03, when the general maximum custom duty was reduced to 25 percent.89 In 1995, the import-weighted average tariff rate was 25.3 percent and simple average MFN tariff rate was 58.2 percent. There are large number of exceptions and concessions which were being phased out over time. In addition, there are efforts to remove the anti-export bias in Pakistan. Export duties on raw cotton and cotton yarn have been removed, and certain other facilities are provided to exporters.90 These include income tax rebates graduated with the degree of processing, drawback of custom duties, sales taxes, surcharges on imported inputs, and excise duties. Pakistani Government has completed a comprehensive liberalization of the trade and other policies that affects its agriculture sector. This contrasts with India, Bangladesh and Sri Lanka, where there are strong protectionist's elements in agricultural policies. Presently, IMF is concerned with the ever-growing flow of remittances and lower export growth of Pakistan. It has suggested to Pakistani Government that "as high dependence on remittances is creating vulnerabilities to external shocks and more efforts should be put into strengthening the export base and attracting investment".91 Pakistan has been engaged in far-reaching in financial sector reform too. Considerable progress has been made, particularly with respect to reform of banking sector.92 SRI LANKA: Sri Lanka has the experience of open economy for more than two decades. In Sri Lanka, two phases of liberalization are noticeable.93 The first phase of reforms, carried out during 1977-89, replaced QRs on tradable with tariff, revised the tariff structure thereafter, and provided incentives for non-traditional exports. The second phase of reforms during the 1990s included further tariff cuts and simplification, removal of exchange controls on current account transactions and flexible exchange rates. In 1997, the maximum tariff in Sri Lanka was 35 percent on consumer goods, the tariff rate for intermediate goods was 20 percent and the tariff rate for raw materials and capital goods was 10 percent.94 Trade and payments system were also further liberalized, and a concerted
86 Sigdel, Bama Dev, Managing and Monitoring Direct and Portfolio Investment in Nepal, in Sushil Ram Mathema (edt.) "Managing and Monitoring Direct and Portfolio Investment Flows: A Comparative Study of SEACEN Countries", The SEACEN Centre, Kuala Lumpur, 2004, P. 179. 87 Ibid; P. 183. 88 Mehta, Rajesh, Op.cit.; P. 429. 89 WB, Trade Policies in South Asia, Op.cit.; P. 5. 90 RIS, Op.cit.; P. 54. 91 IMF, Statement of Mr. Kitahara and Ms. Sekine on Pakistan (Preliminary), International Monetary Fund, GRAY/03/1888, Washington D.C.; October 27, 2003, P. 2. 92 IMF, Pakistan–Sixth and Seventh Reviews Under the Three-Year Arrangement Under Poverty Reduction and Growth Facilities, International Monetary Fund, IBS/031/40, Washington D.C., 2003, P. 55. 93 RIS, Op.cit., P. 55. 94 Mehta, Rajesh, Op.cit.; P. 429.

Economic Integration in South Asia
65
efforts to increase private capital flows were introduced in 1991.95 With the full liberalization of current transactions in 1993, Sri Lanka accepted obligations under Article VIII of the IMF in 1994, while gradually relaxing the capital account transactions. Sri Lanka also abandoned its managed floating exchange rate regime and adopted a full float in 2001. Sri Lanks's early trade liberalization and the appreciation of its currency in relation to the Indian Rupees led to a large and growing trade deficit with India, and in the hope of correcting this deficit, Sri Lanka entered into a free trade agreement with India which became effective from March 2000.96 There was further liberalization of foreign investment by abolishing various restrictions on ownership of joint-venture projects, extension of free trade zone status to export oriented foreign ventures and the setting up of the Board of Investment. Foreign nationals who have operated small businesses in Sri Lanka are also permitted to transfer the capital they originally brought into the country, together with a reasonable amount of savings, subject to certain limits. Intra-Regional Trade among South Asian Nations Intra-regional resources and trade can provide South Asian economies with the necessary dynamics to achieve higher growth. The important internal dynamics for growth such as market for goods, capital, technology, managerial skills and other resources are available within the region. There has been a vast change in the trade policies among the SAARC member countries in the recent past. Trade policies have been gradually liberalized and trade between the SAARC member countries is going to be almost free from tariff and non-tariff barriers, customs, etc. after full fledge implementation SAFTA. Forward and backward linkages achieved through the intensification of intra-regional trade would lead a more efficient allocation of resources resulting high productivity, greater demand for goods and services, higher level of employment and economic growth in each of the South Asian nations. Such trade cooperation could enable these countries to present themselves as an unified force in various international economic forums for trade, investment and other negotiation. Such process would enable South Asian nations to dictate the terms in international market for number of processed primary products of which they are still the largest suppliers. It has been argued that trading ties among SAARC member countries has been characterized as "natural trading partners". The SAARC member countries, Bhutan and Nepal have closer bilateral economic cooperation with India in SAARC region due to their socio-cultural and geographical proximities. India, Bangladesh and Sri Lanka have also to some extent closer bilateral economic cooperation to each other due to this reason. Geographically, Maldives, India and Sri Lanka are also closer to each other. SAARC economic giants India and Pakistan are closer geographically but political tension and rivalries has hindered for the growth of bilateral economic cooperation. SAARC member countries as Bhutan and Nepal's total intra-regional trade to the total South Asian intra-regional trade was the highest, i.e., 92.5 percent and 23.7 percent respectively in 2003. Similarly, Maldives and Sri Lanka's total intra-regional trade to the total South Asian intra-regional trade was 22.3 percent and 12.9 percent respectively in 2003. The other SAARC member countries Bangladesh, India and Pakistan were at the lower profile because these countries' intra-regional trade to the total South Asian intra-regional trade remained at 11.6 percent, 2.8 percent and 2.6 percent respectively in 2003 (Table No. 1). When we visualize the intra-regional trade figure of 1981 and 2003, it reveals that the total intra-regional trade figure has been at an increasing trend and gradually taking shape as SAARC member countries are gradually moving towards economic liberalization process through various trade and investment reform initiatives. It could be expected that the meaningful implementation of SAFTA would further increase the volume of intra-SAARC trade.
95 Amarsekara, Chandranath, Managing and Monitoring Direct and Portfolio Investment Flows: The Case of Sri Lanka, Sushil Ram Mathema (edt.) "Managing and Monitoring Direct and Portfolio Investment Flows: A Comparative Study of the SEACEN Countries", The SEACEN Centre, Kuala Lumpur, 2004, P. 262. 96 WB, Trade Policies in South Asia, Op.cit.; P. 5.

Economic Integration in South Asia
66
Table 1
Officially Recorded Intra-regional Trade as Percentage Share to Total Trade (1981-2003)
(In Percent)
Country Intra-regional exports Intra-regional Imports Total Trade
Year 1981 1990 1996 2001 2003 1981 1990 1996 2001 2003 1981 1990 1996 2001 2003
Bangladesh 7.9 3.1 1.8 1.9 2.1 4.7 7 17.1 15.6 16.9 5.4 5.8 12.0 10.6 11.6
Bhutan na 9.6 98.2 98.6 99.1 na 10.9 64.0 78.6 88.9 na 9.7 79.0 85.7 92.5
India 2.9 2.7 5.0 4.7 4.9 1.3 0.4 0.5 1.0 1.1 1.8 1.4 2.6 2.7 2.8
Maldives 22.3 13.8 18.6 22.3 13.9 6 7.4 20.1 23.7 24.3 9.4 9.2 19.8 23.5 22.3
Nepal 63.8 7.7 19.2 33.1 50.6 na 13.4 32.7 12.1 13.6 47.4 11.9 29.8 19.1 23.7
Pakistan 5.5 4 2.6 2.9 2.9 1.9 1.6 2.4 2.9 2.4 3.1 2.7 2.5 2.9 2.6
Sri Lanka 8.8 3.7 2.7 3.3 6.8 5.2 7 11.9 11.9 17.6 6.5 5.6 7.9 8.1 12.9
Total 4.8 3.1 4.5 4.6 5.0 2.4 2 4.5 4.2 4.3 3.2 2.4 4.5 4.4 4.6 Source: Direction of International Trade, IMF, Various Issues.

Economic Integration in South Asia
67
The mutual trade quantum of SAARC countries was almost stagnant during the eighties. The intra-regional total trade of SAARC countries has found to be taken shape particularly after 1990, i.e., inducement of SAPTA and trade liberalization measures adopted by SAARC member countries. For example, the total intra-regional export trade was US$ 640 million in 1980 which went up to US$ 861 million in 1990. In 1996, the total intra-regional export trade volume remained at US$ 2242 million. It further promisingly increased in 2003 and remained at US$ 4054 million. In 1980, the total intra-regional export trade percentage to their total export was 4.9 increased marginally to 5.0 in 2003. Despite of such increment in the trade volume, it did not contribute that much for the growth of intra-regional export (see, Table No. 2). The total intra-regional import of these countries' trade was US$ 603 million in 1980 which increased to US$ 729 million in 1990. By 1990, the volume of intra-regional import trade remained at increasing trend. In 1990, the total intra-regional import trade volume was US$ 729 million which rose up to US$ 2865 million in 1996. By 2003, the total intra-regional import trade figure went up to US$ 4397 million. In 1980, the total intra-regional import trade percentage to their total import was 2.4 which also doubled and remained to 4.6 percent in 2003 (see, Table No. 2). External Sector Reform of SAARC countries, commitment on enactment of SAPTA has were attributable for increasing promisingly both import and export volume of intra-regional trade in the SAARC region.

Economic Integration in South Asia
68
Table 2
Total Intra-Regional Exports and Imports of SAARC Countries and its Share to Exports -Imports with World (1980-2003)
(In US$ Million)
Country % of Total Export to World % of Total Import from World
Year 1980 1985 1990 1996 2001 2003 1980 1985 1990 1996 2001 2003
Bangladesh 68.5 77.4 60.0 60.89 92.09 109.20 96.7 87.8 257.0 1129.74 1299.11 1608.05 (8.7) (7.7) (3.5) (1.8) (1.9) (2.1) (3.7) (3.5) (7.0) (12.0) (10.6) (11.6) Bhutan 97.10 106.65 116.88 80.61 152.37 193.37 (98.2) (98.6) (99.1) (79.0) (85.7) (92.5) India 307 22 487 1650.00 2051.00 2785.00 141.0 125.0 97.0 198.00 504.00 754.00 (3.6) (2.2) (2.7) (5.0) (4.7) (4.9) (0.9) (0.7) (0.4) (2.6) (2.7) (2.8) Maldives 2.1 4.1 7 10.99 16.99 15.69 4.7 6.5 18.0 60.60 93.16 114.18 (26.2) (17.0) (13.4) (18.6) (22.3) (13.9) (23.0) (9.1) (13.0) (19.8) (23.5) (22.3) Nepal 23.9 45.8 15.0 74.10 243.80 335.18 104.9 96.7 52.0 457.00 178.53 238.05 (37.8) (33.6) (6.9) (19.2) (33.1) (50.6) (47.8) (33.0) (11.5) (29.8) (19.1) (23.7) Pakistan 165.7 145.4 223 240.00 264.00 342.00 124.5 95.1 121.0 293.00 295.00 314.00 (6.3) (5.3) (4.0) (2.6) (2.9) (2.9) (2.3) (1.6) (1.6) (2.5) (2.9) (2.6) Sri Lanka 73.2 53.3 59 109.00 157.72 350.07 131.3 117.9 184.0 647.00 712.47 1175.43 (7.0) (4.2) (3.6) (2.7) (3.3) (6.8) (6.5) (6.4) (6.9) (7.9) (8.1) (12.9) Grand Total 640 551 861 2242.08 2931.72 4054.02 603.0 529.0 729.0 2865.95 3234.64 4397.08 (4.9) (3.6) (3.1) (4.5) (4.6) (5.0) (2.4) (1.9) (1.9) (4.5) (4.4) (4.6) ( ) - indicates percent. Source: Direction of International Trade, IMF, Various Issues.

Economic Integration in South Asia
69
Table 3
Intra-SAARC Export and Import Trade Scenario 1980–2003 (In US$ Million)
Country Bangladesh Bhutan India Maldives
Year 1980 1985 1990 1995 2000 2003 1980 1985 1990 1995 2000 2003 1980 1985 1990 1995 2000 2003 1980 1985 1990 1995 2000 2003
Exports
Bangladesh - - - - 0.9 2.38 8 30 22 36 50.13 55.34 - 0.1 - - - -
Bhutan - - - - 3.78 2.91 - - - - 100.30 113.97 - - - - - -
India 106 59 297 960 860 1358 - - - 12 3 4 - - - 12 20 43
Maldives - - - - - - - - - - - - 19 40 14 - 0.24 0.35
Nepal 0.9 - 1 4 3.6 4.4 - - - - - - 71 38 49 25 216.8 328.7 0.3 0.3 1 - 0.1 -
Pakistan 55 65 103 153 139 166 - - - 1 - - 34 6 20 39 58 84 1.2 5.2 7 1 1 3
Sri Lanka 4 15 10 12 10.2 11 - - - - - - - - - 32 58.3 245.5 - - - 14 90.9 55
Imports
Bangladesh - - - - 1.13 0.93 - - 7 4 4.53 3.84 56 65 170 994 945.45 1494.22 - - - - 1.41 0.4
Bhutan - - - - - - - - - - - - - - - - 171.00 192.03 - - - - - -
India 12 33 15 79 80 61 - - - 16 20 29 - - - - - - - - - - -
Maldives - 0.1 - - - - - - - - - - 3.2 0.4 7 31 35.6 47.7 - - - - -
Nepal 0.5 5.6 8 11 1.4 3.3 - - - - - - 104 91 43 118 157.7 228.2 - - - - -
Pakistan 76 46 36 35 36 43 - - - 2 - - 3.9 16 46 81 178 226 0.5 0.1 - - - -
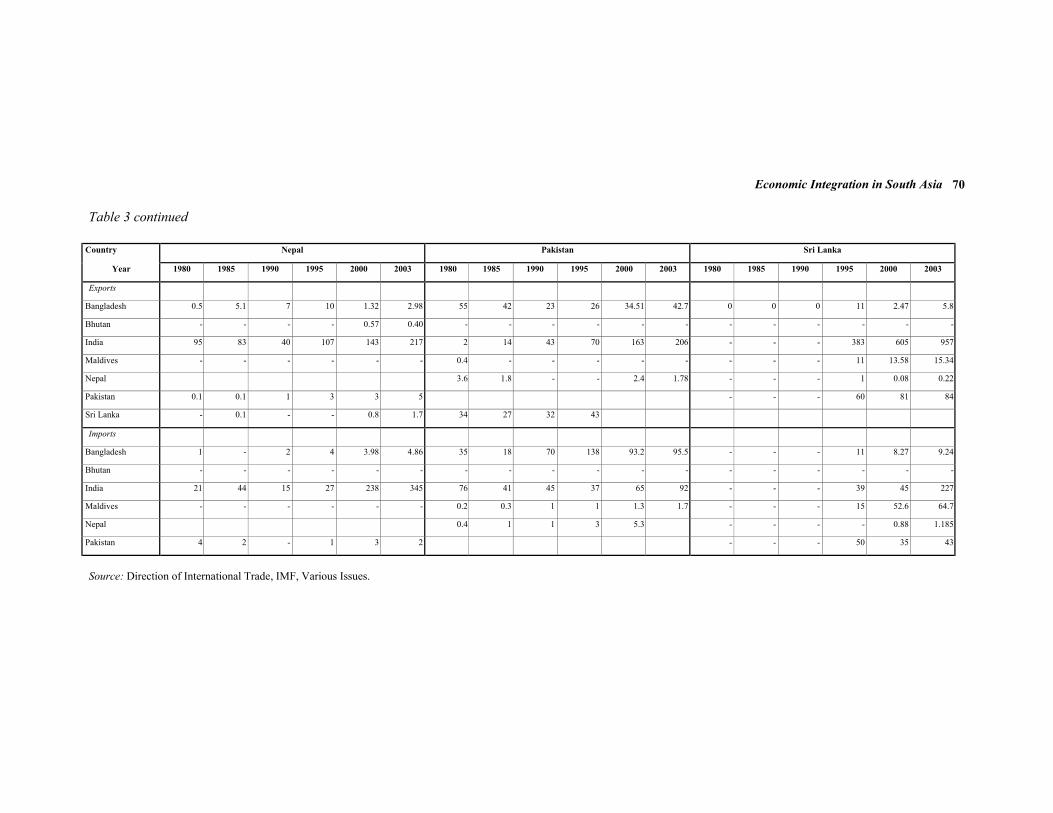
Economic Integration in South Asia
70
Table 3 continued
Country Nepal Pakistan Sri Lanka
Year 1980 1985 1990 1995 2000 2003 1980 1985 1990 1995 2000 2003 1980 1985 1990 1995 2000 2003
Exports
Bangladesh 0.5 5.1 7 10 1.32 2.98 55 42 23 26 34.51 42.7 0 0 0 11 2.47 5.8
Bhutan - - - - 0.57 0.40 - - - - - - - - - - - -
India 95 83 40 107 143 217 2 14 43 70 163 206 - - - 383 605 957
Maldives - - - - - - 0.4 - - - - - - - - 11 13.58 15.34
Nepal 3.6 1.8 - - 2.4 1.78 - - - 1 0.08 0.22
Pakistan 0.1 0.1 1 3 3 5 - - - 60 81 84
Sri Lanka - 0.1 - - 0.8 1.7 34 27 32 43
Imports
Bangladesh 1 - 2 4 3.98 4.86 35 18 70 138 93.2 95.5 - - - 11 8.27 9.24
Bhutan - - - - - - - - - - - - - - - - - -
India 21 44 15 27 238 345 76 41 45 37 65 92 - - - 39 45 227
Maldives - - - - - - 0.2 0.3 1 1 1.3 1.7 - - - 15 52.6 64.7
Nepal 0.4 1 1 3 5.3 - - - - 0.88 1.185
Pakistan 4 2 - 1 3 2 - - - 50 35 43
Source: Direction of International Trade, IMF, Various Issues.

Economic Integration in South Asia
71
The trade profile of individual SAARC member countries reveals that intra-regional export as well as import trade bears similar characteristics. Over the period 1980-2003, each member countries' trade percentage to global exports and imports have found to be erratic and minimal. The intra-regional total trade in SAARC region was 3.2 percent in 1981 which decreased up to 2.4 in 1990. But in the period 1990-2003, the intra-regional total trade hovered around 5 percent (see, Table No. 1). The basic reason for the low intra-regional trade profile could be: the pattern of production of SAARC member countries are more or less the same, their industrial structure is also similar because they all are producer of agro-based commodities and primary products. Additionally, various research studies on informal trading practices among SAARC countries indicate that the proportion of such trade could be significant. If share of such informal trade could be taken into account, the share of intra-regional trade could be easily twice as much as revealed by official trade figures.48 Generally, SAARC member countries are the exporters of primary, semi-manufactured and to some extent manufactured goods (see, Annex 1 for detail).
Problems of Intra-Regional Trade of SAARC Countries Lack of information and contract which is generally available in industrialized economy is the main problem for fostering intra-regional trade among the SAARC countries. The pace of industrialization is getting momentum in some individual SAARC member countries. Thus, there are the prospects of promoting industrial growth through regional cooperation. Restrictive trade policies, resource constraints, imbalance in trade, inadequate transport network, inadequacy of trade and transit facilities, lack of information and trade contracts, lack of adequate communication and banking facilities, etc. are the major constraints for expanding intra-regional trade. The balance of trade has swung in favour of those SAARC member countries that are comparatively well off. The other are still facing services strains on their external balances as a result of intra-SAARC trade. If such bottlenecks are gradually erased, then one could imagine that there is much prospect for the expansion of intra-regional trade among SAARC member countries in coming decades as of European Union (EU) whose member do 60 percent of their trade with each other. Additionally, expansion of intra-regional trade also lies on the successful implementation of SAFTA and normalization of relation among SAARC member countries.
FOREIGN INVESTMENT IN SOUTH ASIA WITH REFERENCE TO NEPAL Foreign investment has been welcomed by developing countries basically for two reasons. One, it adds to the total investible resources and second, it acts as a vehicle for transferring various technological and managerial resources - all in one package.49 During 1980s, many developing countries were forced to ease their restriction on foreign direct investments and changed their policies to attract foreign direct investment. Over and above, owing to lack of alternative financing, governments of LDCs realized that foreign direct investment has a potential benefit in an era of increasing international competition and globalization.
The South Asian countries have also relied upon external resources of different types in varying proportions. With the decline of foreign aid in nominal as well as real terms, there is a renewed emphasis on the role of FDI and foreign portfolio investments as channels of non-debt creating external resources flows. In 1980, FDI flow in the world was US$ 699 billion which went up to US$ 7123 billion in 2002. FDI amount in developing countries of the world and developing Asia remained at US$ 307 billion and US$ 216 billion in 1980 which also increased to US$ 2340 billion and US$ 1305 billion respectively in 2002. The least developed countries (LDCs) had failed to attract more FDI amount. The least developed countries hosted US$ 3 billion worth FDI in 1980 which rose up US$ 46 billion in 2002 (See, Table No. 4). China and India are the main giants of the developing world. FDI flows to China grew from US$ 3.5 billion in 1990 to US$ 52.7 billion in 2002. Those to India rose from US$ 0.4 billion to US$ 5.5 billion during the same time period.50 FDI contributed to
48 RIS, The South Asia Development and Cooperation Report - 2004, RIS, New Delhi, 2004, P. 47. 49 Kapil, Uma, Indian Economy: Issues in Development and Planning and Sectoral Aspects, Academic Foundation, New Delhi, 2002, P. 358. 50 UNCTAD, World Investment Report - 2003, United Nations, New York, July 2003, pp. 42-43.

Economic Integration in South Asia
72
the rapid growth of China's merchandise exports, at an annual rate of 15 percent between 1989 and 2001.51
Table 4
Inward FDI Stock, by Group of Economies (1980-2002)
(US$ in Billion)
Group of economies 1980 1990 1995 2000 2001 2002 World 699 1954 3002 6147 6607 7123 Developed Countries 392 1400 2041 3988 4277 4595 Developing Countries 307 551 921 2030 2174 2340 Africa 32 51 78 145 158 171 Latin America and Caribbean 50 117 202 609 706 762 Developing Asia 216 340 583 1186 1215 1305 Central and Eastern Europe -- 3 40 129 156 188 Memorandum: Least Developed Countries (LDCs) 3 8 16 36 41 46 Source: http://www.un.org/News/Press Docs/2003/trd 1950.doc.htm.
The South Asian countries have also begun to tap the sources of external resources in varying degree with liberalization endeavors and policy reforms. FDI flows to India are steadily rising as it is the largest recipient of FDI in South Asia. However, FDI stock levels as a share of GDP have historically been exceedingly low in South Asia, and remain the lowest of all developing country regions at 0.7 percent of GDP in 2002.52 This reflects both low extra-regional as well as intra-regional investment flows. A more disaggregated look at the number of new (greenfield) and expansion FDI projects underlying these aggregates investment stock figures presents a similar picture, and highlights the low level of intra-regional investment relative to total projects. Of the 1,232 FDI projects in South Asia over the last 30 months (January 2002 to June 2004), only 31 or 2.5 percent are intra-regional in origin by far the largest foreign investors in the region over this period are the larger OECD economies, with the USA accounting for 561 projects, UK 151, Germany 64, Japan 52 and France 39.53 By contrast, the level of intra-regional investment in South East Asia (including China) is more than three times higher, with 339 out of the reported 4,458 projects being intra-regional in origin.54
During 1991-1993, South Asia hosted US$ 977.33 million FDI. This amount rose up to US$ 3,211.00 million in average in between 1998 and 2000 (See, Table No. 5). The SAARC nations as Nepal, Maldives and Bhutan always remained at the lower profile in attracting lesser and lesser amount of FDI influxed in South Asia between 1986-2001. In 1986-90, India hosted US$ 182.0 million FDI followed by Pakistan (US$ 154.1 million) and Sri Lanka (US$ 0.3 million). By 2002, India hosted US$ 3449.0 million worth FDI followed by Pakistan (US$ 823.0 million) and Sri Lanka (US$ 242.0 million) respectively. Thus, FDI significantly rose for South Asia countries namely India, Pakistan and Sri Lanka in 2002. The other South Asian countries as Nepal and Maldives hardly succeeded to attract mere FDI comparatively (See, Table No. 6). The policy reforms have enabled India to widen sectoral as well as source country composition of FDI inflows. Compared to a near total concentration in manufacturing, the bulk of new inflows have in the energy and service sectors.55
51 Ibid. 52 WB, Harmonizing Regulatory Mechanisms: Options for Deepening Investment Integration in South Asia (Programme of Seminars), The World Bank, Washington D.C.; October 1, 2004, P. 1. 53 WB, Ibid; P. 2. 54 UNCTAD, World Investment Report - 2004, United Nations, New York, September 2004. 55 Kumar, Nagesh, Liberalization and Changing Patterns of Foreign Direct Investment, in Uma Kapil (edt.) "Indian Economy Since Independence", Acamedic Founcation, New Delhi, 2002, pp. 650-651.

Economic Integration in South Asia
73
Table 5
Ranking of South Asian Countries as Hosts of FDI (1991-2000)
(US$ in Million)
Average 1991-93 Average 1998-2000 South Asia 777.33 3,211.00 India 320.67 2,361.00 Pakistan 313.00 448.67 Sri Lanka 122.00 200.00 Bangladesh 9.67 179.67 Maldives 7.00 12.00 Nepal 2.33 9.67
Source: RIS, 2002, Table No. 9.6
Table 6
FDI Inflows to South Asia and South East Asia (1986-2002) (US$ in Million)
1986-1990 1991-1995 1996-2000 1999 2000 2001 2002
Bangladesh 2.2 6.4 160.2 178.0 279.8 78.1 45.0
Bhutan 0.3 0.1 0.2 0.3 -0.1 0.2 0.0
India 182.0 796.8 2652.8 2168.0 2319.0 3403.0 3449.0
Maldives 4.3 7.2 11.5 12.3 -13.0 12.3 12.0
Nepal 1.9 5.4 11.6 4.4 -0.5 19.3 10.0
Pakistan 154.1 417.0 594.6 529.7 305.1 385.4 823.0
Sri Lanka 39.6 123.1 230.2 201.0 178.0 172.0 242.0
South Asia 384.6 1356.1 3662.2 3099.7 3094.5 4072.3 4559.0
South East Asia* 6895.9 17737.4 21798.3 19690.0 11055.5 13240.1 –
* South East Asian Countries are Brunei, Cambodia, Indonesia, The Lao Republic, Malaysia, Myanmar, Philippines, Singapore, Thailand and Vietnam.
Source: UN, An Investment Guide to Nepal, United Nations/UNCTAD, Geneva, 2003, Table 11.4, P. 18.
FDI inflows as a percentage of Gross Fixed Capital Formation in South Asia are found to be erratic. In 1991-1996, FDI's contribution to gross fixed capital formation of South Asian nations as Maldives, Pakistan and Sri Lanka remained at 8.5 percent, 5.3 percent and 4.6 percent respectively. FDI's percentage share to the gross fixed capital formation to other South Asian nations as India, Nepal, Bhutan and Bangladesh remained at low level in 1994-96. FDI inflows as a percentage of gross fixed capital formation to South Asian nations as Pakistan, Maldives and India remained significantly high, i.e., 10.7 percent, 6.5 percent and 3.2 percent respectively in 2002. However, FDI did not contribute that much on gross capital formation for other South Asian nation like Nepal, Bangladesh and Bhutan in 2002 (see, Table No. 7).

Economic Integration in South Asia
74
Table 7
FDI Inflows as a Percentage of Gross Fixed Capital Formation in South Asia (1991-2002)
(In percent)
Annual Average,
1991-1996
1997
1998
1999
2000
2001
2002
World 4.4 7.5 10.9 16.5 20.8 12.8 12.2 Developing Countries 6.5 11.4 12.0 14.3 14.6 12.7 10.5 Asia 6.1 9.7 10.2 10.7 13.1 9.8 7.2 South, East and South-East Asia 7.4 10.4 11.0 12.2 14.8 10.3 7.3 Bangladesh 0.1 1.6 2.1 1.8 2.7 0.8 0.4 Bhutan 0.6 -0.5 0.2 0.2 0.2 0.2 0.2 India 1.3 4.0 2.9 2.2 2.3 3.2 3.2 Maldives 8.5 6.5 6.6 5.8 8.9 6.5 6.5 Nepal 0.9 2.2 1.2 0.5 1.0 2.0 0.9 Pakistan 5.3 7.4 5.7 6.4 3.7 4.9 10.7 Sri Lanka 4.6 11.8 3.8 4.7 3.8 2.4 6.5 Source: RIS, Ibid, P. 40.
FDI in Indian manufacturing has been and remain domestic market seeking. FDI accounted 3 percent of India's export in the early 1990s which even today accounts for less than 10 percent of India's manufacturing exports.56 The country's market potential, improved economic performance, growing competitiveness of information technology industries and impetus of recent liberalization are determining factors attracting more FDI into India.
The conspicuous absence of any cross-border investments within the region is a major reason for strengthening the process of regional cooperation and integration in South Asia. Barring a number of Indian joint-venture in Nepal, Sri Lanka, Bangladesh and Bhutan, there are no intra-regional reciprocal investments worth to name.57 India is premier investor in South Asia. Majority of the Indian joint-ventures in South Asia are located in Sri Lanka and Nepal followed by Bangladesh and Maldives. Of the total Indian joint-ventures majority of them are in the manufacturing sector.
Out of the 939 foreign-ventures, some 31.5 percent are from single country India with the investment value of NRs 9759 million (296 projects), 10.5 percent are Japanese with 99 projects worth NRs 950.84 million. The other major investors besides these countries are China, USA, South Korea, Germany and UK. Their share of investment stands at 10.2 percent, 9.6 percent, 5.2 percent, 4.4 percent and 3.3 percent respectively. The other SAARC countries as Pakistan, Bangladesh, Sri Lanka and Bhutan's investment in Nepal have found to be dismal, is less than 2 percent each (See, Annex Table No. 2). There are no traces of investment in Nepal from the Maldives. It is thus evident that foreign investment activities in particular and economic activities in general are being pre-dominated by Indian investors and businessmen in Nepal.
CONCLUSION AND RECOMMENDATIONS The developing countries of Asia attempted to integrate themselves since 1970s. Successful experiences of regional economic integration in 1980s (EU, NAFTA, etc.) of Europe and America prompted Asian Nations to adopt economic integration strategies for the growth and economic betterment of the people and their nations. SAARC member countries came into the mainstream of
56 UNCTAD, Op.cit.; P. 43. 57 Lama, Mahendra P.; Investment in South Asia: Issues, Constraints and Opportunities, in K.K. Bhargara (edts.) "South Asia 2010: Challanges and Opportunities", Friedrich-Ebert-Stiffung, New Delhi, 2001, P. 59.

Economic Integration in South Asia
75
economic integration in the late 1980s. Realizing the importance of intra-regional trade and other economic ties, during the sixth SAARC summit held in Colombo in 1991, the Sri-Lankan Government urged for establishing SAPTA. It came into force formally in 1995. Soon after the initiation of SAPTA, SAARC member countries worked on trade liberalization measures, by reducing tariff and non-tariff barriers which had hindered the expansion of intra-regional trade. Additionally, SAARC member countries also realized that the low profile of intra-regional trade was due to the absence of liberal trade policies and practices. The twelfth SAARC Summit held in Islamabad further declared that SAPTA would transfer to South Asian Free Trade Area (SAFTA) by the beginning of 2006, with full implementation completed between 2013 and 2016. The initiatives of SAPTA and SAFTA are a departure from previous accords that had narrower mandates to increase intra-regional trade and protracted negotiations on the removal of trade barriers.
South Asian countries pursued outward oriented economic strategies as a part of economic reform in the late 1980s decade. This process further intensified in 1990s. The significant emphasis was laid on the process of liberalization in both trade and investment regimes so as to intensify their economic integration globalizing themselves with the world economy. The SAARC member countries Bangladesh, Bhutan, India, Nepal, Pakistan and Sri Lanka committed to reduce existing high tariff walls since the beginning of 1980 so as to expand their trading ties with each other. Economic liberalization got momentum in 1990's decade in these economies. Some of the SAARC member countries correctified their exchange rate policies while others amended their trade policies from time to time as a part of the economic reform. The SAARC member countries also opened up their economies for investment to foreigners amending and formulating suitable FDI policies as a part of economic liberalization process. Privatization process also accelerated in majority of these economies. Despite of these efforts, trade and investment within South Asian region has been limited by a host of economic and political factors. It is much easier to carryout economic cooperation where people in a country perceive neighbouring countries position favouably, but in some SAARC countries there still fear of excessive dependency and domination by other member countries. Asymmetric trade relations of some SAARC member countries with their neighbours are hindering regional integration to some extent.
The mutual trade volume of SAARC countries was almost stagnant in 1980s which increased gradually and took shape in 1990s with the initiation of SAPTA and gradual trade liberalization endeavours by SAARC member countries. Total intra-regional export and import trade remained at 5.0 percent and 4.6 percent respectively in 2003 from that of 4.9 percent and 2.4 percent in 1980. Intra-regional total trade of SAARC hovered around 5 percent in 2003. If the informal trading proportion in SAARC is added up, then one can expect that such figures could be twice as much as revealed by official trade figures. The socio-cultural and political ties also determines the level of intra-regional trade among SAARC countries. Bhutan and Nepal has more trading ties with India rather than with other SAARC countries. India, Bangladesh and Sri Lanka have also similar trading practices. Sri Lanka and Maldives are also closer in this respect. These all indicate that South Asia is gradually adjusting its direction of trade as it has evolved through both domestic reform and international competition. Restrictive trade policies, resource constraints, inadequate transport network, inadequate trade and transit facilities, lack of information, lack of adequate communication and banking facilities, etc. are the major hurdles for expanding the magnitude of intra-regional trade. Additionally, political conflict between India and Pakistan has also obstructed for the expansion of intra-regional trade.
As SAARC member countries eased their restrictions on the flow of FDI and change their policies to attract foreign direct investment in 1980s, almost all SAARC economies succeeded to host more FDI. India remained the largest recipient of FDI followed by Pakistan, Sri Lanka, Bangladesh, Maldives and Nepal. Despite of this, FDI stock levels as a share of GDP have found to be low in South Asia which was remained just 0.7 percent each for all SAARC member countries. Speed up of the policy reform in India paved the way for attracting comparatively more FDI in 1990s. The country's market potential, improved economic performance, growing competitiveness of IT industries and impetus of recent liberalization were the determining factors attracting more FDI into India. India has remained as the premier investor in South Asia. Not only this, recent joint-venture profile of

Economic Integration in South Asia
76
Nepal also depicts that India comes at the premier investor country in Nepal followed by China, USA, South Korea, Germany and UK. The other SAARC member countries' investment profile indicates that Pakistan, Bangladesh, Sri Lanka and Bhutan's investment in Nepal has remained around 2 percent. There is no investment at all in Nepal from the Maldives. It is thus evident that almost all economic activities of SAARC region have been largely influenced by the movement of Indian economy.
The adaptation of liberal trade policy by majority of the South Asian economies in 1990s has led a significant increment in their trade openness. South Asia is emerging as an important region in the global trading system. SAFTA, which was agreed during the 12th SAARC summit held in Pakistan in January 2004, promises to be a major milestone in South Asian trade relation. Under the terms of agreement, Pakistan and India would reduce their tariffs to 0-5 percent within seven years beginning in 2006, and the least developed countries are to reduce their tariffs to 0-5 percent in a period of 10 years in the same period.58 SAARC member countries should accord higher importance to regional approach by sharing experience and expertise. Similarly, member countries should pursue bilateral as well as regional endeavors to improve the existing conditions for the rapid expansion of regional trade, including transport, communication, marketing intelligence, storage, travel rules and facilities, custom procedures and cooperation, financing, etc. Harmonization of laws including investor's protection, intellectual property rights, anti-trust laws, commercial laws, etc. could pave the way for the meaningful implementation of SAFTA and thereby economic integration in South Asia. There is urgent need to evolve unified marketing policies and practices by the SAARC member countries to improve their terms of trade. The SAARC member countries are un-equal from the view point of pace of industrialization and technology. Hence, production strategy is to be devised so as to match the demand and supply of export products among themselves and in international markets. If these countries cooperate in promoting industrialization of their partner countries in the region, this process definitely would boost intra-regional trade.
Continuous efforts to attract FDI inflows to ensure long-term stable economic growth would be desirable for developing countries like Nepal. As Nepal possesses large reservoir of cheap labor, and if she were to put her house in order, she too can attract large volume of export oriented FDI. Admittedly, reform of labor laws, elimination of cumbersome bureaucratic procedures for the approval of FDI projects and measures to curtail corruption are all likely to enhance the attraction of Nepal as a host to foreign firms. Nepal should make efforts to maximize the benefits of FDI by building cooperative-labor management relations, putting in place the fundamental conditions for technological advancement, improving productivity, etc. Additionally, Nepal should be effortful to attract a greater proportion of efficiency-seeking FDI.
58 Malik, Nadeem, New Dawn for South Asian Trade, in "Asia Times Online", http:\\www.atimes.com\South-Asia\FA13pf04.html, 2004.

Economic Integration in South Asia
77
Annex Table No. 1 : Main Socio-Economic Indicators of South Asian Countries
2003
Descriptions Bangladesh Bhutan India Maldives Nepal Pakistan Sri Lanka
Area (sq. kms.) 143998 46500 3287263 298 147181 796099 65610
Population (million) at the end of 2003
138.1 874 (000) 1064.4 290 (000) 24.7 148.4 19.2
GDP Nominal (millions of dollars)
51897
(2371 (bn taka)
4850 (mn nugultrum) 598996
(14245.1 bn rupees)
7583 mn rufiyaa 5835
(286073 mn rupees)
68815
(3895 bn rupees)
18514
(929038 mn rupees)
GDP Growth % 5.3 6.6 8.1 8.4 3.7 5.1 5.6
Per Capita GDP 22331 taka 40623 (ng) 25676 rupees 18748 rupees 32965 rupees 91434 rupees
Inflation (CPI) 5.1 1.6 4.0 -2.9 4.8 3.1 6.3
Exchange rate Per US $ to local currency (period end 2003)
58.78 45.6 45.6 12.8 74.04 57.2 96.7
Exports 332420 mn taka 5652.5 mn ng 225137 crore rupees 149.2 mn US$ 49931 mn Rs 655237 mn rupeea 495426 mn rupees
Imports 558740 mn taka 10421.4 mn ng 297206 crore rupees 4.7.2 mn US$ 124353 mn Rs 714714 mn rupees 643749 mn rupees
Trade Balance -226320 mn taka -4768.8 mn ng -42069 crore rupees -257.9 mn US$ -74422 mn Rs -59477 mn rupees -148323 mn rupees
Current Account (million US$)
328 61.3 6345 -48.1 -339.9 4070 -152
Forex Reserve (Million US$)
2624.2 315.5 102260 159.5 1228.9 11674 1705
Debt Service Ratio as % of Ex. & Services
7.3 4.6 2.0 4.5 8.8 17.8 (2002) 9.8
Fiscal Balance ( % of GDP)
2.3 (2000) -8.7 -0.5 -5.5 -4.6 -3.7 -8.0
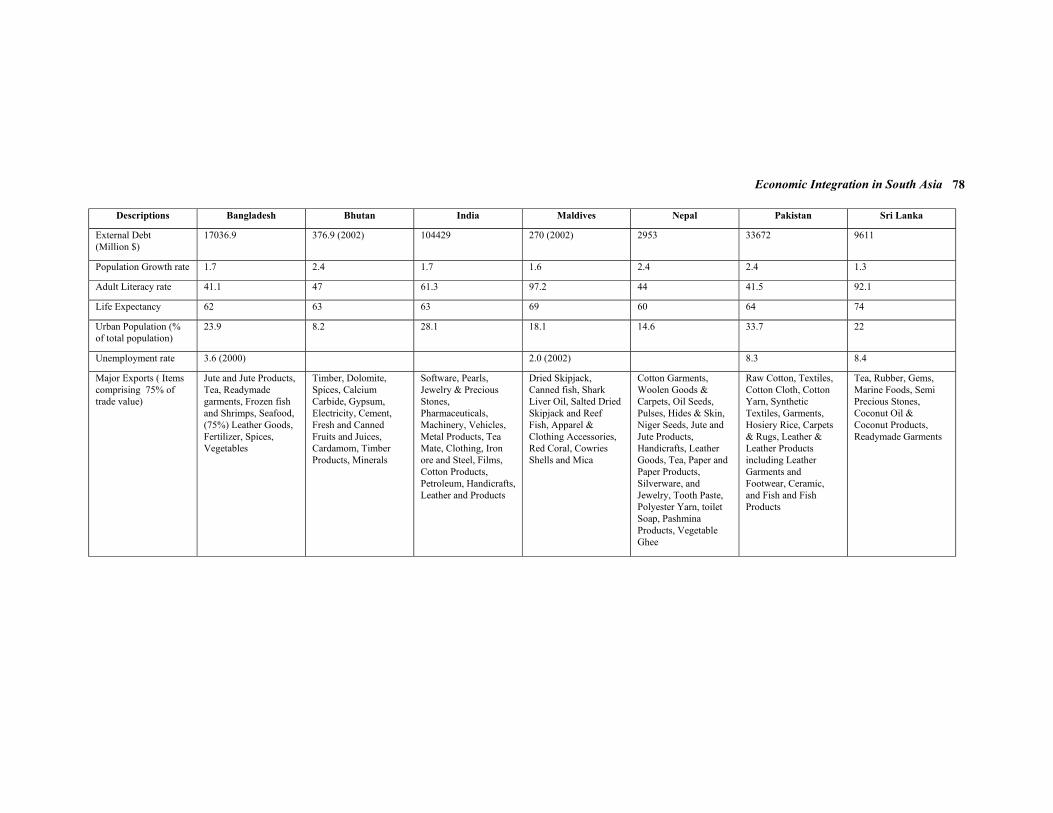
Economic Integration in South Asia
78
Descriptions Bangladesh Bhutan India Maldives Nepal Pakistan Sri Lanka
External Debt (Million $)
17036.9 376.9 (2002) 104429 270 (2002) 2953 33672 9611
Population Growth rate 1.7 2.4 1.7 1.6 2.4 2.4 1.3
Adult Literacy rate 41.1 47 61.3 97.2 44 41.5 92.1
Life Expectancy 62 63 63 69 60 64 74
Urban Population (% of total population)
23.9 8.2 28.1 18.1 14.6 33.7 22
Unemployment rate 3.6 (2000) 2.0 (2002) 8.3 8.4
Major Exports ( Items comprising 75% of trade value)
Jute and Jute Products, Tea, Readymade garments, Frozen fish and Shrimps, Seafood, (75%) Leather Goods, Fertilizer, Spices, Vegetables
Timber, Dolomite, Spices, Calcium Carbide, Gypsum, Electricity, Cement, Fresh and Canned Fruits and Juices, Cardamom, Timber Products, Minerals
Software, Pearls, Jewelry & Precious Stones, Pharmaceuticals, Machinery, Vehicles, Metal Products, Tea Mate, Clothing, Iron ore and Steel, Films, Cotton Products, Petroleum, Handicrafts, Leather and Products
Dried Skipjack, Canned fish, Shark Liver Oil, Salted Dried Skipjack and Reef Fish, Apparel & Clothing Accessories, Red Coral, Cowries Shells and Mica
Cotton Garments, Woolen Goods & Carpets, Oil Seeds, Pulses, Hides & Skin, Niger Seeds, Jute and Jute Products, Handicrafts, Leather Goods, Tea, Paper and Paper Products, Silverware, and Jewelry, Tooth Paste, Polyester Yarn, toilet Soap, Pashmina Products, Vegetable Ghee
Raw Cotton, Textiles, Cotton Cloth, Cotton Yarn, Synthetic Textiles, Garments, Hosiery Rice, Carpets & Rugs, Leather & Leather Products including Leather Garments and Footwear, Ceramic, and Fish and Fish Products
Tea, Rubber, Gems, Marine Foods, Semi Precious Stones, Coconut Oil & Coconut Products, Readymade Garments

Economic Integration in South Asia
79
Descriptions Bangladesh Bhutan India Maldives Nepal Pakistan Sri Lanka
Major Imports Petroleum (Crude), Official equipment, Plant & Machinery, Automobile, Construction Materials, Dyestuffs, Chemicals, Ferrous &Non-ferrous metals, Iron and Steel, Textile, Edible Oil, Milk Products, Raw cotton, Cement, etc.
Petroleum Products, Machinery, Iron and Steel, Automobile, Textiles, Agriculture equipment, Consumer goods, Sugar, Edible oil, Rubber, Tyre, Wheat
Crude Petroleum Products, Machinery, Pearls, Precious and Semi-Precious Stones, Chemical Products, Edible Oils, Vegetables & Fruits, food stuffs, Vehicles, Fertilizers, Rock Salt, Cotton, Sugar, Ceramics & Melamine
Consumer Goods, Petroleum & Food items, Manufactured Goods, Machinery, Vehicles, Chemicals, Steel, Rice, Cement, Wheat, Sugar, Tobacco, Beverages, Paper
Food & Live Animals, Chemicals & Drugs, Manufactured Articles, Construction Materials, Petroleum Products, Oil & Lubricants, Raw wool, Automobiles & Transport Equipment, Machinery, Fertilizer, Textiles, Edible Oil, Cement, Electrical Goods, industrial Raw Materials
Petroleum & its Products, Chemicals, Non-Electrical Equipment, Machinery, Transport Equipment, Iron & Steel Products, Edible Oils, Electrical Goods, Fertilizers, Tea
Machinery, Petroleum, Chemicals, Pharmaceuticals, Iron & Steel, Vehicles, Textiles, Dairy Products, Fertilizers, Pulp & Paper Products, Sugar
PPP GNI Per Capita (US$)
1870 3068 2300 1420 2060 3730
Population below poverty line
49.8 28.6 42 32.6 25
FDI (Millions dollar) in 2002
47 3030 10 823 242
HDI ranking (HDI Report 04)
138 134 127 84 140 142 96
Sources: World Development Report 2005, Human Development Report 2004, ADB- Key Indicators 2004

Economic Integration in South Asia
80
Annex Table No. 2: Profile of Joint Venture Industries in Nepal -Country Wise
(From the beginning to March 2005) (Rs. in Million)
S. N. Country No. Percent In Total
Total Project Cost
Total Fixed Cost
Foreign Investment
Employment Number
1 Australia 9 0.9 141.59 108.82 90.50 359
2 Austria 9 0.9 171.06 130.71 46.36 350
3 Bangladesh 12 1.2 446.14 206.89 211.70 3401
4 Belgium 1 0.1 7.00 5.98 5.95 30
5 Bermuda 6 0.7 1995.25 1694.03 118.27 1474
6 Bhutan 3 0.3 27.26 20.58 3.61 98
7 Brazil 2 0.2 21.07 7.50 4.43 221
8 Bri. Virg. Is. 4 0.4 3439.78 3301.19 1282.94 1210
9 Canada 9 0.9 723.48 630.91 576.30 1289
10 China 96 10.2 9154.25 7630.45 2765.24 7811
11 Denmark 4 0.4 521.92 467.18 30.14 236
12 England 3 0.3 15.53 14.20 11.04 0
13 Finland 2 0.2 10.00 6.86 4.55 91
14 France 23 2.4 439.36 373.44 109.20 1069
15 Germany 42 4.4 1725.83 1570.51 583.68 2707
16 Ghana 1 0.1 6.50 6.18 1.95 0
17 Gwatemala 1 0.1 10.00 5.00 2.50 84
18 Hongkong 15 1.5 1343.54 1099.44 525.24 2075
19 India 296 31.5 31729.73 24462.03 9759.66 40635
20 Iran 1 0.1 5.00 1.80 1.00 0
21 Ireland 1 0.1 5.00 1.00 1.50 40
22 Israel 3 0.3 605.60 504.38 73.50 82
23 Italy 13 1.3 1227.95 1113.16 180.27 329
24 Japan 99 10.5 2858.91 2463.20 950.84 5331
25 Malaysia 6 0.7 464.64 447.07 22.08 203
26 N. Korea 1 0.1 44.82 41.20 12.55 71
27 Netherlands 9 0.9 1062.65 892.28 409.94 2052
28 Newzealand 7 0.7 283.63 228.66 17.07 1994
29 Norway 7 0.7 8035.59 6692.40 1061.33 538
30 Pakistan 11 1.1 310.34 223.97 132.47 2331
31 Panama 1 0.1 83.28 65.17 24.98 121
32 Philippines 4 0.4 934.18 859.53 50.35 1354
33 Poland 2 0.2 89.72 85.55 7.39 39
34 Russia 4 0.4 90.55 59.93 38.73 191
35 S. Africa 2 0.2 30.00 24.84 30.00 59

Economic Integration in South Asia
81
S. N. Country No. Percent In Total
Total Project Cost
Total Fixed Cost
Foreign Investment
Employment Number
36 S. Korea 49 5.2 1757.35 1466.35 918.17 2975
37 Singapore 11 1.1 1614.94 1557.30 343.40 1187
38 Slovenia 1 0.1 4.19 3.94 4.19 0
39 Spain 3 0.3 23.72 20.26 18.97 25
40 Sri Lanka 3 0.3 79.15 55.90 37.41 83
41 Switzerland 21 2.2 522.48 470.75 143.95 347
42 Taiwan 8 0.8 412.75 358.83 172.62 571
43 Thailand 8 0.8 953.12 813.38 91.64 1106
44 Turkey 2 0.2 8.00 5.15 20.50 46
45 UAE 1 0.1 178.54 37.24 45.00 93
46 UK 31 3.3 2491.80 2114.99 702.51 5254
47 USA 91 9.6 12788.11 11613.16 4091.45 8579
48 Ukraine 1 0.1 90.00 82.00 14.70 18 Total: 939 100% 88985.27 74045.29 25751.76 98159
Source: Department of Industries, HMG/Nepal, Kathmandu, 2005.

Economic Integration in South Asia
82
The Proliferation of RTAs with Special Reference to
South Asia
By Bhubanesh Pant∗
PREAMBLE he establishment of the World Trade Organization (WTO) in 1995 led to policy changes that were far-reaching and have been viewed as nothing less than a revolution in trade policy reform.
However, as nations expedited their liberalization processes and integration into the world economy, imbalances and instabilities increased both among nations and within nations. It was unrealistic to assume that these revolutionary changes would keep on bringing about enhanced cooperation among countries and greater stability. In the light of this complex multilateral backdrop, regionalism has become the core component of the new international order. Presently, almost without any exception, trading countries of the world are associated with one, or more typically, two or three regional trading arrangements (RTAs) and the proliferation of RTAs is altering the world trade landscape.
Today, more than one-third of global trade occurs between countries that have some form of reciprocal RTA.1 RTAs have often provided opportunities for comprehensive removal of trade barriers and greater harmonization of rules governing trade than can be achieved under multilateral negotiations. Trade agreements have gone beyond lowering tariffs to include measures to reduce trade hurdles related to standards, customs and border crossing, and services regulations—as well as broader rules that have a positive impact on the investment climate.
The upsurge in RTAs has not only led to qualitative and quantitative changes in regional integration involving North-North and North-South Countries, but it has also ignited many countries of the South to strive for free trade areas (FTAs) among themselves. It is against this background that this paper first discusses the different types of RTAs operating in the world as well as the factors that are responsible for their success. Next, their relevance in the context of the multilateral trading system is highlighted. Thirdly, three emerging RTAs, the Bangkok Agreement, the Bay of Bengal Initiative for Multi-sectoral Technical and Economic Cooperation (BIMST-EC) Free Trade Area and the South Asian Free Trade Area (SAFTA) are examined. The last part concludes this paper.
FORMS OF RTA AND INGREDIENTS FOR SUCCESS Standard economic literature has classified RTA into five categories or levels of integration: preferential trade agreements involving significantly less than 100% liberalization, FTAs, customs unions, common markets and economic unions.
These five categories or stages denote a continuum of integration with the shift from a customs union to a common market representing the step up from low (or shallow) integration to high (or deep) integration. Shallow integration happens where the impact of the integration is felt solely in international trade and mainly affect border measures, such as tariffs, adopted by the state. High integration RTAs, on the other hand, are characterized by the extension of coverage to a whole range of non-tariff barriers (NTBs) and "behind-the-border" issues. Thus, their successful implementation will frequently require a greater degree of political will than is required for low integration RTAs.
At the lowest level of integration, the preferential arrangement, liberalization does not extend to the abolishment of all the trade barriers between territories nor does it cover all the varieties of
∗ Deputy Director, Research Department, Nepal Rastra Bank. 1 Details are provided in World Bank (2005).
T

Economic Integration in South Asia
83
economic activity within the participating countries. In such arrangements, which are also known as partial or sectoral trade agreements, two or more countries exchange preferences or liberalize trade in a selected group of product categories or in selected sectors of the economy. There are two other features that characterize such arrangements: they often extend beyond geographical regions and the liberalization engaged in can be either reciprocal or non-reciprocal in nature.
The most common type of RTA is the FTA. FTAs are the least restrictive of the RTAs, demanding member countries to dismantle only trade barriers among themselves, and permitting each member country to fix its own barriers to trade with nonmembers. A free trade agreement establishes an FTA where trade in goods is fully liberalized between two or more countries. This includes the elimination of tariff and non-tariff barriers to trade between signatories to the agreement. Signatories retain the ability to determine their own trade policies towards non-members. Traditionally, FTAs have only taken into account the free movement of goods but, with the realization that effective integration requires more than just the elimination of tariffs and quantitative restrictions, contemporary FTAs have expanded to include a wider range of economic sectors such as services, investment and competition regulations and government procurement. As a result of this expansion of coverage, contemporary FTAs often display some of the features of "high" integration.
In a customs union, a FTA is supplemented by the harmonization of external tariffs vis-à-vis non-members, that is, the creation of a common external tariff and the use of a common tariff nomenclature. Customs unions typically adopt mechanisms to redistribute tariff revenue among members. Members agree to set their external trade policy as a unified whole. The customs union represents the deepest level of shallow integration.
Simply put, a common market is a customs union with free market mobility within the grouping. It consists not only of the free movement of goods and services characteristic of a customs union, but also of the free mobility of factors of production, that is, labor and capital. Hence, "behind-the-border" issues start being addressed. The line between a customs union and a common market may often seem indistinct since the free movement of services often involves the movement of what could also be classified as factors of production.2 The common market denotes deep integration in the sense that it involves the regulation of sectors that are traditionally considered as falling within the domestic jurisdiction of a state such as the licensing of doctors or lawyers.
Lastly, at the highest or deepest level of integration, is an economic union, which represents a common market with co-ordination of macroeconomic policies, including a common currency.
Globally, RTAs have been expanding over the second half of the 1990s, enabling many nations to seek benefit from freer trade. Depending on the level of integration, these have ranged from PTAs such as the SAARC Preferential Trading Agreement (SAPTA), free trade agreements (FTAs) such as the North American Free Trade Agreement (NAFTA) and the ASEAN Free Trade Agreement (AFTA), customs unions such as Mercosur (a Latin American regional integration mechanism with Argentina, Brazil, Paraguay and Uruguay as full members, and Bolivia and Chile as associate members), to economic union such as the European Union (EU).3
RTAs are beneficial and effective for developing countries when implemented with more comprehensive domestic reforms. Simultaneously, a successful RTA will contribute to the aggregate economic impact of that reform program.
For several reasons, an important determinant for the success of RTAs is the external trade regime. One, trade diversion appears to go down with the level of the external tariffs maintained by member countries after the formation of a PTA. The negative impact of trade diversion is to offset or overcome if the preferential removal of trade barriers against some countries is preceded by a degree of liberalization to all countries, whether taken unilaterally or through multilateral negotiations. If a country that enters into a free trade agreement increases its imports from all countries, not only its partners in the agreement, then there will be an improvement in economic welfare. Hence, countries
2 An example is consulting. 3 A list of the prevalent RTAs is presented in World Bank, op. cit.

Economic Integration in South Asia
84
forming PTAs need to simultaneously lower the level of external protection facing nonmember countries.
Two, where there exist asymmetries in the level of external protection, the high-duty country should lower tariffs to avoid an adverse terms-of-trade shock. Three, low MFN tariffs and nonrestrictive rules of origin ensure that producers within the RTA will get access to competitively priced inputs. In today’s globalized market, policies that considerably increase the input costs of producers will limit their exports to both regional and global markets. Regional integration seems to be more successful if it is attained on the basis of strong competition and ease of access to low-cost inputs.
RTAS AND WTO’S MULTILATERAL TRADING SYSTEM The global trading system has experienced a sharp increase in RTAs over the past two decades. The network of RTAs is becoming more and more complex and many countries are members of several agreements, sometimes with very diverse rules. As at July 2003, only three WTO members—Macau China, Mongolia and Chinese Taipei—were not associated with any RTA. The rise in the RTAs has continued unabated since the early 1990s. By May 2003, over 265 had been notified to the WTO (and its predecessor, GATT). Of these, 138 were notified after the WTO was created in January 1995. Over 190 are currently in force; another 60 are believed to be operational although not yet notified. Based on the number of agreements reportedly planned or already under negotiations, the total number of RTAs in operations could be nearing about 300 by 2005.4
The boom in RTAs demonstrates changes in certain countries’ trade policy objectives, the changing perceptions of the multilateral liberalization process, and the reintegration into the global economy of countries in transition from socialism. The issue is whether these regional groups help or hinder the WTO’s multilateral trading system.
Often RTAs can actually support the WTO’s multilateral trading system. Regional agreements have permitted groups of countries to negotiate rules and commitments that go beyond what was possible at the time multilaterally. As a result, some of these rules have paved the way for agreement in the WTO. Services, intellectual property, environmental standards, investment and competition policies are all issues that were brought up in regional negotiations and later developed into agreements under the WTO.
The groupings that are crucial for the WTO are those that abolish or reduce barriers on trade within the group. The WTO agreements recognize that regional arrangements and closer economic integration can be beneficial to countries. It also recognizes, however, that under certain circumstances RTAs could hurt the trade interests of other countries. Generally, setting up a customs union or FTA area would violate the WTO’s principle of equal treatment for all trading partners (“most-favored nation”). Yet, GATT’s Article 24 permits RTAs to be set up as a special exception, provided certain strict criteria are fulfilled.5 Likewise, Article 5 of the General Agreement on Trade in Services (GATS) concerns economic integration agreements in services. Other provisions in the WTO agreements permit developing countries to enter into regional or global agreements that include the reduction or abolishing of tariffs and non-tariff barriers on trade among themselves.
It is to be noted here that while the renewed momentum for multilateral trade liberalization and rule making launched at Doha in 2001 could have assisted to reduce the risks of regionalism being pursued as a preferred course, the failed ministerial at Cancun in 2003 may have forced many WTO members to accord more emphasis on regional initiatives. Even the United States indicated that it would double its efforts to sign bilateral agreements and RTAs that are easier to negotiate than WTO agreements.
4 These data are taken from the WTO website. 5 Article 24 states that if a free trade area or customs union is formed, duties and other trade barriers should be lowered or removed on substantially all sectors of trade in the group. Non-members should not find trade with the group any more restrictive than before the group was formed.

Economic Integration in South Asia
85
RTAS IN SOUTH ASIA In recent years, RTAs have been viewed as effective mechanisms to address the complex challenges emanating from globalization, the majority of which are beyond the capacity of individual developing countries. This has led countries of South Asia to look for opportunities both to form RTAs among themselves and to be part of the RTAs of the other regions. Accordingly, the South Asian countries have intensified regional economic integration through regional, sub-regional and bilateral approaches. It is against this light that the Bangkok Agreement, the BIMST-EC FTA Accord and the SAFTA Accord are discussed at length below.
The Bangkok Agreement: Linking South-east Asia, East Asia and South Asia It was in July 1975 that the Bangkok Agreement, Asia’s first multi-member PTA between developing countries, was signed by seven countries, namely, Bangladesh, India, Lao People’s Democratic Republic, the Republic of Korea, Sri Lanka, the Philippines and Thailand after agreeing to a list of products for mutual tariff reduction.6 The Agreement was ratified by five of the seven countries, excepting the Philippines and Thailand. The objectives of the Bangkok Agreement are to promote economic development through trade expansion among the members of the Economic and Social Commission of the Asia and the Pacific (ESCAP) and to adopt mutually beneficial trade liberalization measures.7 The rules and regulations are designed, among others, to ensure non-discriminatory and fair trade practices and to preserve the value of the preferences including compensatory action where the value of the preference is lowered or abrogated. The other areas of cooperation include customs administration, standardization of procedures and formalities concerning mutual trade, adoption of a common tariff nomenclature and harmonization of rules of origin and of dumping.
China formally acceded to the Bangkok Agreement in April 2001 and its accession has major implications for trade in the Asia-Pacific Region. While Papua New Guinea acceded to the Agreement in December 1993, the Agreement has yet to be ratified by the Government of Papua New Guinea. Pakistan notified its intention to accede to the Agreement in February 1998, and is in the process of accession. Other countries that have demonstrated interest in joining include Bhutan, Cambodia, Fiji, the Islamic Republic of Iran, Kazakhstan, Mongolia, Nepal and Vietnam.
The Bangkok Agreement as of February 2004 encompassed only tariffs on goods. However, the members have recognized the need to ultimately widen the scope of the Agreement to deal with non-tariff barriers and trade in services.
The Bangkok Agreement has ample potential and is the only truly ‘regional’ trading arrangement in Asia-Pacific as membership covers various sub-regions. To attain its true potential in the new trading environment, the member countries realized that the Agreement was in need for change and modernization. As a result, the member countries launched a revitalization process. The revitalization package included the revision of the text of the Agreement to address the changes in the international trading system that have occurred since the Agreement first came into force, the setting up of a Ministerial Council to take responsibility for the major decisions and the speedy conclusion of the Third Round of negotiations.
Three rounds of negotiations have been concluded under the Agreement. While the First Round of negotiations was completed in 1975, leading to the signing of the Agreement by the participating members, the Second Round of negotiations was concluded on February 15, 1991.8 Since the
6 The Bangkok Agreement will formally come to be known as the Asia-Pacific Trade Agreement (APTA) by Ministers at the first session of the Ministerial Council in 2005. 7 The Agreement was not formulated to divert or restrict trade from countries but to expand mutual trade through fuller exploitation of their trade potential, expansion of productive capacities and higher economic growth. 8 Under the First Round, the total number of products for which tariff preferences were given was 104, in addition to 15 items on which special concessions were granted to Lao PDR. But, tariff preferences were renegotiated and revised in 1979. The total number of product items for which tariff preferences were prolonged for renegotiations was 93 items. Of the 93 products, the ad valorem duties of 80 products were lowered by an average of 23 percent, and the tariff of 9 products was bound at the existing tariff levels. With regard to the other 4 products, specific duties were lowered, varying from 10 percent
Economic Integration in South Asia
86
conclusion of the Second Round, the national lists of concessions of the participating states have been regularly modified. Members have widened their list and China’s offer list itself has provided a considerable rise in the number of items being granted preferential treatment.9 The Third Round of negotiations, with the objective of widening and deepening concessions to increase intra-member trade, was completed in July 2004.10
The Standing Committee of the Bangkok Agreement met in Bangkok on January 8-9, 2005 for its 23rd session. The primary objective of this session was to decide on how to consolidate the second and third round concession lists as well as to continue preparations and arrangements for the first session of the Ministerial Council. Discussions are also ongoing on deriving common rules of origin for the Bangkok Agreement members.
Membership to the Bangkok Agreement is likely to go up in the near future as China’s entry has already aroused renewed interest in the Agreement from the prospective members and the results of the revitalization program are becoming more visible. Members presently have access to two large markets of the region—China and India—together with access on preferential terms to other major markets, especially the Republic of Korea.
BIMST-EC FTA: A Nexus between SAFTA and AFTA The Bay of Bengal Initiative for Multi-sectoral Technical and Economic Cooperation (BIMST-EC), a regional trading bloc, was established in June 1997 to strengthen socio-economic cooperation among Bangladesh, India, Sri Lanka and Thailand. While Myanmar was admitted as a full member in December 1997 Bhutan and Nepal joined in February 2004. BIMST-EC’s six core areas of cooperation, inter alia, are agriculture, energy, fisheries, tourism, trade and transportation.
At the Fourth BIMST-EC Meeting of the Trade and Economic Ministers held in Colombo on March 7, 2003, a Group of Experts (GOE) was appointed for drafting the Framework Agreement of BIMST-EC Free Trade Area. Accordingly, the Framework Agreement on BIMST-EC FTA was signed on February 8, 2004 at Bangkok during the Sixth BIMST-EC Economic Ministers’ Meeting.11 The FTA Agreement would first start on trade in goods from July 2006, while the FTA Accord on trade in services and investment would start from July 2007.
In line with the agreement, in trade in goods, the products excluding those included in the negative list would be subject to tariff cut or elimination on two tracks.12
to 67 percent. The Second Round of negotiations led to tariff concessions being exchanged on 438 items in addition to 63 items for which special concessions were granted to Bangladesh. The extent of tariff concessions among the participating members varied between 13 to 30 percent. 9 The number of products in China’s list of concessions is 739, in addition to 18 items for which special concessions have been given to the LDCs. 10 As member countries are currently consolidating the third round and second round concessions lists, the exact number of concessions arising from the third round is not known. However, preliminary data indicate that the number of items for which tariff concessions were given have risen from 1,721 to 4,279 (from 112 to 609 in the case of special concessions to the LDCs). Details are given in ESCAP (2004a). 11 Although initially Bangladesh was not a signatory to this Accord Framework Agreement as the three developing countries (India, Thailand and Sri Lanka) objected to the move to compensate the loss of revenues for the LDCs, it joined the Framework Agreement on June 25, 2004. 12 In the fast track, products listed by a Party on its own accord shall have their respective applied MFN tariff rates slowly reduced/eliminated in accordance with specified rates to be mutually agreed by the Parties within the following timeframe:
Countries For Developing Country Parties For LDC Parties
India, Sri Lanka and Thailand July 1, 2006 to June 30, 2009 July 1, 2006 to June 30, 2007
Bangladesh, Bhutan, Myanmar, and Nepal July 1, 2006 to June 30, 2011 July 1, 2006 to June 30, 2009
Under the normal track, on the other, hand products listed by a Party on its own accord shall have their respective applied MFN tariff rates slowly lowered/abolished in accordance with specified rates to be mutually agreed by the Parties, within the following timeframe:
Countries For Developing Country Parties For LDC Parties
India, Sri Lanka and Thailand July 1, 2007 to June 30, 2012 July 1, 2007 to June 30, 2010

Economic Integration in South Asia
87
With respect to negotiations for trade in services, emphasis would be given to the progressive elimination of substantially all discrimination between or among the member countries and or prohibition of new or more discriminatory measures with regard to trade in services between the member countries, except for measures allowed under specific Article of the WTO General Agreement on Trade in Services.
In order to promote investments to a develop a transparent and competitive environment, the members also agreed to provide for the promotion and protection of investment, strengthen co-operation in investment, facilitate investment and improve transparency of investment rules and regulations and enter into negotiations in order to progressively liberalize the investment regime through a positive list approach. The members are to develop a modality for anti-dumping measures, subsidy and countervailing measures and non-tariff measures to foster free trade in the region.
The declaration at the end of the first BIMST-EC Summit held in Bangkok in July 2004 provided significant recognition to the potentialities of multi-dimensional cooperation within the region. It expressed strong commitment of the Asian leaders to the founding objectives and principles of BIMST-EC to assess the challenges and opportunities for economic cooperation in the region and to strengthen BIMST-EC’s ability to find ways and means to realize those challenges and opportunities.
A formal meeting of the third round of Trade Negotiation Committee (TNC) of BIMST-EC was held in Kathmandu between March 8-10, 2005. In this meeting the preliminary framework of rules of origin and dispute settlement mechanism, the two crucial provisions of the BIMST-EC FTA Accord, was adopted. The detailed rules and regulations relating to this framework would be finalized through negotiations at the future meetings. The meeting also discussed other outstanding issues concerning the FTA Accord on trade in goods.13
SAFTA and Regional Trade The South Asia Free Trade Area (SAFTA) agreement was signed at the 12th SAARC Summit in January 2004.14 Prior to this, the South Asian Preferential Trading Arrangement (SAPTA) had come into force in December 1995. The four rounds of SAPTA had led to the coverage of more than 5,000 tariff line items. However, studies have demonstrated that the SAPTA process did very little in stimulating regional trade.15
The SAPTA framework was basically based on the 'positive list' approach. The process adopted by SAPTA was very lengthy and slow. Again, at least in the first two rounds of the SAPTA, NTBs were not considered for removal with the granting of tariff preferences. The other problems were that a) the tariff cuts were not deep enough, b) a wide range of goods was not subject to preferential tariffs and (c) some actively traded goods were left out from preferential tariffs.
The SAFTA treaty is to come into force on January 1, 2006. Under the treaty, the non-LDCs are required to bring down their tariffs to 0-5 percent by 2013, except Sri Lanka which is required to do so
Bangladesh, Bhutan, Myanmar, and Nepal July 1, 2007 to June 30, 2017 July 1, 2007 to June 30, 2015
13 Moreover at this meeting, Thailand submitted a new framework on technical barrier to trade (TBT) to the respective technical teams for study. The discussion the TBT framework would be held in the next meeting of the TNC in Myanmar in April, 2005. In that meeting, the TNC is expected to deliberate on various issues such as tariff and customs harmonization, sensitive list, tariff liberalization program, protection during the transition period and safeguard measures, which are very important for the success of the FTA. For details, please refer to The Kathmandu Post, March 12, 2005. 14 It was at the 8th SAARC Summit in New Delhi in 1995 that the SAFTA was initially mooted. At that time, it was proposed that it should be come into operation in 2005. The effective date of SAFTA was changed to 2001 together with the formation of a Group of Eminent Persons (GEP) to draw up a roadmap for SAFTA at the 9th SAARC Summit in Male in 1997. At the 10th SAARC Summit in Colombo in 1998, the GEP report was submitted which suggested that a more practical timetable for SAFTA was 2008. It also recommended the effective date for the LDCs of the region should be 2010. Accordingly, the date for the launching of SAFTA was postponed but without indicating any time-frame. However, it was decided to have a ‘Framework Treaty’ by 2001. The preparation of SAFTA got delayed owing to regional politics. It was only in January 2004, that the SAFTA finally came into shape. For a detailed historical background on the SAFTA, please refer to Kelegama (2004). 15 This is illustrated in Mukherji (2002) and Kemal (2004).

Economic Integration in South Asia
88
by 2014. However, non-LDCs need to bring their tariff to 0-5 percent for the products of LDCs by 2009 with regard to products of export interest to the latter. The LDCs, on the other hand, need to bring down their tariffs to 0-5 percent by 2016.
In accordance with the SAFTA Agreement, a sensitive list, where products exempted from the Trade Liberalization Program, would be listed and then negotiated by the members and incorporated in the Agreement as an integral part. But, the number of products in the list would be subject to maximum ceiling, which are to be mutually agreed among the contracting members, with flexibility given to the LDC members to seek derogation with regard to the products of their export interest.16 It has been agreed in the framework treaty that all the seven member states can maintain two Sensitive List of Products, in which tariff will not be reduced—one for developing countries and another for LDCs.17 Likewise, issues such as imposition of anti-dumping duties, countervailing duties and safeguard measures are to be dealt in accordance with the WTO.18 Rules of Origin are to be negotiated and incorporated into the SAFTA Agreement as an integral part.
The SAFTA affirms the existing rights and obligations under the Marrakesh Agreement establishing the WTO and other treaties and agreements to which SAARC members are signatories. Trade facilitation and other measures are to be adopted. The SAFTA framework has also incorporated simplification and harmonization of standards, customs clearance, import licensing, import financing by banks and transit facilities particularly for landlocked countries. It has clearly stipulated the actions that contracting members can take while facing balance of payment difficulties, during import surges or in the case of disputes.
All in all, the SAFTA is expected to enter into force on the due date upon completion of four procedural formalities: formation of sensitive lists; rules of origin, revenue loss compensation mechanism and ratification by the all member states.
That there exist significant benefits to be reaped from the SAFTA process is clear. For example, openness to trade and investment could result in overall development and make a dent on poverty and backwardness.19 The adoption of SAFTA would facilitate in bringing down customs, duty, promote cross-border investment and, more importantly, formalize the unofficial trade that is occurring through third countries. For example, while current India-Bangladesh bilateral trade is about US$ 1.2 billion, unofficial trade is about twice that figure. According to a recent study, the total elimination of tariffs under SAFTA could augment intra-regional trade by 1.6 times from the existing levels.20 The gains would mainly accrue to the smaller members of the SAARC since they would gain access to the relatively larger markets of the larger members.
However, to imagine that the engine of regional growth in South Asia will lie in the trade in goods alone is being quite optimistic. With very few exceptions, where a country’s advantage lies in unique geographical or resource endowments, it is highly unlikely that an upswing in intra-regional trade can result from comparative advantages when all the economies of SAFTA are still locked into a labor-surplus and capital-scarce environment.21 With low levels of per capita incomes in most of the member
16 Moreover, the sensitive list is to be reviewed every four years or earlier, as decided by the SAFTA Ministerial Council, with the aim of reducing the number of items in the sensitive list. Again, since a large part of gain come from resources for production being allocated in a more efficient manner, it is crucial that the number of products on the sensitive list is kept to a minimum, and that industrial restructuring is allowed to take place. Furthermore, suitable measures need to be undertaken to address the difficulties in the protected sectors with the aim of removing the products from the list as soon as possible. 17 This list is to be finalized between now and the date it enters into force. 18 It was also agreed to accord special regard to the situation of LDCs with regard to anti-dumping and/or countervailing measures, to consider more flexibility for the LDCs in continuation of quantitative restrictions as well as to take direct trade measures with the objective to enhancing sustainable exports from the LDCs, and to set up a suitable mechanism to compensate the LDCs for their loss of customs revenue until alternative domestic arrangements are developed to address this situation. 19 The benefits from SAFTA are discussed in Dadwal (2004) 20 This estimation is given in RIS (2004). 21 As illustrated in Mehta and Kumar (2004), there are other factors, both economic and non-economic, responsible for the low level of intra-regional trade in South Asia which stood at 4.9 percent in 2001, as compared to 22.4 percent for intra-ASEAN trade and 20.8 percent for trade among the Mercosur group. One, since the majority of the South Asian economies are dependent on agriculture and their technological advances with regard to production processes are not very different, the

Economic Integration in South Asia
89
states and fewer numbers of technology driven industries, intra-industry trade based on very refined product differentiation does not seem to have a bright future either.
The Agreement in its present form also needs to be scrutinized from two other angles. First, it excludes the crucial services sector. It chooses to overlook the existing and potential national competitive advantage that the SAARC member states have in sectors like tourism and hospitality (Nepal, Maldives, Sri Lanka), retailing of electricity (with Pakistan’s surplus power, Nepal and Bhutan’s hydel-power capacities), transmission/distribution of gas (Bangladesh), and health services (India), and a host of other services. In this context, it should be realized that a RTA should be both deepened and widened as well.22
Secondly, the agreement is silent on how SAFTA is going to integrate the existing bilateral free trade agreements (BFTAs) between some SAARC countries (such as the Indo-Lanka BFTA, Indo-Nepal BFTA among others) into the SAFTA agreement. Moreover, rules and regulations for the effective implementation of the Trade Liberalization Program and granting of special and differential treatment to the LDCs (Bangladesh, Bhutan, Maldives and Nepal) have not been clearly spelt out. These issues form the crux of the treaty, and until concrete and constructive negotiations are concluded on them, the future of SAFTA would remain uncertain.
Thus, for the success of SAFTA, a gamut of policy initiatives need to be undertaken by the member countries. In the first place, all the countries should have a very small negative list. Secondly, the rules of origin should be simple and transparent. Thirdly, as some of the members could dump and others may provide subsidies to exports and hence practice unfair competition, anti-dumping and countervailing measures need to be transparent. Fourthly, a priority agenda in the next summit could be the extension of SAFTA’s scope to cover trade in services and investment liberalization. Because five of the SAFTA’s members have already signed the BIMST-EC FTA Framework Accord, there should not be any difficulty in building a consensus.
For evaluating the impact of SAFTA in the future, information is required on the degree to which the Agreement’s provisions are being timely implemented and how they are affecting decisions by producers and consumers. As monitoring is important in this respect, an implementation scorecard would be very beneficial.23 Besides providing crucial information, the scorecard is helpful as a disciplinary tool—to disgrace governments with a record of poor implementation into action and to empower governments with good records of implementation to challenge those members who are not fulfilling their commitments.
To conclude this section on SAFTA, a comparison between BIMST-EC FTA and SAFTA is made since membership to multiple RTAs could lead to conflicting obligations.24 For instance, in both SAFTA and BIMST-EC FTA, the target and the depth of integration differ. BIMSTEC-FTA covers both trade in goods and services while SAFTA includes only trade in goods. Moreover, while SAFTA’s aim is to bring down the tariffs to the 0-5 percent level, BIMSTEC-FTA aims for total elimination. These disparities could generate complications in the implementation of these FTAs. There are also other complex issues involved with regard to the simultaneous implementation of these FTA accords. These concern the sensitive list and trade among countries that are members to both the
goods produced by them are quite similar. Secondly, the countries of the region possess an almost identical pattern of comparative advantage in a relatively narrow range of products. Analogously, their bilateral trade structures hardly reveal any complementarities in the trade structure. Again owing to the lower quality of products produced within the region, some countries import goods from outside the region, despite the prices being higher. Finally, geography limits the markets for Nepal and Bhutan owing to land-lockedness, and these countries have to trade basically with India. On the other hand, political issues are responsible for the low level of trade between India and Pakistan. 22 For example, the Indo-Sri Lanka Bilateral Free Trade Agreement has been developed into an Indo-Lanka Comprehensive Economic Partnership Agreement where liberalization of services has been included. Moreover, in the agreement on the BIMST-EC FTA, liberalization of services under a GATS-plus framework has been incorporated. For details, please see Kelegama, op. cit. 23 An example is the ‘Single Market Scoreboard’ employed by the EU Commission. The details are given in World Bank, op. cit. 24 It should be pointed out that BIMST-EC evolved an FTA within seven years of its establishment at its 1st Summit while it took SAARC two decades and twelve summits.

Economic Integration in South Asia
90
FTAs. In the first place, there is an arrangement in both the FTA accords for maintaining the sensitive list. Due to the disparity in tariff targets, there is every possibility that the products under the sensitive list under the two FTAs would not be the same. If this happens, it is unclear as to how trade among countries that are members of both the FTAs will be conducted. Two, as each individual country would wish to protect its local market, countries that are members of both the FTAs may seek protection under the FTA that best fulfils their demands. In this circumstance, it would be difficult to determine which FTA would prevail when trade is carried out among members of both the FTAs. Again, Pakistan and Maldives are not members of BIMST-EC while Thailand and Myanmar are not part of SAARC. All in all, as membership to multiple RTAs could create conflicting obligations, negotiations under SAFTA and BIMST-EC FTA need to be carried out by ensuring that such contradictions do not come about.
CONCLUSIONS To sum up, the RTAs that augment national income normally consist of the following components: a) low external MFN tariffs, b) some sectoral and product exemptions, c) nonrestrictive rules-of-origin tests that build toward a framework common to many agreements, c) measures for facilitating trade, d) measures to enhance new cross-border competition, especially in services and e) rules on investment and intellectual property that are suitable to the development context.
Depending on their design and implementation, RTAs can generate positive or negative impact on trade. In this context, the broader policy context in which an RTA is designed and implemented is of prime importance. Agreements that have been framed to complement a general program of economic reform have been very effective in augmenting trade.
RTAs provide a second-best means of promoting trade liberalization in a context where multilateral negotiations progress slowly. In such an atmosphere, openness through RTAs can build up some of the same institutional and competitive pressures as increased openness via multilateral negotiations.25
The Bangkok Agreement is the oldest RTA of the Asia Pacific region that currently includes countries from South Asia (Bangladesh, India and Sri Lanka), South East Asia (Lao People’s Democratic Republic) and East Asia (China and Republic of Korea) and whose aim is to continuously reduce tariff, non-tariff barriers and forge trade-related cooperation. With a combined population of about 2.5 billion people, this PTA has the potential to become the world’s largest RTA with respect to population coverage. Expansion of membership is expected to boost the trade linkages between East and South Asia, and also serve as a bridge linking these sub-regions with other sub-region.
BIMST-EC has emerged as an important regional entity and indicates a major stride by South Asia towards free trade. BIMST-EC FTA could act as a bridge between the AFTA (ASEAN Free Trade Area) and the SAFTA, especially following the adoption of a framework agreement to form a FTA by 2017. It is necessary for the TNC to finalize the FTA Accord on trade in goods by the end of 2005 since it is to be enforced from July 2006. Moreover, the Summit also endorsed enforcement of FTA on trade in services and investment promotion from July 2007.
The proliferation of RTAs have also inspired the South Asian countries to create a SAFTA which is to be launched beginning 2006 upon completion of formalities, including ratification by all contracting states and issuance of notification by the SAARC Secretariat. The SAFTA Accord marks a movement away from the mere tinkering with tariffs under SAPTA for establishing a FTA in the region. It has the potentiality of going beyond its stated objective of liberalization of trade in goods. Through a successful integration, the South Asian region can attract significant foreign investment; this integration could also lead to restructuring of the economies while making the region a competitive economic block.
However, as South Asian countries are still marginal players in world trade, the benefits to be procured from multilateral agreements should not be undermined. Hence, the countries should follow the two-track approach, giving priority to promoting multilateral trade negotiations under the WTO as 25 ADB (2002) compares RTAs with multilateral trading arrangement.

Economic Integration in South Asia
91
well as strive for meaningful RTAs which they are currently pursuing. Moreover, as the current wave of regionalism has embraced almost all the WTO members, South Asian nations cannot afford to move against the stream.
REFERENCES Adhikari, Ratnakar. 2004. ‘Dangerous fast track,’ The Kathmandu Post, February 20,
http://www.sawtee.org/art3.html#22
Asian Development Bank (ADB). 2002. Asian Development Outlook 2002, New York: Oxford University Press.
Dadwal, Shebonti Ray. 2004. ‘SAFTA is on Track, But FTA…?,’ The Financial Express, April 10.
Economic and Social Commission for Asia and the Pacific (ESCAP). 2003. ‘Facts about the Bangkok Agreement,’ Bangkok: ESCAP, http://www.unescap.org/tid/BAfacts.pdf
ESCAP. 2004. ‘SAARC Summit meeting: Regional cooperation in South Asia moving forward,’ Regional Rapid Response Trade Bulletin, Flier No. 1/2004, http://www.unescap.org/tid/ news/flier/04.pdf.
ESCAP. 2004a. ‘Multilateralism and Free Trade Areas in Asia and the Pacific: Progress, Challenges and Prospects,’ E/ESCAP/SCITI/1, September, http://www.unescap.org/ about/CMG/TI/English/SCITI
Harrison, Glenn W. and David G. Tarr. 2003. ‘Rules of Thumb for Evaluating Preferential Trading Arrangements: Evidence from Computable General Equilibrium Assessments,’ The Policy Research Working Paper 3142, World Bank, Washington, D.C.
Joe, Thomas K. 2004. 'A Subcontinental Free Trade Utopia,' Himal South Asian, January.
http://www.himalmag.com/2004/january/perspective.htm
Kelegama, Saman. 2004. ‘SAFTA: A Critique,’ South Asian Journal, No. 4, April–June, http://www.southasianmedia.net/Magazine/Journal/safta_critique.
Kelegama, Saman and Ratnakar Adhikari. 2002. Regional Integration in the WTO Era: South Asia at Crossroads. Kathmandu and Jaipur: South Asia Watch on Trade, Economics and Environment and CUTS Centre for International Trade, Economics and Environment.
Kemal, A. R. 2004. ‘SAFTA and Economic Cooperation,’ South Asian Journal, No. 6, October-December, http://www.southasianmedia.net/Magazine/Journal/6_safta.
Mahhub ul Haq Human Development Centre. 2002. Human Development in South Asia 2001, Oxford: Oxford University Press.
Mehta, Pradeep and Pranav Kumar. 2004. ‘RTAs and South Asia: Options in the Wake of Cancun Fiasco’. http://rspas.anu.edu.au/paper/asarc2004_11.pdf
Mehta, Rajesh. 2002. 'Establishment of Free Trade Arrangement among BIMST-EC Countries: Some Issues,' Research and Information System for the Non-Aligned and Other Developing Countries, January, http://www.ris.org.in/dp23_pap.pdf
Mukherji, I. N. 2002. ‘Charting a Free Trade Area in South Asia: Instruments and Modalities, in T.N. Srinivasan (ed.). Trade, Finance and Investment in South Asia, New Delhi: Social Science Press.
Mutai, Henri. 2003. ‘Legal Implications for the Conduct of Trade Negotiations’. http://www.tralac.org/scripts/content.php?id=1914
Research and Information System for the Non-aligned and Other Developing Countries (RIS). 2004. ‘South Asia Development & Cooperation Report 2004’. http://www.ris.org.in/sadcr2004
South Asia Watch on Trade, Economics and Environment. (SAWTEE). 2004. ‘Revitalizing the Bangkok Agreement,’ PROACT Monthly E-Newsletter, Volume 1, Issue 6, April, http://www.sawtee.org/PROACT-E-newsletter_Apr_04.html

Economic Integration in South Asia
92
SAWTEE. 2004 ‘Multiple RIAs: Breeding Complexity’. Trade and Development Monitor, 3:2, April.
Suleri, Abid Qaiyum and Bhaskar Sharma. 2004. ‘The SAFTA Mirage', Himal South Asian, February. http://www.sawtee.org/art3.html#22
World Bank. 2005. Global Economic Prospects: Trade, Regionalism and Development. Washington, D.C.: World Bank.
WTO. “Regionalism: friends or rivals?”http://www.wto.org/english/thewto_e/ whatis_e/tif_e/ bey1_e.htm
WTO. ‘Regional Trade Agreements’. http://www.wto.org/english/tratop e/region e.
The Kathmandu Post, December 13, 2004.
The Kathmandu Post, February 8, 2005.
The Kathmandu Post, March 12, 2005.

Economic Integration in South Asia
93
Regional Integration, Economic Growth and Welfare
Rajendra Pandit∗
INTRODUCTION ow Income countries are in big temptation to find the best policy measures and programs for poverty reduction. Most economists have the common view that the growth is essential for poverty reduction; therefore the low-income countries are always desperate to achieve the high
level of economic growth. On the other hand, solid sustainable growth is the ambition for developed countries of the world. There is still to be a consensus about the sources of economic growth, nevertheless, international trade is considered as engine of growth.
The present international economy is characterized by two contradictory concepts: globalization and fragmentation. These two concepts are mutually developing and reciprocally materializing and influencing world economy. The process of regionalisation or fragmentation is often regarded as the synonyms of integration. Regional Trade Agreements (RTAs) are regarded one of the components of a longer political effort to deepen economic relations with neighbouring countries. As such, such forum (agreements) can create opportunities to expand trade through reduction in tax structure and overcome institutional as well as policy barriers to trade. One of the reasons why the countries relatively join RTAs is that, it is often easier to motivate reciprocal reduction in border barriers when the participants are fewer and the policy makers feel more in control of outcomes. Trade agreements therefore usually go beyond slashing tariffs to reduce trade impediments associated with customs and border crossing, and service regulations etc. that improve the overall investment climate. These agreements often form cornerstones of larger economic and political efforts to increase regional cooperation.
According to the L.A. winters (2003), Preferential Trade Agreement (PTA) means any policy aimed at decreasing the trade barriers among countries, without regard to the fact, whether they are neighbouring countries or any near countries. The formulation and contents of economic integration were influenced by the approach of the neo-classical theory of international economic relationships, where international economic integration reflects narrower and more intensive ties among the individual parts of the world economy. Free trade also is according to the neo-classics, the main reason of the economic integration realisation.
Regionalism or international agreements having the form of international groupings are of different integration level. According to V. Jenicek (2001), it starts from the reference areas, where a gradual decrease of the common trade barriers - custom tariffs and quantitative limits - occurs, through a free trade zone (a total removing of tariffs and quantitative limits in the trade of member countries), a customs union (countries give up the right to set autonomous tariffs towards the third countries and set common tariffs), a common market (with unlimited flows of not only goods and services, but also of people and capital), economic and monetary union (a considerable unification of the economies on macro-economic level, introduction of a common structural policy and a common currency) upto the political union (extension of common policies also into the area of external relations and security, harmonization of legislation regarding internal matters of the national state and practically origin of a federation).
The process of regionalism not only gives an answer to the homogenization processes of the economic, social and cultural globalization, but it also represents their inseparable part. The regional liberalization wave, which started on the break of the 80s and 90s, reflected the dragging multilateral GATT negotiations in the frame of the Uruguay Round, reacted at the negative experiences of the ∗ Deputy Director, Research Department, NRB
L

Economic Integration in South Asia
94
protectionist trade policies in the recession period and also took into consideration certain political aspects (the EU, EEA, NAFTA, MERCOSOR, APEC, CEFTA etc.). So far the most developed are the integration process of the west of the European continent in the frame of the EU. Their qualitative as well as quantitative dimensions still offer a considerable development potential of other RTAs of the would. The NAFTA can be regarded, from a certain view point, emerged as a section of the USA on the development of the European Space Consolidation and as an effort of balancing the economic power of the North American Centre.
Many economists argue that regional integration can be harmful for member countries, if RTA does not persue a policy of openness towards other countries. Theoretically as well as practically RTA restricts market access of more efficient producers from outside the RTA, which can lead to welfare losses at home and abroad. However, economic theory also offers some broad insights for conditions under which RTAs are likely to be welfare enhancing. In this regard, a positive development in the South Asian region is to create a South Asian Free Trade Area (SAFTA), which could provide major opportunity to enhance trade and thus economic growth. After a RTA formed, it is regarded as an entity participating in international trade just like individual countries constitute such entities. International trade theory suggests that the best trade policy for this longer entity towards the rest of the world is free trade.
Against the background of a new wave of regionalism parallel with the globalization, Does a country benefit from free trade ? What is the impact of free trade or open economy on growth, welfare, investment, technology and income equality? This paper fundamentally tries to address the issue that the regional agreement whether promote or hinder economic growth for member countries. The focus of this paper is that, if done right, RTA can be a step toward multilateral liberalization and thereby achieve economic growth and people's welfare.
MOTIVES FOR ENTERING INTO REGIONAL AGREEMENTS The number of RTAs, since 1990, has more than quadrupled to about 230 by late 2004. According to the world bank's recent estimate, another 60 arrangements are in various stages of negotiation. If all those come into effect, there will be nearly twice as many PTA as there are in WTO. Nearly all countries belong to at least one RTA, and some are partly to numerous agreements. On average, each country belongs to six RTAs, East Asian countries sign fewer agreements whereas Northern countries have participated in an average of 13 agreements.26
The growing number of overlapping Preferential Trading agreements has shown the character of "spaghetti bowl" of trade relations. The consequences of this is that the trade rules and procedure can be more difficult to administer and that may actually hinder the trade. As the total number of agreements have been increasing, the trade between the RTAs has also risen and has reached almost 40% of world trade where intra-regional trade leading by Europe (60%) and followed by Asia (50%).27 Nevertheless, according to the World Bank estimation only half of this intra-regional trade is on a RTA related preferential basis.
The general or obvious motives for joining the regional arrangements are summarized as follows:
(1) The most common is to enhance trade and thus to achieve higher level of economic growth, and material welfare participating. Countries always seek to secure access to large markets, such as the USA and the EU. However, many developing countries often already enjoy considerable access to these markets, developing countries can reap the benefits from the free market access.
(2) Another important reason for entering into a regional agreement may be to provide developing countries an advantage over other countries in attracting foreign direct investment. RTAs which ensure the market access to the major or large markets, can rise the level of FDI or domestic investment. Increased market size helps in this regard.
26 World Bank (2005) 27 Carltens A. (2005)

Economic Integration in South Asia
95
(3) RTAs can induce to harmonize the internal economic and commercial policies with the other member countries. This reinforces internal regulatory or structural reforms, which would be done through external treaty obligation and political commitments. For instance, Central and Eastern European are locked in some reforms commitment to enter into EU, and similarly Mexico in the context of NAFTA.
(4) Regional agreements can also help in dealing with regional specific problem like border control, transit, migration or movement of labor. RTAs have also included dispute resolution mechanism.
(5) Some countries would also join RTAs to fulfill political objectives. RTAs help to deepen political relationship. Though initial agreement covered trade and investment, it goes beyond the preferential trade to economic and monetary union and political union.
(6) Many countries inter into regional agreements because of the non-participation cost. This is the defence move of the country. Countries may also feel that not entering into regional agreements can lead to a competitional disadvantage relative to countries that have entered into RTAs.
There may be variety of reasons for signing agreement but every member country should think seriously the impact on trade, growth and people's welfare of regionalism to their county themselves. Further objectives could be achieved only after enhancing trade.
THE IMPACT OF PREFERENTIAL AGREEMENTS ON TRADE It has been found that regional trade agreements can have positive or negative effects on trade depending on their design and implementation. World Bank (2005) analysis confirms that gains from a preferential trade agreement cannot be taken for granted. Agreements that have been designed to complement a general program of economic reforms have been most effective in raising trade. The most important ingredient for success is a low trade barrier with all global partners.
Trade performance in several regional trade agreements shows that the increase in intra-regional trade shares of agreements signed in the 1990s has been substantial. The share of intra-NAFTA trade rose from less than 35 percent in the late 1980s to almost 50 percent in 1999. The trade between MERCOSUR members doubled from 10 to 20 percent over the same period. For many agreement signed in the 1990s, intra-regional shares were growing sharply before the agreements were signed (NAFTA, MERCOSUR, SAPTA, SADC). The extent of regional integration in Africa especially among the Common Market for Eastern and Southern Africa (COMESA) members has been relatively static region that has experienced substantial economic progress over the past 20 years, but there has been little increase in the volume of trade. A logical measures, which is commonly used is the share of extra and intra-regional trade in regional GDP.
An interesting conclusion of the empirical studies is that many Preferential Trade Agreements (PTAs) do not appear to lead to substantially increased trade flows between member countries. A large study covering 58 countries and nine PTAs found no indication that PTAs lead to an increase in trade volumes. Moreover, it did not find the new surge in regionalism of the 1990s to have resulted in increased trade between PTA members. Some more recent papers, however, did find some trade creation effects from NAFTA and MERCOSUR.( World Bank 2005).
The effect of possible trade diversion could be that it can lead to a deterioration of member countries' terms of trade. In case a PTA leads to trade diversion from a low cost third country to a higher cost intra-PTA source, the member country's import price increases. This happens even though domestic consumer prices are lower on account of the tariff reduction. However, there is also scope for terms of trade improvements over time through productivity gains on account of increased import competition and technology transfers. Similarly, trade diversion may also be low if PTA members are natural trading partners. Natural trading partners are countries that engage in substantial trade independent of the tariff regime. For example, neighboring countries tend to trade more because of transportation costs, cultural affinity, or similar levels of development and thus consumption preferences. As such, a PTA among natural trading partners provides substantial scope for trade

Economic Integration in South Asia
96
creation, but little scope for trade diversion because member countries trade largely with each other and not with nonmembers.
A number of analysis have concluded that the numerous estimates from the gravity model generally support the contention that RTAs create trade. The meta-analysis of the literature on the impact of regional trade agreements on intra and extra regional trade indicates that although agreements typically have a positive impact on intra-regional trade, their overall impact is uncertain. (see Global Economic Prospect 2005 for detail discussion). Also, actual experience suggests that the presumption of preferential trade agreement will be trade creating can not right everywhere every time.
THEORIES AND EVIDENCES Theoretical predictions of the impact of regional trade integration cover every side of the aspect. Economists do not come up with the common conclusion whether regional integration can be welfare enhancing or welfare reducing. The diverging nature of results seems largely from different approaches to modeling. However newer trade theories find that RTAs provide avenues for welfare improvements.
Beginning with the major findings of traditional trade theory, it is argued that RTAs can be welfare reducing, if they shift trade from a low cost source outside the RTA to a higher cost sources inside the RTA. Regional agreements provide the opportunity for trade creation by lowering trade barriers in the region which leads to increase trade between members. However, lowering trade berriers in a RTA can also lead to trade division from a cheaper sources in a non-RTA country to a more expensive sources in a RTA. RTA member enjoys a price advantage because of tariff protection. Consumers also get the goods cheaper than before the RTA was introduced. However, the importing country, losses tariff revenue by shifting to an intra-RTA source. It is not clear that the direct gain for consumers is larger or smaller than the tariff revenue loss, in particular when the government has to increase taxes to make up for the lost revenue. Thus, the welfare impact of RTA can be positive or negative.
Vamvakidis (1990) surveyed various28 literatures and comes to the conclusion that
"based on cross country regression for the 1970s and 1980s, studies have found that economies with low trade barriers grow faster. Other studies have found that openness variables are not significant in growth regression includes investment over GDP as an independent variables. Nevertheless, openness is significant in regression that have investment share as the dependent variable.Do member countries of an RTA prosper more than non-member? Eventhough there is a considerable theoretical literature on trade creation versus trade diversion in RTAs, there are very few empirical growth studies and no theoretical ones, that address the issues of opening to the world economy versus opening to an RTA. Participation in an RTA does not explain cross country growth difference. Open economics grow faster while closed economies grow slower regardless of their participation in an RTA."
Vamvakidis (1999) estimates the fixed effect growth model to analye the growth of some countries that 10 years before joining RTA and 10 years after joining RTA and finds that participation in the RTA does not foster growth. In contrary, he gets the result that the coefficient of the RTA dummy is always negative and statistically significant at least 10 percent level. However, he concludes that broad liberalization has a significant effect on growth.
By introducing a new measure of regional integration by interacting country membership to a RTA and partners' share of world GDP, Berthelon (2004) finds that the regional integration agreements have exerted positive effects on growth. However, he also shows that just using a dummy variable to measure regional integration agreements will not produce significant effects on long-run growth. Moreover, he finds that North-North agreements have significant growth effect; South-South 28 His conclusion is based on the literatures of Dollar (1992), Edwards (1992), Waczinrg (1998), Vamvakidis (1997, 1998),Levine and Reenelt (1992) and Baldwin and Segheza (1996a)

Economic Integration in South Asia
97
agreements have ambiguous effects depending on the size of countries joining them, and that there is no clear answer for North-South agreements.
Regional trade agreements create the larger market size for the regional producers. Because of this opportunity, average cost goes down by exploiting economies of scale. As RTAs provide free entry in the market, consumers will be benefited from the reduction of commodity prices. Fixed costs are also spread over the lager market and thus investment can also increase thereby productivity and output. This leads to higher employment opportunity and higher income. There is some evidence that RTAs raise investment and therefore growth. Several studies find that the increased market size of RTAs has a positive impact on FDI received by member countries. This effect was more pronounced in the 1990s when RTAs became more widespread. Others, however, find only broad trade liberalization lead to increase investment, while entering into RTAs does not guarantee.
The general lesson coming out of new trade theory is that it is advantageous for RTAs to offer open access to countries wanting to join. Once a RTA has been established, it has similar interests in regional and global trade liberalization as an individual country. As such, having a new member join the RTA provides scope for further trade creation. Therefore, building on the same rationale. RTAs should welcome any other country wanting to join as a general policy. Unfortunately, in practice, the process of joining can be quite complex and involve a variety of considerations.
On balance, empirical studies seem to conclude that RTAs are not harmful, though not necessarily very beneficial either. Perhaps reflecting the theoretical uncertainties discussed above, empirical studies arrive at different results regarding the impact of RTAs. Very few studies find outright harmful effects from trade diversion. However, it also seems difficult to identify clear-cut positive effects. This may partly reflect the fact that regionalism, in particular in the 1990s, took place in parallel with multilateral opening and trends generally described as `globalization.' As such, RTA-specific effects may be difficult to separate from the multitude of other developments.
There are some risks associated with preferential trade. Preferential trade can lead to revenue losses for the member countries, at least in the short run. Tariff reductions associated with trade liberalization naturally entail the risk of falling government revenues. Also, customs administration faces particular challenges to safeguard revenue by properly identifying imports from nonmember countries. Given heavy dependence on trade taxes in many developing countries, tariff reductions are likely to lead to significant revenue losses, in particular when intra-regional trade is important and common external tariffs are also reduced. Early measures to offset potential revenue losses are needed, such as strengthening tax administration, or reinforcing the consumption and income tax systems. Over time, though, there can be a positive impact from preferential trade on revenue, if trade liberalization leads to a better resource allocation, stimulating growth, and, in turn, tax revenues.
Comprehensive product coverage within a RTA ensures that high as well as low tariffs are reduced. Otherwise, benefits to participants would be small, and welfare losses would result from firms moving towards less efficient industries where protection is enjoyed. In practice, textiles, agriculture and services are often exempt or subject to long adjustment periods. This causes large welfare losses and developing countries often suffer the most. If exemptions are unavoidable, a short negative list, listing only those goods and services for which tariffs are not or less reduced, is preferable to a positive list.
CONCLUSION One important point comes out by reviewing the some important readings of experience of preferential trading agreements is that there is no robust support to claim that a regional trade agreements will be net trade creating. Trade diversion will have the chance to threaten the member countries. Benefits for the member countries depend mainly on design and implementation. For the developing countries to be successful, the implementation of RTAs should be followed by comprehensive domestic reforms. External trade regime is the crucial factor for the success of the RTAs. The preferential removal of trade barriers against some countries is accompanied by a degree of liberalization to all countries will offset the negative effect of trade diversion. Economic welfare will not be threaten if a country that enters into a free trade agreement increases its imports from all
Economic Integration in South Asia
98
countries. So, countries joining preferential trading area should simultaneously reduce the level of external protection facing non-member countries.
The example of East Asia shows how increased intra-regional trade can go hand in hand with increased extra-regional trade, contributing to sustained high levels of growth. In addition, successful PTAs typically emerge in existing trading blocs rather than creating them. Moreover, the key lesson appears to be that PTAs should maintain open access and allow countries outside the PTA to join as easily as possible; membership negotiations thus need to be facilitated.
The average tariff rate in South Asian region is quite high i.,e. near about 22 percent29 as against other region, therefore, risks of trade diversion are particularly high in the proposed South Asia Free Trade Area (SAFTA). Trade agreements which, provide comprehensive liberalization for all sectors and non-restrictive rules of origin, are more likely to be successful. Those agreements that devote the most of time and resources to compromising limited positive list or large negative lists and detailed product specific rules of origin tends to limit the gains from free trade area. And lastly, effective implementation and its monitoring are no doubt are crucial ingredients of success. Only signing a RTA is not enough and thus implementation does matter. Agreements are not often implemented because interest groups stop them. In practice, PTAs are signed with a political objective but, after lengthy negotiation, turn out much more restrictive than initially intended.
In South Asia, greater regional cooperation can be pursued through the economic integration under the SAFTA framework. The South Asia is in very low level of regional integration. Therefore, enhancing trade, by trade creation and increasing welfare are of course large potential in the region. SAFTA cannot only prove to be an instrumental for greater economic cooperation but also can be a step advance for normalizing the regional relation towards the wider political objective. But the success of SAFTA mainly depends on the continued unilateral trade liberalization from all member countries vis-a-vis the rest of the world. Regional tariff must be cut down and higher external protection level for some sectors should be dismantled to stop the trade diversion. To make SAFTA itself as effective as possible, exemptions to the agreement need to be limited and sensitive goods lists and the possibility of temporary suspension of concession should be minimized. Liberal rules of origin need to be implemented under the agreement and other issues like harmonization of standards and customs procedures, and cooperation in transport infrastructure in the region are very important for success.
IMPORTANT REFERENCES Berthelon, M., (2004), Growth Effects of Regional integration Agreements, Paper presented at the
joint Central Bank of Chile-World Bank conference , Santiago, Chile
Making Regional Economic Integration Work, Speech by Mr. Agustin Carltens, Deputy Managing Director of IMF at the 20th Annual General Meeting and Conference of Pakistan Society of Development Economists, 2005), Islamabad, Pakistan
Jericek, V., (2001) Globalisation and Regionalistion, paper presented at the conference Agrarian perspectives-Sources of sustainable Economic Growth in the third Millennium, Prague.
Wane, A. A., (2004), Growth and Convergence in WAEMU Countries, IMF Working Paper, IMF
Vamvakidis, A., (1996), Regional Trade Agreements or Broad Liberalization: Which path leads to Faster Growth?, IMF Staff Papers, Vol 43, No 1
Global Economic Prospects, The World Bank (2005), Washington, D.C.
Schiff, M., and Winters, L. A., (2003), Regional integration and development, The World Bank.
29 World Bank (2005) reveals that average tariffs rate is very low i,e less than 3 percent in NAFTA region and very high in SAPTA among the would RTAs.

Economic Integration in South Asia
99
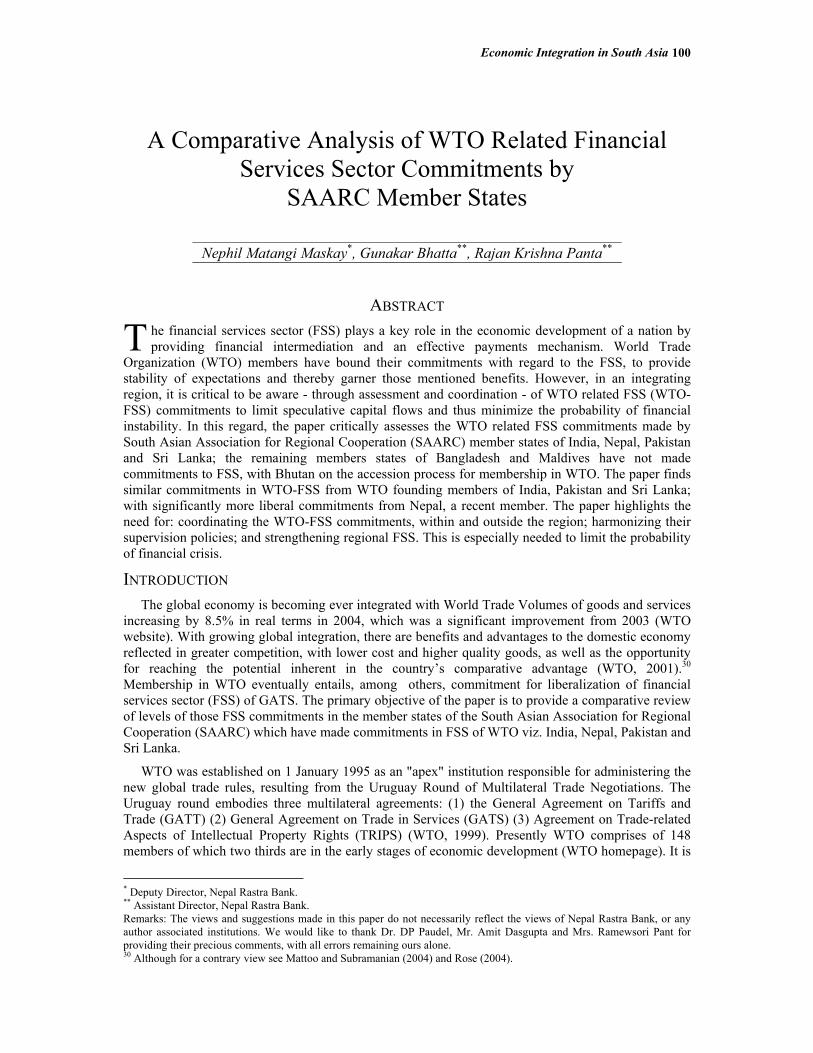
Economic Integration in South Asia
100
A Comparative Analysis of WTO Related Financial
Services Sector Commitments by SAARC Member States
Nephil Matangi Maskay*, Gunakar Bhatta**, Rajan Krishna Panta**
ABSTRACT he financial services sector (FSS) plays a key role in the economic development of a nation by providing financial intermediation and an effective payments mechanism. World Trade
Organization (WTO) members have bound their commitments with regard to the FSS, to provide stability of expectations and thereby garner those mentioned benefits. However, in an integrating region, it is critical to be aware - through assessment and coordination - of WTO related FSS (WTO-FSS) commitments to limit speculative capital flows and thus minimize the probability of financial instability. In this regard, the paper critically assesses the WTO related FSS commitments made by South Asian Association for Regional Cooperation (SAARC) member states of India, Nepal, Pakistan and Sri Lanka; the remaining members states of Bangladesh and Maldives have not made commitments to FSS, with Bhutan on the accession process for membership in WTO. The paper finds similar commitments in WTO-FSS from WTO founding members of India, Pakistan and Sri Lanka; with significantly more liberal commitments from Nepal, a recent member. The paper highlights the need for: coordinating the WTO-FSS commitments, within and outside the region; harmonizing their supervision policies; and strengthening regional FSS. This is especially needed to limit the probability of financial crisis.
INTRODUCTION The global economy is becoming ever integrated with World Trade Volumes of goods and services increasing by 8.5% in real terms in 2004, which was a significant improvement from 2003 (WTO website). With growing global integration, there are benefits and advantages to the domestic economy reflected in greater competition, with lower cost and higher quality goods, as well as the opportunity for reaching the potential inherent in the country’s comparative advantage (WTO, 2001).30 Membership in WTO eventually entails, among others, commitment for liberalization of financial services sector (FSS) of GATS. The primary objective of the paper is to provide a comparative review of levels of those FSS commitments in the member states of the South Asian Association for Regional Cooperation (SAARC) which have made commitments in FSS of WTO viz. India, Nepal, Pakistan and Sri Lanka.
WTO was established on 1 January 1995 as an "apex" institution responsible for administering the new global trade rules, resulting from the Uruguay Round of Multilateral Trade Negotiations. The Uruguay round embodies three multilateral agreements: (1) the General Agreement on Tariffs and Trade (GATT) (2) General Agreement on Trade in Services (GATS) (3) Agreement on Trade-related Aspects of Intellectual Property Rights (TRIPS) (WTO, 1999). Presently WTO comprises of 148 members of which two thirds are in the early stages of economic development (WTO homepage). It is
* Deputy Director, Nepal Rastra Bank. ** Assistant Director, Nepal Rastra Bank. Remarks: The views and suggestions made in this paper do not necessarily reflect the views of Nepal Rastra Bank, or any author associated institutions. We would like to thank Dr. DP Paudel, Mr. Amit Dasgupta and Mrs. Ramewsori Pant for providing their precious comments, with all errors remaining ours alone. 30 Although for a contrary view see Mattoo and Subramanian (2004) and Rose (2004).
T

Economic Integration in South Asia
101
also important to point out that WTO provides for regional trading agreements (RTA), since it generally felt that such agreements are preliminary steps towards its goal of trade liberalization.31
The RTA of interest for this paper is that of the SAARC. The SAARC comprising of the seven member states namely: Bangladesh, Bhutan, India, Maldives, Nepal, Pakistan and Sri Lanka was established on 8 December 1985. This organization was established with an aim of promoting the welfare and of improving the quality of life through accelerated economic growth, social progress and the cultural development of the region. Further, within the SAARC framework, the aspect of economic integration has been highlighted by the SAARC Group of Eminent Persons report (SAARC, GEP, pp. 20–21) which has provided a roadmap toward economic integration resulting in a South Asian Economic Union by 2020; this had been affirmed by subsequent SAARC Declarations (SAARC, 2002 & 2004). The first step toward this goal is the South Asian Free Trade Area (SAFTA; for details of agreement see SAARC homepage). Further, there has been talk of a regional currency – see Maskay (2003) and citations therein. As all the countries in the SAARC have become the members of WTO [except Bhutan, which has an observer status and is on the accession process for membership in that organization] it is of importance to be aware of their respective commitments in WTO.32
While WTO has a large footprint and covers all aspects of trade in goods and services, the specific sector of concern in this paper is limited to FSS of GATS, since it has an important influence on domestic monetary and financial stability, which is essential for facilitating economic growth and development. FSS covers three sub-sectors (which includes a subsector for "others") and sixteen categories as cited in GATS Annex on Financial Services and which are discussed in greater detail later in the paper. Liberalization (versus deregulation) entails higher levels of competition by having the market become more responsive to forces of supply and demand; this in part allows foreigners' access to domestic financial markets and domestic national’s access to foreign financial markets. This increase in financial activity, both domestic and with other countries, will affect financial flows, foreign exchange management and thus finally affecting the capital account in the Balance of Payments (BOP).
With liberalization of FSS there is also increasing probability of crisis in BOP in the absence of ex ante strategic protective measures.33 This may be due to a number of reasons such as volatile capital flows etc. An assumption is that crisis in BOP results from non-symmetric commitments for liberalization of FSS, in an economically integrating region. This is because FSS liberalization facilitates capital flows to speedily move between areas to meet profit opportunities. Non-symmetric FSS liberalization provides those profit opportunities through, for example, currency arbitrage. This would result in volatile capital flows from the less liberalized economy to the more liberalized economy (and vice versa) leading to a BOP crisis (specifically through instability in foreign exchange reserves) and possibly ending with a domestic monetary and financial crisis. Thus, it is essential to harmonize the level and the proper sequence of FSS liberalization for countries in an economically integrating region. The objectives of this paper are thus to (1) produce a description of FSS commitment by those identified SAARC member states; (2) provide a comparative analysis; and (3) put forth some observations in regard to regional FSS commitments to WTO.
The paper proceeds by introducing some background information on concepts of FSS and FSS liberalization in the next section. The third section reviews the levels of FSS liberalization in selected SAARC countries, as put forth in WTO Schedule Format, and does a comparative review of FSS 31 When a WTO member enters into a regional integration arrangement, it grants more favorable conditions to its partners than to other WTO members' trade - this departs from the guiding principle of non-discrimination defined in Article I of GATT, Article II of GATS and elsewhere. WTO members are however permitted to enter into such arrangements under specific conditions which are spelled out in Paragraphs 4 to 10 of Article XXIV of WTO provide for the formation and operation of customs unions and free-trade areas covering trade in goods; the so called Enabling Clause refers to preferential trade arrangements in trade in goods between developing country members; and Article V of GATS governs the conclusion of RTAs in the area of trade in services, for both developed and developing countries. Most WTO members are also party to one or more regional trade agreements. However, there has been a concern raised regarding RTA, most recently by WTO (2004) which goes again the spirit of most favored nations. 32 Nepal has recently become the 147th member of WTO, the first LDC to do so through the regular negotiation process (WTO, 2004). 33 Domestic monetary and financial stability will also be affected, however is assumed to be a result of crisis in the BOP.

Economic Integration in South Asia
102
liberalization in those countries. The fourth section puts forward some observations while the last section summarizes and concludes.
BACKGROUND INFORMATION ON THE CONCEPT OF FSS AND OF FSS LIBERALIZATION To understand FSS, it is important to understand GATS in context of WTO. Prior to the formation of WTO, the existing GATT dealt only with trade in goods. However, the changing composition of trade, in part, resulted in a more comprehensive set of rules over international trade represented by the establishment of WTO on 1 January 1995. An integral portion of WTO is GATS that covers all internationally traded services in twelve sectors.34 These included sectors are the various possible ways of providing an international service.35 One of these services is the FSS. FSS facilitates financial intermediation in the economy (i.e. mobilization and allocation of funds). Further, FSS is important for the economy as a whole since it allows financial transfers and payments. In other words, a healthy and stable FSS is essential for sustainable economic growth. Conversely, instability in FSS can potentially have economy wide effects and can be seen most dramatically in the crisis in East Asia where fragility in the financial system spilt over to other countries in the region.36,37 This short background note, therefore, demonstrates that it is essential to understand and accurately represent a country’s FSS.
In this regard, there are a number of ways for representing a country’s FSS such as through the United Nations or national classification. Because of the varying classification standards, there have been confusion and problems with cross-country comparison. This paper consistently uses the format provided by the GATS Annex on Financial Services, which is presented below38:
Financial Services A. All insurance and insurance-related services:
a. Life, accident and health insurance services;
b. Non-life insurance services;
c. Reinsurance and retrocession;
d. Services auxiliary to insurance (including broking and agency services).
B. Banking and other financial services (excluding insurance):
a. Acceptance of deposits and other repayable funds from the public;
b. Lending of all types, including, inter alia, consumer credit, mortgage credit, factoring and financing of commercial transaction;
c. Financial leasing;
d. All payments and money transmission services;
e. Guarantees and commitments;
34 These sectors of GATS are: Business (including professional and computer) services; Communication services; Construction and related engineering services; Distribution services; Educational services; Environmental services; Financial (insurance and banking) services; Health-related and social services; Tourism and travel-related services; Recreational, cultural and sporting services; Transport services; and Other services not included elsewhere). 35 GATS defines four avenues which will be discussed in greater detail in the next section, they are: cross-border supply; consumption abroad; commercial presence; and finally presence of natural persons. 36 The financial services annex says that governments have the right to take prudential measuring, such as those for the protection of investors, depositors and insurance policy holders, and to ensure the integrity and stability of the financial system. It also excludes from the agreement services provided when a government exercises its authority over the financial system, for example central bank’s services. Negotiations on specific commitments in financial continued after the end of the Uruguay Round and ended in late 1997. 37 The only exception to this is when there are BOP difficulties and even then, the restrictions must be temporary and subject to other limits and conditions. 38 The rationale for using this system, versus other comparable systems, is given in (WTO, 1998).

Economic Integration in South Asia
103
f. Trading for own account or for account of customers, whether on an exchange, in an over-the-counter market or otherwise, the following;
- money market instruments (cheques, bills, certificate of deposit, etc.);
- foreign exchange;
- derivative products including, but not limited to, futures and options;
- exchange rate and interest rate instruments, including products such as swaps, forward rate agreements, etc.;
- transferable securities;
- other negotiable instruments and financial assets, including bullion.
g. Participation in issues of all kinds of securities, including under-writing and placement as agent (whether publicity or privately) and provision of service related to such issues;
h. Money broking;
i. Asset management, such as cash or portfolio management, all forms of collective investment management, pension fund management, custodial depository and trust services;
j. Settlement and clearing services for financial assets, including securities, derivative products and other negotiable instruments;
k. Advisory and other auxiliary financial services on all the activities listed in Article 1B of MTN.TNC/W/50, including credit reference and analysis, investment and portfolio research and advice, advice on acquisitions and on corporate restructuring and strategy;
l. Provision and transfer of financial information, and financial data processing and related software by providers of other financial services.
C. Other Commitment for liberalization of FSS entails that the existing financial regulations are accommodative to greater financial intermediation along with greater financial transfers and payments; the later will eventually be reflected in higher inflow and outflow of funds. This also necessitates that there be deregulation of various financial service activities and increase in industry competition. It is important to point out that this does not touch on the ability of the “central bank or monetary authority” for providing domestic regulation, as clearly spelled out in the second point of the Annex of Financial Services39; WTO is cognizant that financial liberalization and financial services trade has implication for financial stability and shall not prevent measures for prudential reasons.
COMPARATIVE REVIEW OF SELECTED SAARC COUNTRY’S FSS COMMITMENTS IN WTO SCHEDULE FORMAT As mentioned, it is essential to characterize a country’s FSS commitment’s in a format which is comparable with other countries. In this vein, this section proceeds as follows: First, review of WTO schedule format then, secondly, putting forward the level of FSS commitments of selected SAARC member countries and lastly doing a comparative review of those countries FSS commitments.
39 This is show in the second article entitled “Domestic Regulation” which is as: (a) Notwithstanding any other provisions of the Agreement, a Member shall not be prevented from taking measures for
prudential reasons, including for the protection of investors, depositors, policy holders or persons to whom a fiduciary duty is owed by a financial service supplier, or to ensure the integrity and stability of the financial system. Where such measures do not conform with the provisions of the Agreement, they shall not be used as a means of avoiding the Member’s commitments or obligations under the Agreement.
(b) Nothing in the Agreement shall be construed to require a Member to disclose information relating to the affairs and accounts of individual customers or any confidential or proprietary information in the possession of public entities.”

Economic Integration in South Asia
104
Review of WTO Schedule Format This section reviews the WTO schedule format for accurate submission of factual information and is based on WTO (1996). It should be noted that there are two sorts of provisions under the GATS. The first are general obligations, some of which apply to all sectors (e.g. MFN, transparency, etc.). The second are specific commitments, which are negotiated undertakings specific to each member. These commitments can further be broken down into horizontal and specific commitments. Horizontal commitments affect all sectors, and sub-sectors, equally; this is usually at the top of the Schedule of Service Sector Commitments.40 Specific commitments, on the other hand, are commitments specific to the sector and are provided for market access and national treatment which are generally put forward with two separate columns. 41,42
In the first table for market access, the first column puts forth the various categories under each sub-sector of a particular sector. So, in the case of FSS, the first column includes the sub-sectors of “All insurance and insurance-related services”, “Banking and other Financial Services (excluding insurance)” as well as the “Other” sub-sector along with the different categories described earlier. In the second column information relating to market access are included for each category based on the four modes of supply which are: Cross border supply (i.e. the service supplier is typically not present within the territory of the government where the service is delivered with some examples being international transport, the supply of a service through telecommunications or mail, and other such services embodied in exported goods [e.g. a computer diskette, or drawings]); Consumption abroad (i.e. this mode of supply is often referred to as “movement of consumers” whose essential feature is that the service is delivered outside the territory of the government concerned and typically includes crossing for the border of the consumer as, for example, in tourism services43); Commercial presence (i.e. this mode covers not only the presence of juridical persons in the strict legal sense, but also that of legal entities which share some of the same characteristics includes, inter alia, corporations, joint ventures, partnerships, representative offices and branches); Presence of natural persons (i.e. this mode covers natural persons who are themselves service suppliers, as well as natural persons, who are employees of service suppliers). The four modes of supply are simply stated as Mode 1, 2, 3 and 4 for cross border supply, consumption abroad, commercial presence and presence of natural persons respectively.
Commitments are recorded in the WTO schedule format in the table for market access, through a number of ways. First, as mentioned earlier there are horizontal commitments, which apply to trade in
40 The discussion will be consistent with the schedule of the selected SAARC member countries’ FSS is provided on the Internet web home page of Nepal Rastra Bank at www.nrb.org.np as the first and second appendix for market access and national treatment respectively for the interested to look into its details. 41 For ease of understanding, the general table format for market access, which is also true for national treatment, is presented below in tabular form:
Financial Service Sector – market access All insurance and insurance-related services 1) Cross-border supply
2) Consumption abroad 3) Commercial presence 4) Presence of Natural persons
Banking and other Financial Services (excluding insurance) 1) Cross-border supply 2) Consumption abroad 3) Commercial presence 4) Presence of Natural persons
Other 1) Cross-border supply 2) Consumption abroad 3) Commercial presence 4) Presence of Natural persons
42 An example from WTO (1998) will clarify this “if a government commits itself to allow foreign banks to operate in its domestic market, that is a market access commitment. And if the government limits the number of licenses it will issue, then that is a market access limitation. If it also says foreign banks are allowed one branch while domestic banks are allowed numerous branches, that is an exception to the national treatment principle.” 43 Although activities such as ship repair abroad, where only the property of the consumer moves, or is situated abroad, are also covered.
Economic Integration in South Asia
105
services in all scheduled services sectors unless otherwise specified; it is in effect a binding either of measures which constitutes a limitation on market access or national treatment, or of a situation in which there are no such limitations. Second, there are sector specific commitments which apply to trade in services in a particular sector; it is in the context of such a commitment, when a measure is maintained which is contrary to Article XVI or XVII, it must be entered as a limitation in the appropriate column (either market access or national treatment for the relevant sector and modes of supply). Third are recordings of the various levels of commitments; their presentations are extremely important and have to be very precise since the terms used create legally binding commitments indicating the presence or absence of limitations to market access and national treatment. Depending on the extent to which a member has limited market access and national treatment, for each commitment with respect to each mode of supply, four cases can be foreseen:
• Full commitment – Members do not seek in any way to limit market access or national treatment in a given sector and mode of supply through measures inconsistent with Article XVI and XVII. In this situation, the appropriate column is marked with NONE. However, any relevant limitations listed in the horizontal section of the schedule will still apply.
• Commitment with limitations – Where market access or treatment limitations are inscribed, the member must describe in the appropriate column the measure maintained which are inconsistent with Articles XVI or XVII. The entry should describe each measure concisely, indicating the elements, which make it inconsistent with Articles XVI or XVII. Further, in some cases, members may choose to partially bind measures affecting a given category of supplier. This may be achieved through an indication in the horizontal section of a schedule with the corresponding sectoral entry under the relevant mode of supply (i.e. it may thus read “Unbound except as indicated in the horizontal section”).
• No Commitment – In this case, the Member remains free in a given sector and mode of supply to introduce or maintain measures inconsistent with market access or national treatment. In this situation, the Member must record in the appropriate column the word: UNBOUND. This case is only relevant where a commitment has been made in a sector with respect to at least one mode of supply.44
• No commitment technically feasible – In some situations, a particular mode of supply may not be technically feasible. An example might be the cross-border supply of hairdressing services. In these cases, the term UNBOUND* should be used. The asterix should refer to a footnote that states “Unbound due to lack of technical feasibility.”
It is in “Commitments with limitations” that acceding government may limit market access horizontally or to any specific service sector. Such limitations for market access45 may include: Limitations on the number of service suppliers (e.g. ceilings on the total number of banks); Limitations on the total value of transactions on assets (e.g. foreign bank subsidiaries limited to X per cent of total domestic assets of all banks); Limitations on the total number of service operations or on the total quantity of service output (e.g. restrictions on broadcasting time available for foreign firms); Limitations on the total number of natural persons (in particular non-nationals) that may be employed in the sector (or the share of wages paid to foreign labor); Restrictions on, or requirements of, specific types of legal entity through which that service may be supplied (e.g. commercial presence exclude representative offices, foreign companies required to establish subsidiaries, commercial presence must take the form of a partnership); Limitations on the participation of foreign capital. In addition to these limitations it is suggested that clear reference will also have to be made to the relevant laws or regulations.
The second table elaborates on national treatment.46,47 Following the same format as market access, the first column puts forth the various categories under each sub-sector of a particular sub-sector. The
44 Where all modes of supply are “unbound”, and no additional commitments have been undertaken in the sector, the sector should not appear on the schedule. 45 This is consistent with Article XVI of WTO (1995). 46 This is consistent with Article XVII of WTO (1995).

Economic Integration in South Asia
106
second column puts forward limitations on national treatment, which follow a similar format as above where, along with each mode of supply, a detailed description of existing measures maintained by the acceding governments, which may limit market access, will be noted as well as the relevant laws or regulations.48
Level of FSS Commitments for Liberalization of Selected SAARC Member Countries As mentioned, the selected SAARC member states for this paper are limited to India, Nepal, Pakistan and Sri Lanka. This is because Bangladesh and Maldives have not made any commitment in the financial services sector49 and Bhutan is on the process of acceding to WTO;50 these are:
Comparative Review of FSS51 Examining the four selected SAARC member states, a sharp distinction is quickly noted: the three original members of WTO, namely India, Pakistan and Sri Lanka are clustered around similar commitments which are consistent for all sub-sectors in FSS for both market access and national treatment - all those FSS commitments were annexed to the fifth protocol of financial services on February 26, 1998 – while Nepal, the newest member of WTO in SAARC, has FSS commitments which are quite different from those three countries (WTO, 2004). These commitments are provided in tabular form for market access and national treatment in the first and second appendix respectively). Initially, a sub-sector wise comparative analysis for FSS is put forth.
As mentioned, there are two aspects for making an analysis on the “All insurance and insurance related services” portion of FSS. First is the limitations on market access in those selected SAARC member states, which finds that Nepal has made the most liberal commitments. For example, in the insurance subsectors (a) and (b) i.e. "Life, accident and health insurance services and health insurance services" and "Non-life insurance services" only Nepal has committed to having no limitations on market access in modes 1, 2 and 3 whereas the remaining states have "Unbound" in both of these modes. Similarly, in the service subsector (d) i.e. "Services auxiliary to insurance (including broking and agency services)" Nepal has not placed any limitation on the market access in modes 1, 2 and 3 whereas Pakistan and Sri Lanka have not made commitments in this sub sector with India allowing foreign services with some conditions. Further, India does not have any commitment in life insurance whereas Pakistan and Sri Lanka are “Unbound” in all modes of supply except for the commercial presence. Pakistan has already given 25% equity participation to foreign shareholding in existing foreign life insurance services providers and this participation has increased upto 51 % in new life insurance companies with Sri Lanka permitting new establishments only after the approval from the government of Sri Lanka. So far for the non-life insurance services providers, all the three mentioned SAARC member states except Nepal have made unbound commitments in all modes of supply except for the commercial presence. India and Sri Lanka are bound with some specified provisions in the area of reinsurance and retrocession but Pakistan is unbound in all modes of supply, in this regard, except for the commercial presence where it does not have any commitment. In contrast, Nepal has opened Life and Non-life insurance services in all three modes of supply except for mode 4. With regard to the “services auxiliary to insurance (including broking and agency services)”, only India has made some commitments. In regard to the limitations on national treatment in this sector, all the selected SAARC member states except Nepal are either "unbound" or have limited commitment, with a number of exceptions. Apart from Nepal, only Sri Lanka have no limitations on the national treatment in life
47 The GATS states that “in the sectors covered by its schedule, and subject to any conditions and qualifications set out in the schedule” each member shall give treatment to foreign service and service suppliers treatment, in measures affecting supply of services, no less favorable than it gives its own service and suppliers. 48 For completeness an additional column is usually provided for additional commitments with respect to measures affecting trade in services not subject to scheduling under market access or national treatment. Thus, additional treatments are expressed in the form of undertakings, not limitations. In the schedule, the additional comments column would only include entries where specific commitments are being undertaken, and need not include those modes of supply where there are not commitments undertaken. 49 From the “Summary of Financial Service Commitments” in the WTO home page. 50 The levels of FSS commitments of India, Pakistan and Sri Lanka for market access and national treatment are placed on the Internet web home page of Nepal Rastra Bank at www.nrb.org.np for easy access. 51 This builds on the analysis from NRB, IFD (2002)

Economic Integration in South Asia
107
and non-life insurance services in commercial presence .In Nepal there are no limitations on national treatment in all modes of supply except mode 4.
Additionally, there are also two aspects for making an analysis on the “Banking and other financial services (excluding insurance)” of FSS for these four selected SAARC member countries. First is the limitations on market access, where for Nepal, India, Pakistan and Sri Lanka, the first and second mode of supply are generally unbound except for the subsectors (k) and (l) which are related to the transfer of financial information, and financial data processing, software and advisory services – in the case for (k) Nepal, Pakistan and Sri Lanka have no limitations except for those “provided in the General Conditions” and for (l) Nepal and Sri Lanka have no limitations except for those “provided in the General Conditions”. In the case of the fourth mode of supply, there is also the condition of being "unbound" except for the condition as “indicated under the horizontal measures.” The greatest variation was in terms of the third mode of supply (i.e. commercial presence). While all sectors of commitments for India, Pakistan and Sri Lanka require that approval be taken from the relevant authorities and incorporation in the country, with significant equity participation generally around 50% (in some cases, 49% while in others 51%), there were some notable differences. For example, India limited the number of service providers to twelve and put a cap on the total assets foreigners in the banking system, but this was not the case in the other two countries. Further, for “Advisory and other auxiliary financial services” Pakistan diverges with India and Sri Lanka by allowing 100% subsidiary companies in commercial presence. In Nepal, the total foreign shareholding in any institution providing financial services is limited to 67% of the issued share capital. However, bank branches will be allowed for insurance services and wholesale banking as of 1 January 2010.
With respect to the limitations on national treatment all the selected SAARC countries except Nepal are generally unbound in the first two modes of supply except for “Advisory and other auxiliary services..” where the limitation for Sri Lanka in the first and second mode of supply is “None except those provided in the General Conditions.” Only Nepal has no limitations on the national treatment in modes 1,2 and 3. This shows Nepal's willingness to accord the same facilities to the foreign service suppliers if in the future Nepal decides to open up these service sectors. For the fourth mode of supply, it is either unconditionally unbound or unbound “except as indicated under the horizontal measures.” Just as in the prior paragraph, the third mode of supply has the largest variation. Nepal has made no limitations on the national treatment in the third mode whereas it is usually “Unbound” for other countries. While in India it is limited to proper establishment however, an interesting feature is the requirement that foreign banks constitute a “Local Advisory Board.” For Pakistan, this mode of supply is generally "unbound" except for some limitation such as on the transfer of shares as well as no limitations on both “Asset management..” and “Advisory and other auxiliary financial services..”. For Sri Lanka, this mode of supply is limited to the general conditions, which require approval of the relevant authorities and provide maximum of 49% of equity share.
Finally, the last subsection of FSS is “Others”. However, all four SAARC member states are "Unbound" in all the four modes of supply for both market access and national treatment.
The prior analysis is summarized in the table below:
Table 1
Comparative Review of FSS commitments for India, Nepal, Pakistan and Sri Lanka
Market Access National Treatment
Similarities A. Insurance Services: All four states have made some commitments in all the insurance sub sectors. India, Pakistan and Sri Lanka are “Unbound” in all four modes of supply of life and non-life insurance except for commercial presence in life insurance. Some other exceptions are India and Pakistan who are bound in cross border supply and commercial presence in reinsurance and retrocession.
A. Insurance Services: India, Sri Lanka and Pakistan are “Unbound” in all modes of supply with regard to life insurance, non-life insurance, and reinsurance and retrocession. In mode 3, Nepal and Sri Lanka have no limitations in the life, accident and health insurance services; and non-life insurance services.
B. Banking and Other Financial Services: All SAARC b t t t N l

Economic Integration in South Asia
108
B. Banking and Other Financial Services: All SAARC member states have made commitments in the twelve subsectors and are “Unbound” in modes 1 and 2 of supply except, in some cases, for commercial presence such as for India and Pakistan in financial leasing.
SAARC member states except Nepal are “Unbound” in all four modes of supply and require the approval of the respective authorities.
Differences A. Insurance Services: Nepal has made the most liberal commitments with "None" in modes 1 and 2 in life and Non-life insurance. The SAARC member states varied in terms of the degree and form of limitations for commercial presence. For example, Pakistan and Sri Lanka are bound with some commitments in commercial presence with regard to life and non-life insurance but not India etc.
B. Banking and Other Financial Services: In the service sub sector (k) and (l) Nepal and Sri Lanka are "None" in modes 1 and 2 whereas they are "Unbound" for India and Pakistan. All SAARC member states varied in terms of the degree and form of limitations for commercial presence. For example, India permits only through branch operations whereas Pakistan and Sri Lanka permit to open a new licensed bank under commercial presence etc.
A. Insurance Services: Nepal has no limitations on modes 1, 2 and 3 whereas all the remaining SAARC member states, except Sri Lanka on mode 3 in life and non-life insurance, are "Unbound". All countries varied in terms of the degree and form of limitations for commercial presence. For example, Sri Lanka has no commitment in Commercial presence for life insurance etc.
B. Banking and Other Financial Services: Nepal has "None" in modes 1, 2 and 3 in contrast to generally "Unbound" in other countries.
In sum, the similarities are in the restrictive limitations on the first and second mode of supply for India, Pakistan and Sri Lanka; with Nepal being a notable exception. The fourth mode of supply was likewise restrictive for all the identified member states, with some variation, which most likely reflects the different labor and immigration laws of the specific countries. A similarity can likewise be seen that the third mode of supply, commercial presence, has been the choice for commitment in liberalization. This liberalization tries to capture the benefits of foreign experience and expertise in the financial sector without having to go through the many difficulties of having volatile capital flows.52 Likewise, the differences are small compared to the similarities however they give important information about the country peculiarities.
AN OBSERVATION AND RECOMMENDATIONS The above quick critical review of SAARC member states has pointed to a salient observation that their WTO-FSS commitments are not similar. Specifically, there is clustering of WTO-FSS commitments by India, Pakistan and Sri Lanka, which were founding members of WTO. This is in sharp contrast with that of Nepal, a recent member of WTO, which had gone through the full accession process (WTO, 2004) and resulted in more liberal WTO-FSS commitments. It should be noted that these commitments by member states in the SA region, can possibly increase the probability of financial crisis in line with growing real integration. To limit this probability from those asymmetric WTO-FSS commitments and ensure maximum benefit, some recommendations are provided:
1) Coordinate regional commitments in FSS: There is an urgent need to coordinate the level of regional commitments by the different actors, both within each individual member states and across the region. For the prior, there has to be coordination between domestic stakeholders in FSS – specifically between insurance services and banking and other financial services. Likewise for the latter, there is the need to enhance the regional FSS coordination , it is felt that SAARC can play a
52 Kono and Schuknecht (2000) and Maskay (2002).

Economic Integration in South Asia
109
pivotal role. This will also help the region to devise the common strategy in the future negotiations with WTO-FSS, to serve the best interest of the people in this region.
2) Harmonize regional supervision of FSS: There is a critical need to harmonize the regulatory and supervisory aspects of the regional financial services. Besides these, necessary rules and regulations for the financial services sector must be placed forward. This requires adherence to a number of core principles, reflected in the so-called “Basel principles”, and encouragement of information disclosure. In addition, to the prudential regulation, it is essential that there should be a sound mechanism of inspection and supervision for the increasing number of financial institutions which also require development of professional manpower and implementation of necessary technology especially with increasing use of Internet, e.g. E-commerce. With their appropriate implementation, these measures could help to limit the probability of instability in the financial market and, moreover, will be instrumental for effective cushion in case of financial crisis. It is important to note that the pace with which this takes place must necessarily be coordinated with the opening of the FSS.
3) Enhance the strength of regional FSS – In order to insulate the financial sectors from the external shocks, the member states need to enhance the strength their domestic FSS through various reform measures. This may necessitate an immediate attention consisting of the improvement in legislation, introduction of new and appropriate technology, infusion of professional human resources through education and training and development of appropriate organizational structure. It is likewise felt that this aspect is urgently needed for Nepal, in light of the liberal WTO-FSS commitments and the embryonic nature of the domestic financial markets.
SUMMARY AND CONCLUSION The broader necessity for successful FSS liberalization is to put forward a stable and conducive financial environment in this region. A market friendly atmosphere together with building up of the basic infrastructure with necessary coordination of regulator and supervisory authorities is essential for the efficient functioning of the financial system in an economically integrating region. In this regard, the paper has put forward three recommendations namely: (1) regional coordination of FSS commitments; (2) harmonization of regional FSS supervision; and (3) enhancement of the strength of regional FSS. It is felt that the above recommendations provide some necessary steps in this direction.
However, it should be noted that those mentioned recommendations can be described as being of an immediate, short-term, nature; there is necessity of having a long-term vision for the region, which may be incorporated within the broader framework of SAARC. It is felt that a common “roadmap” would ensure goal-oriented motivation to the above-mentioned recommendations. Further, in developing this roadmap, the analysis also suggests that it would be in the interest of SAARC member states to proactively assist Bhutan in the accession in WTO, possibly through SAARC, and advise her for making appropriate FSS commitments, i.e. those which do not put unnecessary pressure on the FSS of fellow regional member states.
At this point, a touch of reality is interjected via a general observation, that is true for all nations - developing the optimal strategy, as indicated above, may be the less difficult portion; the more difficult portion may be the implementation of the “roadmap” with painful economic costs and likely negative political repercussions. However, the appropriate and timely implementation of the “roadmap” is essential for providing a stable financial environment to maximize the net benefits of WTO membership. In conclusion, responsibility and reward is fully on the region to reap the maximum benefits of WTO membership.
REFERENCES International Monetary Fund. Annual Report 2001. Washington DC: (2001).
International Monetary Fund. “World Trade Organization Selected Activities, January 2000 to Present, and Some Current Considerations.” SM/01/128. (April 25, 2001).
Kono, Masamichi and Ludger Schuknecht. “How Does Financial Services Trade Affect Capital Flows and Financial Stability.” In Stijn Claessens and Marion Janson (eds.), The Internationalization of

Economic Integration in South Asia
110
Financial Services: Issues and Lessons for Developing Countries. London: Kluwer Law International. (2000).
Kono, Masamichi, Patrick Low, Mukela Luanga, Aaditya Mattoo, Maika Oshikawa and Ludger Schuknecht. “Opening Markets in Financial Services and the Role of the GATS.” World Trade Organization Special Studies. (September 1997).
Maskay, Nephil Matangi. “Patterns of Shocks and Regional Monetary Cooperation in South Asia”. IMF Working Paper (2003) WP/03/240.
____. “A Short Note on the Distinction Between Financial Service Sector Liberalization and Liberalization of the Capital Account.” Nepal Rastra Bank Samachar. 14 Baishak 2059 pp. 30 – 35.
Mattoo, Aaditya and Arvind Subramanian. “The WTO and the Poorest Countries: The Stark Reality.” IMF Working Paper. WP/04/81. (2004).
Nepal Rastra Bank. 40 Years of Nepal Rastra Bank (1956 – 1996). Nepal: Nepal Rastra Bank. (1996).
Nepal Rastra Bank, International Finance Division, Research Department. “A Comparative Review of Financial Services Sector Commitments in the Selected SAARC Member Countries: Relevant Experiences for Nepal’s Accession into WTO”. Economic Review: Occasional Paper. April 2002, No. 14. 37 – 54.
Rose, Andrew K. “Do We Really Know That the WTO Increases Trade?” American Economic Review. Vol. 94, Number 1 (2004) pp. 98 – 114.
SAARC. “Report of the SAARC Group of Eminent Persons.” (1997/1998).
———, 1997/1998, “SAARC Vision Beyond the Year 2000: Report of the SAARC Group of Eminent Persons.”
———, 6 January 2002, “Declaration of the 11th Summit in Kathmandu, Nepal.”.
———, 6 January 2004, “Declaration of the 12th Summit in Islamabad, Pakistan.”.
Srestha, Ananda P. (ed.). WTO, Globalization and Nepal. Nepal: Nepal Foundation for Advanced Studies and United States Embassy, Kathmandu. (2001).
Wickramasinghe, Upali. “Services Trade as a ‘New Frontier’ in South Asia: Is the Optimism Warranted?” South Asia Economic Journal. Vol. 1, No. 2 (September 2000) 1 – 23.
World Trade Organization. WTO homepage. http://www.wto.org
____. “The future of the WTO: Addressing institutional challenges in the new millennium”. WTO home page.
____. “Report of the Working Party on the Accession of the Kingdom of Nepal to the World Trade Organization: Addendum – Part II – Schedule of Specific Commitments in Services List of Article II MFN Exemptions”. WT/ACC/NPL/16/Add.2. (28 August 2003 c)
____. “WTO membership rises to 147”. WTO News: 2004 Press Release / 356. (23 April 2004).
____. Annual Report 2001. Geneva: World Trade Organization. (2001).
____. Trading Into the Future. 2nd Edition. Geneva: World Trade Organization. (February 1998).
____. “India Schedule of Specific Commitments Supplement 3”. GATS/SC/42/Suppl.4. (26 February 1998).
____. “Pakistan Schedule of Specific Commitments Supplement 3”. GATS/SC/67/Suppl.3. (26 February 1998).
____. “Sri Lanka Schedule of Specific Commitments Supplement 3”. GATS/SC/79/Suppl.12. (26 February 1998).
____. “Financial Services: Background Note by the Secretariat.” S/C/W/72. (2 December 1998).

Economic Integration in South Asia
111
____. “Accession to the World Trade Organization: Information to be Provided on Policy Measures Affecting Trade in Services; Technical Note by the Secretariat.” WT/ACC/5. (31 October 1996).
____. “General Agreement on Trade in Services: Annex 1B.” (1995).

Economic Integration in South Asia
112
SAPTA, SAFTA and Beyond
Hem Prasad Neupane∗
s a part of world wide wave of setting up regional organizations to achieve economic growth and thereby reducing regional poverty through collective efforts and mutual cooperation, 7 South
Asian countries reached on agreement to do so. Accordingly, Bangladesh, Bhutan, India, Maldives, Nepal, Pakistan and Sri Lanka signed to establish South Asian Association of Regional Cooperation (SAARC) on December 8, 1985. Preferential trading arrangement was felt necessary to achieve the broad objective of SAARC by enhancing trade and investment in the region.
SOUTH ASIAN PREFERENTIAL TRADING AGREEMENT South Asian Preferential Trading Agreement(SAPTA) is an agreement on trade of the SAARC member countries which provides each other the preferential treatment to reduce import tariffs on preferential items. Member countries agreed to identify the feasible economic cooperation in the region in the fourth summit held in Islamabad. In view to expand intra-regional trade and investment, finally, the agreement was signed on April 11, 1993 and came into force on December 7, 1995.
The SAPTA has following broad objectives:
• to promote and sustain mutual trade and economic cooperation through exchanging concessions,
• to stimulate national economies by expanding investment and production for the greater opportunities of employment and help securing higher living standards of the people, and
• to liberalize the trade in the region to share the benefits of the expansion of the trade equitably.
PRINCIPLES The agreement is based on the principles of overall reciprocity and mutuality and advantages in a way to share the benefits equitably taking into account of the level of economic and industrial development. Negotiations of the agreement is based on step by step, improved and extended in each successive stages with the periodic reviews. The agreement includes all the products, manufactures and commodities in their raw, semi- processed and processed forms.
COMPONENTS SAPTA consist of the arrangements relating to:
• tariffs: customs duties included in the national tariff schedules
• para-tariffs: border charges and fees on foreign trade transactions which are levied on imports but not those indirect taxes and charges
• non-tariff measures: regulation or practice other than tariffs and para-tariffs to restrict imports
• direct trade measures: measures which are helpful to promote mutual trade in long and medium-term contracts containing import and supply commitments like buy-back arrangements, state trading operations and government and public procurement.
∗ Assistant Director, Research Department, NRB Remarks: I would like to thanks Mr. Rajendra Pandit for providing precious comments.
A

Economic Integration in South Asia
113
NEGOTIATIONS Following are some methods of negotiations for trade liberalization:
• product-by product basis: to promote trade by reducing tariff by negotiation
• across the board tariff reduction: promoting trade through reducing the tariff equally all the products
• sectoral basis: reduction of tariff, non-tariff and para-tariff barriers for specified products
• direct trade measures
SCHEDULES OF CONCESSIONS The tariff, para-tariff concessions negotiated in the agreement can be incorporated in the national schedules of concessions. The concessions agreed by the member states at different round of negotiations are as follows:
Table 1
Trade Negotiations Under SAPTA
Number of products on which tariff concessions have been extended by SAARC member states in three rounds of trade negotiations under SAPTA
First Round
Second Round
Third Round
Grand Total Countries
For LDCs
For All
Total For LDCs
For All Total For LDCs
For All
Total
Bangladesh 1 11 12 11 25 226 143 338 481 719
Bhutan 7 4 11 10 37 47 101 23 124 182
India 62 44 106 514 390 904 1874 43 1917 2927
Maldives 17 17 3 2 5 368 368 390
Nepal 4 10 14 67 166 233 137 52 189 436
Pakistan 15 20 35 131 227 358 271 24 295 688
Sri Lanka 11 20 31 23 72 95 54 28 82 208
Total 100 126 226 759 1109 1868 2580 876 3456 5550
Source: www.ris.org.in/IN-Mukherjee, "Towards a Free Trade Area in South Asia"
Depth of Tariff Concessions agreed by the SAARC member states in the three rounds of negotiations under SAPTA
Table 2
Tariff Concessions at Different Rounds (in percent) First round Second Round Third Round Countries
For LDCs For All For LDCs For All For LDCs For All
Bangladesh 10 10 10 10 10,15 10
Bhutan 10, 13, 15 15 15 10 10, 18, 20 10
India 50, 100 10,25, 30, 50, 90 25, 30 10, 15, 25, 40 50-100 10, 20
Maldives 7.5 7.5 15 10 5, 10 5, 10
Nepal 10 10 15 10 10, 15 10
Pakistan 15 10 15 10 30 20
Sri Lanka 10, 15 10, 20 10, 50, 60 10 10, 30, 50 10
Source: www.ris.org.in/IN-Mukherjee, "Towards a Free Trade Area in South Asia"

Economic Integration in South Asia
114
PROVISIONS FOR THE LEAST DEVELOPED COUNTRIES Following are some provisions for the least developed countries which give them special and favorable treatment:
(a) duty-free access, exclusive tariff preferences or deeper tariff preferences for the export products,
(b) removal of non-tariff barriers,
(c) removal of para-tariff barriers,
(d) negotiations of long-term contracts to achieve reasonable levels of sustainable exports of their products,
(e) special consideration of exports from LDCs in the application of safeguard measures, and
(f) flexibility in introduction and continuation of quantitative or other restrictions in critical conditions.
SOME MEASURES The agreement has provided enough room for member countries to adopt measures to boost trade as well as protect their economy from any adverse effect.
Communication, Transport and Transit The member countries agreed to undertake appropriate steps and measures for developing and improving communication system, transport infrastructures, and transit facilities to accelerate the growth of trade within the region.
Balance of Payments Measures The agreement has the provision of suspending the concessions if any member country encounter with serious economic problems including balance of payments. But, she has to notify the suspension of such concession to the contracting states and the committee. There are adequate rooms for consultations to the contracting parties to preserve the stability of the concessions. The committee of Participants, consisting of representatives of member countries, could review the matter if the matter does not settle for 90 days.
Safeguard Measures There is a provision in the agreement to suspend the concessions provisionally with prior consultations, if a product cause or threaten to cause serious injury (it means significant damage to domestic producers, or like or similar products resulting from a substantial increase of preferential imports in situations which cause substantial losses in terms of earnings, production or employment unsustainable in the short term) in the importing state. The member state should also notify the other contracting states and the committee about the action. The contracting states should reach to the mutually acceptable agreement to resolve the situation otherwise the committee of participants shall review the issue. It has provided right to withdraw equivalent concessions or obligations to the affected parties if the committee fails to resolve the issue within 60 days of its notification.
RULES OF ORIGIN The products are included at the national schedules of concessions if they satisfy the rules of origin including special rules of origin in respect of the least contracting states. Such products shall be eligible for preferential concessions if they conform the origin requirement under any of the following conditions:
a) Wholly produced or obtained:
• raw or mineral products extracted from its soil, its water or seabed
• agricultural products harvested there

Economic Integration in South Asia
115
• animals born and raised there
• products obtained from there
• products obtained by hunting or fishing there
• products of sea fishing and other marine products taken from the high seas (3/4 ownership of the country)
• products processed and or made on boards its factory ships (4/5 ownership)
• used articles collected there as raw materials
• waste and scrap resulting manufacturing operations
b) Not wholly produced or obtained
• the products having not more than 50 percent of f.o.b. value originated in non-contracting states and the final process of manufacture is performed within the territory of the exporting country
• sectoral agreements (special criteria can be made)
MODIFICATION AND WITHDRAWAL OF CONCESSIONS There is a provision to modify or withdraw any concessions provided after a period of three years from the day of concession extended in the agreement. Some procedures have been mentioned as follows:
• Any contracting countries which intend to modify or withdraw any concessions should notify the committee ( a committee of participants consisting of representatives of member countries)
• The contracting country which intends to modify or withdraw the concessions should enter into consultation and negotiation
• If the contracting countries could not reach into any agreement within 6 months of the receipt of the notification, the affected party can withdraw or modify equivalent concessions
WITHDRAWAL FROM SAPTA Article 21 of the agreement provides the right to the member countries to withdraw from SAPTA. Such withdrawal shall be effective after six months from the day on which written notice is received by the SAARC Secretariat.
CERTIFICATE OF ORIGIN Products to be eligible for preferential concessions shall be supported by a certificate of origin issued by an authorized agency of the government of the exporting country. The notification should be done by following a prescribed procedure.
SOUTH ASIAN FREE TRADE AGREEMENT (SAFTA) SAARC countries, since an early stage of discussions, have included the idea of eventually going beyond the exchange of trade preferences in a preferential trade area, abolition of intra-regional trade restrictions and tariffs, thereby creating a South Asian Free Trade Area (SAFTA). During the first meeting of Council of Ministers in 1995, the issue was materialized deciding to form SAFTA by the year 2001, but not later than 2005. Preparation was jointly made by the SAARC Council for Economic Cooperation (CEC) and the Inter-Governmental Expert Group (IGEP) to formulate an action plan and terms of reference of SAFTA. After the several round meetings the member countries signed in a free trade agreement on January 6, 2004, at the Twelfth SAARC Summit held in Islamabad. The agreement will come into effect from January 1, 2006..

Economic Integration in South Asia
116
OBJECTIVES AND PRINCIPLES OF THE AGREEMENT Objectives of the agreement are to promote and enhance mutual trade and economic cooperation among member countries. Objectives and the principles of the agreement which are explicitly given in the Article-3 are as follows:
a) eliminating barriers in trade and facilitating to cross-border movement of goods between the territories of the contracting states;
b) promoting conditions of fair competition in the free trade area, and ensuring equitable benefits to all contracting states, taking into account their respective levels and pattern of economic development;
c) creating effective mechanism for the implementation and application of the agreement for its joint administration and the resolution of disputes; and
d) establishing a framework for further regional cooperation to expand and enhance the mutual benefits of the agreement.
The agreement is governed by the following principles:
a) The SAFTA is governed by the provisions of this agreement and also by rules, regulations, decisions, understandings and protocols to be agreed upon within its framework by the contracting states;
b) The contracting states affirm their existing rights and obligations with respect to each other under Marrakesh Agreement establishing the world trade organization and other treaties/agreements to which such contracting states are signatories;
c) It is based and applied on the principles of overall reciprocity and mutuality of advantages;
d) The agreement involves the free movement of goods, between countries through the elimination of tariffs, para-tariffs and non-tariff restrictions on the movement of goods, and any other equivalent measures;
e) The agreement entail the adoption of trade facilitation and other measures, and the progressive harmonization of legislation in the relevant areas;
f) The special needs of the least developed member countries is clearly recognized by adopting concrete preferential measures in their favor on a non-reciprocal basis.
INSTRUMENTS OF THE SAFTA AGREEMENT The agreement is being implemented through the following instruments:
1. Trade Liberalization Program:
Following are the tariff reduction schedule as agreed by the contracting member states (Article -7):
a) In the first phase, the non-LDC members (India, Pakistan and Sri Lanka) will reduce their maximum tariff rates to 20 percent within a time of two years. While LDC members (Bangladesh, Bhutan, Maldives and Nepal) will reduce their maximum tariff rates to 30 percent within the same time frame.
b) In the second phase which starts from January 1, 2008, the import tariff will be reduced to the 0 to 5 percent by the non-LDC members within 5 years while LDC members will do the same within 8 years (Table 3).

Economic Integration in South Asia
117
Table 3 Planned phased Tariff Cuts on Intra-SAFTA Trade
First Phase (two years)/A Second Phase /A (maximum 8
years) SAARC Countries: January 1, 2006– January
1, 2008 January 1, 2008– January 1, 2013
For LDCs: (Bangladesh, Bhutan, Nepal, Maldives)
Reduce maximum tariff to 20%
Reduce tariff to the 0–5%
For non-LDCs (India, Pakistan, Sri Lanka)
Reduce maximum tariff rate of 20%
Reduce tariff to the 0–5% Reduce tariff to the 0–5% for products of the LDCs within a timeframe of 3 years
A = These phased tariff cuts for intra-SAFTA trade may not apply to items on each country's 'Sensitive Lists'. Each contracting states should notify the SAARC Secretariat all non-tariff and para-tariff measures of their trade annually. These notifications would be reviewed by the committee of experts for its consistency with the WTO provisions. Besides this, member countries are bound to eliminate all quantitative restrictions, except permitted under GATT 1994 provisions.
2. Rules of Origin
It shall be negotiated and incorporated by the contracting states as an integral part.
3. Institutional Arrangements
SAFTA Ministerial Council (SMC) consists of Ministers of Commerce/Trade is the apex decision-making body. This Council is responsible for the administration and implementation of the agreement and its decisions and arrangements within legal framework. The SMC meets at least once every year and each contracting state shall chair the SMC for a period of one year on rotational basis in alphabetical order. The SMC will be supported by a committee of experts (COE) nominated form each contracting states having expertise in trade. The COE will also act as Dispute Settlement Body and meets at least once every six months. The SMC and COE adopt their own rules and procedures for their operations.
4. Consultations and Dispute Settlement Procedure
For the smooth operation of the agreement, it has provided adequate opportunity for consultations to all contracting states. Any dispute between or among the contracting states regarding the interpretations and application of the provisions and instrument adopted will be amicably settled through bilateral consultations. It has given priority in consultations with the concerned parties. If they fail to settle such dispute, COE looks the matter following its own procedures. The COE is aided by specialists who are not party to the dispute.
5. Safeguard Measures
There is a provision in the agreement to suspend the concessions provisionally with prior consultations, if a product cause or threaten to cause serious injury (means a significant impairment of the domestic industry of like or directly competitive products due to a surge in preferential imports causing substantial losses in terms of earnings, production or employment unsustainable in the short term) to the importing country. Prior to such action, an investigation and examination of the affected economy would be held by the competent authorities with the help of other relevant economic factors and indices and their causal relationships. Investigation procedures for restoring to safeguard measures must be consistent with Article XIX of GATT 1994 and WTO agreement on safeguards. This measure is not applicable to the products originating in LDC country as long as its share of imports of the product concerned in the importing member country does not exceed 5 percent, provided Least Developed member country with less than 5% import share collectively account for not more than 15% of total imports of the product concerned.

Economic Integration in South Asia
118
BALANCE OF PAYMENTS MEASURES The agreement has provisions of suspending the concessions if member country has serious balance of payments difficulties. But, she has to notify the action immediately to the COE. The COE periodically reviews the measures taken. It has provided enough places to have consultations with the affected parties. The measure would be phased out after the COE concludes that the balance of payments situation has improved.
ADDITIONAL MEASURES Apart from the trade liberalization program the agreement has other additional measures for trade facilitation and to support the mutual benefit. The followings are some measures:
a) Harmonization, of standards, reciprocal recognition, of tests and accreditation of testing laboratories of member countries and certification of products;
b) Simplification and harmonization of customs clearance procedure;
c) Harmonization of national customs classification based on HS coding system;
d) Customs cooperation to resolve dispute at customs entry points;
e) Simplification and harmonization of import licensing and registration procedures;
f) Simplification of banking procedures for import financing;
g) Transit facilities for efficient intra-SAARC trade, especially for the land-locked member countries;
h) Removal of barriers to intra-SAARC investments;
i) Macroeconomic consultations;
j) Rules for fair competition and the promotion of venture capital;
k) Development of communication systems and transport infrastructure;
l) Making exceptions to their foreign exchange restrictions, relating to payments to products under the SAFTA scheme as well as repatriation of such payments without prejudice to their rights under Article XVIII of the GATT and relevant provisions of Articles of Treaty of the International Monetary Fund; and
m) Simplification of procedures for business visas.
Special and Differential Treatment for the Least Developed Member Countries There is provision to provide special and more favorable treatment to the least developed member countries.
a) Least Developed member countries would get special regard in the application of anti-dumping and/or countervailing measures.
b) Greater flexibility in continuation of quantitative or other restrictions provisionally and without discrimination in critical circumstances by LDCs on imports from other contracting countries.
c) Member countries shall consider while taking direct trade measures with a view to enhancing sustainable exports from LDCs such as long and medium-term contracts containing import and supply commitments in respect of specific products, buy-back arrangements, state trading operations, and government and public procurement.
d) Special considerations shall be given to LDCs upon their requests or technical assistance and cooperation arrangements designed to assist them in expanding their trade with other member countries in getting potential benefits from SAFTA.
Economic Integration in South Asia
119
e) After full implementation of the agreement, member LDCs would loss of customs revenue. An appropriate mechanism has been devised so as to compensate their loss of revenue until alternative domestic arrangements are formulated. Such mechanism and rules and regulations shall be established prior to the implementation of the Trade Liberalization Program (TLP).
COMPONENTS SAFTA consists of arrangements relating to the following measures:
a) Tariffs: customs duties included in the national tariff schedules
b) Para-tariffs: border charges and fees, other than tariffs, on foreign trade transactions of a tariff-like effect which are levied solely on imports, but not those indirect taxes and charges, which are levied in the same manner like domestic products.
c) Non-tariff measures: any measure, regulation, or practice, other than tariffs and para-tariffs.
d) Direct trade measures: measures conducive to promoting mutual trade of member countries such as long and medium-term contracts containing import and supply commitments in respect of specific products, buy-back arrangements, state trading operations, government and public procurement.
AMENDMENTS AND WITHDRAWAL Member countries can amend the provisions by consensus of the member countries. Member countries have right to withdraw from this agreement. Such action may be effective on expiry of six months from the date on which a written notice thereof is received by the Secretary-General of SAARC. This action should be notified to the COE simultaneously.
FUTURE COURSE OF ECONOMIC COOPERATION SAARC region contains one-third of the total world population and two-thirds of the world's poor. The region shares some common features: high population growth, low per capita income, high unemployment and illiteracy, poor economic infrastructures, untapped resources, etc. the list goes long. These countries have common goal of transforming their agro-based industry to industrial economy and better quality of life. The 24th Session of the SAARC Council of Ministers held in Islamabad during January 2-3, 2004 recommended SAARCFINANCE (a body of SAARC comprising central bank governors and finance secretaries of the member countries) to examine the concept of a South Asian Development Bank (SADB) and to study and make recommendations on early and eventual realization of a South Asian Economic Union (SAEU). An attempt has been made to elaborate the rationale of such institutions:
South Asian Development Bank (SADB) South Asia shares the common problems as mentioned above and it has untapped resources due to lack of capital and appropriate technology. This decade witnessed decreasing official development assistance (ODA) but increased investment demand for infrastructure and private business investment. South Asia is a late starter to consider establishing such development bank where as other region have already established regional development banks and are successfully operating. Some of the examples are: Asian Development Bank (ADB) established in 1966 in Asia, North American Development Bank (NADB) in 1993, African Development Bank (AfDB) in 1966. All these development banks have achieved considerable success since their inception.
The proposed SADB will facilitate and mobilize the external and internal resources, public and private funds, promote investment and provide technical assistance and policy advices to member countries and development institutions working in this region. The proposed non-profit making organization would be responsible for promoting public and private investment in the SAARC region and would benefits the clients by proving financial resources at competitive rates. Interest rates would be guided by the bank's cost of fund and a reasonable margin to cover up administrative expenses which will be catalyst in development activities providing low cost of fund to the entrepreneurs.
Economic Integration in South Asia
120
South Asian Economic Union (SAEU) Signing of SAFTA agreement has opened a new possibility for SAARC member countries marching towards close economic integration. An economic integration process passes through various stages. South Asia has already entered into a first stage of integration continuum. The stage would be South Asian Custom Union (SACU) where common tariffs and quotas are set up for trade with non-members. In Common Market, non-tariff barriers to trade (products and services markets integration) as well as restrictions on factor movement (factor market integration) would be abolished. In an economic union, social and economic policies are to be harmonized to a greater extent. Both the goods and financial markets integration is essential for the smooth functioning of the economic integration.
This century witnessed growth FTAs which work as a root cause to realize such arrangements to other regions. Some of the successful FTAs and economic unions are: European Union (EU), North American Free Trade Area (NAFTA), ASEAN Free Trade Area (AFTA), Closure Economic Cooperation (CER), MERCOSUR, etc. SAARC since its inception has been formalizing various bodies and agreements for more liberal trade and investments regimes. Previous efforts have been found to be less effective in order to achieve the common goals. In this backdrop, the 24th Session of the SAARC Council of Ministers held in Islamabad during January 2-3,2004 recommended SAARCFINANCE to study and make recommendations on early and eventual realization of SAEU. Strengths of the economic union can be summarized as follows:
a) A Common currency would reduce economic uncertainty caused by exchange rate fluctuations.
b) Business sector would be fostered because of the lower cost and less currency risk.
c) Monetary unification decreases transaction cost and risk of foreign exchanges which would in turn help flow more capital into the region in the form of investment and trade.
d) Substantial mobility of labor, flexible local markets for goods and labors, flexibility in resource mobilization would expand the economies.
e) Economic union helps to increase formal trade and reduce informal trade. Likewise, it also helps to maintain price stability by restraining excessive monetary spending. No currency union has experienced a hyperinflation. This would also reduces the need for foreign exchange reserve for intra-regional trade.
SELECTED REFERENCES Trade Policies in South Asia: An Overview, September 7, 2004, The World Bank
The SAPTA Agreement, SAARC Secretariat, Kathmandu
The SAFTA Agreement, SAARC Secretariat, Kathmandu
Concept Paper on South Asian Development Bank (SADB) Prepared by Nepal Rastra Bank, Research Department
Concept Paper on South Asian Economic Union (SAEU) Prepared by Nepal Rastra Bank, Research Departement
Gupta, Ansuman, SAARC: SAPTA to SAFTA, Dew Delhi
Regional Economic Cooperation, Initiatives Within SAARC Region, SAARC Secretariat
Pitigala, Nihal, "Whar Does Regional Trade in South Asia Reveal about Future Trade Integration? Some Evidence, World Bank Policy Research Working Paper 3497, February 2005
www.ris.org.in/IN-Mukherjee,"Towards a Free Trade Area in South Asia"


