HENRY J. AARON The BrookingsInstitution BARRY P. BOSWORTH The Brookings Institution Economic Issues in Reformof Health Care Financing As THE DEBATE ON HEALTH CARE REFORM shifts fromdiagnoses of the ills of the current systemto debate on a legislativecure, analysts aretempted also to turntheirattention from broad analysisof systemicflaws to close examination of the details of individual plans. In so doing, they risk neglecting generic issues that any plan must confront. Rather thanfocus on specificaspectsof President Clinton's or any other particular plan, we examinea number of issues thatmost reforms raise. We begin with a brief review of the current system and the various ways to achieveuniversal coverage.Achievingnear universal coverage is technicallyeasy. It will have little effect on aggregate employment or output, inflation, or the balance of trade. Covering the added federal budget costs of universal coveragewill provedifficult, however.We then turnto the most disruptive aspect of health reform, the proposedshift fromexperience rating to community rating.For particular industries this conversion will cause sizablechangesin moneywages, employment, and prices andmay resultin transitory international competitive advantages or disadvantages. Finally, we pointout thatcommunity rating is compatible with competinginsurance plans only if methodsof payment can be de- signed that make "cream-skimming" unattractive. Groupsat financial risk for providing care practicecream-skimming to avoid high-costpa- tients. Risk adjustment formulasexist and are intended to remove the profitability of such practices by adjusting payments basedon risk. How- ever, existingformulas arenot adequate andsufficient improvements may proveimpracticable. 249
Transcript
HENRY J. AARON The Brookings Institution
BARRY P. BOSWORTH The Brookings Institution
Economic Issues in Reform of Health Care Financing
As THE DEBATE ON HEALTH CARE REFORM shifts from diagnoses of the ills of the current system to debate on a legislative cure, analysts are tempted also to turn their attention from broad analysis of systemic flaws to close examination of the details of individual plans. In so doing, they risk neglecting generic issues that any plan must confront. Rather than focus on specific aspects of President Clinton's or any other particular plan, we examine a number of issues that most reforms raise.
We begin with a brief review of the current system and the various ways to achieve universal coverage. Achieving near universal coverage is technically easy. It will have little effect on aggregate employment or output, inflation, or the balance of trade. Covering the added federal budget costs of universal coverage will prove difficult, however. We then turn to the most disruptive aspect of health reform, the proposed shift from experience rating to community rating. For particular industries this conversion will cause sizable changes in money wages, employment, and prices and may result in transitory international competitive advantages or disadvantages. Finally, we point out that community rating is compatible with competing insurance plans only if methods of payment can be de- signed that make "cream-skimming" unattractive. Groups at financial risk for providing care practice cream-skimming to avoid high-cost pa- tients. Risk adjustment formulas exist and are intended to remove the profitability of such practices by adjusting payments based on risk. How- ever, existing formulas are not adequate and sufficient improvements may prove impracticable.
249
250 Brookings Papers: Microeconomics 1994
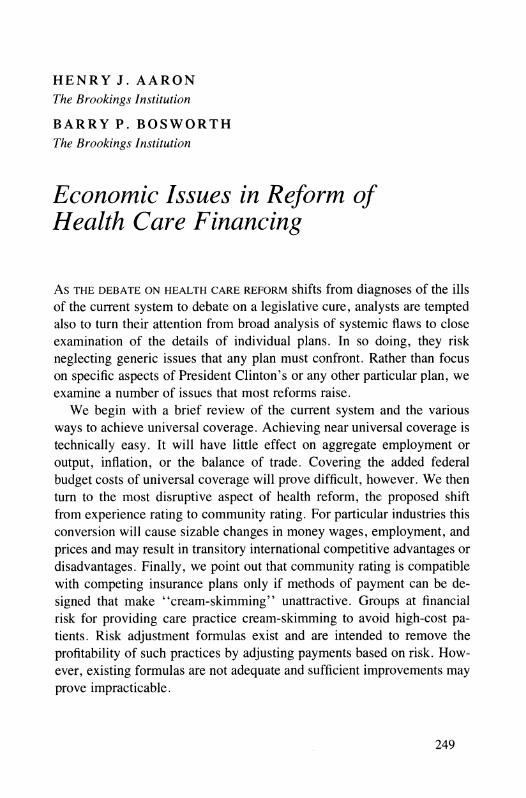
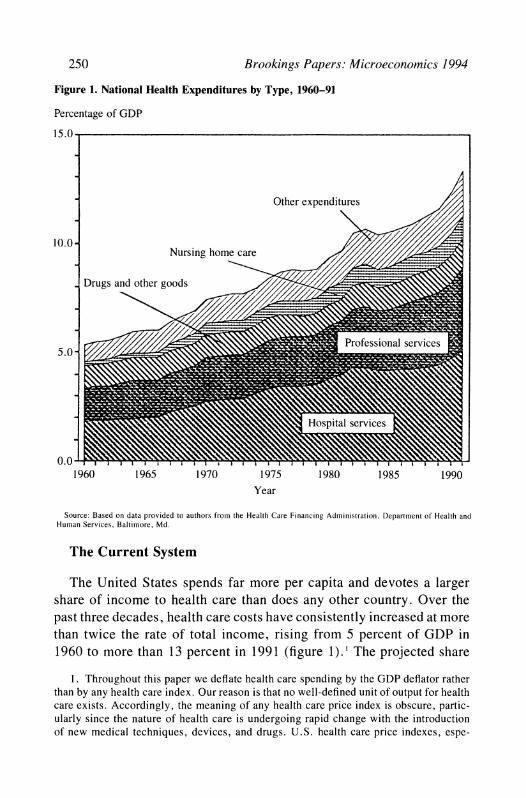
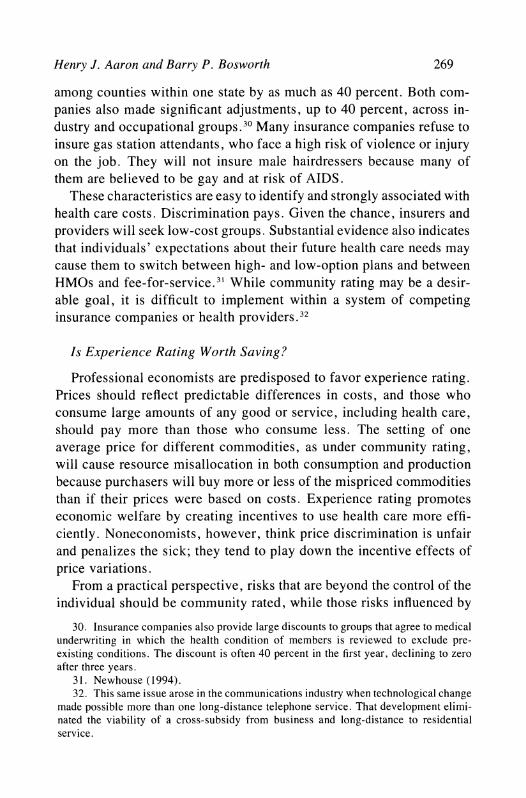
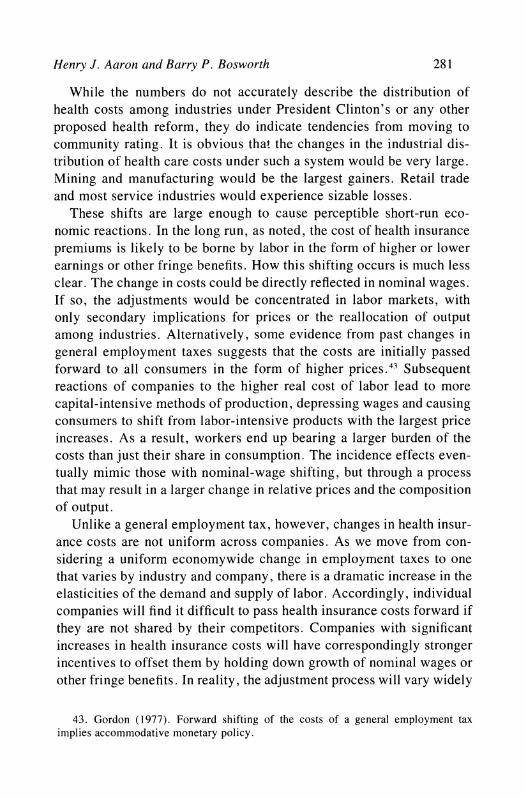
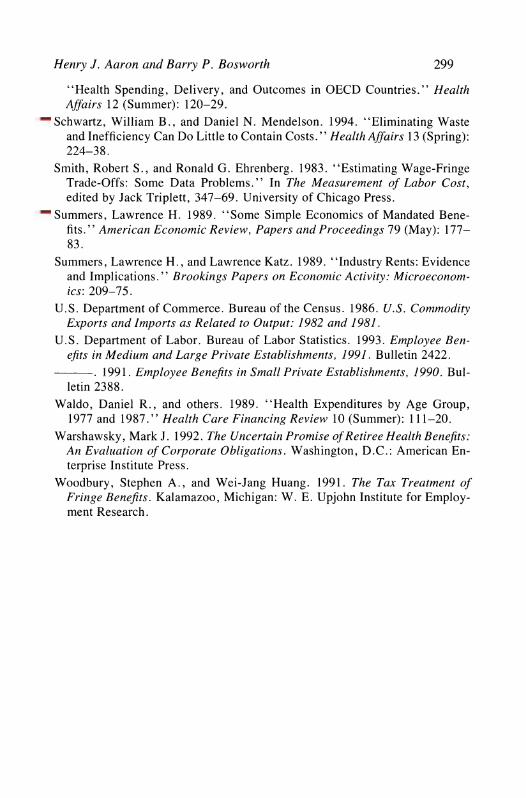
Figure 1. National Health Expenditures by Type, 1960-91
Percentage of GDP
15.0
Other expenditures
10.0- Nursing home care /
Drugs and other goods
.~ ~ ~~~7
Professional services 5.0 /
Hospital services
0.0 1960 1965 1970 1975 1980 1985 1990
Year
Source: Based on data provided to authors from the Health Care Financing Administration, Department of Health and Human Services, Baltimore, Md.
The Current System
The United States spends far more per capita and devotes a larger share of income to health care than does any other country. Over the past three decades, health care costs have consistently increased at more than twice the rate of total income, rising from 5 percent of GDP in 1960 to more than 13 percent in 1991 (figure 1). The projected share
1. Throughout this paper we deflate health care spending by the GDP deflator rather than by any health care index. Our reason is that no well-defined unit of output for health care exists. Accordingly, the meaning of any health care price index is obscure, partic- ularly since the nature of health care is undergoing rapid change with the introduction of new medical techniques, devices, and drugs. U.S. health care price indexes, espe-
Henry J. Aaron and Barry P. Bosworth 251
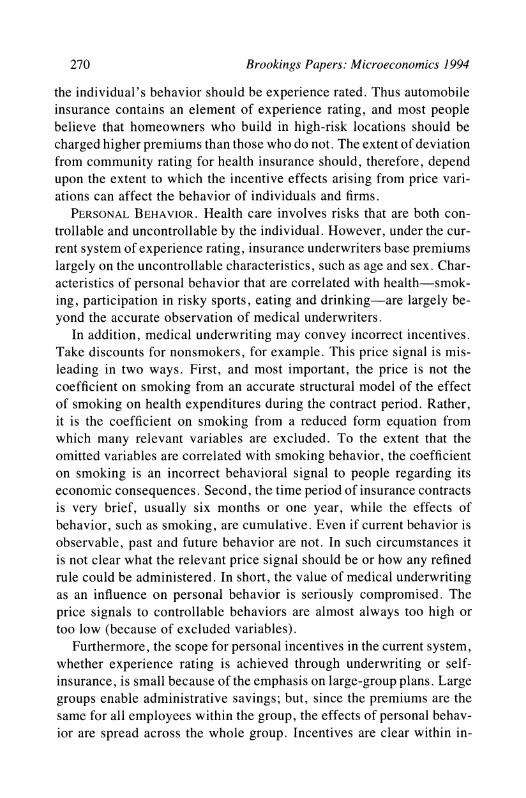
Table 1. Sources of Insurance Coverage, 1992
Persons Category (in millions) Percent
All persons 251.4 100.0 Uninsured 35.4 14.1 Insured 216.0 85.9
Sources of insurance, Employer coverage 139.9 55.7
Multiple insurance coverage 35.2 14.0 Source: Based on data provided to authors from Lewin-VHI, Inc. a. Includes persons with multiple coverage.
of GDP in 1993 was 14 percent.2 The two largest components, hospital charges and professional services (mostly physician fees), rose at about the same rate. The proportion of each medical care dollar devoted to drugs and other goods fell, but that devoted to nursing home care rose. The residual category includes program administration, research, and construction costs. We return to the causes of the cost increases in a later section.
The U.S. system for financing health care is unusually complex, combining elements of government insurance for the elderly and about half of the poor with employment-based insurance for most privately financed health care (table 1). Employment-related group plans cover 140 million people, slightly more than half of the population. Another 10 million retirees receive insurance coverage through a prior employer. Medicare and medicaid cover another 60 million, and 10 million receive military benefits. About 12 percent of the population, 31 million, pur- chase insurance outside of any group plan. Another 14 percent of the population lack any form of health insurance.
The financing of health care has changed in important ways over the
cially the widely cited monthly consumer price index for health, contain many additional characteristics that make them essentially worthless as guides to medical prices. See Newhouse (1989) and Aaron (1991).
2. Congressional Budget Office (1993b, p. 3).
252 Brookings Papers: Microeconomics 1994
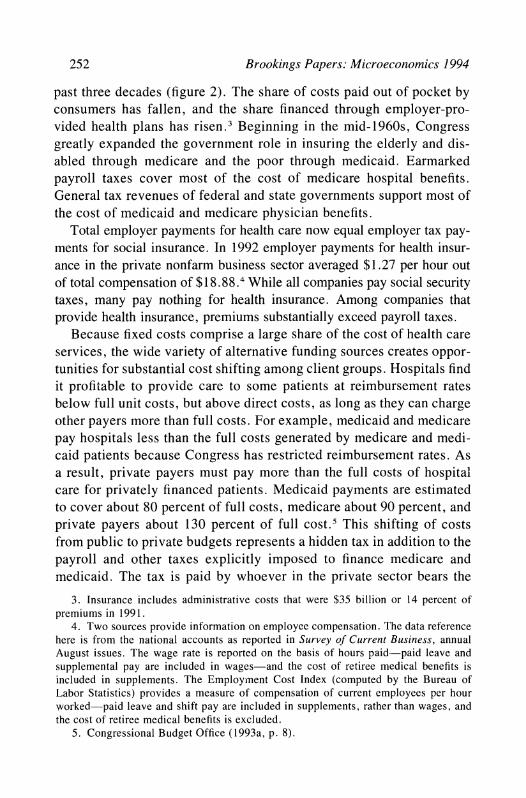
past three decades (figure 2). The share of costs paid out of pocket by consumers has fallen, and the share financed through employer-pro- vided health plans has risen.3 Beginning in the mid-1960s, Congress greatly expanded the government role in insuring the elderly and dis- abled through medicare and the poor through medicaid. Earmarked payroll taxes cover most of the cost of medicare hospital benefits. General tax revenues of federal and state governments support most of the cost of inedicaid and medicare physician benefits.
Total employer payments for health care now equal employer tax pay- ments for social insurance. In 1992 employer payments for health insur- ance in the private nonfarm business sector averaged $1.27 per hour out of total compensation of $18.88.4 While all companies pay social security taxes, many pay nothing for health insurance. Among companies that provide health insurance, premiums substantially exceed payroll taxes.
Because fixed costs comprise a large share of the cost of health care services, the wide variety of alternative funding sources creates oppor- tunities for substantial cost shifting among client groups. Hospitals find it profitable to provide care to some patients at reimbursement rates below full unit costs, but above direct costs, as long as they can charge other payers more than full costs. For example, medicaid and medicare pay hospitals less than the full costs generated by medicare and medi- caid patients because Congress has restricted reimbursement rates. As a result, private payers must pay more than the full costs of hospital care for privately financed patients. Medicaid payments are estimated to cover about 80 percent of full costs, medicare about 90 percent, and private payers about 130 percent of full cost.5 This shifting of costs from public to private budgets represents a hidden tax in addition to the payroll and other taxes explicitly imposed to finance medicare and medicaid. The tax is paid by whoever in the private sector bears the
3. Insurance includes administrative costs that were $35 billion or 14 percent of premiums in 1991.
4. Two sources provide information on employee compensation. The data reference here is from the national accounts as reported in Survey of Current Business, annual August issues. The wage rate is reported on the basis of hours paid-paid leave and supplemental pay are included in wages-and the cost of retiree medical benefits is included in supplements. The Employment Cost Index (computed by the Bureau of Labor Statistics) provides a measure of compensation of current employees per hour -worked-paid leave and shift pay are included in supplements, rather than wages, and the cost of retiree medical benefits is excluded.
5. Congressional Budget Office (1993a, p. 8).
Henry J. Aaron and Barry P. Bosworth 253
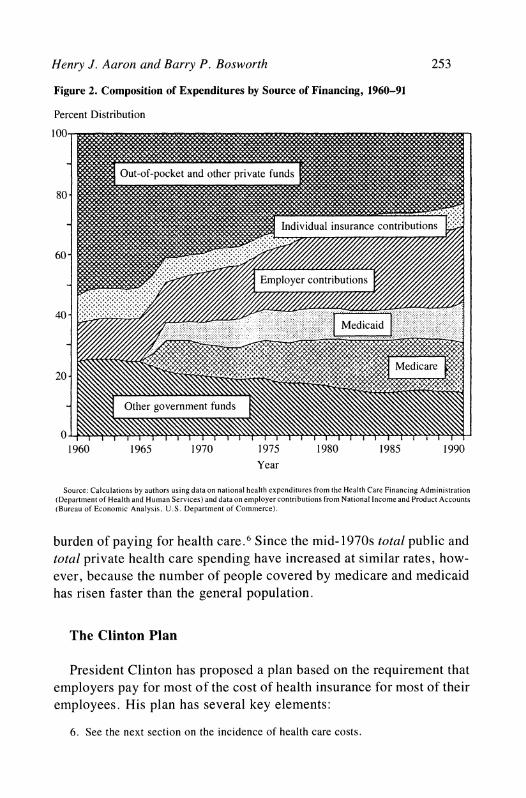
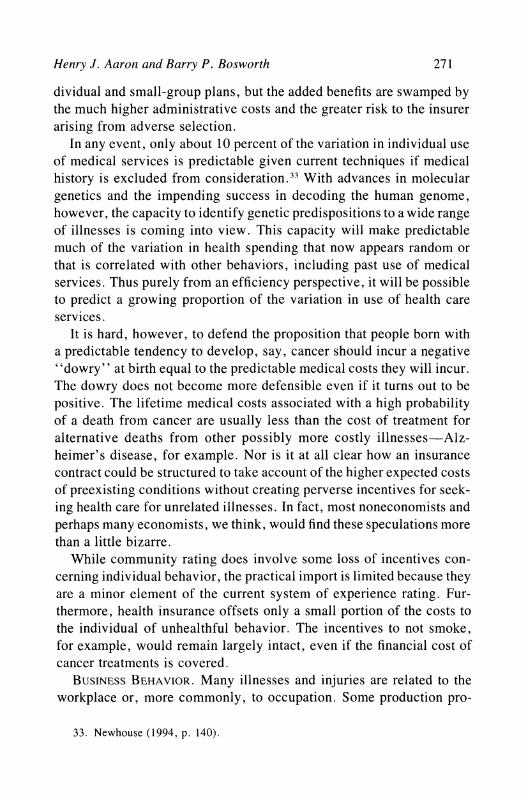
Figure 2. Composition of Expenditures by Source of Financing, 1960-91
burden of 65 payingforhealthcare.6.Since them.d.1970s total public and5 .
total private health care spending have increased at similar rates, how- ever, because the number of people covered by medicare and medicaid has risen faster than the general population.
The Clinton Plan
President Clinton has proposed a plan based on the requirement that employers pay for most of the cost of health insurance for most of their employees. His plan has several key elements:
6. See the next section on the incidence of health care costs.
254 Brookings Papers: Microeconomics 1994
-All legal U.S. residents, other than the elderly or employees of companies with more than 5,000 employees, would be required to obtain insurance through regional health alliances. Companies with more than 5,000 employees would be permitted to form health alliances of their own.
-The states would be required to approve health plans that meet certain regulatory standards, including at least one plan that assures free choice of physicians. The alliances would act as the point of pur- chase for health insurance, and they would impose standardized "risk- rated" premiums to hospitals, physicians, and other providers. The alliances would be the conduit for subsidies to small businesses and low-income households, tasks that would require the alliances to review business accounts and verify household income.
-Employers would be required to pay 80 percent of the average insurance premium in an alliance area for each of four community-rated family types: single persons, single parents and their children, childless couples, and couples with children. These payments would be capped at 7.9 percent of total payroll.
-Employees would be responsible for the balance of the premium, but employers would be permitted to pay the employees' share as a fringe benefit. Exclusion from personal income tax of employer- financed premiums would continue for ten years.
-Various explicit subsidies would be paid to employers with fewer than seventy-five employees and average wage payments below $24,000 annually per worker and to households with incomes below 150 percent of poverty.
-Regional health alliances would administer tight limits on the rate at which premiums for health insurance would increase annually. These limits would be designed to achieve spending targets established na- tionally and allocated to each regional alliance by a national health board. The real growth of private per capita health care spending would be drastically curtailed, falling to zero within four years following enactment. After the year 2000 the premium cap would rise in line with per capita GDP.
-Long-term growth of spending would be set annually by Congress based on the recommendation of the National Health Board. If Congress fails to act, the spending limit, set in statute, would hold growth of health care outlays to the growth of gross domestic product.
Henry J. Aaron and Barry P. Bosworth 255
While the Clinton plan is unlikely to become law in its current form, it does provide a useful point of reference for many of the issues of reform because it is the only plan that is spelled out in considerable detail.
Access
A broad consensus is emerging that health care reform should ensure universal financial access to care, although opinions differ on how soon this goal can be reached. The political consensus encompasses advo- cates of full national health insurance, employer mandates, and indi- vidual mandates. Even those who reject mandates because they believe market reforms will solve the problem of financial access accept uni- versality as the objective. In the academic world Alain Enthoven, Mark Pauly, Stuart Altman, Rashi Fein, and others, who disagree profoundly on means, agree on the need for regulatory measures to compel univer- sal coverage. Three roads to universal coverage lie before us.
-Employer mandates would achieve universal coverage by requir- ing employers to pay for most of the cost of health insurance for all employees and their families. Other devices would be used to cover those not connected to the work force.
-Individual mandates would achieve universal coverage by requir- ing each unrelated individual or family to carry health insurance. To make such insurance affordable, subsidies would be provided to low- income households.
-National Health Insurance plans would require the government (or state governments under federal guidelines) to pay for the health care of the population. The plan would be financed by added taxes.
All three options would encounter administrative problems. Replac- ing the current system with government-sponsored insurance would be disruptive. An individual mandate would require techniques to compel the participation of reluctant households, particularly those who do not pay taxes, claim welfare, or collect food stamps. An individual mandate is enforceable only if accompanied by sufficient subsidies to enable the poor to afford coverage. Ensuring that subsidies go to all of the eligible and only to them is always a costly administrative headache. Enforcing an employer mandate would raise a host of enforcement problems par-
256 Brookings Papers: Microeconomics 1994
ticularly regarding new and small companies, part-time workers, job changers, and members of families with two or more earners. And since members of households without a member in the labor force can be covered only by an individual mandate or government-sponsored insur- ance, employer-mandate plans are bedeviled not only by their own complexities but also by those of at least one of the other two ap- proaches.7 While the administrative issues are vexing, extending cov- erage is doable, as other countries have demonstrated.
Extending coverage also is relatively inexpensive. The uninsured, now representing approximately 14 percent of the population, already consume significant amounts of care, financed largely through cross- subsidies collected from the insured. Furthermore, the uninsured as a group are younger than the rest of the population and therefore are likely to consume less care per person than the insured. On the other hand, some of the uninsured and underinsured no doubt harbor un- treated chronic illnesses, the treatment of which might boost spending for a time. All estimates of how much universal coverage will boost acute care spending are shadowed by a large penumbra of uncertainty. Long and Marquis estimate that universal coverage will boost total spending on health care by just 2.6 percent if prices remain constant.8 Such a one-time increase would boost real growth of health care spend- ing from 1995 through 2000 from the baseline projection of 5 percent annually (approximately the average of the past four decades) to 5.7 percent annually.
The issue of who should pay is far more controversial. Because government programs already cover the poor and the elderly, workers and their families constitute most of the uninsured. An employer man- date would increase the number of insured workers in the private sector by 27 percent (table 2), many of whom are employed in small firms whose owners have strongly resisted such a mandate even with large subsidies. Thus the costs of expanded coverage tend to be pushed onto
7. The Clinton proposal actually links all three approaches to universal coverage: an employer mandate for most households; an individual mandate for most nonelderly households with no member in the labor force; and government-sponsored acute care insurance for the elderly and disabled (medicare) and government-sponsored long-term care coverage for the poor (medicaid). Much of the complexity critics have found in the Clinton plan flows from the simple fact that it employs all three of the available methods of achieving universal coverage instead of relying on one or even two of them.
8. Long and Marquis (1994).
Henry J. Aaron and Barry P. Bosworth 257
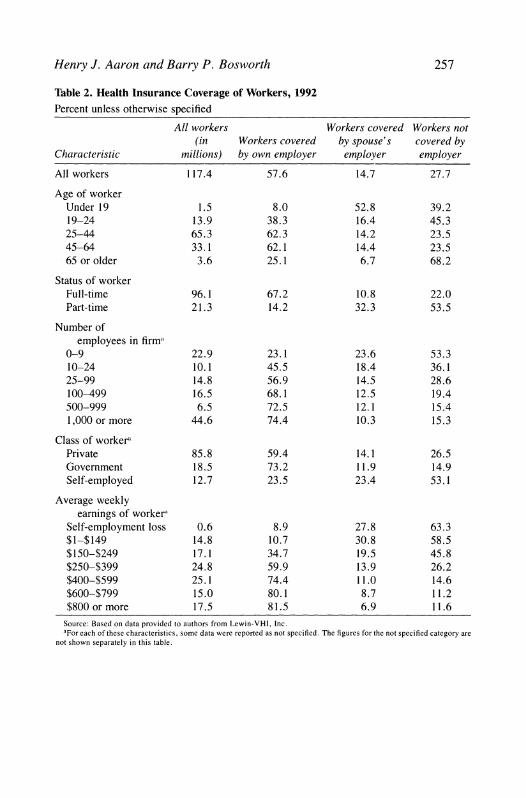
Table 2. Health Insurance Coverage of Workers, 1992 Percent unless otherwise specified
All workers Workers covered Workers not (in Workers covered by spouse's covered by
Characteristic millions) by own employer employer employer
All workers 117.4 57.6 14.7 27.7
Age of worker Under 19 1.5 8.0 52.8 39.2 19-24 13.9 38.3 16.4 45.3 25-44 65.3 62.3 14.2 23.5 45-64 33.1 62.1 14.4 23.5 65 or older 3.6 25.1 6.7 68.2
Status of worker Full-time 96.1 67.2 10.8 22.0 Part-time 21.3 14.2 32.3 53.5
Source: Based on data provided to authors from Lewin-VHI, Inc. aFor each of these characteristics, some data were reported as not specified. The figures for the not specified category are
not shown separately in this table.
258 Brookings Papers: Microeconomics 1994
the public sector or onto charges against other businesses. The govern- ment would also bear much of the cost of insurance for those who are not employed. In the Clinton plan subsidies to employers and house- holds add more than $100 billion annually to the federal budget by the end of the decade.
Who Are the Uninsured?
Table 2 provides further details on the characteristics of uninsured workers. The proportion uninsured is particularly high in very small companies and among part-time workers, the self-employed, and those earning less than $250 per week. Furthermore, 86 percent of part-time workers and 77 percent of workers employed by companies with fewer than ten employees do not receive insurance through their own employer.
Small companies are particularly unlikely to offer health insurance. A 1990 survey by the Health Insurance Association of America found that 73 percent of companies with fewer than ten employees did not provide a health insurance plan compared with 2 percent of companies employing more than one hundred workers.9 The far greater variation in premiums for small companies than for large ones explains part of these differences. Insurers quote higher rates to small companies than to large companies because of concern about adverse selection and greater administrative costs. Insurance premiums for groups of fewer than ten people are commonly 25 to 30 percent above those for groups of fifty or more. In addition, competition in the small-group market is considerably weaker and profit margins higher than in the large-group market.
An explanation of the large differences in coverage rates among companies based only on price would imply implausibly high price elasticities of demand. In fact, the decisions of companies on whether to offer insurance appear to be quite insensitive to price.'0 Instead, small companies seem to attract those workers who place a relatively low value on health insurance and prefer a higher take-home wage, either because they are covered through another family member or because they are willing to risk being uninsured. Small companies, which disproportionately employ low-wage and part-time workers, are
9. Health Insurance Association of America (1991, p. 27). 10. Gruber (1992b).
Henry J. Aaron and Barry P. Bosworth 259
also less likely than large companies to offer pensions or other fringe benefits. The demographic composition of the work force at small com- panies is similar to that of workers who do not take insurance when it is offered by their employer. "I It is noteworthy that more workers in firms with fewer than ten employees are covered by their spouse's insurance than by their own. Small companies have relatively low life expectancies, turnover among their workers is relatively high, and unionization is low; all of these factors are associated with low health insurance coverage.
A universal mandate for employers to pay for most of the cost of health insurance would reduce the hiring advantage of businesses, pre- dominantly small companies, that cater to employees with a low pref- erence for health insurance. The competitive effects would depend to some extent on the method of implementing the mandate. At present, almost 15 percent of workers have health insurance provided through their spouses (table 2). If workers are only required to show that they have insurance, some workers might continue to seek jobs that do not provide insurance. However, if each company must pay part of the cost of health insurance for all of its workers (as the Clinton program re- quires), a significant share of the costs paid by companies that now provide health insurance would be shifted to companies that do not currently provide it. The Clinton plan mutes the resulting redistribu- tional effects by community rating and direct public subsidies.
Employment Effects
Some critics allege that the Clinton plan would cause a sharp reduc- tion in employment because it requires all employers to pay for health insurance through an employment-related charge. Those claims seem grossly exaggerated, although the plan might adversely affect some low-wage workers and lead to employment shifts among companies.
The public discussion of the employment effects rests on the view that employers bear the economic burden of their workers' health in- surance. Nearly all economists, however, argue that employer expen- ditures for health insurance are shifted backward onto workers, either through lower nominal take-home pay and reduced nontaxable fringe benefits or through price increases that lower real incomes.
1 1. Department of Labor (1991) and Long and Marquis (1993).
260 Brookings Papers: Microeconomics 1994
Workers bear most of any employment tax because the elasticity of labor supply with respect to real compensation is low compared with the elasticity of the demand for labor. Empirical studies find that few workers withdraw from the work force to avoid a general tax, although labor supply of married women may vary more than does that of men and single women. The demand for labor, in contrast, is often quite sensitive to cost because companies have many options for avoiding the increased labor costs. Managers replace workers with machines or shift production abroad. If employers react to added health insurance costs by raising prices, the demand for labor will change as consumers shift their spending from labor-intensive products, whose prices will have risen most, to other goods and services. Such adjustments take time, however, and very little information exists on the speed at which they occur.
Unlike a pure employment tax, the current system of employer- provided health insurance confers a direct benefit to workers in the form of improved access to health care. While the added cost of providing health insurance reduces the demand for labor at each wage rate, it also increases labor supply to the extent that workers perceive health insur- ance as having value. 12 This provides an extra reason for believing that even more of the cost is shifted back than in the case of a general wage tax. Equation 1 is a notational shorthand for the extent of backward shifting of the cost:
( 1 ) dW/dC (Xqd - oLW) ? (qd -
where a = the worker's subjective valuation of an increment
of health insurance as a proportion of the premium, W = the wage rate, C = the cost of the benefit, qd = the elasticity of labor demand, and qS = the elasticity of labor supply.
The change in employment is the change in the wage rate times the elasticity of labor supply. If workers value the benefit at its cost
12. This point was an important element of the analysis of the social security tax by Burkhauser and Turner (1985), and it is elaborated on in Summers (1989). A clear presentation of the analytics is provided in Gruber and Krueger (1990).
Henry J. Aaron and Barry P. Bosworth 261
(ot = 1), they would bear the entire expense in a lower wage, and there would be no loss of employment. If they place no value on it or if they are already insured through a spouse's employment, the incidence and employment effects are those of a pure employment tax. Since workers can choose to work for employers that provide no insurance, the costs of the current system should be largely borne by workers with little net effect on employment. II
There have been many empirical studies of labor supply, and there seems to be a consensus on the following two points: the average wage elasticity is between 0. 1 and 0.2, and the elasticity of supply to a specific industry would be considerably larger.'4 There is less consen- sus, however, about the magnitude of the wage elasticity of labor de- mand or the appropriate concept for specific situations. A common microeconomic formulation decomposes the overall response into a substitution effect and a scale effect. 1' In the case of two input factors, this can be expressed as
(2) Id = -(1 - S)U + s-q,
where I
d = elasticity of labor demand, s = labor's share,
ar = elasticity of factor substitution, and - = elasticity of product demand.
The substitution effect depends upon the opportunities to vary the mix of inputs to produce a given level of output, and it has a particularly strong time dimension since it takes time for firms to purchase capital and alter the production technology. 16 The substitution effect would be
13. Recent empirical studies providing evidence that the incidence of employment mandates and fringe benefits falls on workers is provided by Gruber (1992a), Gruber and Krueger (1990), Montgomery and Benedict (1992), and Woodbury and Huang (1991).
14. Burtless (1986). 15. Hamermesh (1993, pp. 22-33). 16. The term (l-s)(T is a compensated elasticity, the movement along a fixed iso-
quant. The scale factor is derived in an ad hoc fashion based on fixed factor proportions. For purposes of evaluating the effect of an employment tax increase, we believe the uncompensated elasticity derived from profit maximization is the more relevant concept. For the class of CES production functions, the uncompensated elasticity of factor demand is ay.
262 Brookings Papers: Microeconomics 1994
very low in the short run and only about 0.3 in the long run. 7 The scale effect refers to the loss of sales and employment associated with the passthrough to product prices of increased labor costs. This effect will be highly dependent on whether the elasticity of product demand refers to an individual firm, an industry, or the total economy. In the aggregate it would also depend upon the reaction of monetary policy to the rise in the price level. Thus a conceptual model leaves wide uncertainty about the precise value of the overall labor demand elasticity in any specific situation.
Empirical estimates of the aggregate employment elasticity also have a wide variance.'8 Much of the variation in these estimated demand elasticities results from differences in the assumptions about what is held constant. At the aggregate level the stock of capital is largely fixed in the short run. Even over the long term, increases in average wage costs will be passed through to the cost of producing capital goods, limiting the change in relative prices.
An important, but often overlooked, feature of the Clinton plan is that individuals are guaranteed full access to health care even if they do not pay the premium. From this perspective the economic effect of the premium is more comparable to a pure employment tax than to a mandated benefit, a value of zero for a in equation 1; and the base on which the economic effects of the premium should be measured is the whole work force of about 120 million, rather than the roughly 50 million without employer-provided insurance. 19 A subsidy program mit- igates the effects of the tax for low-wage workers, for whom it would be a large percentage of wages.20 Payments by employers would be limited to 7.9 percent of payroll, reduced to as little as 3.5 percent for small companies with low average earnings. In addition, low-income households would be eligible for direct subsidies to defray part of their
17. This assumes an elasticity of substitution no greater than unity, Cobb-Douglas, and a labor share of 0.7.
18. Hamermesh (1993, pp. 270-75). 19. The link between receiving the benefit and paying the premium would be no
greater than the link between the benefits of other public programs and general taxes. 20. The Clinton plan caps health insurance costs at 3.5 percent of payroll for com-
panies with fewer than twenty-five employees and average earnings of $12,000 per worker or less. If average earnings are $12,000, this cap translates into a maximum premium of $420. For companies with lower average earnings, the maximum premium would be reduced proportionately.
Henry J. Aaron and Barry P. Bosworth 263
premium costs. On average, the employer cost would be about 7 percent of wages.
If, for illustration, we assume a long-run labor demand elasticity of 0.5 and a supply elasticity of 0.15, about three-fourths of the 7 percent tax would be backward shifted in lower wages, reducing labor supply by 0.8 percent. If we take seriously the Clinton proposal to remove the link between paying the tax and the benefits, the base would be a total work force of 120 million, implying a reduction in labor supply of about 950,000. Alternatively, if the program is viewed as an expansion of the employer mandate to the roughly 50 million who do not currently have insurance through their employer, the effect would be half as large.21 The short-run employment effects would be even smaller.
While the aggregate employment implications of alternative financ- ing methods are small, the changes in the composition of employment could be more significant. At present, health insurance premiums are basically a head tax with a strong influence on employment between insured and uninsured firms and between full-time and part-time em- ployment. These distinctions would be eliminated under the Clinton plan, but they would be replaced by other distortions of employment decisions. A large number of workers would be employed in firms subject to a payroll tax of 7.9 percent, or less for subsidized small firms. For these workers the tax would be converted from a head tax to one that is proportionate to earnings, altering the effective tax on an additional hour of work. The marginal cost of a new hire would also be much different at firms subject to the percent of payroll tax compared with those that are not. For those firms subject to the 7.9 percent premium cap, a worker earning $10,000 would require an annual em- ployer payment of only $790 dollars, compared with $2,000 for the uncapped firm. If workers near the minimum wage are employed in a small firm subject to the 3.5 percent limit, the employer payment would be $350 per year or less. On the other hand, a worker earning $100,000 would require a premium of $7,900 at the capped firm compared with $2,000 at the uncapped firm. In general, there would be a strong incen- tive to group similarly paid workers in the same firm. Companies not
21. Estimates of the job loss using a range of different supply and demand elasticities are provided in Krueger (1993). He obtains much smaller estimates of the employment effect because he restricts the number of workers affected to the currently uninsured.
264 Brookings Papers: Microeconomics 1994
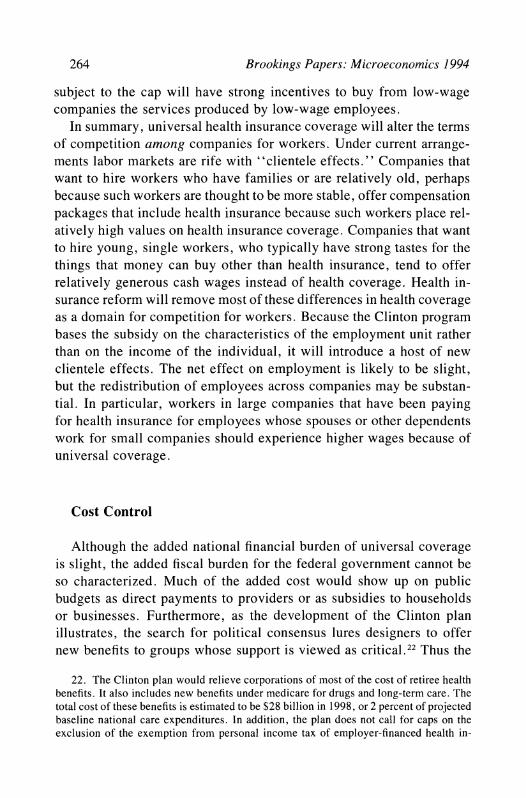
subject to the cap will have strong incentives to buy from low-wage companies the services produced by low-wage employees.
In summary, universal health insurance coverage will alter the terms of competition among companies for workers. Under current arrange- ments labor markets are rife with "clientele effects." Companies that want to hire workers who have families or are relatively old, perhaps because such workers are thought to be more stable, offer compensation packages that include health insurance because such workers place rel- atively high values on health insurance coverage. Companies that want to hire young, single workers, who typically have strong tastes for the things that money can buy other than health insurance, tend to offer relatively generous cash wages instead of health coverage. Health in- surance reform will remove most of these differences in health coverage as a domain for competition for workers. Because the Clinton program bases the subsidy on the characteristics of the employment unit rather than on the income of the individual, it will introduce a host of new clientele effects. The net effect on employment is likely to be slight, but the redistribution of employees across companies may be substan- tial. In particular, workers in large companies that have been paying for health insurance for employees whose spouses or other dependents work for small companies should experience higher wages because of universal coverage.
Cost Control
Although the added national financial burden of universal coverage is slight, the added fiscal burden for the federal government cannot be so characterized. Much of the added cost would show up on public budgets as direct payments to providers or as subsidies to households or businesses. Furthermore, as the development of the Clinton plan illustrates, the search for political consensus lures designers to offer new benefits to groups whose support is viewed as critical.22 Thus the
22. The Clinton plan would relieve corporations of most of the cost of retiree health benefits. It also includes new benefits under medicare for drugs and long-term care. The total cost of these benefits is estimated to be $28 billion in 1998, or 2 percent of projected baseline national care expenditures. In addition, the plan does not call for caps on the exclusion of the exemption from personal income tax of employer-financed health in-
Henry J. Aaron and Barry P. Bosworth 265
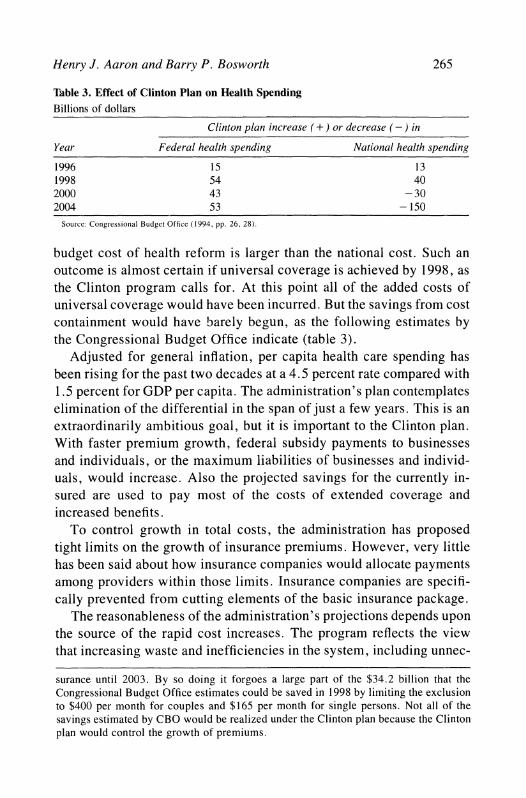
Table 3. Effect of Clinton Plan on Health Spending Billions of dollars
Clinton plan increase ( + ) or decrease (-) in
Year Federal health spending National health spending
1996 15 13 1998 54 40 2000 43 - 30 2004 53 - 150
Source: Congressional Budget Office (1994, pp. 26, 28).
budget cost of health reform is larger than the national cost. Such an outcome is almost certain if universal coverage is achieved by 1998, as the Clinton program calls for. At this point all of the added costs of universal coverage would have been incurred. But the savings from cost containment would have barely begun, as the following estimates by the Congressional Budget Office indicate (table 3).
Adjusted for general inflation, per capita health care spending has been rising for the past two decades at a 4.5 percent rate compared with 1.5 percent for GDP per capita. The administration's plan contemplates elimination of the differential in the span of just a few years. This is an extraordinarily ambitious goal, but it is important to the Clinton plan. With faster premium growth, federal subsidy payments to businesses and individuals, or the maximum liabilities of businesses and individ- uals, would increase. Also the projected savings for the currently in- sured are used to pay most of the costs of extended coverage and increased benefits.
To control growth in total costs, the administration has proposed tight limits on the growth of insurance premiums. However, very little has been said about how insurance companies would allocate payments among providers within those limits. Insurance companies are specifi- cally prevented from cutting elements of the basic insurance package.
The reasonableness of the administration's projections depends upon the source of the rapid cost increases. The program reflects the view that increasing waste and inefficiencies in the system, including unnec-
surance until 2003. By so doing it forgoes a large part of the $34.2 billion that the Congressional Budget Office estimates could be saved in 1998 by limiting the exclusion to $400 per month for couples and $165 per month for single persons. Not all of the savings estimated by CBO would be realized under the Clinton plan because the Clinton plan would control the growth of premiums.
266 Brookings Papers: Microeconomics 1994
essary treatments, account for the increases. If this view is correct, costs can be dramatically reduced with no loss of medical benefit. Schwartz and Mendelson undercut this view by showing that even if all waste and inefficiency were eliminated from the U.S. health care system over the relatively brief span from 1994 to 2000, growth of health care spending would be slowed, at most, from a projected annual rate of 6.5 percent to 5 percent.23 Furthermore, the underlying rate of growth would resume thereafter.
Alternative explanations for rising outlays emphasize technological advances that have broadened the menu of beneficial medical interven- tions. Within just a few decades, organ transplants, bypass surgery, bone marrow transplants, and other major medical interventions have become commonplace. Noninvasive diagnostic tests, such as magnetic resonance imaging, have become routine. Although the cost per case is sometimes lower than the cost of procedures that they replace-ex- ploratory surgery, for example-these techniques increase the total cost of care because they can be used in vastly more situations.
Most health care outlays result from very expensive episodes of care affecting a small percent of the population. In 1987, 1 percent of the population accounted for 30 percent of all outlays, 10 percent for 72 percent. At the other end of the scale, half the population accounted for only 3 percent of costs.24 Furthermore, in examining the claims experience of two health insurance companies, we found that half of all payments by the insurer in 1992 were accounted for by 1 percent of the insured population at an average per capita cost of $25,000.25
The concentration of health care outlays in high-cost interventions suggests that changes in the incentives to individuals to seek medical care or to shop more wisely will have only small effects on total costs.
23. Schwartz and Mendelson (1994, pp. 225, 234). 24. Berk and Monheit (1992, p. 146). This pattern is not unique to the United States.
Other countries exhibit similar concentration. To a large extent, such concentration is a mere artifact, since most people are not seriously ill in any given year; one expects sick people to use medical services and healthy people not to do so. Even if the period over which outlays are measured is as long as a decade, however, considerable concentration remains (Aaron, 1991).
25. If 1 percent of the population accounts for 30 percent of total physician, hospital, and pharmaceutical outlays, the per capita cost of these services in 1992 exceeded $60,000. The discrepancy between these two estimates arises in large part because private insurance companies typically do not provide for most of the costs of the elderly and disabled, who are covered by medicare.
Henry J. Aaron and Barry P. Bosworth 267
Cost savings of the magnitude envisioned by the administration are likely to be achieved only through rationing, particularly in the access to high-cost interventions-an outcome that it opposes.26
Both explanations point up important truths. The price of medical services is higher in the United States than elsewhere; so is the fre- quency of surgery and the use of expensive high technology. Even if the administration were correct about the amount of waste, the ability of managed care and increased government intervention to eliminate it in just a few years is dubious.
If the spending targets cannot be met, budget expenditures rise and revenues fall. If health cost increases outpace administration projec- tions, an increasing proportion of business firms would be subject to the limitation on their payments to 7.9 percent of payroll, and the government would be under pressure to finance the excess. In addition, the larger the proportion of private compensation paid through health care benefits, which are not taxable to individuals, the lower are federal revenues 27
Community Rating
Among the many differences between the U.S. health care system and that of other nations, none is more striking or important than the U.S. adherence to "experience rating." The United States is unique in the extent to which individuals and groups are charged widely varying health insurance premiums on the basis of characteristics (such as age, sex, and preexisting conditions) that are expected to be useful predictors of future health care costs. Most countries with a single-payer system
26. To date, a further factor, the aging of the population, has pushed up health care costs only slightly. While health care spending does vary dramatically among age groups, there has been very little net change in the average age of the population. This pattern will continue for some time into the future. By itself, population aging will push up acute care health spending at most by less than 2 percent of gross domestic product over the next three decades. See Aaron (1991, pp. 42-45).
27. Lewin-VHI (1993, p. 54). Lewin-VHI estimates that if premiums grow 1.5 percent per year faster than the administration assumes, the federal deficit will be $42 billion higher over the 1995-2000 period than under the administration's assumptions.
268 Brookings Papers: Microeconomics 1994
use community rating; everyone is charged the same rate regardless of the person's current or expected health condition.28
The extreme form of the "each-tub-on-its-own-bottom" approach is self-insurance, the practice now employed by most medium and large companies. Sharing of risk is limited to the group. Under this arrange- ment the company pays the actual costs of care consumed by its em- ployees plus a charge for administration by an insurance company or other agent. Self-insurance became appealing after the Employee Re- tirement Income Security Act of 1974 exempted self-insured plans from state regulation and, in particular, from state-mandated benefits. Cur- rently, approximately half of insured workers are covered by self- insured plans.
Most other businesses and individuals who buy insurance face rating practices by insurance companies under which premiums reflect the insurers' best estimates of the costs the insured group or individual will generate. To illustrate the diversity of rates that such a system produces, we obtained the rating factors used by two health insurance companies, A and B. A is a small national insurance company. B is a regional Blue Cross/Blue Shield plan. In both cases premiums vary substantially among different groups of the population.
Premiums rise particularly sharply with age. The premium for males aged forty-five to forty-nine is twice that for twenty- to twenty-nine- year-olds, and those for workers aged sixty to sixty-four are more than four times higher. The age differences for women are muted, particu- larly if maternity benefits are included,29 as they are under most plans today and probably would be under all plausible national plans. Both companies also charge substantially higher premiums for small groups-as much as 25 percent more for groups of ten or fewer peo- ple-but the adjustment for size is negligible for groups of twenty-five or more. The national company makes striking adjustments for geo- graphical differences, with high-cost areas facing premiums three times those charged low-cost areas. For the regional company, rates differed
28. Originally, Blue Cross/Blue Shield plans employed community rating, but that practice all but vanished when commercial insurance companies entered the market and began to cream off the lower cost groups.
29. The adjustment for maternity differs radically between the two companies. The national firm adjusts the rate by nearly 50 percent in the prime child-bearing ages, while the Blue Cross/Blue Shield plan makes a 5 percent adjustment.
Henry J. Aaron and Barry P. Bosworth 269
among counties within one state by as much as 40 percent. Both com- panies also made significant adjustments, up to 40 percent, across in- dustry and occupational groups.30 Many insurance companies refuse to insure gas station attendants, who face a high risk of violence or injury on the job. They will not insure male hairdressers because many of them are believed to be gay and at risk of AIDS.
These characteristics are easy to identify and strongly associated with health care costs. Discrimination pays. Given the chance, insurers and providers will seek low-cost groups. Substantial evidence also indicates that individuals' expectations about their future health care needs may cause them to switch between high- and low-option plans and between HMOs and fee-for-service.3' While community rating may be a desir- able goal, it is difficult to implement within a system of competing insurance companies or health providers.32
Is Experience Rating Worth Saving?
Professional economists are predisposed to favor experience rating. Prices should reflect predictable differences in costs, and those who consume large amounts of any good or service, including health care, should pay more than those who consume less. The setting of one average price for different commodities, as under community rating, will cause resource misallocation in both consumption and production because purchasers will buy more or less of the mispriced commodities than if their prices were based on costs. Experience rating promotes economic welfare by creating incentives to use health care more effi- ciently. Noneconomists, however, think price discrimination is unfair and penalizes the sick; they tend to play down the incentive effects of price variations.
From a practical perspective, risks that are beyond the control of the individual should be community rated, while those risks influenced by
30. Insurance companies also provide large discounts to groups that agree to medical underwriting in which the health condition of members is reviewed to exclude pre- existing conditions. The discount is often 40 percent in the first year, declining to zero after three years.
31. Newhouse (1994). 32. This same issue arose in the communications industry when technological change
made possible more than one long-distance telephone service. That development elimi- nated the viability of a cross-subsidy from business and long-distance to residential service.
270 Brookings Papers: Microeconomics 1994
the individual's behavior should be experience rated. Thus automobile insurance contains an element of experience rating, and most people believe that homeowners who build in high-risk locations should be charged higher premiums than those who do not. The extent of deviation from community rating for health insurance should, therefore, depend upon the extent to which the incentive effects arising from price vari- ations can affect the behavior of individuals and firms.
PERSONAL BEHAVIOR. Health care involves risks that are both con- trollable and uncontrollable by the individual. However, under the cur- rent system of experience rating, insurance underwriters base premiums largely on the uncontrollable characteristics, such as age and sex. Char- acteristics of personal behavior that are correlated with health-smok- ing, participation in risky sports, eating and drinking-are largely be- yond the accurate observation of medical underwriters.
In addition, medical underwriting may convey incorrect incentives. Take discounts for nonsmokers, for example. This price signal is mis- leading in two ways. First, and most important, the price is not the coefficient on smoking from an accurate structural model of the effect of smoking on health expenditures during the contract period. Rather, it is the coefficient on smoking from a reduced form equation from which many relevant variables are excluded. To the extent that the omitted variables are correlated with smoking behavior, the coefficient on smoking is an incorrect behavioral signal to people regarding its economic consequences. Second, the time period of insurance contracts is very brief, usually six months or one year, while the effects of behavior, such as smoking, are cumulative. Even if current behavior is observable, past and future behavior are not. In such circumstances it is not clear what the relevant price signal should be or how any refined rule could be administered. In short, the value of medical underwriting as an influence on personal behavior is seriously compromised. The price signals to controllable behaviors are almost always too high or too low (because of excluded variables).
Furthermore, the scope for personal incentives in the current system, whether experience rating is achieved through underwriting or self- insurance, is small because of the emphasis on large-group plans. Large groups enable administrative savings; but, since the premiums are the same for all employees within the group, the effects of personal behav- ior are spread across the whole group. Incentives are clear within in-
Henry J. Aaron and Barry P. Bosworth 271
dividual and small-group plans, but the added benefits are swamped by the much higher administrative costs and the greater risk to the insurer arising from adverse selection.
In any event, only about 10 percent of the variation in individual use of medical services is predictable given current techniques if medical history is excluded from consideration.33 With advances in molecular genetics and the impending success in decoding the human genome, however, the capacity to identify genetic predispositions to a wide range of illnesses is coming into view. This capacity will make predictable much of the variation in health spending that now appears random or that is correlated with other behaviors, including past use of medical services. Thus purely from an efficiency perspective, it will be possible to predict a growing proportion of the variation in use of health care services.
It is hard, however, to defend the proposition that people born with a predictable tendency to develop, say, cancer should incur a negative "dowry" at birth equal to the predictable medical costs they will incur. The dowry does not become more defensible even if it turns out to be positive. The lifetime medical costs associated with a high probability of a death from cancer are usually less than the cost of treatment for alternative deaths from other possibly more costly illnesses-Alz- heimer's disease, for example. Nor is it at all clear how an insurance contract could be structured to take account of the higher expected costs of preexisting conditions without creating perverse incentives for seek- ing health care for unrelated illnesses. In fact, most noneconomists and perhaps many economists, we think, would find these speculations more than a little bizarre.
While community rating does involve some loss of incentives con- cerning individual behavior, the practical import is limited because they are a minor element of the current system of experience rating. Fur- thermore, health insurance offsets only a small portion of the costs to the individual of unhealthful behavior. The incentives to not smoke, for example, would remain largely intact, even if the financial cost of cancer treatments is covered.
BUSINESS BEHAVIOR. Many illnesses and injuries are related to the workplace or, more commonly, to occupation. Some production pro-
33. Newhouse (1994, p. 140).
272 Brookings Papers: Microeconomics 1994
cesses, such as mining, are inherently dangerous or unhealthful. Prices of commodities that are dangerous to produce should reflect the costs generated by these dangers. Self-insurance and medical underwriting achieve this goal. Community rating would defeat it. Furthermore, companies can engage in various practices that affect health expendi- tures (for example, plant design, selection of equipment, investments in worker training, and wellness programs).34 Community rating re- duces the return to companies from such practices. The use of com- munity rating for general health insurance, however, need not involve the elimination of job-related programs such as workers' compensation. It is also possible to promote workplace safety in other ways, as current regulations attest. These alternative techniques may be less accurate or more costly than reliance on accurate price signals would be. But the existence of alternatives indicates that devices are available to influence employer behavior other than those produced by experience rating.
Experience rating also creates perverse incentives. It encourages employers to discriminate against job applicants who have high pre- dictable health care costs, whether or not these potential workers are qualified to do the job. The alleged reticence of employers to hire older workers may be attributable in part to the tendency of health costs to rise with age. The same considerations arise with respect to workers with disabilities or histories of illness. This incentive is particularly strong with respect to low-wage workers, since health insurance is a large part of the total compensation for such workers. Laws prohibit discrimination based on age, disability, or other correlates of medical expenditures such as race and sex. But regulations that require behavior contrary to strong economic incentives do not have a conspicuously successful track record. Experience rating undercuts civil rights legis- lation; community rating does not.
Price differences can also affect the choice of provider or provider group. The essence of managed competition is that differences in prices charged by providers for given benefits should be clearly and fully
34. Some critics of President Clinton's plan urge that companies with fewer than 5,000 employees be permitted to create their own "health alliances" to encourage companies to bargain with insurers and providers for low costs. Unfortunately, no good evidence is available on whether such company actions have a perceptible effect on health costs or on whether these companies are using their market power to engage in the same cost-shifting that they accuse the government of doing.
Henry J. Aaron and Barry P. Bosworth 273
visible to households and that households should pay the full differences in costs. The goal is to encourage efficiency and innovation among health care providers. All of the major proposals for reform of health care financing, other than the so-called "single-payer" options, em- brace this principle, and there is no good reason why a single-payer plan should exclude provider competition. For that reason the choice between experience rating and community rating has no necessary bear- ing on the behavior of providers.
We conclude that experience rating of health insurance is undesir- able. Whether provided through self-insurance or medical underwrit- ing, it produces modest constructive incentives at best. In the name of small potential efficiency gains, experience rating adds to administra- tive costs, creates some perverse incentives (don't hire the sick, the old, the handicapped), and therefore necessitates extensive regulatory oversight to prevent abuse.35 Most of the variation in health outlays is traceable to factors over which individuals and employers have little control. Given the small efficiency effects, the common view that the choice between experience rating and community rating is mostly a matter of fairness or distributional equity, and that experience rating does indeed penalize the sick, is mostly but not completely right.
Transition
Any major reform of health care financing will change who pays for health care. Full national health insurance, for example, replaces pri- vate, largely business-financed premiums with taxes, a shift that will change who has legal responsibility for health care costs and who bears the economic incidence.36 An individual mandate would also require
35. Some elements of experience rating that most economists would defend can be easily retained. Thus the Clinton health plan, at least at the outset, would retain geo- graphic variations in health spending by basing initial premiums within each regional health alliance on historical spending. Whether efforts should be made over time to reduce such interalliance variations raises additional questions that we do not explore.
36. While economists care mostly about incidence, elected officials clearly care a great deal about legal responsibility. Thus the fact that national health insurance would be financed by taxes has kept national health insurance penned in the left-most regions of the U.S. political world. The fact that the incidence of tax-based finance almost inescapably would be more progressive than premium finance has not seemed to be nearly so salient a matter of distinction as has the effect of tax finance on the size of public budgets. Whether the finding of the Congressional Budget Office that involuntary
274 Brookings Papers: Microeconomics 1994
large tax increases to underwrite the subsidies necessary to make a mandate affordable by low-income households.
The shift from experience rating to community rating also redistrib- utes financial responsibility. President Clinton's proposal as well as the various plans to implement full national health insurance would adopt community rating at the state or substate level. President Clinton's plan would charge employers one of three premiums set in each health alli- ance based on whether the worker is single, a single head of household, or married.37 Based on suggestive evidence presented below, we believe that the largest redistribution of costs will result from the shift to com- munity rating rather than from the choice of whether the government, business, or individuals should be held responsible for payment.
Because it is the most detailed plan available, we focus on President Clinton's plan to illustrate this point. The Clinton plan stops well short of establishing a single price for health insurance. In addition to the variation in premiums based on marital status and the presence or ab- sence of children, premiums would differ based on historic spending patterns in one or more regions each state would create. Whether and at what pace these differences would be reduced is unclear. The drawing of boundaries among health alliances is likely to initiate political battles even more intense than those associated with congressional redistricting for at least three reasons. Large cost differences among urban, subur- ban, and rural areas mean that the cost of health insurance in each geographical area will depend on the other areas with which it is grouped. In addition, the amount and distribution of subsidies payable to businesses and individuals will depend on how alliance boundaries are drawn. Finally, whether groups that are authorized to form separate health alliances (companies with 5,000 or more employees and certain
premiums in the Clinton health plan should be treated as on-budget revenues of the federal government legitimates tax-financed health insurance plans or delegitimates the Clinton proposal is unclear. Perhaps what is really at play is a latent awareness or unacknowledged recognition that a shift to almost any form of tax-based financing from premium financing would cause a major redistribution of income.
37. President Clinton's plan actually divides the population into four family types. Married families consist of couples and couples with children. This distinction is relevant to the portion of the premium that individuals must pay. But employers would pay the same rate for all married employees to foreclose incentives for distinguishing among married employees in hiring and firing. If this distinction creates the risk of discrimi- nation, it is not clear why the discrimination between married workers and single workers or single heads of households does not.
Henry J. Aaron and Barry P. Bosworth 275
other defined groups) would find it profitable to do so will depend on the costs of care within those alliances.38
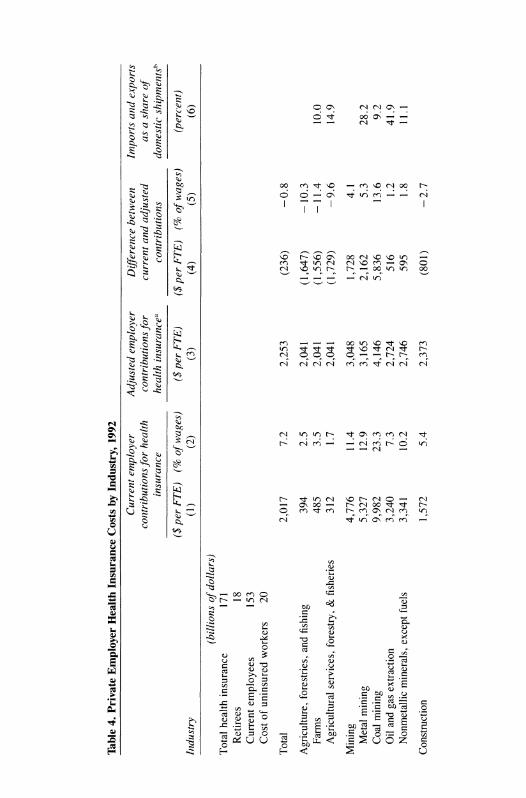
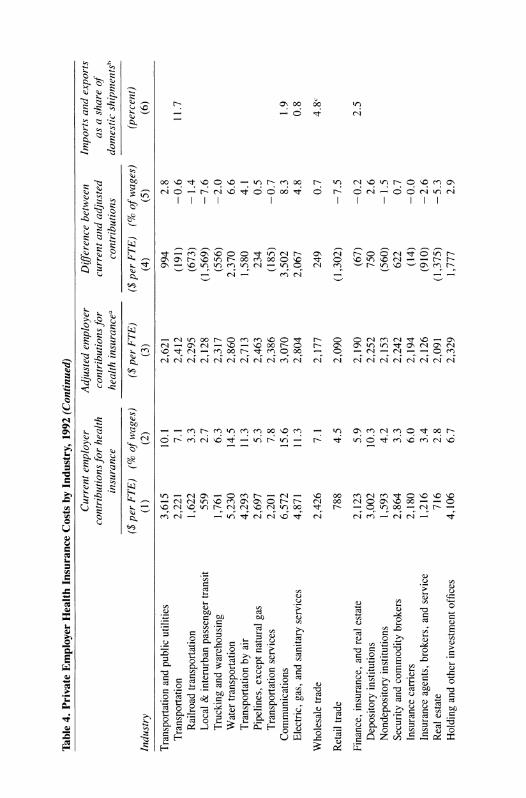
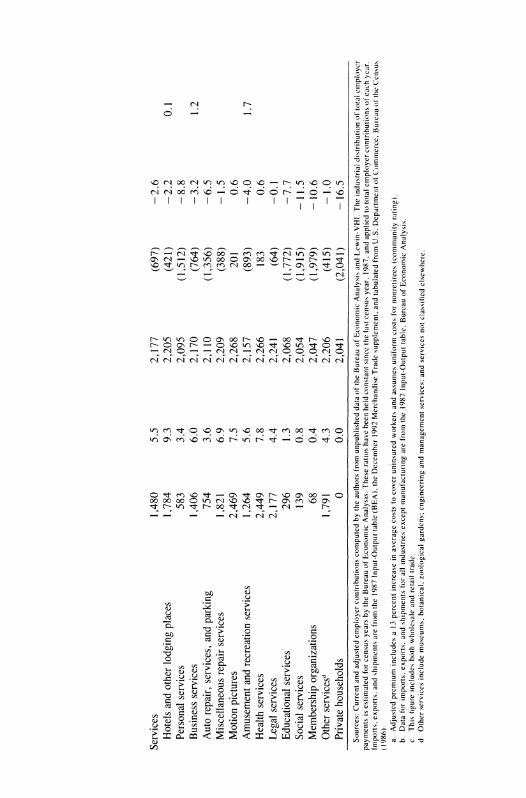
We use the data on employer payments for health insurance at the level of two-digit SIC industries shown in table 4 to gauge the effect of this move toward community rating, and we present crude calculations that may approximate the size of the adjustment. Column 1 shows the health insurance expenditures per full-time equivalent (FTE) worker in 1992. The numbers in column 1 vary enormously for at least four reasons. First, the proportion of workers covered by an employer- provided health plan differs widely among companies and industries.39 Second, the range of benefits and the proportion of the premium paid by the employer vary among companies and industries.40 Third, the cost of given coverage differs among companies and industries based on the riskiness of the activity, the age and other demographic characteristics of the labor force, and the location of the industry (since health costs vary regionally). Fourth, the ratio of retirees for whom employers pro- vide benefits to active workers differs among companies and industries. Despite these qualifications, the numbers in column 1 indicate roughly the distribution of payments for current health care benefits.
If one excludes the industries with extremely low average costs, the numbers in column 1 almost certainly understate the variation among companies in health insurance costs per active full-time equivalent worker for a standard benefit package. They average out much of the regional and demographic differences that are the dominant sources of differences in insurance premiums.
While active workers bear most of the burden of their own health
38. Low-wage workers have a stake in how boundaries are drawn. The company's cost of health insurance cannot exceed 7.9 percent of payroll under the Clinton plan. Thus the health insurance cost of hiring a worker earning, say, $10,000 is $790 if the 7.9 percent cap applies. If the cap does not apply, the cost could exceed $4,000. Thus low-wage workers have an odd interest in seeing to it that their employers are included in health alliances with premiums high enough to trigger the cap.
39. Available data do not allow us to adjust for variations in the proportion of current employees who are covered by insurance at the level of industry detail shown in table 4. Adjustments at the one-digit SIC level, however, do not reduce the variance of costs across industries in dollar amounts.
40. Variations in the characteristics of health plans and the employer share of the premium are both relatively minor sources of difference in the costs. The employer share averages 86 to 90 percent for single coverage and 70 to 75 percent for family plans. See Health Insurance Association of America (1992, p. 13).
Table 4.
Private
Employer
Health
Insurance
Costs by
Industry,
1992
Current
employer
Adjusted
employer
Difference
between
Imnports
and
exports
contributions
for
health
contributions
for
current
and
adjusted
as a
share of
insurance
health
insurancea
contributions
domestic
shipmentsh
($
per
FTE)
(% of
wages)
($
per
FTE)
($
per
FTE)
(% of
wages)
(percent)
Industry
(1)
(2)
(3)
(4)
(5)
(6)
(billions of
dollars)
Total
health
insurance
171
Retirees
18
Current
employees
153
Cost of
uninsured
workers
20
Total
2,017
7.2
2,253
(236)
-0.8
Agriculture,
forestries,
and
fishing
394
2.5
2,041
(1,647)
-
10.3
Farms
485
3.5
2,041
(1,556)
-11.4
10.0
Agricultural
services,
forestry, &
fisheries
312
1.7
2,041
(1,729)
-9.6
14.9
Mining
4,776
11.4
3,048
1,728
4.1
Metal
mining
5,327
12.9
3,165
2,162
5.3
28.2
Coal
mining
9,982
23.3
4,146
5,836
13.6
9.2
Oil
and
gas
extraction
3,240
7.3
2,724
516
1.2
41.9
Nonmetallic
minerals,
except
fuels
3,341
10.2
2,746
595
1.8
11.1
Construction
1,572
5.4
2,373
(801)
-2.7
Manufacturing
3,466
10.7
2,416
1,050
3.2
28.2
Durable
goods
3,801
11.2
2,452
1,349
4.0
38.8
Lumber
and
wood
products
1,705
7.4
2,225
(520)
-2.3
17.9
Furniture
and
fixtures
2,296
10.0
2,289
7
0.0
18.8
Stone,
clay,
and
glass
products
3,224
10.6
2,390
834
2.8
14.7
Primary
metal
industries
5,108
14.3
2,593
2,515
7.0
27.9
Fabricated
metal
products
3,431
11.4
2,412
1,019
3.4
16.0
Industrial
machinery
and
equipment
3,838
10.5
2,456
1,382
3.8
51.6
Electronic &
other
electric
equipment
3,451
10.2
2,414
1,037
3.1
53.3
Transport
equipment
5,449
13.5
2,630
2,819
7.0
44.9
Instruments
and
related
products
3,958
10.1
2,469
1,489
3.8
33.9
Misc.
manufacturing
industries
1,923
7.5
2,249
(326)
-1.3
65.8
Nondurable
goods
3,017
10.0
2,367
650
2.2
16.3
Food
and
kindred
products
3,238
11.6
2,391
847
3.0
9.4
Tobacco
manufactures
7,653
17.3
2,869
4,784
10.8
14.5
Textile
mill
products
1,759
7.9
2,231
(472)
-2.1
17.6
Apparel
and
other
textile
products
1,480
8.5
2,201
(721)
-4.1
32.9
Paper
and
allied
products
3,506
9.8
2,420
1,086
3.0
15.5
Printing
and
publishing
2,607
8.3
2,323
284
0.9
4.8
Chemicals
and
allied
products
4,267
9.5
2,502
1,765
3.9
22.5
Petroleum
and
coal
products
6,800
14.2
2,776
4,024
8.4
10.9
Rubber
and
misc.
plastics
products
3,328
12.1
2,401
927
3.4
18.5
Leatherandleatherproducts
1,365
6.8
2,189
(824)
-4.1
118.6 continued
Table 4.
Private
Employer
Health
Insurance
Costs by
Industry,
1992
(Continued)
Current
employer
Adjusted
employer
Difference
between
Import.s
and
exports
contributions
for
health
contributions
for
current
anid
adjusted
as a
share of
insurance
health
insurancea
contributions
domestic
shipmentsh
($
per
FTE)
(% of
wages)
($
per
FTE)
($
per
FTE)
(% of
wages)
(percent)
Industry
(1)
(2)
(3)
(4)
(5)
(6)
Transportation
and
public
utilities
3,615
10.1
2,621
994
2.8
Transportation
2,221
7.1
2,412
(191)
-0.6
11.7
Railroad
transportation
1,622
3.3
2,295
(673)
-
1.4
Local &
interurban
passenger
transit
559
2.7
2,128
(1,569)
-7.6
Trucking
and
warehousing
1,761
6.3
2,317
(556)
-2.0
Water
transportation
5,230
14.5
2,860
2,370
6.6
Transportation by air
4,293
11.3
2,713
1,580
4.1
Pipelines,
except
natural
gas
2,697
5.3
2,463
234
0.5
Transportation
services
2,201
7.8
2,386
(185)
-0.7
Communications
6,572
15.6
3,070
3,502
8.3
1.9
Electric,
gas,
and
sanitary
services
4,871
11.3
2,804
2,067
4.8
0.8
Wholesale
trade
2,426
7.1
2,177
249
0.7
4.8c
Retail
trade
788
4.5
2,090
(1,302)
-7.5
Finance,
insurance,
and
real
estate
2,123
5.9
2,190
(67)
-0.2
2.5
Depository
institutions
3,002
10.3
2,252
750
2.6
Nondepository
institutions
1,593
4.2
2,153
(560)
-
1.5
Security
and
commodity
brokers
2,864
3.3
2,242
622
0.7
Insurance
carriers
2,180
6.0
2,194
(14)
-0.0
Insurance
agents,
brokers,
and
service
1,216
3.4
2,126
(910)
-2.6
Real
estate
716
2.8
2,091
(1,375)
-5.3
Holding
and
other
investment
offices
4,106
6.7
2,329
1,777
2.9
Services
1,480
5.5
2,177
(697)
-
2.6
Hotels
and
other
lodging
places
1,784
9.3
2,205
(421)
-2.2
0.1
Personal
services
583
3.4
2,095
(1,512)
-8.8
Business
services
1,406
6.0
2,170
(764)
-3.2
1.2
Auto
repair,
services,
and
parking
754
3.6
2,110
(1,356)
-6.5
Miscellaneous
repair
services
1,821
6.9
2,209
(388)
-
1.5
Motion
pictures
2,469
7.5
2,268
201
0.6
Amusement
and
recreation
services
1,264
5.6
2,157
(893)
-4.0
1.7
Health
services
2,449
7.8
2,266
183
0.6
Legal
services
2,177
4.4
2,241
(64)
-0.1
Educational
services
296
1.3
2,068
(1,772)
-7.7
Social
services
139
0.8
2,054
(1,915)
-
11.5
Membership
organizations
68
0.4
2,047
(1,979)
-
10.6
Other
servicesd
1,791
4.3
2,206
(415)
-
1.0
Private
households
0
0.0
2,041
(2,041)
-
16.5
Sources:
Current
and
adjusted
employer
contributions
computed by
the
authors
from
unpublished
data of
the
Bureau of
Economic
Analysis
and
Lewin-VHI.
The
industrial
di.stribution of
total
emiiployer
payments is
estimated
for
census
years by
the
Bureau of
Economic
Analysis.
These
ratios
have
been
held
constant
since
the
last
census
year.
1987.
and
applied to
total
employer
contributions ot
each
year.
Imports,
exports,
and
shipments
are
from
the
1987
Input-Output
table
(BEA).
the
December
1992
Merchandise
Trade
supplement,
and
tabulated
from
U.S.
Department of
Commerce,
Buleau of the
CensLus
(1986). a.
Adjusted
premium
includes a 13
percent
increase in
average
costs to
cover
uninsured
workers
and
assumes
uniform
costs
for
nonretirees
(community
rating).
b.
Data
for
imports,
exports,
and
shipments
for all
industries
except
manufacturing
are
from
the
1987
Input-Output
table.
Bureau of
Economic
Analysis.
c.
This
figure
includes
both
wholesale
and
retail
trade.
d.
Other
services
include
museums,
botanical,
zoological
gardens;
engineering
and
management
services;
and
services
not
classified
elsewhere.
280 Brookings Papers: Microeconomics 1994
insurance, the burden of retiree benefits, which are a more or less fixed liability that is independent of employment, probably falls on share- holders.4' But a sudden equalization of costs or a move in that direction will initially accrue as a change in costs to businesses, and these wind- fall gains and losses may last for some time. (If responsibility for retiree benefits is shifted from companies, shareholders are likely to experience a one-time permanent increase in share values.)
Column 3 shows the cost per FTE of a system in which coverage is expanded to all workers, and employers pay 80 percent of the insurance premium. We assume that the cost for current employees is uniform across all plans and that the net cost of providing insurance for the 27 percent of the private work force not covered by their employers would be half that of an insured worker. We calculated average premiums for the total private economy after excluding the cost of retirees. We then added back the costs of retiree health insurance, which explain the differences among industries.42 In contrast, the employer cost under President Clinton's plan would not be uniform for at least four reasons. First, some companies would receive subsidies under the Clinton plan. Second, the Clinton plan, at least initially, would not eliminate regional variations in health costs. Third, some companies now offer benefits beyond those in the Clinton benefit package and payments beyond 80 percent of total insurance cost. While not required to continue offering such benefits, some companies almost certainly would do so. Finally, the costs of retiree benefits would initially remain with companies. While the Clinton plan would shift these costs to regional alliances completely by the end of four years, we think this proposal is unlikely to survive. Column 4 shows the change in health costs per FTE between the current system (column 1) and the extreme version of community rating (column 3). The differences are expressed as a percent of wages in column 5.
41. This point is of some significance, since retiree benefits are independent, within some range, of current employment; in contrast, benefits for current workers vary with employment. Economic analysis suggests that fixed costs have less effect on current pricing decisions than do variable costs, although both costs must eventually be covered if the business is to survive.
42. The estimates of retiree costs are very approximate. We used estimates from Lewin-VHI on costs at the level of the major industrial sectors, and we assigned those costs to the underlying two-digit industries as a common share of their health care spending.
Henry J. Aaron and Barry P. Bosworth 281
While the numbers do not accurately describe the distribution of health costs among industries under President Clinton's or any other proposed health reform, they do indicate tendencies from moving to community rating. It is obvious that the changes in the industrial dis- tribution of health care costs under such a system would be very large. Mining and manufacturing would be the largest gainers. Retail trade and most service industries would experience sizable losses.
These shifts are large enough to cause perceptible short-run eco- nomic reactions. In the long run, as noted, the cost of health insurance premiums is likely to be borne by labor in the form of higher or lower earnings or other fringe benefits. How this shifting occurs is much less clear. The change in costs could be directly reflected in nominal wages. If so, the adjustments would be concentrated in labor markets, with only secondary implications for prices or the reallocation of output among industries. Alternatively, some evidence from past changes in general employment taxes suggests that the costs are initially passed forward to all consumers in the form of higher prices.43 Subsequent reactions of companies to the higher real cost of labor lead to more capital-intensive methods of production, depressing wages and causing consumers to shift from labor-intensive products with the largest price increases. As a result, workers end up bearing a larger burden of the costs than just their share in consumption. The incidence effects even- tually mimic those with nominal-wage shifting, but through a process that may result in a larger change in relative prices and the composition of output.
Unlike a general employment tax, however, changes in health insur- ance costs are not uniform across companies. As we move from con- sidering a uniform economywide change in employment taxes to one that varies by industry and company, there is a dramatic increase in the elasticities of the demand and supply of labor. Accordingly, individual companies will find it difficult to pass health insurance costs forward if they are not shared by their competitors. Companies with significant increases in health insurance costs will have correspondingly stronger incentives to offset them by holding down growth of nominal wages or other fringe benefits. In reality, the adjustment process will vary widely
43. Gordon (1977). Forward shifting of the costs of a general employment tax implies accommodative monetary policy.
282 Brookings Papers: Microeconomics 1994
across companies in speed and character. Factor and product markets typically are not perfectly competitive. The extent of forward or back- ward shifting of the nominal costs will depend on how much leverage companies enjoy in product and labor markets.
While some see reform of health care financing as a boon to U.S. international competitiveness, health care reform will almost certainly have only trivial aggregate effects on foreign trade unless it changes national saving or investment. Without such changes, adjustments of the exchange rate would negate any changes in the average price of tradables. During a transitional period, however, the composition of exports and imports might change. For example, the automobile indus- try, with an older average work force and relatively high experience- rated health insurance costs, would gain significantly from community rating. Until and unless other elements of employee compensation off- set the drop in health insurance costs, automobile companies would enjoy increased profits or be able to cut prices.
The potential trade effects are highlighted by comparing the share of trade-the ratio of imports plus exports to total industry sales-in column 6 of table 4 with the distribution of gains and losses from an equalization of health care costs. The trade-weighted percentage change in health expenditures per FTE is - 28 percent, which corresponds to a drop in wages of 4 percent.44 This change indicates that companies in traded-goods industries would experience on the average a drop in direct health care costs from a complete equalization of health care spending per worker.
Conclusion
We have emphasized the importance of distributional considerations in the reform of health care financing. Over the long haul, reform may well slow the growth of spending on health care, an allocative effect of considerable potential significance. In the immediate future, however, the major consequence of reform will be redistribution of goods and services, most obviously through the extension of coverage to the cur- rently uninsured. But the size of the redistribution of financial respon- sibility for health care provided to the currently insured is impressive
44. We calculate the trade-weighted change in health care costs per FTE by multi- plying the percentage change in FTE costs by each industry's share of total trade.
Henty J. Aaron and Barry P. Bosworth 283
and of considerable political and economic significance. Reform will generate among U.S. companies short-run gains and losses that are large enough to affect perceptibly the composition of foreign trade and the growth of wages in various sectors.
Most of the debate among economists has concerned the effects of health care reform on broad national aggregates rather than on specific economic sectors for several reasons. Economic theory alone can go a long way toward analyzing the effects of health care reform within a simplified, representative-firm, representative-household framework. This approach demands relatively few data for empirical analysis. In contrast, the data demands for disaggregated analysis are formidable, and existing data do not satisfy those demands. We have adopted rough and ready techniques to estimate the effects of a move to community rating on various industries. We believe improved data would support our belief that the transition from experience rating to community rating will entail significant adjustments. The algebraic resultant of these ad- justments is almost certainly minor, but the absolute size of offsetting adjustments to gains and losses deserves more analytical attention than it has received, because it is these gains and losses that, for good or ill, drive the political debate.
Risk Rating
A central goal of many reform plans is to end differential pricing and insurance redlining in order to provide everyone equal and effective financial access to care. Community rating will achieve that objective from the perspective of the purchaser of a health plan. The Clinton plan would cover everyone and charge employers in regional alliances a uniform premium for enrollees in each family type. Competing health plans within each alliance could not refuse coverage to anyone who wished to join. Such a system simply shifts the problem of adverse selection back to providers, however. Health plans that enroll a dispro- portionate number of high-cost members will not be financially viable, and others will make high profits.45
The Clinton plan envisions controlling the selection bias through a
45. This section borrows extensively from Newhouse (1994).
284 Brookings Papers: Microeconomics 1994
system in which the alliance would reimburse plans according to "risk- adjusted," prospectively established premiums. Prospective payment would maximize incentives for efficiency. By luck or design, some plans are bound to enroll patients with costs that are lower or higher than average. To discourage managers of plans from trying to exclude costly patients and to enroll or retain only the relatively young or healthy or parsimonious users of health care, regional alliances would make "risk-adjusted" payments to approved plans.
Thus the goals of maximizing incentives for efficiency, preventing "cream-skimming," and giving patients fairly priced alternative deliv- ery systems are inextricably linked. If cream-skimming cannot be pre- vented, reimbursement that maximizes efficiency will result in price differentials that reflect not organizational efficiency but adverse or favorable selection by plans. Supporters of competition among ap- proved health plans acknowledge that risk rating is essential to permit competition to work effectively. The Clinton plan instructs the National Health Board to develop such reimbursement rules. If that proves im- possible, the plan calls for mandatory reinsurance.
Currently, the science of risk rating for prospective premiums is too inexact to prevent health plans from gaining enormously from cream- skimming. One test of the ability to risk rate is given by the methods used to pay health maintenance organizations under medicare. Because HMOs do not bill on a fee-for-service basis, medicare pays them a flat sum that differs according to the enrollee's age, sex, institutional status, and welfare status. Despite this adjustment, costs for medicare eligibles who joined HMOs were 23 percent lower and hospitalization 25 percent lower in the year before enrollment than for other medicare eligibles, and mortality rates were 25 percent lower in the year after enrollment.46 These results indicate that selection based on factors not observable by this risk-rating procedure left ample room for large profits to be earned. No demonstrably superior risk-rating procedure now exists.
While research may produce better techniques for risk adjustment to discourage plans from engaging in selection practices, trusting plans to forgo selection requires a great leap of faith. The task of risk adjusters is daunting. While they do not need to adjust for all variation in use, adjustments must take enough of the profit out of selection to prevent
46. Hill and Brown (1990) cited by Newhouse (1994, p. 135).
Henry J. Aaron and Barry P. Bosworth 285
at-risk payers from bothering to try to select patients. Newhouse reports that the best available techniques "should be able to predict at least 15 to 20 percent of the variance in annual spending across a random sample of the population. "47 However, he calculates, risk adjustment that ex- plained 70 percent of the variance in predictable health expenditures would eliminate less than one-third of the maximum profit that plans would earn if they received payments based on the population average and excluded all patients with above average-predicted outlays.
The technique of risk rating suffers from a number of other short- comings. First, it is endogenous to the method of care that is employed. The much-discussed small-area variations in surgical rates and use of diagnostic procedures, as well as other variations in medical procedure, mean that the size and perhaps even the sign of risk adjustments depends on the mode of care-which is to say, on the severity of efforts to control spending. Thus, while the Clinton plan would leave risk ad- justment to the National Health Board, the appropriate risk-adjuster probably varies regionally.
Second, it is impossible to imagine that any regulatory procedure or ex ante risk-adjuster could completely eliminate the opportunity and profit for each plan from shedding high-cost patients.48 Since individuals are free to change plans with no financial penalty, providers could induce high-cost patients to leave simply by being inconsiderate. Those who attempted to deal with the severely ill in a caring fashion would develop a reputation that would attract others with a high probability of the need for high-cost care. Providers also have a high degree of control over the intensity of treatment for a given condition. Thus it is not sufficient to predict variation in costs of groups; health plans know the costs of indi- viduals they serve. Plans that try to shed high-cost patients would be rejecting individuals, not groups. The problem of risk selection arises whenever two or more payers that are financially at risk compete for patients, and providers are not paid retrospectively for services rendered.
47. Newhouse (1994, p. 140). 48. Commenting on this problem to one of us, Peter Diamond wondered how one
could stop a gate-keeper physician from telling a patient newly diagnosed with cancer, AIDS, or any condition requiring costly diagnosis or therapy, "I'll refer you to our [oncologist, hematologist, surgeon, and so on]. But just between you and me, they are not as good as the physicians at [anywhere else]." Professional ethics will discourage such behavior, but if professional ethics sufficed, cream-skimming would not be an issue in the first place. Newhouse (1994) expresses the same concern.
286 Brookings Papers: Microeconomics 1994
Thus health care finance seems to face a nasty dilemma: one can choose a retrospective payment arrangement that is free of selection problems, but it will gut incentives for efficiency. Or one can choose a prospective payment system that maximizes incentives for efficiency, but it will be fraught with selection problems. Newhouse suggests that the practical way out of this dilemma is a reimbursement system that is partly prospective and partly retrospective and cost based. One gives up something on incentives for efficiency but makes selection problems more manageable.
It is worth observing that other countries handle this problem differ- ently. They have not attempted to extend community rating to the provider level. Instead they require that salaried physicians or hospitals subject to fixed budgets provide services that entail big financial risks. Hospitalization, out-patient procedures, and complex-but-definable ser- vices provided in physicians' offices (for example, chemotheraphy in oncologists' offices and cornea transplants done on an out-patient basis) would fall in this category. Physicians and other members of the com- munity must negotiate on how to allocate hospital budgets. Such a regulatory approach has well-known problems of its own-limits on institutional change, for example. And it does not fit easily with health maintenance organizations and other organized practice arrangements that are of growing importance in the United States. But it avoids the problems that arise because of selection.
Comments and Discussion
Comment by David M. Cutler: Henry Aaron and Barry Bosworth have written an extremely interesting paper on the economics of health care reform. It is fashionable of late, and quite easy, for economists to choose a particular reform proposal and point out all its economic flaws, leaving the reader with the belief that anything would be preferable to that proposal. Aaron and Bosworth wisely have avoided that tempta- tion. Instead their paper focuses on the vexing issues that any reform proposal must address.
Aaron and Bosworth do a nice job of summarizing the issues in- volved in reform, and I agree with most of the points made in the paper. I think the real dilemma, however, is that many of the goals of reform are not mutually consistent or, indeed, consistent with other public sector priorities. Thus, while designing a reform plan in isolation is hard enough, integrating it with the rest of public policy is even harder. Consider the goal of universal coverage. Aaron and Bosworth note the obvious tension between providing universal coverage and lowering health costs; universal coverage will necessarily increase spending, and yet one of the goals of reform in general is to lower health spending. This is not the extent of the difficulty, however. Let me discuss three other issues.
The first issue is the effect of universal coverage on retirement. Universal coverage will almost certainly increase the number of re- tirees. In the current market, purchasing health insurance as an early retiree is difficult, if not impossible. Coverage is poor, administrative costs are high, and premiums vary with the individual's health status. Health reform is likely to change all that. Under the Clinton plan, for
287
288 Brookings Papers: Microeconomics 1994
example, coverage will be more generous, administrative costs will be lower, and community rating of premiums coupled with low-income subsidies will reduce the costs of insurance by up to two-thirds. Even with less generous subsidies to older workers, the effective cost of purchasing insurance as a retiree will surely fall. The net effect almost certainly will be increased retirement. I Indeed, administration estimates suggest an additional 350,000 to 600,000 early retirees. Unfortunately, this conflicts with other public policy measures that have been under- taken to postpone retirement, such as increasing the age of full quali- fication for social security benefits. Is universal coverage still worth it?
A second issue is the effect of reform on labor supply for people with low incomes. One of the goals of health reform is to eliminate ''welfare lock" -the fact that some people remain on welfare so that they can collect medicaid benefits, because private insurance is often unavailable at low-wage jobs. By making health insurance available regardless of employment status, the incentives to remain on welfare will certainly be reduced. Universal coverage is likely to decrease the return to working, however. Providing universal coverage necessarily involves government subsidies to poor families. Health insurance is, after all, quite expensive. To avoid large budgetary costs, these subsi- dies must be phased out as income increases, thus raising the effective tax rate on families in the phase-out region.
Consider a simple example. Suppose that health insurance premiums for a family are $5,000, that families with no income will receive insurance for free, and that families at 200 percent of the poverty line (about $30,000) will pay for insurance without subsidies. The average marginal tax rate for families below 200 percent of poverty will be 17 percent. One can disguise this through separate subsidies to employers and families, but the net effect is basically the same. When this implicit tax is combined with income taxes, social security taxes, the phase-out of the earned income tax credit, and the implicit tax on welfare benefits, the total marginal tax rate can get extremely high. Is universal coverage still worth it?
The third issue is the risk associated with the long-run financing of universal coverage. For the past several decades, real per capita health costs have grown at an annual rate of more than 4 percent. Aaron and
1. Madrian (1994).
Henry J. Aaron and Barry P. Bosworth 289
Bosworth note that the Clinton plan relies on extremely large reductions in this growth rate to fund the expansions in coverage in the first several years. This is troubling, because we have no historical experience with cost growth at that level.
Even more troubling, however, are the prospects for long-term fi- nancing of reform. In the short run, at least, there are large potential savings from eliminating care that is inappropriate or unnecessary. Indeed, economic research suggests that up to one-third of many com- mon medical procedures have less benefit than risk to the patient.2 In the long run, however, the underlying growth of health costs seems attributable more to changes in technology than to increases in unnec- essary or inappropriate care.3 Hence, unless the reform reduces the underlying rate of technological change, the nation may be about to invest in a program with long-run cost growth three times that of the rest of the economy.
What are the implications of such a scenario? In the private sector, not much. Individuals can, and do, decide how much they want to spend on goods with rapidly changing prices. In the public sector, the implications are enormous. Suppose the costs of health reform are greater than expected. The public sector has five options: increase the deficit, reduce the generosity of benefits, lower subsidies to the poor, raise taxes, or limit payments to health providers. None is particularly pleasant or easy. And yet planning for these circumstances must be part of reform. Accounting for this risk, is universal coverage still worth it?
My point is not to argue that we should forgo universal coverage, but just that we must decide whether the goal of universal coverage is worth these costs. Aaron and Bosworth argue that there are economic isstues that any reform must address. I think the problem is more com- plicated than that. Health reform is in many ways a set of mutually exclusive goals. Which is more important when they conflict? How much are we willing to pay for the benefits of universal coverage? What price is too high? These are the questions we must begin to ask.
Comment by Mark V. Pauly: One of the potentially important eco- nomic issues in health reform is whether insurance premiums or taxes
2. See Cutler (forthcoming) for a summary. 3. Newhouse (1992).
290 Brookings Papers: Microeconomics 1994
should vary with the risk level of the individual or population insured. Aaron and Bosworth concentrate on this question and produce some very striking estimates of the redistributive effects of a switch from the current pattern of experience rating across almost all groups and com- munity (uniform) premiums within most groups, to one of full or com- plete community rating for the under-65 population. They do not give extensive treatment to some other economic issues, such as the potential for appropriate cost containment or the redistribution across income classes associated with the subsidies embodied in most reform plans, and one could argue that these are much more important economic issues than the question of redistribution across risk levels. Whatever the subjective judgment about economic importance, however, Aaron and Bosworth are quite helpful in dealing with what is probably the knottiest (and most misunderstood) political issue as the nation gropes toward universal coverage and a more rational system of incentives in health care.
The paper poses the positive question of the distributional conse- quences of a movement toward full community rating in which premi- ums do not take account of differences across individuals or groups in the age of those covered, their health levels or previous use of medical care, or (in their estimates, not in the Clinton plan) in price levels or practice patterns across geographic areas. I think these estimates, pre- liminary though they are, are very useful in calling attention to a fairly substantial redistribution from young to old and from low medical cost (usually low income) areas to high medical cost areas. Most of my comments will deal with the normative question the authors pose: which is better, community rating or experience rating? I must confess that, after reading their critical analysis of the pros and cons of each method, my visceral reaction was to answer "neither." Experience rating is or can be unfair to people struck by long-term illnesses over which they have no control, while community rating, in addition to having inequi- ties of its own, seems impossible to enforce without strong regulation that touches the insurance decisions of everyone, even those who are not experiencing substantial redistribution-if community rating can be enforced at all. Aaron and Bosworth appear to conclude, nevertheless, that community rating is preferable on efficiency and equity grounds to experience rating, even though implementation of full community rat- ing would imply substantial redistribution.
Henry J. Aaron and Barry P. Bosworth 291
My own judgment is that the choice between full community rating and the status quo is a Hobson's choice and that other feasible alter- natives might score better. There are, I would argue, some potential efficiency gains from varying premiums with some indicators of risk, but the pattern would be different from the current confused and com- plicated arrangements.
Aaron and Bosworth ask what efficiency advantages there are for basing premiums on risk. The most obvious advantage is one they do not discuss but which may not be so relevant to the debate about health reform. If buyers can choose different amounts of insurance coverage, there can be efficiency loss as high risks buy too much coverage and low risks buy too little. To the extent, however, that health reform mandates a particular benefit package for a person, the impact of dis- torted prices on quantity of insurance desired will not be relevant be- cause the individual is not allowed to choose. It may still be inefficient to require community rating for any coverage supplemental to the min- imum mandated coverage, however, especially if (as seems reasonable) that optional coverage is not of major social concern.
Aaron and Bosworth do discuss two other potential efficiency advan- tages to risk rating. One is that varying premiums with risk levels may deter behavior that is risky to health. They conclude, correctly in my view, that this is not a very strong argument for experience rating. Usually alternative devices that affect only voluntary risk-increasing behavior can be found (for example, a tax on cigarettes), whereas experience rating would lead to jumps in premiums for risks over which the person had no control.
The second potential efficiency of risk rating is that it greatly reduces the risk of "cream-skimming" by insurers-the tendency to avoid high-risk customers and seek low-risk ones. With community rating, high-risk insureds are money losers. Experience rating allows the high- risk insured to be charged high premiums, which means that they can be as profitable as any other insured.
In principle, a formula that adjusted transfers across insurers for the risk levels of the persons insured would work just as well-and would in fact obviate the need to require community rating. Under perfect risk adjustment, community rating is the competitive equilibrium pricing strategy. Precisely for the reasons Aaron and Bosworth note in this paper, however, this kind of perfect adjustment is now and will forever remain impossible.
292 Brookings Papers: Microeconomics 1994
Accordingly, it seems plausible that the best system might be one that permitted some risk rating-enough to ensure that there are fewer enormously profitable or extremely costly insureds. For example, per- mitting premiums to reflect the age of the insured does not impose any risk on the insured: the only risk is that I will not grow older, not that I will. But it would reduce the incentive to insurers to avoid insuring middle-aged people, relative to community rating. It is really only the risk of unpredictable chronic illness that should be shielded against through so-called "community rating within categories" -wonkspeak for permitting insurance premiums to reflect location or demographics but not the insured's state of health.
The key policy design here is the tradeoff against enforcement of rating laws and the possibility of exposing people to the risk of becom- ing a high risk. I would speculate that the optimal insurance against this event would have the same characteristic as other insurance with moral hazard-partial coverage. Specifically, persons might be re- quired to bear some of the higher premiums associated with their iden- tifiable health states, but their exposure would be limited. I have dis- cussed elsewhere how a system that does this might work in practice.4
Aaron and Bosworth do briefly discuss the possible use of cost shar- ing as a device to control cost, but they dismiss it because, with rea- sonable upper limits on out-of-pocket payments, the bulk of the medical care dollars that accrue in the case of serious illnesses could not be affected by cost sharing. Results from the Rand health insurance ex- periment challenge this conclusion. What appears to be the case is that relatively modest front-end cost sharing (small deductibles) can be quite effective in reducing the frequency of episodes of illness, including episodes that eventually result in hospitalization and high cost.5 This is somewhat of a chilling thought: if I get care free of charge, I may pick up the phone and call for an appointment that leads to a hospital- ization I could have avoided, with virtually no effect on my health. It does suggest, however, that cost sharing might be effective, although supply side controls through competitive managed care plans will prob- ably be sought by most consumers as well.
Aaron and Bosworth have offered a useful diagnosis of an important
4. Pauly (1992). 5. Keeler and others (1988).
Henry J. Aaron and Barry P. Bosworth 293
problem. They do not have any pills in their little black bag that they can recommend wholeheartedly, but they have told us much more about the nature of the problem we face.
General Discussion: Several participants commented on the possible effects of moving from experience to community rating in setting health insurance premiums. Donald Kenkel argued that such a change could ultimately increase overall health care costs because many health prob- lems, such as heart disease associated with smoking or bad nutritional habits, reflect individual choices. Community rating, he asserted, re- duces the financial incentives to maintain health habits. As an example, Kenkel noted that, as many corporations have created self-insurance arrangements during the past decade to provide health care services to their employees, they have also begun to institute work-site health and wellness programs. According to Kenkel, these firms believe that their sponsorship of such programs yields net cost savings by reducing the overall health care expenditures of their employees. By equalizing health care premiums, he said, the move to community rating would eliminate the incentive for corporations to care about the health deci- sions of their workers, reducing the number of wellness programs and ultimately increasing overall health care costs.
George Borts argued that the community rating system envisioned by the Clinton health care plan entails not only a redistribution of income from the high-risk to the low-risk population, but also efficiency losses resulting from the requirement that all individuals be covered by a comprehensive plan. Borts argued that, if high-risk and uninsured individuals were offered health insurance subsidies through income grants rather than through lowered prices, many might not want to purchase as much insurance as the Clinton plan would require. He also argued that low-risk individuals would, under experience rating, prefer to purchase types of insurance coverage that would not be available under the Clinton plan, such as insurance with very high deductibles and coinsurance ratios.
Moreover, low-risk individuals would wastefully try to find loopholes in the rules, organizing their own cooperative health care groups and health insurance organizations in order to reduce their premiums. He noted that college students, a low-risk group in general, can now purchase health insurance for less than $1,000 a year. Under the Clinton plan, it is highly
294 Brookings Papers: Microeconomics 1994
likely that someone would try to remove this group from the community rating system and provide it with low-cost insurance. Henry Aaron re- sponded that the Clinton plan would not permit such schemes.
Borts also suggested that the authors add to the paper a more detailed discussion of the problems posed by experience rating. It was not clear to him whether the authors consider it faulty because it fails to classify risk accurately or, conversely, because it does so too accurately, cre- ating socially unacceptable price differentials. In addition, Borts said that the paper does not adequately discuss those alternatives to com- munity rating that might facilitate coverage of the uninsured and reduce the financial burden of cross-subsidy imposed on low-risk individuals. He believed that such alternatives would include direct subsidization of uninsured and high-risk individuals or subsidization of bare-bones health insurance policies.
Addressing the authors' claim that advances in statistical profiling in molecular biology will eventually permit a more accurate determination of each individual's health risks, Borts said that such advances would not be able to eliminate all statistical error. Consequently, he said, there will still be a need for insurance, although the market will be able to price it more efficiently. Michael Katz argued that these profiling developments would, in fact, destroy the insurance market because the purpose of insurance is to even out risks.
Several participants questioned the ability of the Clinton health care plan to yield its promised cost saving. Paul Joskow argued that the cost savings assumed by the Clinton plan were unlikely to be realized. The plan anticipated major cost savings from consolidating hospitals, elim- inating "unnecessary" medical procedures, and slashing "unneces- sary" administrative costs. The historical record on hospital consoli- dations suggests that the costs savings will be smaller than anticipated. In addition, he said, a large portion of the so-called "unnecessary" administrative expenditures are actually designed to control other costs, in particular the kinds of medical procedures that patients are provided and the length of hospital stays. He concluded that real saving can only come from a system, organized to provide less care. Ideally, Joskow argued, only care that provides no value or negative value would be eliminated. That is an unlikely prospect, however, because it is difficult to distinguish procedures deemed to have zero or negative benefits ex post from procedures that are expected to be beneficial or are replacing
Henry J. Aaron and Barry P. Bosworth 295
more expensive alternative procedures ex ante. It is certainly implau- sible to assume that any system will eliminate all zero or negative benefit procedures without also eliminating some beneficial procedures. Agreeing with both Gilbert and Joskow, Richard Schmalensee added that the Clinton plan's complex mix of alliances and expenditure ceilings is unlikely to yield savings that the wide range of institutional health care arrangements used around the world have been unable to attain.
In response, Aaron argued that the current system is not under financial control. He added that access to insurance has been declining under the existing system and that much of the continued increase in costs is attrib- utable not to extensions of medical technology but to services that are not worth their cost. There may be financial risks in changing the system, Aaron concluded, but there are also risks in maintaining the status quo.
Katz agreed with Joskow's argument that allegedly wasteful admin- istrative costs often keep medical costs down. He said that any reform framework must show how it would contain costs better than existing market-based arrangements with strong cost-control incentives, such as health maintenance organizations.
Elizabeth Bailey noted that those who favor health care reform tend to assume implicitly that the continued growth of the share of national income devoted to health care expenditures must be arrested. She cited the contrary presumptions of William Baumol's cost disease model, which argues that as a society grows richer, it may want to invest a greater portion of its resources in such areas as education and health care. According to Bailey, insofar as health care reform plans attempt to stem the growth of health care outlays, they may be interfering with the legitimate and reasonable choices of individuals.
Mancur Olson argued that, contrary to the authors' conclusions, the Clinton health care reform plan may bring about significant job loss. Although the authors assume that increased health costs for firms would result in lower wages and, concomitantly, little unemployment, Olson noted that, in general, wages and prices are sticky, causing markets to adjust slowly and to create involuntary unemployment. In addition, Olson suggested that employer-mandated health insurance coverage that does reduce take-home pay may create social sympathy for low-wage workers, ultimately generating support for a higher minimum wage, which in turns brings about increased unemployment among workers at the bottom of the wage scale.
296 Brookings Papers: Microeconomics 1994
Alvin Klevorick noted an interaction between the potential for health care reforms to have varying effects on different regions and economic sectors and the lack of consensus about the specific shape of reform. He suggested that any health reform plan should be made flexible enough to accommodate, within a system of broad constraints, different plans by individual states acting as "laboratories of democracy." The authors and discussants presume that reform will be implemented on a national basis, he said, but the magnitude and complexity of the task suggest that variety and experimentation might ultimately yield the most beneficial results by providing more information about what works and what does not.
Several participants raised international comparisons. Although agreeing with the paper's contention that the current U.S. health care system is unusually complex, Schmalensee contended that systems in other Western countries have not proven fully satisfactory either. Aaron responded that public opinion polls show that citizens of these other countries are generally more satisfied with their health care delivery than Americans are with theirs. Aaron also noted that the health care indicators of these countries are usually as good as or better than those of the United States.
Citing the Canadian health care system, which is often presented as a model for U. S. reform efforts, Leonard Waverman said that, although Canada devotes a lower percentage of its gross domestic product to health expenditures than does the United States, Canada's expenditure growth rate is actually greater. He also maintained that Canada has been able to create such a lean system only by rationing care. In Ontario, for example, he said that provincial authorities exercise strict control over such areas as the future supply of doctors, the number of days a year that physicians can practice, the number of dialysis machines in the province, and the amount of time an individual can remain in a hospital for treatment of a particular medical problem.
Joskow argued that, at the beginning of the paper, the authors should present the attributes of a good insurance contract. He said that a good contract clearly would not allow an increase in premiums or a loss of insurance as a result of illness or an exhaustion of benefits as a result of an expensive medical problem. By laying out the attributes of a good policy, Joskow said, the authors would be providing a framework for evaluating the various methods proposed to reorganize the health care system.
Henry J. Aaron and Barry P. Bosworth 297
References
Aaron, Henry J. 1991. Serious and Unstable Condition: Financing America's Health Care. Brookings.
Berk, Marc L., and Alan C. Monheit. 1992. "The Concentration of Health Expenditures: An Update. " Health Affairs 11 (Winter): 145-49.
Burkhauser, Richard V., and John A. Turner. 1985. "Is the Social Security Payroll Tax a Tax?" Public Finance Quarterly 13 (July): 253-67.
Burtless, Gary. 1986. "The Work Response to a Guaranteed Income: A Survey of Experimental Evidence." In Lessons from the Income Maintenance Ex- periments: Proceedings of a Conference Held in September 1986, edited by Alicia H. Munnell, 22-59. Conference Series 30, Federal Reserve Bank of Boston.
Congressional Budget Office. 1993a. "Responses to Uncompensated Care and Public-Program Controls on Spending: Do Hospitals 'Cost Shift'?" CBO Papers. May.
. 1993b. "Projection of National Health Expenditures: 1993 Update." Congressional Budget Office Memorandum. October.
. 1994. An Analysis of the Administration's Health Proposal. February.
Cutler, David M. Forthcoming. "A Guide to Health Care Reform." Journal of Economic Perspectives.
Foster Higgins. 1991. "Health Care Benefits Survey: Report 4, Retiree Health Care." Princeton, N.J.: Foster Higgins.
Gordon, Robert J. 1977. "Can the Inflation of the 1970s Be Explained?" Brookings Papers on Economic Activity 1: 253-77.
Gruber, Jonathan. 1992a. "The Efficiency of a Group-Specific Mandated Ben- efit: Evidence from Health Insurance Benefits for Maternity." Working Pa- per 4157. Cambridge, Mass.: National Bureau of Economic Research. Sep- tember.
. 1992b. "State Mandated Benefits and Employer Provided Health In- surance." Working Paper 4239. Cambridge, Mass.: National Bureau of Economic Research. December.
Gruber, Jonathan, and Alan B. Krueger. 1991. "The Incidence of Mandated Employer-Provided Insurance: Lessons from Workers' Compensation Insur- ance." In Tax Policy and the Economy, edited by David Bradford, 111-43. Cambridge, Mass.: National Bureau of Economic Research.
Gruber, Jonathan, and James M. Poterba. 1993. "Tax Incentives and the Decision to Purchase Health Insurance: Evidence from the Self-Employed." Working Paper 4435. Cambridge, Mass.: National Bureau of Economic Research. August.
Hamermesh, Daniel S. 1993. Labor Demand. Princeton University Press.
Hamermesh, Daniel S., and Stephen A. Woodbury. 1990. "Taxes, Fringe
298 Brookings Papers: Microeconomics 1994
Benefits and Faculty." Working Paper 3455. Cambridge, Mass.: National Bureau of Economic Research. September.
Health Insurance Association of America. 1991. Source Book of Health Insur- ance Data: 1991. Washington, D.C.
1992. "Employer-Sponsored Health Insurance in 1991: Policy and Research Findings." Washington, D.C.
Hill, J.W., and R. S. Brown. 1990. Biased Selection in the TEFRA HMOICMP Program. Princeton, N.J.: Mathematica Policy Research.
Keeler, Emmett B., and others. 1988. "The Demand for Episodes of Medical Treatment in the Health Insurance Experiment." Report R-3454-HHS. Rand Corporation, Santa Monica, Calif. March.
Krueger, Alan B. 1993. "Observations of Employment-Based Government Mandates with Particular Reference to Health Insurance." Princeton, N.J.: Princeton University. Mimeo. October 15.
Lewin-VHI, Inc. 1993. The Financial Impact of the Health Security Act. Wash- ington, D.C.
Long, Stephen H., and M. Susan Marquis. 1993. "Gaps in Employer Cover- age: Lack of Supply or Lack of Demand?" Health Affairs 12 (supplement): 282-93.
. Forthcoming. "The Uninsured Access Gap and the Cost of Universal Coverage." Health Affairs (Spring).
Madrian, Brigitte. Forthcoming. "The Effect of Health Insurance on Retire- ment.'" Brookings Papers on Economic Activity.
McDonnell, Ken. 1993. "BLS Survey Shows Decline in Group Health and Retirement Plan Participation." Employee Benefit Research Institute Notes 14 (August): 6-8.
Mendelson, Daniel N., and William B. Schwartz. 1993. "The Effects of Aging and Population Growth on Health Care Costs." Health Affairs 12 (Spring): 119-25.
Montgomery, Edward, Kathryn Shaw, and Mary Ellen Benedict. 1992. "Pen- sions and Wages: An Hedonic Price Theory Approach." International Eco- nomic Review 33 (February): 111-28.
Newhouse, Joseph P. 1989. "Measuring Medical Prices and Understanding Their Effects: The Baxter Foundation Prize Address." Journal of Health Administration Education 7 (Winter): 19-26.
. 1992. "Medical Care Costs: How Much Welfare Loss?" Journal of Economic Perspectives 6 (Summer): 3-21.
. 1994. "Patients at Risk: Health Reform and Risk Adjustment." Health Affairs 13 (Spring): 132-46.
Pauly, Mark V. 1992. "Risk Variation and Fallback Insurers in Universal Coverage Insurance Plans." Inquiry 29 (Summer): 137-47.
Schieber, George J., Jean-Pierre Poullier, and Leslie M. Greenwald. 1993.
Henry J. Aaron and Barry P. Bosworth 299
"Health Spending, Delivery, and Outcomes in OECD Countries." Health Affairs 12 (Summer): 120-29.
Schwartz, William B., and Daniel N. Mendelson. 1994. "Eliminating Waste and Inefficiency Can Do Little to Contain Costs. " Health Affairs 13 (Spring): 224-38.
Smith, Robert S., and Ronald G. Ehrenberg. 1983. "Estimating Wage-Fringe Trade-Offs: Some Data Problems." In The Measurement of Labor Cost, edited by Jack Triplett, 347-69. University of Chicago Press.
Summers, Lawrence H. 1989. "Some Simple Economics of Mandated Bene- fits." American Economic Review, Papers and Proceedings 79 (May): 177- 83.
Summers, Lawrence H., and Lawrence Katz. 1989. "Industry Rents: Evidence and Implications." Brookings Papers on Economic Activity: Microeconom- ics: 209-75.
U.S. Department of Commerce. Bureau of the Census. 1986. U.S. Commodity Exports and Imports as Related to Output: 1982 and 1981.
U.S. Department of Labor. Bureau of Labor Statistics. 1993. Employee Ben- efits in Medium and Large Private Establishments, 1991. Bulletin 2422.
. 1991. Employee Benefits in Small Private Establishments, 1990. Bul- letin 2388.
Waldo, Daniel R., and others. 1989. "Health Expenditures by Age Group, 1977 and 1987." Health Care Financing Review 10 (Summer): 111-20.
Warshawsky, Mark J. 1992. The Uncertain Promise of Retiree Health Benefits: An Evaluation of Corporate Obligations. Washington, D.C.: American En- terprise Institute Press.
Woodbury, Stephen A., and Wei-Jang Huang. 1991. The Tax Treatment of Fringe Benefits. Kalamazoo, Michigan: W. E. Upjohn Institute for Employ- ment Research.