1 Economic Losses for Florida Agriculture Resulting from Hurricane Michael Alan W. Hodges, Christa D. Court, Caleb A. Stair University of Florida-IFAS, Food and Resource Economics Department October 26, 2018 Source: UF-IFAS
Transcript
1
Economic Losses for Florida Agriculture
Resulting from Hurricane Michael
Alan W. Hodges, Christa D. Court, Caleb A. Stair
University of Florida-IFAS, Food and Resource Economics Department
October 26, 2018
Source: UF-IFAS
2
Economic Losses for Florida Agriculture Resulting From Hurricane Michael
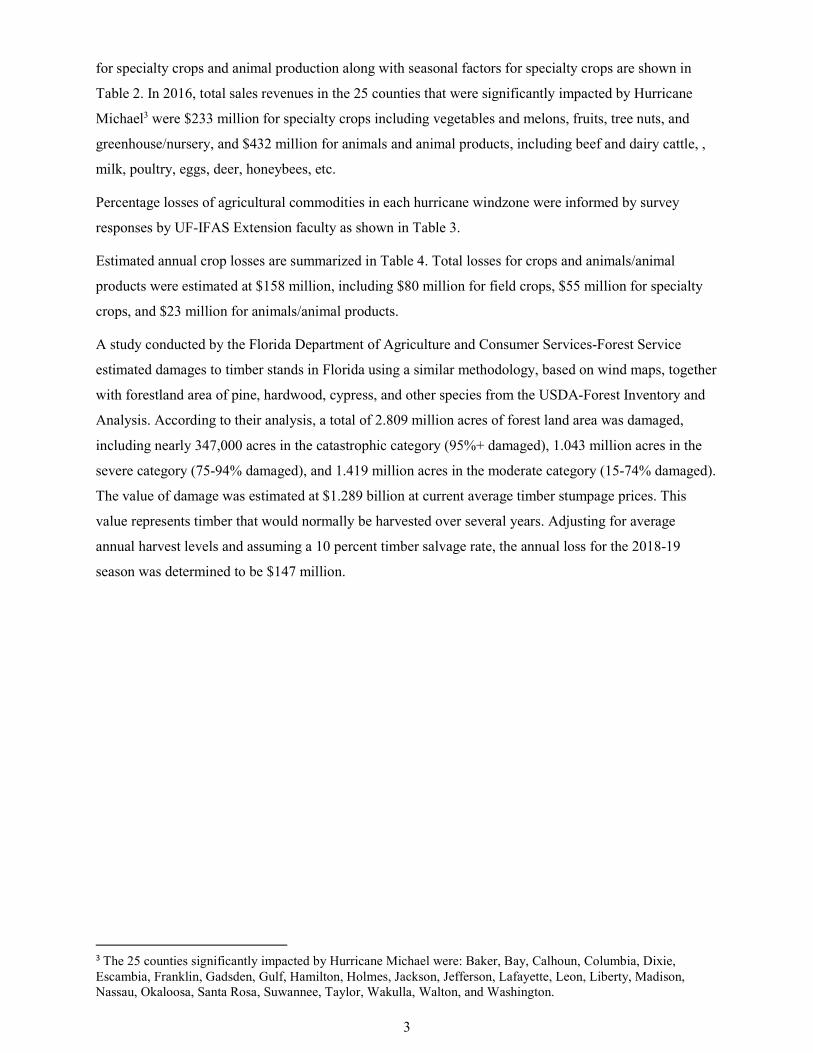
Hurricane Michael made landfall near Mexico Beach, FL on October 10, 2018 as a category four
hurricane with peak sustained winds of 155 miles per hour, making it the strongest hurricane on record to
make landfall in the Florida panhandle. Hurricane Michael significantly impacted Florida agriculture,
causing widespread crop, livestock, and timber losses across Northwest Florida. This report provides
estimates of agricultural losses for the state of Florida.
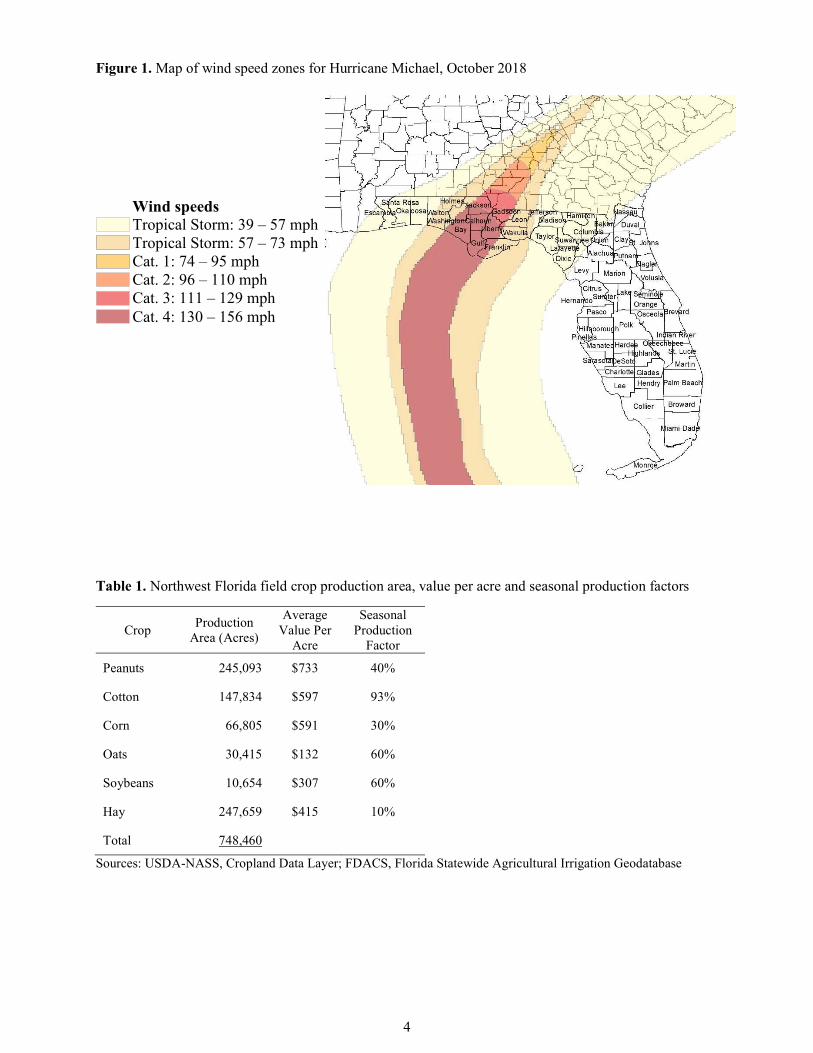
Hurricane and tropical storm force winds from Hurricane Michael were mapped according to information
from the National Hurricane Center, as shown in Figure 1. The windspeed zones were overlaid on
geospatial data compiled from the Cropland Data Layer (CDL) from United States Department of
Agriculture National Agricultural Statistics Service (USDA-NASS) and the Florida Statewide
Agricultural Irrigation Demand Geodatabase (FSAID) available from the Florida Department of
Agriculture and Consumer Services to determine the area of various field and row crops within each
windspeed zone.1 In addition, secondary data sources were used for specialty crops such as vegetables,
fruits, tree nuts, and nursery/greenhouse, that are not represented well for this region in the geodatabases,
to allocate losses by county and windspeed zone.
Estimated loss values for field and row crops were based on the area affected (acres) together with
average yields per acre and commodity prices from USDA-NASS crop surveys for the past three years,
seasonal factors derived from crop conditions reports and Florida’s planting seasons, and percentage loss
estimates collected via online survey from University of Florida-IFAS Extension faculty within the
region.2 Seasonal factors represent the approximate share of the annual production period that was likely
disrupted by hurricane damages. Losses for annual winter vegetable crops that were early in their season
at the time of the storm reflected 30 percent of the average annual value to account for a shortened
production season and expected market distortions due to later production dates. Loss estimates were not
included for crops not generally in production at the time of the storm.
Regional crop area, average value per acre, and seasonal factors for field and row crops are shown in
Table 1. The total field and row crop area impacted by Hurricane Michael was nearly 750 thousand acres,
comprised of approximately 247,000 acres of hay, 245,000 acres of peanuts, 148,000 acres of cotton,
67,000 acres of corn, 30,000 acres of oats, and 11,000acres of soybeans.
Estimated loss values for specialty crops and animal production were based on the latest available data on
factors for specialty crops and percentage loss estimates from UF Extension faculty. Regional revenues
1 CDL data available at https://nassgeodata.gmu.edu/CropScape/ and FSAID data available at
https://www.freshfromflorida.com/Business-Services/Water/Agricultural-Water-Supply-Planning. Valuable assistance in the preparation of the geospatial database for field and row crops was provided by Kyle Ferris (FDACS) and Daniel Dourte (Balmoral Group).
2 Crop area, yield and price data retrieved from USDA-NASS Quick Stats website: https://quickstats.nass.usda.gov/.
3
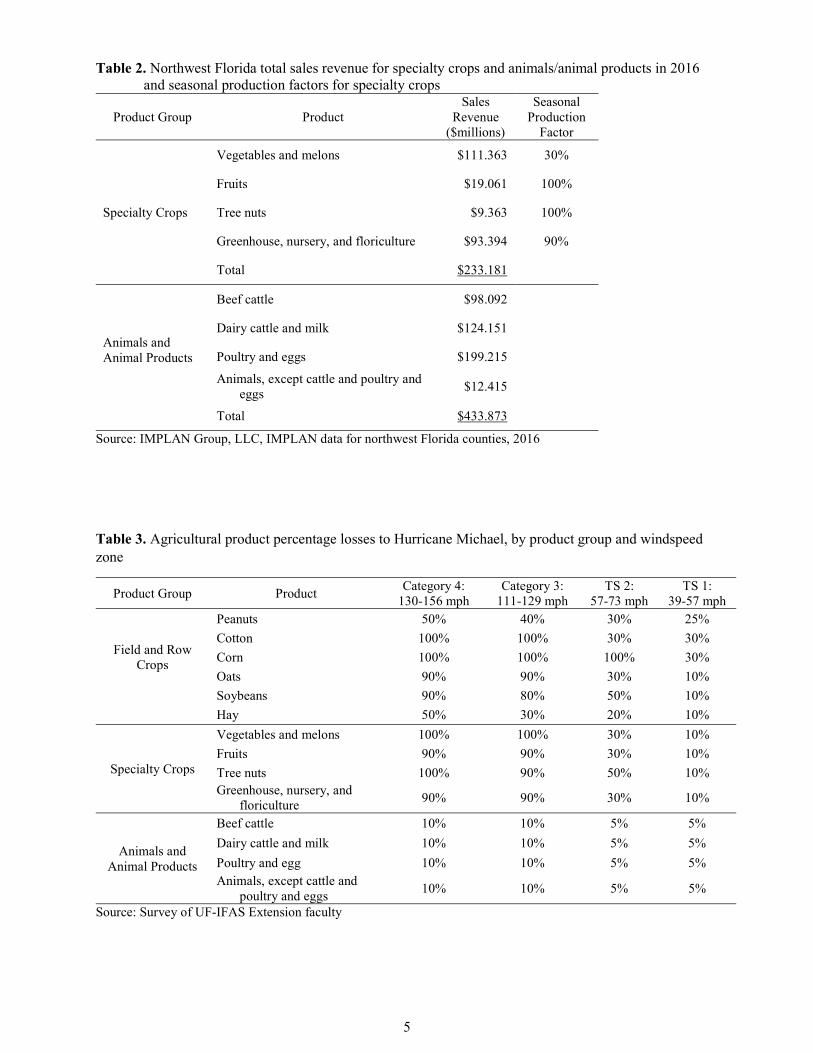
for specialty crops and animal production along with seasonal factors for specialty crops are shown in
Table 2. In 2016, total sales revenues in the 25 counties that were significantly impacted by Hurricane
Michael3 were $233 million for specialty crops including vegetables and melons, fruits, tree nuts, and
greenhouse/nursery, and $432 million for animals and animal products, including beef and dairy cattle, ,
milk, poultry, eggs, deer, honeybees, etc.
Percentage losses of agricultural commodities in each hurricane windzone were informed by survey
responses by UF-IFAS Extension faculty as shown in Table 3.
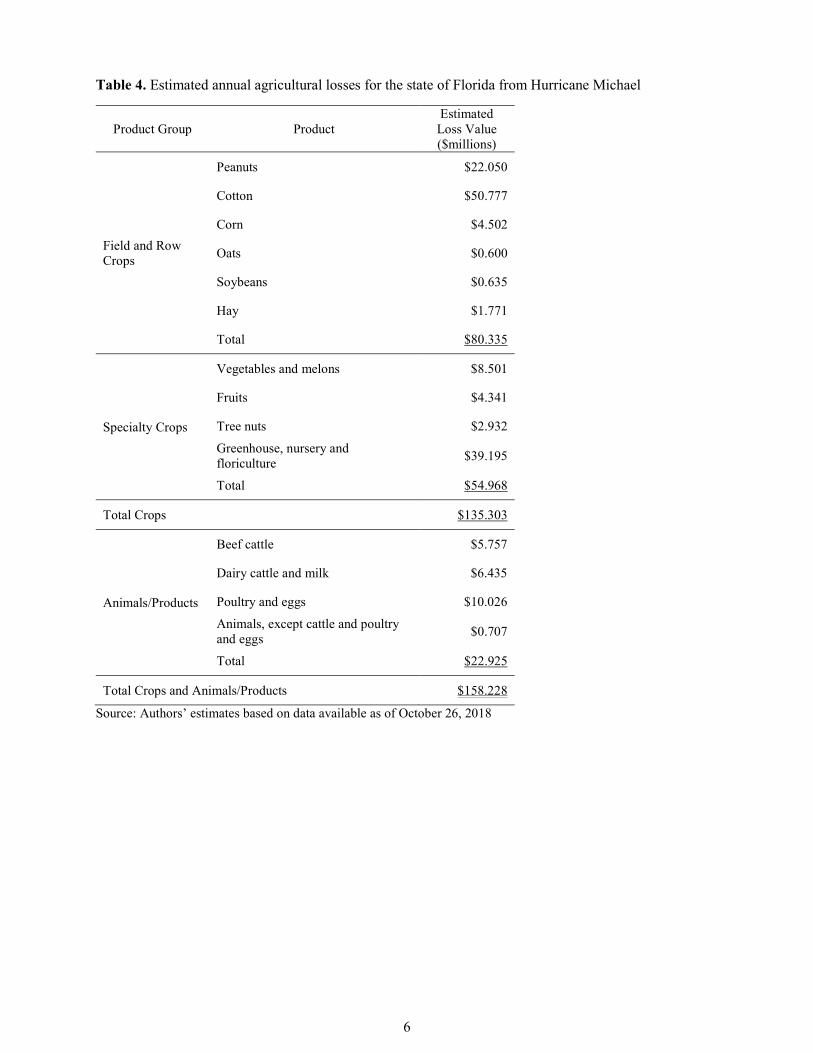
Estimated annual crop losses are summarized in Table 4. Total losses for crops and animals/animal
products were estimated at $158 million, including $80 million for field crops, $55 million for specialty
crops, and $23 million for animals/animal products.
A study conducted by the Florida Department of Agriculture and Consumer Services-Forest Service
estimated damages to timber stands in Florida using a similar methodology, based on wind maps, together
with forestland area of pine, hardwood, cypress, and other species from the USDA-Forest Inventory and
Analysis. According to their analysis, a total of 2.809 million acres of forest land area was damaged,
including nearly 347,000 acres in the catastrophic category (95%+ damaged), 1.043 million acres in the
severe category (75-94% damaged), and 1.419 million acres in the moderate category (15-74% damaged).
The value of damage was estimated at $1.289 billion at current average timber stumpage prices. This
value represents timber that would normally be harvested over several years. Adjusting for average
annual harvest levels and assuming a 10 percent timber salvage rate, the annual loss for the 2018-19
season was determined to be $147 million.
3 The 25 counties significantly impacted by Hurricane Michael were: Baker, Bay, Calhoun, Columbia, Dixie, Escambia, Franklin, Gadsden, Gulf, Hamilton, Holmes, Jackson, Jefferson, Lafayette, Leon, Liberty, Madison, Nassau, Okaloosa, Santa Rosa, Suwannee, Taylor, Wakulla, Walton, and Washington.
4
Figure 1. Map of wind speed zones for Hurricane Michael, October 2018
Table 1. Northwest Florida field crop production area, value per acre and seasonal production factors
Table 2. Northwest Florida total sales revenue for specialty crops and animals/animal products in 2016 and seasonal production factors for specialty crops
Product Group Product Sales
Revenue ($millions)
Seasonal Production
Factor
Specialty Crops
Vegetables and melons $111.363 30%
Fruits $19.061 100%
Tree nuts $9.363 100%
Greenhouse, nursery, and floriculture $93.394 90%
Total $233.181
Animals and Animal Products
Beef cattle $98.092
Dairy cattle and milk $124.151
Poultry and eggs $199.215
Animals, except cattle and poultry and eggs
$12.415
Total $433.873
Source: IMPLAN Group, LLC, IMPLAN data for northwest Florida counties, 2016 Table 3. Agricultural product percentage losses to Hurricane Michael, by product group and windspeed zone
Product Group Product Category 4:
130-156 mph Category 3:
111-129 mph TS 2:
57-73 mph TS 1:
39-57 mph
Field and Row Crops
Peanuts 50% 40% 30% 25%
Cotton 100% 100% 30% 30%
Corn 100% 100% 100% 30%
Oats 90% 90% 30% 10%
Soybeans 90% 80% 50% 10%
Hay 50% 30% 20% 10%
Specialty Crops
Vegetables and melons 100% 100% 30% 10%
Fruits 90% 90% 30% 10%
Tree nuts 100% 90% 50% 10% Greenhouse, nursery, and
floriculture 90% 90% 30% 10%
Animals and Animal Products
Beef cattle 10% 10% 5% 5%
Dairy cattle and milk 10% 10% 5% 5%
Poultry and egg 10% 10% 5% 5% Animals, except cattle and
poultry and eggs 10% 10% 5% 5%
Source: Survey of UF-IFAS Extension faculty
6
Table 4. Estimated annual agricultural losses for the state of Florida from Hurricane Michael
Product Group Product Estimated
Loss Value ($millions)
Field and Row Crops
Peanuts $22.050
Cotton $50.777
Corn $4.502
Oats $0.600
Soybeans $0.635
Hay $1.771
Total $80.335
Specialty Crops
Vegetables and melons $8.501
Fruits $4.341
Tree nuts $2.932
Greenhouse, nursery and floriculture
$39.195
Total $54.968
Total Crops $135.303
Animals/Products
Beef cattle $5.757
Dairy cattle and milk $6.435
Poultry and eggs $10.026
Animals, except cattle and poultry and eggs
$0.707
Total $22.925
Total Crops and Animals/Products $158.228
Source: Authors’ estimates based on data available as of October 26, 2018