Page 1
Providing consultancy and research in health economics for the
NHS, pharmaceutical and health care industries since 1986
PUBLIC HEALTH ADVISORY
COMMITTEE
RX058: Economic Analysis of Oral Health
Improvement Programmes and
Interventions
Final report
Produced by Newcastle Upon Tyne Hospital
and York Health Economics Consortium
External Assessment Centre
LINDSAY CLAXTON, Research Consultant
MATTHEW TAYLOR, Director
MICHELLE JENKS, Research Consultant
ALEXANDRA FILBY, Research Consultant
August 2014
Page 2
Project Name: Economic analysis of oral health improvement programmes and
interventions (oral health promotion)
Project Number: RX058
Start Date: June 2013
Completion Date: August 2014
Correspondence to: Matthew Taylor
York Health Economics Consortium (YHEC)
Level 2 Market Square
University of York
YORK
YO10 5NH
Tel: +44 (0)1904 323620
Declared interests of the authors: None
The views expressed in this report are those of the authors and not those of NICE. Any errors are the responsibility of the authors.
Page 3
All reasonable precautions have been taken by YHEC to verify the information contained in this publication. However, the published material is being distributed without warranty of any kind, either expressed or implied. The responsibility for the interpretation and use of the material lies with the reader. In no event shall YHEC be liable for damages arising from its use.
Contents Page No. Acknowledgements
Section 1: Introduction 1 1.1 Background 1 1.2 Aims of the Modelling 2 1.3 Methods 3 1.4 Report Structure 5
Section 2: Economic Analysis 6 2.1 Background 6 2.2 Model Structure and Input Parameters 8 2.3 Analysis I: Fluoride Varnish and Supervised Toothbrushing 10 2.4 Analysis II: Sensitivity Analysis 16
Section 3: Evidence for Effectiveness 34 3.1 Summary 34 3.2 Evidence for Programmes in Infants and Pre-School Children 39 3.3 Evidence for Programmes in School-Aged Children 43 3.4 Evidence for Programmes in Adults 52
Section 4: Discussion and Conclusions 55 4.1 Summary 55 4.2 Research Recommendations 59 4.3 Conclusion 60 References Appendices: Appendix A: Model Methodology: Restoration Pathway and Tooth Decay Appendix B: Costs Appendix C: Quality of Life Appendix D: Other Oral Health Outcomes
Page 4
IV
Acknowledgements
The External Assessment Centre would like to thank: Lesley Owen, Simon Ellis and Linda
Sheppard of the NICE team for their support in developing this report, and Ivor Chestnutt
and Committee members, Liz Kay, Rachel Johns, Mandy Murdoch, and Brendan Collins, as
well as Gill Davies, Janet Neville and Mark Robinson from Public Health England, for the
provision of data sources to populate some aspects of the model. The EAC would also like
to thank Liz Kay and Richard Watt for their assistance in developing Analysis I. However,
please note that all assumptions contained within are the responsibilities of the authors,
unless otherwise stated.
Page 5
Abbreviations
ADHS Adult Dental Health Survey
CEA Cost-effectiveness analysis
deft/DEFS Decayed, extracted and filled deciduous/permanent surfaces
deft/DEFT Decayed, extracted and filled deciduous/permanent teeth
dft/DFT Decayed and filled deciduous/permanent teeth
dmft/DMFT Decayed, missing, filled deciduous/permanent teeth
d1mft/D1MFT Non-cavitated enamel decay, missing or filled deciduous/permanent teeth
d2mft/D2MFT Cavitated enamel decay, missing or filled deciduous/permanent teeth
d3mft/D3MFT Cavitated dentine decay, missing or filled deciduous/permanent teeth
dmfs/DMFS Decayed, missing, filled deciduous/permanent surfaces
EAC
GA
External Assessment Centre
General anaesthetic
HTA HTA Health Technology Assessment
ICER
IMD
Incremental cost-effectiveness ratio
Indices of Multiple Deprivation
NHS EED NHS Economic Evaluation Database
NHS National Health Service
NICE
NR
National Institute for Health and Care Excellence
Not reported
OHIP Oral Health Impact Profile
OR
PH
PHE
Odds ratio
Public Health
Public Health England
PHAC Public Health Advisory Committee
QALY
QATY
Quality Adjusted Life Year
Quality Adjusted Tooth Year
RCT Randomised controlled trial
RR Relative risk
RRR Relative risk reduction
SD Standard deviation
SE Standard error
Page 6
Section 1 1
Section 1: Introduction
1.1 BACKGROUND
The National Institute for Health and Care Excellence (NICE) was asked by the Department
of Health to develop public health guidance for local authorities on oral health needs
assessments and community oral health promotion programmes.
The guidance applies to local populations, with a particular focus on vulnerable groups at
high risk of poor oral health. People at high risk of poor oral health generally live in areas
that are described as socially and economically disadvantaged. Local authorities (and other
agencies) define disadvantaged areas in a variety of ways. An example is the Index of
Multiple Deprivation 2010. This combines economic, social and housing indicators to
produce a single deprivation score. The vulnerable groups include:
Children aged 5 years and under;
Adults aged over 65 years;
People on low incomes;
People who are homeless or who frequently change the location where they live (for
example, traveller communities);
People from some black and minority ethnic groups (for example, those of South
Asian origin);
People who chew tobacco;
People with mobility difficulties or a learning disability and who live independently in
the community.
The guidance provides recommendations, which are informed by evidence of effectiveness
and cost-effectiveness to promote positive oral health behaviour and prevent oral diseases.
There are three components associated with the guidance development:
1. A review of oral health improvement programmes and interventions assessing
evidence of effectiveness, barriers and facilitators;
2. A review and practice survey of oral health needs assessments;
3. An economic analysis.
The Newcastle and York External Assessment Centre (EAC) has undertaken the third
component only. The first component was commissioned from Bazian and the second from
Cardiff University. The economic analysis complements the approach taken by Bazian in
their review of the effectiveness of oral health programmes and interventions. The literature
search strategy adopted consistent population and interventions terms to those used by
Page 7
Section 1 2
Bazian. This strategy was adapted as appropriate to a search on cost-effectiveness.
Search sources were chosen which were not included in the effectiveness evidence review,
and which were appropriate to retrieving research on cost-effectiveness from a public health
perspective.
The first step in the economic analysis was to undertake a focused systematic review of
published economic studies to establish if there are any high-quality economic studies that
address the research questions set out in the NICE Public Health (PH) scope document and
are relevant to current practice. This step was reported in a separate document which was
submitted to NICE in October 2013 (Coffin et al. 2013).
The systematic review of cost-effectiveness evidence identified 16 papers suitable for
inclusion, which all had methodological weaknesses and limited applicability to the current
English context. Therefore, the review concluded that there was insufficient evidence to
answer the research questions and a de novo economic model was recommended. This
document reports this economic modelling and its findings.
1.2 AIMS OF THE MODELLING
The economic analysis aimed to investigate the following questions:
Question 1: Which community-based programmes and interventions to promote, improve,
and maintain the oral health of a local community are cost-effective?
Question 2: Which methods and settings to deliver community-based programmes for
disadvantaged populations at high risk of poor oral health are cost-effective?
It was decided that a decision-analytic model would be developed in order to estimate the
expected costs and health benefits of various interventions on oral health. The costs and
consequences of various interventions could then be directly compared in order to assess
which are most effective and cost-effective within the limitations of relevant and available
data. This model is described in full in Section 2.
In order to assess the cost-effectiveness of a particular intervention a standard unit of benefit
is required in order to compare across treatment areas. For example, if we cure a certain
number of cases in one disease area and avert a certain number of events in another we
need a common unit in order to decide which of these outcomes is more desirable. Health
economics uses the quality-adjusted life year (QALY) for this purpose. The QALY
incorporates the life years gained from a treatment strategy, adjusted for the quality of life
that the person experiences during those years. Quality of life is determined using
measures of utility, which describe health-related quality of life, such as mobility, pain, ability
to carry out usual functions of daily living, and depression, on a scale of 0 to 1, with 1 being
full health and 0 being dead. For example, if a person lives for 10 years with a utility of 0.5
they will gain 5 QALYs. If they live for 4 years with a utility of 0.75 they will gain 3 QALYs.
Page 8
Section 1 3
Cost-effectiveness analysis is based on the comparison of one intervention with another,
such as standard care or no intervention. In order to do this it is the incremental QALYs and
incremental costs that are considered. Most new interventions are more costly and also
provide more health benefits. In order to decide whether the extra health benefits are worth
the extra costs of the intervention, the incremental cost-effectiveness ratio (ICER) is
calculated. The ICER subtracts the cost of the current strategy from the cost of the new
strategy, divided by the benefits of the current strategy subtracted from the benefits of the
new strategy, in order to determine the incremental cost per unit of benefit. The formula for
calculating the ICER is shown below.
The higher the ICER the higher the cost per QALY gained. NICE generally considered
interventions with an ICER less than £20,000 per QALY gained to be cost-effective. Above
this threshold, judgements around the acceptability of the intervention as an efficient use of
NHS resources are made according to the degree of certainty around the ICER, how
accurately changes in quality of life have been captured and how innovative the innovation
in question is (NICE, 2012).
Given the likely paucity of relevant data (identified by the literature reviews) available to
populate an economic model for community oral health it was decided that interim
‘surrogate’ outcomes would be used to predict longer-term and broader outcomes (e.g.
QALYs).
The questions being answered were concerned with the cost-effectiveness of interventions
to improve and maintain oral health, particularly in specific vulnerable populations.
Seventeen interventions were selected to be incorporated within the economic model
(described in Section 2). These interventions were identified in the effectiveness evidence
review carried out by Bazian. The guideline is for local populations with a focus on
vulnerable groups, and so the modelling approach was amended to cover the population
over a life course approach rather than in each specific vulnerable group described in
Section 1.1. Each of the 17 interventions focused on a subgroup of the population which
included pre-school (or early years) children, school children, working-age adults and adults
over 65 years of age. The 17 interventions are described further in Section 3.
1.3 METHODS
No directly applicable evidence to populate the model could be identified on either oral
cancer or periodontal disease. The PHAC accepted that, given this, the economic modelling
should focus on oral health improvements and maintenance as its effect on dental caries (or
tooth decay) was where the relatively strongest levels of evidence lay.
Page 9
Section 1 4
A decision analytic model was developed in order to analyse the impact of a relative risk
reduction of dental caries occurring as a result of each of the 17 interventions. From this,
the cost per QALY for each intervention could be determined. Due to a lack of directly
applicable data that would allow the economic model to calculate the cost per QALY (such
as utility estimates for oral health states), various assumptions were initially used to build
and populate a preliminary model and presented to the PHAC. Given this lack of
appropriate data, the External Assessment Centre (EAC) advised the PHAC that the results
of this model may be very limited and not provide an accurate basis to inform their decision
making about the range of potential recommendations the PHAC may wish to make. The
uncertainty within the preliminary model due to the large number of assumptions being made
meant that, rather than a single ICER, the provision of a range of cost-effectiveness
estimates based on the likely ranges of values for each input parameter were of more use to
PHAC in informing their recommendations.
Therefore, taking into account the lack of directly applicable data and the limitations of the
preliminary model, the methodology of the economic analysis was amended, with the
alternative approach focusing on the relationship between five key parameters. The model is
described fully in Section 2. Analysis I was developed using additional datasets provided by
Public Health England (PHE) to estimate risks of poor oral health, and focused on selected
interventions (supervised tooth brushing and fluoride varnish programmes) in a deprived
community of pre-school and school children. Analysis II was developed to explore the
uncertainty around the key input parameters (e.g. baseline risk of decay, quality of life)
through sensitivity analyses. An additional model was developed to support Analysis II
(referred to as the input calculator model), to inform likely ranges of values for the key inputs.
This supporting model is described in Appendices A to D.
An alternative approach for the economic analysis would have been a cost-consequence
analysis. Cost-consequence analysis reports a profile of outcomes for each intervention, but
does not combine the outcomes into a single unit of effect, such as the ICER in cost-
effectiveness analyses. Cost-consequence analysis is useful for interventions which have
an impact on a wide range of outcomes, including both health and non-health effects.
However, there is no explicit value attached to each of the different outcomes, and as such
the decision-maker will have to implicitly decide which intervention represents the best value,
which reduces the transparency of the process. Also, the values may reflect those of the
decision-maker and not that of the general population.
In the context of this economic evaluation, many of the limitations that are associated with a
cost-utility approach are also still relevant to a cost-consequence approach. These in
particular are around quantifying the impact of the interventions on a clinical level and on
quality of life, and around the cost of the treatment pathway and the cost of the programmes
themselves. Section 2 and Section 3 describes these issues in more detail. QATYs (quality-
adjusted tooth years) which are described in Appendix C may be considered to be a useful
outcome measure for this approach.
Page 10
Section 1 5
1.4 REPORT STRUCTURE
The report comprises three further sections:
Section 2 describes the economic model and its results;
Section 3 provides an overview the 17 interventions identified in the Bazian review
and describes how these interventions were incorporated into the economic
modelling;
Section 4 discusses the limitations of the work and advises upon future research
recommendations. Summary statements are also provided.
Page 11
Section 2 6
Section 2: Economic Analysis
2.1 BACKGROUND
This section provides a summary of the top-line results from the cost-effectiveness model, as
well as outlining the evidence that has been collected over the course of the development
period to inform the economic analysis. It explores the key areas of uncertainty in this
evidence, and our methodology for exploring these areas of uncertainty using a range of
extensive sensitivity analyses.
The original aim of the model was to capture the impact of each intervention on dental and
periodontal disease, and on oral cancer. However, the economic model has been
redesigned to capture the costs and health benefits associated with treating dental caries
only. Few studies reported outcomes relating to periodontal disease. In addition, there was
a lot of uncertainty around how periodontal disease and the outcomes reported in the studies
(e.g. Plaque and Gingival Index) are linked to quality of life and treatment costs and, as
such, this element of oral health was excluded from the analysis. Furthermore, the
effectiveness review did not capture any data on the impact of the interventions on the risk of
oral cancer. There was, however, a better range of evidence for the impact on dental caries,
although there was still a significant level of uncertainty due to the heterogeneity of the data
reported across the studies. There are also varying levels of uncertainty around many other
parameters in the economic model (including programme costs and impact on quality of life),
due to a paucity of previous research and a lack of data reported in the literature.
Two approaches have been undertaken to estimate the cost-effectiveness of the
interventions in the analysis. One approach looks at four specific interventions in the pre-
school or school populations (Analysis I), while the other approach provides a guide on how
to assess the cost-effectiveness of an intervention given a range of input parameters
(Analysis II).
2.1.1 Quality of Life
The key area where there is a lack of data is the impact of quality of life associated with
tooth decay, including the impact of the stage and severity of decay, and of increasing the
number of teeth being affected. This is compounded by the fact that the majority of the
interventions will be in children where it is considered to be difficult to accurately measure
quality of life associated with oral health.
Guidelines for the development of economic models in public health (as described in the
CPHE Methods Manual) state that generic utility measures should be used to measure and
value outcomes, since they allow for a comparison with other disease areas which may have
very different health benefits. Utility weights (measured directly or indirectly) describing
different health states for dental decay have, unfortunately, not been reported in the
literature. The most relevant source of data for oral health impact is the Adult Dental Health
Page 12
Section 2 7
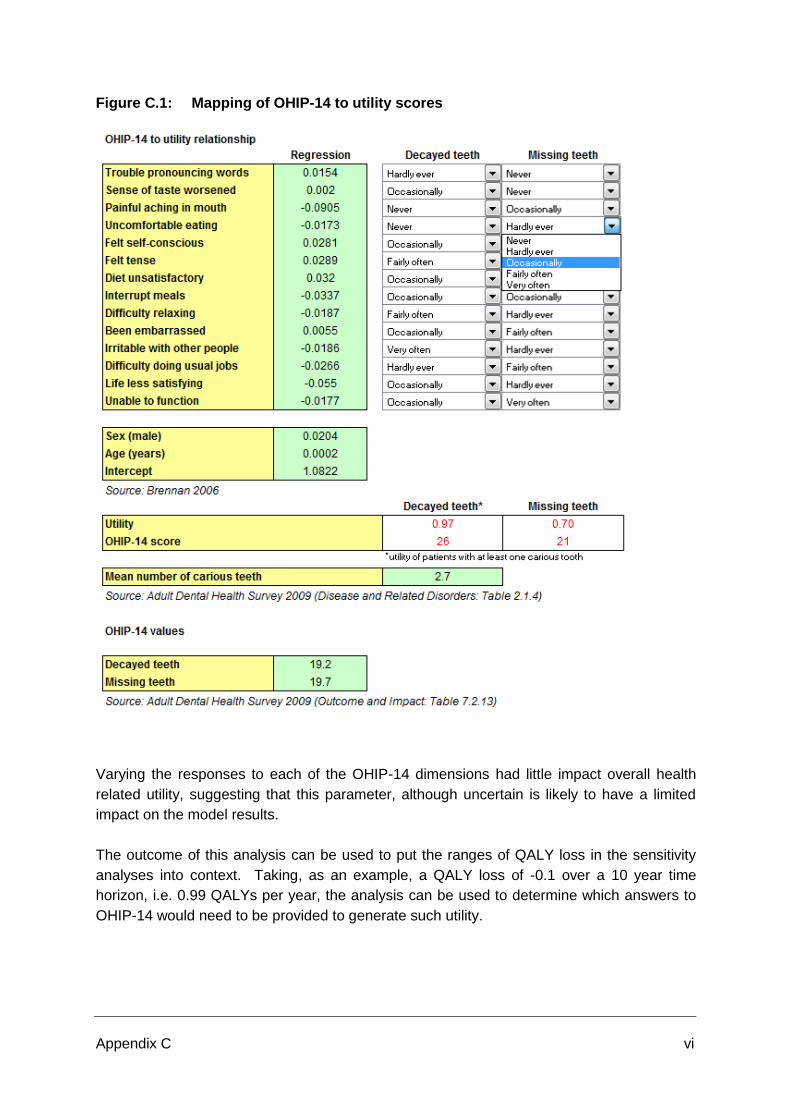
2009 survey, which reported the Oral Health Impact Profile (OHIP-14) scores for varying
levels of pain in the mouth, decay and missing teeth, following an interview-administered
questionnaire on a sample of adults within the UK. The OHIP-14 scores were mapped to
utility estimates using a published regression analysis, further adding to the uncertainty
around of quality of life estimates.
The economic model attempts to estimate the magnitude of the QALY losses associated
with developing dental caries.
Analysis I: Utilities from otitis media have been used as a proxy for the quality of life
associated with tooth loss in children. Further details of the assumptions used to calculate
QALY losses associated with dental caries are provided in Section 2.3.1.
Analysis II: QALY losses associated with dental caries were estimated by converting oral
health-related quality of life to general utilities. Oral-health related quality of life was derived
from the Adult Dental Health survey (2009), which reported OHIP responses for a variety of
oral health conditions. The results of this report were used to estimate the impact of dental
caries associated with decay and with missing teeth. A study by Brennan and Spencer
(2006) was used to map OHIP responses to generic health state values. The authors
surveyed both patients and dentists and used responses to construct models of health state
values. Further details on this study and the methods used to estimate the QALY loss are
provided in Appendix C.
2.1.2 Costs
Intervention costs are very rarely reported alongside the effectiveness results of any oral
health studies. The studies that report cost data are often drawn from other countries and
may not be relevant to the English setting. Reported costs also vary in the level of detail,
which provides further challenges for applying to alternative settings (e.g. in a smaller
number of schools): some report the cost per child per year (with no data reported for
adults); some provide the total cost of the programme broken down by staff and material
costs. There are further limitations of extrapolating cost data from one study in one setting
to a range of settings and populations since each intervention type explored in the current
analysis encompasses a wide range of possible programmes, and there are some concerns
that the intervention costs from a specific study may not be relevant for the broader
category, especially when there is significant variation in the effectiveness impact (e.g. the
cost of a fluoride varnish programme delivering two applications per year in a school in a
disadvantaged area may not be appropriate for a fluoride varnish programme delivering four
applications per year in a similar school in a similar area). Analysis I estimates the
maximum cost of an intervention per child for a given set of input parameters. Analysis II
provides a range of cost-effectiveness estimates based on a range of intervention costs.
Further information around the costs of treating dental caries that are included in the model
is provided in Section 2.3.1 and Appendix B.
Page 13
Section 2 8
2.1.3 Effectiveness
The effectiveness of the interventions on levels of decay has been reported in various ways
across the identified studies, making it difficult to compare different interventions head-to-
head. Most studies reported the clinical outcomes that were evaluated in the study, for
example, the difference in dmft/DMFT before and after the programme, the dmft/DMTF
prevented fraction, and the proportion of the study population that are caries-free before and
after the programme. Few studies provided an estimate of the magnitude of the impact on
the clinical outcomes, such as relative risk (RR) or odds ratios (OR). Some studies only
reported intermediate outcomes relating to modifiable behaviour, such as the frequency of
brushing and flossing, snacking levels, oral health knowledge and use of dental services, but
this evidence is of limited use given that no quantitative data exist to link these to the impact
on the patient regarding quality of life. This is described in more detail in Section 3.
2.2 MODEL STRUCTURE AND INPUT PARAMETERS
A simple model was developed in order to undertake sensitivity analysis around input
parameters, notably those around which there were the greatest levels of uncertainty. The
structure of the model is displayed in Figure 2.1. This model is designed to handle and
explore a range of scenarios.
The model structure was designed to be as simple as possible to avoid introducing
unnecessary complex analysis. Although the model takes a generic approach, due to the
paucity of data in this area, it was developed specifically to allow for the uncertainty in the
key inputs appropriate to this project and to permit a wide range of relevant scenarios to be
considered. It was judged that a less simplistic structure would increase the complexity of
the results and make them less easy to interpret and limit their usefulness.
Page 14
Section 2 9
Figure 2.1: Model structure
The parameters that have been explored in the analyses are detailed below:
Intervention costs (per patient);
Baseline risk of dental caries;
Relative risk reduction of dental caries for the intervention;
QALY loss from each case of dental caries;
Cost of treating each case of dental caries.
A relative risk reduction (RRR) is presented in the sensitivity analysis as an intuitive way of
interpreting the effect of an intervention on the level of disease. This refers to the degree to
which an intervention lowers (or increases) the risk of an event occurring. A relative risk
reduction of 0 is equivalent to no effect on the rate of disease. A relative risk reduction of
10% suggests that the risk of disease has been decreased by 10% (that is, to 90% of its
original level). The larger the relative risk reduction, the more the intervention reduces the
risk of disease.
Page 15
Section 2 10
When assessing the impact of an intervention in a population, the baseline risk should be
interpreted as the mean baseline risk of caries in the population which the programme will be
delivered to (i.e. before the programme starts). Risk in a given population is likely to be
heterogenous across all individuals to a certain extent, so a population with a large
proportion of high risk individuals would have a higher than average baseline risk. For
example, if a school is in the lower IMD quintile, then the baseline risk of caries of 39% for
high risk children (see Section 2.3 for derivation of this risk) might apply to the whole school.
If a school is in an average area of deprivation, 20% of children may be at high risk (with
39% risk of caries) with the remainder at moderate risk (to illustrate, at 20%). The overall
baseline risk for this school would therefore be lower (roughly 24%, in this illustrative
example), and the intervention should be interpreted with this baseline risk in mind.
For the remaining parameters, the approach for estimating the input varies by each analysis.
In Analysis I, it was attempted to more precisely estimate the likely values for each of the
parameters. Analysis II uses a range of values for each parameter.
2.3 ANALYSIS I: FLUORIDE VARNISH AND SUPERVISED TOOTHBRUSHING
This analysis assessed selected interventions delivered to a high risk population; in this
case, children at high risk of poor oral health (i.e. those living in disadvantaged areas).
Fluoride varnish in pre-school children;
Supervised tooth brushing for pre-school children (Childsmile);
Fluoride varnish in school children;
Supervised tooth brushing for school children.
2.3.1 Model Parameters
Baseline risk of caries
Baseline risks of disease were taken from a dataset provided by the Dental Public Health
Intelligence Programme, using the most deprived quintile (by IMD) to represent a high-risk
population i.e. children.
The baseline risk of dental caries for 5 year olds in the most deprived quintile is
39.6%;
The baseline risk of dental caries for 12 year olds in the most deprived quintile is
42.4%.
Quality of life
The current analysis is likely to underestimate the benefit of intervening. The total QALY loss
can only take into account the temporary reduction in quality of life from a missing tooth, and
from the mortality impact of a general anaesthetic. There is a lifetime impact from a missing
Page 16
Section 2 11
tooth, but it has not been possible to include this in the current analysis because it cannot be
quantified at this time.
Very few estimates of quality of life as measured by a generic instrument exist for different
oral health states. As such, some members of the Committee suggested using utility
estimates from a similar disease area in children as a proxy for a missing tooth. Otitis media
is an infection of the middle ear that is particularly common in young children. A number of
utility estimates for otitis media have been selected from different sources to inform the
range of values for our analysis (see Table 2.1 for each estimate and the corresponding
QALY loss). Oh et al. (1996) and Coco (2007) are studies of acute otitis media and, as
such, reflect the short-term impact of otitis media and is considered to apply to tooth loss in
terms of acute pain, disruption to individuals’ and families quality of life, need for professional
support and care, and in some cases attendance at secondary care settings for surgical
intervention). The disutility of dental caries can vary by a number of population factors such
as social group, age, race etc. The utility estimates presented in Table 2.1 are from studies
of the general population and, therefore, may not be applicable to the more deprived and
high risk quintiles.
In the absence of directly applicable data, the following assumptions are used to estimate
QALY losses:
It is assumed that having a missing tooth only will impact on quality of life.
Of those patients with caries experience, the proportion with extraction experience
(%MT>0) is used to estimate the average QALY loss per case of caries.
100% of 5 year olds have an extraction under general anaesthetic. Varying
proportions of 12 year olds were also analysed but this was found to have very little
impact on the overall QALY loss due to GA, so the rate of GA for 5 year olds was
also applied to 12 year olds in this case.
The mortality rate associated with GA is 1 in 300,000 for all age groups.
If a patient dies as a result of GA, then they lose on average 40 QALYs. This takes
into account discounting (at 1.5%) and general population mortality.
This results in an average QALY loss of 0.00013 per extraction under GA.
It is assumed that the disutility associated with a missing tooth lasts for 12 weeks.
It is important to note that the analysis assumes that disutility for a missing tooth lasts for 12
weeks. Although there is a lifetime impact from extraction (of both deciduous and permanent
teeth), this cannot be quantified, and as such are not included in the analysis. Therefore the
analysis is likely to underestimate the benefits of the intervention.
The QALY loss per case of caries takes into account the proportion of children with caries
experience who have had teeth extracted (for each case of caries, the disutility of applied to
the proportion who have extraction experience). ). The calculations are presented in Table
2.1.
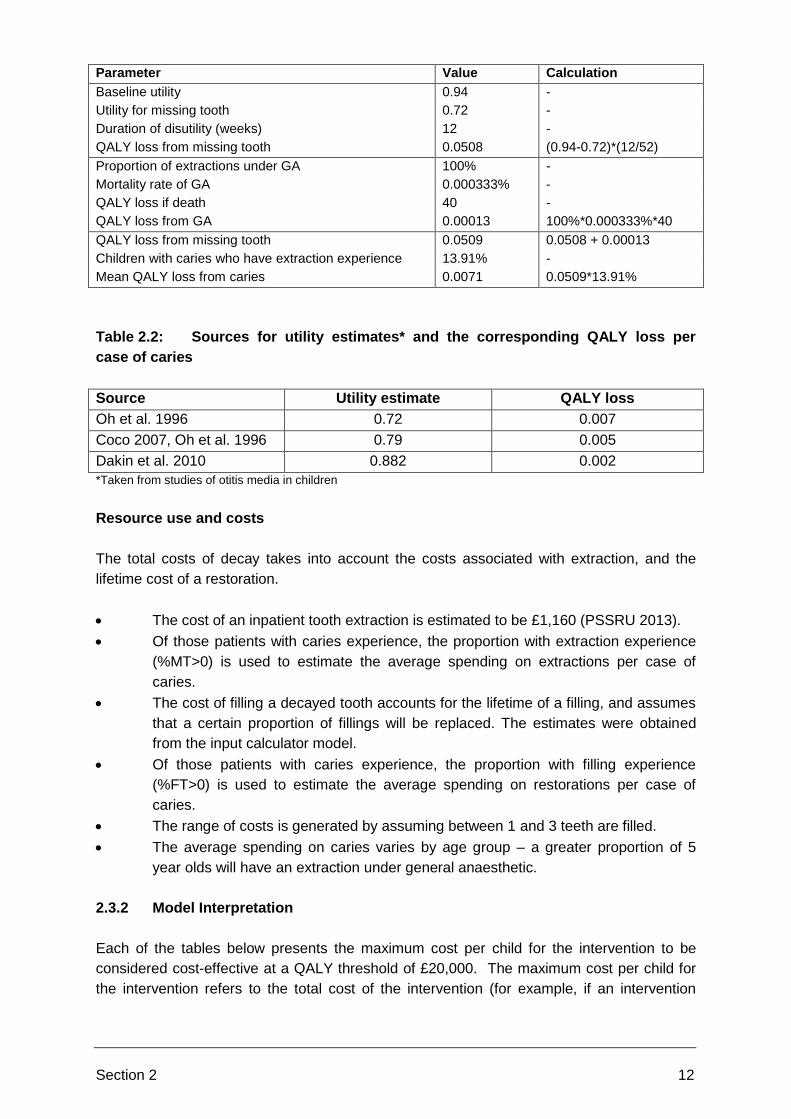
Table 2.1: Calculations for QALY loss
Page 17
Section 2 12
Parameter Value Calculation
Baseline utility 0.94 -
Utility for missing tooth 0.72 -
Duration of disutility (weeks) 12 -
QALY loss from missing tooth 0.0508 (0.94-0.72)*(12/52)
Proportion of extractions under GA 100% -
Mortality rate of GA 0.000333% -
QALY loss if death 40 -
QALY loss from GA 0.00013 100%*0.000333%*40
QALY loss from missing tooth 0.0509 0.0508 + 0.00013
Children with caries who have extraction experience 13.91% -
Mean QALY loss from caries 0.0071 0.0509*13.91%
Table 2.2: Sources for utility estimates* and the corresponding QALY loss per
case of caries
Source Utility estimate QALY loss
Oh et al. 1996 0.72 0.007
Coco 2007, Oh et al. 1996 0.79 0.005
Dakin et al. 2010 0.882 0.002
*Taken from studies of otitis media in children
Resource use and costs
The total costs of decay takes into account the costs associated with extraction, and the
lifetime cost of a restoration.
The cost of an inpatient tooth extraction is estimated to be £1,160 (PSSRU 2013).
Of those patients with caries experience, the proportion with extraction experience
(%MT>0) is used to estimate the average spending on extractions per case of
caries.
The cost of filling a decayed tooth accounts for the lifetime of a filling, and assumes
that a certain proportion of fillings will be replaced. The estimates were obtained
from the input calculator model.
Of those patients with caries experience, the proportion with filling experience
(%FT>0) is used to estimate the average spending on restorations per case of
caries.
The range of costs is generated by assuming between 1 and 3 teeth are filled.
The average spending on caries varies by age group – a greater proportion of 5
year olds will have an extraction under general anaesthetic.
2.3.2 Model Interpretation
Each of the tables below presents the maximum cost per child for the intervention to be
considered cost-effective at a QALY threshold of £20,000. The maximum cost per child for
the intervention refers to the total cost of the intervention (for example, if an intervention
Page 18
Section 2 13
consists of two fluoride varnish applications per year for five years, then the cost per
intervention refers to the five-year cost). The time horizon over which the intervention is
provided is included in the results tables below, for each study that informs the effectiveness
evidence.
For interventions in school children in the most deprived quintile, the baseline risk of caries is
42.4%, and a range of assumptions around the rate of extractions under GA are analysed –
results are presented assuming that 50% of extractions are under GA, and 80% of
extractions are under GA.
For interventions in pre-school children in the most deprived, the baseline risk of caries is
39.6%, and it is assumed that 100% of extractions are under GA.
Results are also presented for a range of QALY loss assumptions (low = 0.002, medium =
0.005, high = 0.007). For each estimate of QALY loss for each intervention, a range of
intervention values are presented, which are based on varying costs of treating tooth decay.
2.3.3 Model Results
Table 2.3: Cost-effectiveness of interventions for infants and pre-school children
in the most deprived quintile (at £20,000 per QALY)
Infants and Pre-school: baseline risk 39.62%
Childsmile RRR 32%
(Macpherson et al. 2013)
Effectiveness assessed at three years
QALY loss Cost-effective for maximum
cost of intervention*
100% extractions under GA Low £27-£34
Med £35-£41
High £40-£46
*Assumes cost of dental caries is between £175-£225
Table 2.4: Cost-effectiveness of interventions for infants and pre-school children
in the most deprived quintile (at £20,000 per QALY)
Infants and Pre-school: baseline risk 39.62%
Fluoride varnish RRR 43%
(Moberg et al. 2005)
Effectiveness assessed at three years
QALY loss Cost-effective for maximum
cost of intervention*
100% extractions under GA Low £37-£45
Med £47-£55
High £54-£62
*Assumes cost of dental caries is between £175-£225
*Assumes same risk reduction as for older children.
Table 2.5: Cost-effectiveness of interventions for school children in the most
deprived quintile (at £20,000 per QALY)
Page 19
Section 2 14
School children: baseline risk 42.4%
Fluoride varnish RRR 43%
(Moberg et al. 2005)
Effectiveness assessed at three years
QALY loss Cost effective for maximum
cost of intervention*
50% extractions under GA Low £35-£62
Med £46-£73
High £53-£80
80% extractions under GA Low £44-£71
Med £55-£82
High £62-£89
*Range in maximum cost refers to minimum and maximum cost of caries. Assumes cost of dental caries is
between £150-£300 for 50%, £200-£350 for 80%
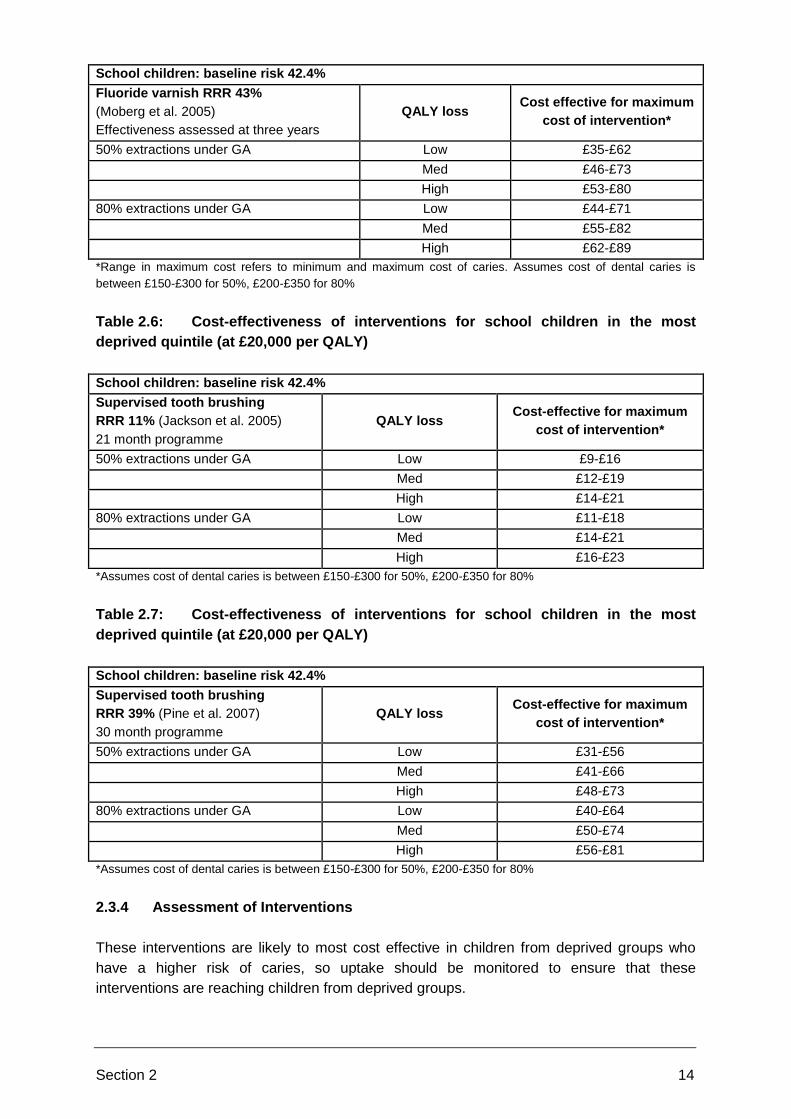
Table 2.6: Cost-effectiveness of interventions for school children in the most
deprived quintile (at £20,000 per QALY)
School children: baseline risk 42.4%
Supervised tooth brushing
RRR 11% (Jackson et al. 2005)
21 month programme
QALY loss Cost-effective for maximum
cost of intervention*
50% extractions under GA Low £9-£16
Med £12-£19
High £14-£21
80% extractions under GA Low £11-£18
Med £14-£21
High £16-£23
*Assumes cost of dental caries is between £150-£300 for 50%, £200-£350 for 80%
Table 2.7: Cost-effectiveness of interventions for school children in the most
deprived quintile (at £20,000 per QALY)
School children: baseline risk 42.4%
Supervised tooth brushing
RRR 39% (Pine et al. 2007)
30 month programme
QALY loss Cost-effective for maximum
cost of intervention*
50% extractions under GA Low £31-£56
Med £41-£66
High £48-£73
80% extractions under GA Low £40-£64
Med £50-£74
High £56-£81
*Assumes cost of dental caries is between £150-£300 for 50%, £200-£350 for 80%
2.3.4 Assessment of Interventions
These interventions are likely to most cost effective in children from deprived groups who
have a higher risk of caries, so uptake should be monitored to ensure that these
interventions are reaching children from deprived groups.
Page 20
Section 2 15
Fluoride varnish in pre-school children
Assuming a baseline risk of 39.2% (which represents children aged 0-5 years in the most
deprived quintile), that 100% of extractions are carried out under GA, that the QALY loss is
low and the cost of treatment is £175, the overall intervention may cost up to £37 per child
and be considered cost effective at the NICE threshold of £20,000/QALY. If the QALY loss is
high and the cost of treatment is £225, the intervention may cost up to £46 per child and be
considered cost effective. The study (Moberg et al., 2005) used to inform this scenario
reported the reduction in risk of caries (estimated to be 43%) at three years, and as such the
maximum cost can be considered to be the maximum three-year cost in this instance.
Supervised toothbrushing in pre-school children
Assuming a baseline risk of 39.2% and that 100% of extractions are carried out under GA, if
the QALY loss is low and the cost of treatment is £175, the intervention may cost in total up
to £27 per child and be considered cost effective at the NICE threshold of £20,000/QALY. If
the QALY loss is high and the cost of treatment is £225, the intervention may cost up to £62
per child and be considered cost effective. The study (Macpherson et al., 2013) used to
inform this scenario reported the reduction in the risk of caries (estimated to be 32%) at
three years, and as such the maximum cost can be considered to be the maximum three-
year cost in this instance.
The investigators of this study were able to provide some limited data for the costs of the
programme. There was a large variation in the annual cost per child across the different
regions that the programme was delivered in. These costs ranged from less than £5 per
child, to over £75. Lower costs per child were associated with a larger population in that
region, so it appears that there were some economies of scale involved. The provided costs
were not reported by cost component, so it is difficult to ascertain how they might apply to
other tooth brushing programmes.
Fluoride varnish in school children
Assuming a baseline risk of 42.4% (which represents children aged 5-12 years in the most
deprived quintile), if 50% of extractions are carried out under GA, and the QALY loss is low
and the cost of treatment is £175, the intervention may cost up to £35 per child and be
considered cost effective at the NICE threshold of £20,000/QALY. If the QALY loss is high
and the cost of treatment is £225, the intervention may cost up to £80 per child and be
considered cost effective. If 80% of extractions are carried out under GA, and the QALY
loss is low and the cost of treatment is £175, the intervention may cost up to £44 per child.
If the QALY loss is high and the cost of treatment is £225, the intervention may cost up to
£89 per child. The study (Moberg et al., 2005) used to inform this scenario reported the
reduction in risk of caries (estimated to be 43%) at three years, and as such the maximum
cost can be considered to be the maximum three-year cost in this instance.
Supervised toothbrushing in school children
Two different risk reductions have been assessed.
Page 21
Section 2 16
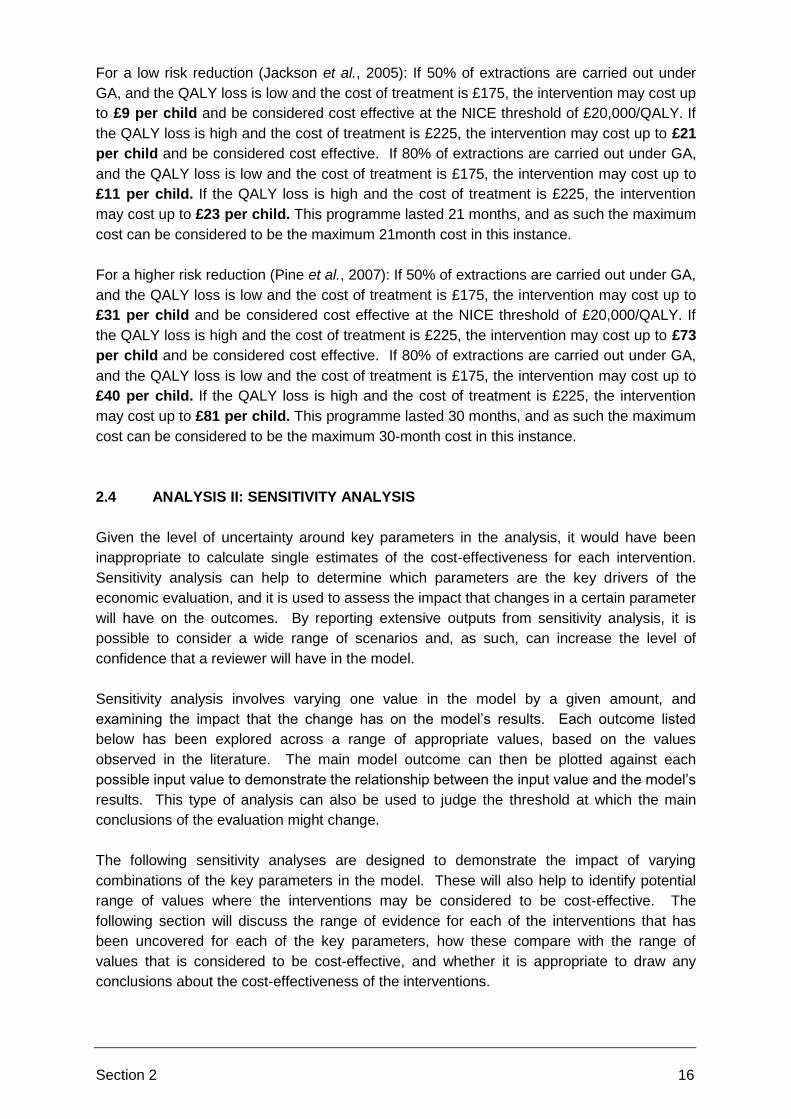
For a low risk reduction (Jackson et al., 2005): If 50% of extractions are carried out under
GA, and the QALY loss is low and the cost of treatment is £175, the intervention may cost up
to £9 per child and be considered cost effective at the NICE threshold of £20,000/QALY. If
the QALY loss is high and the cost of treatment is £225, the intervention may cost up to £21
per child and be considered cost effective. If 80% of extractions are carried out under GA,
and the QALY loss is low and the cost of treatment is £175, the intervention may cost up to
£11 per child. If the QALY loss is high and the cost of treatment is £225, the intervention
may cost up to £23 per child. This programme lasted 21 months, and as such the maximum
cost can be considered to be the maximum 21month cost in this instance.
For a higher risk reduction (Pine et al., 2007): If 50% of extractions are carried out under GA,
and the QALY loss is low and the cost of treatment is £175, the intervention may cost up to
£31 per child and be considered cost effective at the NICE threshold of £20,000/QALY. If
the QALY loss is high and the cost of treatment is £225, the intervention may cost up to £73
per child and be considered cost effective. If 80% of extractions are carried out under GA,
and the QALY loss is low and the cost of treatment is £175, the intervention may cost up to
£40 per child. If the QALY loss is high and the cost of treatment is £225, the intervention
may cost up to £81 per child. This programme lasted 30 months, and as such the maximum
cost can be considered to be the maximum 30-month cost in this instance.
2.4 ANALYSIS II: SENSITIVITY ANALYSIS
Given the level of uncertainty around key parameters in the analysis, it would have been
inappropriate to calculate single estimates of the cost-effectiveness for each intervention.
Sensitivity analysis can help to determine which parameters are the key drivers of the
economic evaluation, and it is used to assess the impact that changes in a certain parameter
will have on the outcomes. By reporting extensive outputs from sensitivity analysis, it is
possible to consider a wide range of scenarios and, as such, can increase the level of
confidence that a reviewer will have in the model.
Sensitivity analysis involves varying one value in the model by a given amount, and
examining the impact that the change has on the model’s results. Each outcome listed
below has been explored across a range of appropriate values, based on the values
observed in the literature. The main model outcome can then be plotted against each
possible input value to demonstrate the relationship between the input value and the model’s
results. This type of analysis can also be used to judge the threshold at which the main
conclusions of the evaluation might change.
The following sensitivity analyses are designed to demonstrate the impact of varying
combinations of the key parameters in the model. These will also help to identify potential
range of values where the interventions may be considered to be cost-effective. The
following section will discuss the range of evidence for each of the interventions that has
been uncovered for each of the key parameters, how these compare with the range of
values that is considered to be cost-effective, and whether it is appropriate to draw any
conclusions about the cost-effectiveness of the interventions.
Page 22
Section 2 17
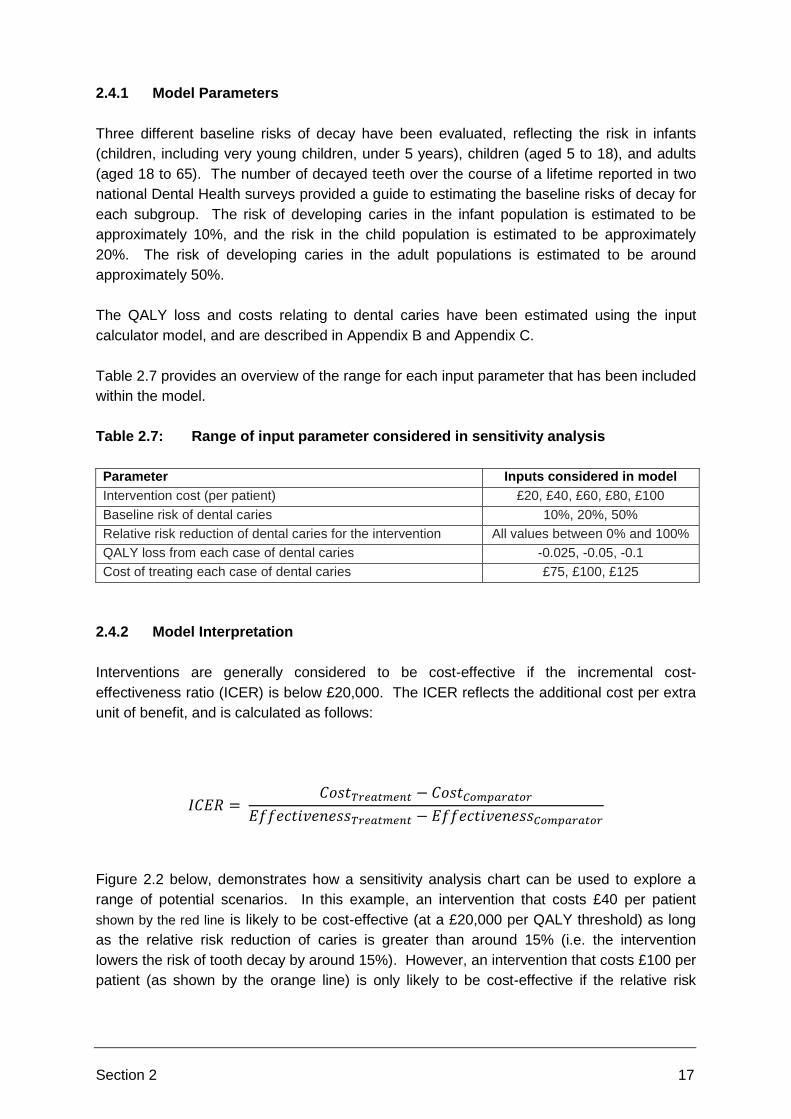
2.4.1 Model Parameters
Three different baseline risks of decay have been evaluated, reflecting the risk in infants
(children, including very young children, under 5 years), children (aged 5 to 18), and adults
(aged 18 to 65). The number of decayed teeth over the course of a lifetime reported in two
national Dental Health surveys provided a guide to estimating the baseline risks of decay for
each subgroup. The risk of developing caries in the infant population is estimated to be
approximately 10%, and the risk in the child population is estimated to be approximately
20%. The risk of developing caries in the adult populations is estimated to be around
approximately 50%.
The QALY loss and costs relating to dental caries have been estimated using the input
calculator model, and are described in Appendix B and Appendix C.
Table 2.7 provides an overview of the range for each input parameter that has been included
within the model.
Table 2.7: Range of input parameter considered in sensitivity analysis
Parameter Inputs considered in model
Intervention cost (per patient) £20, £40, £60, £80, £100
Baseline risk of dental caries 10%, 20%, 50%
Relative risk reduction of dental caries for the intervention All values between 0% and 100%
QALY loss from each case of dental caries -0.025, -0.05, -0.1
Cost of treating each case of dental caries £75, £100, £125
2.4.2 Model Interpretation
Interventions are generally considered to be cost-effective if the incremental cost-
effectiveness ratio (ICER) is below £20,000. The ICER reflects the additional cost per extra
unit of benefit, and is calculated as follows:
Figure 2.2 below, demonstrates how a sensitivity analysis chart can be used to explore a
range of potential scenarios. In this example, an intervention that costs £40 per patient
shown by the red line is likely to be cost-effective (at a £20,000 per QALY threshold) as long
as the relative risk reduction of caries is greater than around 15% (i.e. the intervention
lowers the risk of tooth decay by around 15%). However, an intervention that costs £100 per
patient (as shown by the orange line) is only likely to be cost-effective if the relative risk
Page 23
Section 2 18
reduction of caries is greater than about 30%. The chart can, therefore, be used to show the
range of potential scenarios where an intervention is likely to be cost-effective, and other
scenarios where it is unlikely to be cost-effective.
Figure 2.2: A guide to the interpretation of each graph
Figures 2.3, 2.4 and 2.5 display the impact of varying the other parameters in the model.
Figure 2.3 shows a range of scenarios for a population whose baseline risk of caries is 10%.
The different coloured lines refer to different per-patient intervention costs.
The top row of graphs assumes that the QALY loss resulting from a case dental
caries is -0.025 QALYs. On the second and third rows this loss is changed to -0.05
and -0.10 QALYs respectively.
Likewise, each column displays a different plausible cost of treating dental caries.
In column A each episode of dental caries costs £75; this is then increased to £100
in column B and £125 per case of dental caries in column C.
Each individual graph displays the ICER dependent on both the cost of the
intervention and the relative risk reduction for that intervention.
For example, the graph ‘A1’ in Figure 2.3 shows various ICERs for interventions
costing between £20 and £100 with a relative risk reduction of between 0% and
100%. All of the scenarios shown on this graph have a baseline risk of caries of
10%, a cost per case of dental caries of £75 and a QALY loss associated with
dental caries of -0.025.
Figures 2.4 and 2.5 show the same charts, but for different populations with
different baseline risk of caries.
Incremental cost-effectiveness ratio
(less than £20,000 is generally deemed to
be cost-effective)
A different curve is shown for each ‘cost’ of
intervention.
As the relative risk reduction of each intervention is increased (i.e. the
intervention is more effective), the ICER decreases.
Page 24
Section 2 19
The results of the sensitivity analysis can be interpreted according to the time scale that is
considered to be most relevant - i.e. the PHAC can estimate QALY loss and costs over
whichever time scale that is considered to be appropriate, and then the graphs in Section
2.4.3 can be used to guide discussions around whether in that circumstance the intervention
is cost-effective.
Page 25
Section 2 20
2.4.3 Model Results
Figure 2.3: Baseline risk of caries: 10%
Page 26
Section 2 21
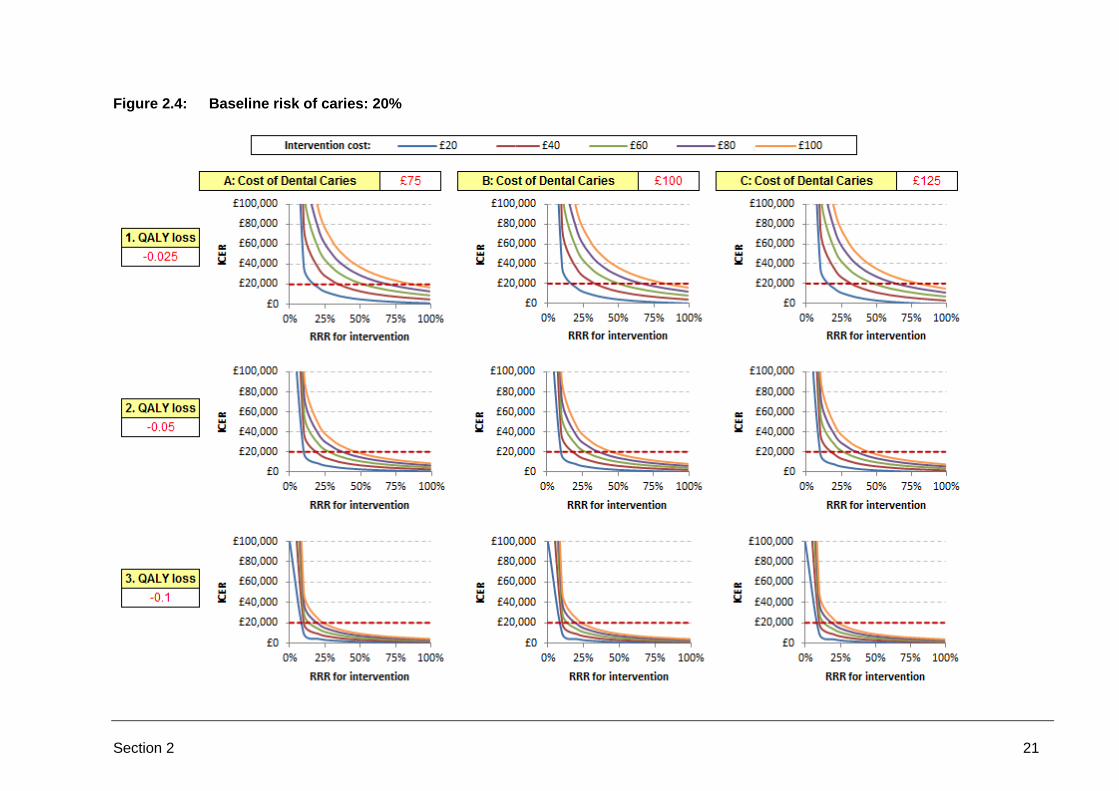
Figure 2.4: Baseline risk of caries: 20%
Page 27
Section 2 22
Figure 2.5: Baseline risk of caries: 50%
Page 28
Section 2 23
2.4.4 Interpretation of Results
The following observations can be drawn from the scenarios set out in Figures 2.3, 2.4 and
2.5 above.
2.4.4.1 Cost per case of dental caries
It appears from Figures 2.3, 2.4 and 2.5 that varying the cost of dental caries does not
significantly impact upon the results of the model. When comparing the graphs in columns
A, B and C on each of the nine rows set out above it is evident that the graphs are very
similar. Considering row 1, the blue line (representing an intervention costing £20 per
patient) crosses the £20,000 threshold line at around 20% RRR for the intervention on all
three graphs. This consistency across the three columns occurs throughout. As such, we
can infer that the cost of dental caries is not a key driver of the model’s results, nor is it likely
to be a key driver in the evaluation of any of the interventions.
2.4.4.2 QALY loss per case of dental caries
Various QALY losses associated with dental caries are displayed in Figures 2.3, 2.4 and 2.5.
By considering the graphs across in rows 1, 2 and 3 on each Figures 2.3, 2.4 and 2.5, the
impact of varying the QALY loss from -0.025 to -0.10 can be established. Across all three
sheets it appears that varying the QALY loss has a relatively large impact on the results of
the model, in that the higher the QALY loss, the more likely the intervention is to be cost-
effective. The greater the assumed QALY loss, the less effective an intervention needs to
be in order to be seen as cost-effective.
2.4.4.3 Intervention cost per individual
A range of intervention costs are provided on each of the graphs displayed in Figures 2.3,
2.4 and 2.5. The lowest cost considered is £20 per person for the total cost of the
intervention (blue line), whilst the highest is £100 per person (orange line). The impact of
varying the cost of the intervention within this range is shown by the shift in the ICER line as
the cost changes. For instance, where the intervention costs £20 per person, the ICER line
is lower (and more likely to be under the £20,000 threshold line) than where the intervention
costs £100 per person. The cost of the interventions is a key driver of the model, as
interventions costing £20 per person almost always cost effective provided the RRR is 25%
or greater, whilst in some populations interventions costing £100 per person will never be
cost effective at a £20,000 per QALY threshold.
2.4.4.4 Relative risk reduction of the intervention
The relative risk reduction of the intervention is displayed across the x axis on each graph,
where 0% indicates that an intervention that does not reduce the risk of disease and 100%
represents a highly effective intervention. On each graph, the ICER reduces significantly as
the intervention become more effective, showing that the relative risk reduction (or
effectiveness) of the intervention under consideration is a key driver of the model. The
Page 29
Section 2 24
graphs are presented so that the user can see what level of risk reduction is needed for each
intervention to be cost-effective.
2.4.4.5 Low baseline risk of dental caries (10%)
Figure 2.3 represents a population with a low baseline risk of dental caries. Only where the
QALY loss associated with dental caries is relatively high, or the relative risk reduction of the
intervention is closer to 100% (i.e. the intervention is very effective) does the intervention
become cost-effective. This occurs because only a small proportion of the population are
able to benefit from the intervention and, as such, the avoided QALY loss needs to be great
or the intervention highly effective, to ensure that the benefit this small number of patients
gain outweighs the cost of implementing the intervention across the whole population.
2.4.4.6 High baseline risk of dental caries (50%)
Figure 2.5 represents a population with a far higher baseline risk of dental caries.
Conversely, to the population with a low baseline risk, here interventions are cost-effective
under a wider range of scenarios. Only where both the QALY loss associated with dental
caries is low (-0.025) and the intervention is relatively ineffective (below 20% RRR) does the
intervention fail to be cost-effective. This population on the whole has great potential to
benefit from an intervention that will reduce incidence of dental caries, and as such this
benefit outweighs the cost of implementing the intervention.
2.4.5 Assessment of Interventions
The interventions that have been considered in this analysis are based around a life course
approach. Most of the relevant interventions that have been identified are in children under
the age of 18. The 17 interventions listed below are interpreted in the context of the
sensitivity analysis shown in Section 2.4.2. The mapping of each intervention to the graphs
shown in Figures 2.3, 2.4 and 2.5 aims to be indicative only and based upon very limited
published literature. The effectiveness of each intervention is discussed in further detail in
Section 3.
The inputs described within this section are illustrative and based on the limited published
literature available. When considering specific population subgroups, the PHAC may wish to
interpret cost-effectiveness results from a different graph to that suggested.
2.4.5.1 Pre-school children
Fluoridated milk in nurseries (Stecksen-Blicks, 2009);
Supervised brushing in nurseries (MacPhaerson, 2013);
Oral health education in nurseries (Tubert-Jeannin, 2012);
Multi-component oral health promotion in the community (Blair, 2005);
Home and/or community based oral health education (Whittle, 2008 and Ellwood,
2004).
Page 30
Section 2 25
Pre-school children are likely to still have their primary teeth, and not yet have developed
their permanent teeth. In this population, the baseline risk of dental caries in this population
is considered to be low (due to a shorter time of exposure to cariogenic agents and
behaviours etc.). It is estimated that this population would best fit within Figure 2.3, where
baseline risk of dental caries is 10%. Alternatively, it has been estimated that in some
sectors of society the risk of caries in infants and children is closer to 50%, and in this
instance the graphs in Figure 2.5 would be more appropriate to consider. The low QALY
loss and costs pictured in graph A1 of the appropriate figure may best represent this
population.
The RRR associated with the each of the interventions listed above has been estimated from
results reported in the literature and as such values are indicative only. All five interventions
had fairly similar RRR for dental caries of between 25% and 37% compared to no
intervention. If it is considered that graph A1 on Figure 2.3 is most appropriate for this
population and if the intervention costs more than £40 or more per child these interventions
are unlikely to be cost-effective at a £20,000 per QALY threshold. Only where the
interventions above have a lower cost (at around £20 per child), or if the baseline risk of
caries is significantly higher, are they likely to be cost-effective at a £20,000 threshold.
2.4.5.2 School children
Fluoride varnish in schools (Moberg, 2005a and Hardman, 2007);
Fluoridated milk in schools (Riley, 2005 and Ketley, 2003);
Fluoride mouth rinse in schools (Levin, 2009);
Supervised brushing in schools (Jackson, 2005 and Pine, 2007);
Multi-component oral health promotion in schools with preventative treatment
(Bodner, 2010);
Addressing common risk factors in schools;
Oral health education in schools (Piper 2012), (Pieterse, 2006), (Vanobbergen,
2004);
Peer-to-peer oral health education in schools;
Community oral health education;
Home visits to improve dental care access.
School children are likely to have a mixture of primary and permanent teeth. As this
population ages, primary teeth will be replaced with permanent teeth and older school
children will generally have all permanent teeth. The baseline risk of dental caries is
estimated to be higher in school children compared with pre-school children. It could be
approximated that this population would best fit within Figure 2.4 (baseline risk of dental
caries of 20%). It is unknown to what degree the QALY loss and costs associated with
dental caries differs to that of pre-school children. Restorations in this age group have a
relatively good survival rate compared to the older age groups (see Appendix A) and so both
the QALY loss and costs associated with experiencing dental caries are comparatively low.
As such, a range of low and medium estimates for cost and QALY loss could be considered,
and graphs 1A, 1B, 2A and 2B on Figure 2.4 might best represent these children.
Page 31
Section 2 26
The relative risk reduction for each of the interventions listed above for school children were
estimated as accurately as possible given the limited information available in the published
literature. A number of interventions (addressing common risk factors; peer-to-peer
education; community oral health education and home visits to improve dental care access)
had unknown RRR compared to no intervention in terms of reducing incidence of dental
caries. By considering graphs 1A, 1B, 2A and 2B on Figure 2.4 it is apparent more
information is required to determine whether, or not these interventions will be cost-effective,
i.e. the ICER is likely to be above £20,000 per QALY. Three further interventions had low
estimated RRRs: supervised brushing (11%), multi-component with preventative treatment
(0.04) and oral health education in schools (8%). It is evident from Figure 2.4 that these
interventions are also unlikely to be cost-effective where the per-patient cost of the
intervention is £20 or more, unless the QALY loss associated with each case of dental caries
is greater than 10%.
The final three interventions had far higher estimated RRR. Fluoride mouth rinse had a RRR
of dental caries of 21%. As such, where the QALY loss of dental caries is assumed to be -
0.05 and the cost per child of the intervention is £40, or below, graphs 1A and 1B on Figure
2.4 show that the intervention would be cost-effective. If the QALY loss of dental caries is -
0.1 (graphs 2A and 2B), the cost of fluoride mouth rinse could rise to £60 per patient and the
intervention remain cost-effective. The estimated RRR of fluoridated milk was 31%.
Considering the same four graphs on Figure 2.4 as above, where the QALY loss of dental
caries is -0.05 fluoridated milk will be cost effective if the cost per child is £60, or less.
Where the QALY loss is -0.1 (graphs 2A and 2B), fluoridated milk remains cost effective at
all costs considered (up to £100 per child). The final intervention, fluoride varnish, had an
approximate RRR of 43%. According to graphs 1A, 1B, 2A and 2B, this intervention will
always be cost-effective within the ranges considered except when the QALY loss
associated with dental caries is -0.05 or less and the cost of the intervention is at the highest
end of the plausible range (£100).
2.4.5.3 Adults of working age
Workplace oral hygiene education (Morishita, 2003).
Adults of working age across their lifetime are likely to have a higher baseline risk of dental
caries than either school children, or pre-school children. A baseline risk of 0.5, or 50% over
the course of the model, is the most plausible estimation for this subgroup of the population
and as such Figure 2.5 should be considered. The only intervention identified in this
population was workplace oral hygiene which had an estimated RRR of 4%. Considering
the graphs on Figure 2.5 an intervention with a RRR of 4% is only cost-effective where the
intervention costs £40 or less per adult and the QALY loss is -0.05 or greater (shown on
rows 2 and 3), or if the intervention costs no more than £60 and the QALY loss is -0.10 or
greater (shown on row 3). It is reasonable to assume that an adult with dental caries may
experience a QALY loss of 0.1 or more (over their lifetime) and, as such, provided that the
intervention costs no more than £40 per adult, it is likely to be cost-effective at a £20,000 per
QALY threshold.
Page 32
Section 2 27
2.4.5.4 Adults over 65
Community oral health promotion (Al-Haboubi, 2012).
Similarly to adults of working age, adults over 65 are also likely to have a higher baseline
risk of dental caries, of 50%. Therefore, Figure 2.5 could again be considered for this
population. The literature reported one intervention for this subgroup of the population;
community oral health programme, which had an estimated RRR of 8%. Where the QALY
loss associated with dental caries is set at -0.05, such an intervention will be cost-effective
provided that it costs £40 or less. As the assumed QALY loss caused by having dental
caries increases, the cost at which the intervention becomes cost-effective reduces such
that, if the QALY loss is -0.05 the intervention is cost-effective up to a cost per person of
£80. Where the QALY loss was higher still, at -0.10, the community oral health programme
is cost-effective at all costs per adult considered (up to £100).
2.4.6 Summary of Sensitivity Analysis
Table 2.8 provides a suggestive mapping of the 17 interventions to the graphs shown in
Figures 2.3, 2.4 and 2.5. It should be noted, however, that the scenarios reported in Section
2.4 of this report are presented for guidance only, and are suggested scenarios to illustrate
the likelihood of the intervention being cost-effective in a range of plausible scenarios. Due
to a lack of robust published evidence, it is not possible to confidently state that some, or all,
of the interventions are cost-effective (or not). The user of this report is urged to use the
illustrative charts and accompanying text to determine the plausibility of each intervention
being cost-effective, based on the best available evidence.
Page 33
Section 2 28
2.4.7 Probabilistic Sensitivity Analysis
Probabilistic sensitivity analysis (PSA) provides a useful technique to quantify the level of
confidence that a decision-maker has in the conclusions of an economic evaluation. NICE
requests that all submissions include PSA in order to provide estimate of confidence around
the model’s findings.
2.4.7.1 Parameters varied in PSA
In addition to the economic analysis described above, a probabilistic approach was also
undertaken. The probability that the intervention is likely to be cost-effective can be
estimated for each combination of the parameters in the sensitivity analysis (such as for an
intervention given in a high risk population). To reflect the level of uncertainty around each
of the five parameters, a standard deviation was defined for each parameter. In order to
calculate a random estimate for each parameter, an appropriate distribution was fitted
around it, as described in Table 2.9.
Table 2.9: Range of parameters in PSA
Parameter Mean* Standard
error Distribution Rationale
Baseline risk 10%, 20%, 50% 0.01 Beta
distribution
Produces values
between 0 and 1 (or 0%
and 100%)
Relative risk
reduction
0%, 10%, 20%,
30%, 40% 0.15
Lognormal
distribution Used for ratios
Intervention cost £20, £40, £60,
£80, £100 £15
Gamma
distribution
Ensures non-negative
values
QALY loss from
dental caries -0.025, -0.05, -0.1 0.015
Gamma
distribution
Manipulated to ensure
negative values only
Cost of dental
caries £75, £100, £125 £25
Gamma
distribution
Ensures non-negative
values
*The mean value of each parameter is described in Section 2.4.
A single estimate of the probability of cost-effectiveness was calculated by generating 1,000
ICER estimates in the model by randomly generating the five key parameters according to
the distributions in Table 2.3. This method was repeated for each of the scenarios described
in Section 2.4.
2.4.7.2 Interpretation of probabilistic model
Figure 2.6 demonstrates how a PSA chart can be used to explore a range of potential
scenarios. The range of intervention costs are displayed across the columns of the chart,
and the range of relative risk reductions are displayed down the rows of the chart. In this
example, an intervention that costs £40 per patient is more than 50% likely to be cost-
effective (at a £20,000 per QALY threshold) as long as the relative risk reduction of caries is
greater than around 35%. However, an intervention that costs more than £80 per patient is
Page 34
Section 2 29
a lot less likely to be cost-effective for the whole range of relative risk reduction explored in
the analysis.
Figure 2.6: A guide to the interpretation of each PSA chart
Figures 2.7, 2.8 and 2.9 display the probability that the intervention is cost-effective in each
scenario.
Page 35
Section 2 30
Figure 2.7: Probability of cost-effectiveness (baseline risk: 10%)
Page 36
Section 2 31
Figure 2.8: Probability of cost-effectiveness (baseline risk: 20%)
Page 37
Section 2 32
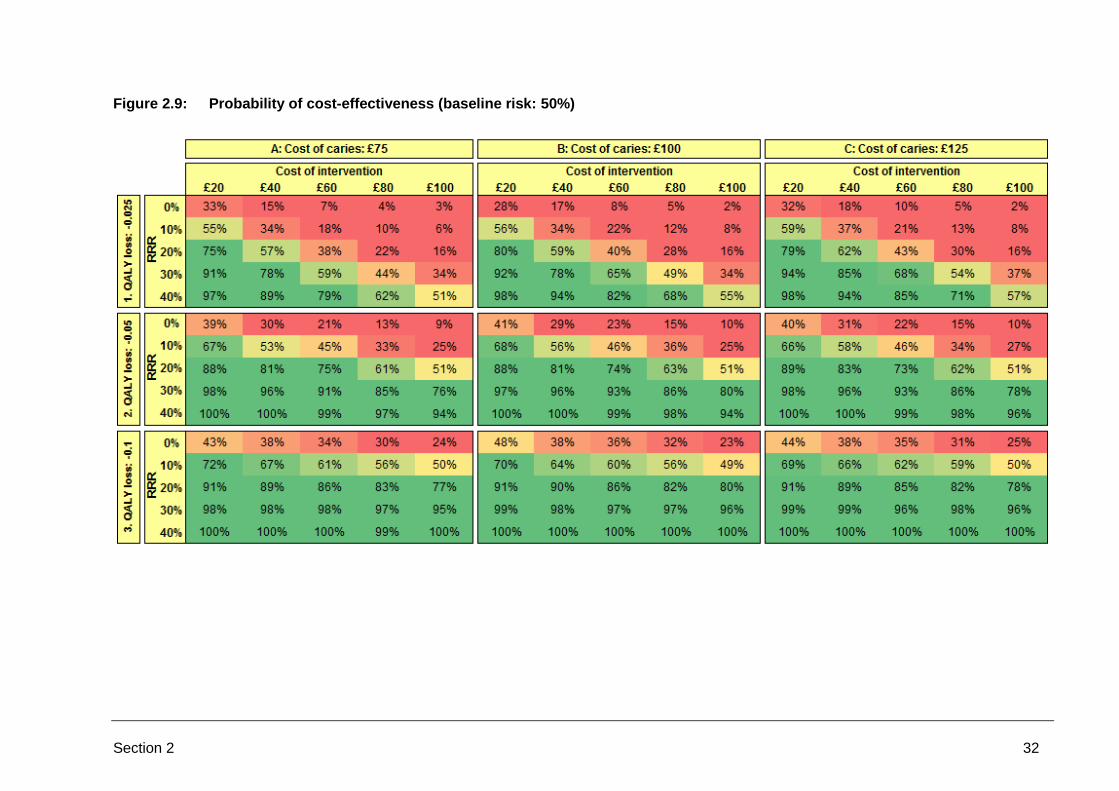
Figure 2.9: Probability of cost-effectiveness (baseline risk: 50%)
Page 38
Section 2 33
2.4.7.3 Interpretation of results
The results of the PSA are largely consistent with that of the sensitivity analysis:
The cost of dental caries does not appear to significantly impact upon the results
of the model. This is demonstrated in Figures 2.7, 2.8 and 2.9, whereby comparing
the charts in columns A, B and C shows that the likelihood of cost-effectiveness is
very similar across the three columns.
The QALY loss has a relatively large impact on the results of the model, in that the
higher the QALY loss, the more likely the intervention is to be cost-effective. The
greater the assumed QALY loss, the less effective an intervention needs to be in
order to be seen as cost-effective.
Intervention cost is a key driver of the model, as interventions costing £20 per
person have a much higher likelihood of being cost-effective compared to
interventions costing £100 per person, which have a very low likelihood of being
cost-effective. Alternatively, if the cost of the intervention is held constant at £20,
the likelihood that it will be cost effective increases with an increase in the baseline
risk, RRR and QALYs gained.
The relative risk reduction of the intervention is a key driver of the results. On
each chart, the likelihood of being cost-effective increases significantly as the
intervention becomes more effective.
A population with a low baseline risk of dental caries is presented in Figure 2.7.
Only where the QALY loss associated with dental caries is relatively high, or for
scenarios where the relative risk reduction is higher (i.e. the intervention is more
effective) and the cost of the intervention is low (i.e. £20 per person) does the
intervention have a high likelihood of being cost-effective.
A population with a higher baseline risk of dental caries is presented in Figure
2.9. The interventions are cost-effective under a wider range of scenarios. Only
where both the QALY loss associated with dental caries is low (-0.025) and the
intervention is relatively ineffective (below 20% RRR) does the intervention have a
low likelihood of being cost-effective.
Page 39
Section 3 34
Section 3: Evidence for Effectiveness
3.1 SUMMARY
The sensitivity analyses in Section 2 explored a range of different relative risks and the
impact on the likelihood of cost-effectiveness. This section explores the range of
effectiveness evidence that has been identified for each intervention, which have been used
to form the effectiveness evidence in Analysis I, and can be used to guide PHAC
discussions around the appropriate sensitivity analysis figure to refer to in Analysis II when
assessing the likelihood of cost-effectiveness for each intervention.
The review of evidence of the effectiveness of oral-health improvement programmes was
conducted by Bazian in accordance with the methods set out in the CPHE Public Health
Guidance Methods Manual. The main steps in the review included the identification of
relevant studies by a systematic search of electronic literature databases, selection of
relevant studies relating to community oral health programmes or interventions, an
assessment the quality of the included studies, and data extraction from the included
studies. For full details of the methods used to identify evidence for the effectiveness
review, please refer to the Bazian report.
The Bazian review was used as a basis for our estimates of the relative risk of dental caries
for each of the interventions. A range of evidence has been extracted from the studies
identified in the review, with further details around the studies, the reported data and our
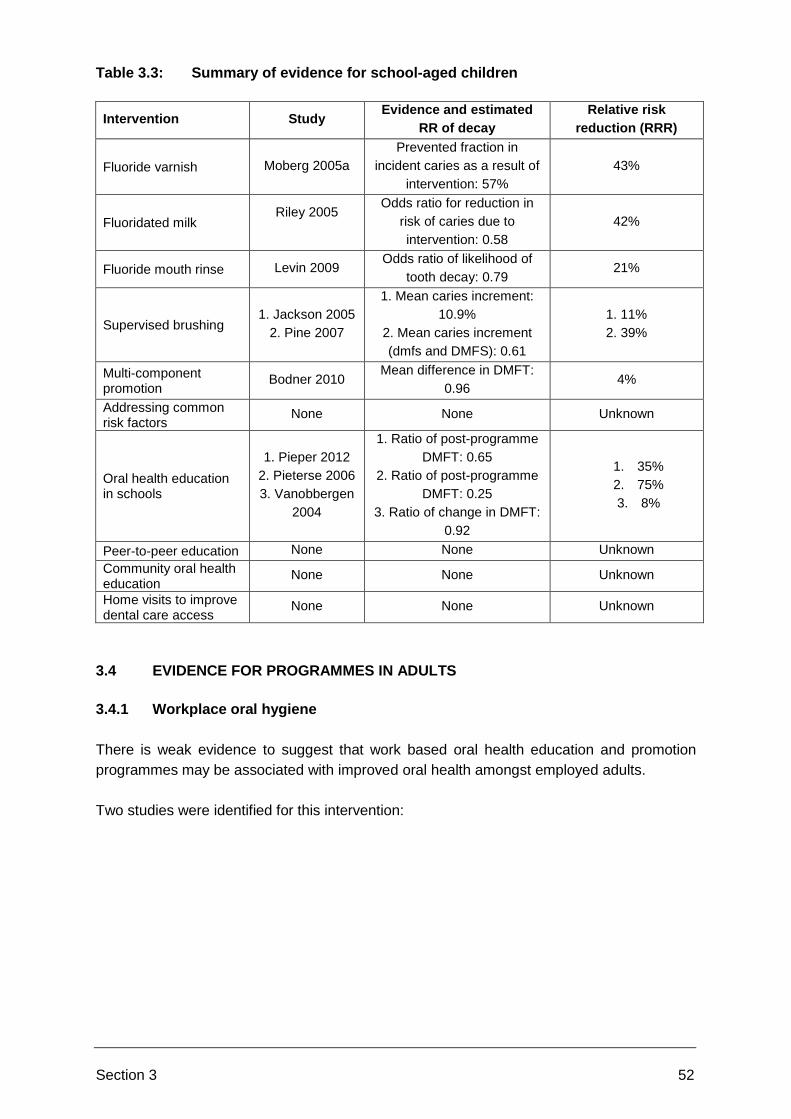
interpretation provided in Sections 3.2, 3.3 and 3.4 of this report. A summary of the studies
and the reported data are presented in Table 3.1. Where there was more than one study
identified for each intervention, this report identifies the most appropriate study or studies to
consider for the economic analysis, based on either the data quality as assessed in the
Bazian review, or using our own judgement based on elements such as the setting,
population size and the relevance of the reported data. Quality appraisal in the Bazian
review was carried out using NICE quantitative study quality checklists, and we have aimed
to explore studies that were assessed as being either [++] all or most of the NICE checklist
criteria have been fulfilled, or [+] some of the checklist criteria have been fulfilled.
It may be difficult to compare the studies both within each intervention and across all
interventions given that there is a wide range of data that has reported. There was a large
amount of heterogeneity in the studies, such as around the time frame of the programme
and the follow-up period for which outcomes were reported, different population groups
(e.g. in different socioeconomic areas, different countries where the level water fluoridation
may vary from that in the UK), and baseline risks of decay. There was heterogeneity
particularly around the reported clinical outcomes, described below:
Most studies reported the clinical outcomes that were evaluated in the study, for
example, the difference in dmft/DMFT before and after the programme, the
Page 40
Section 3 35
dmft/DMTF prevented fraction, and the proportion of the study population that are
caries-free before and after the programme.
Where the impact on the levels of tooth decay has been evaluated by a study,
different severities of decay (e.g. d1mft, d2mft etc.) have been reported in different
studies.
Few studies provided an estimate of the magnitude of the impact on the clinical
outcomes, such as relative risk (RR) or odds ratios (OR).
Some studies only reported intermediate outcomes relating to modifiable
behaviour, such as the frequency of brushing and flossing, snacking levels, oral
health knowledge and use of dental services, but this evidence is of limited use
given that no quantitative data exist to link these to hard endpoints.
Given that the heterogeneity between studies will make it challenging to compare one type
of programme in one study to a programme in another study, the PHAC was interested in
using direct evidence from head-to-head studies of different programmes to inform an
analysis. Hardman (2007) reports on an RCT assessing the effectiveness of fluoride
varnish compared to the provision of oral hygiene materials (toothbrush and fluoride
toothpaste) in the UK. However, the study found that there were no significant differences
between each intervention group, and so the only difference between the two groups would
be due to the intervention costs (which were not reported).
The long-term impact of interventions on oral health, including levels of tooth decay and
gum disease across the life-course, is rarely evaluated in studies. Sufficiently powered,
longitudinal studies are generally costly to fund, implement and evaluate. No published
studies were identified in the literature searches for this work that demonstrated a causal
relationship between oral health interventions in very young children and a reduced life time
risk of dental caries. However, it is generally accepted among oral health professionals that
improving oral health behaviours in young children with primary teeth may reduce their
likelihood of experiencing oral disease including caries and gum disease when they have
their primary teeth or their permanent successors. Improving oral health behaviours for very
young children may also reduce the risk of undergoing surgery for tooth extraction with
general anaesthetic, especially for children in vulnerable groups.
In order to compare the impact of different interventions, the relative risk (RR) of dental
caries has been estimated from the evidence where reported in the studies and where this
is possible. Some studies do not report the appropriate data to enable this (such as for
those studies reported behavioural outcomes) and in these cases a relative risk cannot be
estimated. This is explored in further detail in the sections below. There are however some
limitations associated with this approach which is largely due to the heterogeneity of the
reported data, and as such the PHAC should take this into consideration when interpreting
the estimated relative risks.
Page 41
Section 3 36
Table 3.1: Summary of data
Patient group Setting Intervention Source for Effectiveness Effectiveness data
0-5 year olds Pre-school / nursery
Fluoridated milk 1. Stecksen-Blicks 2009 1. Caries free primary molars and canine teeth Mean dmfs increment in molars and canine teeth
0-5 year olds Pre-school / nursery
Supervised tooth brushing 1. Macpherson 2013 1. Difference in mean d3mft over 12yrs
0-5 year olds Pre-school / nursery
Oral health education 1. Grant et al. 2010, 2. Tubert-Jeannin et al.
2012 3. Axelsson et al. 2006
1. Intervention improved scores in the immediate post-test but these were not sustained two weeks later.
2. Mean dmft. No major difference observed between 2003 and 2009.
3. Percentage of caries free three year olds increased from 35% in the early 1970 to 97% twenty years after. Mean values of deft Incidence and prevalence, but may not be for the correct age group
0-5 year olds At home Oral health promotion 1. Blair 2004 2. Blair 2006
1. dmft prevented fraction of 3yo and 4yo Care Index before and after (proxy for dental service utilisation)
2. Odds for tooth decay at 5yo
0-5 year olds Community Education programmes targeting parents/carers
1. Wennhall 2005, 2. Milgrom 2010, 3. Whittle 2008, 4. Shute 2005, 5. Yuan 2007, 6. Cruz 2012, 7. Plutzer 2008, 8. Ellwood 2004
1. Caries free at age 3 (RR) Mean DEFT Daily brushing (%) Proportion eating sweets
2. Caries free at age 2 (RR) Mean DEFT at age 3 Bleeding gums, visible plaque (%)
3. Mean DMFS at age 3, 5 4. Dental registration rates (OR) 5. Dental registration rates (%) 6. Topical fluoride use
Dental service utilisation 7. Severe caries in 20m.o (OR) 8. Caries prevalence
Mean caries (DMFT score, b&a)
5-10 year olds Primary and Fluoride varnish 1. Moberg 2005a 1. Prevented fraction of caries
Page 42
Section 3 37
Patient group Setting Intervention Source for Effectiveness Effectiveness data
Secondary schools 2. Splieth 2011 3. Hardman 2007 4. Dohnke-Hohrmann
2004
2. Mean caries 3. Mean advanced caries (mean D3fs, d2fs, d1fs) 4. Mean DMFT (reduction after 4yrs)
5-10 year olds Primary and Secondary schools
Milk 1. Ketley et al. 2003 2. Riley et al. 2005
1. Mean dmft, mean dmfs 2. Mean DMFT/Dt/DFS values
5-10 year olds Primary schools Mouthwash 1. Kaneko et al. 2006 2. Neko-Uwagawa et al.
2011 3. Levin et al. 2009 4. Komiyama et al. 2012
1. Mean DFT increment. Mean DFT. OR caries incidence 5.73 in groupd with fluoride mouthrinse and 3.47 in group without it.
2. DMFT prevalence rate and mean DMFT, percentage distribution
3. D3MFT>0 OR. Mean caries. 4. Caries prevalence, DMF person rate, DMFT index,
mean caries
5-10 year olds Primary schools Supervised tooth brushing 1. Jackson 2005 2. Pine 2007 3. Burnett 2005 4. Wind 2005
1. Change in DMFS 2. 3-yr caries incidence (D3MFS) in teeth that were caries
free and with caries at age 5 3. Caries incidence (D3MFS) in teeth that were caries free
at age 5 4. Brushing frequency
Brushing knowledge
5-10 year olds Primary schools Multi-component promotion with preventive treatment
1. Niederman 2008 2. Bodner 2010 3. Axelsson 2006
1. Caries incidence (OR) 2. Decayed (%) 3. Mean DFS and DS
5-10 year olds Primary and Secondary schools
Addressing common risk factors
1. Freeman 2009 2. Muirhead 2011 3. Hedman 2010
1. D3cvMFT at BL and 24m follow-up 2. 2+ decayed teeth (%) 3. Tobacco use (%)
5-10 year olds Primary schools Oral health education 1. Vanobbergen 2004 2. Dental Health
Foundation 2007 3. Pieper 2012 4. Pieterse 2006 5. Livny 2008
1. Prevalence of and average decay (DMFT) Sulcus Bleeding Index score Proportion brushing/flossing daily Proportion eating 2+ snacks Dental service utilisation (mean Restoration Index)
2. Salivary fluoride levels (proxy for brushing) Tooth brushing, snack knowledge
3. % caries free at age 12 Mean D5,6MFT
Page 43
Section 3 38
Patient group Setting Intervention Source for Effectiveness Effectiveness data
Severity of caries Index score 4. Mean DMFS
Brushing levels (% twice daily) 5. Brushing levels (% twice daily)
Diet (% bringing sweets)
5-10 year olds Primary schools Peer-to-peer oral health education
1. Freeman 2003 2. Reinhardt 2009
1. Snacking levels Oral health knowledge
2. Time spent brushing, proportion with good technique Oral health attitude
3. Proportion with good technique, time spent brushing
5-10 year olds Community (aged 5 – 15)
Oral health education 1. Biesbrock 2004 2. Biesbrock 2003
1. Plaque and Gingival Index Plaque, brushing or food knowledge
2. Plaque and Gingival Index Oral health knowledge
5-10 year olds At home (aged 4 – 15)
Home visits to improve dental care access
1. Binkley 2010 2. Harrison 2003
1. Use of dental services (%claims) 2. Receiving benefits (%)
Adults Workplace Oral hygiene education 1. Ojima 2003 2. Morishita 2003
1. Periodontal inflammation 2. DMFT score and % high Periodontal Index after
programme. No BL reported.
Adults over 65 Community Oral health promotion and education
1. Al-Haboubi 2012
2. Marino 2004
3. Marino 2013
1. Plaque and Gingival Index, DMFS score 2. Caries, periodontal, cancer knowledge
OR of flossing and brushing OR of dental service use
3. Plaque and Gingival Index Frequency of flossing
Page 44
Section 3 39
3.2 EVIDENCE FOR PROGRAMMES IN INFANTS AND PRE-SCHOOL CHILDREN
3.2.1 Fluoridated milk
Weak evidence suggests that a nursery based daily fluoride milk programme may be
effective at reducing caries amongst younger nursery school children.
One study was identified for this intervention (Stecksen-Blicks et al. 2009), which was set in
Sweden for pre-school age children attending day care centres. Milk supplemented with
2.5mg F/l and probiotics was provided daily for 21 months. Due to study design limitations,
these results may not be representative of older nursery school children. The study attrition
rate was greater than 25%, and children completing the study were, on average, younger
than non-completers (mean age 42 vs. 60 months). This is due in part to difficulty with
follow-up amongst older children who had left the day care centres.
The intervention had a significant effect on mean dmfs increment of the molars and canine
teeth, with a mean dmfs increment of 0.3 (SD 1.8) in the intervention group and 1.6 (SD 3.1)
in the comparator group, which represents a prevented fraction of 75%. This value was
used to calculate a RRR, which was estimated to be 25%.
In addition to the evidence described above, a recent Cochrane review of fluoridated milk
(2005) found two RCTs, one of which presented evidence for pre-school children. This study
saw a significant reduction in DMFT and in dmft after three years. However the review
suggests that there is insufficient evidence to include milk as a vehicle for the delivery of
fluoride to vulnerable children.
3.2.2 Supervised tooth brushing
Weak evidence suggests that a national daily supervised tooth brushing programme in
nurseries that includes provision of fluoride toothpaste for home use is associated with
significant improvements in oral health of five year old children at a population level.
One large study in the UK (Childsmile, Macpherson et al. 2013) involved daily supervised
tooth brushing in nurseries, and distribution by nurseries of fluoride toothpaste for use at
home. The intervention was provided for 12 years between 1987 and 2009. Given the study
design, conclusions can only be drawn regarding the association between the
implementation of the nationwide nursery based supervised toothbrushing component of
Childsmile and changes in tooth decay amongst five year old children. As a nationwide
programme, the ability to assess whether the reduction seen during this time period is due to
the programme itself, or whether it corresponds with a secular trend in caries reduction is
restricted to assessment in caries in the decade prior to implementation.
The intervention was associated with a reduction in mean d3mft among five year old children
10 to 12 years after the programme compared to the three years prior to implementation,
with a pre-programme d3mft of 3.06 (SD 3.76), and a post-programme d3mft of 2.07 (SD
3.16). The ratio in mean d3mft before and after the programme was used to approximate the
Page 45
Section 3 40
relative risk of decay, and was estimated to be 0.68. From this, a RRR of 32% can be
calculated.
3.2.3 Oral health education
Weak evidence suggests that nursery based oral health education and promotion
programmes may prevent the worsening of caries amongst young children in deprived
communities, but are not associated with improvements in oral hygiene, oral health
knowlede or dental decay status.
Three studies were identified for this intervention;
Grant et al. 2010, an RCT in a population of low-income children enrolled in a pre-
school in the USA, consisting of a single brief oral health education;
Tubert-Jeannin et al. 2012, a French before-and-after study of children aged 3 to 5
attending public schools in deprived areas with high caries levels, consisting of a 3-
year programme aimed at improving tooth brushing habits and use of fluoridated
toothpaste, educational activities on oral hygiene, nutrition and dental care directed
at carers and school staff;
Axelsson et al. 2006, a before-and-after study of children aged 3 to 5 attending
kindergarten in Sweden between 1979 and 1999, consisting of a 3-year programme
of educational activities on oral health, supervised tooth brushing with fluoride
toothpaste, plus professional tooth cleaning and fluoride varnish (2-4 times a year)
for 10% of children at the highest risk.
Tubert-Jeannin 2012 was considered by the EAC to be the most relevant and the most
appropriate study to inform the analysis, particularly due to the relatively large population
(n=1,073). Of the three studies, it was also reported by Bazian as having the highest quality
evidence ([+]). It is also important to note that the study was undertaken in a deprived area
(42.2% students were in a deprived area, 28% in semi-deprived area) and care should be
taken when assessing whether this study is representative of the population considered in
the decision for resource allocation.
Axelsson 2006 compared the baseline level of decay from the early 1970s to the post-
programme levels, and is unlikely to reflect the baseline level of caries. Grant 2010 did not
report outcomes appropriate for the model (hygiene behaviours, knowledge and attitudes).
In the Tubert-Jeannin study, programme schools were associated with a mean dmft of 1.47
(SD 2.75) before the programme vs. 1.44 (SD 2.78) after; non-programme schools were
associated with a mean dmft of 0.97 (SD 2.42) before vs. 1.52 (SD 2.83) after. This
suggests that the programme was associated with preventing a worsening of tooth decay.
The ratio in mean d3mft change before and after the programme for the programme schools
and the non-programme schools was used to approximate the relative risk of decay. After
the baseline d3mft of the non-programme school was adjusted, the RRR was estimated to be
37%.
Page 46
Section 3 41
3.2.4 Community oral health promotion with fluoride provision
Moderate evidence from two interrupted time series describing similar programmes suggests
that oral health promotion campaigns delivered through multiple venues and targeting
several aspects of oral health may be associated with a reduced risk of dental decay in
children under the age of five living in deprived communities.
Blair et al. 2004 and Blair et al. 2005 were both interventions targeting breakfast clubs in
schools and community centres, and includes the promotion of sugar free medicines in
National Smile Week, snack and meal policies for schools, fruit promotion in nurseries and
schools, baby bottle swap/cup provision, annual community fairs, tooth brushing schemes
(e.g. in nurseries), free toothbrush and fluoride toothpaste, opportunistic oral health
promotion by health visitor, oral health related competitions, child friendly dentist scheme,
and parenting support baby club.
Blair et al. 2004 was targeted at residents in a severely socioeconomically deprived
area of Glasgow; children aged from 3 to 5 years were included in the outcome
analysis.
Blair et al. 2005 was a much larger study (n=8628) and targeted children aged
under 5 in Glasgow.
Both studies were assessed by Bazian as being of a good quality ([+]). However, the EAC
considered Blair 2005 to be the most relevant and the most appropriate study to inform the
analysis, and was considered to produce a more robust estimate of the effect size given the
larger population. The study reported lower odds of tooth decay at age 5. For the wider
population, the odds ratio was estimated to be 0.66 and as such the RRR was 34%.
3.2.5 Home or community-based oral health education
Moderate evidence suggests that community centre based oral health promotion and
education programmes delivered to low-income mothers or parents of young children (aged
2) may be effective at reducing tooth decay over approximately one year.
Moderate evidence suggests that oral health promotion and education programmes
delivered by health visitors during early life home visits are no more effective than standard
health visits at improving the oral health of children under the age of five, but may be
associated with improvements in dental registration rates in deprived areas.
Inconsistent evidence was identified regarding the effect of oral health promotion and
education materials and supplies delivered via post on tooth decay of young children;
effectiveness may vary according to deprivation status and provision of fluoride toothpaste.
Postal reminders of eligibility for dental services and fluoride varnish benefit programme may
have no effect on dental registration or use of fluoride amongst low-income children.
Eight studies were identified for this intervention:
Page 47
Section 3 42
Wenhall et al. 2005, a before-and-after study targeting the parent/guardian of
children aged 24 to 36 months in a low socioeconomic area of Sweden. In
community outreach centres, an oral health promotion programme was delivered by
dental assistants during five sessions over the course of a year. The programme
included oral hygiene instruction, supplies, free fluoride tablets and discounted
fluoride toothpaste, dietary recommendations and problem solving.
Milgrom et al. 2010, a cohort study targeting mothers in the USA eligible for
medical and dental benefits with children aged 24 to 35 months. The programme
was delivered in community centres and as home visits for one year, and included
educational materials promoting dental visits for young children, plus home visits or
counselling at community centres and assignment to a dental managed care
programme.
Whittle et al. 2008, an RCT targeting the parents of young children in the UK where
dental health is poor. The programme consisted of a home visits dental health
advice (addressing diet and toothbrushing) plus provision of a toothbrush and low
fluoride toothpaste provided by a health visitor at age 8 and 20 months of age.
Shute and Judge, 2005, a cohort study in the UK aimed at families of six month old
children in disadvantaged areas of Glasgow. The programme consisted of a home
visit delivered by Start Well health visitors.
Yuan et al. 2007, a non-randomised controlled trial in the UK, aimed at mothers of
children aged 0 to 2 years in deprived areas of Belfast with low dental registration
rates. Dental health education, feeding cups, toothbrushes, fluoride toothpaste and
registration vouchers were provided by community based nurses during three
routine health visits over two years.
Cruz et al. 2012, an RCT in the USA of families of low income children aged 1 to 2
years who are eligible for benefits. The programme consisted of six postcard
reminders over 1 year regarding eligibility for comprehensive dental benefits.
Plutzer and Spencer, 2007, an Australian RCT. The programme consisted of 3
rounds of printed guidance on oral health, oral hygiene and nutrition provided to first
time mothers prenatally and over the first year of their child’s life. Finger
toothbrushes for children and toothbrush for mothers were included with the second
and third rounds.
Ellwood et al. 2004, an RCT set in the UK of parents of children aged 1 to 5.5
years in areas with high levels of caries. This was a programme involving health
education literature, free fluoridated toothpaste every three months (440 or
1450ppm) and a toothbrush every year provided via post for 4.5 years.
Of the four studies in the UK setting, two studies (Shute 2005, Yuan 2007) reported
intermediate outcomes around the rates of dental registration, which cannot be used to
estimate the clinical impact of the programme.
Whittle 2008, a programme around home visits, reported mean dmfs for children in the
programme and children who received normal care provided by health visitors in the area
(which included advice about registering with a dentist; avoiding sugary drinks, sweets and
medicine; and tooth brushing). This study was assessed as being of a good quality by
Bazian ([+]). Mean dmfs was reported at age 3 (2.03 vs 2.19) and at age 5 (3.99 vs 4.84).
Page 48
Section 3 43
Age 5 outcomes for children in the intervention group were also compared to results from a
standard dental census at all area schools among five year old children (dmfs: 5.94). The
ratio of the mean dmfs at age 5 was used to approximate the relative risk of decay, and was
estimated to be 0.67 i.e. the RRR was 33%.
Ellwood 2004, a postal programme, was also was assessed as being of a good quality by
Bazian ([+]). This study demonstrated that the intervention reduced the mean caries in the
least deprived group (mean dmfs: 1.4 (SD 2.5) vs. 1.9 (SD 2.9)), with no effect in the most
deprived areas. The relative risk in the least deprived group can be estimated by calculating
the ratio of the programme dmfs and the comparator dmfs post-programme, and is
approximately 0.74 (equivalent to a RRR of around 26%).
Table 3.2: Summary of evidence for infants and pre-school children
Intervention
Study Evidence and estimated
RR of decay
Relative risk
reduction
(RRR)
Fluoridated milk Stecksen-Blicks 2009 Prevented fraction of 75%
for decay
25%
Supervised brushing MacPherson 2013 Ratio in mean d3mft before
and after the programme:
0.68
32%
Oral health education Tubert-Jeannin 2012 Ratio in mean d3mft
change before and after
the programme: 0.63
37%
Community oral health promotion
Blair 2005 Odds ratio for tooth decay
of 0.66
34%
Community oral health education
Whittle 2008
Ellwood 2004
Ratio of mean dmfs
between intervention
group and control: 0.67
Ratio of mean dmfs
between intervention
group and control: 0.74
33% and 26%
3.3 EVIDENCE FOR PROGRAMMES IN SCHOOL-AGED CHILDREN
3.3.1 Fluoride varnish
Moderate evidence suggests that school based fluoride varnish programmes can be
effective at preventing or reducing enamel caries amongst children in deprived or at risk
communities, but are less effective amongst children in non-deprived or low risk areas.
Four studies were identified for this intervention:
Moberg et al. 2005a, an RCT in a population of students in Sweden aged 13 to 16
years. Fluoride varnish was applied by dental nurses and dental hygienists to the
Page 49
Section 3 44
approximal surfaces of teeth during the school year for three years according to 3
schedules: twice yearly, 3 times per year, and 8 times per year.
Splieth et al. 2011, a cRCT in a population of students in Germany aged 6 to 8
years. Fluoride varnish was applied twice a year by a dental hygienist.
Hardman et al. 2007, a cRCT in a population of students in the UK aged 6-7 (year
2) or 7-8 (year 3) attending eligible state primary schools in relatively deprived
communities. Fluoride varnish was applied twice a year by dental therapists to the
primary and first permanent molars.
Dohnke-Hohrmann, 2004, a study of primary school children in a multicultural
under-privileged area in Germany. Fluoride varnish was applied twice a year, and
the outcomes assessed after four years.
Moberg 2005a was assessed to have the highest quality ([++]) evidence by Bazian, with the
study fulfilling all or most of the NICE checklist criteria. Biannual application was considered
to be the most appropriate intervention to include in this analysis. The study reported the
prevented fraction in incident caries across the general student population, which was
estimated as being 57%. This can be used to approximate the RRR of decay of 43%.
Hardman 2007 has the most relevant setting and provides an alternative good-quality (as
reported by Bazian) source of data. The study demonstrated that the fluoride programme
was no more effective than provision of a toothbrush and fluoride toothpaste at reducing
mean advanced caries increment (mean d3fs increment difference: 0.01 (SE 0.18); mean
d2fs increment difference: 0.28 (SE 0.20)). However it was not possible to estimate a
relative risk of decay from this data given that the absolute difference in decay increment
was reported rather than the proportional difference.
3.3.2 Fluoridated milk
Inconsistent evidence regarding the association between school-based fluoride milk
schemes and dental caries was identified from one cohort study and one cross-sectional
study.
Two studies were identified for this intervention:
Ketley et al. 2003, a cohort study in the UK in a population of children aged 7 to 9
in areas of deprivation. Milk containing 0.5mg F/189ml (2.65ppm) was provided five
days per week for four years.
Riley et al. 2005, a cross sectional study of UK children aged 12 in an area of
considerable deprivation. Milk containing 0.5mg F/189ml; (2.65ppm) was provided
for up to 7 years. The frequency was not reported.
Riley 2005 was assessed as having the highest quality evidence by Bazian ([++]), and was
considered as relevant to the economic analysis by the EAC given that is was conducted in
the UK. The programme was associated with a significant reduction of caries of the first
permanent molars in the group receiving fluoridated milk for seven years. The study
reported the adjusted odds ratio for the increase in likelihood of the comparator group of
Page 50
Section 3 45
caries (OR: 1.71). This is equivalent to an odds ratio of 0.58 for the reduction in the risk of
caries due to the programme and RRR of 32%.
Ketley 2003 also provided a good source of data (the quality was assessed as [+] by
Bazian), and was also set in the UK. This study reported the mean difference in dmft
increment over four years (0.40 at the tooth level and 0.38 at the surface level in primary
dentition, 0.00 in the permanent molars). However it was not possible to estimate a relative
risk of decay from this data given that the absolute difference in decay increment was
reported rather than the proportional difference.
In addition to the evidence described above, a recent Cochrane review of fluoridated milk
(2005) found two RCTs, one of which presented evidence for primary school children. The
results in the trial of primary school children were not found to be significant. The review
suggests that there is insufficient evidence to include milk as a vehicle for the delivery of
fluoride to vulnerable children.
3.3.3 Fluoride mouth rinse
Moderate evidence suggests that school based fluoride mouth rinse programmes can be
effective at preventing or reducing dental decay of the permanent dentition amongst school
aged children living in communities with no exposure to fluoridated water.
Five studies were identified for this intervention:
Moberg et al. 2005b, an RCT in Sweden in a population of students aged 13-16.
The programme involved a dental nurse-supervised fluoride mouth rinse
programme delivered for three years.
Kaneko et al. 2006, a cohort study in Japan of primary school students. The
programme involved a teacher-supervised, daily rinsing with 500ppm NaF at age 5-
6, and teacher-supervised weekly rinsing with 2,000ppm NaF from age 7 to 9-10.
The programme lasted for 4 to 6 years.
Neko-Uwagawa et al. 2011, a cross-sectional study in Japan. The programme
involved a teacher-supervised daily rinsing with 500ppm NaF from age 4 to 5, and
then weekly with 2,000ppm NaF from age 6 to 14. Outcomes were reported when
the participating students were aged 20 to 40.
Levin et al. 2009, a cross-sectional UK study of children aged 6 to 11 years in
schools with high caries prevalence. The programme involved a fortnightly rinse for
2 minutes with 0.2% NaF solution at school under supervision.
Komiyama et al. 2012, a cross-sectional study in Japan of students attending
primary schools. The programme involved weekly one minute fluoride mouth rinse
with 900ppm NaF, for six years.
Levin 2009 was considered to be the most appropriate study by the EAC to estimate the
impact of a fluoride mouth rinse programme. This study was based in the UK, and included
a large number of participants (n=1,333). Bazian also assessed the study as contained
good quality evidence ([+]). The different outcomes reported by the study were somewhat
Page 51
Section 3 46
conflicting. Across the general population of 11 year olds, there was no significant difference
in mean tooth decay between rinsers and non-rinsers. When stratified by deprivation
category, only rinsers in the least deprived categories were significantly more likely to be
caries free compared to their non-rinsing peers. This may be due to reduced uptake of the
FMR programme across Deprivation Categories. The study also reported that the
programme was associated with significantly reduced likelihood of tooth decay, with the
odds ratio of the likelihood of tooth decay (D3MFT>0) estimated as 0.79. As such, the RRR
is approximately 21%.
3.3.4 Supervised toothbrushing
There is moderate evidence from three cluster RCTs to suggest that daily, school based,
teacher supervised tooth brushing with 1,000 to 1,450ppm fluoride toothpaste may reduce
dental decay among primary school children, and weak evidence from one cluster RCT to
suggest that such programes may improve oral hygiene in the short but not long term.
Four studies were identified for this intervention:
Jackson et al. 2005, an RCT in a population of children in their first year of primary
school in a deprived area in England. The programme consisted of teacher
supervised daily toothbrushing (with1,450 ppm F toothpaste).
Pine et al. 2007, an RCT in a population of children in their first year of primary
school in a relatively deprived area in England. The programme consisted of 30
months of daily supervised tooth brushing programme with 1,000ppm fluoridated
toothpaste. A toothbrush, toothpaste and a brushing chart to track twice daily
brushing at home during holidays were also provided.
Burnett et al. 2004, an RCT in a population of children attending primary school in
Australia. The programme consisted of a teacher-supervised daily tooth brushing
programme using low dose fluoride toothpaste for three years.
Wind et al. 2005, a RCT in a population of children between the ages of 7 and 10
years attending elementary schools in The Netherlands. The programme consisted
of daily school based supervised tooth brushing for three-years. The use of
fluoridated toothpaste was not reported.
Two of the above studies were assessed by the EAC as having relevant evidence (in a UK
setting, with a relatively large population), as well as being assessed as being of a good
quality by Bazian ([+]).
Jackson 2005 reported that the programme was effective at reducing incident dental decay.
After adjusting for baseline caries differences, the mean caries increment (dmfs and DMFS)
over 21 months was 10.9% lower in the intervention than the comparator group. This is
approximately equivalent to a relative risk of decay of 0.89, or a RRR of 11%.
Pine 2007 also reported that the supervised toothbrushing programme was effective at
reducing incident dental decay. Compared to children in comparator classes, between
baseline and 84 months follow-up, intervention children had a 30% reduction in enamel
lesions (D1FS) of the first permanent molars. This is approximately equivalent to a relative
Page 52
Section 3 47
risk of decay of 0.70. Among children with caries at baseline, the reduction in more severe
caries (D3FS) was 39%, approximately equivalent to a relative risk of decay of 0.61 or a
RRR of 39%.
3.3.5 Multi-component oral health promotion
There is inconsistent evidence regarding the association between multi-component school
based oral health programmes, which include the provision of preventive services (e.g. pit
and fissure sealants) and dental caries in primary school students.
Three studies were identified for this intervention:
Niederman et al. 2008, a cohort study set in the USA of students attending
elementary schools, with a high proportion of low-income children (86.4%). Dental
hygienists provided preventive services twice per year, which included prophylaxis
and oral hygiene instruction, provision of toothbrushes and fluoride toothpaste,
placement of glass ionomer sealants and temporary restorations in carious teeth,
and fluoride varnish.
Bodner and Pulos, 2010, a large before-and-after study of students attending
elementary schools in the USA. The programme consisted of an oral health exam
by dental hygienists and assistants, followed by preventive treatment, consisting of
fluoride releasing pit and fissure sealants if required.
Axelsson et al. 2006, a before-and-after study of students in primary and
secondary school in Sweden from 1979 to 1993. Dental hygienists or dental
assistants provided oral health education needs-related preventative services in
school clinics.
Bodner 2010 was considered by the EAC to be the most appropriate study for the analysis,
and was considered to produce a more robust estimate of the effect size given the larger
population size. Bazian also reported that this study was of high quality ([++]). The
programme was associated with a low uptake of sealant services, as only 18% of eligible
students received sealants. The effectiveness of this intervention was largely affected by the
uptake of sealants. The overall difference in DMFT was reported to be 3.02% among the
general student population (corresponding for a higher percentage of first molars with decay
in the programme population). Among those who received sealants, the mean difference in
DMFT was reported to be -4.6% (corresponding to a lower percentage of first molars with
decay in the programme population). In this population, the relative risk of decay can be
estimated to be around 0.95 and therefore the RRR to be approximately 5%.
3.3.6 Addressing common risk factors
Inconsistent evidence was identified regarding the effectiveness of school based
programmes that address common risk factors on oral health outcomes.
One study suggested that such programmes may be detrimental to the oral health of primary
school children. A school based programme addressing tobacco use amongst secondary
Page 53
Section 3 48
school children at high risk for poor oral health had no effect of smoking behaviour of
students.
The evidence for this intervention comprised three studies:
Freeman and Oliver, 2009, a cluster non-randomised control trial in UK primary
school. Participants were 9 years old and attended school in Northern Ireland in
various socioeconomic areas. The intervention, Boosting Better Breaks was a
dietary health promotion programme, including school milk, water and fruit during
school breaks; the closing of tuck shops and removal of confectionary, cakes,
biscuits or soft-drinks. Teachers provided rewards or prizes.
Muirhead and Lawrence, 2011, a correlation study on students attending
elementary schools in Canada that were voluntarily participating in the Healthy
Schools programme. The Healthy Schools programme targeted healthy eating,
physical activity, bullying prevention, personal safety, injury prevention, substance
use and misuse, healthy growth and development and mental health activities.
Schools were compared to regional schools that had not participated in the
programme.
Hedman et al. 2010, a cluster non-randomised controlled trial carried out on
students aged between 12 and 15 years considered at high risk of oral diseases in
Sweden. The intervention was a health education programme targeting tobacco
use. A dental hygienist and a dental nurse delivered a 40 minute interactive lecture
at the schools addressing oral health and tobacco use.
Given that each of the studies is concerned with addressing common risk factors, such as
diet and tobacco use, the studies all report intermediate outcomes relating to these
behaviours. Muirhead 2011 reported some conflicting evidence that suggested that a dietary
intervention increased the likelihood of students having more than two decayed teeth (effect
size not reported). As such, none of the studies described above reported any data that
could be used to estimate the impact of the intervention on the levels of decay.
3.3.7 Oral health education in schools
There is moderate evidence to suggest that oral health education programmes may improve
plaque and gingival health, and when combined with fluoride provision, are associated with
reduced tooth decay amongst primary school children.
Five studies were included for this intervention:
Vanobbergen et al. 2004, an RCT involving children attending primary school in
Belgium with low population wide caries levels. Intervention group children and
teachers attended an annual, one-hour oral health education programme which
included information on oral hygiene, use of fluorides, dietary habits and dental
attendance. An annual oral examination was carried out which resulted in a referral
letter outlining oral statue and treatment needs.
Dental Health Foundation, 2007, an RCT carried out in Ireland involving children
in their fourth year of primary school. The intervention was a “Winning Smiles” six
Page 54
Section 3 49
week oral health promotion programme provided by community dental staff and
covering oral health, tooth brushing with fluoride toothpaste. Some school children
were also sent toothbrushes and fluoridated toothpaste.
Pieper et al. 2012, a cross-sectional study on kindergarten and primary school
students in underprivileged areas of Germany. The six year intervention enhanced
oral health education, provided oral hygiene instructions (four times per year) and
applied fluoride varnish (four times per year).
Pieterse et al. 2006, a before and after study in the Netherlands of children aged
six to twelve. The intervention comprised an education packet on oral health,
weekly fluoride mouth rinsing and teeth brushing lessons.
Livny et al. 2008, an Israeli before and after study set of medium-low social
economic status primary school children. A municipal dental health education
programme delivered by a dental hygienist took place, which included provision of a
toothbrush and toothpaste, three weekly education sessions of oral hygiene skills
training and supervised brushing. Health education regarding the use of fluoridated
toothpaste and healthy dietary habits was also provided.
Pieper 2012 and Pieterse 2006 were both assessed as being of good quality of Bazian, and
reported relevant data that could be estimate to estimate the impact of the programme on
dental caries.
Pieper 2012 reported significantly lower average decay in the permanent dentition, with an
average D5MFT of 0.50 in the programme population and 0.77 in the comparator population.
The relative risk has been approximated by calculating the ratio of the programme and
comparator D5MFT (RR: 0.65). This results in a RRR of 35%.
Pieterse 2006 reported a lower mean DMFS amongst 12 year olds (0.5 vs. 2.0). The
programme DMFS is a quarter of that of the comparator group. Estimating the relative risk
by calculating the ratio of the two would result in an estimate of 0.25 (a 75% reduction in the
risk of decay), which is a significantly larger reduction than the estimate produced by the
other two studies considered for this intervention. This reflects the heterogeneity across the
studies (in their populations, the type of programme), and reinforces the key message that
all results should be interpreted with caution.
Vanobbergen 2004 reported data however it was assessed as poor quality by Bazian, and
so the evidence should be interpreted with caution. The study reported a small effect on the
average decay of the permanent dentition, with a pre-programme mean DMFT of 0.92
compared to 1.0 post-programme for the intervention group, and a pre-programme mean
DMFS of 1.46 compared to 1.59 post-programme for the comparator group. The ratio of
change in DMFT was used to approximate the relative risk of decay. This was estimated as
being 0.92 (a RRR of 8% in decay).
The Dental Health Foundation was also assessed as having good quality evidence by
Bazian and is of a relevant setting, however the study only reported outcomes around
brushing and snacking behaviour and salivary fluoride levels, and as such it was not
possible to estimate the programme’s impact on dental caries.
Page 55
Section 3 50
3.3.8 Peer-to-peer education
Weak evidence suggests that peer-to-peer oral health education programmes may be
associated with improved oral health knowledge and oral hygiene behaviours, but is not
associated with changes in dietary behaviours amongst primary school children.
Three studies were included for this intervention:
Freeman and Bunting, 2003, a UK-based RCT including children aged between 5
and 11 years from areas with high social deprivation. The intervention group
participated in a three stage child-to child oral health intervention. This comprised
in stage one a healthy snacking education programme for older children over 4
weeks; in stage two these children designing a healthy snacking educational
programme to be provided to their younger peers and in stage 3 a one hour child-
to-child educational session from the 11 year olds to the 5 years olds.
Reinhardt et al. 2009a, a before and after study undertaken in a German primary
school. Children participated in a peer-to-peer oral health tutoring programme
which involved training fourth graders about dental caries and tooth brushing, and
then supporting them in training first graders.
Reinhardt et al. 2009b, reported on the same before and after study described
above (Reinhardt et al. 2009a).
Each of the studies described above reported outcomes relating to behaviour, such as
snacking levels, brushing technique, and on oral health knowledge. As such, none of the
studies described above reported any data that could be used to estimate the impact of the
intervention on the levels of decay.
3.3.9 Community oral health education
Weak evidence from two before and after studies describing similar programmes suggests
that community centre based oral health promotion and education programmes that include
provision of oral hygiene supplies (e.g. toothbrush and fluoride toothpaste) may be
associated with improvements in plaque scores, gingival health and oral health knowledge.
The two studies identified are relevant for this intervention were:
Biesbrock et al. 2004, a before and after study set in Chicago, USA including
children between 6 and 15 years old. The intervention, “The Crest Cavity Free
Zone Program”, included oral health education programme, provision of a
toothbrush, toothpaste, dental floss and plaque disclosing tablets.
Biesbrock et al. 2003, a before and after study set in Kentucky, USA involving
children aged between 5 and 15 years. The intervention in this study was identical
to the other study included for this intervention.
Page 56
Section 3 51
Each of the studies described above reported outcomes relating to oral health knowledge, or
relating to periodontal disease such as Plaque Index or Gingival Index. As such, none of the
studies described above reported any data that could be used to estimate the impact of the
intervention on the levels of decay.
3.3.10 Home visits to improve dental care access
There is weak evidence from one RCT and one before and after study to suggest that
intensive home visits by care facilitators or coordinators may improve access to or use of
dental services among low income children eligible for government funded dental care.
Two studies were identified for this intervention:
Binkley et al. 2010, a RCT set in Kentucky, USA. Children aged 4 to 15 and
enrolled in Medicaid but had not accessed a dentist through the programme in at
least two years were eligible to participate in a dental care coordinator programme.
Children randomised to the intervention received a home visit to discuss personal
barrier to dental care access, provide information on Medicaid services and provide
pamphlets and oral health products.
Harrison et al. 2003, a before and after study set in Canada on children living in an
urban, low-income neighbourhood. Three community based facilitators sent letters
to parents and attended community events in order to inform families of their role in
facilitating access to publicly funded dental services (the Healthy Kids programme).
The facilitators then assisted families in gaining Healthy Kids funding and provided
advice and assistance in choosing and attending a dentist.
Each of the studies described above reported outcomes relating to dental service utilisation.
As such, none of the studies described above reported any data that could be used to
estimate the impact of the intervention on the levels of decay.
Page 57
Section 3 52
Table 3.3: Summary of evidence for school-aged children
Intervention Study Evidence and estimated
RR of decay
Relative risk
reduction (RRR)
Fluoride varnish Moberg 2005a
Prevented fraction in
incident caries as a result of
intervention: 57%
43%
Fluoridated milk Riley 2005
Odds ratio for reduction in
risk of caries due to
intervention: 0.58
42%
Fluoride mouth rinse Levin 2009 Odds ratio of likelihood of
tooth decay: 0.79 21%
Supervised brushing 1. Jackson 2005
2. Pine 2007
1. Mean caries increment:
10.9%
2. Mean caries increment
(dmfs and DMFS): 0.61
1. 11%
2. 39%
Multi-component promotion
Bodner 2010 Mean difference in DMFT:
0.96 4%
Addressing common risk factors
None None Unknown
Oral health education in schools
1. Pieper 2012
2. Pieterse 2006
3. Vanobbergen
2004
1. Ratio of post-programme
DMFT: 0.65
2. Ratio of post-programme
DMFT: 0.25
3. Ratio of change in DMFT:
0.92
1. 35%
2. 75%
3. 8%
Peer-to-peer education None None Unknown
Community oral health education
None None Unknown
Home visits to improve dental care access
None None Unknown
3.4 EVIDENCE FOR PROGRAMMES IN ADULTS
3.4.1 Workplace oral hygiene
There is weak evidence to suggest that work based oral health education and promotion
programmes may be associated with improved oral health amongst employed adults.
Two studies were identified for this intervention:
Page 58
Section 3 53
Ojima et al. 2003, an RCT of workers at a company in Japan. Employees
randomised to the experimental group received access to a web-based periodontal
health system which stored and displayed personalised oral health records and
gave personalised advice on oral hygiene. The personalised advice was generated
following two visits from a dental hygienist in the work place. The control group
received the dental hygienist visits, but not access to the web-based system;
Morishita et al. 2003, a cross-sectional study of employees from 43 companies in
Japan participating in an oral health promotion programme. This included an
annual clinical examination and dental health education free of charge. The study
analysed those who had attended once, twice, or three times or more, and
compared their oral health outcomes to employees who had not taken part in the
programme.
The impact of oral hygiene programmes were estimated from Morishita 2003. There are
some caveats however: no baseline outcomes were reported, and there appears to be
significant differences between the outcomes for men and women. The relative risk of decay
was crudely approximated by calculating the average DMFT after the programme between
men and women, weighted for programme participation, and calculating the ratio of these
two values. The mean post-programme DMFT for the control group was estimated to be
12.475, compared with the mean post-programme DMFT for the participants group of 12.02.
Thus the relative risk was estimated to be 0.96 (a 4% RRR of decay).
No comparative risk reduction can be estimated from Ojima 2003, as this study primarily
reported the effect of the programme on periodontal outcomes.
3.4.2 Community oral health
Weak evidence suggests that oral health interventions and education programmes may be
effective at improving flossing behaviour, gingival health, dental attendance and knowledge
amongst elderly individuals, but has no impact on tooth decay, brushing habits or plaque
levels in this population.
Three studies were identified for this intervention:
Al-Haboubi et al. 2012: a UK based RCT including community dwelling people
aged 60 years and older who had ≥6 teeth and were not regular chewers of gum.
The intervention group were prescribed and provided with six months’ supply of
chewing gum (100% xylitol) to use twice a day for 15 minutes each time along with
instructions of how and when to use the gum. The control group continued usual
oral hygiene practice.
Marino et al. 2004, a cluster non-randomised controlled trial involving adults over
55 attending community centres in Australia. The intervention group participated in
Oral Health Information Seminars which involved nine fortnightly oral health group-
based seminars; provision of oral care products related to the seminar session and
information sheets to reinforce learning. Control centres did not receive Oral Health
Information Seminars.
Page 59
Section 3 54
Marino et al. 2013, a cluster, non-randomised controlled trial based in Australia.
Elderly people were recruited by social clubs and participants received Oral Health
Information Seminars/Sheets for 16 weeks. This consisted of 10 oral health
seminars, four one-to-one oral hygiene sessions and provision of oral health
products. Comparison group participants received no oral health program.
Al-Haboubi 2012 was assessed as having good quality evidence by Bazian ([+]), and was
also considered by the EAC as having the more relevant setting and reporting the more
relevant outcomes for the economic analysis. The study reported the effect of the
programme on tooth decay levels, as well as clinical outcomes relating to periodontal
disease. The mean DMFS for the intervention (baseline vs follow-up was 85.6 (SD 28.1) vs.
88.7 (SD 26.8), and the mean DMFS for the comparator was 83.8 (SD 24.1) vs. 86.7 (SD
23.3). The ratio of change in DMFS can be used to approximate the relative risk of decay,
which was estimated to be 0.92 (a RRR of 8%).
No comparative risk reduction can be estimated from Marino 2004 and Marino 2013, as
these studies primarily reported the effect of the programme on oral health knowledge and
behaviours (flossing and brushing).
Table 3.4: Summary of evidence for adults
Intervention Study Evidence and estimated
RR of decay
Relative risk
reduction (RRR)
Adults - Workplace oral hygiene education
Morishita 2003
Mean post-programme
DMFT for control and
intervention groups: 0.96
4%
Adults over 65 - Community oral health promotion
Al-Haboubi
2012
Ratio of change in DMFS:
0.92 8%
Page 60
Section 4 55
Section 4: Discussion and Conclusions
4.1 SUMMARY
The primary research questions for the cost-effectiveness modelling described in this report
were:
Question 1: Which community-based programmes and interventions to promote, improve,
and maintain the oral health of a local community are cost effective?
Question 2: Which methods and settings to deliver community-based programmes for
disadvantaged populations at high risk of poor oral health are cost effective?
The 17 community based programmes and interventions included within the model were
identified through a review undertaken by Bazian, using an approach taking a whole
population perspective over a life course, with a focus on vulnerable groups. Therefore, the
modelling approach focused upon answering the first of the questions listed above only,
rather than focusing on each specific vulnerable group described in Section 1.1.
It was originally intended that a decision analytic model calculating ICERs to make
comparisons between the 17 interventions would be built. This approach required that the
costs and benefits of each of the interventions were quantified and health outcomes
expressed as QALYs. The original model was built, however it became apparent that the
paucity of data required to inform inputs into the model was so great that expressing the
results of the model in a single ICER value would be of limited value. The uncertainty that
existed around the results made their purpose in informing PHAC recommendations very
limited.
Consequently, two alternative analyses were developed which were based on a simpler
model which utilised five key parameters. The first approach (Analysis I) evaluated four
specific interventions in the pre-school or school populations, and it was attempted to more
precisely estimate the likely values for each of the parameters. The second analysis
(Analysis II) was developed to allow ranges of inputs to be used and as such a likely range
of results to be explored. These analyses were undertaken in order to provide the PHAC
with a tool to aid their decisions around the cost-effectiveness of specific interventions.
Multiple values of each of the five model input parameters were incorporated given the
uncertainty around their values. The input calculator model described in Appendix A was
utilised to help determine reasonable ranges for each of the inputs.
All five parameters and their values or ranges in each of the analyses are now discussed.
Page 61
Section 4 56
Intervention costs were very rarely reported in any of the oral health studies
identified by Bazian and on occasion when costs were reported, interventions were
very specific and based outside of England and Wales meaning the costs are
unlikely to be relevant to a current NHS setting. As such, the maximum cost for the
intervention to be considered cost-effective (for a given range of input variables)
was estimated in Analysis I, and a range of intervention costs, from £20 to £100 per
person were considered in Analysis II.
Baseline risk of dental caries in Analysis I were estimated from a dataset
provided by the Dental Public Health Intelligence Programme, using the most
deprived quintile (by IMD) to represent a high-risk population. The baseline risk of
dental caries in the pre-school group was estimated to be 39.6%, and 42.4% for 12
year olds. For Analysis II, the baseline risk for each age group was approximated
using the number of decayed teeth over the course of a lifetime reported in The
Adult Dental Health Survey, 2009. The risk of developing caries in the infant
population was estimated to be 10%, in the child population 20% and in the adult
population 50%.
Relative risk reduction of dental caries for each of the interventions compared to
no intervention was calculated approximately where possible from information
provided within the published studies. The studies were heterogeneous in terms of
patient population, reported outcomes, settings, meaning it was only plausible to
attempt to compare each intervention to no intervention, rather than making
between intervention comparisons. The estimated RRR are reported in detail in
Section 3. Four interventions of interest were selected for Analysis I, and all
interventions were included in Analysis II.
QALY loss from each case of dental caries could not be identified from any
published literature. Analysis I used estimates from otitis media as proxies for poor
oral health. In analysis II, a published regression analysis (Brennan and Spencer,
2006) mapping OHIP-14 response to utility was utilised. There were limitations with
this analysis (as described in Appendix C). Losses of -0.025, -0.05 and -0.1 were
considered in the analyses.
Cost of treating each case of dental caries aims to capture the lifetime cost of a
restoration. In a small number of patient groups (e.g. children), dental extraction
may require general anaesthetic and an inpatient hospital stay costing around
£1,146 (PSSRU, 2012). In the interventions in pre-school children in Analysis I, it is
assumed that all children experience extractions under general anaesthetic. In
Analysis II, a range of costs (£75-£125) representing the average cost of dental
caries per patient were considered, which reflects the variation in costs depending
on the treatment pathway that a patient takes. If a patient visits the dentist regularly
and the caries is identified and treated early, the cost of treatment is likely to be low
with the patient often covering most of the cost. If, however, the caries is left more
extensive treatment may be required.
The results of Analysis I and Analysis II are summarised in the following summary
statements. The summary statements relating to Analysis II provide an overview of the likely
cost-effectiveness at given baseline risk of dental caries and RRR of the intervention in
Page 62
Section 4 57
question. It is important to reiterate that, due to the lack of robust data available to inform
baseline risk of dental caries, RRR of intervention as well as other model inputs, the reader
is urged to use their own judgement as to where a specific intervention in a specific
subgroup of the population would fit. Interpretation of these results should be treated with
caution.
Summary statement 1: Cost-effectiveness of interventions in populations with high
baseline risk of dental caries (50%)
A. In high risk populations, interventions with a RRR of 30% or greater (compared with
no intervention), are likely to be cost-effective at a threshold of £20,000 per QALY
over the range of intervention costs explored in the analysis.
B. In high risk populations, interventions with RRR of less than 10% compared with no
intervention are unlikely to be cost-effective over the range of intervention costs
explored in the analysis.
C. In high risk populations, interventions with RRR of between 10% and 30% compared
with no intervention are likely to be cost-effective if the average QALY impact of the
dental caries is greater than -0.05 in this population.
Summary statement 2: Cost-effectiveness of interventions in populations with
medium baseline risk of dental caries (20%)
A. In medium risk populations, interventions with a RRR of 75% or greater (compared
with no intervention), are likely to be cost-effective at a threshold of £20,000 per
QALY over the range of intervention costs explored in the analysis and the QALY
loss associated with dental caries.
B. In medium risk populations where the QALY loss associated with dental caries is -
0.05 or greater, interventions with a RRR of 50% or greater are likely to be cost-
effective over the range of intervention costs explored in the analysis.
C. In medium risk populations where the QALY loss associated with dental caries is -0.1
or greater, interventions with a RRR of 25% or greater are likely to be cost-effective
over the range of intervention costs explored in the analysis.
D. In medium risk populations, interventions with RRR of less than 20% compared with
no intervention are unlikely to be cost-effective over the range of intervention costs
explored in the analysis.
Summary statement 3: Cost-effectiveness of interventions in populations with low
baseline risk of dental caries (10%)
A. In low risk populations where QALY losses are -0.025 or below for dental caries,
interventions that cost more than £60 per patient are unlikely to be cost-effective for
any RRR at a £20,000 per QALY threshold.
B. In low risk populations where the QALY loss associated with dental caries is -0.1 or
higher, interventions with a RRR (compared with no intervention) of 40% or higher,
are likely to be cost-effective over the range of intervention costs in the analysis.
C. In low risk populations, the cost of the intervention is a key driver. Interventions
costing £20 per person or below are likely to be cost-effective provided their RRR is
30% or higher.
Page 63
Section 4 58
D. In low risk populations, interventions costing £80 per person or higher are likely to be
cost effective if they have a RRR of 50% or higher (compared with no intervention)
and the QALY loss of is -0.1 or higher.
Summary statement 4: Cost-effectiveness of supervised tooth brushing and fluoride
varnish programmes in a deprived population of pre-school children
A. Where the QALY loss associated with dental caries is low (0.002), supervised
toothbrushing programmes are likely to be cost-effective if the total cost of the
intervention per child does not exceed £34.
B. Fluoride varnish programmes are likely to be cost-effective if the total cost of the
intervention per child does not exceed £45, when the QALY loss associated with
dental caries is low (0.002).
C. Where the QALY loss associated with dental caries is high (0.007), supervised
toothbrushing programmes are likely to be cost-effective if the total cost of the
intervention per child does not exceed £46.
D. Fluoride varnish programmes are likely to be cost-effective if the total cost of the
intervention per child does not exceed £62, when the QALY loss associated with
dental caries is high (0.007).
Summary statement 5: Cost-effectiveness of supervised tooth brushing and fluoride
varnish programmes in a deprived population of school children
A. Where the QALY loss associated with dental caries is low (0.002), fluoride varnish
programmes are likely to be cost-effective if the total cost of the intervention per child
does not exceed £62, if 50% of extractions are under GA, or £71 if 80% of
extractions are under GA.
B. Supervised tooth brushing programmes that reduce caries by 11% are likely to be
cost-effective if the total cost of the intervention per child does not exceed £16 and
50% of extractions are under GA. When the RRR increases to 39%, the maximum
cost of the intervention is £56 per child. When 80% of extractions are under GA, the
maximum cost for an intervention that reduces the risk of caries by 11% is £18 per
child, and £64 for an intervention that is 39% effective.
C. Where the QALY loss associated with dental caries is high (0.007), fluoride varnish
programmes are likely to be cost-effective if the total cost of the intervention per child
does not exceed £80 if 50% of extractions are under GA or £89 if 80% of extractions
are under GA.
D. Supervised tooth brushing programmes that reduce caries by 11% are likely to be
cost-effective if the total cost of the intervention per child does not exceed £21 and
50% of extractions are under GA. When the RRR increases to 39%, the maximum
cost of the intervention is £73 per child. When 80% of extractions are under GA, the
maximum cost for an intervention that reduces the risk of caries by 11% is £23 per
child, and £81 for an intervention that reduces the risk of caries y 39%.
Page 64
Section 4 59
4.2 RESEARCH RECOMMENDATIONS
A number of limitations were identified with the economic analysis, which may be overcome
through further research. Each of these limitations and subsequent research
recommendations are described below:
Gaps in effectiveness evidence. There exists limited evidence on the effectiveness
of interventions to improve oral health set in England and the existing evidence is
extremely heterogeneous. Future studies should include head to head
comparisons between interventions. Retrospective cohort studies providing
evidence on the prevention of diseases such as oral cancer and periodontal
disease would also be beneficial. If such studies could provide information on
costs, or resource use, this too would be of benefit to cost-effectiveness analyses.
Lack of utility data. Existing studies have failed to report utility data on oral health.
Studies including patient reported outcome measures through established, non-
disease specific tools such as EQ-5D are merited. Such data would allow QALYs
to be calculated and in turn, comparisons between diseases to be made to assist in
NHS resource use decisions.
Treatment pathway of dental caries. Although, a recognised treatment pathway for
dental caries exists, it assumes patients make regular visits to their dentist and
therefore may represent an atypical patient. If a more typical treatment, or impact,
pathway could be established, calculations such as those for the cost of dental
caries may be made with more certainty.
Gaps in intervention cost evidence. The availability evidence around the cost or
resource use involved in oral health intervention is low. Reporting of the cost of
interventions, or at least the resources utilised during interventions would assist in
future cost-effectiveness analysis.
Table 4.1: Data gaps for modelling
# Research recommendation
1 Existing evidence is very heterogeneous, and the head-to-head evidence of different oral health
programmes is very limited. In addition, few studies report the long-term clinical outcomes in
the years after the programme. In particular, it would be useful to explore the impact of
programmes in children with primary teeth and how it impacts on the level of decay in their
permanent teeth in the future.
2 Many intermediate outcomes such as oral health knowledge (e.g. knowledge for tooth brushing
and flossing, awareness of oral health outcomes) and behavioural outcomes (e.g. brushing
frequency, snacking levels, smoking) are collected in studies of oral health interventions.
However the relationship between these and the clinical outcomes such as levels of decay and
periodontal disease needs to be explored and quantified in order for the outcomes to provide any
meaningful indication of how the intervention impacts on the patients’ health.
3 Programme costs should be collected during the study. This should be detailed as appropriate,
i.e. with costs specified for the number of patients, and for intervention cost types (staffing,
materials). The targeted number and the proportion eligible with consent for the programme
should also be collected.
Page 65
Section 4 60
4 Quality of life should be evaluated as measured by a generic instrument (e.g. EQ-5D) for
different oral health states, including missing teeth, decayed and painful teeth, and restored teeth.
For each of these health states, the accumulative effect (e.g. the disutility of one missing tooth
compared with the disutility of three missing teeth etc.) and how this varies by tooth location
should also be evaluated. Given that the majority of programmes are in school-aged children,
quality of life should be evaluated in child as well as adult populations.
5 While the “typical” treatment pathway for dental caries has been well described, there is little
data to suggest exactly how some patients (e.g. from different socioeconomic backgrounds) may
deviate from this pathway. Instead of assuming that all decayed teeth receive prompt and
appropriate treatment, it would be useful to know the rate at which this occurs and the proportion
of teeth that are left untreated until it is required that they are extracted (with the remainder of
teeth having delayed restorative treatment). Additionally, some restored teeth will experience
further decay, where a proportion will require further restorative work and some will be extracted.
The rate at which each of these occur will also be required for a robust analysis of the pathway.
6 There is some evidence to suggest that a significant number of children receive a general
anaesthetic for a tooth extraction (Moles 2008). Further evidence on the annual rate of
extractions under general anaesthetic, stratified by age group or year, would be required to model
this robustly.
7 The impact of interventions on oral cancer may not be appropriate to evaluate in short-term
studies, but this evidence could be collected from patient databases which contain observational
long-term evidence.
8 There is currently little evidence to be able to model periodontal disease adequately. The
impact of periodontal disease on quality of life using a general instrument (EQ-5D) is currently not
known – a research recommendation may be to collect and evaluate general utility scores within
a study, or conduct analyses of how measures of periodontal disease (Plaque Index, Gingival
Index) are related to quality of life, for example using a regression analysis.
9 There is little epidemiological information about the progression of periodontal disease or
longitudinal data for a UK or similar population over a sufficient period. The end-state of
periodontal disease is a missing tooth: while data exists for the rate of missing teeth in general, it
is not known how this relates to the periodontal status of the patient.
4.3 CONCLUSION
Due to the data limitations described in previous sections, providing an exact ICER figure for
interventions designed to promote, improve and maintain oral health was not considered to
be appropriate. Therefore, two alternative analyses have been developed. One analysis
examines the impact of four interventions in a deprived population of pre-school and school
children. In addition, an analysis which utilises ranges of results has been provided as a tool
to assist the PHAC in providing recommendations for the range of interventions in the
guidance. The PHAC is urged to use their expertise, professional experience and
judgement alongside this report to ascertain realistic model inputs and, therefore, the
likelihood of cost-effectiveness of a given intervention. As further data becomes available
and model inputs can be established with more certainty, this report may provide more
definitive answers around the cost-effectiveness of oral health interventions.
R:\Projects\JAC\JAC155 - MTEP RX058 Oral Health\Reports\Technical Report\Oral Health Tech Report MASTER 19 Feb.Docx
AF/17.02.14
Page 66
References 61
References
1. Al-Haboubi M, Zoitopoulos L, Beighton D et al. The potential benefits of sugar-free
chewing gum on the oral health and quality of life of older people living in the
community: a randomized controlled trial. Community Dent Oral Epidemiol.
2012;40(5):415-24.
2. Ashley PF, Williams CECS, Moles DR, Parry J. Sedation versus general
anaesthesia for provision of dental treatment in under 18 year olds. Cochrane
Database of Systematic Reviews 2012, Issue 11.
3. Axelsson P. The effect of a needs-related caries preventive program in children
and young adults - results after 20 years. BMC oral health. 2006;6:Suppl.
4. Bazian Ltd. Oral Health: local authority oral health improvement strategies.
Evidence review 1: review of evidence of the effectiveness of community-based oral
health improvement programmes and interventions. London: National Institute for
Health and Care Excellence: Centre for Public Health; 2014. Available
from: http://www.nice.org.uk/guidance/gid-phg61/resources/review-1-review-of-
evidence-of-the-effectiveness-of-communitybased-oral-health-improvement-
programmes-and-interventions.-main-report2
5. Biesbrock AR, Walters PA, Bartizek RD. Initial impact of a national dental
education program on the oral health and dental knowledge of children. J Contemp
Dent Pract. 2003;4(2):1-10.
6. Biesbrock AR, Walters PA, Bartizek RD. Short-term impact of a national dental
education program on children's oral health and knowledge. J Clin Dent.
2004;15(4):93-7.
7. Binkley CJ, Garrett B, Johnson KW. Increasing dental care utilization by Medicaid-
eligible children: a dental care coordinator intervention. J Public Health Dent.
2010;70(1):76-84.
8. Blair Y, Macpherson L, McCall D et al. Dental health of 5-year-olds following
community based oral health promotion in Glasgow, UK. Int J Paediatr Dent.
2006;16(6):388-98.
9. Blair Y, Macpherson LMD, McCall DR et al. Glasgow nursery-based caries
experience, before and after a community development-based oral health
programme's implementation. Community Dent Health. 2004;21(4):291-8.
10. Bodner S, Pulos L. Evaluation of a school based oral health program. Tacoma
(WA): Tacoma-Pierce County Health Department; 2010. Available from:
http://www.tpchd.org/files/library/758841c32b2ec30b.pdf.
Page 67
References 62
11. Brennan DS and Spencer AJ. Mapping oral health related quality of life to generic
health state values. BMC Health Services Research, 2006; 6:96
12. Burke F, Lucarotti P, Holder R. Outcome of direct restorations placed within the
general dental services in England and Wales (Part 2): Variation by patients’
characteristics. Journal of Dentistry 2005; 33, 817–826.
13. Burnett M, Malone C, O'Conner M et al. Toothbrushing in primary schools.
Adelaide (South Australia): The University of Adelaide; 2005. Available from:
http://www.adelaide.edu.au/oral-health-promotion/programs/Qld/TIPS.pdf.
14. Cancer research UK. Oral cancer incidence statistics; 2013. Available from:
http://www.cancerresearchuk.org/cancer-info/cancerstats/types/oral/incidence/#By2
15. Chestnutt I. Commentary on reviews of potential relevance to the development of
NICE public health guidance on “Oral health: local authority strategies to improve
oral health, particularly among vulnerable groups”. Oral Health Improvement: Local
Authorities Supplementary Report. National Institute for Health and Care
Excellence: Centre for Public Health. December 2013.
16. Coco AS. Cost-effectiveness analysis of treatment options for acute otitis media.
Ann Fam Med. 2007 Jan-Feb;5(1):29-28.
17. Coffin D, Craig J, Arber M et al. Literature Review of Economic Evaluations on Oral
Health Improvement Programmes and Interventions. York and Newcastle External
Assessment Centre, 2013.
18. Communities and Local Government. The English Indices of Deprivation 2010.
Available from: https://www.gov.uk/government/publications/english-indices-of-
deprivation-2010
19. Cruz AD, Mueller G, Milgrom P et al. A community based randomized trial of
postcard mailings to increase dental utilization among low-income children. J Dent
Child (Chic). 2012;79(3):154-8.
20. Dakin H, Petrou S, Haggard M et al. Mapping analyses to estimate health utilities
based on responses to the OM8-30 otitis media questionnaire. Qual Life Res (2010)
19:65-80.
21. Dental Health Foundation. Winning smiles: schools oral health promotion
programme for 7 to 8-year-olds: report. Dublin: Dental Health Foundation, Ireland
[in association with others]; 2007. Available from:
http://www.dentalhealth.ie/download/pdf/winning_smiles_report06.pdf.
22. Dohnke-Hohrmann S, Zimmer S. Change in caries prevalence after implementation
of a fluoride varnish program. J Public Health Dent. 2004;64(2):96-100.
Page 68
References 63
23. Dolan P, Gudex C, King P et al. A social tariff for EuroQol: results from a UK
general population survey. Discussion Paper 138. University of York, Centre for
Health Economics; York: 1995.
24. Downer, M.C., Jullien, J.A. and Speight, P.M. (1997): An interim determination of
health gain from oral cancer and precancer screening: 1. Obtaining health state
utilities. Community Dental Health 14, 739-142
25. Elderton RJ. Preventive (Evidence-Based) Approach to Quality General Dental
Care. Med Princ Pract 2003;12(suppl 1):12–21.
26. Ellwood RP, Davies GM, Worthington HV et al. Relationship between area
deprivation and the anticaries benefit of an oral health programme providing free
fluoride toothpaste to young children. Community Dent Oral Epidemiol.
2004;32(3):159-65.
27. Fleurence RL and Hollenbeak CS. Rates and Probabilities in Economic Modelling.
Pharmacoeconomics. 2007; 25(1): 3-6.
28. Freeman R, Bunting G. A child-to-child approach to promoting healthier snacking in
primary school children: a randomised trial in Northern Ireland. Health Education.
2003;103(1):17-27.
29. Freeman R, Oliver M. Do school break-time policies influence child dental health
and snacking behaviours? An evaluation of a primary school programme. Br Dent
J. 2009;206(12):619-25.
30. Fuller E, Steele J, Watt R et al. Oral health and function – a report from the Adult
Dental Health Survey 2009. The Health and Social Care Information Centre; 2011.
Available from: http://www.hscic.gov.uk/pubs/dentalsurveyfullreport09
31. Fyffe HE and Kay EJ. Assessment of dental health state utilities. Community
dentistry and oral epidemiology. 1992; 20(5).
32. Grant JS, Kotch JB, Quinonez RB et al. Evaluation of knowledge, attitudes, and
self-reported behaviors among 3-5 year old school children using an oral health and
nutrition intervention. J Clin Pediatr Dent. 2010;35(1):59-64.
33. Hardman MC, Davies GM, Duxbury JT et al. A cluster randomised controlled trial to
evaluate the effectiveness of fluoride varnish as a public health measure to reduce
caries in children. Caries Res. 2007;41(5):371-6.
34. Harrison RL, Li J, Pearce K et al. The Community Dental Facilitator Project:
reducing barriers to dental care. J Public Health Dent. 2003;63(2):126-8.
35. Health and Social Care Information Centre. NHS Dental Statistics for England:
2011-12. 2012. Available from: http://www.hscic.gov.uk/catalogue/PUB07163
Page 69
References 64
36. Hedman E, Riis U, Gabre P. The impact of behavioural interventions on young
people's attitudes toward tobacco use. Oral Health Prev Dent. 2010;8(1):23-32.
37. Jackson RJ, Newman HN, Smart GJ et al. The effects of a supervised
toothbrushing programme on the caries increment of primary school children,
initially aged 5-6 years. Caries Res. 2005;39(2):108-15.
38. Kaneko N, Yoshihara A, Ida H et al. Influence of a fluoride mouthrinse on mutans
streptococci in schoolchildren. Caries Res. 2006;40(6):501-7.
39. Ketley CE, West JL, Lennon MA. The use of school milk as a vehicle for fluoride in
Knowsley, UK: an evaluation of effectiveness. Community Dent Health.
2003;20(2):83-8.
40. Komiyama E, Kimoto K, Arakawa H. Relationship between duration of fluoride
exposure in school based fluoride mouthrinsing and effects on prevention and
control of dental caries. ISRN Dent. 2012;2012:183272.
41. Levin KA, Jones CM, Wight C et al. Fluoride rinsing and dental health inequalities in
11-year-old children: an evaluation of a supervised school based fluoride rinsing
programme in Edinburgh. Community Dent Oral Epidemiol. 2009;37(1):19-26.
42. Livny A, Vered Y, Slouk L et al. Oral health promotion for schoolchildren -
evaluation of a pragmatic approach with emphasis on improving brushing skills.
BMC oral health. 2008;8:4.
43. Macpherson LM, Anopa Y, Conway DI et al. National supervised toothbrushing
program and dental decay in Scotland. J Dent Res. 2013;92(2):109-13.
44. Marino R, Calache H, Morgan M. A community based culturally competent oral
health promotion for migrant older adults living in Melbourne, Australia. J Am
Geriatr Soc. 2013;61(2):270-5.
45. Marino R, Calache H, Wright C et al. Oral health promotion programme for older
migrant adults. Gerodontology. 2004;21(4):216-25.
46. Milgrom P, Sutherland M, Shirtcliff RM et al. Children's tooth decay in a public
health program to encourage low-income pregnant women to utilize dental care.
BMC public health. 2010;10:76.
47. Moberg SU, Petersson LG, Lith A et al. Effect of school based fluoride varnish
programmes on approximal caries in adolescents from different caries risk areas.
Caries Res. 2005a;39(4):273-9.
48. Moberg SU, Birkhed D, Borg E et al. Approximal caries development in adolescents
with low to moderate caries risk after different 3-year school based supervised
fluoride mouth rinsing programmes. Caries Res. 2005b;39(6):529-35.
Page 70
References 65
49. Moles DR, Ashley P. Hospital admissions for dental care in children: England 1997-
2006. British Dental Journal. 2009; 206: E14.
50. Morishita M, Sakemi M, Tsutsumi M et al. Effectiveness of an oral health promotion
programme at the workplace. J Oral Rehabil. 2003;30(4):414-7.
51. Muirhead VE, Lawrence HP. Exploring school oral health outcomes and
neighbourhood factors in schools participating in Ontario's "Healthy Schools"
recognition program. Can J Public Health. 2011;102(1):30-4.
52. Nassani MZ and Kay EJ. Tooth loss – an assessment of dental health state utility
values. Community Dent Oral Epidemiol. 2011; 39: 53–60
53. National Institute for Health and Clinical Excellence (2005). CPHE Public Health
Guidance – Methods Manual. London: National Institute for Health and Clinical
Excellence. Available from: www.nice.org.uk
54. Needleman I, Mcgrath C, Floyd P et al. Impact of oral health on the life quality of
periodontal patients. J Clin Periodontol. 2004; 31: 454–457
55. Neko-Uwagawa Y, Yoshihara A, Miyazaki H. Long-term caries preventive effects of
a school based fluoride mouth rinse program in adulthood. Open Dent J.
2011;5:24-8.
56. NHS Choices. NHS Dental Services: NHS Dental Charges. 2011. Available from:
http://www.nhs.uk/NHSEngland/AboutNHSservices/dentists/Pages/nhs-dental-
charges.aspx
57. NHS: The information centre. Adult Dental Health Survey 2009. 2011. Available
from: https://catalogue.ic.nhs.uk/publications/primary-care/dentistry/adul-dent-heal-
surv-firs-rele-2009/adul-dent-heal-surv-firs-rele-2009-rep.pdf
58. NICE. Methods for the development of NICE public health guidance (third edition).
London: National Institute for Health and Care Excellence; 2012. Available from:
http://publications.nice.org.uk/methods-for-the-development-of- nice-public-health-
guidance-third-edition-pmg4.
59. Niederman R, Gould E, Soncini J et al. A model for extending the reach of the
traditional dental practice: the ForsythKids program. J Am Dent Assoc.
2008;139(8):1040-50.
60. Nuttall N, Tsakos G, Lader D et al. Outcome and impact – a report from the Adult
Dental Health Survey 2009. The Health and Social Care Information Centre; 2011.
Available from: http://www.hscic.gov.uk/pubs/dentalsurveyfullreport09
61. Oh PI, Maerov P, Pritchard D et al. A cost-utility analysis of second-line antibiotics
in the treatment of acute otitis media in children. Clin Ther. 1996 Jan-
Feb;18(1):160-82.
Page 71
References 66
62. Ojima M, Hanioka T, Kuboniwa M et al. Development of web-based intervention
system for periodontal health: a pilot study in the workplace. Med Inform Internet
Med. 2003;28(4):291-8.
63. Pieper K, Weber K, Margraf-Stiksrud J et al. Evaluation of a preventive program
aiming at children with increased caries risk using ICDAS II criteria. Clin Oral
Invest. 2012;1-7.
64. Pieterse S, de JN, de VN. Does fluoride rinsing have an effect on teeth status?
Evaluation of preventive dental health activities for the youth of Woudenberg, The
Netherlands. Int J Dent Hyg. 2006;4(3):133-9.
65. Pine CM, Curnow MM, Burnside G et al. Caries prevalence four years after the end
of a randomised controlled trial. Caries Res. 2007;41(6):431-6.
66. Pitt N and Harker R. Obvious decay experience: Children’s Dental Health in the
United Kingdom 2003. Available
from:http://webarchive.nationalarchives.gov.uk/+/www.dh.gov.uk/en/Publicationsan
dstatistics/Bulletins/Chiefdentalofficersbulletin/Browsable/DH_4860753
67. Plutzer K, Spencer AJ. Efficacy of an oral health promotion intervention in the
prevention of early childhood caries. Community Dentistry and Oral Epidemiology.
2008;36(4):335-46.
68. PSSRU. Unit Costs of Health and Social Care 2013. 2013. Available from:
http://www.pssru.ac.uk
69. Reinhardt CH, Lapker N, Noack MJ et al. Peer teaching pilot programme for caries
prevention in underprivileged and migrant populations. Int J Paediatr Dent.
2009;19(5):354-9.
70. Riley JC, Klause BK, Manning CJ et al. Milk fluoridation: a comparison of dental
health in two school communities in England. Community Dent Health.
2005;22(3):141-5.
71. Shute JL, Judge K. Evaluating "Starting Well", the Scottish national demonstration
project for child health: outcomes at six months. J Prim Prev. 2005 IT24172 [Epub
ahead of print];26(3):221-40.
72. Speight PM, Palmer S, Moles DR et al. The cost-effectiveness of screening for oral
cancer in primary care. Health Technology Assessment 2006; 10(14)
73. Splieth CH, Berndt C, Alkilzy M et al. Efficacy of semiannual topical fluoride
application in schoolchildren. Quintessence Int. 2011;42(9):753-60.
74. Stecksen-Blicks C, Sjostrom I, Twetman S. Effect of long-term consumption of milk
supplemented with probiotic lactobacilli and fluoride on dental caries and general
Page 72
References 67
health in preschool children: a cluster-randomized study. Caries Research.
2009;43(5):374-81.
75. Tubert-Jeannin S, Leger S, Manevy R. Addressing children's oral health
inequalities: caries experience before and after the implementation of an oral health
promotion program. Acta Odontol Scand. 2012;70(3):255-64.
76. UK Data Service. Adult Dental Health Service, 1998. Available from:
http://discover.ukdataservice.ac.uk/catalogue?sn=4226
77. Vanobbergen J, Declerck D, Mwalili S et al. The effectiveness of a 6-year oral
health education programme for primary schoolchildren. Community Dent Oral
Epidemiol. 2004;32(3):173-82.
78. Warnakulasuriya S. Global epidemiology of oral and oropharyngeal cancer. Oral
Oncology 45 (2009) 309–316.
79. Wennhall I, Martensson EM, Sjunnesson I et al. Caries-preventive effect of an oral
health program for preschool children in a low socio-economic, multicultural area in
Sweden: results after one year. Acta Odontol Scand. 2005;63(3):163-7.
80. Whittle JG, Whitehead HF, Bishop CM. A randomised control trial of oral health
education provided by a health visitor to parents of pre-school children. Community
Dent Health. 2008;25(1):28-32.
81. Wind M, Kremers S, Thijs C et al. Toothbrushing at school: effects on toothbrushing
behaviour, cognitions and habit strength. Health Education. 2005;105(1):53-61.
82. Yeung A, Hitchlings J, Macfarlane T et al. Fluoridated milk for preventing dental
caries. Cochrane Database of Systematic Reviews 2005, Issue 3. Art. No.:
CD003876. DOI: 10.1002/14651858.CD003876.pub2
83. Yuan S, Kerr G, Salmon K et al. Evaluating a community based dental registration
program for preschool children living in areas of high social deprivation. Eur Arch
Paediatr Dent. 2007;8(1):55-61.
Page 73
APPENDIX A
Model Methodology: Restoration pathway and tooth decay
Page 74
Appendix A i
The main focus of the economic analysis is to capture the costs and benefits associated with
the treatment of dental caries. The impact of varying the key parameters in the analysis is
described in Section 2. An additional model, the input calculator model, has been developed
in addition to the core model with the aim of providing illustrative estimates of each of these
parameters. The input calculator model was based around a treatment pathway, described
below, where each health state is linked to a cost impact (in Appendix B) and a quality of life
impact (in Appendix C).
Levels of tooth decay
Data from the Children’s Dental Health Survey 2003 was used to estimate the levels of
decay in the general child population (Pitt and Harker, 2003). Data from the Adult Dental
Health Survey was used to estimate the level of decay in the general adult population (NHS:
The Information Centre, 2011).
The Children’s Dental Health Survey reported the number of teeth with “obvious decay
experience” (defined as having decay into dentine and filled, otherwise sound teeth). This
was reported for primary teeth in children aged 5 and aged 8, and for permanent teeth in
children aged 8, 12 and 15, and presented in Table A.1 as the number of unsound teeth.
The mean number of teeth that were missing due to decay was also reported for permanent
teeth in children aged 8, 12 and 15. In Table A.1, the number of missing and unsound teeth
in children aged eight was a combined total of the affected primary and permanent teeth.
Table A.1 State of oral health in children
Age Missing teeth Unsound teeth
Age 5 0 1.6
Age 8 0 2.0*
Age 12 0 1.1
Age 15 0.1 2
*1.8 primary teeth, 0.2 permanent teeth
The Adult Dental Health Survey reported the mean number of total teeth for each age band,
from which it was possible to estimate the number of missing teeth for each age band by
assuming the mean number of adult teeth to be 30. The survey also reported the mean
number of sound teeth, and the number of unsound teeth was also estimated by subtracting
the number of sound teeth from the total number of teeth.
Page 75
Appendix A ii
Table A.2: State of oral health in adults
Age Total teeth Missing teeth* Sound teeth Unsound
teeth*
16-24 28.6 1.4 25.9 2.7
25-34 28.8 1.2 23.7 5.1
35-44 27.6 2.4 20.1 7.5
45-54 26.0 4 15.1 10.9
55-64 23.2 6.8 12.0 11.2
65-74 20.9 9.1 10.5 10.4
75-84 17.1 12.9 8.5 8.6
85+ 14 16 6.8 7.2
*estimated by assuming the adult mouth has 30 teeth
From these two sources of data, the mean number of unsound teeth was estimated over the
lifetime. Over a course of a lifetime, some unsound teeth will become missing teeth, but it is
not known the proportion of these teeth that were lost due to poor oral health and which
were lost by some other means, e.g. in an accident. The number of unsound teeth and the
combined number of unsound and missing teeth for each age is presented in Figure A.1.
This has been estimated by assuming that the number of unsound or missing teeth refers to
the midpoint of the age band (e.g. a 50 year old has 10.9 unsound teeth and a 60 year old
as has 11.2 unsound teeth) and assuming that the rate of teeth affected by decay is constant
between the two age points.
Figure A.1: Lifetime unsound and missing teeth
From this graph the number of teeth that become affected by decay each year can then be
inferred. Given that the number of teeth lost due to reasons other than poor oral health is
not known for the cohort, it is assumed that all missing teeth were previously decayed. A
corresponding cost and QALY loss is incurred each year for each of these newly decayed
0
5
10
15
20
25
30
0 20 40 60 80 100
Nu
mb
er
of
teeth
Age
Unsound teeth Decayed and missing teeth
Page 76
Appendix A iii
teeth, based on the patient age and the timeline of the analysis. The mechanism by which
these are calculated is described in Appendix B and Appendix C, and the restoration
pathway described below.
Restoration pathway
The input calculator model attempts to capture the progression of the dental treatment of a
decayed tooth, referred to as the “restorative cycle”. This cycle is well recognised having
first been described by Elderton 2001. Evidence suggests that restorations have a limited
life span, and that once a tooth is restored the filling is likely to be replaced many times in
the patient’s lifetime. This may due to the fact that they wear out or break, or get recurrent
decay around the margins. Successive restorations places inside the tooth tend to increase
in size, leading to an increased risk of subsequent tooth fracture. Replacement restorations
tend to be more complex than the initial restorations, and may have a detrimental effect on
the pulp leading to the need for a root treatment. A crown may be required as the hole is too
big to be filled. Eventually the crown fails and the tooth is then extracted to be replaced by a
bridge which in turn may fail to be replaced by a denture. This pathway is described in
Figure A.2.
Figure A.2: Restoration pathway
It was felt by PHAC that this represents an atypical pathway which may not be
representative of some socioeconomic groups, since it is assumed that people are having
regular visits to their dentist and receiving timely treatment. To account for those patients
who do not have their teeth attended to regularly, the pathway was altered to allow for
patients whose decayed tooth is immediately removed (perhaps due to an advanced state of
decay), or to allow movement from any step of the process to an extraction. Unfortunately
there is currently no published data that allows this to be accurately modelled. It is also
unlikely to be a straightforward relationship, where the rate of extraction will vary by age, and
the probability of going from each step of the process to a tooth extraction is unlikely to be
constant (i.e. patients may be more likely to have a tooth with a crown completely removed
instead of going to a root canal than a badly decayed tooth being completely removed
instead of having a filling).
The input calculator model allows for these additional steps to be modelled in the treatment
pathway, and also includes the rate at which newly decayed teeth are treated (assuming that
treatment is delayed for a certain proportion of decayed teeth). Given that there is no
published data for the value of these rates, the model allows for a range of values to be
included; these are currently based on a range of assumptions, but it was considered to be
useful to include these parameters in the event that evidence is published in the future and
First filling
Re-filling Crown Root canal Extraction
Page 77
Appendix A iv
the model will be able to be updated, or to be able to analyse a range of values to see how
much it impacts on the results. A range of values for these parameters has been explored,
and the corresponding impact on costs is presented in Appendix B. This can then provide a
guide for PHAC as to the most plausible cost impact associated with dental caries.
The rate at which restorations were replaced was estimated from data reported in Burke et
al. 2005. The median survival of a restoration was reported in this study for different age
groups. This study investigated the outcome of direct placement restorations provided within
the General Dental Services in England and Wales, and to identify the patient factors which
may affect this using a database derived from patient treatment data at the Dental Practice
Board. The results indicated that patients’ gender was of little significance in the long-term
survival of restorations, but patient age had a significant effect, with the restorations of older
patients surviving less well than those of younger patients. The study does not present
median survival for the younger age groups, and it appears that this is due to the fact that
more than 50% of dental patients had their restoration intact at the end of the 10-year follow-
up period. This indicates that the median survival for the 30-39 age group may be an
underestimate for the younger age-groups and if this is the case, the illustrative QALY loss
estimates in Appendix C will be too high, although the input calculator model indicates that
the difference is extremely negligible. The median restoration survival for each age group was converted to an annual probability
of failure, by i) assuming that the median survival corresponds to a 50% probability of
survival, and converting this to an annual rate of failure, and ii) converting this rate to an
annual probability. These calculations used the following set of formulas, where probability
is denoted p and rate is denoted r (Fleurence et al. 2007):
(1)
(2)
Table A.3: Median filling survival by patient age
Age group Survival (years) Annual probability of failure
30 - 39 10.22 6.6%
40 - 49 8.39 7.9%
50 - 59 6.41 10.2%
60 - 69 5.67 11.5%
70 - 79 4.78 13.5%
80 and over 4.47 14.4%
Page 79
Appendix B i
NHS dental costs
A UDA is a “Unit of Dental Activity” undertaken by an NHS dentist. A UDA depends on the
type of work undertaken. A dentist is contracted by his PCT (Primary Care Trust) to do a set
number of UDAs and dentists have to be within 4% of their targets.
The cost of a UDA is variable: one UDA might be worth anywhere between £15 and £25, but
can be more than this or less. The actual UDA varies according to where in the country a
dentist is located and the amount of work previously carried out by the dentist before the
new contract. It is thought that the more desperate a PCT is for NHS dentists, the more a
UDA might be worth. This analysis assumes that one UDA is costed at £25.
Dentistry is one of very few NHS services the patient pays for. Patient charges were also
included in the economic model (NHS Choices, 2011).
There are three standard charges for all NHS dental treatments:
Band 1 - this covers an examination, diagnosis (including X-rays), advice on how to
prevent future problems, a scale and polish if needed, and application of fluoride
varnish or fissure sealant. Band 1 treatments are allocated 1 UDA.
Band 2 - This covers everything listed in Band 1 above, plus any further treatment
such as fillings, root canal work or removal of teeth. Band 2 treatments are
allocated 3 UDAs.
Band 3 - This covers everything listed in Bands 1 and 2 above, plus
crowns, dentures and bridges. Band 3 treatments are allocated 12 UDAs.
Table B.1: NHS dental costs
Band Treatment Dentist costs Patient charges
1 Examination, diagnosis £25 £18
2 Fillings, root canal, extraction £75 £49
3 Crowns, dentures and bridges £300 £214
Some adults are exempt from patient charges. Children under the age of 18 do not pay for
dental treatments. Table B.2 describes the proportion of adults who are exempt from paying
for treatment, which has been estimated from data reported in NHS dental statistics for
England: 2011/2012. NHS Dental Statistics is an annual report which brings together
information on NHS dental activity in England, based on data collected through FP17 forms
by NHS Dental Services (Health and Social Care Information Centre, 2012).
Page 80
Appendix B ii
Table B.2: NHS activity in adults
Band of treatment Exempt adults Paying adults
Band 1 course of treatment 22.63% 77.37%
Band 2 course of treatment 35.45% 64.55%
Band 3 course of treatment 55.19% 44.81%
Other costs that might be considered in the NHS are those hospital admissions for dental
care in children for the management of dental caries, as general anaesthesia is used to
manage behaviour and anxiety. A significant cost is associated with extraction under
general anaesthesia, and an inpatient stay for a dental extraction is estimated to cost around
£1,146 (PSSRU 2012). This cost has been applied to a proportion of dental patients under
the age of 16. However, the rate of extraction is very low and the impact of including this
element in the costs is negligible.
A range of potential per-patient costs for different age groups, for two different time horizons
are presented in Table B.3. This table refers to the costs incurred when one tooth is
affected by decay, i.e. the cost of treating one decayed tooth. These values have been
estimated using the input calculator model, and assumes that a decayed tooth follows the
pathway as described in Appendix A. Future costs are discounted at a rate of 1.5% (NICE,
2012). The calculations also take into account the fact that the patient is more likely to die
from natural causes as they get older, and so costs incurred in each year are weighted by
the probability of being alive. Treatment costs generally increase with age due to the fact
that restoration survival is largely affected by the patient age. These costs may over-
estimate the actual expenditure as it does not take into account that more than one tooth
may be treated at the same time, e.g. the cost of doing one filling is the same as the cost of
three fillings if they are done under the same course of treatment.
There is a lower level of uncertainty around treatment costs (compared with quality of life),
since dental costs are set on a national level. Two different scenarios around the rate of
extraction of decayed, unfilled teeth are explored:
Scenario one: the majority of decayed teeth are restored. The annual rate for
having a decayed tooth extracted is assumed to be 1%, which represents a low rate
of tooth extraction per decayed tooth.
Scenario two: a smaller proportion of decayed teeth are restored. The annual rate
for having a decayed tooth extracted is assumed to be 10%, which represents a
higher rate of tooth extraction per decayed tooth.
Page 81
Appendix B iii
Table B.3: Costs per patient, by age
Age
5 year time horizon 10 year time horizon
Scenario 1 Scenario 2 Scenario 1 Scenario 2
Age 5 £80.24 £73.12 £80.24 £73.12
Age 10 £93.58 £84.67 £131.44 £118.74
Age 25 £93.50 £84.60 £131.24 £118.57
Age 50 £107.98 £98.90 £175.10 £158.60
Age 65 £113.54 £103.48 £197.61 £177.70
For example, a 50-year old presenting with a decayed tooth will incur £98.90 in treatment
costs over five years. This figure is estimated by assuming the probability for having the
decayed tooth extracted instead of restored is 10% each year. In the same scenario, the
treatment costs rise to £158.60 over ten years.
Table B.4 reports the potential actual costs that are incurred by a patient over a five-year or
ten-year time horizon (as opposed to the potential cost of treating one case of caries that are
described in Table B.3), and is based on the predicted level of tooth decay as modelled in
Appendix A using the mean number of missing and unsound teeth over a lifetime (as
opposed to the costs in Table B.3 which are based on one tooth affected by decay). These
costs are displayed for each intervention type (stratified by age group), and for the same
scenarios as described for Table B.3. A range of relative risks are explored.
Table B.4: Per-patient actual costs, by intervention type
Intervention type
5 year time horizon 10 year time horizon
Scenario 1 Scenario 2 Scenario 1 Scenario 2
Relative risk of intervention: 1.0 (0% risk reduction)
Infants £106.78 £97.14 242.90 220.26
School-children £138.07 £124.98 370.43 334.69
Adults of working £145.04 £131.80 434.90 393.87
Adults over 65 £92.75 £85.02 257.83 235.05
Relative risk of intervention: 0.9 (10% risk reduction)
Infants £96.10 £87.43 231.83 210.18
School-children £124.27 £112.48 351.07 317.20
Adults of working £130.53 £118.62 412.20 373.32
Adults over 65 £83.48 £76.52 243.67 222.15
Relative risk of intervention: 0.75 (25% risk reduction)
Infants £80.09 £72.86 215.21 195.07
School-children £103.55 £93.74 332.04 290.96
Adults of working £108.78 £98.85 378.16 342.50
Adults over 65 £69.75 £63.77 222.42 202.80
Page 82
APPENDIX C
Quality of Life
Page 83
Appendix C i
Background
Quality of life measures are included within economic models in order to measure the impact
interventions have on this measure compared with the alternative. Including a quality of life
component within the economic model allows for any differences between interventions in
terms of their impact on quality of life to be included within decision making no matter how
small these differences may be.
Oral health related problems are likely to impact upon quality of life, however, in some cases
this may be to a nominal level. Where a patient experiences dental caries and requires a
filling, they are likely to have reduced quality of life associated with any pain in the tooth until
the tooth is treated and filled. After some initial discomfort on the day of the filling the
patient’s quality of life is likely to return to their normal level. In this case there is likely to be
a small reduction in quality of life over a short time frame. In other cases, the impact on
quality of life from oral health problems may be greater, or for a longer time frame, for
instance in the case of severe dental caries. In a recent documentary there was an example
of a 3 year old who had all his primary teeth removed due to decay. It was carried out under
GA. The result was that he was without any teeth for several years at primary school until his
adult teeth started to come through. However, for the vast majority of the disease pathway,
there will be no reduction in quality of life at all - the loss of quality of life only appears at the
end of the pathway where advanced decay will result in pain, and dysfunction due to tooth
loss. The reduction in quality of life due to lost teeth may be either transient altogether, or be
diluted over time due to people adapting to their condition, a well-documented phenomenon
across all chronic diseases. Furthermore, because these events occur in the future, the
impact of discounting (even at 1.5% per year) will reduce the impact even more.
It is also important to acknowledge the impact on the quality of life of young children that is
associated with losing primary teeth. This includes the impact on development of the mouth
or jaw if these teeth are lost prematurely, the risks associated with having teeth extracted
under general anaesthetic, and dental phobia as a result of the first experiences of visiting a
dentist being traumatic. However the risks associated with general anaesthesia were
assessed to be small (Cochrane review of sedation, 2012) and therefore have a relatively
low impact on the average population. The Cochrane review also concluded that there were
no studies suitable for inclusion in the review, indicating that the full impact of general
anaesthesia on mortality and morbidity is not known, and as such cannot be modelled
robustly. A fairly significant number of extractions under general anaesthetic are undertaken
in England, estimated to be around 34,000 in children under 17 in 2005-06, with roughly a
third of these occurring in the under-5s (Moles and Ashley, 2008). But given that the
economic analysis takes account of the average impact across the population that would
receive an intervention (the under-5 population size in 2012 was just under 4 million), the
impact on the average child is likely to be negligible.
Modelling
Page 84
Appendix C ii
Cost-effectiveness models are used to assess the relative benefits of a given treatment
using patient outcomes and the costs incurred in achieving those outcomes. The additional
cost per extra unit of benefit gained is of key interest to policy and decision makers. Benefit
gained is often measured a generic heath related utility measure known as a QALY which is
explained further in Section 1.2. Use of the QALY allows comparisons to be made between
very different health states.
General population utility values
Baseline quality of life by age group and gender was included in the input calculator model
as reported by Dolan et al. 1995. These utility values were applied to the ‘healthy’
population (unaffected by tooth decay or missing teeth) in the input calculator model, and are
displayed in Table C.1.
Table C.1: General population utility values (baseline)
Male Female All
<25 0.94 0.94 0.94
25-34 0.93 0.93 0.93
35-44 0.91 0.91 0.91
45-54 0.85 0.85 0.85
55-64 0.80 0.81 0.81
65-74 0.78 0.78 0.78
75+ 0.73 0.71 0.72
Dental caries and quality of life
There existed no health related utility scores for dental caries within the published literature,
and as such, these were estimated in the input calculator model. There exist some oral
health-specific instruments to measure quality of life. One of the more commonly used
instruments is the Oral Health Impact Profile (OHIP-14). The total OHIP score is calculated
by adding the numerical values for people’s responses on the 14 questions ('Never' =0,
'Hardly ever' =1, 'Occasionally' =2, 'Fairly often' =3 and 'very often' =4). The range of values
possible was from 0 (never on all 14 questions) to 56 (very often on all 14 questions).
Higher scores imply a more impaired oral health-related quality of life. The Adult Dental
Health survey reported OHIP responses for a variety of oral health conditions such as
decayed or missing teeth, following an interview administered questionnaire on a sample of
adults within the UK. Table C.2 displays the prevalence of OHIP-14 problems with different
levels of oral health, including those with one or more decayed tooth, and those who have
fewer than 21 teeth. A widely accepted threshold for reporting a positive OHIP-14 impact is
experiencing a problem occasionally or more often, and as such the proportion experiencing
oral health problems at least this frequently is reported in the ADHS and described in Table
Page 85
Appendix C iii
C.2 below. For comparison with the groups in the table, the mean OHIP score for dentate
adults ranged from 17.1 for those who had no decayed teeth (vs 19.2 for those with at least
one decayed tooth), to 17.4 for those who have more than 21 teeth (vs 19.7 for those with
fewer than 21 teeth).
Table C.2: Illustrative OHIP-14 scores (ADHS): proportion responding with
“occasionally or more often”
Dimension Some decayed teeth* Some missing teeth**
Trouble pronouncing words 10% 18% (10% occasionally)
Sense of taste worsened 10% 18% (10% occasionally)
Painful aching in mouth 38% (24% occasionally) 41% (26% occasionally)
Uncomfortable eating 38% (24% occasionally) 41% (26% occasionally)
Felt self-conscious 28% (14% occasionally) 30% (14% occasionally)
Felt tense 28% (14% occasionally) 30% (14% occasionally)
Diet unsatisfactory 12% 15%
Interrupt meals 12% 15%
Difficulty relaxing 24% (15% occasionally) 22% (13% occasionally)
Being embarrassed 24% (15% occasionally) 22% (13% occasionally)
Irritable with other people 10% 10%
Difficulty doing usual jobs 10% 10%
Life less satisfying 9% 11%
Unable to function 9% 11%
Mean total OHIP score 19.2 19.7
*At least one decayed tooth
**Fewer than 21 teeth
The NICE methods guide for the development of public health guidance states that where
possible cost-effectiveness analysis using QALY’s should be undertaken to allow
comparisons between NICE programmes (NICE, 2012). However no published literature
providing utility score estimations for dental caries were available. As such, the utility score
for each oral health state can be estimated within the input calculator model using a
regression analysis which maps OHIP-14 score to EQ-5D. A review of the literature did not
find any other studies which mapped any other oral health-specific instruments to generic
quality of life.
A study by Brennan and Spencer (2006) was used to map OHIP responses to generic health
state values. The authors surveyed both patients and dentists and used responses to
construct models of health state values. This provided an algorithm to transform OHIP-14
scores into estimated generic health state values. The regression coefficients for each of
the 14 dimensions of the OHIP-14 are shown in Table C.3. The regression model in Table
C.3 is described by the authors as a continuous model, which assumes that each level of
response (i.e. ‘never’, ‘hardly ever’, ‘occasionally’, ‘fairly often’ and ‘very often’) coded from 0
to 4 is a continuous variable. The authors of the study also considered an additional
categorical model but this was found to fit less well and was not presented in this analysis.
Page 86
Appendix C iv
Table C.3: Regression coefficients for OHIP-14 to utility relationship
Dimension Regression coefficient Standard error
Trouble pronouncing words 0.0154 0.025
Sense of taste worsened 0.002 0.022
Painful aching in mouth -0.0905 0.020
Uncomfortable eating -0.0173 0.019
Felt self-conscious 0.0281 0.026
Felt tense 0.0289 0.027
Diet unsatisfactory 0.032 0.024
Interrupt meals -0.0337 0.025
Difficulty relaxing -0.0187 0.030
Being embarrassed 0.0055 0.029
Irritable with other people -0.0186 0.030
Difficulty doing usual jobs -0.0266 0.038
Life less satisfying -0.055 0.026
Unable to function -0.0177 0.037
Gender (1=male) 0.0204 0.031
Age (years) 0.0002 0.001
Constant term 1.0822 0.060
For example, a female patient aged 50 answering “Occasionally” to each of the items will
have their utility score estimated as such:
Utility = 0.0154*2 + 0.002*2 – 0.0905*2 – 0.0173*2 + 0.0281*2 + 0.0289*2 + 0.032*2 –
0.0337*2 – 0.0187*2 + 0.0055*2 – 0.0186*2 -0.0266*2 -0.055*2 -0.0177*2 + 0.0204*0 +
0.0002*50 + 1.0822 = 0.76
While the OHIP outcomes of the Adult Dental Health Survey in Table C.2 are not presented
in a format that is suitable for use in the regression analysis, they can provide a guide to the
likely responses and thus the potential utility weight for each oral health state.
A range of possible utility estimates based on responses to the OHIP using the regression
analysis in Table C.3 are described below:
Where the answer ‘never’ is provided to all of the dimensions the utility score
calculated is 1 (equivalent to an OHIP-14 score of 0).
Page 87
Appendix C v
Conversely, where the answer ‘very often’ is selected for all 14 dimensions (i.e. an
extreme worst case), the utility score generated is 0.49 (equivalent to an OHIP-14
score of 54).
There are some limitations with the Brennan study, some of which were discussed by the
EAC and others which were mentioned by the authors of the study. As with all regression
models, there is a degree of estimation error in the analysis. The authors of the study
estimated the forecast error of the regression model to be 15.2%. The standard error around
each regression coefficient is also presented in Table C.3. The study also only considered
responses from adult dental patients, so the results of the regression may not be applicable
for child populations.
As is evident from the coefficients shown in Table C.3, some of the coefficients calculated in
the regression analysis by Brennan and Spencer are positive (e.g. ‘felt tense’) meaning that
as the dimension occurs more often, the utility score increases. This point is counter-
intuitive, and likely to be a limitation of the analysis. However it was not discussed by the
authors of the paper.
The constant term is also larger than 1 (the maximum for a utility weight), suggesting that if a
patient answered “never” to each question, their utility score would be above 1 (the input
calculator model artificially capped the estimated utility weight at 1 so this would not occur in
the analysis). There is a ceiling effect associated with the distribution of responses to the
survey in the Brennan study, where a large number of respondents reported no problems,
making the instrument less appropriate for milder conditions.
The authors do however mention that previous mapping studies have cautioned that the use
of such mapped utility values would not be appropriate for use at the individual level and
instead should be applied to analyses performed at the group level. They also noted that the
participants in this study were dental patients who may have more oral disease than the
general population, and may over-estimate the value of some health states.
Figure C.1 provides an illustration of how utility weight can be estimated from OHIP
responses in the input calculator model. Please note that this is provided purely as an
illustrative example and is not a reflection of what the EAC consider the as being the most
appropriate utility estimates for the analysis.
Page 88
Appendix C vi
Figure C.1: Mapping of OHIP-14 to utility scores
Varying the responses to each of the OHIP-14 dimensions had little impact overall health
related utility, suggesting that this parameter, although uncertain is likely to have a limited
impact on the model results.
The outcome of this analysis can be used to put the ranges of QALY loss in the sensitivity
analyses into context. Taking, as an example, a QALY loss of -0.1 over a 10 year time
horizon, i.e. 0.99 QALYs per year, the analysis can be used to determine which answers to
OHIP-14 would need to be provided to generate such utility.
Page 89
Appendix C vii
Answering ‘hardly ever’ to all bar one dimensions and ‘never’ to the ‘life less
satisfying’ dimension provides a utility score of 0.99 and an OHIP-14 score of 13.
Therefore, if a patient lived in this health state for 10 years, they would experience a
QALY loss of -0.1.
A QALY loss of -0.1 can also by generated by considering a one year time horizon
during which a patient lives with a utility of 0.9. A patient completing the OHIP-14
with answers of ‘occasionally’ for all dimensions except ‘never’ interrupting meals or
having difficulty relaxing and ‘hardly ever’ having difficulty doing usual jobs would
generate an OHIP-14 score of 23 and a utility of 0.9.
It is important to note the difference between ‘utility’ and ‘QALYs’. Whilst we can map OHIP-
14 to utility (as shown above), estimating the relationship between OHIP-14 and lost QALYs
would involve modelling the complex disease pathway over longer periods of time.
Therefore, using OHIP-14 to predict QALYs is somewhat more challenging. A range of
alternative values has been assessed in the economic analysis in Section 2, rather than
attempting to select one single estimate. The values of -0.025, -0.050 or -0.100 were
chosen because it was felt that they represented a reasonable and plausible range of
potential scenarios. A lower limit of zero (i.e. no utility loss) could also have been included,
however that would result in no QALY gains or losses at all and, as such, cost-effectiveness
ratios would be impossible to generate. It would also be possible to model QALY losses that
are greater than our worst case (-0.100) but those are analyses are excluded for two
reasons: (i) it is unlikely that the magnitude of QALY losses will be greater than this figure
due to the transient nature of the quality of life loss (i.e. it is usually incurred over short
periods of time), and (ii) the sensitivity analysis below has demonstrated that, for QALY
losses of 0.100 or more, the results of the model remain mostly unchanged.
The results of the sensitivity analysis in Section 2 can be interpreted according to the time
scale which is considered to be most relevant - i.e. The PHAC can estimate QALY loss and
costs over whichever time scale that is considered to be appropriate, and then the graphs in
Section 2.4 can be used to guide discussions around whether in that circumstance the
intervention is cost-effective. A range of potential per-patient QALY losses for different age
groups, for two different time horizons are presented in Table C.4. This table refers to the
QALY loss when one tooth is affected by decay. These values have been estimated using
the input calculator model, and assumes that a decayed tooth follows the pathway as
described in Appendix A. Future QALYs are discounted at a rate of 1.5% (NICE, 2012).
Two different utility scenarios are explored:
Scenario one: decay and missing teeth have a small impact on quality of life. The
utility for having a decayed tooth is assumed to be 0.99 and the utility for having a
missing tooth is assumed to be 0.95;
Scenario two: decay and missing teeth have a larger impact on quality of life. The
utility for having a decayed tooth is assumed to be 0.95 and the utility for having a
missing tooth is assumed to be 0.90.
Page 90
Appendix C viii
To reflect that the general health of the population will naturally deteriorate over time, the
health state utility weights were applied to general population utility estimates to derive the
adjusted utility scores allowing for the underlying utility of the general population. For
example, an otherwise healthy 40 year old has a utility value of 0.91 (Table C.1). Assuming
that the utility weight for having a decayed tooth is 0.99, a 40 year old with a decayed tooth
would have a utility value of 0.91 x 0.99 = 0.9009.
Additionally, many studies in the clinical effectiveness review state that the benefits of
interventions were not sustained in the long-term. The scenarios in the Table C.4
conservatively assume that each intervention reduces the risk of disease for no more than
five years. An additional scenario is presented in C.5 where it is assumed that each
intervention reduces the risk of disease for at least ten years (i.e. over the full 10-year time
horizon). Results for the 5-year time horizon in this scenario will be identical to those in
Table C.4 and are, therefore, not replicated.
Table C.4: QALY loss per patient, by age (benefits of intervention last 5 years)
Age
5 year time horizon 10 year time horizon
Scenario 1 Scenario 2 Scenario 1 Scenario 2
Age 5 -0.0205 -0.1011 -0.0362 -0.1783
Age 10 -0.0215 -0.1024 -0.0398 -0.1831
Age 25 -0.0213 -0.1012 -0.0391 -0.1802
Age 50 -0.0190 -0.0903 -0.0343 -0.1576
Age 65 -0.0172 -0.0825 -0.0306 -0.1403
Table C.5: QALY loss per patient, by age (benefits of intervention last 10 years)
Age
10 year time horizon
Scenario 1 Scenario 2
Age 5 -0.0359 -0.1783
Age 10 -0.0398 -0.1831
Age 25 -0.0391 -0.1802
Age 50 -0.0343 -0.1576
Age 65 -0.0306 -0.1403
There are limited data exploring how oral health in general impacts on quality of life, but
there is even less evidence which looks at more specific scenarios. The Adult Dental Health
Survey measured the OHIP score for patients with more than one tooth with decay, and with
less than 21 teeth. It seems plausible that quality of life will be lower when more teeth are
missing and more teeth are decayed, but unfortunately there exists no data to be able to
quantify this. It is also very plausible that the location of the affected tooth in the mouth is a
big factor when determining the impact on quality of life when it is affected, and for several
different reasons – a missing front tooth is likely to cause embarrassment and emotional
distress, and a decayed molar tooth may impact on the ability to eat and speak. People
Page 91
Appendix C ix
have a tendency to adapt to their current (health) state, and it is likely that any disutility
associated with decay will apply only in the short-term. For example, it may be that applying
a disutility to the health state of having a filled tooth will over-estimate the benefits of
treatment, given that the discomfort associated with a restoration will not apply indefinitely.
The number of teeth that become decayed and eventually extracted has been modelled over
the course of a lifetime, using outcomes reported in the Children’s Dental Health report and
the Adult Dental Health Survey, and described in Appendix A. One option for modelling the
total QALYs that are lost from experiencing decay and missing teeth is to assume that the
QALY loss estimated in Table C.4 and Table C.5 is applied to each tooth that is affected.
However this approach will over-estimate the QALY loss given that it is unlikely that going
from one tooth being affected to two teeth being affected will double the number of lost
QALYs; that is, the utility of one decayed tooth and the utility of two decayed teeth is unlikely
to differ by much. But data to suggest how the utility will vary does not exist, and in order to
be fully able to model the quality of life, this is the kind of data that would be required.
Table C.6 reports the potential actual QALY loss that are incurred by a patient over a five-
year or ten-year time horizon (as opposed to the potential QALY loss of one case of caries
that are described in Table C.4), and is based on the predicted level of tooth decay as
modelled in Appendix A using the mean number of missing and unsound teeth over a
lifetime. The range of QALY losses are displayed for each intervention type (stratified by
age group), for the same utility scenarios as described for Table C.4 and Table C.5. A range
of relative risks are explored. As noted above, this analysis is likely over-estimating the
potential QALY loss for each intervention, given that the additive approach for modelling
multiple decayed teeth is unrealistic.
Table C.6: Per-patient actual QALY loss associated with caries, by intervention type (benefits of intervention last 5 years)
Intervention type 5 year time horizon 10 year time horizon
Scenario 1 Scenario 2 Scenario 1 Scenario 2
Relative risk of intervention: 1.0 (0% risk reduction)
Infants -0.0259 -0.1264 -0.0860 -0.4102
School-children -0.0318 -0.1514 -0.1119 -0.5153
Adults of working -0.0269 -0.1278 -0.0905 -0.4164
Adults over 65 -0.0123 -0.0588 -0.0349 -0.1613
Relative risk of intervention: 0.9 (10% risk reduction)
Infants -0.0234 -0.1137 -0.0747 -0.3879
School-children -0.0286 -0.1363 -0.0973 -0.4882
Adults of working -0.0242 -0.1151 -0.0785 -0.3942
Adults over 65 -0.0111 -0.0529 -0.0300 -0.1524
Relative risk of intervention: 0.75 (25% risk reduction)
Infants -0.0195 -0.0948 -0.0815 -0.3545
School-children -0.0239 -0.1136 -0.1061 -0.4477
Adults of working -0.0201 -0.0959 -0.0857 -0.3610
Adults over 65 -0.0092 -0.0441 -0.0329 -0.1390
Page 92
Appendix C x
Table C.7: Per-patient actual QALY loss associated with caries, by intervention
type (benefits of intervention last 10 years)
Intervention type 10 year time horizon
Scenario 1 Scenario 2
Relative risk of intervention: 1.0 (0% risk reduction)
Infants -0.0859 -0.4096
School-children -0.1118 -0.5148
Adults of working -0.0883 -0.4063
Adults over 65 -0.0289 -0.1334
Relative risk of intervention: 0.9 (10% risk reduction)
Infants -0.0773 -0.3687
School-children -0.1006 -0.4633
Adults of working -0.0795 -0.3657
Adults over 65 -0.0260 -0.1200
Relative risk of intervention: 0.75 (25% risk reduction)
Infants -0.0644 -0.3072
School-children -0.0839 -0.3861
Adults of working -0.0663 -0.3047
Adults over 65 -0.0217 -0.1000
Quality-adjusted tooth years
The OHIP-14 scores used within the model and their mapping to estimate generic utility
scores made use of the best available data relating to non-disease specific heath related
quality of life. However, given the limitations of this data, a disease specific measure of
utility was also considered within the model. Quality-adjusted tooth years (QATYs) measure
tooth related quality of life on a scale of 0 to 1 whereby “0” corresponds to the worst tooth
state imaginable and “1” corresponds to the best tooth state imaginable (Fyffe and Kay
1992).
The QATY scores used in the model for tooth decay and pain were taken from a study by
Fyffe and Kay (1992) and those for tooth loss from Nassani and Kay (2011). These scores
are shown in Table C.8.
Page 93
Appendix C xi
Table C.8: QATY score inputs for model
Tooth state QATY score
QATY scores for tooth decay/pain*
Decayed and painful 0.57
Filled, further work required 0.87
Filled 0.90
QATY scores for tooth loss (UK data service, 1998)
Anterior teeth 0.26
Premolar teeth 0.39
Molar teeth 0.44
Mean utility weighted by caries location 0.43
*only values for molar teeth were reported, so these values were applied to all teeth
A range of potential per-patient QATY losses for different age groups, for two different time
horizons are presented in Table C.9. This table refers to the QATY loss when one tooth is
affected by decay. These values have been estimated using the input calculator model, and
assumes that a decayed tooth follows the pathway as described in Appendix A.
Table C.9: QATY loss per patient, by age
Age 5 year time horizon 10 year time horizon
Age 5 -1.722 -1.722
Age 10 -1.093 -1.642
Age 25 -1.093 -1.640
Age 50 -1.092 -1.634
Age 65 -1.078 -1.582
Table C.10 reports the potential actual QATY loss that are incurred by a patient over a five-
year or ten-year time horizon, and is based on the predicted level of tooth decay as modelled
in Appendix A using the mean number of missing and unsound teeth over a lifetime. The
range of QATY losses are displayed for each intervention type (stratified by age group). A
range of relative risks are explored. Similarly to the QALY analysis, these values for the
potential QATY loss for each intervention are likely over-estimates, given that the additive
approach for modelling multiple decayed teeth is unrealistic.
Page 94
Appendix C xii
Table C.10: Per-patient actual QATY loss associated with caries, by intervention type
Intervention type 5 year time horizon 10 year time horizon
Relative risk of intervention: 1.0 (0% risk reduction)
Infants -0.18 -0.50
School-children -0.25 -0.86
Adults of working -0.21 -0.68
Adults over 65 -0.09 -0.22
Relative risk of intervention: 0.9 (10% risk reduction)
Infants -0.16 -0.48
School-children -0.23 -0.82
Adults of working -0.19 -0.65
Adults over 65 -0.08 -0.21
Relative risk of intervention: 0.75 (25% risk reduction)
Infants -0.13 -0.45
School-children -0.19 -0.75
Adults of working -0.16 -0.59
Adults over 65 -0.07 -0.19
The issues with modelling QATYs are similar to the reasons listed in the section above
describing general health state utilities, whereby it is expected that quality of life will be lower
when more teeth are missing and more teeth are decayed, and that the location of the
affected tooth in the mouth is a big factor when determining the impact on quality of life when
it is affected. While there is some limited evidence for the tooth utility of different teeth being
affected and with multiple teeth being affected, it is difficult to include this within the
economic analysis - the total number of affected teeth over the patient’s lifetime can be
estimated, but not where these affected teeth are located in the mouth. In addition, the fact
that the mouth contains up to 32 teeth means that any analysis attempting to capture the
large number of different combinations of affected teeth would result in a highly complex
model.
There is insufficient evidence to be able to generate robust estimates of the likely QATY
gains for each intervention. As such, specific cost-per-QATY ICERS are not presented.
However, the potential QATY gains presented in Table C.10 and the range of costs in
Appendix B can be used by the PHAC to draw inferences around the likely cost per QATY
for each intervention.
Page 95
APPENDIX D
Other oral health outcomes
Page 96
Appendix D i
The original aim of the model was to capture the impact of each intervention on dental and
periodontal disease, and on oral cancer. However it was decided by the EAC that the
economic analysis would exclude oral cancer and periodontal disease given that no useable
evidence could be identified on either outcome. Further issues around this aspect of the
analysis are discussed below.
Oral cancer
The annual risk of oral cancer by age band was obtained from Cancer Research UK
incidence statistics. The risk for the younger population is very small, with no cases of oral
cancer recorded for the under 10s.
Table D.1: Risk of oral cancer by age
Age band Annual risk of oral cancer
0 to 4 0.0000%
5 to 9 0.0000%
10 to 14 0.0001%
15 to 19 0.0002%
20 to 24 0.0002%
25 to 29 0.0007%
30 to 34 0.0010%
35 to 39 0.0023%
40 to 44 0.0051%
45 to 49 0.0100%
50 to 54 0.0183%
55 to 59 0.0250%
60 to 64 0.0279%
65 to 69 0.0294%
70 to 74 0.0285%
75 to 79 0.0275%
80 to 84 0.0279%
85+ 0.0270%
Utility weight was reported by cancer stage (Downer et al. 1997). The mean utility weight
was then calculated, weighted by the proportion of patients diagnosed with that stage of
cancer.
Table D.2: Oral cancer quality of life
Stage Proportion of patients Utility weight
Precancer 15.1% 0.92
Stage I/II cancer 46.9% 0.88
Stage III/IV cancer 38.0% 0.68
Mean - 0.81
Page 97
Appendix D ii
The median oral cancer survival is 5 years (Warnakulasuriya 2009). This was converted to
an annual risk of death (by assuming that an exponential rate at which patients died), which
was estimated to be 20%.
Management costs were obtained from the HTA for the cost-effectiveness of screening for
oral cancer (Speight et al., 2006):
High first year costs (£6,444);
Lower second and third year costs (£946, £881);
Patients are discharged after the third year.
The modelling approach is presented in Figure D.1 below.
Figure D.1: Oral cancer modelling approach
The QALY loss and costs associated with a case of oral cancer have been generated based
on the modelling approach described in Figure D.1.
Table D.3: Expected cost of oral cancer
Year Probability alive at year end Resource costs Expected cost
Year 1 0.8 £6,444 £5,155.19
Year 2 0.64 £946 £596.42
Year 3 0.51 £881 £437.81
Page 98
Appendix D iii
The lifetime QALY loss associated with oral cancer will inevitably vary with age. An 18 year
old with oral cancer will lose approximately 30 QALYs, with their life expectancy based on
UK life tables. A 40 year old with oral cancer will lose approximately 20 QALYs, and a 65
year old with oral cancer will lose approximately 10 QALYs.
Given that the rate of oral cancer in children under 10 is very low, the impact of including oral
cancer in the economic analysis for the programmes in infants and pre-school children is
negligible. In this age group, oral cancer is likely to be far in the future, and the costs and
QALYs will be heavily discounted at this point. A similar argument can be made for children
of school-age. Even for older age groups, the risk of oral cancer is still very low, and the
potential QALY gains from reducing the risk of oral cancer will be smaller than that of the
child population given the shorter natural life expectancy. If an intervention does have a very
large effect on oral cancer (i.e. a small relative risk), it is highly unlikely to impact on the
costs and QALYs.
Periodontal disease
This element of oral health was excluded from the economic analysis due to a lack of
understanding around how periodontal disease and the outcomes reported in the studies
(e.g. Plaque and Gingival Index) are linked to quality of life and treatment costs.
Periodontal disease is generally managed at home with good brushing and flossing
practices, with a scale and polish by a dental practitioner encouraged to be part of routine
dental care. Generally the treatment for a tooth affected with a more advanced form of
periodontal disease is extraction. There exists some data on the rates of tooth extraction in
the population, but the cause is rarely reported, or is generally due to a combination of
factors (some tooth decay and periodontal disease). The input calculator model aims to
capture the total number of teeth missing over the course of a patient lifetime (and the
associated impact on quality of life and costs), so any additional rate of tooth loss according
to periodontal disease would be double-counting.
Regarding quality of life, it is understood that this is largely only affected as the disease
becomes more severe and causes pain, and when this leads to a tooth being lost. A large
proportion of the general population report some level of bleeding and pocketing (NHS: The
Information Centre, 2011) so it is expected that the general population utility estimates
should capture this. One study reports that a large proportion of patients perceive that oral
health does not affect their quality of life; however there was some correlation between
different symptoms associated with periodontal disease and quality of life as measured by
an oral health-specific tool (Needleman, 2004).