Economic Notes Source: The Slavonic Review, Vol. 1, No. 3 (Mar., 1923), pp. 659-665 Published by: the Modern Humanities Research Association and University College London, School of Slavonic and East European Studies Stable URL: http://www.jstor.org/stable/4201666 . Accessed: 14/06/2014 21:14 Your use of the JSTOR archive indicates your acceptance of the Terms & Conditions of Use, available at . http://www.jstor.org/page/info/about/policies/terms.jsp . JSTOR is a not-for-profit service that helps scholars, researchers, and students discover, use, and build upon a wide range of content in a trusted digital archive. We use information technology and tools to increase productivity and facilitate new forms of scholarship. For more information about JSTOR, please contact [email protected]. . Modern Humanities Research Association and University College London, School of Slavonic and East European Studies are collaborating with JSTOR to digitize, preserve and extend access to The Slavonic Review. http://www.jstor.org This content downloaded from 62.122.73.250 on Sat, 14 Jun 2014 21:14:53 PM All use subject to JSTOR Terms and Conditions
Transcript
Economic NotesSource: The Slavonic Review, Vol. 1, No. 3 (Mar., 1923), pp. 659-665Published by: the Modern Humanities Research Association and University College London, School ofSlavonic and East European StudiesStable URL: http://www.jstor.org/stable/4201666 .
Accessed: 14/06/2014 21:14
Your use of the JSTOR archive indicates your acceptance of the Terms & Conditions of Use, available at .http://www.jstor.org/page/info/about/policies/terms.jsp
.JSTOR is a not-for-profit service that helps scholars, researchers, and students discover, use, and build upon a wide range ofcontent in a trusted digital archive. We use information technology and tools to increase productivity and facilitate new formsof scholarship. For more information about JSTOR, please contact [email protected].
.
Modern Humanities Research Association and University College London, School of Slavonic and EastEuropean Studies are collaborating with JSTOR to digitize, preserve and extend access to The SlavonicReview.
http://www.jstor.org
This content downloaded from 62.122.73.250 on Sat, 14 Jun 2014 21:14:53 PMAll use subject to JSTOR Terms and Conditions
IT is a well-known fact that Russian industries are in a state of complete destruction. But many peopie have attributed this to the civil war, blockade, foreign intervention, and other causes-to any cause except the Communist rule. But in 1922 civil war has long since come to an end, the blockade is withdrawn, and the Soviet Government has even been recognised either de jure or de facto in Western Europe. And now, after the proclamation of the new economic policy and the syndicalising of Russian industry, the Soviet Go vernment is yet compelled to contract all the branches of industry. This scheme of reducing industries was prepared as early as last spring, and the necessary measures were then taken. The engineer A. Yakub (Ekon. Zhizn., 8.6.22) states that the reduction must in general include about I5 per cent. of the present industries. The various branches of industry have been reduced in the following percentages: coal industry, I5 per cent.; ores, 33 per cent.; gold and platinum, I2 per cent.; salt, 33 per cent.; metals, 6-7 per cent.; cotton, 20-25 per cent.; wool, 20 per cent.; silk, IO per cent.; linen, 20 per cent.; leather, I5 per cent.; chemicals, approximately, 5 per cent.; silicate: glass, 64 per cent.; porcelain, 34 per cent. The causes of these drastic measures taken bv the Central Government are chiefly to be found in the impoverishment of the peasant population and the general decrease of their purchasing power. Secondly, there is a persistently growing scarcity of money, and all the trusts, in order to obtain money, are even compelled to sell their food supplies. Under such conditions Russian industries are overproducing, and some Communists have pro- posed to export the surplus. It sounds quite paradoxical that Russia should have a surplus, but such is the fact. The peasant cannot afford to buy even the most needed articles and they are stored in the factories. The consequence of this wholesale stoppage of factories is an increase of unemployment. The following table gives figures of unemployed for Moscow, Petrograd and 33 other towns':
I922 Moscow Petrograd 33 Other Towns
January ... ... ... ... I 7,200 9,500 4I,700 February ... ... ... ... I 7,800 I4,000 42,300 March ... ... ... ... 19,400 I 7,200 4I,800 April ... ... ... ... I8,200 24,600 47,300 May ... ... ... ... 34,200 45,600 59,000 June ... ... ... ... 1 39,400 37,700 69, IOO July ... ... ... ... 32,700 50,500 73,600 August ... ... ... ... 35,600 6o,ooo September ... ... ... 39,300 65,600 October ... ... ... ... 48,ooo -
November ... ... ... 55,400 -
1 Ekon. Zhizn., 24.I2.22.
T t 2
This content downloaded from 62.122.73.250 on Sat, 14 Jun 2014 21:14:53 PMAll use subject to JSTOR Terms and Conditions
It is obvious that unemployment is steadily increasing and at present must reach much higher figures. Remuneration, which for- merly included food rations, now consists exclusively of paper money. If we count in pre-war roubles, the following remuneration of skilled workmen prevailed in Petrograd and Moscow during September, I922'
This table shows that the standard wage of the most skilled work- men is much lower than before the war. The Soviet officials get even less than the workmen. The average monthly salary of a Soviet official during the period April-September, I922, amounted only to 8 66 pre-war roubles.2
Output.-The output in I922, as usual, has fallen to the minimum during summer and increased in the autumn, owing to the new yield of crops. But this improvement is only temporary and in the spring, when the corn is consumed, the output will again decrease. The principal branches of industry had the following output in thousands of puds (the figures are taken from Ekon. Zhizn.)
ist 2nd A_Sept- Nov- Industry Quarter Quarter July August ember October ember
HOW TO USE SOVIET FIGURES: AGRICULTURE AND EXPORT.
The Soviet Government, in view of the Hague Conference, tried to persuade Western Europe that there was an exceptionally good yield of crops in Russia this year and a possibility of export of cereals. The Soviet statisticians appear to have been instructed to provide special figures for this purpose. The trouble is that various Departments could not agree and have given quite contradictory figures. Not less than four attempts to calculate the yield of crops of I922 have been made public. The first was made by Popov, head of the Central Statistic Department; the second by the statistician V. Mikhailovsky; the third by the statistician N. Vishnevsky, and the fourth by the Statistical Section of the State Plan Department.1 The results of these attempts are shown in the following table
Area under Average Yield of crops in mill. puds crops in yield in million puds per Ttl Net (with-
desyatines desyatine Total out seeds)
By Popov ... ... 50 6o 2,853 2,378
By Mikhailovskv ... 53 62 3,200 2,700
By Vishnevsky ... 70 50 3,400 2,700
The requirements of the population were calculated in the following way: the average standards of yearly consumption for the rural popu- lation were taken at I7 puds per head and for the town population at Io puds per head. For the rural population this makes a total of I,63I million puds, and for the town population the total of I75 million puds. Thus, according to Popov, the grand total of require- ments is I,8o6 million puds. The final conclusion of these calcula- tions of Popov is that this year Russia will have abou; 500 million puds of surplus for export.
These figures were calculated before the final results of the crops were known. Strangely enough, the Central Statistical Department has not yet published (February, I923) the corrected results. It is obvious at first sight that all the above estimates are exaggerated, but as the Soviet Government is determined to export cereals at all costs, the only thing left is silence on the subject. Owing to depart- mental jealousies, however, the Commissariat of Agriculture has published its own figures as to the area sown in I922. This area was actually only 4I,383,000 desyatines (except potatoes, flax, hemp, etc.), and not 50 or 70 million desyatines as calculated before. The average yield per desyatine was also much lower than the figure of Popov and, according to local information, actually amounts to about 45 puds
1 Ekonomicheskaia Zhizn, I7.8.22.
This content downloaded from 62.122.73.250 on Sat, 14 Jun 2014 21:14:53 PMAll use subject to JSTOR Terms and Conditions
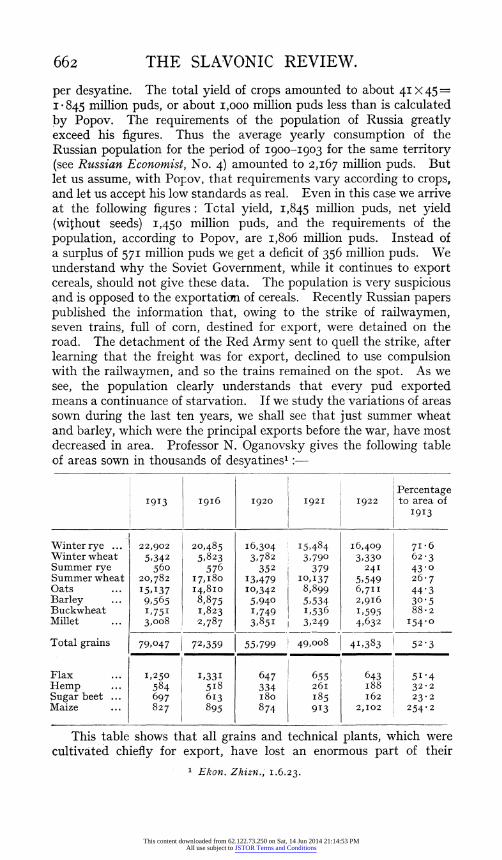
662 THE SLAVONIC REVIEW. per desyatine. The total yield of crops amounted to about 4I X 45 I - 845 million puds, or about I,000 million puds less than is calculated by Popov. The requirements of the population of Russia greatly exceed his figures. Thus the average yearly consumption of the Russian population for the period of I900-I903 for the same territory (see Russian Economist, No. 4) amounted to 2,167 million puds. But let us assume, with Popov, that requirements vary according to crops, and let us accept his low standards as real. Even in this case we arrive at the following figures: Total yield, I,845 million puds, net yield (without seeds) I,450 million puds, and the requirements of the population, according to Popov, are i,8o6 million puds. Instead of a surplus of 57I million puds we get a deficit of 356 million puds. We understand why the Soviet Government, while it continues to export cereals, should not give these data. The population is very suspicious and is opposed to the exportaticn of cereals. Recently Russian papers published the information that, owing to the strike of railwaymen, seven trains, full of corn, destined for export, were detained on the road. The detachment of the Red Army sent to quell the strike, after learning that the freight was for export, declined to use compulsion with the railwaymen, and so the trains remained on the spot. As we see, the population clearly understands that every pud exported means a continuance of starvation. If we study the variations of areas sown during the last ten years, we shall see that just summer wheat and barley, which were the principal exports before the war, have most decreased in area. Professor N. Oganovsky gives the following table of areas sown in thousands of desyatines'
areas. On the other hand, grains cultivated for local consumption have lost very little, and in some cases (such as millet and maize) have even increased their areas. The conclusions to be drawn from these data are, firstly, that Russia cannot export cereals until the areas under summer wheat and barley reach their original figures; and, secondly, that the Soviet Government, if it exports foodstuffs, must condemn the population of Russia to starvation.
B.-POLAND. Area under cultivation, I92I-22.
(In hectares, round figures.)_
___ Congress Pomerania (2) Teschen (4) en(' Polangds(s and and Galicia(4 Districts
(1) In the Kielce district, the soil is only fair; in the Lublin and San- domierz districts, very rich. (2) There is rich alluvial soil near the mouth of the Vistula. 3 All gradations of soil from very rich to very poor. (4) In Podolia, very rich soil, of the Ukrainian " black-earth " type; in the Carpathian foothills, poor soil. (3) The season I92I-2 has been the first real season in these districts since the Bolshevik invasion.
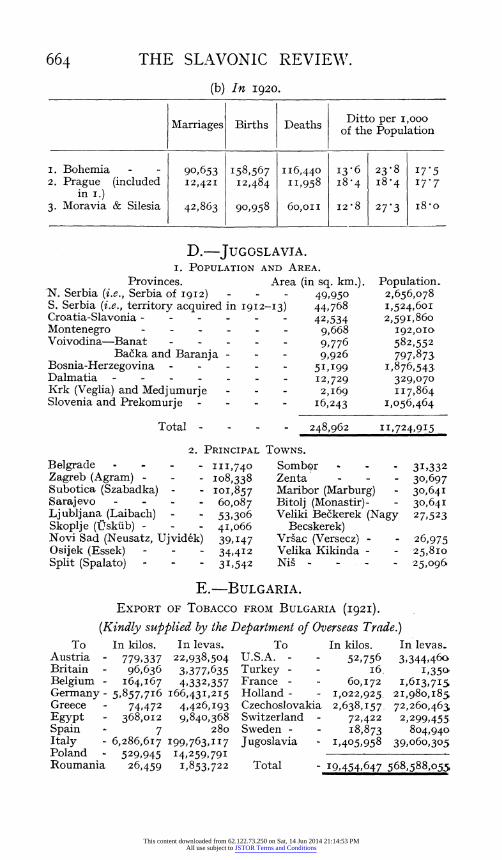
C.-CZECHOSLOVAKIA. GROWTH OF POPULATION IN BOHEMIA-MORAVIA-SILESIA.1
Marriages Births Deaths Ditto per i,ooo, of the Population
I. Bohemia - 90,653 I58,567 II6,440 I3.6 23.8 I 7.5 2. Prague (included I2,421 I 2,484 I I,958 I8.4 I8.4 I 7.7
in I.) 3. Moravia & Silesia 42,863 90,958 6o,oI I I2-8 27 3 i8 o,
D.-JUGOSLAVIA. I. POPULATION AND AREA.
Provinces. Area (in sq. km.). Population. N. Serbia (i.e., Serbia of 19I2) - - - 49,950 2,656,078 S. Serbia (i.e., territory acquired in I9I2-13) 44,768 I,524,60I Croatia-Slavonia - - - 42,534 2,59I,860 Montenegro - - - - - - 9,668 I92,010 Voivodina-Banat - - - 9,776 582,552