United States Department of Agriculture Economic Research Service Economic Information Bulletin Number 102 November 2012 Assessing the Healthfulness of Consumers’ Grocery Purchases Richard Volpe and Abigail Okrent
Transcript
United States Department of Agriculture
Economic Research Service
Economic Information Bulletin Number 102
November 2012
Assessing the Healthfulness of Consumers’ Grocery Purchases
Richard Volpe and Abigail Okrent
The U.S. Department of Agriculture (USDA) prohibits discrimination in all its programs and activities on the basis of race, color, national origin, age, disability, and, where applicable, sex, marital status, familial status, parental status, religion, sexual orientation, genetic information, political beliefs, reprisal, or because all or a part of an individual's income is derived from any public assistance program. (Not all prohibited bases apply to all programs.) Persons with disabilities who require alternative means for communication of program information (Braille, large print, audiotape, etc.) should contact USDA's TARGET Center at (202) 720-2600 (voice and TDD).
To file a complaint of discrimination write to USDA, Director, Office of Civil Rights, 1400 Independence Avenue, S.W., Washington, D.C. 20250-9410 or call (800) 795-3272 (voice) or (202) 720-6382 (TDD). USDA is an equal opportunity provider and employer.
Recommended citation format for this publication:
Volpe, Richard, and Abigail Okrent. Assessing the Healthfulness of Consumers’ Grocery Purchases, EIB-102, U.S. Department of Agriculture, Economic Research Service, November 2012.
Photo: Thinkstock.
ww
ww
w.wwer
sr .usda.govoo
Visit Our Website To Learn More!
www.ers.usda.gov
United StatesDepartmentof Agriculture
www.ers.usda.gov
A Report from the Economic Research Service
Abstract
The nutritional quality of Americans’ diets has increasingly become a focus of economic research due to its effects on health outcomes. Health care and other costs associated with obesity, overweight, diabetes, and other diet-related ailments continue to swell. This study focuses on consumers’ grocery (food-at-home) expenditures to measure the extent to which Americans are conforming to Dietary Guidelines for Americans with the foods they purchase at the supermarket. Overall, consumers purchase too few fruits, vegetables, and whole grains and too many refined grains, fats, and sugars/sweets. The average Healthy Eating Index score for food-at-home purchases was only 56.4 for an average consumer, far below the maximum score of 100, which would indicate full adher-ence to the Dietary Guidelines. The healthfulness of purchases varies somewhat across geographic regions and markets, with consumers in the Northeast and West purchasing more healthful food than consumers in the Midwest or South. Differences across income levels and across race are small, with all subgroups falling well short of the recommenda-tions in the Dietary Guidelines.
The authors wish to thank Ephraim Leibtag, Abebayehu Tegene, Andi Carlson, Mark Lino, Timothy Park, Laurian Unnevehr, Elise Golan, Jill Reedy, Ted Jaenicke, and an anonymous reviewer for their help and advice with this report. The authors gratefully acknowledge Dr. Mark Lino for providing the weekly dollar cost estimates, which are not available in the CNPP publications. The authors also thank Dale Simms and Wynnice Pointer-Napper for editorial and design assistance.
Assessing the Healthfulness of Consumers’ Grocery Purchases
NHANES National Health and Nutrition Examination Survey
Errata
On December 18, 2012, Appendix Table 5 was corrected to reflect a layout error that repeated rows 7-14 and omitted rows 15-20 . The corrected table now has the previously missing rows (15-20) and rows 7-14 are no longer repeated .
iii Assessing the Healthfulness of Consumers’ Grocery Purchases / EIB-102
Economic Research Service/USDA
Summary
What Is the Issue?
Nutritionists, healthcare providers, and policymakers seek solutions to the ongoing proliferation of obesity, overweight, and other health-related concerns that can be linked, in part, to diet quality. Some recent studies have illustrated the deleterious effects of food away from home (FAFH) on Americans’ diets, but food choices made by consumers when grocery shop-ping may also affect diet quality. This report measures the extent to which U.S. consumers are adhering to the Dietary Guidelines for Americans (DGA) with their food-at-home (FAH) purchases and the role of selected demo-graphic and market factors on food purchase healthfulness.
What Did the Study Find?
Overall, Americans have a long way to go in conforming to dietary guide-lines with their FAH purchases. Very few households meet the guidelines when food shopping.
•Consumerspurchasetoofewfruits,vegetables,andwholegrainsandtoomany refined grains, fats, and added sugars.
•Theaverage2005HealthyEatingIndexscoreforfood-at-homepurchaseswas 56.4, far below the maximum score of 100, which would indicate perfect adherence to the 2005 Dietary Guidelines.
•Thehealthfulnessoftheaverageconsumerfoodshoppingbasketdidnotimprove noticeably between 1998 and 2006. Households shifted from refined grains toward whole grains, but allocate less of their food budgets to fruits and vegetables and more toward processed and packaged foods.
Although food purchase behavior varies across some demographic and market segments, all subgroups fall short of meeting the Guidelines:
•Whencomparingconsumersacrossregionsofthecountry,thoseinthe Northeast and West typically purchase more healthful food than consumers in the Midwest or South.
•Higherincomeshoppers,onaverage,purchaseslightlymorehealthfulfood than do lower income shoppers.
•Intermsofdifferencesacrossraces,WhitesandAsianstypicallypurchasemore healthful foods than Blacks and other non-Asian minorities.
•Marketconcentration,definedbythenumberandsizeofretailerswithinamarket, has a very small negative effect on the healthfulness of consumers’ food purchases.
How Was the Study Conducted?
This study uses self-reported purchase data from the Nielsen Homescan data-base for the years 1998 through 2006. To facilitate the analysis of a data set featuring millions of purchase records, we use aggregate categories from the
iv Assessing the Healthfulness of Consumers’ Grocery Purchases / EIB-102
Economic Research Service/USDA
QuarterlyFood-at-HomePriceDatabase,whichorganizestheHomescandatainto major food groups. Our healthfulness measures rely upon the Liberal Food Plan recommendations from the USDA Center for Nutrition Policy and Promotion as well as the USDA 2005 Healthy Eating Index.
1 Assessing the Healthfulness of Consumers’ Grocery Purchases / EIB-102
Economic Research Service/USDA
Introduction
Many of the most prevalent and costly health issues in the United States today can be attributed, in varying degrees, to diet quality. These include obesity, overweight, cardiovascular diseases, and diabetes. Americans eat fewer fruits and vegetables than recommended and more fats, added sugars, and calories than recommended (Krebs-Smith et al., 2010). Accordingly, a great deal of economic research has examined consumers’ demand and preferences, as well as the general food environment, to understand how the average American diet can better conform to healthy eating guidelines.
Dietary quality is defined generally as adherence to the Dietary Guidelines for Americans (DGA), a joint product of USDA and the U.S. Department of Health and Human Services (see CNPP (2010) for complete details). Recent research has suggested that food away from home (FAFH) is generally less healthful than food at home (FAH). As consumers spend more of their food dollars on FAFH or get more of their total calories from FAFH, their overall dietary quality tends to decrease. Mancino and Kinsey (2008) found that increases in FAFH consumption lead to the intake of more total calories and lower overall dietary quality. Also, food away from home has been linked to excess calorie consumption and decreased consumption of fruits, vegetables, and whole grains for adults (Todd, Mancino, and Lin, 2010) as well as chil-dren (Mancino et al., 2010). Gregory et al. (2011) showed that consumers who eat more FAFH are less likely to rate their own dietary quality favorably.
The breadth of evidence suggesting that FAFH is less healthful, however, does not imply that the quality of Americans’ FAH purchasing habits is meeting recommendations. The Bureau of Labor Statistics reports that Americans spend 61 percent of their food dollars on FAH, compared to 39 percent on FAFH.1 Hence, the extent to which consumers adhere to the DGA when grocery shopping will also influence dietary quality.
A common approach among researchers examining diet quality is to focus on single product categories or nutrients that have established implications for diet quality and health outcomes. Bertail and Caillavet (2008) and Richards and Patterson (2005) focused on fruit and vegetable consumption, Mancino et al. (2008) and Lin and Yen (2008) studied whole grains, and Barros (2008) looked at added sugars. Each of these studies operate on the implicit assump-tion that increasing the intake of more healthful foods (DGA recommended to increase) or decreasing the intake of less healthful foods (DGA recom-mended in moderation) improves dietary quality and overall health.
However, policy analysis based on targeting consumption of one food or nutrient ignores the potential unintended consequences of changes in consumption of foods and nutrients excluded from the analysis. Policies designed to decrease obesity may not be fully informed due to the limited scope of these studies. For example, Okrent and Alston (2011) found that while a price decrease for fruits and vegetables would increase their consumption—with implied benefits from greater fiber and micronutrient intake—overall calorie consumption per U.S. adult would also increase, causing average bodyweight to swell. Similarly, Lakdawalla et al. (2005) found that an increase in the price of hamburger, which is a high-fat food,
1According to the latest relative importance weights of the Consumer Price Index, released December 2011.
2 Assessing the Healthfulness of Consumers’ Grocery Purchases / EIB-102
Economic Research Service/USDA
has a negative effect on the intake of iron and that an increase in the price of orange juice, which is a high-calorie beverage, leads to deficiencies in folate and vitamin C. Hence, a measure of healthfulness that accounts for the overall change in nutrient and calorie intake would be a useful enhancement to the literature.
Our strategy, therefore, in studying and measuring the healthfulness of consumer food choices focuses on total food purchases (the methodology could also be applied to consumption baskets, given data availability). We develop and apply three approaches for empirically assessing the extent to which consumers’ food shopping conforms to USDA recommendations. Depending on the data available to researchers, one of these methods may be more viable than the others, or several methods may be used for more robust findings. We apply these methods to the Nielsen Homescan data to examine the healthfulness of American FAH purchases as it varies according to demographic factors, including race and income, geographic region, and market conditions.
3 Assessing the Healthfulness of Consumers’ Grocery Purchases / EIB-102
Economic Research Service/USDA
Data
We use the 1998-2006 Nielsen Homescan data to measure consumer expen-ditures by food category for our analysis.2 The Homescan dataset consists of the self-scanned food purchases of a sample of U.S. households who are asked to record the complete purchases of each shopping trip by scanning Universal Product Codes (UPCs). The sample includes detailed information on product names and characteristics as well as household demographics.
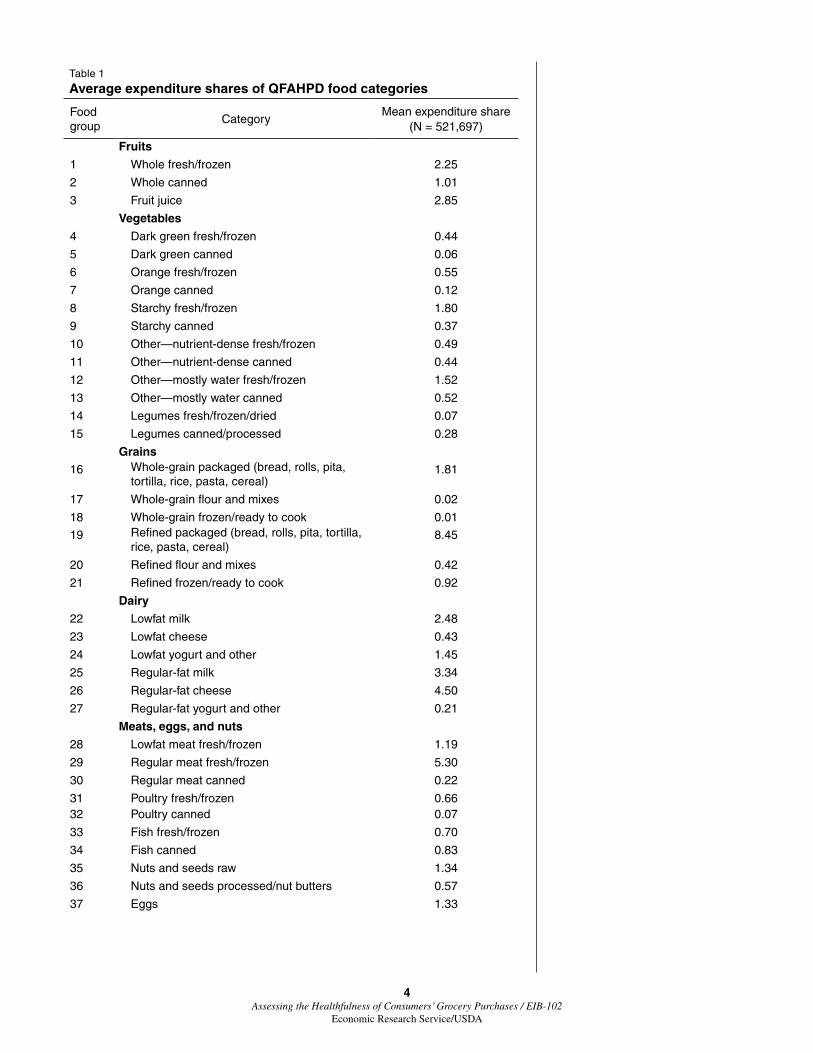
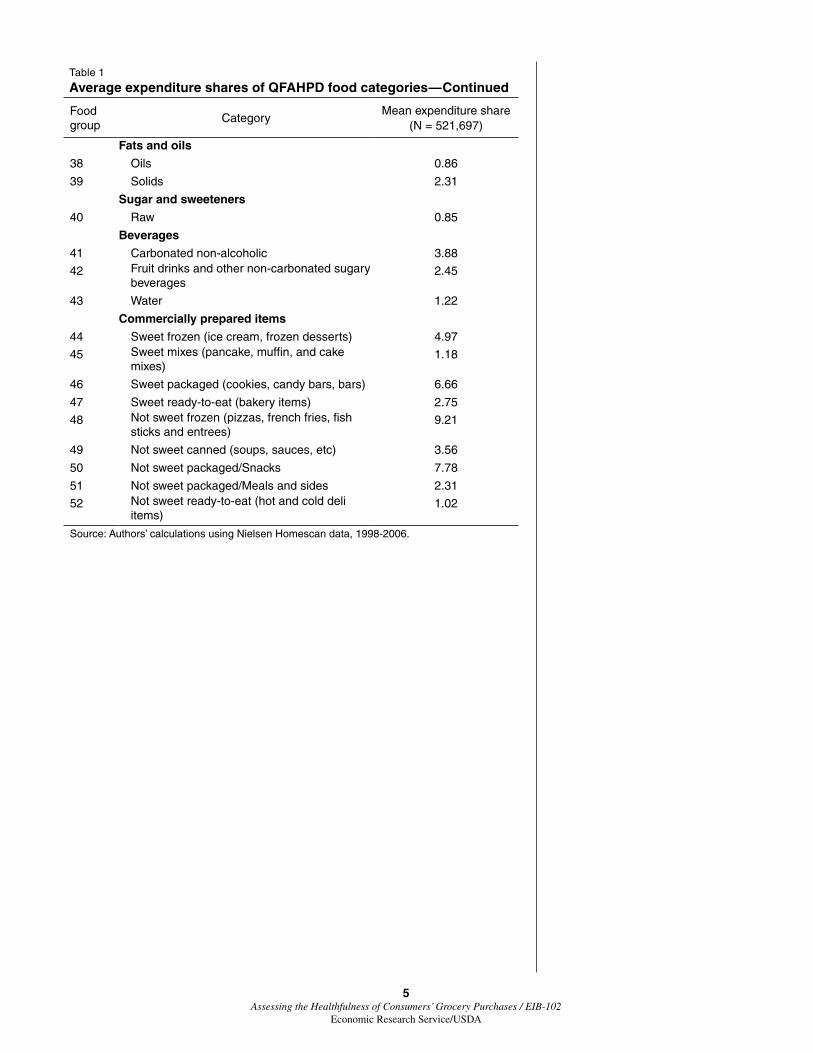
WeorganizetheHomescandata,whichincludethousandsofdifferentprod-ucts, into larger food groups that are tractable for comparison. The Quarterly Food at Home Price Database (QFAHPD) provides an excellent starting point because it aggregates the 600+ broad Nielsen food categories into 52 food groups based on the 2005 DGA.3 These food groups form the basis of our analysis and include fruits and vegetables, whole and refined grains, prepared foods, meats, fats, sweeteners, and more (see table 1).
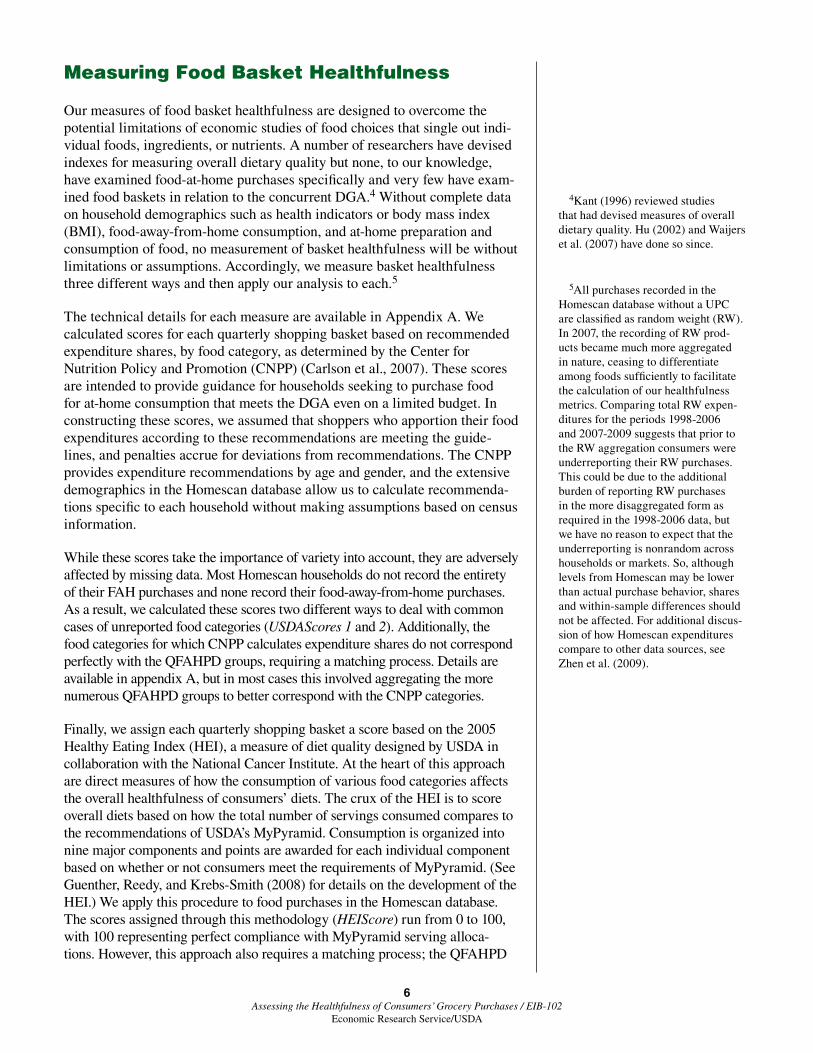
We constructed shopping baskets of total expenditures by Homescan house-hold and quarter. We then calculated expenditure shares for the 52 QFAHPD food groups. Expenditure shares for household I and food group g (g = 1–52) in quarter q (q = 1998Q1-2006Q4) are given by
(1) igqigq 52
igqg 1,
expshare
exp==
∑
where exp is expenditure as reported in the QFAHPD. To illustrate, the row for food group 1 in table 1 is the average household expenditure share spent onwholefreshorfrozenfruitforquarterlyshoppingbaskets.Hence,house-holds responding to the Homescan survey spent an average of 2.25 percent of theirFAHdollarsonfreshorfrozenfruit.
2The time period was selected based on the level of detail in the Homescan data, which changed after 2006. For 2007 and beyond, it is not possible to examine purchase quantities for indi-vidual food products without UPCs.
3See Todd, Mancino, Leibtag, and Tripodo (2010) for more information on QFAHPD methodology.
4 Assessing the Healthfulness of Consumers’ Grocery Purchases / EIB-102
Economic Research Service/USDA
Table 1
Average expenditure shares of QFAHPD food categories
48 Not sweet frozen (pizzas, french fries, fish sticks and entrees)
9.21
49 Not sweet canned (soups, sauces, etc) 3.56
50 Not sweet packaged/Snacks 7.78
51 Not sweet packaged/Meals and sides 2.31
52 Not sweet ready-to-eat (hot and cold deli items)
1.02
Source: Authors’ calculations using Nielsen Homescan data, 1998-2006.
6 Assessing the Healthfulness of Consumers’ Grocery Purchases / EIB-102
Economic Research Service/USDA
Measuring Food Basket Healthfulness
Our measures of food basket healthfulness are designed to overcome the potential limitations of economic studies of food choices that single out indi-vidual foods, ingredients, or nutrients. A number of researchers have devised indexes for measuring overall dietary quality but none, to our knowledge, have examined food-at-home purchases specifically and very few have exam-ined food baskets in relation to the concurrent DGA.4 Without complete data on household demographics such as health indicators or body mass index (BMI), food-away-from-home consumption, and at-home preparation and consumption of food, no measurement of basket healthfulness will be without limitations or assumptions. Accordingly, we measure basket healthfulness three different ways and then apply our analysis to each.5
The technical details for each measure are available in Appendix A. We calculated scores for each quarterly shopping basket based on recommended expenditure shares, by food category, as determined by the Center for Nutrition Policy and Promotion (CNPP) (Carlson et al., 2007). These scores are intended to provide guidance for households seeking to purchase food for at-home consumption that meets the DGA even on a limited budget. In constructing these scores, we assumed that shoppers who apportion their food expenditures according to these recommendations are meeting the guide-lines, and penalties accrue for deviations from recommendations. The CNPP provides expenditure recommendations by age and gender, and the extensive demographics in the Homescan database allow us to calculate recommenda-tions specific to each household without making assumptions based on census information.
While these scores take the importance of variety into account, they are adversely affected by missing data. Most Homescan households do not record the entirety of their FAH purchases and none record their food-away-from-home purchases. As a result, we calculated these scores two different ways to deal with common cases of unreported food categories (USDAScores 1 and 2). Additionally, the food categories for which CNPP calculates expenditure shares do not correspond perfectly with the QFAHPD groups, requiring a matching process. Details are available in appendix A, but in most cases this involved aggregating the more numerous QFAHPD groups to better correspond with the CNPP categories.
Finally, we assign each quarterly shopping basket a score based on the 2005 Healthy Eating Index (HEI), a measure of diet quality designed by USDA in collaboration with the National Cancer Institute. At the heart of this approach are direct measures of how the consumption of various food categories affects the overall healthfulness of consumers’ diets. The crux of the HEI is to score overall diets based on how the total number of servings consumed compares to therecommendationsofUSDA’sMyPyramid.Consumptionisorganizedintonine major components and points are awarded for each individual component based on whether or not consumers meet the requirements of MyPyramid. (See Guenther, Reedy, and Krebs-Smith (2008) for details on the development of the HEI.) We apply this procedure to food purchases in the Homescan database. The scores assigned through this methodology (HEIScore) run from 0 to 100, with 100 representing perfect compliance with MyPyramid serving alloca-tions. However, this approach also requires a matching process; the QFAHPD
4Kant (1996) reviewed studies that had devised measures of overall dietary quality. Hu (2002) and Waijers et al. (2007) have done so since.
5All purchases recorded in the Homescan database without a UPC are classified as random weight (RW). In 2007, the recording of RW prod-ucts became much more aggregated in nature, ceasing to differentiate among foods sufficiently to facilitate the calculation of our healthfulness metrics. Comparing total RW expen-ditures for the periods 1998-2006 and 2007-2009 suggests that prior to the RW aggregation consumers were underreporting their RW purchases. This could be due to the additional burden of reporting RW purchases in the more disaggregated form as required in the 1998-2006 data, but we have no reason to expect that the underreporting is nonrandom across households or markets. So, although levels from Homescan may be lower than actual purchase behavior, shares and within-sample differences should not be affected. For additional discus-sion of how Homescan expenditures compare to other data sources, see Zhen et al. (2009).
7 Assessing the Healthfulness of Consumers’ Grocery Purchases / EIB-102
Economic Research Service/USDA
food groups need to align with those of the National Health and Nutrition Examination Survey (NHANES), as documented in appendix A. Food catego-ries unreported by households are also an issue with HEI scoring.
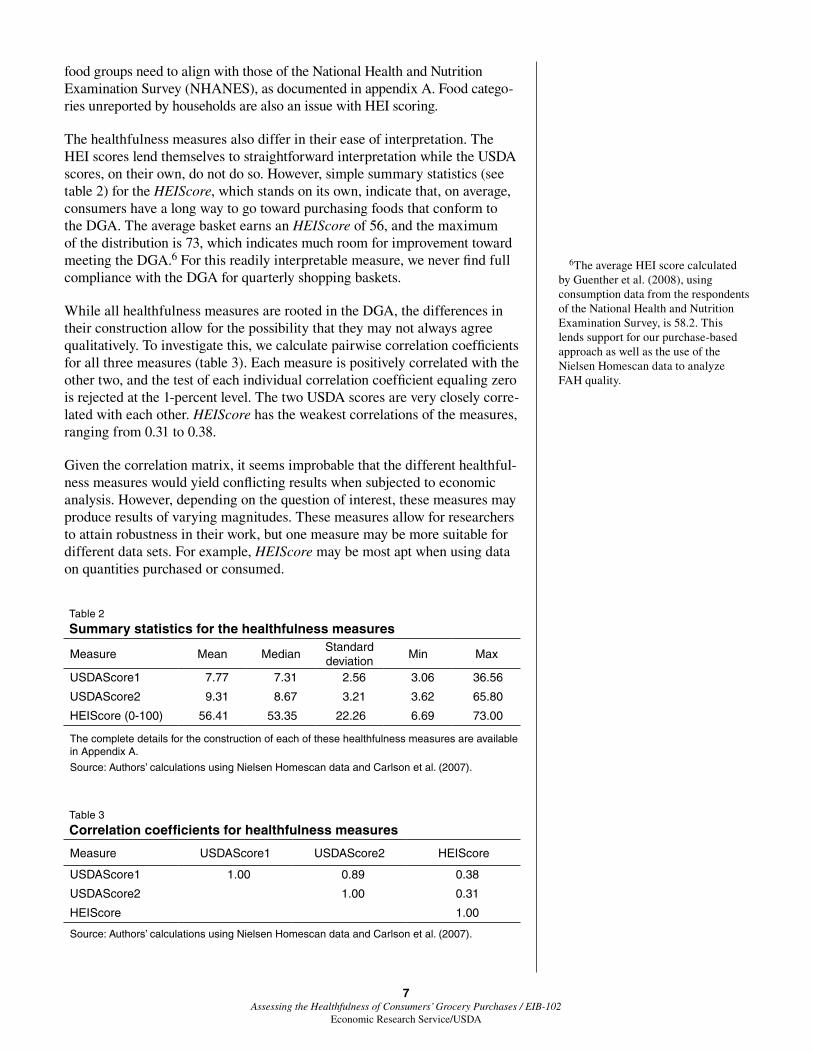
The healthfulness measures also differ in their ease of interpretation. The HEI scores lend themselves to straightforward interpretation while the USDA scores, on their own, do not do so. However, simple summary statistics (see table 2) for the HEIScore, which stands on its own, indicate that, on average, consumers have a long way to go toward purchasing foods that conform to the DGA. The average basket earns an HEIScore of 56, and the maximum of the distribution is 73, which indicates much room for improvement toward meeting the DGA.6 For this readily interpretable measure, we never find full compliance with the DGA for quarterly shopping baskets.
While all healthfulness measures are rooted in the DGA, the differences in their construction allow for the possibility that they may not always agree qualitatively. To investigate this, we calculate pairwise correlation coefficients for all three measures (table 3). Each measure is positively correlated with the othertwo,andthetestofeachindividualcorrelationcoefficientequalingzerois rejected at the 1-percent level. The two USDA scores are very closely corre-lated with each other. HEIScore has the weakest correlations of the measures, ranging from 0.31 to 0.38.
Given the correlation matrix, it seems improbable that the different healthful-ness measures would yield conflicting results when subjected to economic analysis. However, depending on the question of interest, these measures may produce results of varying magnitudes. These measures allow for researchers to attain robustness in their work, but one measure may be more suitable for different data sets. For example, HEIScore may be most apt when using data on quantities purchased or consumed.
6The average HEI score calculated by Guenther et al. (2008), using consumption data from the respondents of the National Health and Nutrition Examination Survey, is 58.2. This lends support for our purchase-based approach as well as the use of the NielsenHomescandatatoanalyzeFAH quality.
Table 2
Summary statistics for the healthfulness measures
Measure Mean MedianStandard deviation
Min Max
USDAScore1 7.77 7.31 2.56 3.06 36.56
USDAScore2 9.31 8.67 3.21 3.62 65.80
HEIScore (0-100) 56.41 53.35 22.26 6.69 73.00
The complete details for the construction of each of these healthfulness measures are available in Appendix A.
Source: Authors’ calculations using Nielsen Homescan data and Carlson et al. (2007).
Table 3
Correlation coefficients for healthfulness measures
Measure USDAScore1 USDAScore2 HEIScore
USDAScore1 1.00 0.89 0.38
USDAScore2 1.00 0.31
HEIScore 1.00
Source: Authors’ calculations using Nielsen Homescan data and Carlson et al. (2007).
8 Assessing the Healthfulness of Consumers’ Grocery Purchases / EIB-102
Economic Research Service/USDA
Assessing Food Purchase Healthfulness Across the Nation
Examining trends and patterns in the FAH healthfulness measures described earlier helps to demonstrate which Americans are most closely abiding by the DGA and where. Such findings can indicate where policy implementa-tion or education and promotion may be most effective or where such efforts are lacking. A solid understanding of the healthfulness of FAH—coupled with a similar analysis of food away from home and the potential interaction between the two—may help to link food purchase and consumption empiri-cally with public health concerns related to obesity and diabetes.
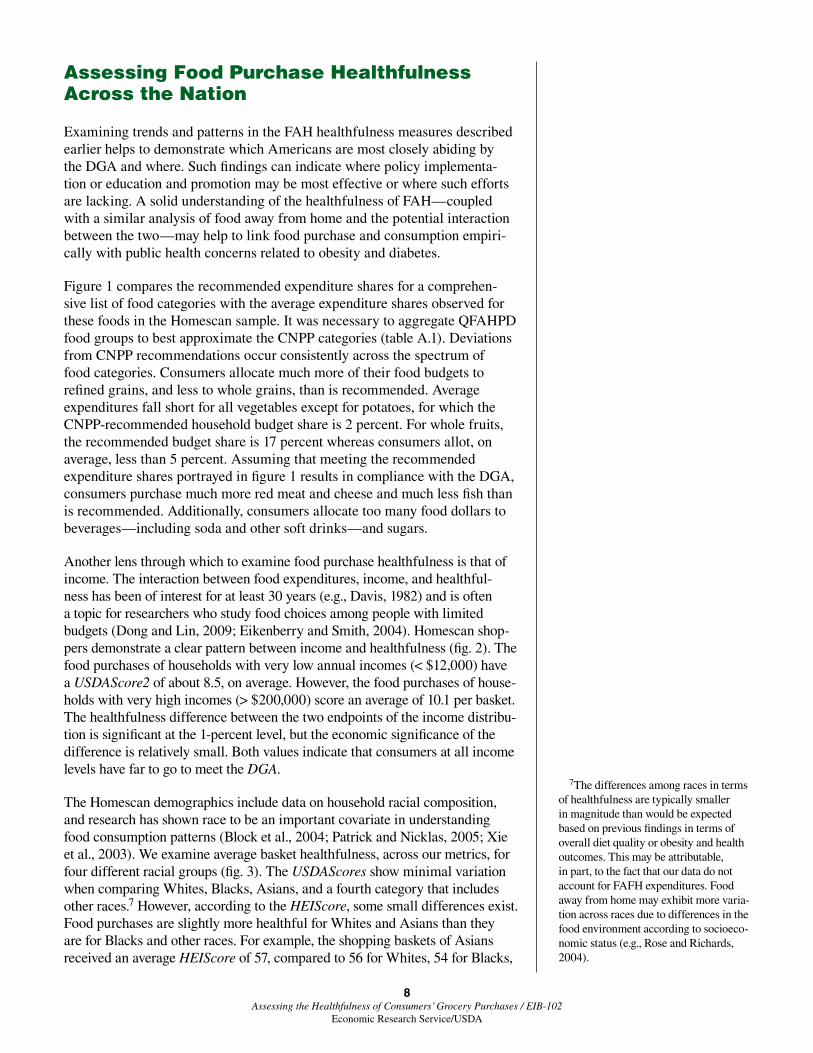
Figure 1 compares the recommended expenditure shares for a comprehen-sive list of food categories with the average expenditure shares observed for these foods in the Homescan sample. It was necessary to aggregate QFAHPD food groups to best approximate the CNPP categories (table A.1). Deviations from CNPP recommendations occur consistently across the spectrum of food categories. Consumers allocate much more of their food budgets to refined grains, and less to whole grains, than is recommended. Average expenditures fall short for all vegetables except for potatoes, for which the CNPP-recommended household budget share is 2 percent. For whole fruits, the recommended budget share is 17 percent whereas consumers allot, on average, less than 5 percent. Assuming that meeting the recommended expenditure shares portrayed in figure 1 results in compliance with the DGA, consumers purchase much more red meat and cheese and much less fish than is recommended. Additionally, consumers allocate too many food dollars to beverages—including soda and other soft drinks—and sugars.
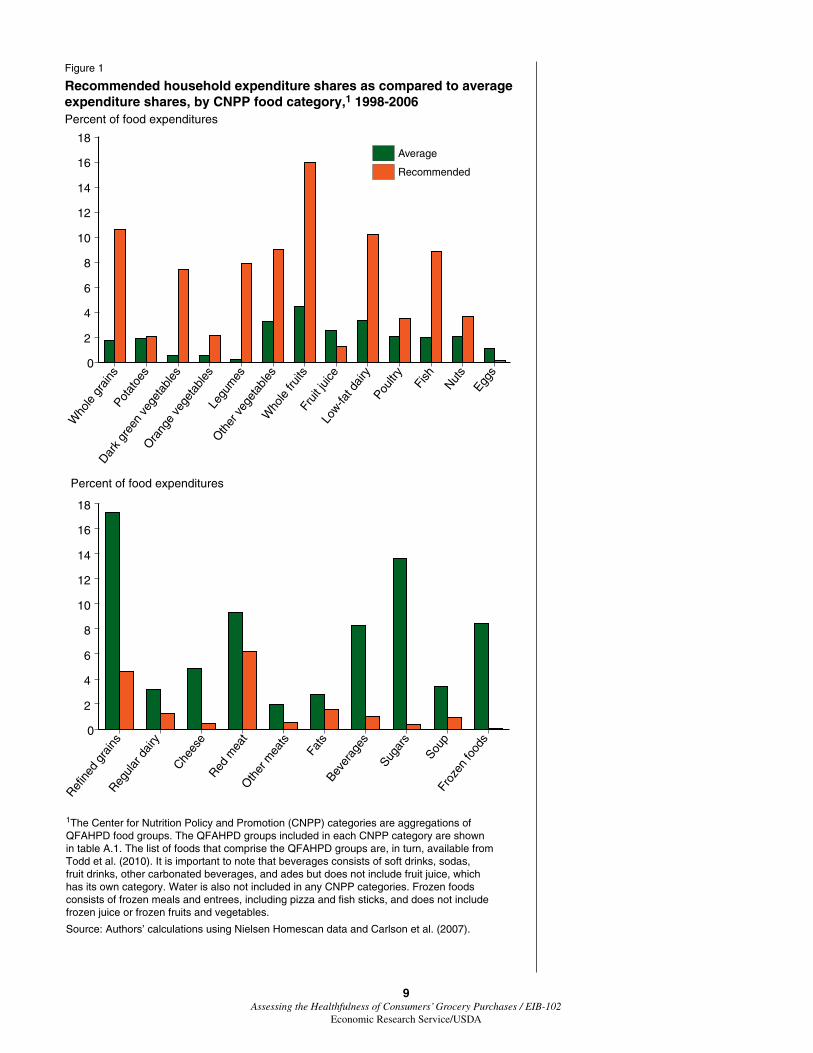
Another lens through which to examine food purchase healthfulness is that of income. The interaction between food expenditures, income, and healthful-ness has been of interest for at least 30 years (e.g., Davis, 1982) and is often a topic for researchers who study food choices among people with limited budgets (Dong and Lin, 2009; Eikenberry and Smith, 2004). Homescan shop-pers demonstrate a clear pattern between income and healthfulness (fig. 2). The food purchases of households with very low annual incomes (< $12,000) have a USDAScore2 of about 8.5, on average. However, the food purchases of house-holds with very high incomes (> $200,000) score an average of 10.1 per basket. The healthfulness difference between the two endpoints of the income distribu-tion is significant at the 1-percent level, but the economic significance of the difference is relatively small. Both values indicate that consumers at all income levels have far to go to meet the DGA.
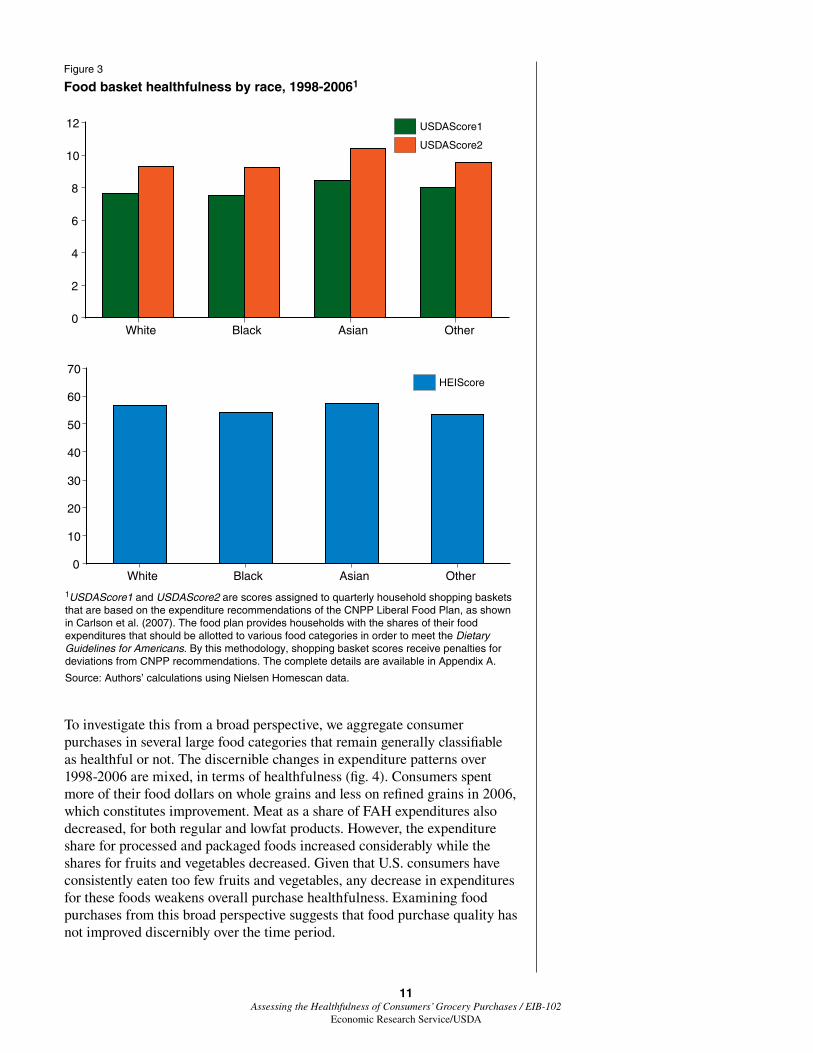
The Homescan demographics include data on household racial composition, and research has shown race to be an important covariate in understanding food consumption patterns (Block et al., 2004; Patrick and Nicklas, 2005; Xie et al., 2003). We examine average basket healthfulness, across our metrics, for four different racial groups (fig. 3). The USDAScores show minimal variation when comparing Whites, Blacks, Asians, and a fourth category that includes other races.7 However, according to the HEIScore, some small differences exist. Food purchases are slightly more healthful for Whites and Asians than they are for Blacks and other races. For example, the shopping baskets of Asians received an average HEIScore of 57, compared to 56 for Whites, 54 for Blacks,
7The differences among races in terms of healthfulness are typically smaller in magnitude than would be expected based on previous findings in terms of overall diet quality or obesity and health outcomes. This may be attributable, in part, to the fact that our data do not account for FAFH expenditures. Food away from home may exhibit more varia-tion across races due to differences in the food environment according to socioeco-nomic status (e.g., Rose and Richards, 2004).
9 Assessing the Healthfulness of Consumers’ Grocery Purchases / EIB-102
Economic Research Service/USDA
Figure 1
Recommended household expenditure shares as compared to average expenditure shares, by CNPP food category,1 1998-2006 Percent of food expenditures
1The Center for Nutrition Policy and Promotion (CNPP) categories are aggregations of QFAHPD food groups. The QFAHPD groups included in each CNPP category are shown in table A.1. The list of foods that comprise the QFAHPD groups are, in turn, available from Todd et al. (2010). It is important to note that beverages consists of soft drinks, sodas, fruit drinks, other carbonated beverages, and ades but does not include fruit juice, which has its own category. Water is also not included in any CNPP categories. Frozen foods consists of frozen meals and entrees, including pizza and fish sticks, and does not include frozen juice or frozen fruits and vegetables.
Source: Authors’ calculations using Nielsen Homescan data and Carlson et al. (2007).
Who
le g
rain
sPot
atoe
s
0
2
4
6
8
10
12
14
16
18
Frui
t jui
ce
Who
le fr
uits
Oth
er v
eget
able
s
Legu
mes
Ora
nge
vege
tabl
es
Dark
gree
n ve
geta
bles
Fish
Nuts
Eggs
Poultr
y
Low-fa
t dai
ry
Refin
ed g
rain
sReg
ular
dai
ry
Chees
eRed
mea
tO
ther
mea
ts
Fats
Bever
ages
Sugar
s
Soup
Froz
en fo
ods
0
2
4
6
8
10
12
14
16
18
Percent of food expenditures
Recommended
Average
10 Assessing the Healthfulness of Consumers’ Grocery Purchases / EIB-102
Economic Research Service/USDA
and 53 for other races. Average differences across races are significant at the 5-percent level, but as with income the most salient finding in this respect is that all households fall considerably short of meeting the DGA.8
The differences in healthfulness of food purchases across income groups and races are small relative to general gaps between average shopping baskets and DGA-recommended baskets. The inconclusive findings with respect to income groups are perhaps not surprising given that the relationship between income and obesity/BMI is not entirely clear (Chang and Lauderdale, 2005; Wang and Zhang, 2006). The relationship between income and dietary quality is also complex. Lower income households have been shown to consume fewer fruits, vegetables, and whole grains, but there seems to be no overall difference in calories consumed or macronutrient intake among income levels (Darmon and Drewnowski, 2008). However, there are highly significant differences across races in obesity and BMI (Ogden et al., 2006), which suggests that factors such as FAFH purchases and exercise are also important drivers of these differences.
Having data from 1998 to 2006 allows us to investigate how food purchasing habits may have changed over time. Evolving research on health and nutrition affects consumers’ understanding of healthful eating. Moreover, the super-market industry is constantly evolving, updating its product offerings and promotional tactics. Hence, there is reason to anticipate changes in aggregate FAH purchasing patterns over time.
8Given that most races vary in concentration across geographic markets, future research might inves-tigate the extent to which tastes and preferences versus market conditions, such as prevailing store formats or food prices, are driving these small differ-ences across races.
Figure 2
Average USDAScore2 for shopping baskets by household income, 1998-20061 USDA score
1USDAScore2 is a score assigned to quarterly household shopping baskets that is based on the expenditure recommendations of the CNPP Liberal Food Plan, as shown in Carlson et al. (2007). The food plan provides households with the shares of their food expenditures that should be allotted to various food categories in order to meet the Dietary Guidelines for Americans. By this methodology, shopping basket scores receive penalties for deviations from CNPP recommendations. In our data, USDAScore2 ranges from 3 to 65 depending on the specific household purchase basket. The complete details are available in Appendix A.
Source: Authors’ calculations using Nielsen Homescan data, 1998-2006.
11 Assessing the Healthfulness of Consumers’ Grocery Purchases / EIB-102
Economic Research Service/USDA
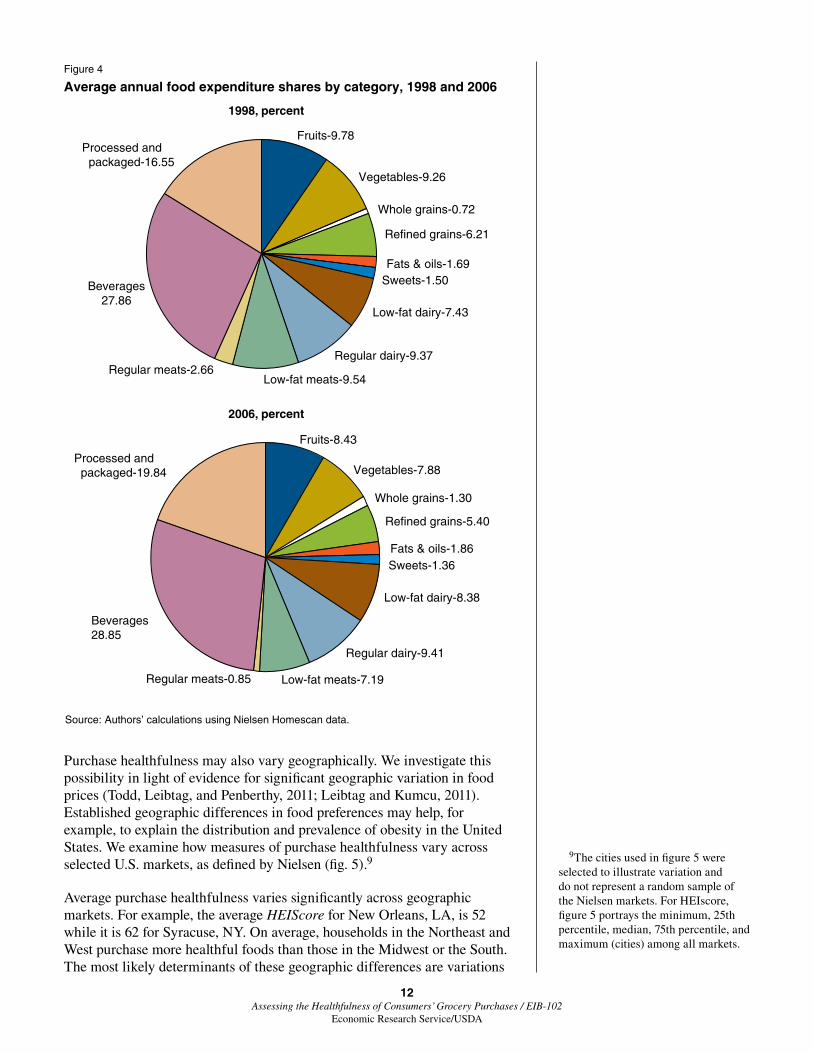
To investigate this from a broad perspective, we aggregate consumer purchases in several large food categories that remain generally classifiable as healthful or not. The discernible changes in expenditure patterns over 1998-2006 are mixed, in terms of healthfulness (fig. 4). Consumers spent more of their food dollars on whole grains and less on refined grains in 2006, which constitutes improvement. Meat as a share of FAH expenditures also decreased, for both regular and lowfat products. However, the expenditure share for processed and packaged foods increased considerably while the shares for fruits and vegetables decreased. Given that U.S. consumers have consistently eaten too few fruits and vegetables, any decrease in expenditures for these foods weakens overall purchase healthfulness. Examining food purchases from this broad perspective suggests that food purchase quality has not improved discernibly over the time period.
Figure 3
Food basket healthfulness by race, 1998-20061
1USDAScore1 and USDAScore2 are scores assigned to quarterly household shopping baskets that are based on the expenditure recommendations of the CNPP Liberal Food Plan, as shown in Carlson et al. (2007). The food plan provides households with the shares of their food expenditures that should be allotted to various food categories in order to meet the Dietary Guidelines for Americans. By this methodology, shopping basket scores receive penalties for deviations from CNPP recommendations. The complete details are available in Appendix A.
Source: Authors’ calculations using Nielsen Homescan data.
USDAScore2
USDAScore1
White Black Asian Other0
2
4
6
8
10
12
White Black Asian Other0
10
20
30
40
50
60
70HEIScore
12 Assessing the Healthfulness of Consumers’ Grocery Purchases / EIB-102
Economic Research Service/USDA
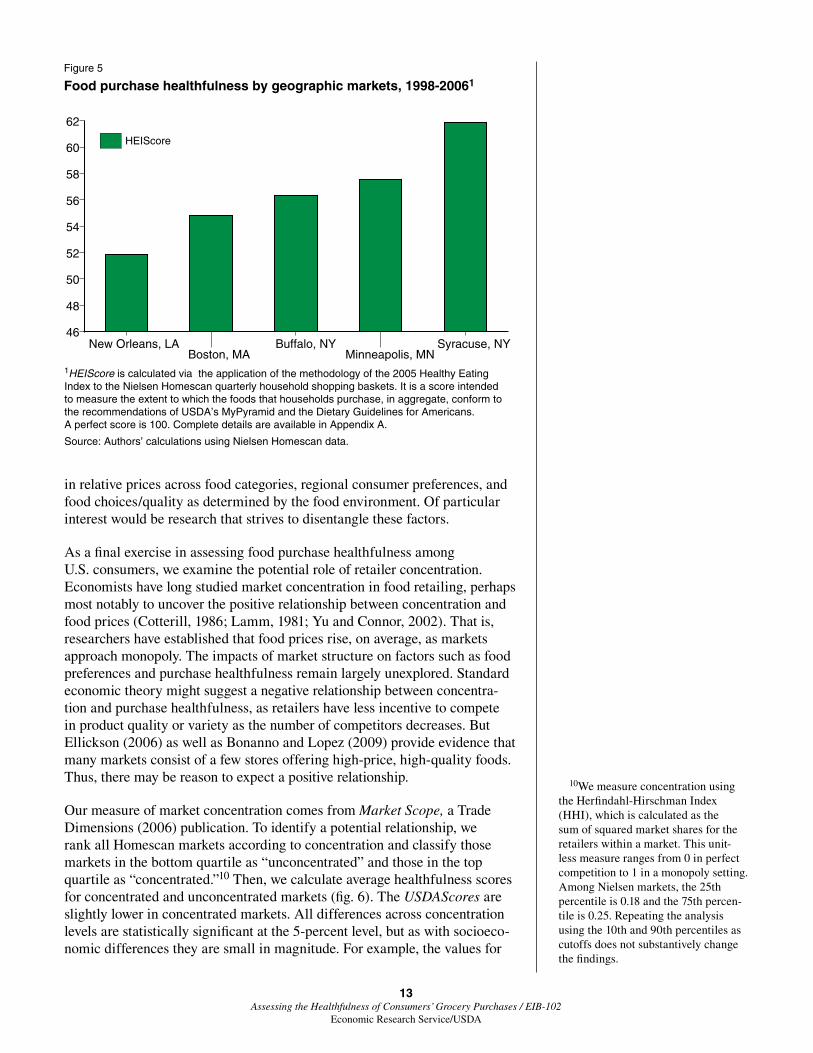
Purchase healthfulness may also vary geographically. We investigate this possibility in light of evidence for significant geographic variation in food prices (Todd, Leibtag, and Penberthy, 2011; Leibtag and Kumcu, 2011). Established geographic differences in food preferences may help, for example, to explain the distribution and prevalence of obesity in the United States. We examine how measures of purchase healthfulness vary across selected U.S. markets, as defined by Nielsen (fig. 5).9
Average purchase healthfulness varies significantly across geographic markets. For example, the average HEIScore for New Orleans, LA, is 52 while it is 62 for Syracuse, NY. On average, households in the Northeast and West purchase more healthful foods than those in the Midwest or the South. The most likely determinants of these geographic differences are variations
9The cities used in figure 5 were selected to illustrate variation and do not represent a random sample of the Nielsen markets. For HEIscore, figure 5 portrays the minimum, 25th percentile, median, 75th percentile, and maximum (cities) among all markets.
Figure 4
Average annual food expenditure shares by category, 1998 and 2006
Source: Authors’ calculations using Nielsen Homescan data.
Fruits-9.78
Vegetables-9.26
Whole grains-0.72
Refined grains-6.21
Fats & oils-1.69Sweets-1.50
Low-fat dairy-7.43
Regular dairy-9.37
Low-fat meats-9.54Regular meats-2.66
Beverages27.86
Processed and packaged-16.55
Fruits-8.43
Vegetables-7.88
Whole grains-1.30
Refined grains-5.40
Fats & oils-1.86Sweets-1.36
Low-fat dairy-8.38
Regular dairy-9.41
Low-fat meats-7.19Regular meats-0.85
Beverages28.85
Processed and packaged-19.84
1998, percent
2006, percent
13 Assessing the Healthfulness of Consumers’ Grocery Purchases / EIB-102
Economic Research Service/USDA
in relative prices across food categories, regional consumer preferences, and food choices/quality as determined by the food environment. Of particular interest would be research that strives to disentangle these factors.
As a final exercise in assessing food purchase healthfulness among U.S. consumers, we examine the potential role of retailer concentration. Economists have long studied market concentration in food retailing, perhaps most notably to uncover the positive relationship between concentration and food prices (Cotterill, 1986; Lamm, 1981; Yu and Connor, 2002). That is, researchers have established that food prices rise, on average, as markets approach monopoly. The impacts of market structure on factors such as food preferences and purchase healthfulness remain largely unexplored. Standard economic theory might suggest a negative relationship between concentra-tion and purchase healthfulness, as retailers have less incentive to compete in product quality or variety as the number of competitors decreases. But Ellickson(2006)aswellasBonannoandLopez(2009)provideevidencethatmany markets consist of a few stores offering high-price, high-quality foods. Thus, there may be reason to expect a positive relationship.
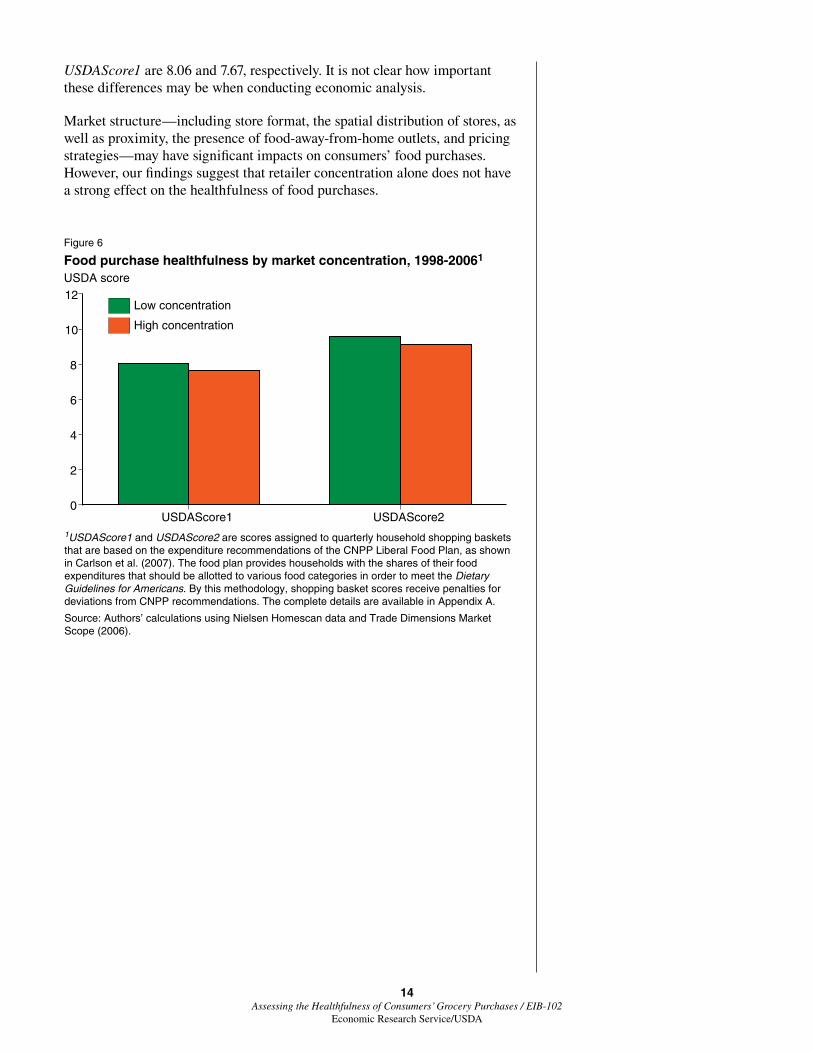
Our measure of market concentration comes from Market Scope, a Trade Dimensions (2006) publication. To identify a potential relationship, we rank all Homescan markets according to concentration and classify those markets in the bottom quartile as “unconcentrated” and those in the top quartile as “concentrated.”10 Then, we calculate average healthfulness scores for concentrated and unconcentrated markets (fig. 6). The USDAScores are slightly lower in concentrated markets. All differences across concentration levels are statistically significant at the 5-percent level, but as with socioeco-nomic differences they are small in magnitude. For example, the values for
10We measure concentration using the Herfindahl-Hirschman Index (HHI), which is calculated as the sum of squared market shares for the retailers within a market. This unit-less measure ranges from 0 in perfect competition to 1 in a monopoly setting. Among Nielsen markets, the 25th percentile is 0.18 and the 75th percen-tile is 0.25. Repeating the analysis using the 10th and 90th percentiles as cutoffs does not substantively change the findings.
Figure 5
Food purchase healthfulness by geographic markets, 1998-20061
1HEIScore is calculated via the application of the methodology of the 2005 Healthy Eating Index to the Nielsen Homescan quarterly household shopping baskets. It is a score intended to measure the extent to which the foods that households purchase, in aggregate, conform to the recommendations of USDA’s MyPyramid and the Dietary Guidelines for Americans. A perfect score is 100. Complete details are available in Appendix A.
Source: Authors’ calculations using Nielsen Homescan data.
New Orleans, LABoston, MA
Buffalo, NYMinneapolis, MN
Syracuse, NY46
48
50
52
54
56
58
60
62
HEIScore
14 Assessing the Healthfulness of Consumers’ Grocery Purchases / EIB-102
Economic Research Service/USDA
USDAScore1 are 8.06 and 7.67, respectively. It is not clear how important these differences may be when conducting economic analysis.
Market structure—including store format, the spatial distribution of stores, as well as proximity, the presence of food-away-from-home outlets, and pricing strategies—may have significant impacts on consumers’ food purchases. However, our findings suggest that retailer concentration alone does not have a strong effect on the healthfulness of food purchases.
Figure 6
Food purchase healthfulness by market concentration, 1998-20061 USDA score
1USDAScore1 and USDAScore2 are scores assigned to quarterly household shopping baskets that are based on the expenditure recommendations of the CNPP Liberal Food Plan, as shown in Carlson et al. (2007). The food plan provides households with the shares of their food expenditures that should be allotted to various food categories in order to meet the Dietary Guidelines for Americans. By this methodology, shopping basket scores receive penalties for deviations from CNPP recommendations. The complete details are available in Appendix A.
Source: Authors’ calculations using Nielsen Homescan data and Trade Dimensions Market Scope (2006).
High concentration
Low concentration
USDAScore1 USDAScore20
2
4
6
8
10
12
15 Assessing the Healthfulness of Consumers’ Grocery Purchases / EIB-102
Economic Research Service/USDA
Discussion and Conclusions
We apply three methods for measuring the healthfulness of consumer food purchases to a national data set of household food purchases in order to assess how well U.S. consumers abide by the Dietary Guidelines for Americans. Our results indicate that consumer purchasing behavior falls far short of what would be considered a healthy diet, rich in fruits and vegetables, whole grains, and lowfat meat and dairy products, while light on added sugars, fats/oils, and most packaged products.
Virtually without exception among food categories, consumers allocate too much of their food budgets to less healthful options and too little to healthful options. We find that the average household falls far short in fruit and vege-table consumption and spends too much on sugars and refined grains. The correlation between income and purchase healthfulness warrants further research on both the food environment and consumer perceptions, particu-larly since healthy food options are typically not more expensive (Carlson andFrazao,2012).Small,butsignificantdifferencesinthehealthfulnessoffood-at-home purchases exist across races, as well as larger differences across geographic markets.
The healthfulness of FAH purchases did not improve from 1998 to 2006. Consumers shifted from refined grains toward whole grains, but have also shifted from fruits and vegetables toward processed and packaged foods.
Since the Nielsen Homescan database contains extensive demographic infor-mation on participating households—many of whom have been participating in the sample for multiple years—a more rigorous, future research using a panel-based approach that examines the determinants of consumers’ deci-sions could be undertaken.
However, the Homescan database is also subject to limitations. We are unable to observe consumers’ food-away-from-home purchases, which necessarily affect overall dietary quality. We also do not have measures of health or phys-ical characteristics such as BMI. Such information would enable the measure-ment of a direct linkage from food purchases to health outcomes. Finally, we are only able to observe the products consumers purchase at retail outlets, not the entire product menu they choose from when shopping. Therefore, we cannot determine the extent to which variations in available product variety or quality may be driving food purchase healthfulness.
To get a fuller picture of the determinants and broader implications of foodpurchasehealthfulness,futureresearchcouldsynthesizeexistingdataresources. For example, the National Health and Nutrition Examination Survey conducted by the Centers for Disease Control and Prevention, while not a panel, includes FAFH in addition to FAH, as well as key physical measure-ments such as BMI. Store-level scanner data can provide information on total product menus, which can be illuminating if linked to household purchase data. Given the economic and sociological impacts of health issues related to dietary quality, the design and implementation of future surveys or data sets on the part of statistical agencies could incorporate the necessary components for drawing better linkages between food purchases and health outcomes.
16 Assessing the Healthfulness of Consumers’ Grocery Purchases / EIB-102
Economic Research Service/USDA
References
Barros, A.R. 2008. “Sugar Prices and High-Fructose Corn Syrup Consumption in the United States,” Journal of Agricultural Economics 43(1): 64-73.
Bertail, P., and F. Caillavet. 2008. “Fruit and Vegetable Consumption Patterns: A Segmentation Approach,” American Journal of Agricultural Economics 90(3): 827-842.
Block, J.P., R.A. Scribner, and K.B. DeSalvo. 2004. “Fast Food, Race/Ethnicity, and Income: A Geographic Analysis,” American Journal of Preventive Medicine 27(3): 211-217.
Bonanno,A.,andR.A.Lopez.2009.“CompetitionEffectsofSupermarketServices,” American Journal of Agricultural Economics 91(3): 555-568.
Carlson,A.,andE.Frazao.2012.Are Healthy Foods Really More Expensive? It Depends on How You Measure the Price. EIB-96, U.S. Department of Agriculture, Economic Research Service, May.
Carlson, A., M. Lino, and T. Fungwe. 2007. The Low-Cost, Moderate-Cost, and Liberal Food Plans. U.S. Department of Agriculture, Center for Nutrition Policy and Promotion.
Center for Nutrition Policy and Promotion. 2010. Dietary Guidelines for Americans, Executive Summary, http://www.cnpp.usda.gov/Publications/DietaryGuidelines/2010/PolicyDoc/ExecSumm.pdf
Centers for Disease Control and Prevention. 2006. National Health and Nutrition Examination Survey, Examination Files, Dietary Interview - Individual Foods, First Day. 2003-04.
Chang, V.W., and D.S. Lauderdale. 2005. “Income Disparities in Body Mass Index and Obesity in the United States, 1971-2002,” Archives of Internal Medicine 165(18), 2122-2128.
Cotterill, R.W. 1986. “Market Power in the Retail Food Industry: Evidence from Vermont,” The Review of Economics and Statistics 68(3): 379-386.
Darmon, N., and A. Drewnowski. 2008. “Does Social Class Predict Diet Quality?” American Journal of Clinical Nutrition 87(5): 1107-1117.
Davis, C.G. 1982. “Linkages between Socioeconomic Characteristics, Food Expenditure Patterns, and Nutritional Status of Low Income Households: A Critical Review,” American Journal of Agricultural Economics 64(5): 1017-1025.
Dong, D., and B. Lin. 2009. Fruit and Vegetable Consumption by Low-Income Americans: Would a Price Reduction Make a Difference? ERR-70, U.S. Department of Agriculture, Economic Research Service, Jan.
17 Assessing the Healthfulness of Consumers’ Grocery Purchases / EIB-102
Economic Research Service/USDA
Eikenberry, N., and C. Smith. 2004. “Healthful Eating: Perceptions, Motivations, Barriers, and Promoters in Low-Income Minnesota Communities,” Journal of the American Dietary Association 104(7): 1158-1161.
Ellickson, P. 2006. Quality Competition in Retailing: A Structural Analysis, International Journal of Industrial Organization 24(3): 521-540.
Gregory, C., T. Smith, and M. Wendt. 2011. How Americans Rate Their Diet Quality: An Increasingly Realistic Perspective, EIB-83, U.S. Department of Agriculture, Economic Research Service, Sept.
Guenther, P.M., J. Reedy, and S.M. Krebs-Smith. 2008. “Development of the Healthy Eating Index,” Journal of the American Dietetic Association 108(11): 1896-1901.
Guenther, P.M., W.Y. Juan, J. Reedy, P. Britten, M. Lino, A. Carlson, H.H.Hiza,andS.M.Krebs-Smith.2008.“DietQualityofAmericansin1994-96 and 2001-02 as Measured by the Healthy Eating Index-2005,” Center for Nutrition Policy and Promotion, Nutrition Insight 37, Aug.
Hu, F.B. 2002. “Dietary Pattern Analysis: A New Direction in Nutritional Epidemiology,” Current Opinion in Lipidology 13(1): 3-9.
Kant, A.K. 1996. “Indexes of Overall Dietary Quality: A Review,” Journal of the American Dietetic Association 96(8): 785-791.
Kinsey, J.D., and B. Bowland. 1999. “How Can the US Food System Deliver Food Products Consistent With the Dietary Guidelines?” Food Policy 24(2): 237-253.
Krebs-Smith, S.M., P.M. Guenther, A.F. Subar, S.I. Kirkpatrick, and K.W. Dodd. 2010. “Americans Do Not Meet Federal Dietary Recommendations,” The Journal of Nutrition 140(10): 1832-1838.
Lakdawalla, D., T.J. Philipson, and J. Bhattacharya. 2005. “Welfare-Enhancing Technological Change and the Growth of Obesity,” American Economic Review 95(2): 253-257.
Lamm, R.M. 1981. “Prices and Concentration in the Food Retailing Industry,” The Journal of Industrial Economics 30(1): 67-78.
Leibtag, E., and A. Kumcu. 2011. The WIC Fruit and Vegetable Cash Voucher: Does Regional Price Variation Affect Buying Power? EIB-75, U.S. Department of Agriculture, Economic Research Service, May.
Lin, B., and S.T. Yen. 2008. “Consumer knowledge, food label use and grain consumption in the US,” Applied Economics 40(4): 437-448.
Mancino, L., and J.D. Kinsey. 2008. Is Dietary Knowledge Enough? Hunger, Stress, and Other Roadblocks to Healthy Eating, ERR-62, U.S. Department of Agriculture, Economic Research Service, Aug.
18 Assessing the Healthfulness of Consumers’ Grocery Purchases / EIB-102
Economic Research Service/USDA
Mancino, L., F. Kuchler, and E. Leibtag. 2008. “Getting Consumers To Eat More Whole-Grains: The Role of Policy, Information, and Food Manufacturers,” Food Policy 33(6): 489-496.
Mancino, L., J.E. Todd, J. Guthrie, and B. Lin. 2010. How Food Away From Home Affects Children’s Diet Quality, ERR-104, U.S. Department of Agriculture, Economic Research Service, Oct.
Ogden, C.L., M.D. Carroll, L.R. Curtin, M.A. McDowell, C.J. Tabak, and K.M. Flegal. 2006. “Prevalence of Overweight and Obesity in the United States, 1999-2004,” The Journal of the American Medical Association 295(13): 1549-1555.
Okrent, A.M., and J.M. Alston. 2011. “The Effects of Farm Commodity and Retail Food Policies on Obesity and Economic Welfare in the United States,” American Journal of Agricultural Economics 94(3): 611-646.
Patrick, H., and T.A. Nicklas. 2005. “A Review of Family and Social Determinants of Children’s Eating Patterns and Diet Quality,” Journal of the American College of Nutrition 24(2): 83-92.
Reedy, J., S.M. Krebs-Smith, and C. Bosire. 2010. “Evaluating the Food Environment: Application of the Healthy Eating Index-2005,” American Journal of Preventive Medicine 38(5): 465-471.
Richards, T.J., and P.M. Patterson. 2005. “A Bilateral Comparison of Fruit and Vegetable Consumption: United States and Canada,” Journal of Agricultural and Resource Economics 30(2): 333-349.
Rose, D., and R. Richards. 2004. “Food Store Access and Household Fruit and Vegetable Use Among Participants in the US Food Stamp Program,” Public Health Nutrition 7(8): 1081-1088.
Todd, J.E., E. Leibtag, and C. Penberthy. 2011. Geographic Differences in the Relative Prices of Healthy Foods, EIB-78, U.S. Department of Agriculture, Economic Research Service, June.
Todd, J.E., L. Mancino, E. Leibtag, and C. Tripodo. 2010. Methodology Behind the Quarterly Food-at-Home Price Database, TB-1926. U.S. Department of Agriculture, Economic Research Service.
Todd, J.E., L. Mancino, and B. Lin. 2010. The Impact of Food Away from Home on Adult Diet Quality, ERR-90. U.S. Department of Agriculture, Economic Research Service, Feb.
Trade Dimensions. 2006. Market Scope.
U.S. Department of Agriculture. 2010. Healthy Eating Index–2005 Development and Evaluation Technical Support Files, 2010, Center for Nutrition Policy and Promotion.
U.S. Department of Agriculture. 2003. Agriculture Fact Book, 2001-2002.
19 Assessing the Healthfulness of Consumers’ Grocery Purchases / EIB-102
Economic Research Service/USDA
Waijers, P.M., E.J. Feskens, and M.C. Ocke. 2007. “A Critical Review of Predefined Diet Quality Scores,” British Journal of Nutrition 97(2): 219-231.
Wang, Y., and Q. Zhang. 2006. “Are American Children and Adolescents of Low Socioeconomic Status at Increased Risk of Obesity? Changes in the Association between Overweight and Family Income between 1971 and 2002,” American Journal of Clinical Nutrition 84(4): 707-716.
Xie, B., F.D. Gilliland, Y. Ly, and H.R. Rockett. 2003. “Effects of Ethnicity, Family Income, and Education on Dietary Intake among Adolescents,” Preventive Medicine 36(1): 30-40.
Yu, C., and J.M. Connor. 2002. “The Price-Concentration Relationship in Retailing: Retesting Newmark,” Agribusiness 18(4): 413-426.
Zhen, C., J.L. Taylor, M.K. Muth, and E. Leibtag. 2009. “Understanding Differences in Self-Reported Expenditures between Household Scanner Data and Diary Survey Data: A Comparison of Homescan and Consumer Expenditure Survey,” Review of Agricultural Economics 31(3):470-492.
20 Assessing the Healthfulness of Consumers’ Grocery Purchases / EIB-102
Economic Research Service/USDA
Appendix A: Methodology for Measuring Food Purchase Healthfulness
Method 1: Scoring Based on CNPP Expenditure Recommendations
The USDA’s Center for Nutrition Policy and Promotion (CNPP) calculates food plans to assist Americans in allocating their food budgets to meet the DGA. Assuming a close relationship between food purchases and food consumption, these food plans provide a framework for measuring basket healthfulness to compare expenditure shares directly. The CNPP report provides separate food plans for consumers with food expenditures in the second quartile of the United States (Low Cost), the third quartile (Moderate Cost), and upper quartile (Liberal). Since we are unable to accurately measure the total food expenditures for the households in our data, we rely on the Liberal Food Plan as our basis for comparison.1
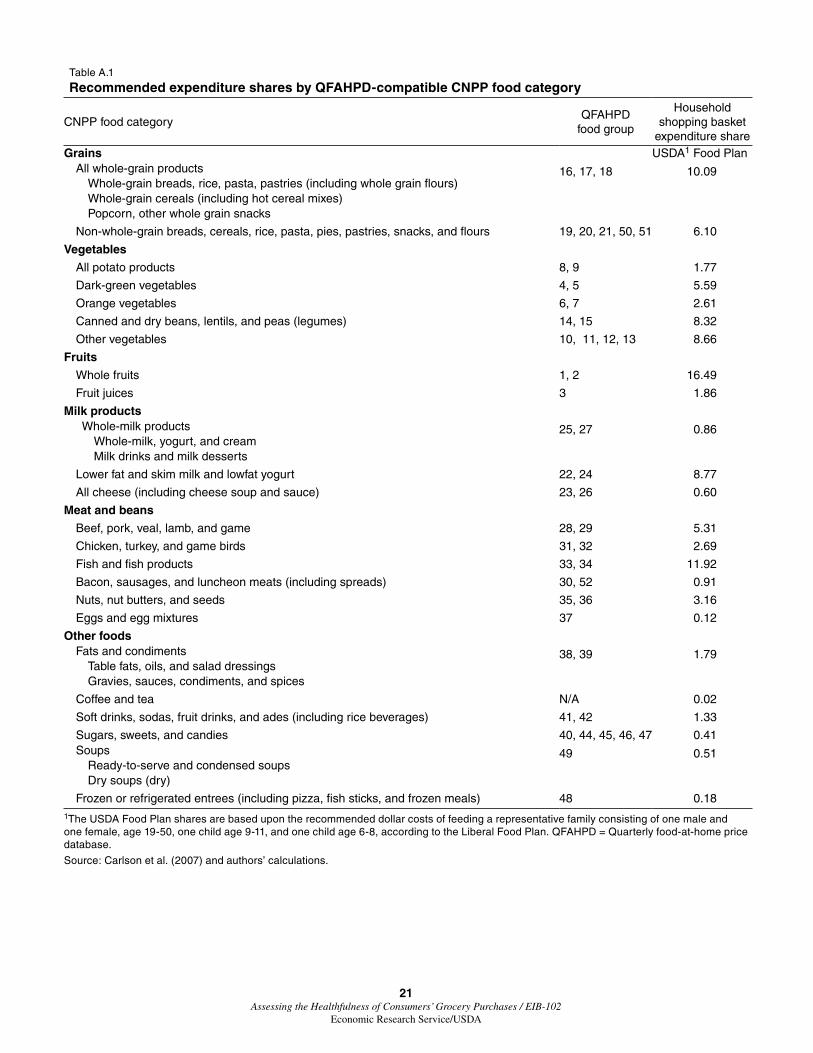
The recommended expenditure shares pertain to food categories that do not match up perfectly with the QFAHPD food groups. We applied some degree ofaggregationtobothorganizationalschemesinordertofacilitatecompat-ibility (table A.1). In addition to combining food classifications within both systems, we used the USDA food plans to calculate recommended expendi-ture shares for households, rather than for individuals, in order to best facili-tate measurements on Homescan household baskets. To do so, we began with the CNPP estimates of the weekly recommended dollar costs of feeding men, women, and children of all ages, by food category. From these values, it is possible to calculate total recommended food expenditure as well as optimal expenditure shares tailored for individual families, based on their demo-graphic composition. As a basis for comparison, we calculated total weekly FAH costs for a representative American family, as defined by the USDA Thrifty Food Plan (TFP). Such a family consists of one male, age 19-50; one female, age 19-50; and two children, age 9-11 and 6-8. From total dollar costs, by food category, we calculated household-level recommended expen-diture shares, as reported in the third column of table A.1.
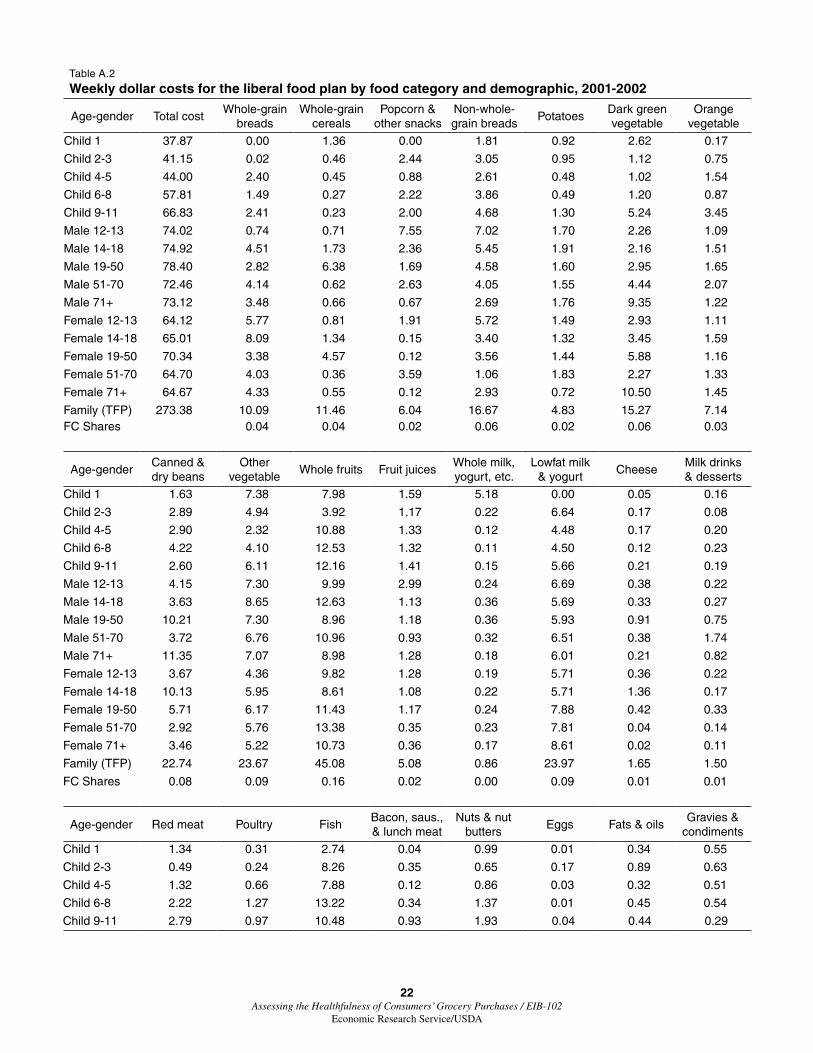
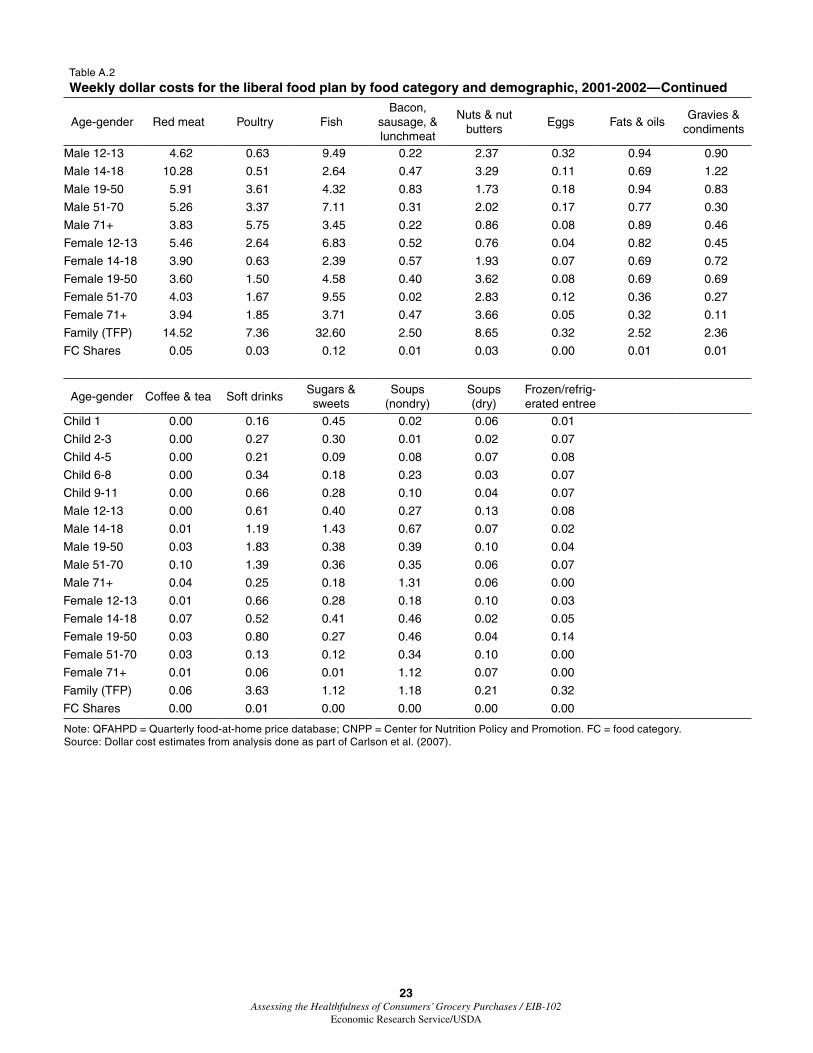
Homescan households report the presence and age of male and female heads of household as well as the presence and age of children. With such information, we are able to calculate USDA-recommended total food expenditures as well as individual expenditure shares for every family in the data. To calculate house-hold-specific recommended expenditure shares, we used the average weekly dollar costs, by food category and age-gender group (table A.2). Fortunately for our purposes, the prices used by CNPP to calculate weekly costs are drawn from the 2001 and 2002 Nielsen Homescan panels. Therefore, CNPP relied on the same relative prices among food groups to calculate expenditure shares as those faced by the consumers in our data. Table A.1 includes recommended expenditure shares for the TFP representative family. Recall that the TFP family consists of a male and female age 19-50 and two children, age 9-11 and 6-8. Hence, the total weekly food expenditure for the TFP family is $273.38. Using this value as a denominator, we then calculate the USDA-recommended expenditure shares for each food category.
RecognizingthattheTFPfamilymaynotberepresentativeofthosehouse-holds in the Homescan database, we use the demographic information
1We selected the Liberal plan as the average household income in the Homescan data from 1998 to 2006 was $47,300, as compared to the median household income in the United States, according to the Census, of $45,018 as of 2003. Thus, households in the data are likely to have higher incomes than the population at large. However, the relative expenditure shares for the various food categories compiled by CNPP are very similar across food plans. Using the Low-Cost or Moderate-Cost food plans does not change the findings substantively.
21 Assessing the Healthfulness of Consumers’ Grocery Purchases / EIB-102
Economic Research Service/USDA
Table A.1
Recommended expenditure shares by QFAHPD-compatible CNPP food category
CNPP food category QFAHPD
food group
Household shopping basket
expenditure shareGrains USDA1 Food Plan
All whole-grain productsWhole-grain breads, rice, pasta, pastries (including whole grain flours) Whole-grain cereals (including hot cereal mixes)Popcorn, other whole grain snacks
Canned and dry beans, lentils, and peas (legumes) 14, 15 8.32
Other vegetables 10, 11, 12, 13 8.66
Fruits
Whole fruits 1, 2 16.49
Fruit juices 3 1.86
Milk productsWhole-milk products
Whole-milk, yogurt, and cream Milk drinks and milk desserts
25, 27 0.86
Lower fat and skim milk and lowfat yogurt 22, 24 8.77
All cheese (including cheese soup and sauce) 23, 26 0.60
Meat and beans
Beef, pork, veal, lamb, and game 28, 29 5.31
Chicken, turkey, and game birds 31, 32 2.69
Fish and fish products 33, 34 11.92
Bacon, sausages, and luncheon meats (including spreads) 30, 52 0.91
Nuts, nut butters, and seeds 35, 36 3.16
Eggs and egg mixtures 37 0.12
Other foodsFats and condiments
Table fats, oils, and salad dressingsGravies, sauces, condiments, and spices
38, 39 1.79
Coffee and tea N/A 0.02
Soft drinks, sodas, fruit drinks, and ades (including rice beverages) 41, 42 1.33
Sugars, sweets, and candies 40, 44, 45, 46, 47 0.41Soups
Ready-to-serve and condensed soups Dry soups (dry)
49 0.51
Frozen or refrigerated entrees (including pizza, fish sticks, and frozen meals) 48 0.181The USDA Food Plan shares are based upon the recommended dollar costs of feeding a representative family consisting of one male and one female, age 19-50, one child age 9-11, and one child age 6-8, according to the Liberal Food Plan. QFAHPD = Quarterly food-at-home price database.
Source: Carlson et al. (2007) and authors’ calculations.
22 Assessing the Healthfulness of Consumers’ Grocery Purchases / EIB-102
Economic Research Service/USDA
Table A.2
Weekly dollar costs for the liberal food plan by food category and demographic, 2001-2002
Note: QFAHPD = Quarterly food-at-home price database; CNPP = Center for Nutrition Policy and Promotion. FC = food category. Source: Dollar cost estimates from analysis done as part of Carlson et al. (2007).
24 Assessing the Healthfulness of Consumers’ Grocery Purchases / EIB-102
Economic Research Service/USDA
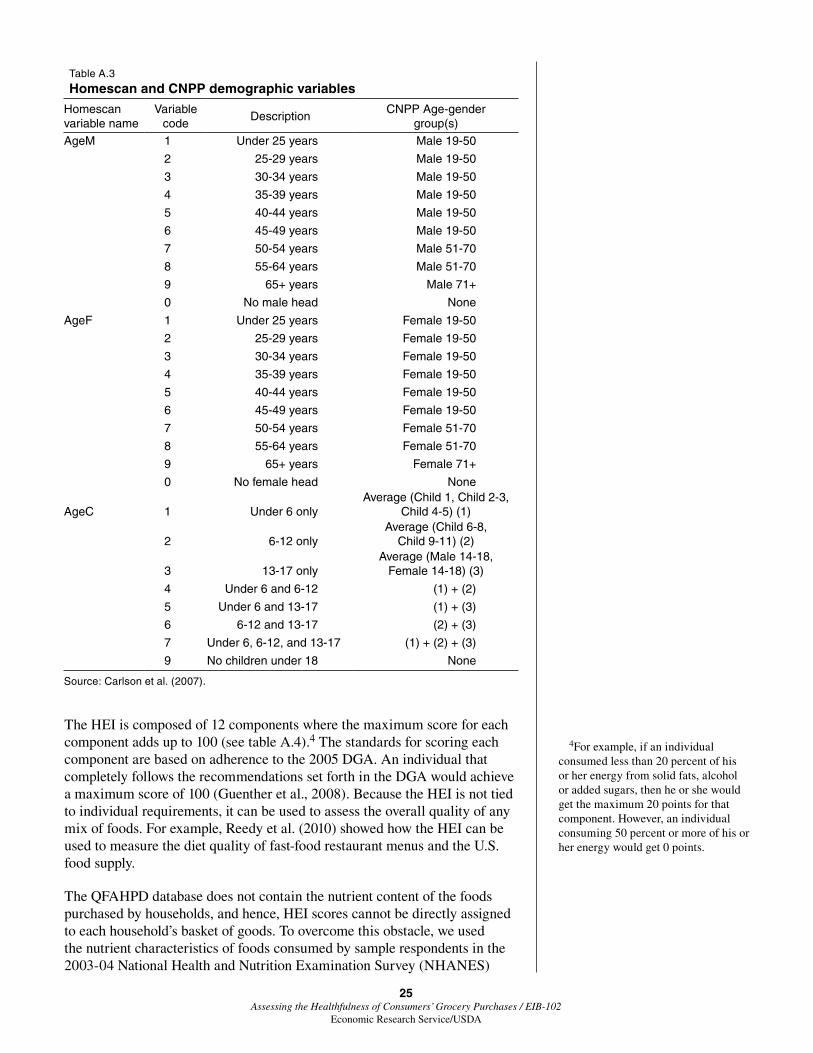
provided by the Homescan households to construct recommended shopping baskets based on the CNPP weekly dollar cost estimates. The three categor-ical Homescan variables that enabled this construction are AgeM, the age of the male head of household; AgeF, the age of the female head of household; and AgeC, the presence and age of children. Every household-specific weekly shopping basket consists of a dollar cost based upon these three variables (table A.3). The CNPP age-gender groups do not correspond perfectly with the Homescan categorical variables, particularly because there are more of the former. Therefore it was necessary to use approximate matches or in certain cases average values to sync the two datasets.
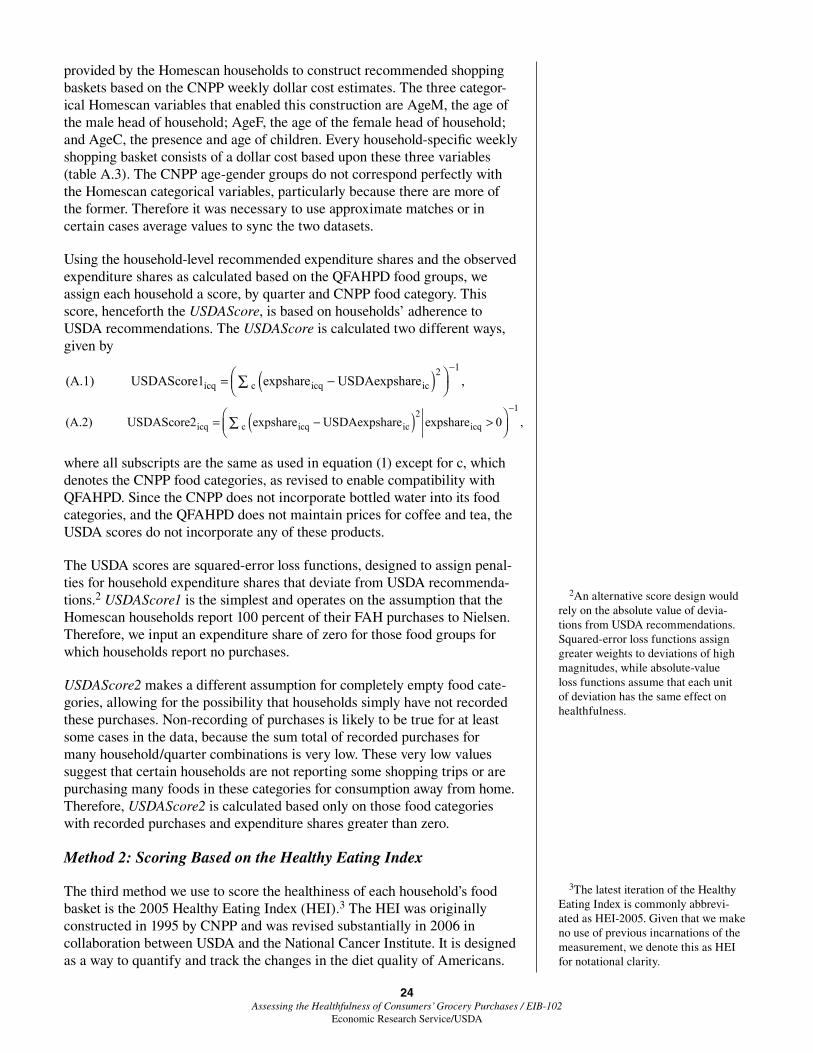
Using the household-level recommended expenditure shares and the observed expenditure shares as calculated based on the QFAHPD food groups, we assign each household a score, by quarter and CNPP food category. This score, henceforth the USDAScore, is based on households’ adherence to USDA recommendations. The USDAScore is calculated two different ways, given by
icq c icq ic icq(A.2) USDAScore2 expshare USDAexpshare expshare 0 ,− = − > ∑
where all subscripts are the same as used in equation (1) except for c, which denotes the CNPP food categories, as revised to enable compatibility with QFAHPD. Since the CNPP does not incorporate bottled water into its food categories, and the QFAHPD does not maintain prices for coffee and tea, the USDA scores do not incorporate any of these products.
The USDA scores are squared-error loss functions, designed to assign penal-ties for household expenditure shares that deviate from USDA recommenda-tions.2 USDAScore1 is the simplest and operates on the assumption that the Homescan households report 100 percent of their FAH purchases to Nielsen. Therefore,weinputanexpenditureshareofzeroforthosefoodgroupsforwhich households report no purchases.
USDAScore2 makes a different assumption for completely empty food cate-gories, allowing for the possibility that households simply have not recorded these purchases. Non-recording of purchases is likely to be true for at least some cases in the data, because the sum total of recorded purchases for many household/quarter combinations is very low. These very low values suggest that certain households are not reporting some shopping trips or are purchasing many foods in these categories for consumption away from home. Therefore, USDAScore2 is calculated based only on those food categories withrecordedpurchasesandexpendituresharesgreaterthanzero.
Method 2: Scoring Based on the Healthy Eating Index
The third method we use to score the healthiness of each household’s food basket is the 2005 Healthy Eating Index (HEI).3 The HEI was originally constructed in 1995 by CNPP and was revised substantially in 2006 in collaboration between USDA and the National Cancer Institute. It is designed as a way to quantify and track the changes in the diet quality of Americans.
2An alternative score design would rely on the absolute value of devia-tions from USDA recommendations. Squared-error loss functions assign greater weights to deviations of high magnitudes, while absolute-value loss functions assume that each unit of deviation has the same effect on healthfulness.
3The latest iteration of the Healthy Eating Index is commonly abbrevi-ated as HEI-2005. Given that we make no use of previous incarnations of the measurement, we denote this as HEI for notational clarity.
25 Assessing the Healthfulness of Consumers’ Grocery Purchases / EIB-102
Economic Research Service/USDA
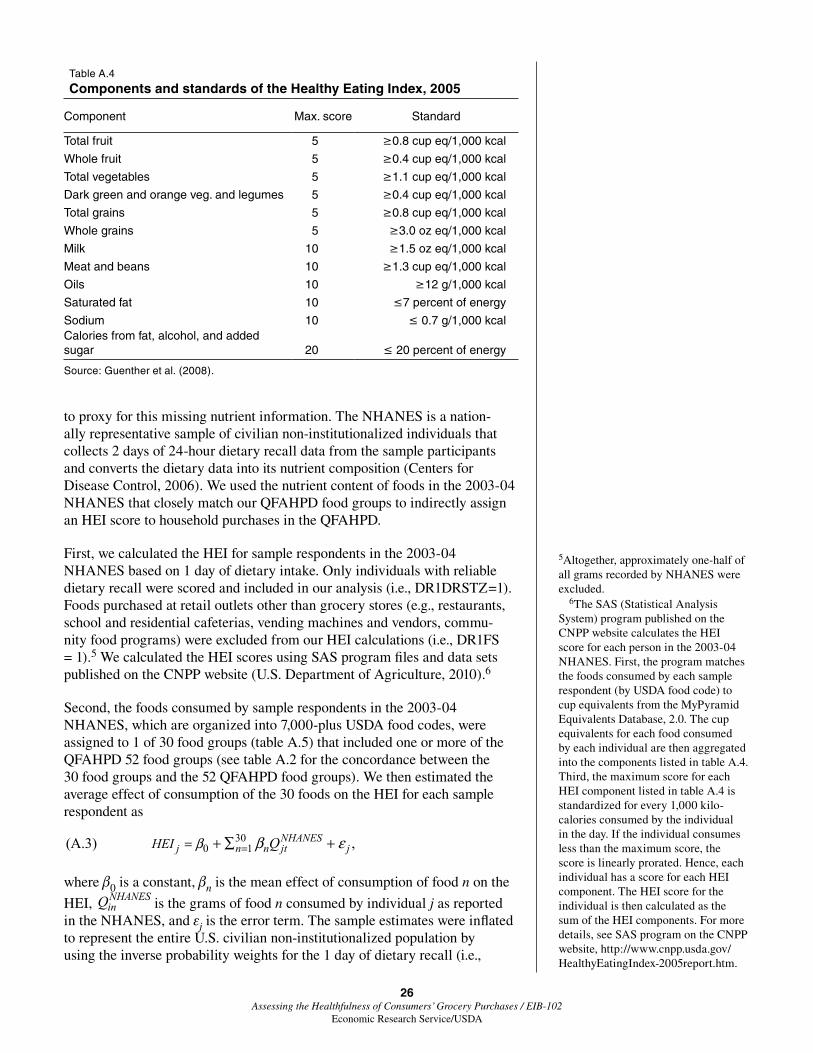
The HEI is composed of 12 components where the maximum score for each component adds up to 100 (see table A.4).4 The standards for scoring each component are based on adherence to the 2005 DGA. An individual that completely follows the recommendations set forth in the DGA would achieve a maximum score of 100 (Guenther et al., 2008). Because the HEI is not tied to individual requirements, it can be used to assess the overall quality of any mix of foods. For example, Reedy et al. (2010) showed how the HEI can be used to measure the diet quality of fast-food restaurant menus and the U.S. food supply.
The QFAHPD database does not contain the nutrient content of the foods purchased by households, and hence, HEI scores cannot be directly assigned to each household’s basket of goods. To overcome this obstacle, we used the nutrient characteristics of foods consumed by sample respondents in the 2003-04 National Health and Nutrition Examination Survey (NHANES)
4For example, if an individual consumed less than 20 percent of his or her energy from solid fats, alcohol or added sugars, then he or she would get the maximum 20 points for that component. However, an individual consuming 50 percent or more of his or her energy would get 0 points.
Table A.3
Homescan and CNPP demographic variables
Homescan variable name
Variable code
DescriptionCNPP Age-gender
group(s)
AgeM 1 Under 25 years Male 19-50
2 25-29 years Male 19-50
3 30-34 years Male 19-50
4 35-39 years Male 19-50
5 40-44 years Male 19-50
6 45-49 years Male 19-50
7 50-54 years Male 51-70
8 55-64 years Male 51-70
9 65+ years Male 71+
0 No male head None
AgeF 1 Under 25 years Female 19-50
2 25-29 years Female 19-50
3 30-34 years Female 19-50
4 35-39 years Female 19-50
5 40-44 years Female 19-50
6 45-49 years Female 19-50
7 50-54 years Female 51-70
8 55-64 years Female 51-70
9 65+ years Female 71+
0 No female head None
AgeC 1 Under 6 onlyAverage (Child 1, Child 2-3,
Child 4-5) (1)
2 6-12 onlyAverage (Child 6-8,
Child 9-11) (2)
3 13-17 onlyAverage (Male 14-18,
Female 14-18) (3)
4 Under 6 and 6-12 (1) + (2)
5 Under 6 and 13-17 (1) + (3)
6 6-12 and 13-17 (2) + (3)
7 Under 6, 6-12, and 13-17 (1) + (2) + (3)
9 No children under 18 None
Source: Carlson et al. (2007).
26 Assessing the Healthfulness of Consumers’ Grocery Purchases / EIB-102
Economic Research Service/USDA
to proxy for this missing nutrient information. The NHANES is a nation-allyrepresentativesampleofciviliannon-institutionalizedindividualsthatcollects 2 days of 24-hour dietary recall data from the sample participants and converts the dietary data into its nutrient composition (Centers for Disease Control, 2006). We used the nutrient content of foods in the 2003-04 NHANES that closely match our QFAHPD food groups to indirectly assign an HEI score to household purchases in the QFAHPD.
First, we calculated the HEI for sample respondents in the 2003-04 NHANES based on 1 day of dietary intake. Only individuals with reliable dietary recall were scored and included in our analysis (i.e., DR1DRSTZ=1). Foods purchased at retail outlets other than grocery stores (e.g., restaurants, school and residential cafeterias, vending machines and vendors, commu-nity food programs) were excluded from our HEI calculations (i.e., DR1FS = 1).5 We calculated the HEI scores using SAS program files and data sets published on the CNPP website (U.S. Department of Agriculture, 2010).6
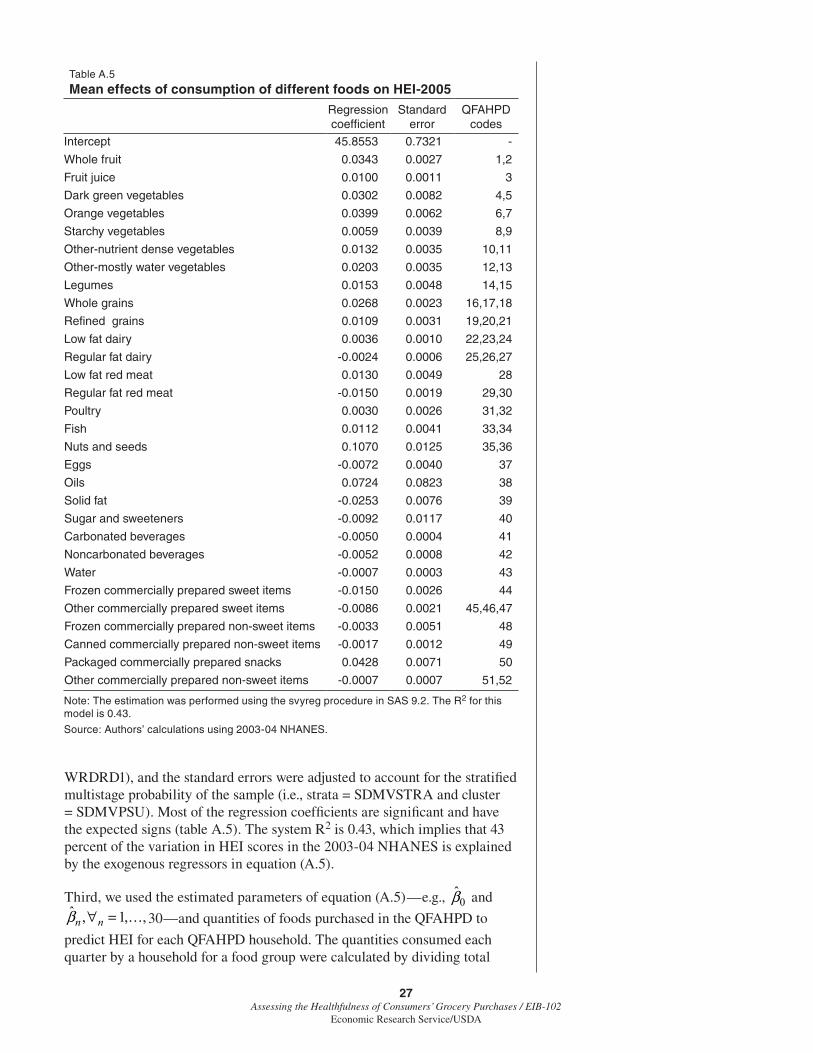
Second, the foods consumed by sample respondents in the 2003-04 NHANES,whichareorganizedinto7,000-plusUSDAfoodcodes,wereassigned to 1 of 30 food groups (table A.5) that included one or more of the QFAHPD 52 food groups (see table A.2 for the concordance between the 30 food groups and the 52 QFAHPD food groups). We then estimated the average effect of consumption of the 30 foods on the HEI for each sample respondent as
300 1(A.3) ,NHANES
j n n jt jHEI Qβ β ε== + ∑ +
where β0 is a constant, βn is the mean effect of consumption of food n on the
HEI, NHANESinQ is the grams of food n consumed by individual j as reported
in the NHANES, and εj is the error term. The sample estimates were inflated torepresenttheentireU.S.civiliannon-institutionalizedpopulationbyusing the inverse probability weights for the 1 day of dietary recall (i.e.,
5Altogether, approximately one-half of all grams recorded by NHANES were excluded.
6The SAS (Statistical Analysis System) program published on the CNPP website calculates the HEI score for each person in the 2003-04 NHANES. First, the program matches the foods consumed by each sample respondent (by USDA food code) to cup equivalents from the MyPyramid Equivalents Database, 2.0. The cup equivalents for each food consumed by each individual are then aggregated into the components listed in table A.4. Third, the maximum score for each HEI component listed in table A.4 is standardizedforevery1,000kilo-calories consumed by the individual in the day. If the individual consumes less than the maximum score, the score is linearly prorated. Hence, each individual has a score for each HEI component. The HEI score for the individual is then calculated as the sum of the HEI components. For more details, see SAS program on the CNPP website, http://www.cnpp.usda.gov/HealthyEatingIndex-2005report.htm.
Table A.4
Components and standards of the Healthy Eating Index, 2005
Component Max. score Standard
Total fruit 5 ≥0.8 cup eq/1,000 kcal
Whole fruit 5 ≥0.4 cup eq/1,000 kcal
Total vegetables 5 ≥1.1 cup eq/1,000 kcal
Dark green and orange veg. and legumes 5 ≥0.4 cup eq/1,000 kcal
Total grains 5 ≥0.8 cup eq/1,000 kcal
Whole grains 5 ≥3.0 oz eq/1,000 kcal
Milk 10 ≥1.5 oz eq/1,000 kcal
Meat and beans 10 ≥1.3 cup eq/1,000 kcal
Oils 10 ≥12 g/1,000 kcal
Saturated fat 10 ≤7 percent of energy
Sodium 10 ≤ 0.7 g/1,000 kcalCalories from fat, alcohol, and added sugar 20 ≤ 20 percent of energy
Source: Guenther et al. (2008).
27 Assessing the Healthfulness of Consumers’ Grocery Purchases / EIB-102
Economic Research Service/USDA
WRDRD1), and the standard errors were adjusted to account for the stratified multistage probability of the sample (i.e., strata = SDMVSTRA and cluster = SDMVPSU). Most of the regression coefficients are significant and have the expected signs (table A.5). The system R2 is 0.43, which implies that 43 percent of the variation in HEI scores in the 2003-04 NHANES is explained by the exogenous regressors in equation (A.5).
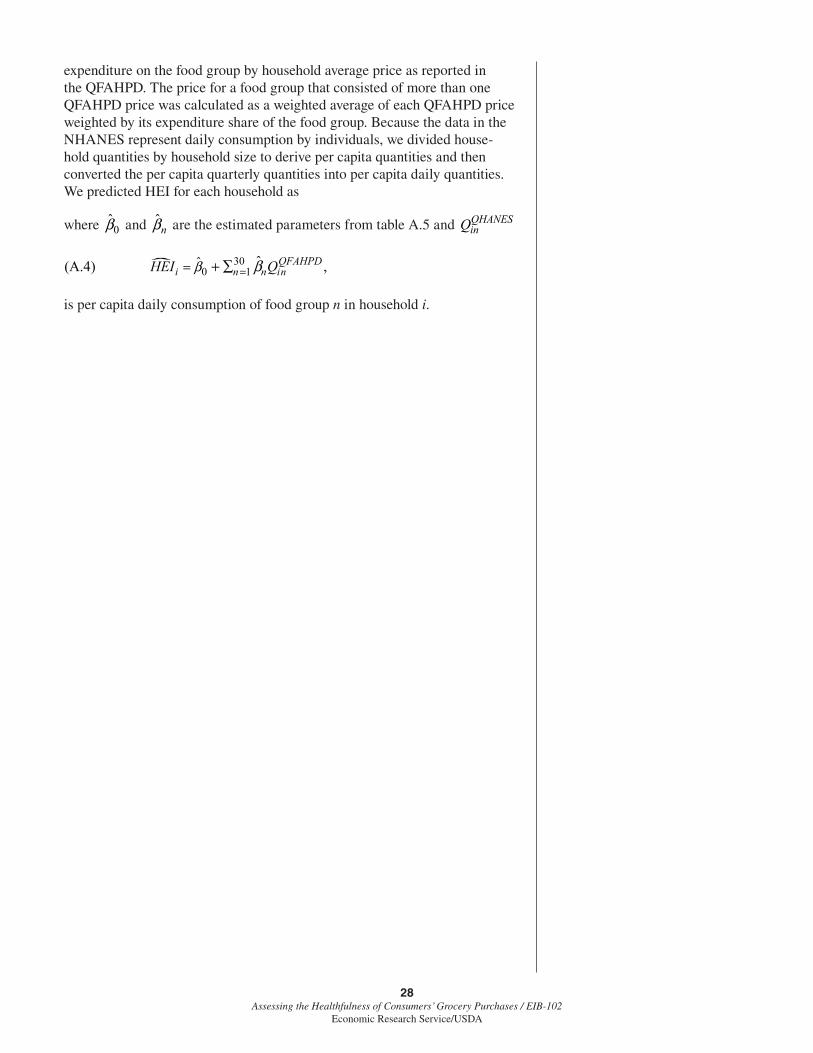
Third, we used the estimated parameters of equation (A.5)—e.g., 0β̂ and ˆ , 1, ,n nβ ∀ = 30—and quantities of foods purchased in the QFAHPD to
predict HEI for each QFAHPD household. The quantities consumed each quarter by a household for a food group were calculated by dividing total
Table A.5
Mean effects of consumption of different foods on HEI-2005
Other commercially prepared non-sweet items -0.0007 0.0007 51,52
Note: The estimation was performed using the svyreg procedure in SAS 9.2. The R2 for this model is 0.43.
Source: Authors’ calculations using 2003-04 NHANES.
28 Assessing the Healthfulness of Consumers’ Grocery Purchases / EIB-102
Economic Research Service/USDA
expenditure on the food group by household average price as reported in the QFAHPD. The price for a food group that consisted of more than one QFAHPD price was calculated as a weighted average of each QFAHPD price weighted by its expenditure share of the food group. Because the data in the NHANES represent daily consumption by individuals, we divided house-hold quantities by household size to derive per capita quantities and then converted the per capita quarterly quantities into per capita daily quantities. We predicted HEI for each household as
where 0β̂ and ˆnβ are the estimated parameters from table A.5 and QHANES
inQ
is per capita daily consumption of food group n in household i.