Spring 2002 To the Investment Committee of the SMU Board of Trustees: The Southern Methodist University Endowment Fund provides support for scholarships, departments, and other operating expenses of the University. Although the endowment is divided into three major groups, the majority of the endowment’s funds are in the balanced pool. As of May 31, 2001, the entire endowment had a market value of $872,388,000. The portion that the undergraduate students manage is the Anne Rife Cox Endowment Fund, which has a market value of $2,362,785. The overall objective is to preserve the purchasing power of the endowment while providing a predictable, stable and inflation-adjusted stream of earnings consistent with the University’s spending requirements. In order to meet this objective, our target return will be an average annual total return of 9% per year. Another quantitative objective is to outperform a blended benchmark of 82.5% of the Russell 3000 and 17.5% Government Credit Index over rolling five-year periods. A final performance goal is to rank in the top third of the NACUBO universe of college and university endowment returns for rolling five-year periods. The time horizon for the Anne Rife Portfolio is infinite. This perpetual time horizon allows for a liquidity premium due to a spending rate of 5.1% on a three-year rolling average. Thus, liquidity requirements for the portfolio are low. Due to the fact that the Anne Rife Cox Endowment Fund has a range of 65-85% equity and is primarily concerned with equity growth instead of fixed income returns, the client is willing to assume a moderate degree of market risk. In addition to sector diversification, the client prefers a diversified investment approach that contains a number of uncorrelated investment strategies. The portfolio also holds several fixed income securities, which primarily function to adjust for inflation. Recognizing the power and trust that our client, Southern Methodist University, places in us by allowing the practicum to manage the Anne Rife Cox Endowment Fund, it is important that the class be guided by several key ethical principles. After researching the Association for Investment Management Research’s Standards of Professional Conduct, we feel that this document contains many critical points which provide the basis for the class’ own guidelines. While all of the class’ actions should be handled in an ethical manner that follows these standards, this document highlights several principles that should be abided to the highest degree:
Transcript
Spring 2002 To the Investment Committee of the SMU Board of Trustees:
The Southern Methodist University Endowment Fund provides support for scholarships, departments, and other operating expenses of the University. Although the endowment is divided into three major groups, the majority of the endowment’s funds are in the balanced pool. As of May 31, 2001, the entire endowment had a market value of $872,388,000. The portion that the undergraduate students manage is the Anne Rife Cox Endowment Fund, which has a market value of $2,362,785.
The overall objective is to preserve the purchasing power of the endowment while
providing a predictable, stable and inflation-adjusted stream of earnings consistent with the University’s spending requirements. In order to meet this objective, our target return will be an average annual total return of 9% per year. Another quantitative objective is to outperform a blended benchmark of 82.5% of the Russell 3000 and 17.5% Government Credit Index over rolling five-year periods. A final performance goal is to rank in the top third of the NACUBO universe of college and university endowment returns for rolling five-year periods.
The time horizon for the Anne Rife Portfolio is infinite. This perpetual time horizon
allows for a liquidity premium due to a spending rate of 5.1% on a three-year rolling average. Thus, liquidity requirements for the portfolio are low.
Due to the fact that the Anne Rife Cox Endowment Fund has a range of 65-85% equity
and is primarily concerned with equity growth instead of fixed income returns, the client is willing to assume a moderate degree of market risk. In addition to sector diversification, the client prefers a diversified investment approach that contains a number of uncorrelated investment strategies. The portfolio also holds several fixed income securities, which primarily function to adjust for inflation.
Recognizing the power and trust that our client, Southern Methodist University, places
in us by allowing the practicum to manage the Anne Rife Cox Endowment Fund, it is important that the class be guided by several key ethical principles. After researching the Association for Investment Management Research’s Standards of Professional Conduct, we feel that this document contains many critical points which provide the basis for the class’ own guidelines. While all of the class’ actions should be handled in an ethical manner that follows these standards, this document highlights several principles that should be abided to the highest degree:
1. Members shall not engage in any professional conduct involving dishonesty, fraud, deceit, and misrepresentation or commit any act that violates the SMU Honor Code (see SMU Code of Conduct) or reflects adversely on their honesty, trustworthiness, or professional competence. We must not only understand these primary rules of securities management but also actively follow them in all of our investing decisions. It is vital to our role as financial advisors to maintain the highest level of trust and honesty in our relationship with the client in order to perform our duty to its fullest.
2. Every investment recommendation should be made in light of the client’s financial
situation and investment objectives. In order to hold our client’s trust and confidence it is important that we know our client’s goals and use these to make sound investment recommendations, a process that will be maintained throughout the entire relationship with the client.
3. Conduct all research with due diligence and distinguish between fact and opinion in the
final report not only for the purposes of an objective selection process, but also to help filter out reports that might misrepresent the truth.
4. The group should always act with integrity as well as acting independently of personal
investments. Members are required to disclose all matters, including beneficial ownership of securities or other investments that reasonably could be expected to interfere with their duty or their ability to make unbiased and objective recommendations. Members should abstain from voting on any recommendation or portfolio adjustment which directly conflicts with their personal asset holdings or appears to put their interests ahead of the clients’.
5. Recognizing our academic purpose, we must strive to constantly improve our financial
knowledge and competence as well as the competence of others involved in the management of the Portfolio.
Keeping the goals and interests of our client in mind, the Anne Rife Portfolio Practicum shall strive to maintain the integrity of AIMR standards, as well as the professional code of conduct expected of financial managers given such a fiduciary responsibility.
Sincerely, The Anne Rife Cox Management Team
ECONOMIC OUTLOOK Noteworthy Points 3
• Economic indicators such as GDP, interest rates, and earnings expectations suggest an economic rebound for the United States’ in 2002.
• With inflation rates expected to remain relatively stable at 2.3%, a primary determinant of bond yields over the coming year will be default risk.
• Until firm over-capacities are diminished, companies are not expected to significantly increase their investment spending regardless of how low interest rates go.
• Economists predict that the consumer will continue to provide solid spending support as the economy moves into recovery during the latter portion of 2002.
I. The Year 2001 in Review
Immense uncertainty and volatility characterized the year 2001. After the September 11th attacks on the World Trade Center and the Pentagon, the United States’ economic downturn was solidified. The United States’ economy officially entered a recession in 2001 after two consecutive quarters of negative GDP growth. Overly optimistic business models as well as firm over-capacity spawned the current bout of economic anemia after a decade of prosperity. Although the Federal Reserve began cutting interest rates on January 3, 2001 and cut them 10 more times throughout the year, the economic downturn remained inevitable. Despite the late stock surges, the stock market’s major indices all performed dismally in 2001. Last year, the Dow Industrials fell by 7.1% and barely finished above the 10,000 benchmark. This decline exceeded the previous year’s downturn of 6.18% and was the worst loss on record since 1981. Top performing stocks in 2001 included consumer cyclicals and consumer staples, with home builders and home furnishings faring well. Other groups that held up well include paper goods, chemicals, metals, and other basic materials. Among the biggest decliners were telecommunications companies as well as energy related enterprises. The enormous damage that technology stocks suffered was apparent in the 21.05% NASDAQ composite decline. Although damage spread beyond technology to manufacturing, consumer, and financial stocks, small-cap equities strongly outperformed large-cap equities in 2001.
As a result of vast uncertainties prevalent within domestic markets, the bond market was exceptionally volatile in 2001. Higher quality, longer maturity bonds provided the best total returns with investment-grade corporate bonds rising 10.70%. In addition, investors’ desire for secure and predictable returns caused default-free Intermediate Treasuries to gain 8.42% on the year.
THE YEAR 2001 IN REVIEW
STATISTIC SOURCE
The U.S. Securities or Equity Market Overall Wilshire 5000 -10.97% Wall Street Journal
Large vs. Small S&P 500 -13.04% Wall Street Journal Dow Jones Industrials -7.10% Wall Street Journal Russell 2000 1.03% Wall Street Journal
Value vs. Growth S&P Barra 500 Value -11.72% Ibbotson & Associates S&P Barra 500 Growth -12.72% Ibbotson & Associates
Foreign Markets EAFE -21.21% MSCI Europe -19.63% MSCI Far East -28.27% MSCI Japan -18.84% MSCI Emerging Markets -18.35% MSCI
Fixed Income Markets Long Treasuries 3.80% Wall Street Journal Investment Grade Credits 10.70% Wall Street Journal Intermediate Treasuries 8.42% Lehman Brothers Intermediate Credits 9.77% Lehman Brothers High Yield 5.28% Lehman Brothers T-Bills 3.90% Congressional Budget Office
Domestic Economy Real GDP Growth 1.70% Congressional Budget Office Inflation/CPI Index 3.00% Congressional Budget Office Unemployment 4.60% Congressional Budget Office
II. Domestic Economic Outlook for 2002 Economic Indicators
Economic indicators such as GDP, interest rates, and earnings expectations suggest an economic rebound for the United States’ in 2002.
2001 2002 Projections Nominal GDP 4.1% 3.4% Real GDP 1.7% 2.6% Federal Funds Rate 1.75% 2.25% Inflation 2.3% 2.3% Earnings Growth Expectations -30% 12% - 17% Unemployment 4.6% 5.2% 10 year Treasury Security 5.3% 5.6% Source: Congressional Budget Office
The economic downturn of 2001 is expected to continue through the first quarter of 2002. Many analysts believe that the country will face one additional quarter of falling GDP with the contraction being no more than 1%. Since the Federal Reserve reduced the Federal Funds Rate to 1.75% in 2001, the Fed will probably pursue a relatively stable monetary course in the short run. Because overly optimistic business models and firm over-capacity are blamed for the country’s recent economic downturn, further interest rate reductions are unlikely since rate cuts do not adequately address these problems. The Federal Reserve’s likely shift in stance from an easing position to a neutral position is anticipated to shift toward a tightening schedule late in the year. By the end of 2002, the Federal Funds rate is projected to reach 2.25%. With inflation rates expected to remain relatively stable at 2.3%, a primary determinant of bond yields over the coming year will be real interest rates. As a result of the interest rate increase, bond yields will rise and bond prices will slide.
Although earnings growth expectations are in the mid to upper teens for the year, the earnings recovery is anticipated to be slow and uneven at first. After the initial obstacles are surpassed, earnings growth expectations are likely to contribute to a moderate surge in the stock market. With earnings projections increasing, price-to-earnings ratios will decline slightly as earnings gains outpace price gains. Earnings per share for the S&P 500 are expected to rebound in 2002 with an overall rise in the index predicted at 15% for the year.
United States consumer confidence fell in February to 94.1 as persistent weakness in the labor markets weighed on Americans' assessment of the economy. The dip in confidence comes despite recent evidence that American consumers' spending habits have held strong in the face of recession. While confidence has weakened from January's level, both components of the Index still point to healthy consumer spending in the months ahead. Economists predict that the consumer will continue to provide solid spending support as the economy moves into recovery during the latter portion of 2002. Meanwhile, there has been mounting evidence that the jobs market has stabilized after a rapid deterioration following the September 11th attacks. But Americans still view the current job situation as weak. Until firm over-capacities are diminished, companies are not expected to significantly increase their investment spending regardless of how low interest rates go. As a result of the recession, firms are engaging in significant cost cutting behaviors, one of which includes payroll minimization. Considering all of these factors, the unemployment rate is expected to increase slightly in 2002 to 5.2% despite the positive economic projections for the year. Conclusion Overall, we remain optimistic about prospects for the economy and the stock market during 2002 and expect moderate, positive returns in the year upcoming. III. Sectors of Special Interest Healthcare The Healthcare sector is expected to grow via new product development and increased consumption of medical supplies. Growth within this sector is sustained through reinvestment in Research & Development. Although some pharmaceutical firms are concerned with expiring patents, many new drug approvals are expected during 2002. Consequently, we believe that the outlook for this sector is favorable. Industrials As a result of the September 11th attacks, the aerospace and defense industry experienced significant gains in the latter half of 2001. However, with the increased military spending proposed in the 2002 United States’ budget, this industry is likely to remain on the upswing. Utilities
Growth within this sector is attributed to both the 2001 energy crisis and lower interest rates. These events created advantageous pricing opportunities for independent power generators last year which are likely to evaporate in the coming year. Thus, we feel that the outlook for this sector is dismal.
FOREIGN ECONOMIC SYNOPSIS Noteworthy Points
• The high correlation between foreign markets and the U.S. market will result in a slow foreign market rebound.
• Japan does not appear to be a viable market for foreign investment. However, other Asian markets are projected to have a better growth rate since some of their sectors are undervalued.
• European markets appear poised for a stable year of modest growth and possess equities that appear less pricey then U.S. opportunities.
• Latin American markets are extremely turbulent due to political, inflationary, and overall economic concerns.
Introduction
The impact of terrorist attacks and the overall slowdown of the U.S economy have postponed the global economic recovery into the latter portion of 2002. Because of the dependent relationship between international economies and the U.S economy, both the domestic economic downturn and the unfavorable, domestic business sentiment have had a severe impact on many foreign regions. As the United States emerges from its recession during 2002, foreign exports are expected to gradually improve.
I. Asian Economy
Japan
The Japanese economy has shown no signs of improvement in comparison to last year. Furthermore, rising unemployment and talk of a currency devaluation solidifies the uncertainty of the upcoming year. After an estimated contraction of 0.4% in 2001, Japan’s real GDP is expected to contract by 1.4% in 2002. Moreover, consumer prices are expected to fall approximately 1.2% this year. Lower worldwide oil prices and continued problems in the Japanese banking system will also add to deflationary price pressures. The United States’ weak economy has contributed to Japan’s economic contraction since Japan’s exports to the United States constitute approximately one third of the country’s annual revenue. Moreover, the volatile Yen exchange rate creates significant currency risk that further undermines potential foreign investment. In addition, there is a high probability of a Yen devaluation. The projected six month
interest rate for 2002 is 3.0% while the twelve-month interest rate is 3.5%. Considering the above, we believe that the Japanese economy has very limited short-term growth prospects.
China In 2002, China’s real GDP growth is expected to hold steady at 7.3% while the country’s annual inflation rate is projected at 1.1%. Government expenditure will continue to be the main catalyst behind China’s economic growth as well as large inflows of foreign capital. Moreover, growth in private consumption will help underpin investment-driven growth. For 2002, the Chinese currency, RMB, is expected to trade around 8.3 RMB per U.S $1. Since China has high foreign exchange reserves, the country is not likely to devalue its currency in the upcoming years. High import growth has shrunk the Chinese current-account surplus in recent years with this trend projected to continue into the near future. Furthermore, increased amounts of Chinese exports expected in during late 2002 will augment Chinese incomes within the manufacturing sector and help stimulate China’s domestic demand. China’s strong economic growth combined with its stable exchange rate makes it a favorable candidate for foreign direct investment. Asian/Pacific With slow, global economic activity in 2001, the Asian Development Bank predicts an economic rebound for the Asian/Pacific economy during 2002. Project growth rates in this region average 4.1% annually. However, economic policies pursued by individual countries within this region will play a significant role in how the Asian/Pacific economy performs in 2002. Since this region is particularly vulnerable to the economic policies of its member countries, ineffective policies may cause extreme market volatility during favorable economic conditions. Southeast Asia is likely to experience moderate growth in 2002 as exports recover and GDP increases 0.9%. Many Asian/Pacific stocks are currently inexpensive and undervalued. Particularly noteworthy sectors include consumer cyclicals and consumer staples, which are undervalued by approximately 30%. Technology stocks and media companies do not comprise the list of significantly undervalued equities within this region. In 2002, exports will be essential to the Asian/Pacific economic recovery. Nevertheless, export growth will not be the only source of GDP growth. With inflation remaining subdued, countries with floating exchange rates will keep interest rates low in order to support economic growth. II. European Economy
We believe that the European market will experience a recovery in 2002. Morgan Stanley predicts an end to the European sector’s two-year decline with annual economic growth rates projected between 5% and 8%. Europe’s economic growth is expected to occur in two phases:
the first half of the year will be characterized by double digit gains with the second half of the year experiencing an estimated 5 to10% decline The first sign of an economic upturn within the European market can be seen in the 2002 GDP growth projections. According to International Monetary Fund, Europe will experience approximately 2.2% economic growth next year. This estimate depicts a modest estimate about European GDP over the coming year. This indicator shows that analysts expect a solid recovery during 2002 as national production moderately increases. European GDP growth may be an indication of increased domestic demand or increased demand of European exports from foreign countries.
Furthermore, we believe the Euro will exhibit modest gains in 2002. Despite these gains, the Euro is expected to remain weaker than the U.S. Dollar. The strengthening of the Euro has important economic implications including fluctuations in exchange rate risk, strong European influence on foreign trade, and changes demand for European exports. Since the effects of the currency transition are expected to be gradual, these economic implications are likely to be minimized. Thus, these considerations should not create an overwhelming concern for our investments in 2002. With the recent interest rate cuts from the European Central Bank, analysts predict interest rates to remain low throughout 2002. Low interest rates should help to boost consumer spending, but may also result in decreased foreign investment. While the outlook for the European economy is optimistic, the success of this economy depends on the world economy. If the global economy does not shift into a recovery, the European Union’s economy will remain sluggish during 2002. Much of the European economy’s fate is also dependent on the United States’ economy. While European equities are currently trading at healthy multiples relative to their historical levels, they are still less pricey than U.S. equities. Although the European market contains undervalued assets, analysts believe that investors will wait until there is an upturn in the U.S. equity market before considering European equity markets. III. Latin American Economy
The Latin American economy has been a difficult course to navigate over the past year. With a number of faltering economies coupled with the strong devaluation of the Argentinean Peso, the economic presence of Latin America has not been strong.
Mexico We will begin by considering the strength of the Mexican Peso. Analysts predict that the Peso will depreciate approximately 10% in 2002. By year-end, Viewshire anticipates the Peso to be trading at a reasonable 10.5 MXP to $1 U.S. A significant portion of the Mexican currency depreciation is do to the country’s decrease in capital inflows. In order to augment capital inflows, Mexico is offering relatively high short-term interest rates: 6.0% (3 month), 6.0% (6 month), and 6.25% (12 month). In exchange for assuming higher risk within the Mexican economy, the Mexican government is hoping to lure in foreign investors by offering higher interest rates. Furthermore, the Mexican economy is expected to exhibit little to no GDP growth in 2002. With the problems of foreign capital outflow and political instability, Mexico’s economic woes are not close to being mended. However, the Peso depreciation may increase demand for Mexican exports and higher interest rates may bring more foreign capital into Mexico. Argentina and Brazil The status of the Argentinean economy is of great concern in Latin America. As a result of Argentina’s current economic and financial distress, many investors are skeptical about the country’s future economic recovery. However, a number of countries have fought to differentiate themselves from the Argentina collapse. The largest and most economically important of these countries is Brazil. While it appears that Brazil has successfully distanced itself from Argentina’s woes, Brazil still remains vulnerable to the adverse effects of Argentina’s sluggish economy. Brazilian exports are likely to continue to experience reduced demand because of the low demand for Argentinean exports. Analysts predict that Brazil’s 2002 GDP figures will exhibit growth of 2.3% and believe that the Brazilian Real will strengthen in the coming year. Furthermore, Brazil is offering enormous incentives for investment in the form of higher interest rates: 18% (3 month), 16% (6 month), and 15.2% (12 month). We believe that these numbers reflect the solid foundation Latin America has for a short-term economic recovery. At the same time, however, we need to be aware of the effect a Real appreciation will have countries’ demand for Brazilian exports. In addition, we must keep an eye on Brazil’s inflation rate since high inflation has plagued the country in the past. In summation, the Latin American economy has some bright spots, but we must question whether the prospective benefits outweigh the immense risks that exist within this region. Until the Latin American economy is better able to control exchange rates and inflation, we believe that this region does not constitute a favorable region to invest in at this time.
Portfolio Asset Allocation: Positioning the Portfolio for 2002 The process of asset allocation starts with an assessment of the expected risks and rewards to investing in broad asset classes of securities. The goal is to determine where to concentrate in the search for attractive individual security selection ideas. While we could take the recent recommendations of Wall Street analysts, we decided to conduct our own independent inquiry into the best allocation for the portfolio.
To determine the appropriate asset allocation, we first focused our attention on the following asset classes: S&P 500, Russell 2000, MSCI EAFE Foreign Index, and a measure of Long Term Gov’t/Corp bonds. Using Efficient Frontier software, we first ran a model using historical data from 1970 to obtain raw risk and expected return statistics. The optimal portfolio on the frontier of highest expected return per unit of risk was found to have the following, rather peculiar, weights in each asset class: However, the underlying assumptions of current economic conditions were absent in the formulation of this model. In an effort to incorporate current and projected economic conditions, we adjusted the current bond yield to the CBO Forecast of 5.6% plus a .4% corporate bond premium, and changed the risk-free rate to the current 3.8%. We also changed the start date of our asset classes to 1973, giving us the longest possible time period with common data. In addition to this, we subtracted 2.4% from the expected returns on the equity assets to adjust for the decrease in the CBO’s forecasted inflation rate relative to historical levels. By analyzing trends in increasing correlations between foreign and domestic markets, we increased the correlation between EAFE and Russell by 20% (from .4755 to .571), and EAFE
and S&P by 25% (from .537 to .671). These adjustments more closely resemble the effects of globalization over the past ten years. Based on these assumptions, we ran an efficient frontier analysis and contrasted the results with two preset portfolios. The first was comprised of weights taken from the SMU Balanced Pool. The second portfolio reflected an average of several analysts’ asset allocation recommendations taken from Bloomberg. The results of these portfolios are as follows:
The class concluded that the results of the SMU Pool were too aggressive to achieve in the current market, and the Analysts’ recommendation did not achieve our target return of 9%. As the following graph shows, the global tangent portfolio, which provides the highest reward to variability also failed to achieve the 9% return objective of the SMU endowment. In addition, the emphasis on foreign equity seemed relatively high for our lack of knowledge and experience working with these securities. To gauge the impact of reducing foreign investments, we added an additional portfolio on the efficient frontier that placed a constraint on foreign equities, yet still met our 9% target return. The characteristics of this portfolio are summarized below:
When the small cap and large cap equity components are added together, our allocation target reflects a roughly 70% investment in equities and 30% in fixed income.
As indicated in the following graph, the Constrained 9% Portfolio allows us to be as conservative as possible and still achieve the target return rate. The underweighting of the foreign sector is not detrimental to the risk-return environment, and still allows us to be within the ranges for equity and debt set by the University’s Investment committee. It also allows us to turn our focus to domestic securities, where we feel we have a
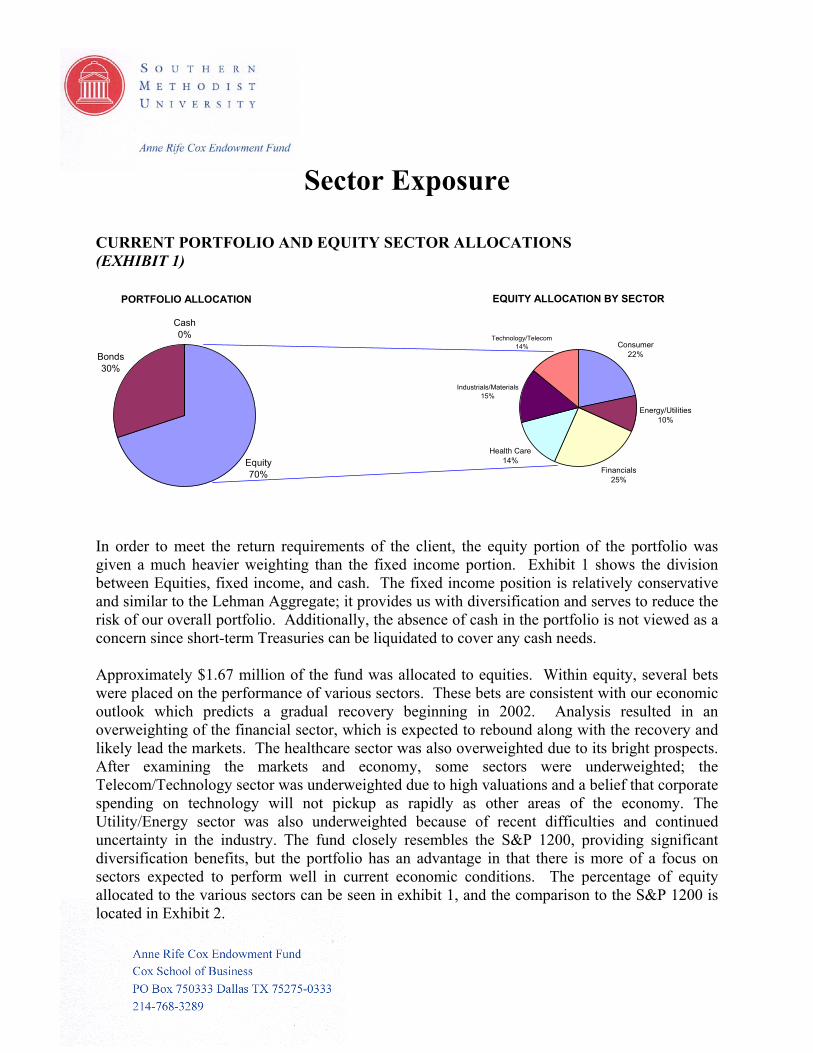
CURRENT PORTFOLIO AND EQUITY SECTOR ALLOCATIONS (EXHIBIT 1)
PORTFOLIO ALLOCATION
Equity70%
Bonds30%
Cash0%
EQUITY ALLOCATION BY SECTOR
Consumer22%
Energy/Utilities10%
Financials25%
Health Care14%
Industrials/Materials15%
Technology/Telecom14%
In order to meet the return requirements of the client, the equity portion of the portfolio was given a much heavier weighting than the fixed income portion. Exhibit 1 shows the division between Equities, fixed income, and cash. The fixed income position is relatively conservative and similar to the Lehman Aggregate; it provides us with diversification and serves to reduce the risk of our overall portfolio. Additionally, the absence of cash in the portfolio is not viewed as a concern since short-term Treasuries can be liquidated to cover any cash needs.
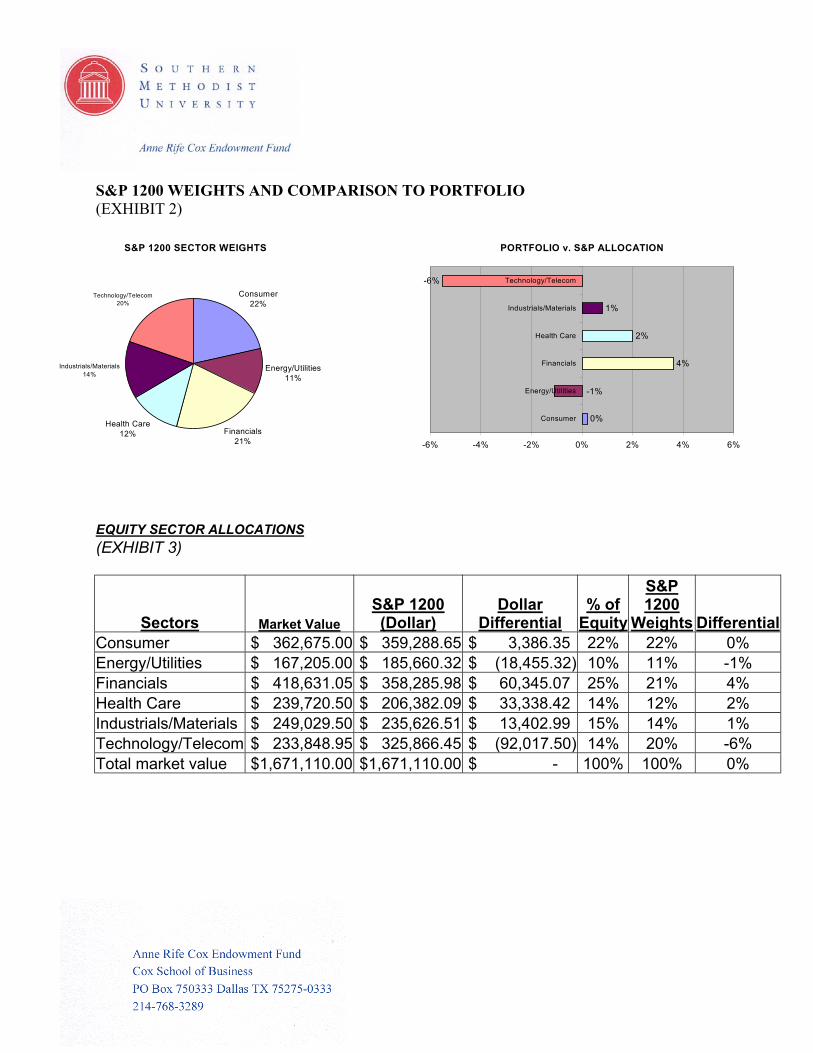
Approximately $1.67 million of the fund was allocated to equities. Within equity, several bets were placed on the performance of various sectors. These bets are consistent with our economic outlook which predicts a gradual recovery beginning in 2002. Analysis resulted in an overweighting of the financial sector, which is expected to rebound along with the recovery and likely lead the markets. The healthcare sector was also overweighted due to its bright prospects. After examining the markets and economy, some sectors were underweighted; the Telecom/Technology sector was underweighted due to high valuations and a belief that corporate spending on technology will not pickup as rapidly as other areas of the economy. The Utility/Energy sector was also underweighted because of recent difficulties and continued uncertainty in the industry. The fund closely resembles the S&P 1200, providing significant diversification benefits, but the portfolio has an advantage in that there is more of a focus on sectors expected to perform well in current economic conditions. The percentage of equity allocated to the various sectors can be seen in exhibit 1, and the comparison to the S&P 1200 is located in Exhibit 2.
S&P 1200 WEIGHTS AND COMPARISON TO PORTFOLIO (EXHIBIT 2)
The previous summary sell information gives the list of the securities and bonds sold during the Spring 2002 semester. One of the class’ goals was to reduce the number of stocks in the portfolio in order to have a manageable amount to research each semester. We want the next class to be able to evaluate each stock currently held within the time frame of this class. Also, many of the stocks were sold due to a lack of information and poor performance. The I-shares in both the Healthcare and Energy industries were sold. We did this because we decided to achieve our target exposures with individual securities. As one can see, there are many different motivations behind our decisions to sell these investments. The following reports highlight our reasoning behind our major sell decisions.
TYCO
The sell recommendation for TYCO was prepared on January 30, 2002 after the stock price fell 20% on the previous day. There were three main concerns regarding TYCO’s future performance.
• Nondisclosure of accounting changes: Because TYCO failed to report depressed earnings after the CIT acquisition and have endured many SEC probes; investors are concerned that TYCO will be the next Enron. This leads to the possibility that the company is choosing to hide other information from investors as well.
• Concerns with top management: TYCO paid a total of $20 million to Frank
Walsh, a lead director of the corporate governance committee (a board of independent directors), for his help in the CIT acquisition. Walsh was supposed to be an independent party, yet he owned 50,000 shares of CIT prior to the acquisition, thus enhancing his interest in the company. Half of the $20 million paid out went to support a charitable fund in which Walsh is a trustee.
• Uncertainty of TYCO’s break-up plan: The January 22, 2002 announcement of
the plans to split into four independent public companies generated a negative market reaction which is somewhat rare for this type of news. Due to the uncertainty of the break-up plan, investors remain wary of future performance.
Sell Recommendation (Golden Telecom and Tele Sudeste)
It is my belief that in order to stay within the class objective of creating a more
manageable portfolio and maintain our asset allocation objective, Golden Telecom, Inc. and Tele Sudeste Celular should be sold. Our current holdings in TSD is minimal ($3, 750) and both have had significant declines (-58% for GLDN and -37% for TSD). The class has already determined that we can meet our return objective of 9% without investing in international equities. Our chosen asset allocation scheme will be 13.6%
small cap, 56.2% large cap, and 30.2% bonds (and no international securities). The difference in risk levels due to the elimination (or at least reduction) of international exposure is minimal with the standard deviation changing from 12.3% with international securities to 12.4% with them.
Projections have also indicated that the telecommunications sector should be under weighted. Sales in this sector are expected to decline in 2002 and there are also concerns about past practices in the telecom sector, called hollow swaps. Many telecom companies exchanged capacity on each other’s networks. However, some treated these swaps as revenues, leading to investigations. Although neither of these companies has been mentioned specifically and I do not expect this to be another Enron incident, it is something that we should consider when evaluating telecommunications companies.
It is difficult to obtain long-term estimates on these equities. No growth estimates
could be found, making it difficult to accurately value these companies. Difficulty in researching these equities provides another reason to sell. Expending energy to analyze equities that have not been performing well and represent a small portion of the portfolio is not efficient and may detract from our ability to manage the portfolio in an effective manner. Due to the above reasons and the fact that we have already decided that we need to trim the technology sector to make it more manageable, I believe that selling Tele Sudeste and Golden Telecom is the best available option.
Starwood Hotels and Resorts The decision to sell Starwood Hotels and Resorts Worldwide, Inc., resulted primarily from the stock’s overvaluation. Starwood trades at approximately forty-nine times earnings while the industry multiple slightly exceeds fifteen. Neither Starwood’s financial statements or core operations justify the excessive multiple at which Starwood is currently trading. Our price target of $31.52 based on a discounted cash flow analysis suggests that the shares should trade at approximately 43 times its 2002 earnings per share estimate of $0.73. Thus, our discounted cash flow estimation provides evidence for Starwood’s overvaluation. In addition to its high trading price, Starwood has recently been named in a $100 million lawsuit. This lawsuit stems from the claim that Starwood defrauded quests by adding an improperly classified “resort fee” to their bill. The fact that Starwood either failed to disclose this fee or misrepresented the fee as a tax negatively impacts Starwood’s image. In addition to negative publicity, the firms’ bottom line may be affected through a financial settlement and from decreased clientele. Lastly, using a comparative analysis, Starwood is not the most attractive investment within the hotel and gaming industry. Given the fact that Starwood is overvalued, faces legal implications, and performers poorer than its competitors justifies its removal from the portfolio.
Grant Prideco Inc. (GRP)
On February 27, 2002, all 1,000 shares of Grant Prideco, Inc. were sold from the portfolio. This decision was based primarily on an economic hypothesis regarding the recovery time of Grant and Grant’s customers. Simply put, Grant would not recover until their customers began new exploration projects. There is a significant correlation between the performance of GRP and the companies that would use the products manufactured by GRP. Furthermore, there would be decreased exploration efforts by many of GRP’s customers throughout the next twelve months. This stemmed from the reduced quota from OPEC, as well as the excess supply of oil and gas in the markets. With this, it was thought to be unlikely that customers would need new exploration equipment in the relevant time horizon. It was our belief that demand for oilfield equipment would not rebound until early 2003. Thus, GRP was thought to potentially deteriorate further with decreased investment in exploration equipment from GRP’s clients in the oil and gas exploration industry.
Performing a company and industry comparison revealed that Grant had less attractive ratios than the industry and sector. Furthermore, Grant had a zero dividend yield. This is not consistent with the desired characteristics of companies in this sector. A higher dividend yield would enhance the stability of the portfolio. From a profitability standpoint, Grant’s historical performance had not met the industry and sector standards. This indicated inefficiencies that had detracted from the past five-year’s performance. There were no indicators that these under-performing returns would be subject to change in the near future.
A comparison of similar companies revealed that Grant had a relatively high PE and PEG ratio. This indicates that investors are paying a relatively high dollar amount for the expected earnings that Grant will receive over the next five years. The higher PE/PEG may be due to the fact that Grant was a riskier investment, as shown in their capital structure allocations. Grant has a much higher total debt to equity ratio than the competition. This relatively high risk was also illustrated through Grant’s extremely low interest coverage ratio. In summary, this comparative analysis showed that investors were paying a relatively high amount for earnings that were generated through a relatively risky capital structure. After combining our future economic assumptions with an analysis of comparables, it was decided that Grant would be eliminated from the portfolio.
DEVON ENERGY (DVN) – Within the inherited portfolio, we owned Mitchell Energy, which was acquired later by Devon Energy. Devon Energy Corporation is involved in oil and gas property acquisition, exploration, and production, and operates in various regions of United States and Canada, while also maintaining an international presence. We decided that by selling Devon Energy, we could more closely focus on the remaining, much stronger companies within the energy sector of the portfolio, which would better serve our time, efforts and objective of fully evaluating present and potential securities. More importantly, there
were other numerical indicators suggesting that Devon Energy would be a poor choice among other potential securities we could hold instead. Like other companies in this industry, Devon was hit hard in the tough economy, and they took major write-offs as a result of the reduced carrying value of their oil and gas. But instead of reducing their operative capacity, and focusing on their structure, this energy company underwent two acquisitions in 2001, one of which was Mitchell Energy. These acquisitions increased its debt exponentially, above its historical levels, resulting in a much higher debt to equity ratio. Besides this, we found other companies to be far more resilient in other comparative areas. Therefore, we believe the selling of Devon Energy was necessary, as the additional financial leverage was a near-term concern, and we felt we could use the proceeds to invest in a more sound company.
ISHARES DOW ENERGY INDEX – When we inherited the portfolio, Ishares comprised a significant portion of the Energy Sector. The index is a tracker, composed of various securities within the industry. Thus, it clearly did not meet the challenge we as a class agreed upon when we set out the standards of conduct. We felt the presence of such an index in our portfolio would not give us the chance to serve as equity analysts and would undermine the reason why we are here to begin with. It would limit our experiences, our learning potential and overall objectives of the class. Furthermore, with the recovering economy, and the oil surplus gradually being absorbed by the markets, we felt this was the ideal time to take advantage of the low prices on selected strong energy stocks. Because of the bad economy and other extraneous factors, many of the energy stocks suffered. Eliminating I-shares served a two-fold purpose. It allowed us to enrich our experiences and not rely on readily available indices. Secondly, this index was sold in order to raise sufficient cash for the purchase of Stat Oil, (STO), which we felt was a strong company and would be a significant contributor to the portfolio’s returns for this investment period, given the prospects of a good economy.
Sell Recommendation for Jones Apparel Group, Inc. 1) Our portfolio is currently over-weighted in Consumer Discretionary stocks. In
order to meet our weight requirement in this sector, we have to sell some of our holdings. Jones Apparel appears to be a weak stock in its sector indicated by its poor financial standing, including decreasing revenues and margins.
From the Annual Financials, revenue, gross profit, operating income, operating margin, net profit margin, and EPS decreased from 2000 to 2001. It has been hard times for the retailing and apparel industry, but compared to some of its competitors, Jones looks weak. For example, Brown Shoe and Liz Claiborne have been steadily increasing revenues and gross profit margin while these numbers have been decreasing with Jones. 2) Jones’ EPS estimates for this quarter and next quarter fall below the EPS numbers for the same quarters last year.
Jones reported on April 3, 2002 that EPS would be in the range of $0.62 to $0.64. The range by analysts is from $0.52 to $0.68, but for this quarter a year ago, EPS was $0.75. The next quarter’s average estimated EPS is $0.42, which is also lower than the year ago EPS of $0.47 for the same quarter last year.
3) Jones is currently being outperformed by its competitors. If we choose to hold a stock in this sector, we feel that there are better opportunities and investments in other companies.
Although Jones has the highest annual sales compared to its competition, its revenues have been decreasing while the competitors’ have been on the rise. We feel that this is indication that the competitors are gaining on Jones, especially Liz Claiborne whose revenue grew by 11.1% last year. The P/E ratio of Jones also makes it look expensive relative to its earnings compared to all but one of its competitors, Ann Taylor. Long-term debt per share is the highest for Jones amongst its competitors, which is another financial concern that we have about the company. 4) Last month, Jones announced that the Company might have to close 30 to 40 underperforming retail locations unless it can negotiate lower rents. This shows that Jones is having trouble recovering from the challenging retail environment.
Fred’s Inc. Sell Recommendation
Although Fred’s Inc. has performed profitably, several factors have influenced our decision to remove it from the portfolio. Fred’s stock price has consistently increased to a level that is no longer justified by the company’s operations. Using the discounted free cash flow method, Fred’s per share intrinsic value was calculated at $29.56, as opposed to it current trading price of $37.50. This overvaluation resulted even with generous growth estimates (23%) and a relatively low weighted average cost of capital of 8.73%. Therefore, eliminating Fred’s would allow the portfolio to capture a sizable return; whereas, continuing to hold the inflated stock could prove irrational given the analysis. At the time of sale, our portfolio holdings included one of Fred’s direct competitors, Walgreen’s. Through a comparable analysis, Walgreen’s profitability and risk indicators presented more attractive growth opportunities for the portfolio. This being the case, there was no reason to hold two direct competitors and expose the portfolio to redundancy. Furthermore, our sector exposure within the consumer discretionary sector was overvalued. The portfolio needed to trim down our holdings within this sector in order to meet our target sector weights and benefit from diversification. To meet this criterion, upon evaluation Fred’s was the most logical choice. Over Fred’s holding period, its return has exceeded 100%, which triggered concerns of overvaluation as high demand artificially forces the trading price above a value supported by the fundamentals of the firm. For Fred’s this was the case. The high stock price incorporated unrealistic expectations, optimistic growth potential due to the failure of Kmart, and inflationary pressures due to high demand for the stock. With all of these factors in mind, the traditional guideline of “buy low, sell high” applied perfectly for the removal of Fred’s.
General Electric Company (NYSE: GE)
Recommendation: Sell A number of reasons contributed to the decision to sell General Electric from the Anne Rife Cox Endowment Fund. At the top of these is the class’s belief that their energies can be used more effectively elsewhere, as GE has 70 analysts who follow the stock resulting in what we believe to be a fair valuation of the company. In addition the complex organization of General Electric makes valuation attempts extremely complicated. In order to conduct a fair valuation the class would be required to break down and model each subsidiary of GE. Similar problems occur when trying to find comparables for the company. While other conglomerates such as 3M do exist, none of these truly serves as an adequate comparable of General Electric’s operations. The best way to conduct a comparable analysis would be to break down GE by subsidiary and create a list of comparables for each individual branch of GE. The compilation of the comparables might not be out of the question but, the analysis of the information would certainly be tedious and with a low prospect of discovering a discrepancy in the stock price. Finally, the post-Enron world has resulted in GE releasing more financial information than before, producing more financials to sort through in order to reach a valuation. Overall, the class felt that selling GE made a sound decision, as any efforts to conduct a valuation would prove to be lengthy and not reveal any mispricing within the market.
Ann Rife Cox Investment Fund Summary Buy Information
Delta Air Lines, Inc. (DAL) 2,000 29.302 58,604 100 58,704 4/9/02 4/12/02 29.07 -0.79%
*The following stocks were added to our holdings as portfolio balancing trades on 4/22/02. Four Seasons (FS) – 900 shares Citigroup (C) – 800 shares Novartis (NVS) – 500 shares Delta Air Lines (DAL) – 1200 shares American International Group, Inc. (AIG) – 500 shares UNUMProvident (UNM) – 500 shares
The above is a summary of the stocks that were purchased during the Spring 2002 semester. Throughout the buy recommendation process many stocks were discussed, and these were the ones the class believed would create the most value for our client. So far the class has been pleased with its selections. The final column in the table shows the percentage change in price from the date we purchased the sock up to 4/19/02. The average return of the stocks purchased throughout the semester (not including the portfolio balancing trades) was 5.47% as of 4/19/02. For the same holding period, the S&P 500, one of our benchmarks, had a return of –1.87%. Our portfolio additions for the short time period since purchase have outperformed the S&P 500 index by 7.34%.
We believe the securities added to the Ann Rife Cox Fund during the 2002 year have enriched the client’s portfolio and will continue to contribute to the 9% target return. Please refer to the following synopsis reports on each security. These will show our motivation for purchasing each of these stocks. Complete analyst reports on each of our buy decisions are available for download on our website. (www.finance.cox.smu.edu/~portfolio/undergrad)
Four Seasons Hotels Buy Recommendation Four Seasons Hotels and Resorts, Inc.’s addition to the portfolio resulted from a thorough analysis of the company’s per share value, market behavior, internal and operational strengths, as well as competitive landscape. In calculating Four Season’s intrinsic per share value, a discounted free cash flow analysis demonstrates its undervaluation. Using a 23% five-year growth rate and a weighted average cost of capital of 11.98%, the value of Four Seasons, on a per chare basis, is $68.03. Given the fact that the company was trading at $54.85, the analysis provides significant evidence for growth potential. Using a Price-Earnings analysis, the implied stock price for December 31, 2002, was calculated at $67.51. The fact that both quantitative analyses support the fact that Four Season’s is trading below its intrinsic value in the marketplace provides an opportunity for the portfolio to advantageously secure a mispriced stock. Taking into consideration the economic outlook, Four Season’s seems to track the S&P 500 closely with more volatility, which proves beneficial considering the expected rebound of the economy. The slowly approaching economic turnaround will only benefit Four Season’s growth, as will the increase of travelers. Since September 11, travel sentiments and the travel industry in general have suffered due to consumer fears. This negative sentiment has more than been priced into Four Season’s stock price, and in fact accounts for some of its undervaluation. Therefore, the opportunity to purchase a strong company at below fair value makes it an attractive buy. Four Season benefits from a management team that has years of experience with the company and within the industry. On average, its eight-person executive management team has twenty-one years of experience with Four Seasons. And the twenty-seven corporate vice presidents and fifty-five higher level managers posses thirteen years of experience. Four Season’s earnings are mostly driven through management revenues; therefore, its strong management and within-firm hiring process function to maintain the stability and growth of the firm. In order to keep its position as a market leader, Four Seasons follows several objective criteria. For financial objectives, Four Season’s seek earnings per share growth of 20%, focuses on income from management operations (90%), reinvests 70% of its cash flows into new projects, maintains an investment grade balance sheet, and maintains adequate cash flow reserves in relation to debt. Four Season’s growth objects demonstrate the company’s desire to increase revenues and market share through operational growth. For example, Four Seasons expands its portfolio with new hotels and resorts in current areas of operations, develops operations in new countries, and sets target revenue per available room growth rates. In order to hedge risk, Four seasons utilizes several risk mechanisms to avoid unexpected surprises. These include pegging revenues to the US dollar, high cash reserves, political and operational risk insurance, and geographic and enterprise diversification. All of these key financial, growth, and risk objects keep Four Season’s cost of capital low and keep its financial statements profitable, which allows further expansion and growth. In fact, Four Seasons current expansion program will place the company’s hotels and resorts in thirty-three countries. Lastly, through a comparable analysis of Four Seasons and its top competitors, Four Seasons profitability, capital structure, financial, and growth numbers surpass the competition. Given all of these factors, Four Seasons provides growth opportunity, diversification benefits, and puts a highly successful and stable company within our portfolio at an undervalued price.
Highlights
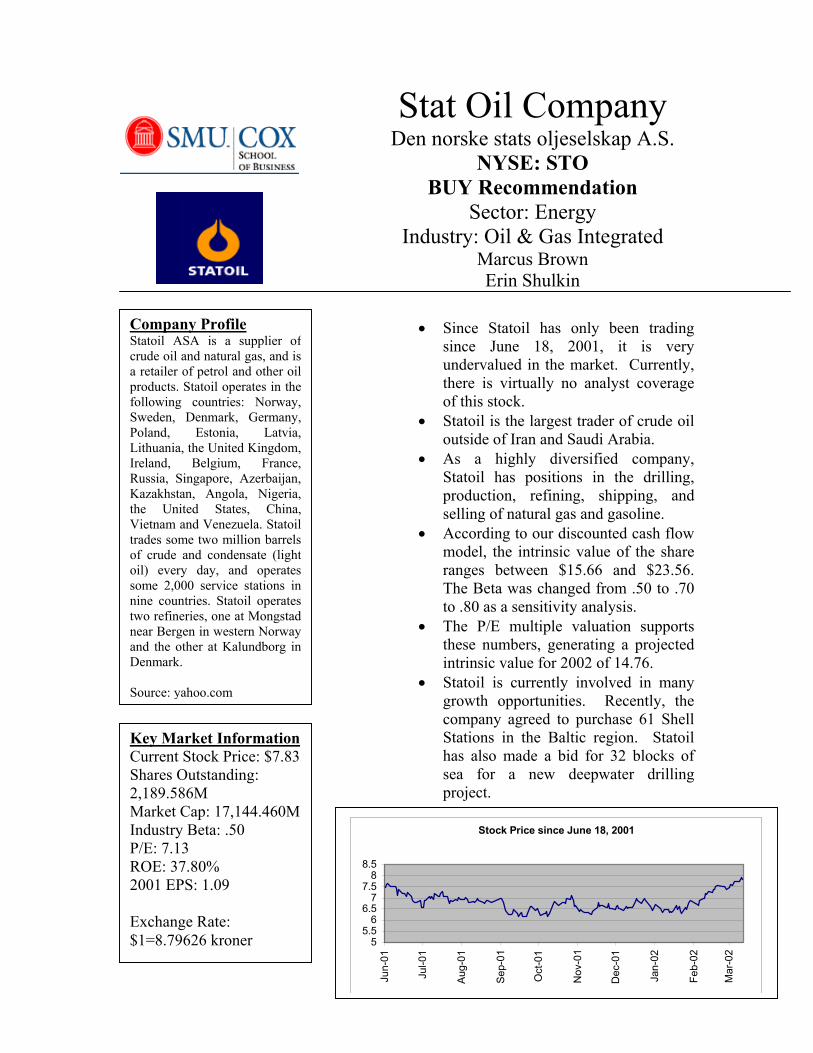
Key Market Information Current Stock Price: $7.83 Shares Outstanding: 2,189.586M Market Cap: 17,144.460M Industry Beta: .50 P/E: 7.13 ROE: 37.80% 2001 EPS: 1.09 Exchange Rate: $1=8.79626 kroner 5
5.56
6.57
7.58
8.5
Jun-
01
Stat Oil Company Den norske stats oljeselskap A.S.
NYSE: STO BUY Recommendation
Sector: Energy Industry: Oil & Gas Integrated
Marcus Brown Erin Shulkin
• Since Statoil has only been trading since June 18, 2001, it is very undervalued in the market. Currently, there is virtually no analyst coverage of this stock.
• Statoil is the largest trader of crude oil outside of Iran and Saudi Arabia.
• As a highly diversified company, Statoil has positions in the drilling, production, refining, shipping, and selling of natural gas and gasoline.
• According to our discounted cash flow model, the intrinsic value of the share ranges between $15.66 and $23.56. The Beta was changed from .50 to .70 to .80 as a sensitivity analysis.
• The P/E multiple valuation supports these numbers, generating a projected intrinsic value for 2002 of 14.76.
• Statoil is currently involved in many
Company Profile Statoil ASA is a supplier ofcrude oil and natural gas, and isa retailer of petrol and other oilproducts. Statoil operates in thefollowing countries: Norway,Sweden, Denmark, Germany,Poland, Estonia, Latvia,Lithuania, the United Kingdom,Ireland, Belgium, France,Russia, Singapore, Azerbaijan,Kazakhstan, Angola, Nigeria,the United States, China,Vietnam and Venezuela. Statoiltrades some two million barrelsof crude and condensate (lightoil) every day, and operatessome 2,000 service stations innine countries. Statoil operatestwo refineries, one at Mongstadnear Bergen in western Norwayand the other at Kalundborg inDenmark. Source: yahoo.com
growth opportunities. Recently, the
company agreed to purchase 61 Shell Stations in the Baltic region. Statoil has also made a bid for 32 blocks of sea for a new deepwater drilling project.
Stock Price since June 18, 2001
Jul-0
1
Aug-
01
Sep-
01
Oct
-01
Nov
-01
Dec
-01
Jan-
02
Feb-
02
Mar
-02
• Statoil is an established enterprise that has developed into a world leader in oil and gas. Statoil is the world leader in crude oil trade (with the exception of Iran and Saudi Arabia’s state owned oil companies).
• Statoil is undervalued due to low analyst coverage and the fact that it has been
publicly traded for less than one year. Once the market adjusts, Statoil’s stock price should increase dramatically. Our price target ranges from 15.26 to 23.56.
• Biggest bang for your buck – Based on comparables listed, Statoil is the most
profitable, yet it carries the lowest price premium in terms of P/E Ratio and Price to Sales.
• Statoil benefits our portfolio with its low beta by lowering the overall volatility
of the portfolio.
• Statoil would be a great replacement for Ishares (IYE), because not only does Statoil match our learning objective, it has outperformed Ishares.
• Due to the importance of the importance of oil and natural gas to the Norwegian
economy, Statoil has the support of the national government.
• Management has a great balance of new leaders with fresh ideas and individuals with years of experience with the company and within the industry.
• Statoil has outperformed its major competitors (ExxonMobil, Chevron Texaco,
Total Fina, and British Petroleum).
• Statoil is expected to grow due to its recent acquisitions of Shell stations in the Baltic region and the new drilling prospects.
• Encouraging Fourth Quarter results are expected to continue.
AmeriCredit Corporation NYSE Symbol: ACF
Sector: Financial Services Debt Rating: Ba1 Parvaneh Nilforoushan Paria Rafiee Company Profile AmeriCredit Corporation has been operating in the automobile finance business since September 1992. Through its branch network, AmeriCredit purchases automobile finance contracts without recourse from franchised and select independent automobile dealerships and makes loans directly to consumers buying late model pre-owned and new vehicles. AmeriCredit targets consumers who are typically unable to obtain financing from traditional sources. Funding for the Company’s auto lending activities is obtained primarily through the sale of loans in securitization transactions. Select Financial Data Stock Price $37.99 P/E 11.48 Shares Outstanding 84.9 M P/B 2.83 Market Capitalization $3.23 B P/CF 12.37 EPS $3.31 PEG 0.495 LT growth rate 23.20% ROE 25.7% 52-week low $14.00 ROA 7.5% 52-week high $64.90 Total Debt/Equity 1.97 Beta 1.71 Leverage Ratio 3.41 Summary Bullet Points
• Industry Leader: Controlled growth, enhanced profitability and proprietary risk management skills have allowed AmeriCredit to lead the middle market auto finance industry.
• Historical Performance: AmeriCredit consistently outperformed the S&P 500
prior to the September 11th attacks. With a beta of 1.71, AmeriCredit is expected to outperform the S&P 500 again given the positive outlook for the market in 2002.
• Customer Focus: By understanding what customers want, AmeriCredit is able to
present the right products and services to each unique customer.
• Risk Management: Prudent reserve levels and expanding margins are available to offset higher expected credit losses in a weak economy.
With ample opportunities available for growth, AmeriCredit has capitalized on the favorable market environment by tightening its lending standards several times over the past few years. These steps, which included raising minimum acceptable credit scores, have served the Company well. The effect of these initiatives can be seen in the Firm’s credit quality trends as charge-offs declined to 3.6% of the average managed portfolio for fiscal 2001, compared to 4.0% for fiscal 2000.
Earnings per share grew to $2.60 for fiscal 2001,compared to $1.59 last fiscal year. Excluding thecharge, projected 2002 earnings per sharesestimates were between $3.76 and $3.84. Thefirst quarter of the 2001 fiscal year markedAmeriCredit’s 32nd consecutive quarter ofincreased earnings per share.
• Continued ROE Growth: AmeriCredit’s return on equity ratio has been consistently increasing over the past four years with a current ROE of 25.7%.
Moreover, AmeriCredit’s return on equity ratio has been consistently increasing over the past four years with a rise of 4.5% from Fiscal 2000 to Fiscal 2001. As of the second quarter of Fiscal 2002, AmeriCredit’s return on equity ratio had risen to 27.3% with projections for the year-end ROE increase to be even higher.
Discounted Cash Flow Analysis: Using 23.20% as the EBIT growth rate from 2003-2006 and a WACC of 13.55%, AmeriCredit’s intrinsic value per share is calculated to be $49.70 as of 04/01/02.
•
• Novartis AG is an undervalued security with an estimated price tar-get between $46 and $49.
Target supported by DCF analysis based upon conservative estimations of future business transactions and assumptions about currency ex-change rates, industry growth, and the continuation of some current trends.
• Strong sales growth, especially in pharmaceuticals and generics, cou-
pled with continued success in the merger market will yield double-digit sales growth for near term.
During the tenure of Dr. Daniel Vasella, Novartis has successfully refo-cused its businesses in its most profitable areas, and has become one of the most successful acquirers of businesses worldwide.
• Novartis’ market exposure includes an increasing American compo-
nent, but also stable European, Japanese and Australian healthcare markets.
Novartis is enjoying the benefits of a growing industry worldwide, al-lowing greater opportunity and less risk than a comparable American-focused model.
• In a time of uncertain governmental regulation of the drug industry, Novartis has fostered a humanitarian image with governments in Europe, the US and Japan.
Through drug-discounting programs and careful attention to rules & regulations, Novartis has fostered relationships with the EU, US and Japanese bodies that yield a better (product) approval rating than anyone else in the industry.
Novartis AG Buy Recommendation
Value Buy - Price Target $47
the anne ri fe cox endowment fund buy recommendation March 2002
Price Target: $47
Price Target $47
Current Price $39
52 Week Low $33
52 Week High $43
EPS (02) *E 1.75
EPS (01) 1.64
Beta 0.65
Swiss franc (in$) 0.61
Worldwide Sales 54
Trailing P/E 23.9
Shares Out. (bil.) 2.5
Dividend (01) 0.52
Div. Yield 1.33
VITAL STATISTICS
Company Highlights
• Successful acquisition and merger strategy
• Recently purchased 30% of shareholding of largest Swiss com-petitor, Roche
• Largest number of new product approv-als from the US FDA last year (2001)
• Concentrating into core Pharmaceutical business—most prof-itable segment.
Company Overview Novartis is a Swiss com-pany which is currently globally engaged in sales and product innovation in the areas of pharmaceuti-cals, generics, consumer health, eye care, and ani-mal health.
P ag e 1 N o v a r t i s AG Price Target: $47
Current Holding: 350 shares @ 58.61 = $20513.50
Price for SRCL
Fundamentals Shares (Millions) 18.706
Market Cap (Millions) 1,164.640
Earnings 1.150
Price / Earnings 52.391
Relative P/E 0.870
Last Dividend Reported () NA Dividend Yield (Trailing 12mo.) NA
Relative Dividend Yield NA
90 Day Volatility 35.503
Beta 0.691
Stericycle, Inc. Level I Report NASDAQ Ticker: SRCL Grayson Jenkins
Company Description are the largest regulated medical management company in North erica, serving approximately
,000 customers throughout the States, Canada, Puerto Rico and xico. We have the only fully grated, national medical waste gement network. Our network
es 36 treatment/collection centers additional transfer and collection We use this network to provide ustry’s broadest service offering, ding medical waste collection, rtation and treatment and related
sulting, training and education es and products. Our treatment ologies include our proprietary ro-thermal-deactivation system ”) as well as traditional methods s autoclaving and incineration.”
Source: Stericycle
Investment Highlights rowth Potential: The regulated edical waste industry is an emerging dustry and has enormous growth tential in the mid 20% range for the coming years stemming from veral growth drivers. dustry Leader: Stericycle has sitioned itself as the market leader its industry, as it is the only rtically integrated company with a tional network of services better le to serve extensive customer ses. Through the growth thquisition strategy and its expected
60% growth rate for the current year, RCL will continue to lead the dustry.
rough
rice Target: The stock has been ading around $60, but has a year-end ice target ranging from $74.23 to 8.27 based on P/E and Discounted
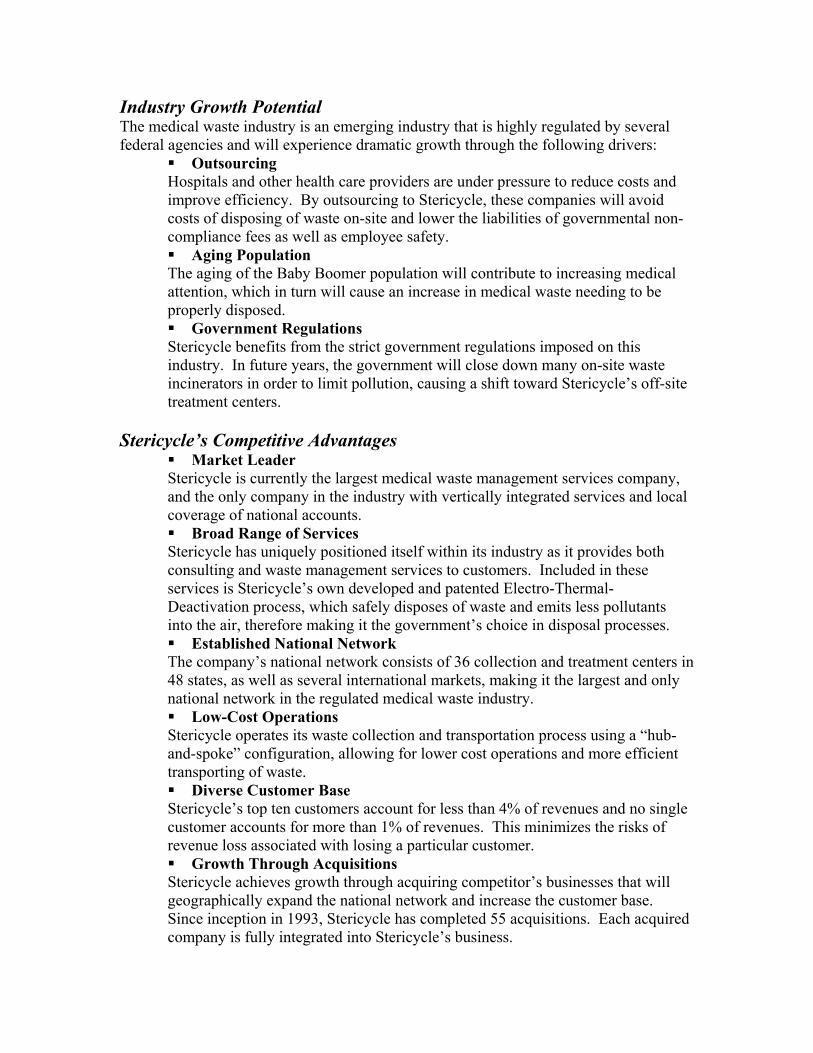
Industry Growth Potential The medical waste industry is an emerging industry that is highly regulated by several federal agencies and will experience dramatic growth through the following drivers:
Outsourcing Hospitals and other health care providers are under pressure to reduce costs and improve efficiency. By outsourcing to Stericycle, these companies will avoid costs of disposing of waste on-site and lower the liabilities of governmental non-compliance fees as well as employee safety. Aging Population
The aging of the Baby Boomer population will contribute to increasing medical attention, which in turn will cause an increase in medical waste needing to be properly disposed. Government Regulations
Stericycle benefits from the strict government regulations imposed on this industry. In future years, the government will close down many on-site waste incinerators in order to limit pollution, causing a shift toward Stericycle’s off-site treatment centers.
Stericycle’s Competitive Advantages
Market Leader Stericycle is currently the largest medical waste management services company, and the only company in the industry with vertically integrated services and local coverage of national accounts. Broad Range of Services
Stericycle has uniquely positioned itself within its industry as it provides both consulting and waste management services to customers. Included in these services is Stericycle’s own developed and patented Electro-Thermal-Deactivation process, which safely disposes of waste and emits less pollutants into the air, therefore making it the government’s choice in disposal processes. Established National Network
The company’s national network consists of 36 collection and treatment centers in 48 states, as well as several international markets, making it the largest and only national network in the regulated medical waste industry. Low-Cost Operations
Stericycle operates its waste collection and transportation process using a “hub-and-spoke” configuration, allowing for lower cost operations and more efficient transporting of waste. Diverse Customer Base
Stericycle’s top ten customers account for less than 4% of revenues and no single customer accounts for more than 1% of revenues. This minimizes the risks of revenue loss associated with losing a particular customer. Growth Through Acquisitions
Stericycle achieves growth through acquiring competitor’s businesses that will geographically expand the national network and increase the customer base. Since inception in 1993, Stericycle has completed 55 acquisitions. Each acquired company is fully integrated into Stericycle’s business.
Delta Air Lines (DAL) Betsy Miller
Erik Heath Recommendation: Buy Level 1 Analyst Report April 3, 2002 Highlights:
• Target Price: $48.10 • As the five largest airlines are included in
the S&P 500 index, the transportation sector is something in which we need exposure. The airline industry will always be around and Delta appears the strongest of these airlines.
• Since most of the other risks involved in running an airline seem manageable, terrorism seems to be the major concern.
• Through effective cost-cutting measures and an already strong competitive position, Delta is well positioned to take advantage of a rebound in air traffic.
Sept. 11 Impact/Terrorism Threat:
• The fear of further terrorist attacks is why Delta’s stock is appears so cheap. However, we believe these fears are overstated in the stock price.
• Zero revenue from FAA shutdown while expenses continually accrue
• Federal Government’s $5B stimulus package (Delta’s share = $650M) & guarantee $10B in loans over time
• Aviation and Transportation Security Act gave federal gov’t control of airport security: aim to expand Air Marshall program & set deadlines for standardized increased security measures.
• Increased insurance costs due to threat of war and terrorism
• Delta has incorporated these effects into their cost structure and business model.
Market Information Current Price 29.63 Market Cap 3,709 m Shares Outstanding 123.232 m Price/Earnings (’03) 7.08 2003E EPS 4.19 EPS (TTM) -8.45 Annual Dividend 0.10 Dividend Yield 0.24% Beta 1.266
Risks:
• Fuel prices: Currently down 40% from highs. Delta is well hedged for 2002 fuel expense.
• Economic Conditions: Air travel demand highly correlated with GDP. Business should increase as economy recovers.
• Competition: Highly competitive industry. Weak financial state of other airlines softens competitive environment
• Prices: With all major airlines exhibiting negative operating income, none are in a position to lower prices.
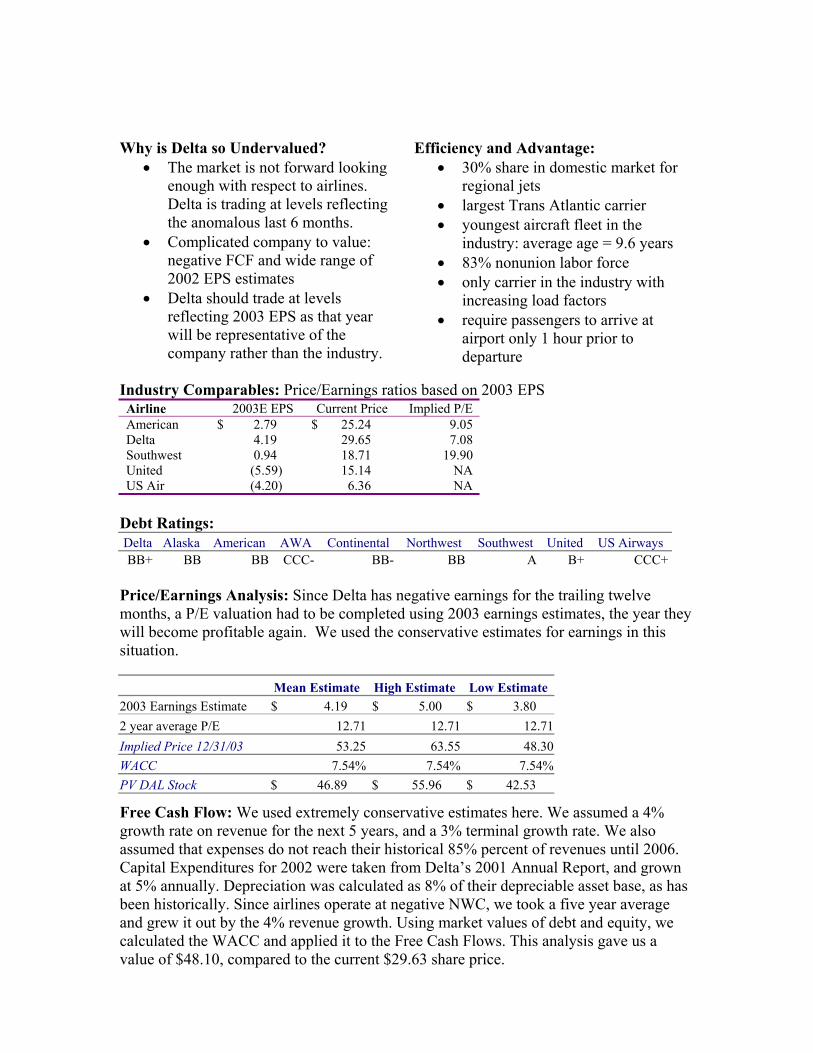
Why is Delta so Undervalued?
• The market is not forward looking enough with respect to airlines. Delta is trading at levels reflecting the anomalous last 6 months.
• Complicated company to value: negative FCF and wide range of 2002 EPS estimates
• Delta should trade at levels reflecting 2003 EPS as that year will be representative of the company rather than the industry.
Efficiency and Advantage: • 30% share in domestic market for
regional jets • largest Trans Atlantic carrier • youngest aircraft fleet in the
industry: average age = 9.6 years • 83% nonunion labor force • only carrier in the industry with
increasing load factors • require passengers to arrive at
airport only 1 hour prior to departure
Industry Comparables: Price/Earnings ratios based on 2003 EPS Airline 2003E EPS Current Price Implied P/E American $ 2.79 $ 25.24 9.05 Delta 4.19 29.65 7.08 Southwest 0.94 18.71 19.90 United (5.59) 15.14 NA US Air (4.20) 6.36 NA
Debt Ratings: Delta Alaska American AWA Continental Northwest Southwest United US Airways BB+ BB BB CCC- BB- BB A B+ CCC+
Price/Earnings Analysis: Since Delta has negative earnings for the trailing twelve months, a P/E valuation had to be completed using 2003 earnings estimates, the year they will become profitable again. We used the conservative estimates for earnings in this situation.
Mean Estimate High Estimate Low Estimate 2003 Earnings Estimate $ 4.19 $ 5.00 $ 3.80 2 year average P/E 12.71 12.71 12.71 Implied Price 12/31/03 53.25 63.55 48.30 WACC 7.54% 7.54% 7.54% PV DAL Stock $ 46.89 $ 55.96 $ 42.53
Free Cash Flow: We used extremely conservative estimates here. We assumed a 4% growth rate on revenue for the next 5 years, and a 3% terminal growth rate. We also assumed that expenses do not reach their historical 85% percent of revenues until 2006. Capital Expenditures for 2002 were taken from Delta’s 2001 Annual Report, and grown at 5% annually. Depreciation was calculated as 8% of their depreciable asset base, as has been historically. Since airlines operate at negative NWC, we took a five year average and grew it out by the 4% revenue growth. Using market values of debt and equity, we calculated the WACC and applied it to the Free Cash Flows. This analysis gave us a value of $48.10, compared to the current $29.63 share price.
Fixed Income Portfolio Topic I: 2001 Fixed Income Portfolio Position
The initial positions in the portfolio made significant bets on how the market would perform. These bets occurred in three main areas: sectors, maturity, and credit quality. The allocation of our bonds across sectors was extremely concentrated and limited to two sectors: industrial and finance. This prevented the fund from diversifying away any of the unsystematic risk present in these sectors and placed a huge bet on the performance of these sectors. Additionally, the portfolio held no Treasury or Mortgage backed securities, which are the two largest components of indexes such as the Lehman Aggregate. The second area, maturity, was less extreme in its position; the maturity of the bonds was between four and five years, but the concentration of bonds in the one to ten year range of maturity and the lack of longer-term bonds unnecessarily lessened the potential return if interest rates suffered extreme volatility. The most significant and risky bet taken by the portfolio was the large amount of high yield bonds. Nearly 26% of bonds were below investment grade, so if credit spreads failed to tighten the portfolio would under perform; these positions create an extremely risky bond portfolio due to the focus they create on less credit worthy bonds. The potential consequences for this level of risk were demonstrated by the performance of Kmart bonds following that company’s filing for Chapter 11 bankruptcy. The strategy of focusing on specific sectors and below investment grade bonds failed to produce the desired results in 2001. Topic II: Goals for the 2002 Fixed Income Portfolio
In evaluating our 2001 position, we were concerned with the portfolio’s exposure to the junk bond market. Having three out of six securities classified as high-yield, our fixed income portfolio was quite susceptible to fallout from the economic recession of 2001-2002. Thus, we liquidated our positions within the junk bond market in order to make our portfolio more consistent with a conservative bond portfolio. According to the Asset Allocation, approximately 30% percent of our portfolio should be dedicated to the fixed income market. By concentrating primarily on the investment grade bond market, the portfolio will yield more reliable returns over the coming years and concentrate overall portfolio risk on the equity market.
Furthermore, a comparison of our portfolio with the Lehman Aggregate revealed significant underweighting in treasuries, agencies, and mortgages. Since these three sector exposures comprise 69.4% of the Lehman Aggregate, our portfolio’s 0% composite within these sectors was incompatible with our 2002 economic outlook. In addition, our 23.1% industrial exposure and 34.3% financial exposure exceeded those of the Lehman Aggregate by high margins. In order to align our fixed income portfolio with the Lehman Aggregate, we wanted to
reposition our holdings to include treasuries, agencies, and mortgages while reducing our holdings of industrials and financials.
Another concern involved the Lehman Aggregate’s apparent susceptibility to interest rate volatility. Since 46.7% of the Lehman’s bond holdings have maturities between 5 and 10 years, interest rate fluctuations would cause the value of this portfolio to vary considerably. Not wanting to expose our fixed income portfolio to as much interest rate risk as the Lehman, we decided to allocate our holdings to achieve an average maturity of approximately 4 years. Topic III: Strategies to Achieve Our Goals
Liquidating our junk bond positions of Kmart, CNA, and Lyondell, gave the class approximately $500,000 to reallocate to new investment grade securities. Concentrating on default-free and AAA bonds, we purchased $100,000 of 2.5-year Treasury strips and $100,000 of 10-year Treasury notes. With these transactions, we increased our Treasury exposure from 0% to 27.3%. Another $100,000 was invested in Fannie Mae agencies with 4-year maturities, augmenting our agency sector exposure to 13.5%. Finally, in purchasing $200,000 of 5-year Ginnie Mae CMO’s, we increased our portfolio’s mortgage exposure from 0% to 27.2%.
Combined, these transactions bring our fixed income portfolio’s AAA+ and AAA ratings to 68% and sub-grade bond ratings to 0%. By allocating funds to securities with both short and long-term maturities, our portfolio will have a duration of approximately 4 years as well as a convexity that would not have been attained if we purchased securities with only 3-5 year maturities.
In conclusion, we have acted in accordance with what we believe to be realistic and attainable goals for our fixed income portfolio. The before and after positions of our fixed income portfolio can be viewed in Exhibits 1 and 2 respectively.
EXHIBIT 1 Initial Portfolio versus the Lehman AggregateDesired dollar exposure 731000
MaturityCASH 42.7% 0.0%1 TO 3 YEARS 14.2% 19.0% (W ells)
3 TO 5 YEARS 27.0% 17.9% (CNA, Ford ,Kmart)
5 TO 10 YEARS 16.2% 46.7% (Lyondell, Southwest)
Greater than 10 0.0% 16.5%
CreditAAA+ (GVT) 69.3%AAA 5.7%AA3 14.2% 5.0% (W ells Fargo)
A3 13.6% 10.9% (Ford)
BAA1 3.6% 9.2% (Southwest)
BAA2 6.5% 0.0% (CNA)
BA3 12.5% 0.0% (Lyondell)
CA 6.9% 0.0% (Kmart)
CASH 42.7% 0.0%
EXHIBIT 2
Desired dollar exposure $731,000
Sector Exposure Current % Lehman AggregateTREASURY 27.3% 22.0% 100K each 2.5 and 10 yr T-note
AGENCY 13.5% 12.0% 100 K FNMA 4 yr
MORTGAGE 27.2% 35.4% 200 K 5 yr GNMA CMO
ABS 1.7%INDUSTRIAL 3.6% 10.7% Southwest
FINANCE 27.7% 7.3% Wells, Ford
UTILITY 2.0%Foreign 8.8%Cash 0.6%Total Fixed Income 100.0%
MaturityCASH 0.6% 0.0%1 TO 3 YEARS 27.8% 19.0% Wells + 2.5 yr T-strip
3 TO 5 YEARS 27.1% 17.9% Ford + 100K FNMA
5 TO 10 YEARS 30.8% 46.7% Southwest + CMO
Greater than 10 13.7% 16.5% 10 yr T-note
Total Fixed Income 100.0%
CreditAAA+ (GVT) 54.5% 69.3% CMO + Treasuries
AAA 13.5% 5.7% 100 K FNMA 4 yr
AA3 14.2% 5.0% (Wells Fargo)
A3 13.6% 10.9% (Ford)
BAA1 3.6% 9.2% (Southwest)
Sub-Grade 0.0% 0.0%0.6% 0.0%
Income 100.0%
Comparison of Ending Portfolio with Lehman Aggregate
CASH
Total Fixed
Portfolio Performance Annual Cox Returns vs. Benchmark
essening
Figure 1: Annual Cox Returns vs. Benchmark
-10
0
10
20
30
40
50
1997 1998 1999 2000 2001
Ann
ualiz
ed R
etur
n in
%
Cox
BlendedBenchmark
Went 40% Foreign
(Asian Flu)
Overweighted Tech and Telecom
Overall, the Cox Portfolio has performed below the practicum benchmark for the past five years (see Figure 1, Figure 2). This practicum benchmark is comprised of 90% of the Russell 3000, and 10% of the Lehman Government Credit Index. This five-year performance was hindered by the poor performance in 1997 and 1998. The worst performance was realized in 1997, where the portfolio performed 16.79% below the benchmark. This was due to the fact that the class invested 40% of the funds into foreign markets. Unfortunately, foreign markets were hit severely, which had a profound effect on our portfolio due to heavy allocations in foreign markets. This negative effect carried over into 1998, although to a lesser degree. This lgap was also influenced by a lower benchmark return.
In the following three years, the portfolio rebounded to outperform the benchmark. The portfolio’s best performance was in 1999, due to the overweight exposure in telecom and technology stocks. In this year, the portfolio realized a return of 31.88%, which was 11.94% above the benchmark. In 2000 and 2001, both the benchmark and the Cox Portfolio experienced a negative return. Nevertheless, the Cox Portfolio still outperformed the benchmark with a smaller negative return. We expect this positive trend to continue as we move further away from 1997 and 1998. This expectation is supported by the fact that the portfolio has realized a return of 1.85% while the benchmark has had a return of 0.94% in the first quarter of 2002.
Figure 2: Compound Return of the Cox Portfolio over Various Time Periods Practicum Wilshire Cox Portfolio Benchmark* 5000 T-Bills 1 yr -7.77% -8.98% -10.96% 0.04% 3 yr 17.69% 0.51% -1.96% 0.14% 5 yr 44.24% 58.50% 58.88% 0.24% * Practicum Benchmark = 90% Wilshire 500, 10% Lehman Aggregate
JP Morgan Performance Measurement JP Morgan Performance Measurement Model was applied to the Cox Anne Rife Endowment Portfolio. This portfolio was measured against the universe of core managers, consisting of 861 funds total. The eight-quarter rank is 175th out of the 861. The twelve-quarter rank is 41st out of 823. The twenty-quarter rank is 234th out of 509. Furthermore, the portfolio outperformed the S&P 500 in both the eight and twelve quarter ranking.