1 Economic Perspectives of Renewable Energy Systems Present Contribution of Renewables to Energy Supply, Renewable Energy Sources and Technologies, Assessment of Renewable Energy Technologies, Key European Renewable Energy R&D, Forecast for Renewables Gerhard Faninger Energy Economics Group ( EEG) At the Institute of Energy Systems and Electric Drives, Vienna University of Technology, Lecture 2011/2012
Transcript
1
Economic Perspectives of Renewable Energy Systems
Present Contribution of Renewables to Energy Supply, Renewable Energy Sources and Technologies,
Assessment of Renewable Energy Technologies, Key European Renewable Energy R&D,
Forecast for Renewables
Gerhard Faninger
Energy Economics Group (EEG) At the Institute of Energy Systems and Electric Drives,
Vienna University of Technology, Lecture 2011/2012
2
CONTENT Preface / Introduction 4 1. World and OECD Total Primary Energy supply 2009 6 2. Fossil and Nuclear Energy Outlook 10 3. Renewable Energy Sources and Technologies 14 4. Global Renewables Status Report 2010 15 5. Contributions of Renewables in Europe 2004 21 6. The Future of Renewables 23 7. The Attractiveness of Renewable Energy Sources 25 8. Renewable Energy Technologies on the Market, in Demonstration
and in the Concept-Phase 26 8.1 Hydropower 27 8.2 Bio-energy 28 8.3 Solar Heating and Cooling 28 8.4 Solar Electric Systems (Photovoltaic) 30 8.5 Wind Energy 30 8.6 Geothermal Energy 30 8.7 Solar Thermal Power 31 8.8 Solar Production of Fuels and Commodities 32 8.9 Solar High Temperature Industrial Process Heat 33 8.10 Solar Hydrogen Production 33 8.11 Concepts for Ocean Energy Systems 34 8.12 Concept for Floating Solar Chimney Technology 35 8.13 Concept for Solar Power Satellites 36
9. Market Introduction of Renewables 37 10. Estimating the Worldwide Possible Useful Potential
of Renewable Energy Sources 38 11. Towards a Sustainable Energy System 40
11.1 Requirements and Options for Future Energy Systems 40 11.2 The Role of Energy Policy to Promote Renewables Deployment 41
11.3 EU-Targets for Renewables and Energy Efficiency 45 11.4 Identifying Key Tasks for European Research
on Renewable Energy Technologies 48 11.5 Growing Political Consensus to
Promote Renewable Energy Technologies 51 12. Estimating the Future Energy System 52 13. Forecast for Total Primary Energy Supply
and share of Renewables to Energy supply 54 14. IEA World Energy Outlook 2035 59 15. Summary 69
References 71
3
ANNEX
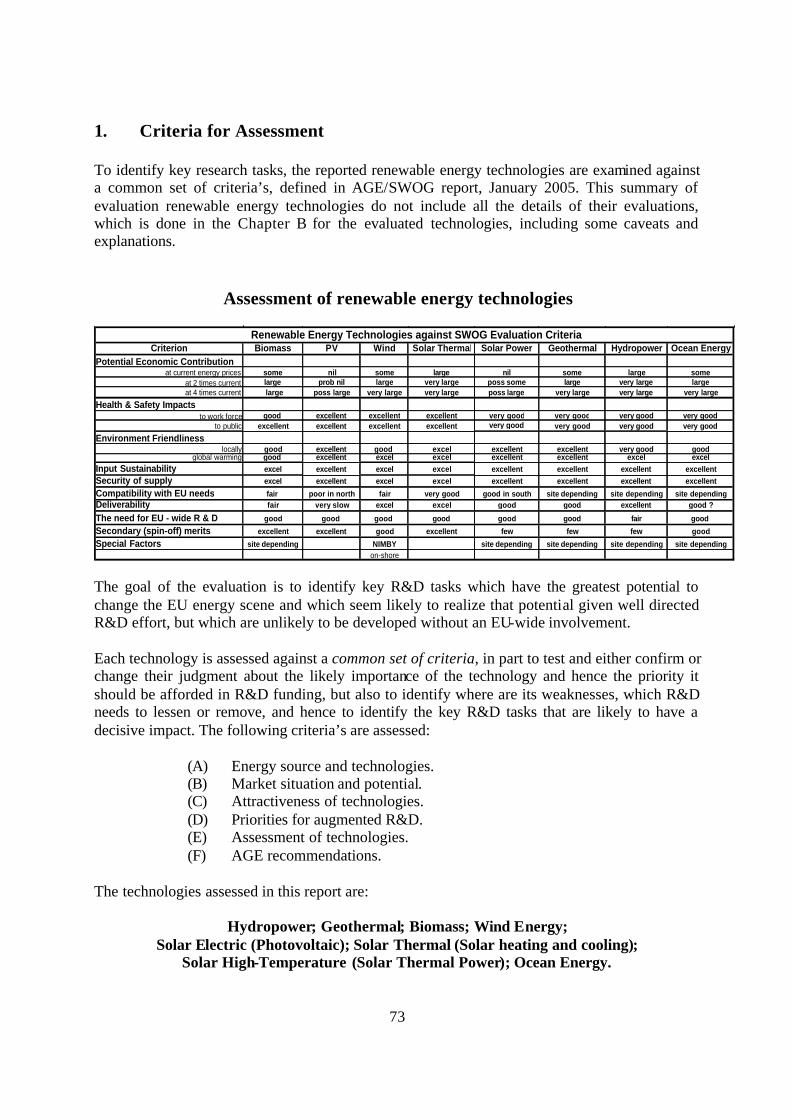
Assessment of Renewable Energy Technologies
1 Criteria’s for Assessment 73 2 Hydropower Technologies 74 3 Geothermal Technologies 78 4 Biomass Technologies 82 5 Wind Energy Technologies 88 6 Solar Electric Technologies (Photovoltaic) 93 7 Solar Thermal Technologies / Solar Heating and Cooling 99 8 Solar High-Temperature Technologies / Solar Thermal Power Plants 107 9 Ocean Energy Technologies 114
1. Renewable energy (Renewables) is energy that is derived from natural processes that are replenished constantly at a rate equal to or greater then the rate of consumption. In its various forms, Renewables derives directly or indirectly from the sun, or from heat generated deep within the earth. Renewables come in many forms: Electricity generated from solar, wind, biomass, geothermal, hydropower, and ocean sources; Heat generated from solar thermal, geothermal and biomass sources; Bio-fuels and hydrogen obtained from renewable sources. Therefore, Renewables are capable supplying most of worlds energy needs and have the potential to support global economic development.
2. Renewables technologies have made considerable progress over the last few decades.
Through technology development - much carried out through international collaboration - many Renewables options have reached levels of maturity that allow broad market deployment, while others are finding cost effective applications in expanding niche markets. The significant increase over the last few years of emerging technologies such as wind, solar both thermal and electric (photovoltaic, PV), as well as modern bioenergy plants, is concentrated in countries, which are leaders in R&D spending.
3. Even if Renewables production has doubled since 1970, the share of Renewables in
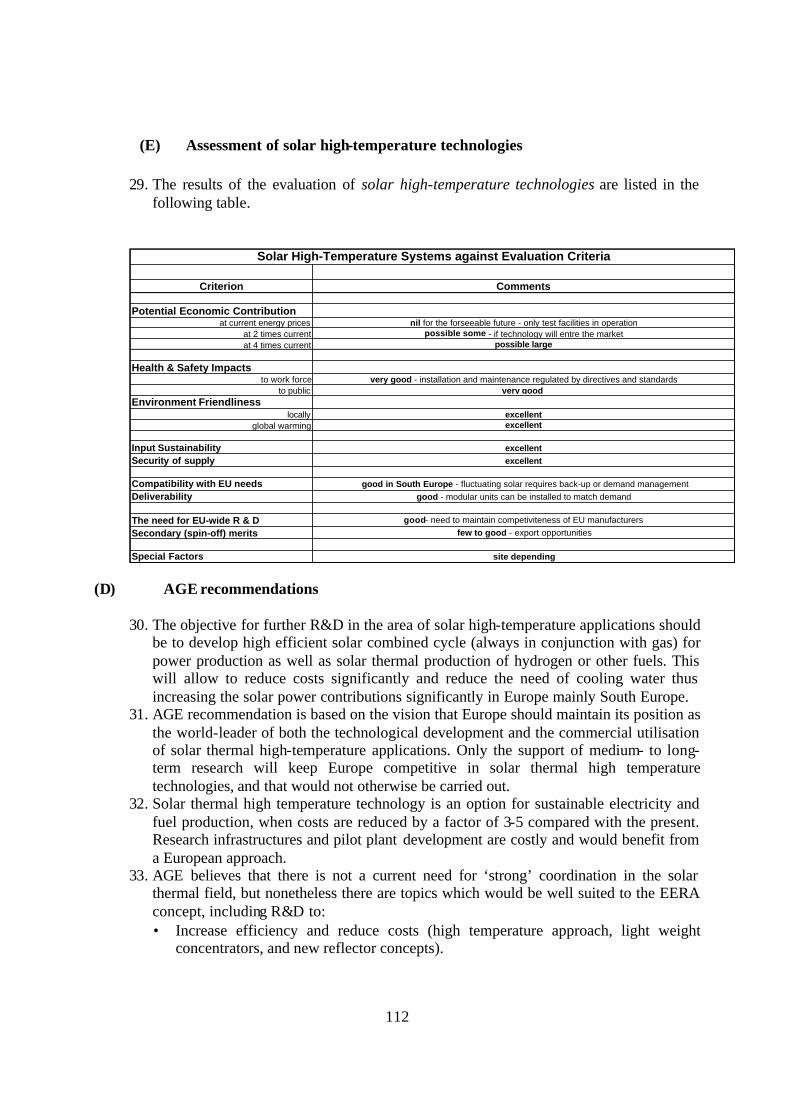
energy supply in EU-Member States has stagnated around 6%. This means that Renewables just could keep pace with the overall increase in energy demand but more needs to be done to expand their shares in the fuel mix. Thus more public supporting measures and initiatives in a larger number of countries will be necessary to raise renewable energy percentages in national and EU-level energy supply and to give Renewables technologies the role it could play to foster a more sustainable energy supply.
4. Renewables add to the diversity of the energy supply portfolio, and reduce the risk of
energy price fluctuations, as well as constraints on supply. Distributed Renewables provide options to consumers not otherwise available. And Renewables are the most environmentally benign of the options available in current and near-term markets. Also, Renewables are the only future eventually energy sources if fusion fails and coal remains dirty.
5. Expanded use of Renewables, in combination with increased energy efficiency as well as
rational energy use in all sectors of energy consumers can reduce dependence on imported fossil fuels, thus enhancing energy security and reducing greenhouse gas emissions.
6. Technological progress will influence the market deployment of Renewables
technologies. Commitment on the part of policy and industry is necessary to stimulate demand and significantly increase use of emerging Renewables technologies.
5
7. More Renewables research is required to increase the efficiency of existing technologies,
to develop new technologies, processes and products and to drive down significantly the costs for the production of heat, power and fuels from Renewables. An increased public R&D spending should go hand in hand with increased involvement of the industry to ensure the market up-take of the generated results.
8. Both the extension and the use of Renewables have also created other positive effects e.g.
technological innovations. The industry producing the facilities for the use of Renewables belongs to the most dynamic sectors of the European economy. This guarantees regional value added and secure jobs not only today, and offers excellent chances for the future.
9. Based among others on the extra long cycles in the energy system and on the commodity
nature of energy, the entry threshold for any new energy source will be high. Radical social und technical changes are needed if we are to reduce our alliance on fossil fuels.
10. Any long-term vision for European economic development must include Renewables, to
save finite energy sources and to build up an industry of strategic importance. 11. Energy systems with Renewables can be made more robust by decentralising both power
generation and control. The use of more distributed power generation systems would be an important element in the production for the consumers against power interruptions and blackouts, whether caused by technical faults, natural disasters or terrorism.
12. Price trends for coal, oil and gas are important for planning future energy systems, but are
less predicable. Important is the willingness for the transition from fossil fuels to Renewables.
13. EU funds are needed to strengthen existing competencies in the renewable energy sphere
and to intensify research and technological development according to the main principles of sustainable development.
14. The overall goal of an EU R&D initiative should be to achieve the leadership of EU-
Member States in the area of renewable energy technologies.
15. Due to their continually improving performance and cost, and given growing recognition of their environmental, economic and social benefits - Renewables will grow increasingly competitive with traditional energy technologies. More R&D funding for Renewables both in EU Member States and on EU level is needed. The increased R&D effort should start now, and will have to continue over a long period of time. If nothing is done to increase and focus the Renewables R&D effort, our society will not meet the energy challenges with Renewables to secure a sustainable energy future.
The following document describes the present energy supply worldwide and in Europe, the availability of energy carriers for future energy systems, the state of art for Renewable Energy Technologies, its market introduction and present contribution to Primary Energy Supply. On the basis of rough estima tes on technical potential of proved and unproved renewable sources, the possible contribution of Renewables to the long-term energy Supply Worldwide and in EU-Member States is analysed.
6
1. World and OECD Total Primary Energy supply 2009 Source: IEA World Energy Outlook 2010
Present Total Primary Energy Supply, TPES The worldwide Total Primary Energy Supply, TPES, in 2009 was about 293 EJ (12 267 Mtoe), of which oil provided 33.2%, coal 27.0%, natural gas 21.1%, nuclear 5.8%, hydropower 2.2% and other Renewables (geothermal, wind, solar, tide) 10.7%. The regional shares of TPES in 2009 was OECD 44.2%, Non-OECD Europe 0.9%, China 17.4%, Asia (excluding China) 11.5 %, Former Soviet Union 8.5 %, Africa 5.3 %, Middle East 4.8 %, Latin America 4.7 % and Bunkers 2.7 %. The worldwide Renewables contribution (66.25 EJ) consisted 79.9% biomass & waste, 16.3% hydropower, geothermal 3.1%, wind 0.4% and solar & tide 0.3%. From the biomass & Waste contribution 39 % are “non-sustainable” (deforestation). The OECD primary energy supply in 2009 was about 216 EJ, of which oil provided 37.2%, coal 19.7%, natural gas 24.2%, nuclear 11.3%, hydropower 2.1% and other Renewables (geothermal, wind, solar, tide) 5.5%. The Renewables contribution (16.45 EJ) consisted 53.2% biomass & waste, 35.1% hydropower, geothermal 9.0%, wind 1.6% and solar & tide 1.1%. Mtoe: million tonnes of oil equivalent 1 Mtoe = 4.1868 × 10⁴ TJ = 107 Gcal = 3.968 × 10⁷ MBtu = 11630 GWh
World Total Primary Energy Supply 2009Regional Shares of TPS
Middle East4,8%
China17,4%
Non-OECD Europe
0,9%
Asia11,5%
Latin America4,7%
Africa5,3%
Bunkers2,7%
Former Soviet Union8,5%
OECD44,2%
Total 2009: 12 267 Mtoe= 293.00 EJ
IEA-World Energy Statistics 2010
Includes international aviation and international
Asia excludes China
World Total Primary Energy Supply 2009Fuel Shares of TPS
Hydropower2,2%
Renewables10,7%
Nuclear5,8%
Coal/peat27,0%
Oil33,2%
Gas21,1%Total 2009:
12 267 Mtoe= 513.58 EJ
IEA-World Energy Statistics 2010
World Total Primary Energy Supply 2009Fuel Shares of TPS
Hydropower2,2%
Renewables10,7%
Nuclear5,8%
Coal/peat27,0%
Oil33,2%
Gas21,1%Total 2009:
12 267 Mtoe= 513.58 EJ
IEA-World Energy Statistics 2010
7
Share of Renewable Energy Sources for Worldwide Energy Supply 2009
Bioenergy, sustainable
43,5%
Hydropower17,0%
Solar, Wind Geothermal, Tides
0,5%
Bioenergy, non-sustainable
39,0%
Renewable Energy Contribution to Worldwide Total Primary Energy Supply 2009: 12.9 %
Share of "Other" Renewable Energy Sources for Worldwide Energy Supply 2009
Geothermal Energy; 0,41%
Wind Energy;0,06 %
Solar Energy; 0,039 %Tide-Energy;
0,004 %
"Other" Renewable Energy Contribution to Worldwide Total Primary Energy Supply 2009: 0,51 %
8
World Total Primary Energy Supply 1973Regional Shares of TPS
Non-OECD Europe
2%
Middle East1%
Asia6%
China7%
Former Soviet Union14%
Latin America4%
Africa3%
Bunkers3%
OECD60%
IEA-World Energy Statistics 2010
Total 1973: 6.115 Mtoe= 256,00 EJ
Asia excludes China
Includes international aviation and international marine
World Total Primary Energy Supply 2009Regional Shares of TPS
Middle East4,8%
China17,4%
Non-OECD Europe
0,9%
Asia11,5%
Latin America4,7%
Africa5,3%
Bunkers2,7%
Former Soviet Union8,5%
OECD44,2%
Total 2009: 12 267 Mtoe= 293.00 EJ
IEA-World Energy Statistics 2010
Includes international aviation and international
Asia excludes China
World Total Primary Energy Supply 1973Fuel Shares of TPS
Hydropower1,8%
Renewables10,7%
Nuclear0,9%
Coal/peat24,5%
Oil46,1%
Gas16,0%
Total 1973: 6 115 Mtoe= 256.02 EJ
IEA-World Energy Statistics 2010
World Total Primary Energy Supply 2009Fuel Shares of TPS
Hydropower2,2%
Renewables10,7%
Nuclear5,8%
Coal/peat27,0%
Oil33,2%
Gas21,1%Total 2009:
12 267 Mtoe= 513.58 EJ
IEA-World Energy Statistics 2010
World Electricity Generation 1973Fuel Shares (TWh)
Hydropower21,0%
Other Renewables0,6%
Nuclear3,3%
Coal/peat38,3%
Oil24,7%
Gas12,1%
Total 1973: 6 116 TWh
IEA-World Energy Statistics 2010
World Electricity Generation 2009Fuel Shares (TWh)
Hydropower15,9%
Other Renewables2,8%
Nuclear13,5%
Coal/peat41,0%
Oil5,5%
Gas21,3%
Total 2009: 20 181 TWh
IEA-World Energy Statistics 2010
IEA/OECD-World Energy Outlook 2010 (1)
9
OECD Total Primary Energy Supply 1973Fuel Shares of TPS
Hydropower2,1% Renewables
2,5%Nuclear
1,3%
Coal/peat22,6%
Oil52,5%
Gas19,0% Total 1973:
3 724 Mtoe= 155.91 EJ
IEA-World Energy Statistics 2010
OECD Total Primary Energy Supply 2009Fuel Shares of TPS
Hydropower2,1%
Renewables5,5%
Nuclear11,3%
Coal/peat19,7%
Oil37,2%
Gas24,2%
Total 2009: 5 170 Mtoe= 216.45 EJ
IEA-World Energy Statistics 2010
OECD Total Primary Energy Supply 1973Regional Shares of TPS
OECD Pacific10,9%
OECD Europe37,0%
OECD North America
52,1%
IEA-World Energy Statistics 2010
Total 1973: 3 724 Mtoe= 155.91 EJ
OECD Total Primary Energy Supply 2009Regional Shares of TPS
OECD Pacific16,5%
OECD Europe33,2%
OECD North America
50,3%
IEA-World Energy Statistics 2010
Total 2009: 5 170 Mtoe= 216.45 EJ
World Total Primary Energy Supply 2030Reference ScenarioFuel Shares of TPS
Hydropower2,4%
Renewables11,9%
Nuclear5,7%
Coal/peat29,1%
Oil29,8%
Gas21,2%
Total 2030: 16 790 Mtoe= 702.95 EJ
IEA-World Energy Statistics 2010
World Total Primary Energy Supply 2030Policy Scenario
Fuel Shares of TPS
Hydropower3,4%
Renewables18,6%
Nuclear9,9%
Coal/peat18,2%
Oil29,5%
Gas20,4%Total 2030:
14 389 Mtoe= 602.43 EJ
IEA-World Energy Statistics 2010
IEA/OECD World Energy Outlook 2010 (2)
10
2. Fossil and Nuclear Energy Outlook Today, the world’s energy system is based mainly on oil, gas and coal. The finiteness of oil, gas and nuclear resources gives cause for concern.
Fossil Resources Up to now, very few estimates of hydrocarbon resources are available (IEA-World-Energy Outlook-2004). Those estimates that do exist are also subject to considerable uncertainty. Oil resources Undiscovered oil resources range from 494 billion barrels at 95% probability to 1 589 billion barrels at 5% probability. Oil reserves growth varies more widely, from 229 billion barrels to 1 230 million barrels. Ultimate oil reserves vary among regions, but, as is the case for proven reserves, the Middle East and the transition economies hold the majority of them. By 2030, most oil production worldwide will come from capacity that is yet to be built.
Average Annual Growth-Rate of Decline-Phase:From 6.7% in 2007 to 8.6% in 2030
Proven Oil Reserves at End-2002
12
Gas resources Proven gas resources have outpaced production by a wide margin since the 1970s and are now equal to about 66 years of production at current rates. With an annual grow rate of 2.3%, reserves would last 40 years. Coal resources Proven coal reserves worldwide total 907 billion tonnes are almost 200 years of production at current rates. Coal production in Europe will continue to decline as subsidies are reduced and uncompetitive mines are closed. Political instabilities in the main supply countries of carbon fuels cause additional risks for the security of supply. The human origin of climate change is now widely acknowledged. No large energy-consuming sector can be ignored if we want to tackle this challenge. Nuclear resources and Power Plants Nuclear fission with the introduction of Generation IV reactors in combination with effective waste disposal / recycling was convinced up to now as a good option from the point of view of operating cost, life cycle emissions, and availability of primary fuel. Although there were acceptability problems in some Member States and since the reactor accident in Fukushima, Japan, in 2011 more States are willing to cancel the planning of new fission reactors and to close operating reactors when reached the planned lifetime of 30 years in operating. Also unsolved problems with a long-time (more than 1 000 years) waste disposal and the limited fuel resources (uranium, thorium) are important arguments which can not be ignored in planning of long-term sustainable energy systems. Nuclear fusion energy has long been seen as a potentially attractive new source of electricity. It tantalisingly offers most of the advantages of fission power with even more readily available fuels and without the possibility of major reactor accidents releasing large quantities of radioactive material, and without producing very long-lived radioactive wastes. For many years even its technical feasibility was in doubt, but that has now been demonstrated with high confidence. The uncertainty which still remains is whether it will be a practical and reliable energy source, given the complexity of the technology and, in particular, whether the energy will be produced at anything like a competitive cost. Unfortunately, because fusion technology is complex and inevitably large scale, the research is very expensive; it simply cannot be taken forward at low cost. To demonstrate fusion’s technical feasibility with certainty and gain some experience with the operation of realistic-scale fusion technology and subsystems , the International Thermonuclear Experimental Reactor (ITER) will be built in Europe, with international collaboration to share the costs, but with the EU playing an active, leading role. New materials and new technologies have to be developed and demonstrated, which are needed for reactors when are used at high-load factors. The realisation of nuclear fusion reactors for market introduction will take some decades.
The difference of 26 000 tons in 2005 was coming fromsecundary resources: recycelt material from Military sources.
• Proven Resources: 3 million tonsConsidering the present Supply: Reserves for 45 years
Nuclear Power Plants in Operation (January 2011): 437Operation Time > 20 years: 327Operation Time > 30 years: 87
Operation Time < 20 years: 23
State of the ARTState of the ART
14
The Vision of Nuclear FusionThe Vision of Nuclear Fusion
Research Fusion Reactor ITERin Development
Cadarache, France
Research Fusion Reactor ITERin Development
Cadarache, France
3. Renewable Energy Sources and Technologies Renewable energy sources (Renewables) Renewable Energy is energy that is derived from natural processes that are replenished constantly at a rate equal to or greater then the rate of consumption. Renewable does not mean inexhaustible. Furthermore the harnessing of Renewables, like all else, relies on material resources which are finite and non-renewable. In other words they have their limits and so do their environmental consequences. In its various forms, Renewables derives directly or indirectly from the sun, or from heat generated deep within the earth. Included in the definition is energy generated from solar, wind, biomass, geothermal, hydropower and ocean resources, and bio fuels and hydrogen derived from renewable resources. Renewable energy technologies (Renewables technologies) There are three generations of Renewables technologies. First generation of Renewables technologies include hydropower, biomass combustion, and geothermal power and heat, which emerged from the industrial revolution at the end of the 19th century. First generation of Renewables technologies have become competitive in locations where the resource endowment is strong. Their future use depends on exploiting the remaining resource potential, particularly in
15
developing countries, and on overcoming challenges related to the environment and to social acceptance. Second generation of Renewables technologies include solar hot water systems, wind power, advanced biomass, wind-power and solar PV. These are entering markets today as a result of R&D investments by IEA/EU-Member States beginning in the 1980s, prompted by the oil price crises of that period and subsequently benefiting from their environmental appeal. Second generation of Renewables technologies have been commercially deployed, albeit with incentives to ensure cost reductions as a result of “market learning.” Markets for these technologies are strong and growing, but only in a few countries. The challenge is to broaden the base of the market to assure continued rapid growth worldwide. Third generation of Renewables technologies are still under development. Concentrating solar power, ocean energy, advanced geothermal, advanced biomass gasification and bio refinery technologies are part of it. Third generation of Renewables technologies have not yet been widely demonstrated or commercialised. They are on the horizon, may have comparable potential as other Renewables technologies but depend currently on getting sufficient attention and R&D funding. 4. Global Renewables Status Report 2010
Source: REN21-Renewable Energy Policy Network for the 21st Century, Renewables 2010, Status Report)
The year 2009 was unprecedented in the history of renewable energy, despite the headwinds posed by the global financial crisis, lower oil prices, and slow progress with climate policy. Indeed, as other economic sectors declined around the world, existing renewable capacity continued to grow at rates close to those in previous years, including grid-connected solar PV (53 %), wind power (32 %), solar hot water/heating (21 %), geothermal power (4 %), and hydropower (3 %). Annual production of ethanol and bio-diesel increased 10 % and 9 %, respectively, despite layoffs and ethanol plant closures in the United States and Brazil. Highlights of 2009 include: For the second year in a row, in both the United States and Europe, more renewable power capacity was added than conventional power capacity (coal, gas, nuclear). Renewables accounted for 60 % of newly installed power capacity in Europe in 2009, and nearly 20 % of annual power production. China added 37 GW of renewable power capacity, more than any other country in the world, to reach 226 GW of total Renewables capacity. Globally, nearly 80 GW of renewable capacity was added, including 31 GW of hydro and 48 GW of non-hydro capacity. Wind power additions reached a record high of 38 GW. China was the top market, with 13.8 GW added, representing more than one-third of the world market — up from just a 2 % market share in 2004. The United States was second, with 10 GW added. The share of wind power generation in several countries reached record highs, including 6.5 % in Germany and 14 % in Spain.
16
Solar PV additions reached a record high of 7 GW. Germany was the top market, with 3.8 GW added, or more than half the global market. Other large markets were Italy, Japan, the United States, Czech Republic, and Belgium. Spain, the world leader in 2008, saw installations plunge to a low level in 2009 after a policy cap was exceeded. Many countries saw record biomass use. Notable was Sweden, where biomass accounted for a larger share of energy supply than oil for the first time. Bio-fuels production contributed the energy equivalent of 5 % of world gasoline output. Almost all renewable energy industries experienced manufacturing growth in 2009, despite the continuing global economic crisis, although many capital expansion plans were scaled back or postponed. Impaired access to equity markets, difficulty in obtaining finance, and industry consolidations negatively affected almost all companies. Nearly 11 GW of solar PV was produced, a 50 % increase over 2008. First Solar (USA) became the first firm ever to produce over 1 GW in a single year. Major crystalline module price declines took place, by 50–60 % by some estimates, from highs of $3.50 per watt in 2008 to lows approaching $2 per watt. Wind power received more than 60 % of utility-scale Renewables investment in 2009 (excluding small projects), due mostly to rapid expansion in China. Investment totals in utility-scale solar PV declined relative to 2008, partly an artifact of large drops in the costs of solar PV. However, this decline was offset by record investment in small-scale (rooftop) solar PV projects. Investment in new bio-fuels plants declined from 2008 rates, as corn ethanol production capacity was not fully utilized in the United States and several firms went bankrupt. The Brazilian sugar ethanol industry likewise faced economic troubles, with no growth despite ongoing expansion plans. Europe faced similar softening in bio-diesel, with low production capacity utilization. "Green stimulus" efforts since late-2008 by many of the world's major economies totalled close to $200 billion, although most stimulus was slow to start and less than 10 % of green stimulus funds was spent during 2009. By 2009, over 85 countries had some type of policy target, up from 45 countries in 2005. Many national targe ts are for shares of electricity production, typically 5–30 percent, but range as high as 90 percent. Other targets are for shares of total primary or final energy supply (typically 10–20 percent), specific installed capacities of various technologies, or total amounts of energy production from Renewables. Most recent targets aim for 2020 and beyond. Many targets also exist at the state, provincial, and local levels. At least 83 countries have some type of policy to promote renewable power generation. The most common policy is the feed-in tariff, which has been enacted in many new countries and regions in recent years. By early 2010, at least 50 countries and 25 states/provinces had feed-in tariffs, more than half of these adopted only since 2005. Strong momentum for feed-in tariffs continues around the world as countries continue to establish or revise policies. States and provinces have been adopting feed-in tariffs in increasing numbers as well.
17
Renewable energy has an important role in providing modern energy access to the billion of people in developing countries that continue to depend on more traditional sources of energy, both for households and small industries. The number of rural households served by renewable energy is difficult to estimate, but runs into the tens of millions considering all forms of Renewables. Micro-hydro configured into village-scale or county-scale mini-grids serves many of these. More than 30 million households get lighting and cooking from biogas made in household-scale digesters. An estimated 3 million households get power from small solar PV systems. Biomass cook-stoves are used by 40 percent of the world’s population.
18
Average Annual Growth Rates of Renewables Energy Capacity, end-2004 to 2009
Renewable Energy Share of Global Final Energy Consumption, 2008
Share of Global Electricity fromRenewable Energy, 2008
Renewable Power Capacities:Developing World, EU, and Top Six Countries, 2009
World Generating Capacity by Source, 2009
New Power Capacity Added Worldwide by Source,2008-2009
REN-Global Renewables Status Report 2010
19
Wind Power – Existing World Capacity, 1996-2009
Wind Power Capacity, Top 10 Countries, 2009
Solar PV, Existing World Capacity, 1995-2009
Solar PV Existing Capacity, Top Six Countries, 2009
Ethanol and Biodiesel Production, 2000-2009
Solar Hot Water/Heating Existing Capacity,Top Countries/Regions, 2008
REN-Global Renewables Status Report 2010
20
Annual Investment in New Renewable Energy Capacity, 2004-2009
EU Renewable Energy Targets;Share of Final Energy by 2020
REN-Global Renewables Status Report 2010
21
5. Contribution of Renewables in Europe in 2004 The present contribution of Renewables to the total primary energy supply, TPES, in OECD Member States and European countries is of about 6%. The average annual percent change of Renewables to TPES was in the time period 1990 – 2004 1.3%. The top countries in Europe using Renewables are Iceland with 70.7% share to TPES, followed by Norway with 40.1%, Sweden with 24.7%, Finland with 22.6% and Austria with 21.3%. Renewables share to electricity production in OECD/Europe amounts in the year 2004 to 18.2%, with Iceland on the top (99.9%), followed by Norway (99.4%) and Austria (65.0%). The gross heat and electricity production from Renewables increased from 1.735 EJ on 2000 to 1.936 EJ in 2004, related to an average annual rate of 0.6%.
Contribution of Renewable Energy Sources to Total Primary Energy Supply (TPES) in Europe 2004
1.3
14.9
24.7
6.23.7
14.2
4.91.91.1
5.91.8
40.1
70.7
3.65.23.95.9
22.9
13.7
2.91.5
21.3
5.8
0
10
20
30
40
50
60
70
80
EU-19
Austria
Belgium
Czech R
epub
licDen
markFin
land
Franc
e
German
yGree
ce
Hunga
ryIce
land
Irland Ita
ly
Luxem
bourg
Netherl
ands
Norway
Polan
d
Portug
al
Slovak
Repub
lic Spain
Swed
en
Switze
rland
United K
ingdo
m
Ren
ewab
les/
TPE
S, %
IEA Statistics 2005
22
Share of Electricity Production from Renewable Energy Sources in Europe 2004, %
3.4
54.6
45.8
19.213.7
27.2
1.9
99.4
5.46.8
17.5
5.5
99.9
2.89.89.211.3
29.324.4
3.01.7
65.0
13.7
0
20
40
60
80
100
120
EU-19
Austria
Belgium
Czech R
epub
licDen
mark
Finlan
dFra
nce
German
yGree
ce
Hunga
ryIce
land
Irland Ital
y
Luxem
bourg
Netherla
nds
Norway
Polan
d
Portu
gal
Slova
k Rep
ublic Spa
in
Swed
en
Switze
rland
United
Kingdo
m
Sh
are
fro
m R
enew
able
s, %
IEA Statistics 2005
Share of Electricity Production from "Other" Renewable Energy Sources in Europe 2004, %
Excluding Hydro
1.91.4
4.55.9
0.3
4.5
0.40.5
4.0
2.43.2
2.2
16.5
0.51.9
4.3
0.8
11.5
18.1
0.61.1
3.43.2
0
2
4
6
8
10
12
14
16
18
20
EU-19
Austria
Belgium
Czech R
epub
licDenm
arkFin
land
France
Germany
Greece
Hunga
ryIce
land
Irland Ital
y
Luxem
bourg
Netherla
nds
Norway
Polan
d
Portu
gal
Slovak
Repub
lic Spain
Swed
en
Switze
rland
United K
ingdo
m
Sha
re f
rom
"O
ther
" R
enew
able
s, %
IEA Statistics 2005
23
Gross Heat and Electricity Production from Renewable Sources in Europe: 2000 - 2004
0
500000
1000000
1500000
2000000
2500000
2000 2001 2002 2003 2004
Gro
ss H
eat/
Ele
ctri
city
Pro
du
ctio
n, T
J Waste Heat and Heat Pumps
Gas from Biomass
Solid Biomass
Municipal Solid Waste-Non-Renewable
Municipal Solid Waste-Renewable
Industrial Waste
Wind
Tide, Wave, Ocean
Solar Electric, PV
Solar Thermal
Geothermal
Hydro-Power
6. The Future of Renewables Renewable energy sources (Renewables) will have to play a central role in moving the world onto a more secure, reliable and sustainable energy path. The potential is unquestionably large, but how quickly their contribution to meeting the world’s energy needs grows hinges critically on the strength of government support to stimulate technological advances and make Renewables cost competitive with other energy sources. Government support for Renewables can, in principle, be justified by the long-term economic, energy security and environmental benefits they can bring, though it is essential that support mechanisms are cost-effective. Renewable energy sources can contribute to all forms of energy supply: Heat from solar, geothermal and bio-energy; Electricity from solar, wind, bio-energy, geothermal, hydropower and ocean energy; Bio-fuels and hydrogen from bio-energy and solar. Some of Renewable energy technologies are on the market, some under development and some in the demonstration phase.
24
Renewable Energy Sourcesfor Energy Supply
• HEAT from Solar, Geothermal and Bioenergy
• ELECTRICITY from Solar, Wind, Bioenergy, Geothermal, Hydropower and Ocean Energy
• Bio-FUELS and HYDROGEN from Renewables
The greatest scope for increasing the use of Renewables in absolute terms lies in the power sector. In the New Policies Scenario, Renewables -based generation triples between 2008 and 2035 and the share of Renewables in global electricity generation increases from 19% in 2008 to almost one-third (catching up with coal). The increase comes primarily from wind and hydropower, though hydropower remains dominant over the Outlook period. Electricity produced from solar photovoltaics increases very rapidly, though its share of global generation reaches only around 2% in 2035. The share of modern Renewables in heat production in industry and buildings increases from 10% to 16%. The use of bio-fuels grows more than four-fold over the Outlook period, meeting 8% of road transport fuel demand by the end (up from 3% now). Renewables are generally more capital intensive than fossil fuels, so the investment needed to provide the extra Renewables capacity is very large. Investment in Renewables to produce electricity is estimated at $5.7 trillion (in year-2009 dollars) over the period 2010-2035. Investment needs are greatest in China, which has now emerged as a leader in wind power and photovoltaic production, as well as a major supplier of the equipment. The Middle East and North Africa region holds enormous potential for large-scale development of solar power, but there are many markets, technical and political challenges that need to be overcome. Although Renewables are expected to become increasingly competitive as fossil fuel prices rise and renewable technologies mature, the total value of government support is set to rise as their contribution to the global energy mix increases. We estimate that governme nt support worldwide in 2009 amounted to $37 billion for electricity from Renewables and $20 billion for bio-fuels. In the New Policies Scenario, total support grows to $205 billion (in year-2009 dollars), or 0.17%
25
of global GDP, by 2035. Over the Outlook period, 63% of the support goes to Renewables -based electricity. Support per unit of generation on average worldwide drops over time, from $55 per megawatt-hour (MWh) in 2009 to $23/MWh by 2035, as wholesale electricity prices increase and their production costs fall due to technological learning. This does not take account of the additional costs of integrating them into the network, which can be significant in some cases, for example, because of the variability of some types of Renewables, such as wind and solar energy. The use of bio-fuels – transport fuels derived from biomass feedstock – is expected to continue to increase rapidly over the projection period, thanks to rising oil prices and government support. In the New Policies Scenario, global bio-fuels use increases from about 1 mb/d today to 4.4 mb/d in 2035. The United States, Brazil and the European Union are expected to remain the world’s largest producers and consumers of bio-fuels. Advanced bio-fuels, including those from ligno-cellulosic feedstocks, are assumed to enter the market by around 2020. The cost of producing bio-fuels today is often higher than the current cost of imported oil, so strong government incentives are usually needed to make them competitive with oil-based fuels. Globally, government support to bio-fuels is projected to rise to about $45 billion per year between 2010 and 2020, and $65 billion per year between 2021 and 2035. Government support typically raises costs to the economy as a whole. But the benefits can be significant too, including reduced imports of oil and reduced CO2 emissions – if sustainable biomass is used and the fossil energy used in processing the biomass is not excessive. 7. The Attractiveness of Renewable Energy Sources Expanded energy supplies are needed to support global economic development. Renewable energy sources are attractive candidates. Renewables come in many forms: Electricity generated from solar, wind, biomass, geothermal, hydropower, and ocean sources; heat generated from solar thermal, geothermal and biomass sources; bio-fuels and hydrogen obtained from renewable sources. Renewables are capable supplying most of worlds energy needs and therefore have the potential to support global economic development. Renewables technologies costs are continuing to decline, as production and markets expand. Renewables technologies have made considerable progress over the last few decades. Through technology development - much carried out through international collaboration - many Renewables options have reached levels of maturity that allow broad market deployment, while others are finding cost effective applications in expanding niche markets. The significant increase over the last few years of emerging technologies such as wind and both solar thermal and solar electric (PV) , as well as modern bioenergy plants, is concentrated in countries, which are leaders in R&D spending and in special initiatives by public and industry supporting the market introduction. Deployment efforts are needed in many EU Member States to give Renewables technologies the role it could play to foster a more sustainable energy supply in the long-term future. Renewables add to the diversity of the energy supply portfolio, and reduce the risk of energy price fluctuations, as well as constraints on supply. Distributed Renewables provide options to consumers not otherwise available. And Renewables are environmentally benign of the options available in current and near-term markets. Benefits from Renewables generally include some combination of the following:
26
• Energy security: reduced dependence on foreign energy imports. • Environment: mitigating global climate change, regional acid rain, local air pollution, and
indoor air pollution. • Employment: technology development, manufacturing, installation and maintenance
services. • Technological development and competitiveness: rise of new domestic industrial bases. • Rural development: improved energy services and income-generation opportunities. • Reliability: greater energy availability and/or reliability in areas where service from
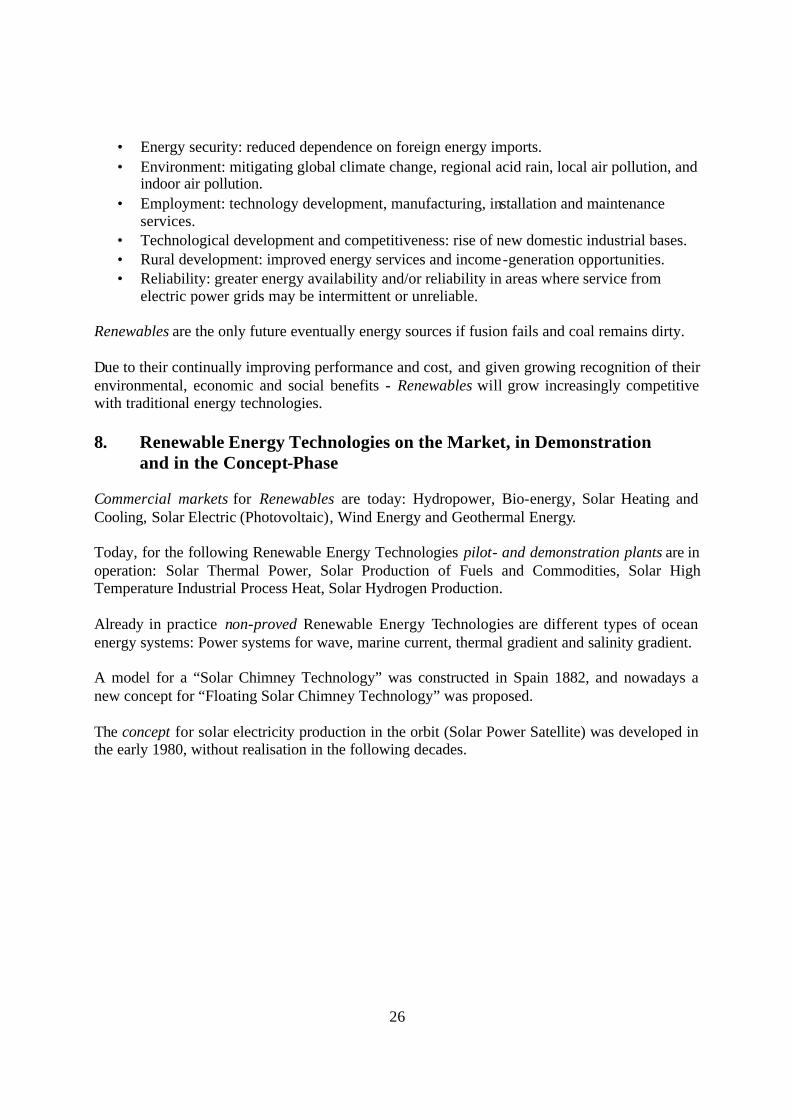
electric power grids may be intermittent or unreliable. Renewables are the only future eventually energy sources if fusion fails and coal remains dirty. Due to their continually improving performance and cost, and given growing recognition of their environmental, economic and social benefits - Renewables will grow increasingly competitive with traditional energy technologies. 8. Renewable Energy Technologies on the Market, in Demonstration
and in the Concept-Phase Commercial markets for Renewables are today: Hydropower, Bio-energy, Solar Heating and Cooling, Solar Electric (Photovoltaic), Wind Energy and Geothermal Energy. Today, for the following Renewable Energy Technologies pilot- and demonstration plants are in operation: Solar Thermal Power, Solar Production of Fuels and Commodities, Solar High Temperature Industrial Process Heat, Solar Hydrogen Production. Already in practice non-proved Renewable Energy Technologies are different types of ocean energy systems: Power systems for wave, marine current, thermal gradient and salinity gradient. A model for a “Solar Chimney Technology” was constructed in Spain 1882, and nowadays a new concept for “Floating Solar Chimney Technology” was proposed. The concept for solar electricity production in the orbit (Solar Power Satellite) was developed in the early 1980, without realisation in the following decades.
27
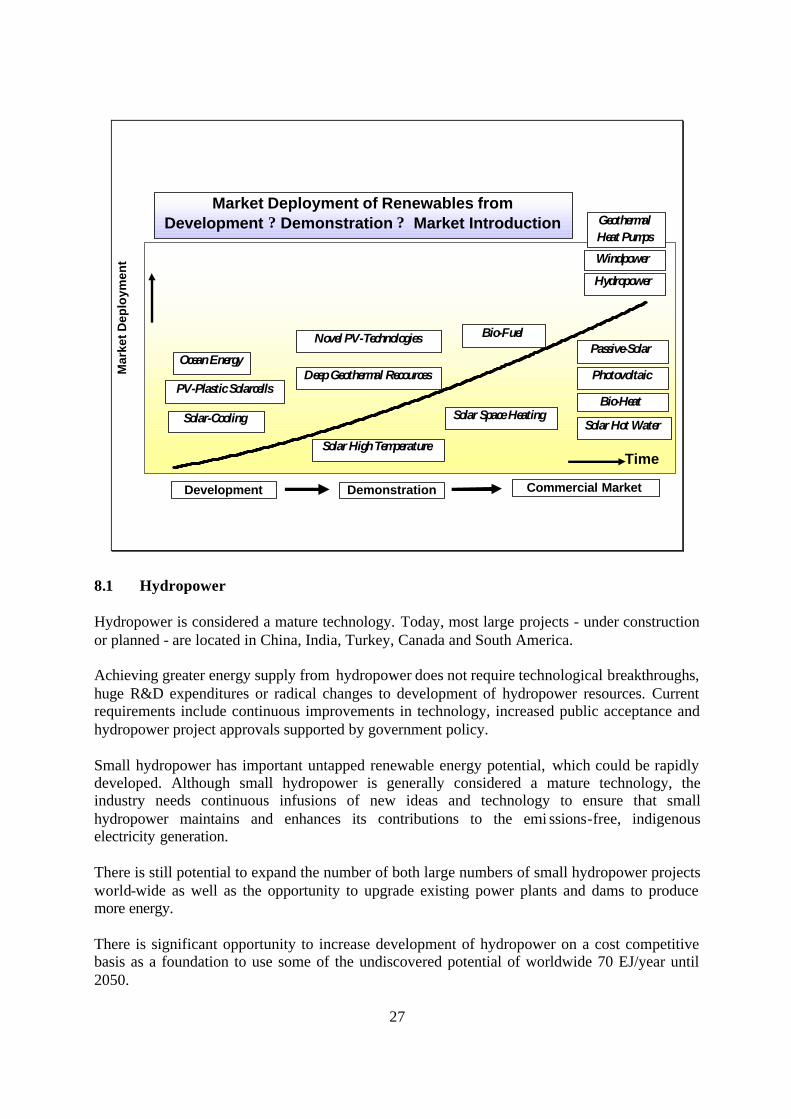
Time
Mar
ket D
eplo
ymen
t
Development Commercial MarketDemonstration
Solar-CoolingBio-Heat
Passive-Solar
Solar Hot WaterSolar Space Heating
Bio-Fuel
Solar High Temperature
Deep Geothermal Recources
GeothermalHeat Pumps
Windpower
Hydropower
Ocean Energy
Novel PV-Technologies
PhotovoltaicPV-Plastic Solarcells
Market Deployment of Renewables from Development ? Demonstration ? Market Introduction
8.1 Hydropower Hydropower is considered a mature technology. Today, most large projects - under construction or planned - are located in China, India, Turkey, Canada and South America. Achieving greater energy supply from hydropower does not require technological breakthroughs, huge R&D expenditures or radical changes to development of hydropower resources. Current requirements include continuous improvements in technology, increased public acceptance and hydropower project approvals supported by government policy. Small hydropower has important untapped renewable energy potential, which could be rapidly developed. Although small hydropower is generally considered a mature technology, the industry needs continuous infusions of new ideas and technology to ensure that small hydropower maintains and enhances its contributions to the emi ssions-free, indigenous electricity generation. There is still potential to expand the number of both large numbers of small hydropower projects world-wide as well as the opportunity to upgrade existing power plants and dams to produce more energy. There is significant opportunity to increase development of hydropower on a cost competitive basis as a foundation to use some of the undiscovered potential of worldwide 70 EJ/year until 2050.
28
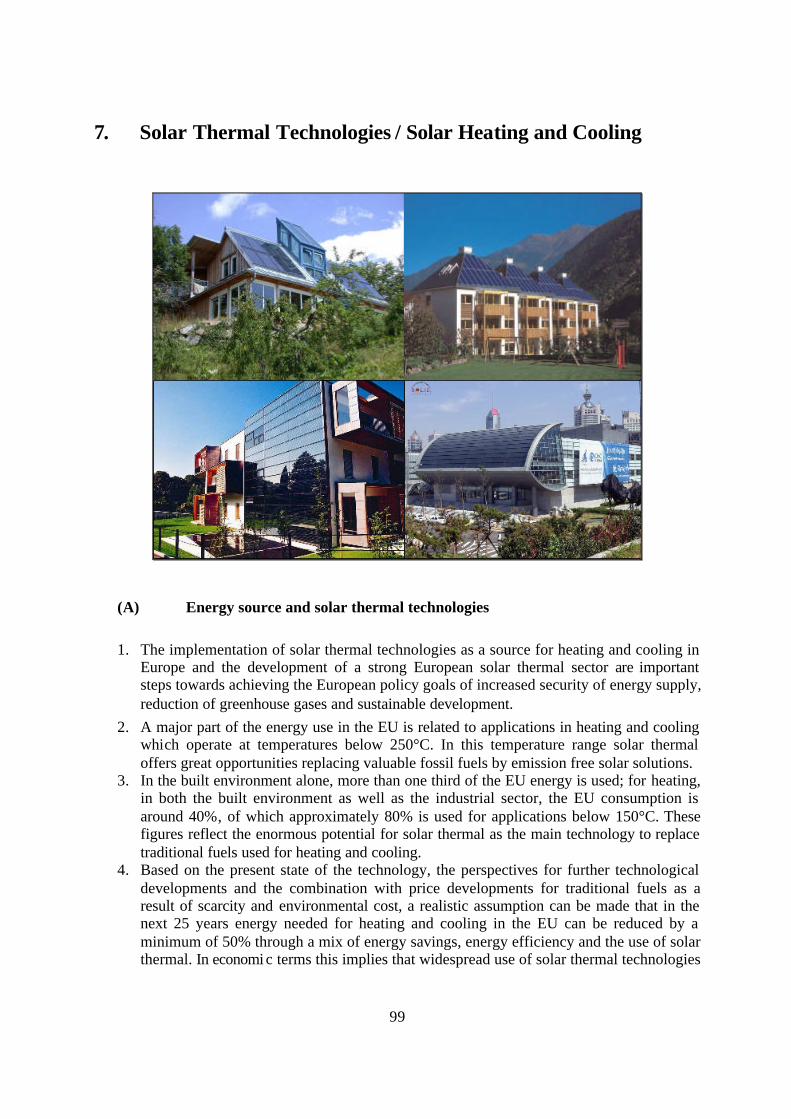
8.2 Bio-energy Simple biomass combustion technologies are already competitive with oil, in those rural areas where wood residues are available nearby and can be burned in small, decentralised plants, and with oil and gas in urban areas where the combustion of municipal wastes saves the costs of transport to and disposal in scarce landfill sites. Biomass offers considerable flexibility of fuel supply due to the range and the diversity of fuels which can be produced at small or large scale, in a centralised or decentralised way. Cost of heat production from biomass, or bio-heat, depends firstly on the bio fuel cost. The cost depends on the country, the type and quality of the fuel, the demand, the organisation of the procurement chain, the quantity (individual user up to large industrial scale), etc. Converting biomass to liquid (BTL) fuels is potentially very important because it offers not only the prospect of retaining liquid chemical fuels for transport without increasing atmospheric CO2 but also the possibility of a global trade in biomass-derived liquids, not really possible with solid biomass itself. Because of this potential of BTL to provide liquid fuels it is important to find biological processes for converting the ligno-cellulose parts of woody plants to liquids. The design and operation of conventional BTL plant for the different biomass feedstock which might become available in or to the EU would also be useful, in order that the conversion technology and costs of BTL fuels might be reduced or at least become less uncertain. The worldwide potential for useful biomass resources is estimated to be about 400 - 1,400 EJ/year. 8.3 Solar Heating and Cooling A large variety of solar-thermal components and systems, mostly for residential applications, are available on the market. The products are reliable and show a high technical standard in the low temperature regime. The market growth is not yet stable and still is very much dependant on public support (subsidies), not unlike the other non-renewable and renewable energy technologies. The potential of solar thermal technologies for the heat supply (hot water and space heat) in housing is large: About 50% to 70% solar share for hot water preparation and 40% to 60% of the heat supply - hot water and space - heat can be achieved in low-energy houses. While solar water and space heating have been in the market for decades, new approaches for solar thermal applications - e.g. for cooling and process heat - are now emerging onto the market. About 30 to 40% of the process heat demand could be covered with low- to medium temperature solar collector systems. The worldwide contribution of solar thermal heat to the overall energy supply has been strongly underestimated in the past.
29
In the built environment alone, more than one third of the EU energy is used; for heating, in both the built environment as well as the industrial sector, the EU consumption is around 40% of which approximately 80% is used for applications below 150°C.
These figures reflect the enormous potential for solar thermal as the main technology to replace traditional fuels used for heating and cooling. Based on the present state of the technology, the perspectives for further technological developments and the combination with price developments for traditional fuels as a result of scarcity and environmental cost, a realistic assumption can be made that in the next 25 years energy needed for heating and cooling in the EU can be reduced by a minimum of 50% through a mix of energy savings, energy efficiency and the use of solar thermal.
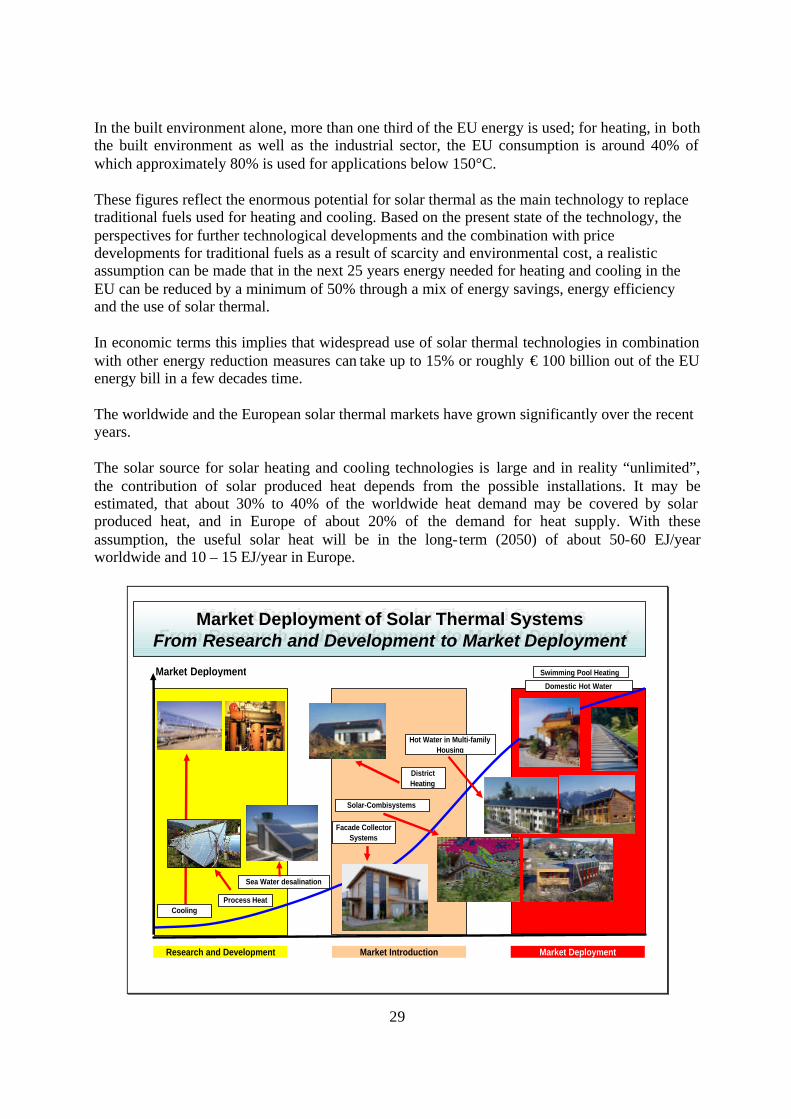
In economic terms this implies that widespread use of solar thermal technologies in combination with other energy reduction measures can take up to 15% or roughly € 100 billion out of the EU energy bill in a few decades time. The worldwide and the European solar thermal markets have grown significantly over the recent years. The solar source for solar heating and cooling technologies is large and in reality “unlimited”, the contribution of solar produced heat depends from the possible installations. It may be estimated, that about 30% to 40% of the worldwide heat demand may be covered by solar produced heat, and in Europe of about 20% of the demand for heat supply. With these assumption, the useful solar heat will be in the long-term (2050) of about 50-60 EJ/year worldwide and 10 – 15 EJ/year in Europe.
Market Deployment of Solar Thermal SystemsFrom Research and Development to Market Deployment
Market Deployment of Solar Thermal SystemsFrom Research and Development to Market Deployment
Market Deployment
Research and Development Market Introduction Market Deployment
District Heating
Domestic Hot Water
Hot Water in Multi-family Housing
Solar-Combisystems
Facade Collector Systems
Sea Water desalination
Process HeatCooling
Swimming Pool Heating
30
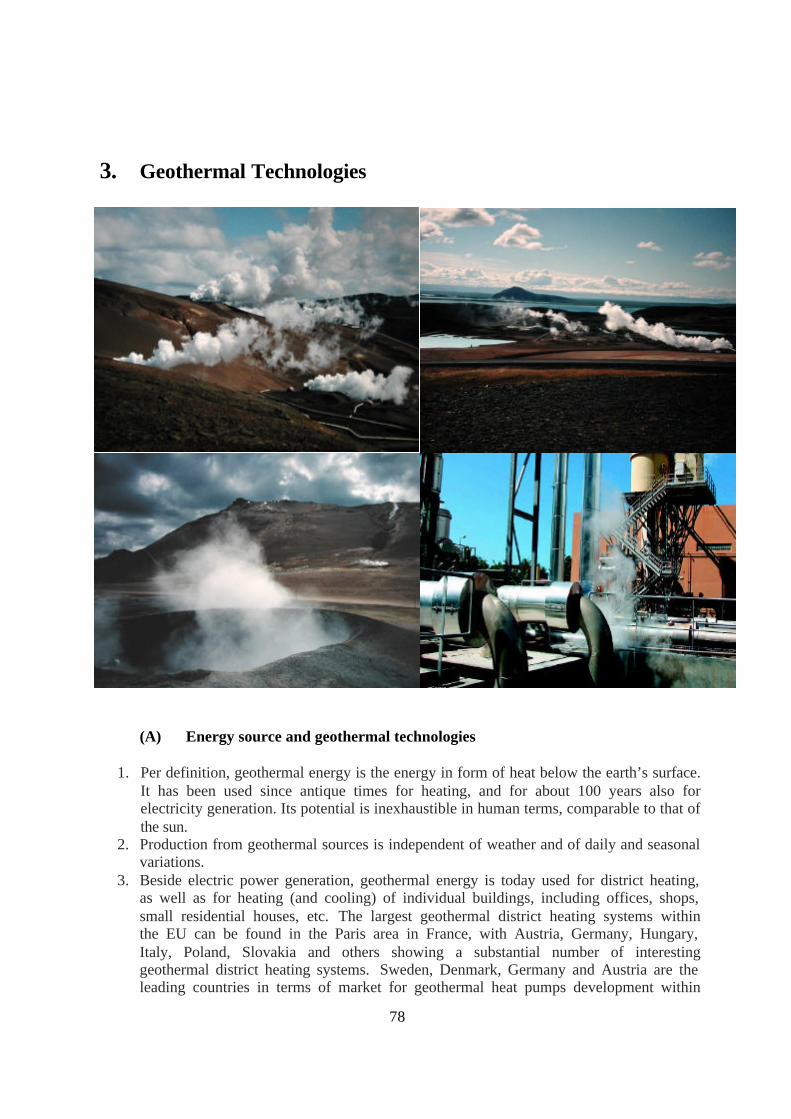
8.4 Solar Electric Systems (Photovoltaic) Solar Electric Systems (Photovoltaic) have already proved their advantages over conventional energy sources in remote, off-grid applications and in mobile specialist devices such as watches and calculators. These applications have already created a successful PV manufacturing industry. The really widespread deployment of PV energy in the grid-connected market hinges on the development of improved materials and innovative concepts for a new generation of PV systems. These might include organic or hybrid solar cells, the improvement of thin film technology for PV materials, the further development of PV processing and automated manufacturing technologies. The potential of solar resource for photovoltaic systems is “unlimited”, the market in developing countries for stand-alone systems huge. In Europe, grid-connected PV systems are of interest. The vision for long-term PV-contribution to electricity supply may be about 30% of electricity production in small villages in developing countries, and of about 10% of electricity production by grid-connected systems in Europe. Under this assumption, the estimates for 2050 are of about 15 EJ/year worldwide and up to 5 EJ/year in Europe. 8.5 Wind Energy The potential for the increased use of wind energy is huge. The report, “Wind Force 12”, makes estimates of wind energy’s technical potential in Europe and worldwide by calculating areas with an annual average wind speed exceeding 5 metres per second at a height of 10 m. The estimated potential in Europe is about 4 800 TWh per year (17 EJ/year) and worldwide some 53 000 TWh per year (191 EJ/year). It is foreseen that offshore wind turbines will produce much of the future contribution. Naturally, the exploitable potential is rather less. Experience in Denmark and Germany suggests that it is feasible to utilise about 10% of the technical potential. Using this assumption, the European Wind Energy Association sets up a scenario for the deployment in which wind turbines in Europe (EU-15) in 2020 produce 425 TWh annually – some 12% of the expected electricity consumption in Europe (EU-15) at that time. In “Wind Force 12” the EWEA suggests that wind power is capable of supplying 12% of the world’s electricity demand in 2020, even if the overall demand increases until then by two-thirds. Whether such scenarios will become commercially attractive depends on whether or not wind power can be made competitive with the cheapest alternative including cost of back-up and external costs. The European Commission, in its “European Energy and Transport – Trends to 2030”, predicts differently for EU-25, giving wind power an 11% share of electricity generation in 2020. 8.6 Geothermal Energy Per definition, geothermal energy is the energy in form of heat below the earth’s surface. It has been used since antique times for heating, and for about 100 years also for electricity generation. Its potential is inexhaustible in human terms, comparable to that of the sun. Beside electric power generation, geothermal energy is today used for district heating, as well as for heating (and cooling) of individual buildings, including offices, shops, small residential houses, etc.
31
The geothermal sector is currently the fourth largest electrical power production sector using renewable energy sources, ranked behind hydraulic power, biomass and wind power. At the end of the year 2004, it represented 0.3% of world electricity production (54.7 TWh out of a total of 17 387 TWh). Installed geothermal capacity went from 7 973 MWe in 2000 to 8 911 MW in 2004. If the large regions of the world are considered, two main producers of geothermal origin electricity can be seen: America (3 921 MWe) and Asia (3 291 MWe). Europe comes next, with total capacity of 1 123 MWe. A large part of geothermal energy is used by geothermal heat pumps, under the heading of the so-called very low temperature applications. The European Union is one of the main regions of the world to have developed geothermal heat pump technology (ground-coupled heat pumps). The total number of geothermal heat pumps is estimated at more than 379 000 units, equivalent to 4 531 MWth 2004 (+30.5% with respect to 2003). The heat pump industry is by far the most dynamic of the three geothermal sectors. Total worldwide geothermal heat pump capacity has considerably increased these last five years. Their total installed capacity is estimated to be 13 815 MWth at the end of year 2004(1.15 million units with mean capacity of 12 kWth each) vs. 5 275 MWth capacity in 2000. The worldwide technical potential of geothermal – including very deep resources (below 3000 m) - is very large and has been estimated to be as much as 5,000 EJ/year (theoretically). Important limitations to expanding its use are economics as well as the geographic distribution of the resource. 8.7 Solar Thermal Power A new window of opportunity for Solar Thermal Power Technologies has opened up recently. Today‘s technology is based on parabolic troughs using thermal oil, and central receivers using molten salt or atmospheric air. Solar Thermal Power Plants are thought to be near to cost competitive, and could reach that goal with the deployment of modest number of systems. Market focuses are in the larger scale projects (80-300 MW), as well as in smaller systems (10-50 MW). The larger systems are thought to be appropriate for bulk power, and would be developed as fossil hybrids (generally natural gas). The smaller systems have a variety of potential sub-markets, including captive industrial power, distributed generation, or small independent grids. Solar Thermal Power Plants are operated by concentrating solar systems. Applications require sites with high direct solar radiation, in Europe only in southern countries e.g. Spain, Greece, Italy, Malta. Favourites markets for Solar Thermal Power Plants are Africa, Asia, Australia and the western part of US.
32
Solar Electricity from the Desert
Solarthermal Powerplants– Tower- and Parabolic Collector-Concept -since 1981 under development and allready
available for the market.
European „Solar Desert Project“
in the planning phase
8.8 Solar Production of Fuels and Commodities The ultimate goal of Solar Chemistry is the chemical storage of solar energy to make that energy source available regardless of time and location. In the long term future fossil fuels as required for the conversion of crude feedstock’s or the production of basic chemicals could be substituted by solar energy. Compared to thermal energy storage, the conservation of solar energy in chemical form offers additional flexibility. Time and place of use are subject to significantly fewer constraints than for the grid connected electricity. So seasonal adaptation of energy demand and supply is possible, and remote places without grid connection or mobile application can be individually served, which in many cases is not possible on the basis of electricity. The fundamental question addressed in this research field is whether the chemical storage of solar energy or the production of solar fuels by concentrating solar technologies offers significant performance and cost benefits compared to other renewable alternatives. This has to be evaluated in the light of the experience gathered over the past twenty years by solar chemistry but also by other approaches (such as the nuclear high temperature thermo-chemical cycles). One of the most-studied solar chemical processes is the reforming of natural gas to produce synthesis gas. The technical feasibility of solar reforming of methane has already been demonstrated at an engineering scale applying different reactor concepts. Presently the receiver concept is enhanced and industrial scale plants are modeled.
33
In addition new approaches for materials used in thermo-chemical cycles have been identified. Previous limitations, e.g. in the use of thermo-chemical cycles based on metal oxides, were due to the high dissociation temperature of the metal oxide (> 1500 K), which appears to be difficult to control in terms of the material properties. Recent studies have identified a new group of metal oxides with a spinel structure as potential materials for a thermo-chemical cycle with dissociation temperatures below 1200 K. These and other approaches appear to be a promising start for an efficient method of hydrogen production (compared to electrolysis with renewable electric power). 8.9 Solar High Temperature Industrial Process Heat In solar thermal concentrating plants process heat can be provided at high temperature levels: in receivers which have already been developed in a multi MW scale for high temperature heat generation in central receiver systems at 500-1000 °C and in an experimental scale up to 2000 °C, in parabolic dish concentrators and in solar furnaces even at more than 2000 °C. Thus it is useful to investigate whether such plants - besides of solar thermal power production - could meet the energy demand for the established high temperature processes in the primary industry. For the short to mid term future some market niches can already be identified today. These include the solar photochemical production of specialty chemicals and the solar detoxification of polluted water and hazardous wastes. For the near term future first industrial applications can be expected such as solar steam reforming of natural gas, photo-chemical production of specialities, detoxification of specific hazardous wastes, or testing and treatment of materials. Whilst developing the first applications an intended effect is to establish specific know how in solar chemical engineering and to collect those experiences which are required to carry out a larger range of solar chemical bulk processes. At the same time also further specific applications of solar radiation should be inspired. 8.10 Solar Hydrogen Production A solar-based world energy economy require the conversion of solar energy into the chemical binding energy of a fuel, to offer the possibility to arrive at a utilization independent of the annual variation of solar energy availability. Solar-hydrogen has been proposed as a candidate for such a solar-based world energy economy. Hydrogen is also storage for electricity. Hydrogen could be produced through electrolysis by PV-cells or directly by photochemical cells. Such an energy system would be ideal as it is driven by renewable solar energy, it does not produce critically environmental pollutants and it is totally closed, i.e. hydrogen fuels are produced from water, and the conversion of hydrogen into various forms of final energy produces only water. It is technically feasible to store grid electricity as hydrogen at times when supply exceeds demand and that this is useful in cases where a large number of intermittent generators could locally overload the electricity grid. Typically examples of these intermittent generators are wind farms and photovoltaic arrays. However, extrapolating from the current rate of growth of these different generating technologies, their penetration in the European grid will not be large enough in the near future to create instability.
34
However, much more renewable energy generating capacity must be built than that needed for this target before it makes sense to use wind or PV for electrolysis, for instance, or to gasify biomass to hydrogen. Given this situation, hydrogen will not be a prerequisite for de-carbonising the current energy system.
The global potential for solar hydrogen production is estimated to about 30 EJ/year (IEA –Solar Paces Implementing Agreement).
8.11 Concepts for Ocean Energy Systems Around 71% of the Earth’s land mass is covered by sea and oceans, and the potential opportunities to harvest the abundant renewable energy sources that these contain is vast, estimated between 1 – 10 TW globally. Ocean energy includes potential and kinetic energy from the ocean. At present only tidal power systems are commercially operated. Several other types of ocean energy sources with different origins exist and the sources are classed into wave, marine current, thermal gradient and salinity gradient. The energy from ocean waves can be considered to be a concentrated form of solar energy. Winds are generated by the differential heating of the earth, and, as a result of their blowing over large areas of water; part of their energy is converted into waves. Many wave energy devices have been proposed but few have reached demonstration. Prototypes of onshore, near shore and offshore Oscillating Water Column systems deployed since 1985 have proven this technology, which is still being developed. Various offshore wave energy devices are reaching the prototype stage as well as devices to exploit the energy resource that marine currents contain. Different
35
types of wave energy devices are now developed and planned to be built in the near future in the framework of international co-operation in the IEA Ocean Energy Systems Programme. Marine currents systems, caused by thermal differences in addition to tidal effects, is kinetic energy from the sea which can be harnessed using techniques similar in principle to those for extracting energy from the wind, by using submarine converters similar to “underwater windmills”. But this option is still relatively undeveloped. A number of studies have been completed on the energy potential of marine currents but there have been few on the engineering requirements for utilisation of this resource. Salient gradient system utilises the pressure difference arising between fresh water and sea water (Salinity Power). Large amounts of renewable energy can be extracted wherever freshwater from rivers and lakes meets the saltwater of the ocean. This technology has an enormous unexploited power production potential world-wide. Estimates indicate a potential about 250 TWh per year in Europe and 2000 TWh globally. The main objective of the EU-co-funded 3.4 MEUR Salinity Power project is the development of a cheap membrane with a long operating life in order to keep the cost for power down. Recent developments and results suggest that salinity power plant can be constructed with a very gentle environmental impact taking very good care of the local environment and biodiversity. Assuming realistic membrane performance and cost data it is expected that salinity power will be competitive with other emerging renewable energy sources such as off-shore wind power and biomass power generation when commercialised in about 5 to 10 years. Ocean Thermal Conversion power system uses the thermal gradient between surface water heated by solar radiation and the cold deep water. Ocean thermal energy systems (Ocean Thermal Energy Conversion or OTEC) have been up to now only test prototypes. The estimated global resource for these undeveloped types of ocean energy systems is of about 100 – 300 EJ/year. 8.12 Concept for Floating Solar Chimney Technology “Floating solar chimney technology” is an electricity power generating method with the warm air of a large solar collector up drafting through a tall chimney. The earliest description of a solar chimney power station was written in 1931, and a model was built in 1982 in Manzaranas, Spain, 150 km south of Madrid. The power plant operated successfully for approximately 8 years, but the results were not considered as an economic solution. With a new approach using a reinforced concrete solar chimney technology with higher solar chimneys – up to 3000 m height and 100 m internal diameter – and lighter structures, the efficiency of solar chimney power plants should be increased and the costs decreased. For the production of 50% of the present world energy demand for electricity a land of 130000 km² (360 km x 360 km) is necessary. But in EU-Member States, appropriate areas for Floating Solar Chimney applications are very limited. A major difference with other renewable power generation methods is the ability of the proposed project, equipped with thermal storage facilities of negligible cost, to produce guaranteed power for 24h/day and for 365days/year. As no Floating Solar Chimney is in operation, learning curves and cost figures do not rest on existing experience, but on estimates. The cost of “Floating Solar Chimney Technology” are
36
estimated to be much lower than that of a “concrete solar chimney power plant” and thus becomes remarkably competitive with both comparable technologies, namely wind and PV but also with conventional power generation. 8.13 Concept for Solar Power Satellites At the end of 1970, the United States (Department of Energy and NASA) in co-operation with the European Space Agency (ESA, ESTEC) developed a concept for Solar Power Satellites. The idea was to employ much more solar energy in the space compared to the available solar radiation at the earth’s surface. A space transportation system carries materials and personnel to the construction base in the orbit. The assembled power satellite beams rf-radiation to the rectenna which converts and delivers it to the grid. The solar driven Power Satellite is almost constantly illuminated throughout the year and the microwave beam transferring the energy to the ground is virtually unaffected by atmospheric conditions. Bearing in mind the loss in the microwave transmission system, which is estimated to be less than 40%, each square metre of solar cells in the Solar Power Satellite will deliver approximately five times more energy to the electricity user than would be absorbed from terrestrial photovoltaic power plant. The 3-year assessment programme was finished 1981 with the result, that some proposed types of Solar Power Satellites would be technically feasible – although the technical challenges are formidable - but the environmental, economic, social and international problems and uncertainties are to large for realisation.
Energy SatellitesEnergy Satellites
37
9. Market Introduction from Renewables From Prototype to Widespread adoptions
The industrialised economies of the world show over the past couple of centuries an economic cycle for new energy systems and technological innovations of 50 to 60 years. Examples are the transition period from coal to oil and oil to gas. This indicates that new energy technologies introduced to the energy sector over the last 20 years (wind turbines, bio-energy and solar technologies) will massively be integrated in the energy sector in the decades to come. The market introduction phase will lead to industrial learning and to move down the learning curve for these technologies. On the other hand we can generally expect fewer completely new energy innovations in the decades to come. Experience suggests that new energy technologies require timescales of 20 to 30 years or even longer between prototype and widespread adoptions. On the other hand we can generally expect fewer completely new energy innovations in the decades to come. Experience suggests that new energy technologies require timescales of 20 to 30 years or even longer between prototype and widespread adoptions.
Market Introduction from RenewablesFrom Prototype to Widespread adoptions
38
10. Estimating the Worldwide Possible Useful Potential of Renewable Energy Sources
Some renewable energy technologies have good potential for growth, namely solar thermal, biomass fuels, wind power, geothermal and solar photovoltaic. Estimating the global potential for energy production from Renewable energy sources is complex. Main reasons for this are both the versatility of Renewables in meeting so many different end-uses and geographic distribution of renewable sources. In different studies (WEA, IEA-Working Party on Renewable Energy Technologies) the possible useful potential of worldwide renewable energy sources were estimated. Given the uncertainty and wide range of estimates for global Renewable energy sources potential, the results are documented in the following Table. Important limitations to expanding the use of technical potentials of renewable sources are economics as well as the geographic distribution of the resource.
39
Source Potential, EJ/YearGeothermal energy 500 ? 5000 (?)
Solar Electric (Photovoltaic) 5 ? 15Solar Heating and Cooling 15 ? 60
Possible Useful Potential of Worldwide Renewable Energy Sources
Estimates for Technical Potential of Worldwide Renewable Energy Sources
30
500
15
400
200
5 0,5 20 30 1 3 2050
1000
60
1200
700
15 1 30
300
3 7 360
200
400
600
800
1000
1200
1400
Hydro-
Power
Geothe
rmal
Energ
y
Solar H
eatin
g and
Coolin
gBioe
nergy
Wind-Po
wer
Solar E
lectric
, PV
Tidal E
nergy
Solar
Hydrog
en
Ocean
Wav
e
Ocean
Mari
ne Curr
ent
Ocean
Salin
ity
Ocean
Therm
al, OTE
C
Ann
ual C
ontr
ibut
ion,
EJ/
year
Realistic Potential, EJ/year
Optimistic Potential, EJ/year
Proven Technologies not available
Worldwide Total Primary Energy Supply, TPES:2003:443 EJ/year 2030 (Outlook): 691 EJ/year
40
11. Towards a Sustainable Energy System Energy systems are the main indicators of the global economy. The industrialised economies of the world show over the past couple of centuries an economic cycle for new energy systems and technological innovations of 50 to 60 years. Examples are the transition period from coal to oil and oil to gas. This indicates that new energy technologies introduced to the energy sector over the last 20 years (wind turbines, bio-energy and solar technologies) will massively be integrated in the energy sector in the decades to come. This will lead to industrial learning and to move down the learning curve for these technologies. On the other hand we can generally expect fewer completely new energy innovations in the decades to come. Experience suggests that new energy technologies require timescales of 20 to 30 years or even longer between prototype and widespread adoptions. Lon-term energy scenarios indicate that radical social und technical changes are needed if we are to reduce our alliance on fossil fuels. Governmental-base energy R&D is essential if radical changes in the energy system are to be achieved. The substitution of fossil fuels by Renewables leads to significant reduction of CO2 emissions and to a diversification of supply resources and therefore to a greater security of energy supply. Renewables support the development of a sustainable energy system as a requirement for economic sustainable development. On the political level, this fact was reflected in a continuous promotion of Renewables in EU-Member States through promotional policies – including subsidies. Any long-term vision for European economic development must include Renewables, to save finite energy sources and to build up an industry of strategic importance: Renewable Energy is essential for a Sustainable Energy System 11.1 Requirements and Options for Future Energy Systems The coming decades will bring big changes in energy systems throughout the world. The systems are expected to become more “intelligent” with change from central power plants producing electricity and heat to the customers to a combination of central units and a variety of distributed units such as renewable energy technologies and to e.g. fuel cells. Energy systems can be made more robust by decentralising both power generation and control. The use of more distributed power generation systems would be an important element in the production for the consumers against power interruptions and blackouts, whether caused by technical faults, natural disasters or terrorism (H. Larsen, L.S. Petersen et al). Despite the rapid development and market introduction of new energy technologies with renewable sources such as wind, solar, biomass and geothermal, the world will continue to depend on fossil fuels for several decades to come, and global primary energy demand is forecasted to grow by 60% between 2002 and 2030 (IEA-World Energy Outlook 2004). The
41
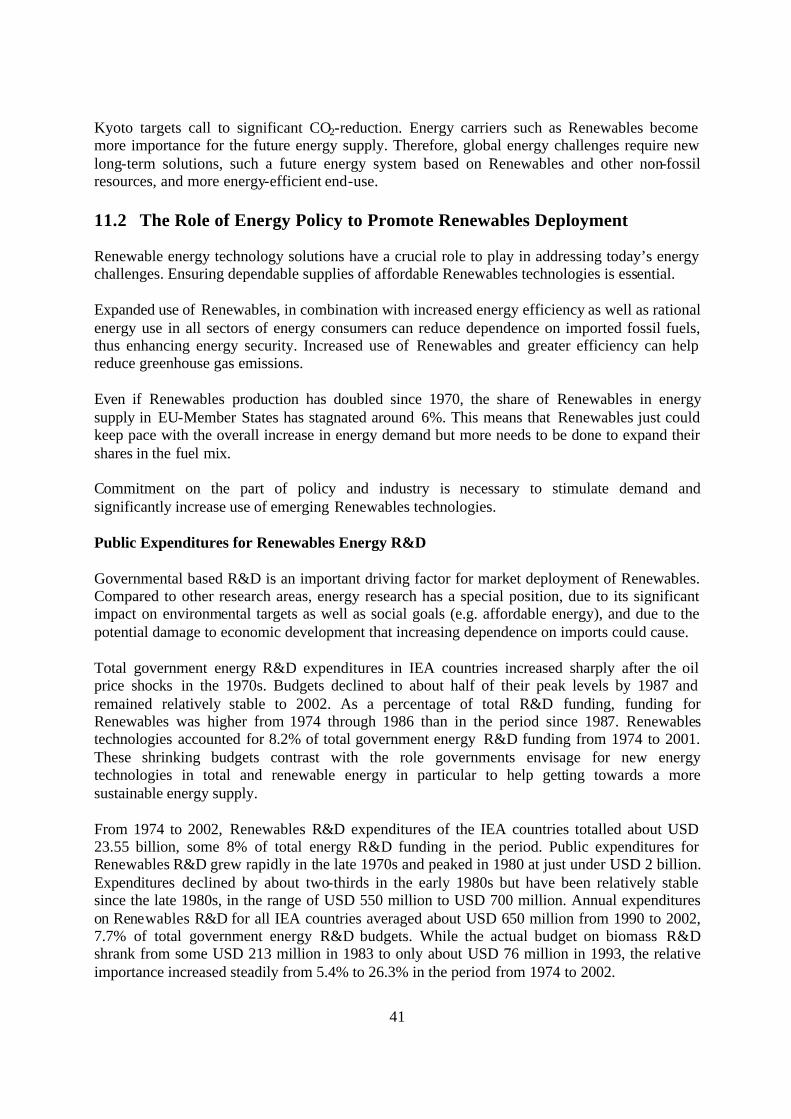
Kyoto targets call to significant CO2-reduction. Energy carriers such as Renewables become more importance for the future energy supply. Therefore, global energy challenges require new long-term solutions, such a future energy system based on Renewables and other non-fossil resources, and more energy-efficient end-use. 11.2 The Role of Energy Policy to Promote Renewables Deployment Renewable energy technology solutions have a crucial role to play in addressing today’s energy challenges. Ensuring dependable supplies of affordable Renewables technologies is essential. Expanded use of Renewables, in combination with increased energy efficiency as well as rational energy use in all sectors of energy consumers can reduce dependence on imported fossil fuels, thus enhancing energy security. Increased use of Renewables and greater efficiency can help reduce greenhouse gas emissions. Even if Renewables production has doubled since 1970, the share of Renewables in energy supply in EU-Member States has stagnated around 6%. This means that Renewables just could keep pace with the overall increase in energy demand but more needs to be done to expand their shares in the fuel mix. Commitment on the part of policy and industry is necessary to stimulate demand and significantly increase use of emerging Renewables technologies. Public Expenditures for Renewables Energy R&D Governmental based R&D is an important driving factor for market deployment of Renewables. Compared to other research areas, energy research has a special position, due to its significant impact on environmental targets as well as social goals (e.g. affordable energy), and due to the potential damage to economic development that increasing dependence on imports could cause. Total government energy R&D expenditures in IEA countries increased sharply after the oil price shocks in the 1970s. Budgets declined to about half of their peak levels by 1987 and remained relatively stable to 2002. As a percentage of total R&D funding, funding for Renewables was higher from 1974 through 1986 than in the period since 1987. Renewables technologies accounted for 8.2% of total government energy R&D funding from 1974 to 2001. These shrinking budgets contrast with the role governments envisage for new energy technologies in total and renewable energy in particular to help getting towards a more sustainable energy supply. From 1974 to 2002, Renewables R&D expenditures of the IEA countries totalled about USD 23.55 billion, some 8% of total energy R&D funding in the period. Public expenditures for Renewables R&D grew rapidly in the late 1970s and peaked in 1980 at just under USD 2 billion. Expenditures declined by about two-thirds in the early 1980s but have been relatively stable since the late 1980s, in the range of USD 550 million to USD 700 million. Annual expenditures on Renewables R&D for all IEA countries averaged about USD 650 million from 1990 to 2002, 7.7% of total government energy R&D budgets. While the actual budget on biomass R&D shrank from some USD 213 million in 1983 to only about USD 76 million in 1993, the relative importance increased steadily from 5.4% to 26.3% in the period from 1974 to 2002.
Geothermal experienced a very significant drop of R&D attention: its share in the total renewable R&D budget decreased sharply from 33.1% attributed in 1974 to only 8.3% in 2002. Almost the entire budget came from the US and Japan, which together made up for some 80-90% of the geothermal R&D budget throughout almost all the period. Wind power received only 0.3% of the total budget in 1974, but 15.1% in 2002. The relative attention paid to wind has been rather stable in the 1980s and 1990s, with shares varying between 11.9% (1981 value, when the total budget spent on wind power actually peaked with some USD 242 million) and 17.4% (1996 value). Despite the drop of total R&D expenditures on solar PV in the early 1980s from some USD 400 million in 1980 to USD 182 million in 1987, the relative importance of solar PV in the Renewables R&D portfolio has been increasing steadily. While the share of solar PV was at 8.6% in 1974, it was raised to 34.7% of the total reported Renewables R&D funding for 2002. The peak was reached in the year 2000, when 42.5% or some USD 271 million was attributed to solar PV. Solar thermal electric technologies faced similar trends. While up to 21% (1980 value) of the Renewables budget were attributed to them in the late 70s and early 80s, the trend changed through the lessons learned on the potential payoff of R&D in this area. Resource allocations among technologies have changed, with the result that only about 3.4% of the total funding went to this technology in 2000. It has since then increased again to 8.2% in 2002. Other public measures to support Renewables market deployment
R&D is not the only systematic means for creating the necessary progress and innovation for the development and market deployment of an energy system. Financial, regulatory or legislative, for example, measures can be at least more systematic and innovative as technological research. Subsidies for supporting the market deployment of energy technologies are broadly defined as any government intervention that alters the price of a good or service from the price it would be in an undistorted economic market. Subsidies cover a wide range of mechanisms and measures, including direct payments such as grants and loans, potential transfer of funds as loan guarantees, foregone government revenue or preferential taxes and market price intervention such as price or income support and feed-in-tariffs.
During the period 1990 – 1995, energy subsidies, including research subsidies, but excluding funding through the R&D European Community framework programmes, remained focused on the support of fossil fuels and nuclear power despite the pressures and potential threats that these fuels place on the environment. Limited support was provided for energy conversation and renewable energy sources. Between 1990 and 1998, energy research subsidies were reduces by 36% and remained focused on nuclear fission and fusion (more than 55% of the total in 1998). The total subsidies (excluding external costs) within the EU 15 of support to energy sector were estimated to be in the order of EUR 29 billion in 2001. Solid fuels received the largest share of subsidies in 2001. The Renewables technologies industry received significantly higher support on a per-energy unit basis than other fuel resources in the majority of EU-Member States.
45
Public Support for Energy Sources in the EU: 1990-1995
Public Support for Energy Sources in the European Union, EU 15 Subsidies, financial incentives, feed-in-tariffs, tax reduction, R&D expenditures: 1990 – 1995
Energy Sector Share of direct energy subsidies, %
Fossil fuels 53% Nuclear fission 23%
Renewables 7% Electricity 1%
Conservation 16% TOTAL 100%
Source: European Environment Agency, July 2002
Public Support for Energy Sources in the EU: 2001
Public Support for Energy Sources in the European Union, EU 15
Renewable energy sources 5,3 TOTAL 29,2 Source: European Environment Agency, June 4, 2004
To solve past problems, to meet short term energy needs and for positioning ourselves for a more sustainable future a better balance between funding is needed. 11.3 EU-Targets for Renewables and Energy-Efficiency In the White Paper of 1997, the EU laid down clear objectives for renewable energy by 2010: a share of 12% of Renewables in gross inland energy consumption. In the electricity and transport sectors, EU-wide legislation has been adopted to promote Renewables. The Directives include specific national targets, summing up to 21% for renewable electricity and 5.75% for bio fuels. In fact, almost half of the EU’s overall target for renewable energies can be covered by renewable heating and cooling alone. Fact is that almost 50% of the final energy consumption in
46
Europe is used for the heating needs of buildings, for domestic hot water production and for heating in industrial processes. Heat is the largest consumer of energy, being greater than electricity or transport. Renewable heating sources (solar thermal, biomass, geothermal) have a huge potential for growth and can replace substantial amounts of fossil fuels and electricity currently used for heating purposes.
EU-Goals for Energy Supply in EU-Member States2000 ? 2020
EU-Goals for Energy Supply in EU-Member States2000 ? 2020
Improvement of Energy-Efficiency
Improved contribution of Renewablesto Energy Supply
Reduction of Energy-relatedCO2-Emission
???
+ 20%
+ 20%
- 20%
20 / 20 / 20
17501890
1500
0
200
400
600
800
1000
1200
1400
1600
1800
2000
Ene
rgy
Sup
ply,
Mto
e
2005 2020 2020
Development of Total Primary Energy Supply in EU-25: 2005 - 2020: "Business as usual " and Goal
Supply GoalBusiness as usual
- 20%
47
Goals for Energy Efficiency in EU-25
2,7
2,6
2,8
2,2
1,6
1,4
1,5
0,9
1,9
1,3
1,8
0,4
0,0 0,5 1,0 1,5 2,0 2,5 3,0
Industry
Households
Trade, Energy Service
Transportation
%/Year
90 - 00 IST00 -20 Trend00 - 20 Scenario
0
1.000
2.000
3.000
4.000
5.000
6.000
7.000
En
erg
y, T
Wh
/Yea
r
Heat Demand EU 252004
Heat Demand EU 252030
Solar Thermal 2030 Solar Thermal 2050
Scenario for Contribution of Solar Heat to EU Demand by Sectors
Households
Commerce, Service
IndustryReduction of 40%
20%
50%
ENERGY DEMAND
SOLAR THERMAL
48
11.4 Identifying Key Tasks for European Research Renewables technologies The growing interest in Renewables market success will become realised only with an increased commitment to further improve market confidence in the continued, strong growth of Renewables by creating supportive and consistent policy frameworks in leading market countries, and by stimulating significant scale in those markets through public sector investments. EU Member States have continued to advocate for a strong R&D effort to develop a new generation of Renewables as well as a balanced commitment toward continued R&D, and toward market support. As an emerging industry, the renewable energy sector needs a supportive political and legal framework to reach its full potential, which includes strong public investment in R&D and better incentives for private sector research spending. General R&D issues for Renewables More Renewables research is required to increase the efficiency of existing technologies, to develop new technologies, processes and products and to drive down significantly the costs for the production of heat, power and fuels from Renewables. An increased public R&D spending should go hand in hand with increased involvement of the industry to ensure the market up-take of the generated results. With solar electric technologies (photovoltaic), for example, industrial applications have long been cost-effective, and limited niches in high solar resource areas are close to economic. In addition to the space exploration and consumer products, it is now very common to observe PV powered signs in road construction sites, water pumping, lighting systems at recreation properties and many other, all planned and funded through market forces. To achieve the mainstream however, PV costs must come down substantially. More R&D funding is needed to achieve the breakthroughs that will lead to large-scale markets. Other renewable technologies have fallen out of the R&D pipeline. Concentrating solar power, ocean energy, and advanced geothermal are all technologies that lost much of their R&D funding some years ago. It is time to assess their potential in the context of the new imperatives that arise from the global efforts to reduce greenhouse gas emissions and perhaps refocus R&D investments to bring these technologies to the market. Such refocusing may occur not necessarily by increasing overall funding levels, but rather either through reallocations or more imaginative ways of leveraging public funding with the private sector. Efficiency and effectiveness are called for in devising strategies to accomplish a wider spectrum of R&D priorities. The novel approaches include both public sector investments. The efforts of the private sector supporting potentially winning technologies can subsequently be encouraged through policy initiatives towards commercialisation. If national objectives for diverse and environmentally sustainable energy use are to be achieved, a clear strategy must be at the centre of every transformation path into a more renewable energy future. The strategy should include a significant acceleration in technical development of technologies. Although the development of new and improved renewable energy technologies aiming at lower
49
capital costs, improved reliability and higher conversion efficiencies, much more work will be needed over the next 50 years. R&D must lead to market related products and services. There has to be a clear distinction between wide-ranging ‘long-term scientific research’ and well focussed ‘near-term market R&D’. Particular consideration should be given to achieving cost-effectiveness. The world needs a new generation of Renewables technologies to reach the mainstream market for heat and for fuels, as well as for electricity and public funds need to be used as effectively as possible. Environmental and social issues associated with public acceptance and capacity build-up also needs to be addressed. Certain technologies face seasonal fluctuations and intermittency. It is necessary to address integration of new technologies into the grid, including specific technologies for storage and grid management. Demonstration is called for in most areas, notably concentrating solar power, ocean energy, novel bio-energy technologies and other options, in order to test new findings and act as a precursor to market deployment. Regulatory frameworks are needed in areas addressing heating and cooling, such as bio-energy, solar heating and geothermal heat pumps. Based among others on the extra long cycles in the energy system and on the commodity nature of energy, the entry threshold for any new energy source will be high. Another threshold is that price is the main factor in the competition. Therefore, all renewable energy sources except for large industrial bio-energy (paper and pulp industries), large-scale hydro and some niche Renewables applications seem still to need public support to be cost-competitive. Public support will be necessary to bring new energy technologies to a volume market, which requires a political vision and decision. EU funds are needed to strengthen existing competencies in the renewable energy sphere and to intensify research and technological development according to the main principles of sustainable development. Special issues on Renewables technologies The principle lessons learned over the last thirty years are that the move towards sustainable renewable energy options depends on resource availability, technical maturity and finally a policy environment that is conducive to both technology improvements as well as commercialisation. Because of the diverse nature of renewable sources of energy, it is important that each country or region promote technologies and options that are well suited to specific resource availability. While renewable energy production rises rapidly in absolute terms, shares have stagnated. Thus more R&D funding and initiatives in a larger number of countries will be necessary to raise renewable energy percentages in global energy supply.
50
Achieving greater energy supply from hydropower does not require technological breakthroughs, huge R&D expenditures or radical changes to development of hydropower resources. Current requirements include continuous improvements in technology, increased public acceptance and hydropower project approvals supported by government policy. In addition, the technology is at a stage in which implementation and development should be financed and supported jointly by the public and private sectors. Regarding R&D priorities of bio-energy, it focuses on overcoming the environmental, institutional, technical, non-technical and financial barriers to the short- and long-term deployment of bio-energy technologies. Additional R&D priorities for bio-energy include: making available relatively cheap feedstock’s and further increasing conversion (short term); capitalising on opportunities offered by bio-refineries (medium term); and producing hydrogen from biomass and cultivating, in sustainable ways, large amounts of biomass worldwide (long term). Efforts must also be undertaken to strengthen social and environmental integration of bio-energy along the complete chain, i.e., from biomass production to provision of energy services to the consumer. Geothermal has identified several priority R&D areas in which significant progress will help accelerate its worldwide advancement and has aimed to address them. These are related to cost reduction, sustainable use, and the expansion of the technology for new applications and into new geographical regions. With greater funding and manpower available, more rapid achievement of the priorities would be possible. The benefits would include an extension of the use of geothermal for power generation, and direct heat use, to areas far from tectonic plate boundaries and covering much larger regions. During the last five years, company R&D has put emphasis on developing larger and more effective wind turbine systems, utilising knowledge developed from national and international generic R&D programs. Continued R&D is essential to provide the necessary reductions in cost and uncertainty to realise the anticipated level of deployment. Continued R&D will support revolutionary new designs as well as incremental improvements. Researchers will improve understanding of how extreme wind situations, aerodynamics, and electrical generation affect wind turbine design. The priority research areas include increasing value and reducing uncertainties, continuing cost reduction efforts, enabling large-scale use, and minimising environmental impacts. Commercially, PV technology is currently dominated by two module technologies, crystalline silicon (c-Si) and thin film modules. Wafer based crystalline silicon currently controls 90% of market share. The thin film market share has decreased over the past ten years as crystalline silicon production has increased. Thin films have the important potential to extend the PV learning curve beyond the point which may be reached by crystalline silicon technology; as emerging technologies, thin films could compete with C-Si but further development and scaling up of manufacturing is necessary. The share of thin-film technologies is expected to increase after 2010. It is estimated that about half of the future cost decreases for PV will be the result of R&D into improving materials, processes, conversion efficiency and design. Substantial cost reductions can also be gained through increased manufacturing volume and economies of scale. Increasing the size of components and plants will also reduce costs, as well as streamlining installation procedures.
51
A comprehensive and ambitious applied R&D programme is needed to develop competitive advanced solar heating and cooling systems. These systems would be able to cost effectively provide 10 -20% of the overall low temperature heat demand of the EU Member States by 2020. R&D efforts need to focus on technical advances in material and components, storage, scaling up and increasing efficiency of solar heating and cooling (SHC) systems. Architectural aspects also need to be taken into consideration. Solar thermal collectors need to become an integral part of buildings, ideally becoming standard construction elements. It has been estimated that approximately half of the cost reduction potential for concentrating solar power (CSP) can be attributed to scale-up to larger plant sizes and volume production effects, whereas the other half is attributed to technology R&D efforts. Scaling reduces unit investment cost, unit operation and maintenance costs, and increases performance. Technological improvements in the concentrator performance and cost would most dramatically impact the levelized electricity cost (LEC) figures. Storage Systems are a second key factor in reducing the cost of solar power plants. Additional R&D efforts need to be supported by significant deployment efforts. Northern Africa is considered as a high solar resource levels and it may possible to export solar electricity to the European market. Such as high solar resource levels may over-compensate the additional transport cost and deployment of the technology would help to support the political stability in this region. Legal frameworks should allow more flexibility in the adoption of hybrid operations of central solar power (CSP) systems. And, as scaling up CSP to larger power block sizes is an essential step in reducing electricity costs, incentive schemes should not limit the upper power level to fully exploit the cost reduction potential. There is no commercially leading technology on ocean energy conversion systems. Ocean energy systems are confronting the marine environment in its most energetic location, implying strong wave climate and/or strong currents and they need to fulfil the basic economic and environmental requirements including: low cost, safety, reliability, simplicity and low environmental impact. Non-technical barriers are hurdles put in front of emergent technologies that will slow or even stop their maturity. The research areas that will address common barriers can be classified as resource assessments, energy production forecasting, simulation tools, test and measurement standards and the environmental impact. Technical barriers are technical hurdles that need to be solved by research activities to bring a concept to its full potential. Every concept has its own list of specific technical barriers. Nevertheless, there are common denominators among similar types of concepts. For simplification these barriers will be categorized in to three technology areas: wave, tidal and salinity gradient. Additional R&D funding is critical to advancing the development of ocean energy systems. Ocean energy technologies must solve two major problems concurrently: proving the energy conversion potential and overcoming a very high technical risk from a harsh environment. Additional R&D funding would help to mitigate the substantial technical risk faced by device developers daring to harness the energy of the marine environment. 11.5 Growing Political Consensus to Promote Renewables Technologies There is a strong and growing political consensus to promote the development of Renewables. E.g., all IEA Member States have established, or are planning, measures to increase share of Renewables in their energy markets. The Directive adopted by the European Union as a Member of IEA - is an example of this political will: the target is to increase the share of Renewables – as an average for all EU-Member countries – in energy consumption/energy supply from its present level of 6% to 12% in 2010. Renewables are also high on the agenda of developing countries,
52
and expanded renewable energy deployment is one of the key goals of the World Bank. Renewables are perceived by Third World Countries to provide solutions to many of their development challenges, including energy supply, diversity of the energy mix, local environmental problems, and rural development. One of the main findings of the EU survey on "Energy: Issues, options and technologies" – EUROBAROMETER, based on interviews with some 16 000 citizens from 15 EU Member States - is that the EU’s dependency on external energy supply is seen as a real problem, leading citizens to call for further research into new energy sources, such as nuclear fusion and renewable energies, and the development of new technologies for energy-saving methods. Some of the survey’s main findings are:
• In general the image of Renewables is very positive. People have faith in these environmentally benign sources of energy and they assign a high priority to it, both in terms of research activities and policy measures.
• As regards the perception of the EU’s long-term future, renewable sources of energy are perceived as being less expensive, particularly environment-friendly, and producing useful energy in sufficient quantities.
• As far as energy-related research is concerned, EU citizens expect to see significant spin-offs for the protection of the environment and want more action in the field of renewable energy sources and cleaner means of transport.
Accession to the European Union and the movement towards a European research area have, together with international obligations in the field of climate change, created a whole new context for energy research and technology. These institutional and market changes have led on one side to a shortening of the time horizons for energy research and technological development, and on the other to increased competition between national innovation systems. With this in view, the task of the energy research and energy technology concept is to establish medium term focus points which cover the areas not sufficiently dealt with by existing instruments, and to work out a clear position within the European Union. Its aim is to strengthen existing competencies in the energy sphere and to intensify research and technological development according to the main principles of sustainable development. The overall goal of an EU R&D initiative should be to achieve the leadership of EU-Member States in the area of renewable energy technologies. 12. Estimating the Future Energy Systems Even future energy systems is hard to foresee, there is no doubt about the global growth of energy consumption, the necessity for more decentralised and dispersed energy sources and systems in Europe and other larger regions. This means that larger contribution of Renewables in the global and European energy mix is necessary. Price trends for coal, oil and gas are important for planning future energy systems, but are less predicable. Important is the willingness for the transition from fossil fuels to Renewables. Large-scale market introduction of new technologies (i.e. wind-power, solar-power, bio-fuel production) will have an influence/impact to the environment as well to public acceptance. These
53
facts have to be considered on the basis of “sustainability”, considering energetic, economic, environmental and social aspects. R&D is needed to find adequate solutions. The energy system of tomorrow will be a result of technological innovation and various social, economic and environmental changes. Important limitations to expanding the use of technical potentials of renewable sources are economics as well as the geographic distribution of the resource. Long-term scenarios are generally simplified. Estimates for the future energy systems generally involve forecasting current trends into the future creating the best possible images of the future. The main question what may be realisable is not answered. But prospective energy scenarios are not only meant to give the best prediction of the future but also to initiate debate or even promote visions. Energy scenarios often concentrate on the future of fossil fuels and nuclear energy, including longer-term prospects of producing oil from tar sands and extracting natural gas trapped in hydrate beneath the ocean. But fossil fuels and nuclear energy both face environmental challenges – fossil fuels because of their contribution to emissions of greenhouse gases, and nuclear power because of the problem of long-term storage for nuclear waste. Energy scenarios for the establishment of a “sustainable” energy system focus on the long-term vision of energy production systems based on renewable sources and more efficient energy-use technologies, as well as the use of hydrogen or other synthetic fuels of energy carriers. Also coal may be a part of future sustainable energy system, if way could be found to use coal more efficiently and to remove and store the CO 2 produced when burned. The uncertain nature of energy forecasting is a main barrier for initiatives on global and national level to organise future energy systems. A key uncertainty is the point in time at which growth in the demand for oil and gas will extend growth in production capacity. There exist really no clear idea how much oil and gas can be recovered, and at what prices. Also the pace at which new energy technologies will be introduced on the market is a big source of uncertainty. The uncertain nature of energy forecasting is a main barrier for initiatives on global and national level to organise future energy systems. A key uncertainty is the point in time at which growth in the demand for oil and gas will extend growth in production capacity. There exist really no clear idea how much oil and gas can be recovered, and at what prices. Also the pace at which new energy technologies will be introduced on the market is a big source of uncertainty.
54
Examples in the past show that new energy technologies often succeed only with the help of specific policies and incentives set up to establish new markets and promote technical innovation. Even future energy systems is hard to foresee, there is no doubt about the global growth of energy consumption, the necessity for more decentralised and dispersed energy sources and systems in Europe and other larger regions. This means that larger contribution of Renewables in the global and European energy mix is necessary. Price trends for coal, oil and gas are important for planning future energy systems, but are less predicable. Important is the willingness for the transition from fossil fuels to Renewables. Large-scale market introduction of new technologies (i.e. wind-power, solar-power, bio-fuel production) will have an influence/impact to the environment as well to public acceptance. These facts have to be considered on the basis of “sustainability”, considering energetic, economic, environmental and social aspects. R&D is needed to find adequate solutions. The energy system of tomorrow will be a result of technological innovation and various social, economic and environmental changes. 13. Forecast for Total Primary Energy Supply and
share of Renewables to Energy supply
Energy forecasts on assumptions of an average growth of TPES and of an average annual capacity of Renewables production are illustrated in the following figures. Worldwide energy forecast: In the case of an average annual growth of TPES with 2% and an average annual growth of Renewables production capacity of 5%, the share of Renewables contribution to TPES will be 30 % in 2050. OECD-Europe forecast: In the case of an average annual growth of TPES with 1% and an average annual growth of Renewables production capacity of 5%, the share of Renewables contribution to TPES will be 33 % in 2050. Austria energy forecast: In the case of an average annual growth of TPES with 1% and an average annual growth of Renewables production capacity of 3%, the share of Renewables contribution to TPES will be 74 %. While in developing countries and countries in transition a higher annual growth rate in TPES is expected, a decrease in industrialized countries is expected – because of more energy-efficiency.
55
Forecast of Worldwide Total Primary Energy Supply (TPES)
0
500
1000
1500
2000
2500
3000
3500
4000
4500
2003
2005
2007
2009
2011
2013
2015
2017
2019
2021
2023
2025
2027
2029
2031
2033
2035
2037
2039
2041
2043
2045
2047
2049
Pri
mar
y E
ner
gy
Su
pp
ly,
EJ/
year
+1%/year
+2%/year
+5%/year
Average Annual Growth Rate of TPES:1%/year, 2%/year and 3%/year
443 707
1 124
4 388
2010: 514
+2%/year
Forecast of Worldwide Renewable Energy Supply Assumption: Annual Growth Rate of Renewables Production Capacity
0
50
100
150
200
250
300
350
400
2003
2005
2007
2009
2011
2013
2015
2017
2019
2021
2023
2025
2027
2029
2031
2033
2035
2037
2039
2041
2043
2045
2047
2049
Ren
ewab
les
Su
pp
ly, E
J/ye
ar
Renewables Production Capacity
2003: 1,5 EJ/yearAnnual Growth-Rate:
1%, 3%, 5%/year
59
1 %/year
148
5 %/year
3 %/year213
339
2009: 66
1%/year
56
Forecast of Primary Energy Supply (TPES) in OECD-Europe
0
200
400
600
800
1000
1200
1400
1600
1800
2000
2003
2005
2007
2009
2011
2013
2015
2017
2019
2021
2023
2025
2027
2029
2031
2033
2035
2037
2039
2041
2043
2045
2047
2049
Pri
mar
y E
ner
gy
Su
pp
ly, E
J/ye
ar
+1%/year
+2%/year
+5%/year
Average Annual Growth Rate of TPES:1%/year, 2%/year and 3%/year
2032010: 216
2 011
515
324
1 %/year
Forecast of Renewable Energy Supply in OECD-EuropeAssumption: Annual Growth Rate of Renewables Production Capacity
0
20
40
60
80
100
120
2003
2005
2007
2009
2011
2013
2015
2017
2019
2021
2023
2025
2027
2029
2031
2033
2035
2037
2039
2041
2043
2045
2047
2049
Ren
ewab
les
Su
pp
ly, E
J/ye
ar
Renewables Production Capacity
2003: 0,5 EJ/JahrAnnual Growth-Rate:
1%, 3%, 5%/year
13
1 %/year
43
5 %/year
3 %/year 65
107
2009: 16.4
3%/year
57
Forecast of Primary Energy Supply (TPES) in Austria
1000
1500
2000
2500
3000
3500
400020
02
2004
2006
2008
2010
2012
2014
2016
2018
2020
2022
2024
2026
2028
2030
2032
2034
2036
2038
2040
2042
2044
2046
2048
Pri
mar
y E
ner
gy
Su
pp
ly, P
J/ye
ar
+1%/year
+2%/year
+3%/year
Average Annual Growth Rate of TPES:1%/year, 2%/year and 3%/year
1.5 %
2008: 1 439
3 538
3 024
2 227
1 395
Forecast of Renewable Energy Supply in Austria Assumption: Annual Growth Rate of Renewables Production Capacity
Share of Renewables to Worldwide Total Primary Energy Supply (TPES)
OECD-Europe
Austria Energy ScenarioAssumptions
Average Annual Growth Rate, %/year
TPES Renewables
1 %/year
TPES
59
14. IEA World Energy Outlook 2030 Forecasting the World Total Primary Energy Supply (TPES), three Scenarios were used in the IEA World Energy Outlook 2010: (1) New Policies Scenario is the central scenario in WEO-2010
⇒ Assumes cautious implementation of recently announced commitments & plans, even if yet to be formally adopted.
⇒ Provides benchmark to assess achievements & limitations of recent developments in climate & energy policy.
(2) Current Policies Scenario takes into consideration only those policies that had been formally adopted by mid-2010, equivalent to the Reference Scenario of past Outlooks. (3) The 450 Scenario sets out an energy pathway consistent with the goal of limiting increase in average temperature to 2°C according to the “Climate Goal”.
IEA WEO-2010 scenariosNew Policies Scenario is the central scenario in WEO-2010
> assumes cautious implementation of recently announced commitments & plans, even if yet to be formally adopted
> provides benchmark to assess achievements & limitations of recent developments in climate & energy policy
Current Policies Scenario takes into consideration only those policies that had been formally adopted by mid-2010
> equivalent to the Reference Scenario of past Outlooks
The 450 Scenario sets out an energy pathway consistent with the goal of limiting increase in average temperature to 2OC
Results for 2035 are:
• In 2035, energy demand is 8% higher in the Current Policies Scenario and 11% lower in the 450 Scenario than in the New Policies Scenario.
• The share of fossil fuels in the energy mix in 2035 varies markedly, from 79% in the Current Policies Scenario to 74% in the New Policies Scenario and 62% in the 450 Scenario.
• Global primary energy demand grows in the New Policies Scenario by 36% between 2008 and 2035, with natural gas rising the most in absolute terms .
60
• Global oil use continues to expand on announced policies, reaching 99 mb/d by 2035, but would need to fall to little more than 80 mb/d to achieve the climate goal.
• Global oil production reaches in the New Policies Scenario 96 mb/d in 2035 on the back of rising output of natural gas liquids and unconventional oil, as crude oil production plateaus.
• Production of oil from Canadian oil sands emits more greenhouse gas than that of most conventional oils, but on a well-to-wheels basis the differences is typically only 5-15%.
• Production from Canadian oil sands increases steadily from 1.3 to 4.2 mb/d, with in-situ production overtaking mined production.
• OPEC output is set to expand progressively, boosting its global markets share from 41% today to 52% in 2035 and outweighing a slow long-term decline in non-OPEC countries.
• Shale oil production is expected to remain small, in spite of the huge resources, due to costs and environmental constraints.
• The shares of generation from non-hydro renewable sources — wind, biomass, solar, geothermal and marine — increases more than five-fold, from 3% in 2008 to 16% by 2035.
• Renewable sources (including hydro) and nuclear power are projected to account for 45% of total global generation by 2035, up from 32% today.
• Modern Renewable grow rapidly in all three scenarios; the use of traditional biomass declines.
• The use of renewable energy triples between 2008 & 2035, driven by the power sector where their share in electricity supply rises from 19% in 2008 to 32% in 2035.
• Across all scenarios, bio-fuels for transport grow more rapidly than Renewable for heat and electricity, but from a relatively low base.
• Electricity from Renewable increases from 3 800 TWh to 11 200 TWh in the New Policies Scenario; it rises to 8 900 TWh in Current Policies Scenario and 14 500 TWh in 450 Scenario.
• Most of the increase in renewable electricity generation between 2008 and 2035 comes from wind and hydropower, which contribute 36% and 31% of the additional demand.
• On average, the cost of onshore wind power is cut by a third between 2010 and 2035; the cost of PV is cut by two-thirds.
• Offshore wind power could supply as much as 4% of total electricity by 2035; prospects are particularly bright in Northern Europe.
• CSP electricity can be produced at costs of $100 to $135 per MWh at good sites in North Africa and Middle East in 2035, some of the lowest in the world.
• Solar power could be exported from North Africa to Europe (at transmission costs of $20 to $50 per MWh) to the benefit of both regions.
• In the 450 Scenario, China & the US together account for 50% of the cumulative emission abatement that is needed in 2010-2035.
• In the 450 Scenario, transport becomes the largest source of energy-related emissions, as the power sector is largely decarbonised, especially in OECD+ countries.
• For the countries surveyed, fossil fuels were subsidised at a weighted-average rate of 22%, meaning consumers paid 78% of competitive market reference prices.
• A complete phase-out of fossil-fuel consumption subsidies would reduce CO2 emissions by 5.8% or 2 Gt, by 2020.
• The phase out of fossil-fuel subsidies by 2020 would provide over 40% of the abatement that is needed by 2020 to move from the Current Policies Scenario to the 450 Scenario.
61
Forecast of Development of World-Population
0
2
4
6
8
10
12
14
16
18
20
1995 2010 2025 2040 2055 2070 2085 2100
Bill
ion
Inh
abit
ants
Scenario-1 Scenario-2 Scenario-3
Scenario-1: High Birth-rate, Low Death-rateScenario-2: Low Birth-rate, High Death-rate
World Total Primary Energy Supply 2030Reference ScenarioFuel Shares of TPS
Hydropower2,4%
Renewables11,9%
Nuclear5,7%
Coal/peat29,1%
Oil29,8%
Gas21,2%
Total 2030: 16 790 Mtoe= 702.95 EJ
IEA-World Energy Statistics 2010
Total Primary Energy Supply (TPES) in 2030450 Policy Scenario
Share of Fuels
Hydropower3,4%
Geothermal, Solar, Wind, Biomass,
etc.18,6%
Nuclear9,9%
Coal/Peat18,2%
Oil29,5%
Gas20,4%TOTAL 2030:
14 389 Mtoe= 602.43 EJIEA-World Energy Outlook 2010
63
In 2035, energy demand is 8% higher in the Current Policies Scenarioand 11% lower in the 450 Scenario than in the New Policies Scenario
6 000
8 000
10 000
12 000
14 000
16 000
18 000
20 000
1980 1990 2000 2010 2020 2030 2035
Mto
e
Current Policies Scenario
New Policies Scenario
450 Scenario
World primary energy demand by scenario
The share of fossil fuels in the energy mix in 2035 varies markedly, from 79% in the Current Policies Scenario to 74% in the New Policies
Scenario & 62% in the 450 Scenario
0% 25% 50% 75% 100%
450 Scenario 2035
New Policies Scenario 2035
Current Policies Scenario 2035
2008
Coal
Oil
Gas
Nuclear
Hydro
Biomass
Other renewables
Shares of energy sources in world primary demand by scenario
Global primary energy demand grows in the New Policies Scenario by 36% between 2008 & 2035, with natural gas rising the most in absolute terms
0
1 000
2 000
3 000
4 000
5 000
1980 1990 2000 2010 2020 2030 2035
Mto
e Oil
CoalGas
Biomass
Nuclear
Other renewablesHydro
World primary energy demand by fuel in the New Policies Scenario
Global oil use continues to expand on announced policies, reaching 99 mb/d by 2035, but would need to fall to little more than 80 mb/d
to achieve the climate goal
50
60
70
80
90
100
110
1980 1990 2000 2010 2020 2030 2035
mb/
d Current Policies Scenario
New Policies Scenario
450 Scenario
World primary oil demand by scenario
Global energy use grows in the New Policies Scenario by 36%, with non-OECD countries – led by China, where demand surges by 75% –
accounting for almost all of the increase
World primary energy demand by region in the New Policies Scenario
0
2 000
4 000
6 000
8 000
10 000
12 000
14 000
16 000
18 000
1990 1995 2000 2005 2010 2015 2020 2025 2030 2035
Mto
e
Rest of world
China
OECD
Incremental primary energy demand in the New Policies Scenario, 2008-2035
- 600 - 300 0 300 600 900 1 200 1 500
Other renewables
Hydro
Nuclear
Gas
Oil
Coal
Mtoe
OECD
China
Rest of world
- 600 - 300 0 300 600 900 1 200 1 500
Other renewables
Hydro
Nuclear
Gas
Oil
Coal
Mtoe
OECD
China
Rest of world
Demand for all types of energy increases in non-OECD countries,while demand for coal & oil declines in the OECD
64
Global oil production reaches in the New Policies Scenario 96 mb/d in 2035 on the back of rising output of natural gas liquids & unconventional oi l,
as crude oil production plateaus
World oil production by type in the New Policies Scenario
0
20
40
60
80
100
1990 1995 2000 2005 2010 2015 2020 2025 2030 2035
mb/
d
Crude oil - fields yetto be developed or found
Crude oil – currentlyproducing fields
Total crude oil
Unconventional oil
Natural gas liquids
Production of oil from Canadian oil sands emits more greenhouse gas than that of most conventional oils, but on a well-t0-wheels basis the differences
is typically only 5-15%
0 100 200 300 400 500 600 700
Saudi Arabia
Venezuela
Mexico
Iraq
US Gulf Coast
Nigeria
California heavy
Oil sands mining
Oil sands in-situ low
Oil sands in-situ high
Kilogrammes of CO2-eq per barrel of crude
Combustion
Refining
Upgrading & transport
Production
Well-to-wheels greenhouse-gas emissions of various oils
Production from Canadian oil sands increases steadily from 1.3 to 4.2 mb/d,with in-situ production overtaking mined production
0
1
2
3
4
5
2000 2009 2015 2020 2025 2030 2035
mb/
d In-situ
Mining
Canadian oil-sands production by type in the New Policies Scenario
Shale-oil production by country in the New Policies Scenario
0
0.1
0.2
0.3
0.4
2000 2009 2015 2020 2025 2030 2035
mb/
d Estonia
Brazil
Jordan
China
United States
0
0.1
0.2
0.3
0.4
2000 2009 2015 2020 2025 2030 2035
mb/
d Estonia
Brazil
Jordan
China
United States
Shale oil production is expected to remain small, in spite of the huge resources,due to costs & environmental constraints
Modern renewables grow rapidly in all three scenarios;the use of traditional biomass declines
World primary renewable energy supply by scenario
Modern renewables
Traditional biomass
0 1 000 2 000 3 000 4 000
450 Scenario
New Policies Scenario
Current Policies Scenario
450 Scenario
New Policies Scenario
Current Policies Scenario
2035
20
20
Mtoe
2008
The use of renewable energy triples between 2008 & 2035, driven by the power sector where their share in electricity supply rises
from 19% in 2008 to 32% in 2035
Renewable primary energy demand in the New Policies Scenario
0 100 200 300 400 500
European Union
United States
China
Brazil
India
Africa
OECD Pacific
Mtoe
2008
2035
65
Share of nuclear and renewable energy in total electricity generation by regionin the New Policies Scenario
19% 24%32%
17%24%
33%21% 23%
31%
14%14%
14%
21%
22%
23%
5%7%
8%
0%
10%
20%
30%
40%
50%
60%
2008 2020 2035 2008 2020 2035 2008 2020 2035
World OECD Non-OECD
Nuclear
Renewables
19% 24%32%
17%24%
33%21% 23%
31%
14%14%
14%
21%
22%
23%
5%7%
8%
0%
10%
20%
30%
40%
50%
60%
2008 2020 2035 2008 2020 2035 2008 2020 2035
World OECD Non-OECD
Nuclear
Renewables
Renewable sources (including hydro) and nuclear power are projected to account for45% of total global generation by 2035, up from 32% today
Incremental renewables-based electricity in the New Policies Scenario, 2008-2035
0
250
500
750
1 0001 250
1 500
1 750
2 000
2 250
Wind Hydro Biomass Solar PV CSP Geothermal Marine
TW
h OECD
Non-OECD
0
250
500
750
1 0001 250
1 500
1 750
2 000
2 250
Wind Hydro Biomass Solar PV CSP Geothermal Marine
TW
h OECD
Non-OECD
Most of the increase in renewable electricity generation between 2008 and 2035 comes from wind and hydropower, which contribute 36% and 31% of the additional demand
Electricity from renewables increases from 3800 TWh to 11 200 TWh in the New Policies Scenario; it rises to 8900 TWh in Current Policies Scenario &
14 500 TWh in 450 Scenario
Global electricity generation from renewables by scenario
0
3 000
6 000
9 000
12 000
15 000
2000 2005 2010 2015 2020 2025 2030 2035
TWh 450 Scenario
New Policies
Scenario
Current Policies
Scenario
Electricity generating costs of renewablesin the New Policies Scenario
0 50 100 150 200 250 300 350 400
Geothermal
Wind: onshore
Wind: offshore
Hydro
Biomass
Solar PV
Concentrating solar power
Marine
Dollars per MWh
2010
2020
2035
0 50 100 150 200 250 300 350 400
Geothermal
Wind: onshore
Wind: offshore
Hydro
Biomass
Solar PV
Concentrating solar power
Marine
Dollars per MWh
2010
2020
2035
On average, the cost of onshore wind power is cut by a third between 2010 and 2035;the cost of PV is cut by two-thirds
Stronger economic recovery and the lack of ambition of 2020 pledges mean that emissions cuts after 2020 need to be both deeper and faster than those
presented in WEO-2009
20
25
30
35
40
45
1990 1995 2000 2005 2010 2015 2020 2025 2030 2035
Gt WEO-2010: Current
Policies Scenario
WEO-2009: Reference Scenario
WEO-2010: New Policies Scenario
WEO-2010: 450 Scenario
WEO-2009: 450 Scenario
World energy-related CO2 emissions by scenario
After 2020, the share of energy efficiency in total abatement declines,while more costly options like biofuels and CCS increase their share
20
25
30
35
40
45
2008 2015 2020 2025 2030 2035
Gt
450 Scenario
Current Policies Scenario
2020 2030 2035
Efficiency 71% 49% 48%
– End-use (direct) 34% 24% 24%
– End-use (indirect) 33% 23% 23%
– Power plants 3% 2% 1%
Renewables 18% 21% 21%
Biofuels 1% 3% 3%
Nuclear 7% 9% 8%
CCS 2% 17% 19%
Total (Gt CO2) 3.5 15.1 20.9
Abatement
World energy-related CO2 emissions savings in the 450 Scenario compared with the Current Policies Scenario,
by measure
66
20
22
24
26
28
30
32
34
36
38
2008 2015 2020 2025 2030 2035
Gt
New Policies Scenario35.4 Gt
In the 450 Scenario, China & the US together account for50% of the cumulative emission abatement that is needed in 2010-2035
450 Scenario
21.7 Gt
World energy-related CO2 emission savings by country in the 450 Scenario
China 32%United States 18%
European Union 8%India 7%Middle East 4%
Russia 4%Rest of world 27%
Share of cumulative abatement between 2010-2035
13.7 Gt
Fossil-fuel consumption subsidies amounted to $312 billion in 2009, down from
$558 billion in 2008, with the bulk of the fall due to lower international prices
Economic value of fossil-fuel consumption subsidies by country, 2009
Iran
Saud
i Ara
bia
Russ
iaIn
dia
Chin
aEg
ypt
Vene
zuel
aIn
done
sia
UAE
Uzb
ekis
tan
Iraq
Kuw
ait
Paki
stan
Arge
ntin
aU
krai
neAl
geri
aM
alay
sia
Thai
land
Bang
lade
shM
exic
oTu
rkm
enis
tan
Sout
h Af
rica
Qat
arKa
zakh
stan
Liby
a
0
10
20
30
40
50
60
70
Billi
on d
olla
rs Electricity(generated from fossil fuels)
Gas
OilCoal
Impact of subsidy phase-out on global energy-related CO2 emissions
28
30
32
34
36
2008 2010 2012 2014 2016 2018 2020
Gt
Current Policies Scenario
450 Scenario
1.5 Gt
3.5 Gt
The phase out of fossil-fuel subsidies by 2020 would provide over 40% of the abatementthat is needed by 2020 to move from the Current Policies Scenario to the 450 Scenario
Fossil-fuel subsidy rates as a proportion of the full cost of supply, 2009
For the countries surveyed, fossil fuels were subsidised at a weighted -average rate of 22%,
meaning consumers paid 78% of competitive market reference prices
67
World Total Primary Energy Supply (TPES)
0
2.000
4.000
6.000
8.000
10.000
12.000
14.000
16.000
18.000
Mto
e
Other Renewables 654 1.313 1.998 2.675
Hydropower 110 270 403 489
Nuclear 55 711 957 1.424
Coal/Peat 1.498 3.312 4.886 2.618
Gas 978 2.588 3.559 2.934
Oil 2.819 4.073 4.987 4.243
1973 2009 RS 2030 "450" 2030
IEA WEO-2030 Scenarios
6 115
16 790
14 38912 267
World Total Primary Energy Supply (TPES)Share of Fuels
46,1
33,2 29,7 29,5
16
21,121,2 20,4
24,5
2729,1
18,2
5,8 5,7
9,9
3,4
10,7 10,7 11,918,6
0,92,42,21,8
0
10
20
30
40
50
60
70
80
90
100
1973 2009 RS 2030 "450" 2030
Sh
are
of F
uel
s, %
Other RenewablesHydropowerNuclearCoal/PeatGasOil
Development of WORLD Total Primary Energy Supply IEA World Energy Outlook 2010
68
Energy-related CO2 - Emissions
0
5.000
10.000
15.000
20.000
25.000
30.000
35.000
40.000
1970 1980 1990 2000 2010 2020 2030
Bill
ion
tons
CO
2
World OECDTransition economies Developing countriesWorldwide CO2-Emissions increase with 1,8 % per year up to
38 billion tons in 2030 – 70% more than Kyoto-goal
Quelle: IEA World Energy Outlook 2002
Developing Countries
OECD
World
TransitionEconomies
Of course, carbon is not the only environmental problem, but it’s the benchmark, and the situation will continue to deteriorate if policy changes are not made.
15. Summary Even future energy systems is hard to foresee, there is no doubt about the global growth of energy consumption, the necessity for more decentralised and dispersed energy sources and systems in Europe and other larger regions. This means that larger contribution of Renewables in the global and European energy mix is necessary. Renewable energy sources will have to play a central role in moving the world onto a more secure, reliable and sustainable energy path. The potential is unquestionably large, but how quickly their contribution to meeting the world’s energy needs grows hinges critically on the strength of government support to stimulate technological advances and make Renewables cost competitive with other energy sources. Government support for Renewables can, in principle, be justified by the long-term economic, energy security and environmental benefits they can bring, though it is essential that support mechanisms are cost-effective. The greatest scope for increasing the use of Renewables in absolute terms lies in the power sector. Renewables-based generation triples between 2008 and 2035 and the share of Renewables in global electricity generation increases from 19% in 2008 to almost one-third (catching up with coal). The increase comes primarily from wind and hydropower, though hydropower remains dominant over the Outlook period. Electricity produced from solar photovoltaics increases very rapidly, though its share of global generation reaches only around 2% in 2035. The share of modern Renewables in heat production in industry and buildings increases from 10% to 16%. The use of bio-fuels grows more than four-fold over the Outlook period, meeting 8% of road transport fuel demand by the end (up from 3% now). Large-scale market introduction of new technologies (i.e. wind-power, solar-power, bio-fuel production) will have an influence/impact to the environment as well to public acceptance. These facts have to be considered on the basis of “sustainability”, considering energetic, economic, environmental and social aspects. The energy system of tomorrow will be a result of technological innovation and various social, economic and environmental changes. Important limitations to expanding the use of technical potentials of renewable sources are economics as well as the geographic distribution of the resource. Price trends for coal, oil and gas are important for planning future energy systems, but are less predicable. Important is the willingness for the transition from fossil fuels to Renewables. The WORST-Case of Future Energy Systems would occur, when: Fossil energy resources will not be available for energy supply; Climate change will not allow the utilisation of fossil resources for energy production; Further market deployment of nuclear power plants will be stopped because of nuclear accidents and problems with long-term nuclear waste disposal; Nuclear Fusion could not be realised for Electricity production; The market deployment of Renewables was not fast enough to substitute fossil resources. Result: The „Fossil Energy Period“ was only a short time period for industrialisation and evolution.
70
Forecast of Energy SupplyForecast of Energy Supply
Renewable Energy Renewables &Nuclear Fusion ?
Fossil Energy
Nuclear Fission
NuclearFusionFossil
Energy
RenewableEnergy
Solar /Hydrogen
Year
Worst-Case Scenario for Future Energy System
(1) Fossil energy resources will not be available for energysupply.
(2) Climate change will not allow the utilisation of fossil resources for energy production.
(3) Further market deployment of nuclear power plants will be stopped because of nuclear accidents and problems
with long-term nuclear waste disposal.(4) Nuclear Fusion could not be realised for Electricity
production.(5) The market deployment of Renewables was not fast
enough to substitute fossil resources.(6) Result: The „Fossil Energy Period“ was only a short
time period of about 200 years of evoluation.
71
References Compiled for this document International Energy Agency Renewable Energy Working Party (IEA/REWP) Including the Renewables Implementing Agreement IEA Statistics Information on Renewables 2005 IEA World Energy Outlook 2010 The IEA-Solar and Cooling Programme: www.iea-shc.org European Commission, Directorate-General for Research Key Tasks for future European Energy R&D: A first set of recommendations for research and development by the Advisory Group on Energy AGE-SWOG. Community Research: EUR 21352. http://europa.eu.int/comm/research/energy/index_en.htm
European Commission, Directorate-General for Research Towards the European Energy Research Area Recommendation by the ERA Working Group of the Advisory Group on Energy AGE-ERAWOG. Community Research: EUR 21353. http://europa.eu.int/comm/research/energy/index_en.htm
International Energy Agency Renewable Energy Working Party (IEA/REWP): Catching Up: Priorities for Augmented Renewable Energy R&D. 3 March 2005, Paris European Renewable Energy Centres Agency, EUREC, March 2005 FP7 Research Priorities for the Renewable Energy Sector Further Tasks for Future European Energy R&D: A second set of recommendations for research and development by the DG-RDT’s Advisory Group on Energy. (EUR 22395) The reports can also be received electronically by logging on the EU-energy research website: http://europa.eu.int/comm/research/energy/index_en.htm
72
ANNEX
Assessment of Renewable Energy Technologies
In October 2002 the Commission asked its DG-Advisory Group on Energy (AGE) to develop a strategic vision for energy R&D on a European scale, with emphasis on overcoming the usual compartmentalisation into different energy options and the barriers between advocates of each option. The objective was to support decision-makers with wide and thorough analyses of the issues at stake, and of the potential of various technology options to provide Europe with sustainable energy supply and use.
The first AGE/SWOG-Report has carefully analysed eight different promising technology areas. It has identified key research tasks in these areas, where it concludes efforts should be focussed. The technology areas examined in this report are: biomass, cleaner use of coal, fuel cells, hydrogen, nuclear fission, nuclear fusion, solar photovoltaic and wind energy. Other potentially important issues and energy technologies were examined in 2005, such as other renewable energy technologies, energy storage and transport, distributed electricity generation, system integration, energy efficiency and crosscutting issues.
The following Report is evaluating/assessing the renewable energy technologies hydropower, geothermal, biomass, wind energy, photovoltaic, solar heating and cooling, solar thermal power, and ocean energy systems solar against a common set of criteria, and is identifying where are its weaknesses which R&D needs to lessen or remove and hence to identify the key R&D tasks that are likely to have a decisive impact. This report is intended to provide guidance on the long-term development of renewable energy technologies, and explores whether more R&D funding is needed to achieve the breakthroughs that will lead to large scale markets and if so what activities should take priority. The report is based on a substantial input from the IEA Renewable Energy Working Party and its research programmes (Implementing Agreements) on renewable energy technologies, following the IEA-REWP Seminar “Catching Up: Priorities for Augmented Renewable Energy R&D” in March 2005 in Paris. The report has received guidance, comments and inputs from the members of the IEA-Renewable Energy Working Party as well of the chairpersons of the relevant Implementing Agreements. -------------------------------------------------------------------------------------------------------------------- European Commission, Directorate-General for Research (1) Key Tasks for future European Energy R&D: A first set of recommendations for research and development by the Advisory Group on Energy (EUR 21352) (2) Further Tasks for Future European Energy R&D: A second set of recommendations for research and development by the DG-RDT’s Advisory Group on Energy. (EUR 22395) The reports can also be received electronically by logging on the EU-energy research website: http://europa.eu.int/comm/research/energy/index_en.htm
73
1. Criteria for Assessment To identify key research tasks, the reported renewable energy technologies are examined against a common set of criteria’s, defined in AGE/SWOG report, January 2005. This summary of evaluation renewable energy technologies do not include all the details of their evaluations, which is done in the Chapter B for the evaluated technologies, including some caveats and explanations.
Assessment of renewable energy technologies
Criterion Biomass PV Wind Solar Thermal Solar Power Geothermal Hydropower Ocean EnergyPotential Economic Contribution
at current energy prices some nil some large nil some large someat 2 times current large prob nil large very large poss some large very large largeat 4 times current large poss large very large very large poss large very large very large very large
Health & Safety Impactsto work force good excellent excellent excellent very good very good very good very good
to public excellent excellent excellent excellent very good very good very good very good
Environment Friendlinesslocally good excellent good excel excellent excellent very good good
global warming good excellent excel excel excellent excellent excel excelInput Sustainability excel excellent excel excel excellent excellent excellent excellentSecurity of supply excel excellent excel excel excellent excellent excellent excellent
Compatibility with EU needs fair poor in north fair very good good in south site depending site depending site dependingDeliverability fair very slow excel excel good good excellent good ?
The need for EU - wide R & D good good good good good good fair good
Secondary (spin-off) merits excellent excellent good excellent few few few good
Special Factors site depending NIMBY site depending site depending site depending site dependingon-shore
Renewable Energy Technologies against SWOG Evaluation Criteria
The goal of the evaluation is to identify key R&D tasks which have the greatest potential to change the EU energy scene and which seem likely to realize that potential given well directed R&D effort, but which are unlikely to be developed without an EU-wide involvement. Each technology is assessed against a common set of criteria, in part to test and either confirm or change their judgment about the likely importance of the technology and hence the priority it should be afforded in R&D funding, but also to identify where are its weaknesses, which R&D needs to lessen or remove, and hence to identify the key R&D tasks that are likely to have a decisive impact. The following criteria’s are assessed:
(A) Energy source and technologies. (B) Market situation and potential. (C) Attractiveness of technologies. (D) Priorities for augmented R&D. (E) Assessment of technologies. (F) AGE recommendations.
The technologies assessed in this report are:
Hydropower; Geothermal; Biomass; Wind Energy; Solar Electric (Photovoltaic); Solar Thermal (Solar heating and cooling);
Solar High-Temperature (Solar Thermal Power); Ocean Energy.
74
2. Hydropower Technologies
(A) Energy source and hydropower technologies
1. Hydropower is considered a mature technology. Many projects built in the early decades of the 20th century are still operating today, though most have been rehabilitated, modernized or redeveloped. The era of large hydropower projects started in the 1930’s in North America and has extended world wide ever since.
2. Today, most large projects, under construction or planned, are located in China, India, Turkey, Canada and South America.
3. Small hydropower has important untapped renewable energy potential, which could be rapidly developed. Although small hydropower is generally considered a mature technology, the industry needs continuous infusions of new ideas and technology to ensure that small hydropower maintains and enhances its contributions to the emissions-free, indigenous electricity generation Europeans are seeking, and that hydropower facilities operate in harmony with the environment.
4. Summarising, there is still potential to expand the number of both large numbers of small hydropower projects world-wide as well as the opportunity to upgrade existing power plants and dams to produce more energy.
5. Hydropower faces challenges, both in terms of public acceptance and economics, due in part to the long approvals and construction cycles, high initial cost and hence long payback period.
75
(B) Market situation and potential
6. The technical challenges associated with large hydropower are mostly covered by the few manufacturers of major equipment and the numerous suppliers of auxiliary components and technology. While no major breakthroughs have occurred in machinery, the advent of computers has led to vast improvements in monitoring, diagnostics, protection and control technologies, as well as many other areas.
7. The technical challenges for small hydropower are both a by-product of the large hydropower industry and the application of appropriate technology by small manufacturers, organisations and agencies. Perhaps the greatest difference between the technology status of large and small hydropower is the huge variability of designs, layouts, equipment types and material types used in small hydropower. It can be said that there is no “state of the art” in small hydropower, but rather a huge body of knowledge and experience in designing and building projects to fit the site and the resources of the developer.
(C) Attractiveness of hydropower technologies
8. Hydropower is one of the most cost effective sources of renewable energy. Hydropower
presently provides over 80% of renewable energy, and is not only considered the most cost effective renewable energy source but also offers other significant benefits such as flood control, irrigation, potable water etc. There is significant opportunity to increase development of hydropower on a cost competitive basis as a foundation to meeting the vision of 50% renewable energy by 2050.
9. One of the greatest opportunities for quick gains to the renewable energy portfolio is to maximize the energy produced from existing projects through modernization. Gains of 5 to 10% are not an excessive target for most hydropower owners and where there are significant numbers of dams without generation, the numbers could be much higher.
10. The potential for new and improved projects in EU Member States as well as in developing countries is huge, with barriers both in the financial and institutional/political areas. Development mechanisms, green credits, feed-in tariffs etc, for sustainable generation, present a significant opportunity. Where not already implemented, technology and performance improvements at existing projects have benefits that exceed costs by a margin of 2 to 5 times.
(D) Priorities for augmented R&D
11. While acknowledging that hydropower is well established, and considered a mature
technology, there are some remaining opportunities for R&D to enhance its development globally.
12. To achieve further technology developments it is not necessary for technological breakthroughs, huge expenditures on governmental R&D or radical changes to development of the hydropower resource. What are required though, are continuous improvements in technology, public acceptance and approvals supported by government policy and implementation and development financed and supported by the public and private sector.
76
13. The hydropower industry needs to maximize the use of its existing resources and adopt collaborative approaches to developing new projects that meet sustainability guidelines. Governments probably have the greatest role by supporting existing hydropower as and where it is sustainable and promoting and supporting the development of new projects that also meets sustainability guidelines.
14. The maturity of hydropower, the longevity of hydropower plants and the dams and waterways associated with them, and the high availability and reliability of the power output leads many to question what R&D is left to do or is even necessary. Because of this attitude in many organizations and governments, the hydropower business has fallen behind in many areas and fails to attract R&D funding. Hiring well-qualified staff to the industry is also difficult in many regions.
15. Small-hydropower development requires multidisciplinary R&D involving technological know-how that is widely dispersed in Europe. It is therefore essential to co-ordinate small-hydro R&D, and to move over from a situation where know-how and results are dispersed, and necessarily incomplete, to one where work is systematic and co-ordinated, within framework of research programmes.
16. The highest priorities to focus new, additional R&D spending over the next 20 years can be classified under technical, economic and socio/environmental categories. Technical priorities include: • Continuing equipment and materials development (by equipment manufacturers). • Improved performance of existing hydropower plants. • Innovative approaches to add generation to dams. • In-stream flow technologies (in conjunction with ocean energy). • Integration of wind into hydropower systems. • Development of hybrid systems for small hydropower in conjunction with wind- and
photovoltaic systems. • Training and education of professional and technical staff.
Economic priorities include: • Reducing O&M costs for existing and new hydropower plants. • Innovative financing for new hydropower plants. • Developing hydropower in developing countries. • Improved risk management processes. • Financial resources to upgrade existing projects in non OECD countries. Socio-economic priorities include: • Increased public acceptance of hydropower. • Auditable process to certify hydropower projects as sustainable. • Safety and security of hydropower facilities.
17. The focus of R&D funding for hydropower should be prioritised to cover the following key issues: • Provide approval mechanisms to ensure sustainable development that meets
government and public acceptance. • Provide funding mechanisms for new projects in developing countries and existing
low performing projects in non-OECD countries. • Develop improvements in technology (systems, materials, manufacturing processes)
and performance (systems and processes) for new and existing projects. • Develop/improve technologies for dams with power plants, and rivers with in-stream
flow generation potential.
77
• Work with other renewable energy technologies (wind, hydrogen, ocean energy) to develop symbiotic benefits for overlapping renewable energy technologies.
(E) Assessment of hydropower technologies
18. The results of the evaluation of hydropower technologies are listed in the following
Table.
(F) AGE recommendations
19. AGE believes that the benefits of successfully increasing acceptance for hydropower
technologies will be immense and contribute significantly to further sustainable development. The challenge is presently more related to public opinion and negative press than cost. However, it is necessary to clearly show how hydropower can be built and operated in a sustainable manner with regard to issues such as fish passage, climate change etc. To achieve this, it is necessary to ensure future hydropower developments are sustainable and to communicate this effectively.
20. Innovative manufacturing techniques and composite materials are used extensively for newer renewable energy sources such as wind and solar. There is an opportunity to adapt these technologies for use in hydropower plants, particularly smaller developments.
21. There are a large number of dams without power plants and rivers with in-stream flow generation potential. The costs for development are presently slightly higher than marginal cost, and R&D is necessary to bring these costs down to a cost competitive level. Benefits could be up to 10% of existing generation.
22. Hydropower can work in a symbiotic relationship with other Renewables technologies (such as firming and shaping wind energy), as a hybrid partner with wind energy, hydrogen etc, and with similar technological challenges, such as in-stream flow, with marine current technologies.
Criterion Comments
Potential Economic Contributionat current energy prices large - at special areas
at 2 times current very large - at special areasat 4 times current very large - at special areas
Health & Safety Impactsto work force very good - installation and maintenance regulated by directives and standards
to public very good Environment Friendliness
locally very good to excellent (small hydropower)global warming excellent
Input Sustainability excellentSecurity of supply excellent
Compatibility with EU needs very good - site dependingDeliverability excellent - site depending
The need for EU-wide R & D fair - need to maintain competiviteness of EU manufacturers
Secondary (spin-off) merits few to good - export opportunities
Special Factors site depending
Hydropower Systems against Evaluation Criteria
78
3. Geothermal Technologies
(A) Energy source and geothermal technologies
1. Per definition, geothermal energy is the energy in form of heat below the earth’s surface. It has been used since antique times for heating, and for about 100 years also for electricity generation. Its potential is inexhaustible in human terms, comparable to that of the sun.
2. Production from geothermal sources is independent of weather and of daily and seasonal variations.
3. Beside electric power generation, geothermal energy is today used for district heating, as well as for heating (and cooling) of individual buildings, including offices, shops, small residential houses, etc. The largest geothermal district heating systems within the EU can be found in the Paris area in France, with Austria, Germany, Hungary, Italy, Poland, Slovakia and others showing a substantial number of interesting geothermal district heating systems. Sweden, Denmark, Germany and Austria are the leading countries in terms of market for geothermal heat pumps development within
79
the EU. In 2003, a total of approximately 2 Mtoe has been supplied by geothermal heating alone; including ground-coupled heat pumps.
(B) Market situation and potential
4. Geothermal energy in the form of electricity was first generated commercially in 1913 in Tuscany, Italy. Geothermal energy has been used on a large-scale for both heat and electricity (>100 M W) for over 45 years. 5. The geothermal sector is currently the fourth largest electrical power production sector using renewable energy sources, ranked behind hydraulic power, biomass and wind power. 6. Presently, geothermal energy is used in 71 countries, 24 of which use it to generate electricity; and over 80 countries have reported resource availability. Total installed capacity now stands at 8,902 MWel, generating 56.8 TWh/year, which is equivalent to 0.4% of global electricity production. Unique to geothermal is the added capability of using the heat in the separated hot water from power generation for direct-use applications, contributing significantly to the 2004 global geothermal installed capacity of 27,825 MWth for direct utilization and total energy use of 261,418 TJ (72,622 GWh). 7. If the large regions of the world are considered, two main producers of geothermal
origin electricity can be seen: America (3 921 MWe) and Asia (3 291 MWe). Europe comes next, with total capacity of 1 123 MWe.
8. Current generation costs are in the range of US$ 0.02-0.10/kWh and projected to come down to US$ 0.01-0.08/kWh. Capital costs vary widely depending upon resource quality and generation size, and are currently in the range of US$ 1,150-2,300/kW installed capacity for high quality resources, down by about 50% over the last twenty years. 9. Availability factors range from 92-99%, with load factors of 84-96%. Capacity factors are typically in the range of 75-90 % and are expected to improve with further R&D. 10. A large part of geothermal energy is used by geothermal heat pumps, under the heading of the so-called very low temperature applications. The European Union is one of the main regions of the world to have developed geothermal heat pump technology (ground-coupled heat pumps). The total number of geothermal heat pumps is estimated at more than 379 000 units, equivalent to 4 531 MWth 2004 (+30.5% with respect to 2003). The heat pump industry is by far the most dynamic of the three geothermal sectors.
(C) Attractiveness of geothermal technologies
11. The worldwide technical potential is very large and has been estimated to be as much as 5,000 EJ/year, corresponding to about 66% of total renewable energy potential. Important limitations to expanding its use are economics as well as the geographic distribution of the resource. 12. Geothermal energy could provide indigenous, affordable, environmentally friendly power to areas now without power or where power is currently provided by oil. Increased efficiencies in power production would be expected from development of deeper, hotter geothermal resources and more effective use of resources could be made through co-generation and cascaded use. 13. Meeting the 2020 goal of producing 5% of global generation would provide a savings of over 180 Mtoe per year and reduce CO2 emissions by 570 million tonnes annually. Direct-use of the separated hot water would also add very significantly to these savings.
80
(D) Priorities for augmented R&D
14. R&D funding for geothermal energy peaked in 1980 at US$ 430 million and reached a minimum of US$ 56 million in 2002. With the long term objective of increasing electrical production to as much as 5% of global generation by 2020 and parallel rapid growth in heat use, the main areas requiring improvement have to be in cost- effectiveness in the marketplace, improved resource assessment, better public awareness and addressing environmental barriers. 15. Some of the current R&D priorities being addressed are:
• Environmental impacts of geothermal energy. • Enhanced geothermal systems. • Deep Geothermal Resources. • Advanced geothermal drilling techniques. • Direct use of geothermal energy. • Sustainability of geothermal energy use. • Geothermal power generation cycles.
16. Though geothermal is in many ways a mature technology, it now requires increased financial support to attain its ambitious goals. 17. Private sector share of R&D is limited. For better leverage of public funds and assured dissemination and use of results, it is proposed that government support of some projects be contingent on matching private sector investments. 18. In addition to the current R&D work, it is necessary to inform stakeholders of the benefits of geothermal energy, encourage partnerships that allow benefits to flow back to the community and clear commitment on the part of national governments on the positive impact of new technologies towards mitigation of CO2 emissions. 19. Some of the specific priorities for additional R&D could include funding to expedite the completion of current priorities as well as new topics and include increased production and dissemination of information towards:
• Development of better exploration and resource confirmation and management tools. • Commercial development of enhanced geothermal systems. • Development of deep (>3,000 m) geothermal resources. • Increased geothermal co-generation (power and heat). • Reduction of costs of geothermal well drilling, logging and completion. • Increased direct use of geothermal resources for space/district heating and
multipurpose “cascading”. • Better understanding and mitigation of environmental effects. In addition,
dissemination of appropriate information to stakeholders is essential. 20. More general priorities being proposed include:
• Life cycle analysis of geothermal power generation and direct use systems. • Sustainable production form geothermal resources. • Power generation by improved conversion efficiency cycles. • Shallow geothermal resources for small-scale individual users. • Induced seismicity related to geothermal power generation (conventional and
enhanced geothermal systems).
81
(E) Assessment of geothermal technologies
21. The results of the evaluation of geothermal technologies are listed in the following Table.
Criterion Comments
Potential Economic Contributionat current energy prices some/good - at special areas
at 2 times current large - if market deployment will be successfullat 4 times current very large - if market deployment will be successfull and technical potential will be utilised
Health & Safety Impactsto work force very good - installation and maintenance regulated by directives and standards
to public very good Environment Friendliness
locally very goodglobal warming very good
Input Sustainability excellentSecurity of supply excellent
Compatibility with EU needs very good - in areas with geothermal sourcesDeliverability good - modular units can be installed to match demand
The need for EU-wide R & D good - need to maintain competiviteness of EU manufacturersSecondary (spin-off) merits few to good - export opportunities
Special Factors site depending
Geothermal Systems against Evaluation Criteria
(F) AGE recommendations
23. Geothermal worldwide technical potential, current capabilities, electricity generation/operating capacity ratio, capacity factors, and its low and consistently decreasing funding levels over the past 20 years certainly argue for significantly increased funding levels. 24. AGE-WOG-1 believes that the benefits of increased funding would include an extension of geothermal for power generation and direct heat use to areas far from tectonic plate boundaries and greatly increase the areas of utilization.
82
4. Biomass Technologies
(A) Energy source and biomass technologies 1. Biomass energy, that is solar energy captured by plants through photosynthesis and fixed
in carbohydrate material, is the traditional energy source of much of mankind. It can be used as plant material direct from the field or in the form of agricultural (including forest industries), household and industrial wastes. Before the advent of fossil fuels our forests provided most of the fuel needed for cooking and for keeping warm in winter. Among the non-fossil energy technologies in prospect for the future only biomass produces solid, liquid and gaseous fuels which can be used as, or easily transformed into, fuels for transport, electricity generation and heating applications.
2. Simple biomass combustion technologies are already competitive with oil, in those rural areas where wood residues are available nearby and can be burned in small, decentralised plants, and with oil and gas in urban areas where the combustion of municipal wastes saves the costs of transport to and disposal in scarce landfill sites. AGE sees little contribution which EU-wide R & D can make to increase this ‘conventional’ use, though manufacturers will doubtless continue to improve boilers, fuel/feed systems etc and should be encouraged in the usual ways, via tax relief on R&D, measures for market deployment etc.
83
3. However, the available biomass resource in most EU countries is limited and ways should be sought to maximise it. EU-wide R & D should aim at designing plants optimised for energy use, looking for a better trade-off between high yield, fertiliser requirements and limited environmental impact. It should also encourage a few local communities to demonstrate, with currently available technology, the complete biomass supply chain in action.
4. Converting biomass to liquid (BTL) fuels is potentially very important for two reasons. It offers not only the prospect of retaining liquid chemical fuels for transport without increasing atmospheric CO2 but also the possibility of a global trade in biomass-derived liquids, not really possible with solid biomass itself. Because of this potential of BTL to provide liquid fuels indigenously or from a wide range of external sources, AGE believes that EU– wide R & D is important, in particular trying to find biological processes for converting the ligno-cellulose parts of woody plants to liquids. The alternative approach of using chemical or biological processes to separate liquefiable sugars and starches from solid lignin, which can then used as a solid fuel, also needs pursuing. R & D on optimising the design and operation of conventional BTL plant for the different biomass feedstock which might become available in or to the EU would also be useful, in order that the conversion technology and costs of BTL fuels might be reduced or at least become less uncertain.
(B) Market situation and potential 5. In the EU 15, wood fuel has long since been overtaken by coal, oil and gas. Biomass now
provides only about 5% of EU primary energy consumption, though it is still by a significant margin Western Europe’s most important renewable energy source. It is more important in some member states; in Portugal it provides more than 15% of primary energy, in Luxembourg, Finland and Sweden more than 20%.
6. The source of most biomass energy in the EU is still wood, burned for heat in households, district-heating plants and in industry and, primarily in Finland and Sweden, in generating plants for electricity production. However, there is a growing use as fuels of agricultural residues such as straw and of domestic, commercial and industrial solid wastes. These are commonly counted as biomass since all agricultural residues and a large fraction of solid commercial and domestic waste is organic in origin. Moreover, roughly sorting municipal wastes can provide a product stream which is largely biomass. Anerobic digestion is an attractive alternative to combustion for some wet agricultural and municipal wastes and is fairly well developed for use on farms, in the food and animal-feed industries and in landfill sites.
7. Even the use of wood as a fuel is often effectively waste combustion, using thinned-out young trees or wood residues from the timber and paper industries. This point is significant because collecting biomass fuel as part of some other essential activity (the disposal of municipal wastes) or a profitable one (the production of timber, wood products and paper) greatly improves the economics of its use and has enabled the biomass contribution to EU energy supply to remain at the 5% level without much subsidy.
8. Although the burning of wood or other biomass does release CO2 into the atmosphere it is generally accepted that biomass fuels are CO2 neutral and do not contribute to global warming. This is because, in properly managed forests in dynamic equilibrium, new biomass growth recaptures the same amount of CO2 as is released in its combustion. In the past, wood burning in simple stoves was wasteful of energy and led to large emissions
84
of CO and other pollutants but modern boilers have greatly improved efficiency (up to 90% at design output) and lower discharges (less than 0.2 gram CO per m3 exhaust).
9. However, biomass is largely carbohydrate (CH2O), is often slightly wet and consequently has a much smaller energy content (13 – 20 GJ/tonne) than oil (CH2: 45 GJ/tonne) and somewhat smaller than coal (CH0.7: 25 - 30 GJ/tonne). In volumetric terms the comparison with oil and coal is even less favourable, since much of the wood is in the form of lightly packed pellets or chips, and this makes the movement of wood fuel over large distances rather expensive.
10. The current annual production of heat from biomass in the EU is about 1.8 EJ and of electricity about 22 TWh, the latter equivalent to only 80 PJ delivered electricity but 0.25 EJ or so in primary energy terms.
11. The potential for an increased use of fuel wood from existing forests in EU 15 is significant but not enormous. For example, in Austria the resource is estimated at 230 PJ/year, of which some 122 PJ/year are currently used. This ratio is typical of the member states having extensive forests. In most member states the potential is much less and only in Finland is the current use (94 PJ/year) a significantly smaller fraction of the potential (350 PJ/year).
12. However, the global potential for biomass production is estimated to be much larger; some 450 EJ/year compared with the current global consumption of 50 EJ/year and a global consumption of fossil fuels of about 350 EJ/year.
13. Realising the potential of biomass to contribute more to EU energy supply therefore depends on progress in one or more of four areas:
- Encouraging a greater take-up of biomass fuels as currently used, that is the combustion of wood, agricultural residues or commercial/industrial and domestic wastes for heat and/or electricity, possibly together with: Increasing the supply of biomass in member states with primarily urban populations and which no longer have extensive forests to provide wood - Converting biomass to liquids, enabling their more flexible use and economical transport over longer distances, thereby making available to the EU bio-fuels which can be used in transport and biomass which is grown far from the consumers, where growth conditions are more favourable and/or more land is available and finally: - Supplying technology and equipment which will encourage greater use of biomass elsewhere. This will help take global pressure off other fuels which can be imported for use in the EU, will provide foreign currency for such energy imports and reduce global warming.
(C) Attractiveness of biomass technologies
Increasing biomass resources in the EU
14. The supply of biomass fuel in the EU could certainly be increased by growing energy
crops. Perennial plants are the most attractive prospect, because they require very low fertiliser and pesticide inputs compared with annuals and the production of these agrochemicals is very energy intensive. Perennial crops with low inputs also create a stable habitat, with the prospect of increasing the diversity of flora and fauna in an area when compared with conventional agriculture.
15. Grasses would have the merit that they could be harvested with conventional reaping machinery. However willow, grown on a 2-4 year cutting cycle commonly referred to as short rotation coppice, is favoured for northern European conditions. Energy crops are
85
not currently economic but might become so in the EU if there is a continuing need to pay farmers to take agricultural land out of food production and find other uses for it.
(D) Priorities for augmented R&D
16. The EU-wide R&D contribution AGE sees here should aim at breeding plants optimized
for energy use, looking for a better trade-off between high yield and limited environmental impact. It also consists in making available the results of field trials and in encouraging a few local communities to demonstrate, with currently available technology, the complete biomass supply chain in action.
Biomass to Liquids
17. The best way to transport energy in bulk is as liquid fuels, in tankers or pipelines. Liquids
are also the most versatile fuels, since they are easily usable in transport vehicles as well in stationary applications. The conversion of solid carbohydrate biomass into liquids has therefore always been seen as a highly desirable goal.
18. Making ester bio-fuels from oilseeds can certainly be done but looks uneconomic for the foreseeable future and has poor energy payback. Similarly, making ethanol by fermentation of plant sugars, though widely used in Brazil with public support, would be more difficult to pursue in the cooler, drier countries of the EU. In contrast, the conversion of whole plants, including sugars, starches and cellulose, to liquid fuel via biomass-to-liquid (BTL) processes could be widely applicable in the EU.
19. Various gasification and pyrolysis options are available and all the required chemistry, such as Fischer-Tropsch reactions, is well known. However, the current cost of biomass derived liquid fuels is more than 12 €/GJ, whereas crude oil is available to the EU at 30 € per barrel, corresponding to only 5 €/GJ. Since many of the costs are in the technology rather than the feedstock, biomass liquids produced overseas are not likely to become competitive in the foreseeable future either, with crude oil often produced at less than 0.5 €/ GJ.
20. However, because of the potential of BTL to provide CO2-neutral liquid fuels, indigenously or from a wide range of external sources, AGE believes that EU – wide R&D here is justified, in particular on trying to find bioconversion processes for the ligno-cellulose parts of woody plants. The alternative approach of using chemical or biological processes to separate liquefiable sugars and starches from solid lignin, which can then used as a solid fuel, also needs pursuing. R&D on optimising the design and operation of more conventional BTL plant for the different biomass feedstock which might become available in or to the EU would also be useful, in order that the conversion technology and costs of BTL fuels might be reduced or at least become less uncertain.
Biomass Combustion and Processing Equipment for Export
21. The potential of biomass energy outside the EU, in Asia, Africa and South/Central
America is great. Those poor countries which use wood and agricultural wastes as fuels would greatly benefit from using these resources more cleanly and efficiently. In lightly populated rural areas where wood or other biomass is available but coal and gas are not and oil is expensive, modest-size, decentralised biomass generating plants will probably prove a good way of making electricity.
86
22. The boilers, electricity generating and liquefaction plants which have been or will be developed for EU use should have significant markets overseas if they are good enough and competitive. AGE does not see the need for an EU-wide R&D programme to achieve this, but the Commission should encourage companies to adopt best practice by providing good information and develop better products, aided by tax relief on R&D, export credit guarantees etc.
(E) Assessment of biomass technologies
23. AGE’s evaluation of biomass energy against its standard criteria is given in the following table. If energy prices were to rise significantly or large carbon taxes were introduced, the additional use of bio-fuels could be substantial, in the range of 5 to 10 % of EU energy demand, without dramatic technological breakthroughs. Cheaper and more effective processes for converting biomass to liquids, or much larger increases in conventional energy prices, would allow an even bigger contribution.
Criterion Comments
Potential Economic Contributionat current energy prices small additional ( but a few % of EU demand if fossil fuels carry a carbon tax)
at 2 times current substantial - an additional 5 - 10% of total demand at 4 times current probably large - from EU and imports
Health & Safety Impactsto work force good - similar to agriculture
to public excellentEnvironment Friendliness
locally good - with modern equipmentglobal warming good - but needs careful monitoring over life cycle
Input Sustainability excellentSecurity of supply excellent - significant indigenous supplies and no imports from Middle East
Compatibility with EU needs fair - fuel storage is easy but energy transport to urban areas is notDeliverability fair - some new infrastructure required
The need for EU - wide R & D good - need for long-term research and to spread best-current-practiceSecondary (spin-off) merits excellent - major markets for equipment outside EU
Special Factors excellent - strong public support
Biomass Energy against Evaluation Criteria
87
(F) AGE recommendations 24. As with hydropower, but unlike most other Renewables, the present conventional use of existing wood and waste resources for fuel is largely without the help of subsidies. In some situations it is competitive with oil, in those rural areas where wood residues are available nearby and can be burned in small, decentralised plants; in other situations with oil and gas, in urban areas where the combustion of commercial and municipal wastes saves the costs of transport to and disposal in scarce landfill sites. As a result there is already a wide range of well-developed equipment available and a variety of supply chains in use. AGE sees little contribution which EU-wide R&D can make to increase this ‘conventional’ use, though manufacturers will doubtless continue to improve boilers, fuel/feed systems etc and should be encouraged in the usual ways, via tax relief on R & D etc. In particular, municipal waste burning will become more widely attractive when all the problems of flue-gas pollutants, heavy-metal wastes and boiler corrosion are clearly and reliably dealt with in commercial equipment. Projects demonstrating advanced technologies or supply chain concepts could accelerate progress down the learning curve. Also, gasification followed by combustion and/or a variety of co-firing options need to be demonstrated and evaluated. 25. An effective way to increase the use of wood or wastes would be to level the economic playing field, recognising the benefits of biomass energy to global warming by introducing across the EU a realistic carbon tax on fossil fuels burned without CO2 sequestration. This is already done in Denmark, where the basic cost of energy from natural gas is about 3.3 €/GJ compared with 4.6 €/GJ for wood chips, but taxes are used to increase the cost of gas to consumers to 10 €/GJ.
88
5. Wind Energy Technologies
(A) Energy source and wind energy technologies
1. Wind energy is sunlight converted into atmospheric kinetic energy, via convection in the atmosphere and evaporation over oceans. It is a fully renewable energy source with very low external costs and a great potential for increased use. In the EU, wind turbines could, by 2020, produce 10% or more of the expected electricity consumption. Achieving such a contribution will be a great challenge, since wind energy must be competitive in the market place despite its inevitably fluctuating nature.
2. Moreover, despite its use in Europe for many hundreds of years for grinding corn and pumping water, there is a large unrealised potential for wind power generation in the EU.
(B) Market situation and potential
3. The EU has attained a leading position in electricity generation from wind power. Thus 75% of worldwide wind energy capacity is installed in Europe, primarily in Denmark, Germany and Spain. By 2003 there was about 29 GW of installed capacity in the EU, with some 5.5 GW of new capacity being added in 2003. It supplied over 60 TWhr of electricity in that year, the equivalent of about 1.7 times the Danish consumption, 2% of overall EU-25 consumption. In Denmark and Schleswig-Holstein more than 20 % of electricity demand is now covered by wind turbines.
89
4. The majority of wind generators in Europe are connected to the electricity grid. They are mostly three-bladed, horizontal-axis turbines mounted on tubular or lattice towers, with rated powers of 600 kW upwards, rotor diameters and tower heights from 40 metres. The largest wind turbines currently being deployed have nominal powers of 3-4 MW with rotor diameters and tower heights of 80 metres or more, but even larger ones under development have nominal powers of 4.5 MW, rotor diameters between 110 and 120 meters and tower heights of more than 100 meters.
5. European wind energy resources are unevenly distributed geographically. Good wind-sites are those where wind turbines can generate more than 3,000 full-loadequivalent hours of energy production per year; poor sites are those where they would reach less than 1,500 full-load-equivalent hours per year. In Denmark the range of generation at different sites is between 1,800 and 3,000 equivalent hours for onshore sites, with an average around 2200 - 2300. Offshore sites are expected to provide between 3,000 and 4,200 equivalent-full-load hours generation per year.
6. Next to conventional hydropower and biomass combustion, wind energy is economically the most competitive of the renewable energy sources. On a 3000 hours equivalent full load site, allowing €50/tonne for the external cost of CO2 reduction in competing fossil plants and not charging any cost for standby power plant, wind is currently (early 2004) competitive with new coal, oil and open-cycle gas turbine power plants, but not with combined-cycle gas or nuclear power plants. Clearly, for the industry to stand alone without subsidies some further cost reductions are necessary.
7. Life-cycle analyses show that modern wind generators have an energy-pay-back time of about three months - for average sites in Denmark. Since the design life-time for these wind turbines is 20 years, they will produce over their lifetime around 80 times the energy it takes to make them. The analyses also show that practically all the materials used can be recycled – there are no long-term wastes.
8. The potential for the increased use of wind energy is huge. The report, “Wind Force 12”, makes estimates of the wind energy technical potential in Europe and worldwide by calculating areas with an annual average wind speed exceeding 5 metres per second at a height of 10m. The estimated potential in Europe is about 4,800 TWh per year and worldwide some 53,000 TWh per year. The potential in Europe which is offshore but less than 30 km from land and in water depths less than 30 m is 630 TWh per year.
9. The exploitable potential is naturally rather less. Experience in Denmark and Germany suggests that it is feasible to utilize about 10% of the technical potential. Using this assumption the European Wind Energy Association sets up a scenario for deployment, in which wind turbines in Europe (EU-15) in 2020 produce 425 TWh annually - some 12% of the expected electricity consumption in Europe (EU-15) at that time. In “Wind Force 12” the EWEA suggests that wind power is capable of supplying 12% of the world’s electricity demand in 2020, even if the overall demand increases until then by two-thirds. Whether such scenarios will become commercially attractive depends on whether or not wind power can be made competitive with the cheapest alternative including cost of backup and external costs.
10. AGE agrees that supplying 10 or more of Europe’s electricity consumption from wind energy will offer major benefits but also present serious challenges. On the positive side, wind turbines will increase the indigenous provision of energy in the EU and should increase the overall security of electricity supply. The failure of one or more wind turbine would not affect the overall grid system the way the drop out of a large conventional power plant may affect it. On the other hand, there will have to be a combination of novel and effective usage of dynamic grid-management, demand-management, energy storage
90
and back-up capacity to deal with situations of no wind whilst electricity consumption is high.
11. There are also challenges to be faced in using wind turbines in different types of terrain. In Denmark and Germany most of the current turbines and the potential new sites are on flat land or offshore in shallow water. In the southern parts of Europe (Spain, Italy and Greece) the majority of turbines and the potential sites are in complex terrain. Three bladed, upwind wind turbines sited on flat land have a long track record and good reliability. However, research is much needed concerning wind over complex terrain, aerodynamics, aero-elastics, structural design and materials, control, sensor technology, and grid integration and dynamics.
12. Offshore wind sites will place heavy demands on turbines, to cope with the demanding environment (e.g. waves, ice, complex wind structure over rough sea) whilst achieving better reliability to avoid expensive service and maintenance visits. R&D is needed on new codes to calculate and verify the loads and strength (e. g. blades, gearboxes etc.), new standards, new materials for the multi megawatt turbines.
(C) Attractiveness of wind energy technologies
13. Demand for wind turbines is almost certain to grow even further, not just in the EU but also globally, and competition between the manufacturers supplying it will become intense. AGE believes that the competitiveness of EU companies in this global market will be crucially dependent on their having access to relevant R&D derived from medium and long-term research programs, to provide ideas for revolutionary new designs as well as incremental improvements to existing designs.
14. Thus modern wind turbines are pushing technology to extremes in several fields and needs research in areas such as meteorology (wind resources and wind structure), aerodynamics and aero elastics, structural design and materials (composite materials, gear boxes, generators) and electricity grid modelling with fluctuating sources in the grid. Other industries than wind energy should also benefit from this frontier research.
15. Unfortunately, manufacturers often - but quite naturally - focus on short-term innovation and do not pay much attention to long-term perspectives. Moreover, the days are over when the fledgling European wind energy industry could depend on wind R&D performed in national laboratories. Their future success therefore relies on the existence in the EU of the necessary research, available to EU companies at costs not too excessive compared with that supporting US and Japanese competitors.
(D) Priorities for augmented R&D
16. AGE concludes that EU-wide support is needed to create open knowledge- networks
among the European research institutes and companies dealing with long-term generic and more fundamental R&D-activities. A European Research Area in wind energy, which can support the sector through long-term generic and scientific R&D should be the ambition, a necessary basic element of which will be the establishment in FP7of an EU research program dedicated to wind energy with the aim to support R&D projects and to facilitate the development of a European research area in the wind energy sector.
17. To meet the challenges that face the European wind energy, the following R&D issues
must be dealt with:
91
- Wind resources (identification and characterisation of sites for wind-power parks): Improvement of databases and models for complex terrains as well as over the sea is much needed. - Prediction of power outputs: Reliability of short-term (6-48 hours) forecasts of power outputs is one of the most pressing issues in connection with management of wind energy and its integration into the electrical grid. This is a priority that requires EU and international cooperative efforts.
- Offshore: Offshore wind energy demands knowledge of ocean-atmosphere interactions with structures. There is a need for an R&D program encompassing modelling and predictions of ocean currents and wave-state, wave-structure interaction (internal waves and surface waves), sediment transport and ice conditions. - Wind-turbine technology (development of new, 4th-generation turbines): In order to be economically feasible, offshore wind-turbines must be big, reliable and easy to maintain, characteristics which are desirable but not quite so crucial for wind turbines ashore. The scale-up to multi-MW sizes requires turbine blades that are so big and have such complicated and huge loads that no-one yet knows how to make them. Novel rotor concepts with aero-elastic wings utilizing interactive, adaptive shape control of aerodynamic forces could reduce loads and strains and thereby weight and cost. This development will require research into "intelligent" materials and extending computational fluid mechanics to include aero-elastic interactions between rotor blades and turbulent flows. More efficient generators and converters e.g. directly driven generators could open new possibilities for making more efficient and lighter wind turbines. By adding classical power-plant characteristics to individual wind turbines, it may be possible to reduce the problems and cost associated with transmission systems. Vice versa, designing the grid such that it accommodates fluctuating wind energy is another possibility. - Grid integration: The integration of wind energy into national grids requires online grid-security assessments, short term reserve management, "ride through default" capabilities to provide grid robustness of operation, remodelling of Europe-wide grid systems, etc. These radically different and better systems and techniques for dynamic grid management must be based on vastly improved systems integration (improvement of short-term forecast of power outputs), systems analysis (economics, barriers, strategies for implementation), and better control technologies. - Stand-alone and hybrid systems: System integration of wind generators with other power sources such as photovoltaic solar cells (PV) or diesel generating systems is essential in small grids where high reliability is required. - Environmental impact: Conflicting goals for the use of the countryside by different interest groups are becoming more pronounced. Understanding of noise generation and transmission is essential. Better design methods for noise reduction must be developed. Wild life must be considered in the deployment process. This requires better background data and understanding of the behaviour of different species. This holds for both land and offshore applications. Turbine interference with telecommunications/radars needs to be studied and quantified. - Testing, standardization and certification: To support the technological development and make market penetration easier, there is a need for further testing, standardization and certification. EU should support research necessary for certification of site assessments, design of offshore wind farms, designs of wind farms in complex terrain, identification and quantification of uncertainties.
92
(E) Assessment of wind energy technologies
18. An evaluation of wind energy against AGE standard criteria is given in the table below:
Criterion Comments
Potential Economic Contributionat current energy prices some - can compete with coal and oil if CO2 is taxed and back-up is not required
at 2 times current large - will compete with new fossil plant charged for CO2 even with back-upat 4 times current very large
Health & Safety Impactsto work force excellent - installation and maintenance regulated by directives and standards
to public excellent Environment Friendliness
locally good - but local concerns about visual intrusion and noiseglobal warming excellent
Input Sustainability excellentSecurity of supply excellent
Compatibility with EU needs fair - fluctuating wind requires back-up or demand management Deliverability excellent - modular units can be installed to match demand
The need for EU-wide R & D good - need to maintain competiviteness of EU manufacturersSecondary (spin-off) merits good - export opportunities but US and Japanese competition
Special Factors good - strong public support generally but some NIMBY problems
Wind Energy against Evaluation Criteria
(F) AGE recommendations
19. AGE agrees that wind power can contribute substantially to the European energy economy, provided that further reduction in overall system costs can be realised, that a sufficient number of good sites (including suitable sites offshore) can be used and that the external costs assigned to competitive sources are set at realistic levels and do not remain clouded with political uncertainties. 20. Realising wind’s contribution will require medium to long term R&D of a kind that is unlikely to happen unless supported by public initiatives at national and EU level. AGE therefore believes that a EU-wide, long-term generic and scientific R&D in wind energy would be appropriate to support the sector. The necessary basic element will be the establishment in FP7 of a research program dedicated to wind energy with the aim of supporting R&D projects and facilitating the further development of European industry in the wind energy sector. 21. AGE suggests that among the many R&D topics necessary for wind energy particular attention is paid to: - A better understanding of wind resources, particularly in complex terrain and offshore, including better prediction of power outputs and an increased reliability of short-term (6-48 hours) forecasts - ‘Fourth Generation’ wind turbine technology, i.e. novel rotor concepts using ‘intelligent’ materials; the enabling computational fluid mechanics; new generator concepts - Off-shore installations including design, operation, and maintenance - Grid integration, i.e. radically different and better systems and techniques for dynamic grid management based on improved systems integration, systems analysis, and control technologies.
93
6. Solar Electric Technologies (Photovoltaic)
(A) Energy source and solar electric (PV) technologies 1. By far the most important energy source for all life on earth is the sun. Its energy is
generated deep in its interior by nuclear fusion reactions, is carried to the surface we can see in the daytime sky by high-energy radiation and convection and then to Earth and down through our atmosphere by sunlight, that is electromagnetic radiation primarily in the visible and infra-red. The sun also emits some ultra-violet light and high-energy particles, but the major fraction of the solar energy reaching the earth’s surface is just visible and near-infra-red light. The energy content of the sunlight reaching the earth is some hundred thousand times bigger than mankind’s total current energy use and solar photovoltaic (PV) technology simply aims to use some of this torrent of free energy to make electricity.
2. As far back as 1839 Becquerel demonstrated a link between light and electricity, but effective solar cells that could convert light into electricity became possible only after the development of semiconductor diodes and transistors in the 1930s and 1940s. In 1955 the US Bell Labs patented a solar cell based on silicon, creating what has proved to be the most important solar cell technology so far and enabling an understanding of their operation to be gained which has guided the development of cells based on other
94
semiconductors such as gallium arsenide, cadmium telluride and copper-indium-diselenide.
3. The intensity of sunlight falling on the surface of the earth when the sun is directly overhead can reach 900 watts per square metre but the average intensity is usually in the range 90 to 290 Wm². Laboratory cell efficiencies can be up to 45%, but current commercial cells reach only 17% and the average system efficiency for terrestrial applications is only 10-13%. As a consequence, solar cells need to cover large areas if significant electrical powers are to be made. Fortunately, only a very thin layer of the often-expensive active material is needed for solar cells but thin PV junctions covering large areas need good physical support which can itself be costly. Using the roofs and the facades of the buildings in which the electricity will be used as support for the cells in so-called building integrated PV (BIPV) is consequently a favoured approach.
4. Individual solar cells make low-voltage direct-current electricity and most PV installations therefore need additional equipment to convert this to the medium-voltage alternating-current electricity that is easy to switch and transport and for which most modern electrical equipment is designed. Finally, PVs can make electricity only during daylight and, in most applications for bulk electricity; they must therefore be used in conjunction with storage devices or back-up sources. Stand-alone or ‘hybrid’ installations have their back-up sources or electricity storage co-located with the solar cells; grid-connected installations rely on the normal electricity grids but require appropriate connection equipment. The solar cells themselves are therefore only part of what is required for practical PV electricity.
(B) Market situation and potential
5. Photovoltaic (PV) systems use semiconductor materials to convert sunlight directly into
electricity. They have already proved their advantages over conventional energy sources in remote, off-grid applications and in mobile specialist devices such as watches and calculators. These applications have already created a successful PV manufacturing industry.
6. PV-systems drawbacks are that they cannot directly meet electricity demand at night; nor during bad weather nor in winter in the more northerly, more cloudy countries of the EU; that their take up is likely to be slow if it has to be linked with replacing or refurbishing buildings – but above all that their costs are currently too high. The costs for grid-connected PV systems have certainly decreased in the last decade, to the extent that resulting electricity costs are close to retail electricity prices in favourable situations. But these costs are currently some 5 – 20 times higher than generating costs for conventional sources and major further reductions are needed. A simple increase in the number of installations will certainly reduce the gap, through ‘learning-curve’ manufacturing cost reductions for PV modules and systems, improved reliability, longer life and higher efficiencies, but SWOG believes more needs to be done to close the cost gap.
7. The current PV scene is dominated by polycrystalline or single-crystal silicon. Improved silicon components and systems are certainly possible, especially through the development of thinner cells, the better application of PV in buildings and the built environment and the application of PV in large scale MW size plants. Improvements in large-scale systems, including higher efficiency contacting mechanisms, better integration with electricity grids will also be useful. SWOG sees little contribution which EU-wide R&D can make to this ‘conventional’ silicon technology now in volume production, though manufacturers will doubtless continue to improve PV cells and
95
systems and should be encouraged in the usual ways, via tax relief on R&D, measures for market deployment etc.
8. However, SWOG believes that it is unlikely that crystalline or polycrystalline silicon will turn out to be the best PV concept for bulk use. Finding a more cost-effective PV technology, which better lends itself to a high-throughput manufacturing process, is the key issue for R&D. The really widespread deployment of PV energy in the grid-connected market hinges on the development of improved materials and innovative concepts for a new generation of PV systems. These might include organic or hybrid solar cells, the improvement of thin film technology for PV materials, the further development of PV processing and automated manufacturing technologies.
9. Nevertheless, PV systems have proved to have enormous advantages over conventional energy sources such as diesel generators in remote, off-grid applications such as communications repeaters in sunny countries and in mobile specialist devices such as watches and calculators. As a consequence, they have already created a successful global industry. Total installed capacity is now over 3GW worldwide. In 2004, PV module production stood at 700 MW and the market for PVs is expanding at 20-35 per cent per year. AGE does not therefore see any need for EU-wide support for PV cells and systems aimed specifically at the off-grid market, though manufacturers will doubtless continue to improve their cells and systems and should be encouraged in the usual ways, via tax relief on R&D, support for deployment in new markets etc.
10. As sources of bulk electricity, connected to electricity grids, PVs meet most of AGE’s evaluation criteria with flying colours (see the table at the end of this annex)! Their input energy is ‘strictly’ sustainable in AGE terms; the raw materials needed for their manufacture are very widespread; they pose only modest safety risks to the workforce (during installation and cleaning) and none to the general public; they cause no noise nor greenhouse nor any other gaseous emissions when in use, though some types of cells would constitute toxic waste at the end of their lives; when used as roofs or facades for buildings they cause little visual intrusion; they cannot be significantly disrupted by any political, economic or terrorist incidents. Their drawbacks are that they cannot easily meet electricity demand at night or in more northerly, more cloudy countries of the EU; that their take up is likely to be slow if it has to be linked with replacing or refurbishing buildings – but above all that their costs are currently too high.
11. Even without electricity storage PVs have the technical potential to supply much of the daytime electricity needs of countries where the climate is usually sunny. Most of the southern member states of EU - 25 fit the bill, with a total current daytime demand of about 800 TWhr, approaching a quarter of the total EU electricity demand. Moreover, since electricity demand in domestic and commercial buildings in sunny countries tends to peak in the daytime in sunny weather, because of equipment used during the working day and air conditioning, some conventional capacity savings as well as large fuel savings can be made in this application. PVs would usually be installed on the buildings needing the energy or fairly close by, so they would also lead to fewer losses in transmission.
12. With effective energy storage PVs could potentially meet more than just the daytime demand. Conversely however, PV installations in more northerly countries without built in storage do not allow saving in conventional generating capacity, since electricity demand here is often higher in hours of darkness or during periods of bad weather when PVs work less well. To a simple first approximation therefore, a widespread economic contribution to EU electricity supply from PVs depends on achieving simple PV system costs which are low enough to compete with other energy sources on a fuel and transmission losses savings basis. This is a very tough target which PVs are still some
96
way from meeting. It is particularly tough if the competition is base-load coal or nuclear plants where costs of the fuel to the power station owners are very low.
13. However, it is the case that, whilst PV installations are on a relatively small scale (and even the European Photovoltaic Industry Association expects only a 1% contribution to electricity supply by 2020), the costs of PV electricity need be competitive only with the retail price of power from electricity companies. This is a much softer target and is certainly helping PV electricity begin its penetration into the ongrid market. But if the ultimate impact of PV is to be large it will have to meet the more difficult challenge of competing with more dependable bulk power producers in the wholesale market where the costs of its inability to meet demand at night or in poor weather will have to be factored in.
(C) Attractiveness of solar electric (PV) technologies 14. PV systems have already proved their advantages over conventional energy sources in
remote, off-grid applications and in mobile specialist devices such as watches and calculators. These applications have already created a successful PV manufacturing industry.
15. PV systems also have many features which are attractive for bulk energy supply, not least the technical potential to supply electricity for a significant part (up to about a quarter) of the total EU demand. Thus the input solar energy is ubiquitous and fully sustainable; the raw materials needed for PV ma nufacture are very widespread; PV poses only modest safety risks to the workforce (during installation and cleaning) and none to the general public; they cause no noise or gaseous emissions when in use; when used as roofs or facades for buildings they cause little visual intrusion; their modularity makes it easy to match capacity to demand requirements; installation is usually straightforward and quick; they cannot be significantly disrupted by any political, economic or terrorist incidents. Moreover, the direct economic benefit to the owner is often in electricity that no longer has to be bought from retail suppliers at high, retail prices.
(D) Priorities for augmented R&D 16. Current installed system costs for building-integrated PV in Europe are around 5 –10 € per peak watt (PV module costs 3 – 6 € per peak watt). On a good site in southern Europe, with around 1800 equivalent peak solar-power hours per year, assuming a capital charge rate of 6% and a system life of 20 years but no significant maintenance costs, this corresponds to an electricity cost of around 25 - 60 €cents per kWhr. This is more than 10 – 20 times the fuel and transmission costs of conventional electrical power, with which PVs will ultimately have to compete if they are to make a large contribution to supply, but only 1 – 8 times the retail price. There are two different approaches to making PVs more widely competitive, though they are not necessarily independent. 17. The first is to subsidise the deployment of the current technologies (the guaranteed price paid to solar generators in Germany is 46 €cents / kWhr) and rely entirely on economies of scale and the learning curve of mass production. If enough solar cells are manufactured using the currently dominant silicon technology then the costs will reduce; and silicon enthusiasts believe that these cost reductions will be big enough to ensure that these cells can eventually compete without subsidies. The second approach is to search for more efficient cells such as multi -layer junctions with a range of
97
materials and/or more easily mass-produced technologies such as amorphous silicon and to seek to make PVs competitive via installation subsidies only when better echnologies are available. 18. AGE is not sure whether or not economic PV installations can be achieved with current silicon technologies but it doubts it. They may compete with retail power on good sites but it is very doubtful that they can ever be truly economic against gas, coal or nuclear generation in large-scale use. Moreover, since the scale of PV production is already quite large, supplying as it does the existing off-grid and subsidised on-grid demand, the increased scale of production needed to drive the costs down to where they can truly compete will be enormous and the subsidies required to achieve those sales volumes will be very large too. However, since the subsidy strategy for making cells competitive may be used in some member states, AGE believes that some EU- wide research should focus on trying to optimise current PV systems via R&D on cheap ‘solar-grade’ silicon, crystalline silicon cell and wafer production technologies, balance of systems equipment, control systems for grid connection, safety and reliability issues. 19. But AGE believes that the really important long-term R&D challenge is to find a PV technology concept which is significantly cheaper per unit output than crystalline silicon and lends itself more readily to mass production. There is as yet no clear winner among the various materials being studied such as amorphous silicon, copper- indium- diselenide, cadmium telluride, organic solar cells etc. and for all thin film cells fundamental R&D and new production technologies are required. AGE therefore concludes that the main EU – wide R&D priority for PV should be on materials research linked with device physics and manufacturing technologies for promising thin-film and/or multi-layer PV technologies. (E) Assessment of solar electric (PV) technologies 20. AGE’s evaluation of solar photovoltaics against its standard criteria is given in the table
below. The block of ‘excellent’ ratings in the centre of the table indicate why PVs are so highly thought of by the public and politicians. In the north of the EU the problems of inherently low load factors and incompatibility with customer needs (in not delivering power during periods of darkness or bad weather) are probably insurmountable. In the south, the only real obstacle to the wider use of PVs is their cost.
98
Criterion Comments
Potential Economic Contributionat current energy prices nil for the forseeable future
at 2 times current probably nilat 4 times current possibly large in the long term
Health & Safety Impactsto work force excellent
to public excellentEnvironment Friendliness
locally excellentglobal warming excellent
Input Sustainability excellentSecurity of supply excellent
Compatibility with EU needs poor in the northern EU - because of diurnal, seasonal and weather variationgood in the southern EU
Deliverability very slow - if it has to be part of the building fabric
The Need for for EU - wide R & D good - for the difficult search for better PV technologiesSecondary (spin-off) merits excellent - major markets outside EU
Special Factors excellent - strong public support
Solar Photovoltaics against Evaluation Criteria
(F) AGE recommendations 21. The problem of making PVs truly competitive in the bulk electricity market is a hugely
difficult one and will not be solved quickly or perhaps not at all unless Europe’s best researchers in the area are closely coordinated and can build on each other’s advances. AGE believes that the EU needs to have a major campaign to develop novel PV technologies, which can attract our best researchers and our most innovative production engineers. The scale of the research may not initially be very large but the researchers need to work closely with industry to ma ke sure new technologies take proper account of the opportunities and constraints in thin film manufacturing.
22. AGE therefore concludes that the main R&D priorities are: - Exploration of novel PV materials, including organics, and new production technologies. - Novel thin-film modules and production techniques. - Work on truly mass-producible PV modules, linking device physics with manufacturing technology and material research on promising PV technologies.
99
7. Solar Thermal Technologies / Solar Heating and Cooling
(A) Energy source and solar thermal technologies
1. The implementation of solar thermal technologies as a source for heating and cooling in Europe and the development of a strong European solar thermal sector are important steps towards achieving the European policy goals of increased security of energy supply, reduction of greenhouse gases and sustainable development.
2. A major part of the energy use in the EU is related to applications in heating and cooling which operate at temperatures below 250°C. In this temperature range solar thermal offers great opportunities replacing valuable fossil fuels by emission free solar solutions.
3. In the built environment alone, more than one third of the EU energy is used; for heating, in both the built environment as well as the industrial sector, the EU consumption is around 40%, of which approximately 80% is used for applications below 150°C. These figures reflect the enormous potential for solar thermal as the main technology to replace traditional fuels used for heating and cooling.
4. Based on the present state of the technology, the perspectives for further technological developments and the combination with price developments for traditional fuels as a result of scarcity and environmental cost, a realistic assumption can be made that in the next 25 years energy needed for heating and cooling in the EU can be reduced by a minimum of 50% through a mix of energy savings, energy efficiency and the use of solar thermal. In economi c terms this implies that widespread use of solar thermal technologies
100
in combination with other energy reduction measures can take up to 15% or roughly € 100 billion out of the EU energy bill in a few decades time.
5. The worldwide and the European solar thermal markets have grown significantly over the recent years. The most dynamic markets for flat-plate and evacuated tube collectors worldwide are in China and in Europe. The average annual growth rate between 1999 and 2003 was 27% in China and 12% in Europe. At the beginning of 2005, the installed capacity of flat-plate and evacuated tube collectors in Europe was 10 GWth (14 million square meters of collector area).
6. Europe is leading in technological terms but in terms of manufacturing, 75% of the solar thermal collectors produced worldwide in 2003 were produced in China. Europe comes in at second place, with just 10% of the worldwide production. In order to improve European competitiveness and to open new markets, the European solar thermal sector needs to increase its research efforts and levels of market support. Therefore a strong common European strategy for solar thermal technologies is needed.
7. Markets for solar thermal systems are domestic hot water preparation, solar heating and cooling of buildings, process heating below 250 °C, drying processes e.g. crop drying, sea water desalination and other special applications like “Floating Solar Chimney Technology”. New approaches for solar thermal applications are solar-combined heating systems, solar-supported district heating for housing estates and solar-supported process heat up to temperatures of 250 °C.
(B) Market situation and potential
8. A large variety of solar-thermal components and systems, mostly for residential
applications, are available on the market. The products are reliable and show a high technical standard in the low temperature regime. However, there are technical and economic barriers and obstacles preventing the wider use of solar thermal components and systems. The market growth is not yet stable and still is very much dependent on public support (subsidies), not unlike the other renewable energy technologies.
9. Solar heating and cooling applications have a low penetration in most countries where business is carried out mainly by small and medium enterprises with partly manual fabrication and no established technical-scientific R&D divisions. There has been, however, a rapid market growth in recent years for small solar hot water systems (SDHW) in countries moving towards partly automatic or semi-automatic fabrication of solar-thermal components. Over the past 20 years the specific costs of SDHW systems have decreased by a factor of two. Nevertheless “solar heat” is not yet seen as fully competitive with fossil alternatives.
10. The worldwide contribution of solar thermal heat to the overall energy supply has been strongly underestimated in the past. The IEA-SHC-report “Solar Heating Worldwide: Markets and contribution to the energy supply 2003” was prepared within the framework of the Solar Heating and Cooling Programme (SHC) of the International Energy Agency (IEA). The 35 countries included in this report (IEA-Member States, Barbados, Brazil, China, Cyprus, and India) represent 3.7 billion people which is about 57% of the world’s population. The collector area installed in these countries is estimated to represent 85-90% of the solar thermal market worldwide.
11. The world-wide installed capacity of solar thermal systems is estimated to 92.7 GWth corresponding to 132 million square meters of collector area at the end of year 2003. Of this, 69.5 GWth were counted by flat-plate and evacuated tube collectors, which are used to prepare hot water and for space heating and 22 GWth by unglazed plastic collectors,
101
which are used mainly to heat swimming pools. Air collector capacity was installed to an extent of 1.2 GWth. These are used for drying agricultural products and to a lesser extent for space heating of houses and production halls. The use of solar thermal energy greatly varies in the different countr ies respective economic regions. In North America (USA and Canada) swimming pool heating is dominant with an installed capacity of 17.9 GWth of unglazed plastic collectors while in China (35.5 GWth), Europe (10.1 GWth) and Japan (8.9 GWth) plants with flat-plate and evacuated tube collectors - mainly used to prepare hot water and for space heating - are dominant.
12. The annual collector yield of all solar thermal systems installed by the end of 2003 in the 35 recorded countries corresponds to an oil equivalent of 8.8 billion litres and an annual avoidance of 24.1 million tons of CO2.
13. Based on the data available for the year 2004 at the date of publishing this report the total installed capacity worldwide of flat-plate and evacuated tube collectors can be estima ted with 86 GWth (123 million square meters) and the installed capacity of unglazed plastic collectors is estimated with 23 GWth (33 million square meters of collectors).
(C) Attractiveness of solar thermal technologies
14. The areas for solar thermal applications are manifold, and there are main reasons for
utilisation: The energy need for heating and cooling as well as for crop drying and process heating is large and growing, the solar resource is large and inexhaustible, the environmental benefits and the economic benefits are substantial.
15. Building using solar energy have remarkable advantages: Require less energy, cause less adverse environmental impacts, e.g., CO2, provide open sunlight, high quality space, improve building aesthetics, require no special architecture, provide new medium for architectural expression.
16. The potential of solar technologies for the heat supply in housing is large: Passive solar heating in combination with energy-efficient building construction can reduce the heat demand for space heat – in combination with rational energy use and energy efficiency - up to 30%. Active solar can reduce the fuel demand for hot water and space heat (50% to 70% solar share for hot water preparation, 40% to 60% of the heat supply - hot water and space heat in low-energy houses), and day-lighting can reduce the electricity demand for lighting up to 50%.
17. While solar water and space heating have been in the market for decades, new approaches for solar thermal applications - e.g. for cooling and process heat - are now emerging onto the market. About 30 to 40% of the process heat demand could be covered with low- to medium temperature solar collector systems.
18. Solar assisted cooling is an extremely promising technology, as peak cooling consumption coincides with peak solar radiation. A number of large-scale solar cooling systems have been successfully demonstrated: it is now necessary to support wide market introduction. Small-scale solar cooling systems could be ready within a decade, if R&D support is provided.
19. Summarising, solar thermal systems could replace more than 30% of the EU's oil imports from the Middle East.
102
(D) Priorities for augmented R&D
20. The governmental R&D funding for solar heating and cooling in IEA-Member countries were in 2000 US$ 75 million and in 2001 US$ 69 million. Industry funded R&D during 2000 - 2001 is estimated to be at least 50% as much as that provided by governments. Conclusion: Governmental and industry funded R&D for solar thermal systems is decreasing.
21. Reasons for continued R&D-funding are: • Solar thermal systems are the logical successor of oil and gas heating: more than one third of our energy use is for heating. • It is a cost effective investment as many applications are close to market entry. • Solar thermal systems - as with other renewable energy sources - provide significant local and global environmental benefits. • Contribute to energy security and energy services at point of end use, promotes employment, and therefore contribute to sustainable economic development of nations.
22. Steady funding at an increased level would allow the various solar heating and cooling (SHC) technologies and designs to reach better cost and performance goals and thereby facilitate their growing presence in the market and their associated environmental benefits.
23. A faster market penetration of solar thermal systems requires initial governmental support for R&D, information and market development. A basic justification for continued R&D support for SHC is therefore that R&D is a basic and important part of technology and market development.
24. It is however important to emphasise that R&D and R&D support is not the only requirement for the development of a mature market for solar heating and cooling technologies. Market stimulation is an essential element as one without the other does not give best value for the money invested in either. In addition, policies, economics and cultural aspects have a significant impact on the market development for SHC.
25. The target set in the EC’s White Paper on renewable energy published in 1997 is 100 million square meters of solar collector area installed by 2010. This target clearly will not be reached without market oriented R&D initiatives, although solar thermal energy has the potential to meet a significant portion of the heating and cooling demand in the residential sector and to contribute significantly to the energy supply of the commercial and tertiary sector. Of course it is important that better efficiencies are used to reduce these heating and cooling demands.
26. To reach the goal of a wide-spread market deployment of solar thermal systems fundamental and applied research and demonstration is needed in the following four main sections: • Advanced Materials and Components (advanced materials, advanced solar thermal collectors, advanced thermal energy storage). • Advanced Systems (large-scale solar heating systems, solar industrial processes systems, solar cooling systems, combined solar heating and cooling systems). • Building Integration and Passive Solar. • Standards, Regulations and Test Procedures.
103
27. Fundamental and applied research is needed to develop high performance and cost efficient materials for improved solar thermal systems: Cost-effective optical coatings on the surfaces interacting with the solar irradiation in order to reflect, transmit or absorb the light in a highly effective way, low-cost anti-reflective and self cleaning glazing materials (e.g., new synthetics, embossing of suitable micro-structures into the surfaces of panels and tubes).
28. Material research is also needed on the thermal side of the solar thermal energy conversion: Materials and components are necessary to withstand high stagnation temperatures of high efficiency solar thermal collectors without decreasing the efficiency in the required temperature range or to break down and shorten the 20-year service life; plastic materials for collectors with high thermal and optical performance could significantly reduce the costs of solar thermal systems.
29. For the future development of solar thermal energy storage, advanced insulation materials are necessary and energy storage materials with a higher energy density than water need further development. Promising technologies are based on phase change materials or thermo-chemical storage processes (e.g., sorption).
30. Specific R&D needs for advanced solar thermal components includes: Advanced flat-plate collectors, specifically designed for roof and façade integration, new collectors for medium temperature applications up to a temperature level of approx. 250°C are necessary for new and challenging applications like solar cooling and solar heat for industrial processes, photovoltaic-thermal (PVT) collectors.
31. For novel collector systems in the low and medium temperature range polymeric materials will allow for significant technology progress. As evidenced in the past by developments in numerous industrial sectors (e.g., electrics and electronics, automotive and aviation, general machinery, building and construction, packaging) a high potential for innovative advancements by the proper integration of polymeric materials is also to be expected for solar components and systems. Due to the wide range of properties that may be realized by polymeric materials combined with their cost efficient and highly flexible process ability and the high potential for multi-functional integration, the advantages related to the use of polymers in solar components and systems include functional improvements, system cost reductions and - last but not least - more design freedoms to meet the aesthetic demands of architects and end-users. Moreover, as a result of their property profile which may be tailored to specific requirements and applications together with their low density (light weight), polymeric materials use “less to do more”, thus also contributing to resource preservation.
32. The potential for solar thermal applications in the housing sector and industry will increase dramatically once suitable technical solutions are available to store the heat for the medium (daily) to longer (seasonal) term. Water tanks have and will achieve a good method for heat storage. However, when it comes to high solar fraction for solar homes, water tanks show limits due to the required size and the heat losses. New materials and new types of storage concepts are necessary. They can be based on phase change materials (PCM’s) or chemicals, or a combination of water tanks and those materials adequately encapsulated. PCM materials can also be incorporated into structural elements of the building. Solar assisted air conditioning and cooling needs both hot and cold storage in order to produce cold, when the sun is available and deliver cold water when it is needed. This also would be a promising application for PCM materials.
33. Advanced storage systems could utilize chemical and physical processes to reduce the total storage volume and the related costs. The general aim should be to develop materials, components and systems that allow a reduction of storage volume by at least a
104
factor of 3 compared to water. For phase change materials (PCM) only a factor of 1.5 – 2 can be expected relative to hot water systems.
34. Solar heating systems for combined domestic hot water preparation and space heating, so called “solar combisystems”, and are increasing their market share in many European countries. But current designs are mainly focused on single-family houses. Therefore it is necessary to develop and to demonstrate solar combisystems with several hundred kW for multi-family houses and large-scale applications for housing estates and solar assisted district heating systems with several MW.
35. The industrial sector has the biggest energy consumption in the EU countries at approximately 30%, followed closely by the transportation and household sectors. The major share of the energy, which is needed in commercial and industrial companies for production, processes and for heating of the production halls, is below 250°C. The unique features of these applications lie on the scale on which they are used. Appropriate system designs and controls are needed to meet industrial requirements. Medium temperature collectors and high performance storage tanks are needed for the efficient integration of the solar energy into industrial processes.
36. With increasing demand for higher comfort levels in offices and houses, the market for cooling has been increasing constantly over the past years. The obvious solution to provide the prime energy for these cooling applications through solar thermal systems is still under development. In the small capacity range the component development of cooling equipment needs further R&D in order to come to higher performance, lower prices and to a more industrialized production. For all systems – small capacity for residential application and in small commercial buildings as well as in the large capacity range for large buildings and industrial applications R&D is required in the following areas: Cooling machines for low capacities and machines able to adjust to the solar thermal heat supply, system design, integration and control, providing best practice solutions via demonstration projects.
37. The combination of solar space heating, hot water preparation and cooling has not been addressed since the initial R&D done in the 1980s. Such systems have a high market potential, and by extending the operational period of the collectors to the full year, they will dramatically increase the competitiveness of solar thermal technology through the combination of heating and cooling.
38. For a broad market introduction of solar thermal systems, architectural aspects have to be taken into consideration: Building Design and Integration. Solar thermal collectors need to become an integral part of the building, ideally becoming standard construction elements. Furthermore, the impact of solar thermal systems on the building physics (i.e., façade collectors) is an important factor and has to be investigated in more detail.
39. As new buildings require less energy, in northern countries the effective heating season is shortened to a few months of the year. These months are also exactly the months with the least solar radiation. The logical conclusion is to consider the option of superior building insulation in combination with the use of passive solar gains during the spring and autumn to eliminate auxiliary energy demand while increasing the quality of life within buildings all year around. The interaction among windows, the degree of insulation and the use of ventilation heat recovery in high performance buildings is a subject needing further investigation.
40. Comfort is a critical aspect as the solar fraction is increased by means of passive solar design. Sun and glare protection reduce the passive solar heat contribution while the losses remain constant. Accordingly, the balance between comfort and energy savings requires careful analysis of occupant behavior and types of shading/glare control devices,
105
including options for automation. As "smart" houses gain a bigger sector of the housing market, the opportunity arises to maximize useful solar gains without compromising comfort. Types of devices, control systems and window systems could be investigated in the context of highly insulated houses with and without mechanical ventilation, both with heat recovery.
41. In order to support the further development and market introduction of solar thermal energy, it is necessary to provide, besides the technology itself, the appropriate boundary conditions. Among these are methods of testing and assessing the thermal performance, durability and reliability of systems and components. Tools and education packages for practicing architects are also needed. Furthermore, it is necessary to develop methods in order to assess the environmental benefits from solar thermal systems and to include solar thermal in today's building standards and regulations such as the European Building Performance Directive.
(E) Assessment of solar thermal technologies 42. The results of the evaluation of solar thermal technologies are listed in the following
table.
Criterion Comments
Potential Economic Contributionat current energy prices large - can compete with fossil fuels and electricity CO2 is taxed and/or solar systems are subsidised
at 2 times current very large - will compete with fossil fuels and electricityat 4 times current very large
Health & Safety Impactsto work force excellent - installation and maintenance regulated by directives and standards
to public excellent Environment Friendliness
locally excellentglobal warming excellent
Input Sustainability excellentSecurity of supply excellent
Compatibility with EU needs very good - fluctuating solar requires back-up or demand management Deliverability excellent - modular units can be installed to match demand
The need for EU-wide R & D good - need to maintain competiviteness of EU manufacturers
Secondary (spin-off) merits good - export opportunities
Special Factors excellent - strong public support generally
Solar Thermal Systems against Evaluation Criteria
(F) AGE recommendations
43. Almost 50% of the final energy consumption in Europe is used for the heating needs of
buildings, for domestic hot water production and for heating in industrial processes. Heat is the largest consumer of energy, being greater than electricity or transport. Renewable heating sources (solar thermal, biomass, geothermal) have a huge potential for growth and can replace substantial amounts of fossil fuels and electricity currently used for heating purposes. AGE believes, that steady funding at an increased level would allow the various solar heating and cooling (SHC) technologies and designs to reach better cost
106
and performance goals and thereby facilitate their growing presence in the market and their associated environmental benefits. AGE also support the development of stronger policies to promote renewable heating and cooling in EU-Member States: EU Directive to promote heating and cooling from Renewables.
44. To reach the EC’s target and to keep the leading technological position in the field of solar thermal technology then an ambitious fundamental and applied research and demonstration programme is required. The objective should be to develop competitive advanced solar heating and cooling systems which are able to cover 5%-10% of the overall low temperature heat demand of the EU-Member States by 2020.
45. Although other instruments (such as taxes, subsidies or regulatory) may be very helpful to temporarily relieve the burden by accelerated market diffusion of recently developed energy technologies, the only way out for a long-term sustainable solution in the energy sector will have to be found through R&D.
107
8. Solar High-Temperature Technologies / Solar Thermal Power Plants
(A) Energy source and solar high-temperature technologies
1. Solar systems for producing high-temperature heat are based on concentrating collectors.
2. Concentrating solar systems for electricity production have been used successfully since the mid-1980s to commercially generate electric power in regions of California (USA) with high direct radiation. Further spread of this technology came to a halt in the early 1990s because the costs were still too high to compete in the face of declining fuel prices and subsidies for the electricity market. Just recently, new engagement in climate protection and sustainable technologies and the volatility of fuel prices has led to new incentive programmes for solar power plants sponsored by national and European initiatives and by the World Bank.
3. Seven different technical concepts of concentrating solar thermal power technologies (CSP) are currently under promotion in Europe. Most of the systems are planned for Spain, which offers an incentive of about 21 cents/kWh for solar thermal electricity.
108
The most mature technology today is the parabolic trough system that uses thermal oil as heat transfer medium. Several 50 MWel units using thermal energy storage based on molten salt are currently planned.
4. The potential of CSP in Europe (EU-15) is estimated to be above 2000 TWh/year mainly in Spain, Italy, Portugal and Greece including Mediterranean islands. This potential figure has only considered unused, unprotected flat land area with no hydrographical or geomorphologic exclusion criteria with a direct radiation level above 1800 kWh/m²a. This figure is three times higher than the potential of hydropower and in the same order of magnitude than the wind energy potential (onshore and off-shore) in Europe. When including the import of solar electricity form northern Africa, the potential is considered almost infinite.
5. The present ECOSTAR evaluation estimates levelized electricity cost (LEC) of 17-18 cents/kWh for these initial systems, assuming a load demand between 9:00 a.m. and 11:00 p.m. under southern European solar conditions. The other selected technology options are currently planned in significantly smaller pilot scale of up to 15 MWel. The LEC is significantly higher for these small systems ranging from 19 to 25 cents/kWh. Assuming that several of the smaller systems are built at the same site to achieve a power level of 50 MW and take benefit of a similar O&M effort than the larger plants, LEC estimates of all of the systems also range between 16 and 18 cents/kWh. The systems achieve a solar capacity factor of up to 30% under these conditions (depending on the availability of storage).
6. One significant exception is the integration of solar energy into a gas turbine/ combined cycle, which at the current status of technology can only provide a solar capacity factor of 11% and need significant fossil fuel (20% - 25%) solar share depending on load curve) but offers LEC of below 8 cents/kWh. Due to the low specific investment cost of the gas turbine/combined cycle together with a high efficiency, the system is specifically attractive for hybrid operation.
7. Based on current understanding of the issues associated with the various systems, cost reduction of 30 - 35% triggered by technical innovations appears very feasible for most of the technologies. These figures do not include effects of volume production or scaling of the power size of the plants beyond 50 MW. For parabolic trough technology a cost reduction of 14 % by larger power blocks (400 MW) and 17% by volume production effects when installing 600 MW per year was estimated. Assuming similar figures also for the other technologies, an overall cost reduction of 60 – 65% can be estimated in the next 15 years. This would lead to levelized cost of electricity in Southern Spain of around 6 cents/kWh and down to 4.5 cents/kWh in high sunshine areas.
(B) Market situation and potential
8. A new window of opportunity for Solar Thermal High-temperature Technologies has
opened up recently. Today‘s technology is based on parabolic troughs using thermal oil, and central receivers using molten salt or air.
9. Spain offers a revenue of up to 22 cents/kWh for the first 500 MW of installed capacity other incentive schemes are in preparation in Italy, Portugal and Greece.
10. The construction of the first plant has been started; several others are close to start construction. In Spain solar power plant installations of more that 500 MW have requested to be considered under the above mentioned tariff scheme and should be installed by 2010.
109
11. A variety of projects are also under development in the US, the construction of the first plant will be finished by end of 2005.
12. Two international requests for bidding have been released for hybrid solar power plants in Morocco, and Algeria, further projects are under preparation in Iran, Israel, Egypt and Mexico.
13. A Global Market Initiative formed by the governments of 10 countries (Algeria, Egypt, Germany, Israel, Italy, Jordan, Morocco, Spain, Nevada, Yemen) have agreed to establish the boundary conditions to generate a market of 5000 MW of concentrating solar power plants needed to become fully commercial
14. Market focuses are in the larger scale projects (80-300 MW), as well as in smaller systems (10-50 MW). The larger systems are thought to be appropriate for bulk power, and would be developed as fossil hybrids (generally natural gas). The smaller systems have a variety of potential sub-markets, including captive industrial power, distributed generation, or small independent grids. In some situations, these, too, would be hybrids. Electricity generation costs for these first plants are in the order of 15-20 cents/kWh in Southern Europe for 50 MW size systems.
15. Low cost thermal energy storage systems improve the revenues of a solar power plant significantly. Promising concepts are concrete storage for parabolic troughs or molten salt or packed beds for central receivers. Quartz sand may be a candidate for a future high temperature storage system for air receiver power towers.
16. In solar thermal concentrating plants for process heating at high-temperature level can be provided in receivers which have already been developed in a multi MW scale for high temperature heat generation: in central receiver systems at 500-1000 °C and in an experimental scale up to 2000 °C in parabolic dish concentrators and in solar furnaces. Thus it is useful to investigate whether such plants - besides of solar thermal power production - could effectively be used to produce chemical energy carriers like hydrogen or could help to meet the energy demand for the established high temperature processes in the primary industry.
17. For the near term future only niche industrial applications at high-temperature levels can be expected such, detoxification of specific hazardous wastes, or testing and treatment of materials. Whilst developing the first niche applications an intended effect is to establish specific know how in solar chemical engineering and to collect those experiences which are required to carry out solar chemical bulk processes. At the same time also further specific applications of solar radiation should be inspired. The feasibility of a solar chemical technology has been demonstrated in an engineering scale.
18. A longer term goal is to develop the technology for a bulk production of solar fuels (e.g. hydrogen) to address the increasing fuel demand of the transport sector specifically in the sun-belt countries, without their own fossil fuel resources
(C) Attractiveness of solar high-temperature technologies
19. Solar thermal high-temperature technology is an option for sustainable electricity and
fuel production, when costs are reduced by a factor of 3-5 compared with the present. Research infrastructures and pilot plant development are costly and would benefit from a European approach.
20. Europe currently has a leading role but this is in jeopardy from US and Japan. It is part of this vision that Europe should maintain its position as the world-leader of both the technological development and the commercial utilisation of solar thermal high-
110
temperature applications. EU-funding is necessary in order to keep Europe competitive in solar thermal high temperature technologies, and that would not otherwise be carried out.
21. The chances for the industries of the industrialized world are twofold: solar chemical techniques could be employed directly at locations in the industrialized countries if there is enough sun (e.g. in Southern Europe, in the Southern States of the U.S.A., in Israel, in Australia) or could be exported to non-industrialized or industrializing countries which have good solar conditions (e.g. North African countries, South Africa, Namibia, Arab countries, Mexico). In a future world economy these countries could export electricity or their fossil resources taking benefit form the increasing world market prices, whereas a major part of their own increasing demand could be covered by renewable options.
(D) Priorities for augmented R&D
22. Current development needs are concentrated in:
• Parabolic Trough Technology using Direct Steam Generation. • Central Receiver Systems (CRS) using molten salt or CRS using saturated steam. • CRS using atmospheric air, and CRS using pressurized air receiver and dish sterling
systems. 23. Continuous demonstration of scaling steps of technology innovations are required to
run down the cost curve. 24. Innovative approaches for further cost-reduction have partly proven their technical
feasibility: • Efficiency improvements for direct steam generation for parabolic troughs or hot air
for gas turbines in power towers. • Cost reduction up to 25%. • Approaches in hybrid power conversion.
25. Low cost thermal energy storage systems improve the revenues of a solar power plant significantly. Promising are concrete storage for parabolic troughs or molten salt or packed beds for central receivers. Quartz sand may be a candidate for a future high temperature storage system for air receiver power towers.
26. R&D priorities on concentrating solar technologies for power generation are: • Short- to medium-term research should focus on the improvements of modular
components like concentrators, heliostats or modular receivers. These are essential cost drivers. Qualification of improved components can be done in existing CSP systems resulting in a low risk and relatively low cost qualification phase and a high development speed.
• The main objective of medium- to long-term R&D is to develop high efficient solar combined cycle (always in conjunction with gas) for power production. This will allow to reduce costs significantly and reducing the need of cooling water thus increasing the solar power contributions significantly in Europe mainly South Europe.
• Medium-to-long term research should also focus on thermal energy storage systems and the integration aspects of solar energy into larger more efficient power cycles. This development needs a number of scaling steps from the lab to the power plant thus requesting a longer development time and higher cost for the qualification of the concepts. Before starting such a development the consortium should be well
111
aware on the medium to long term aspect of this research activity and the cost associated with it. It appears necessary to include demonstration activities in this development phase. In order to achieve a significant progress, much larger resources are needed for these developments than offered in public programs in the past.
27. Competition is essential for cost reduction. In order to stimulate competition it appears to be essential to give similar starting conditions to a number of options. This includes the support of pilot plant demonstrations in order to establish a technical reference that allows suppliers to create bankable commercial projects in the future. In addition, there is a need for growth in the available expertise in several associated domains (glass, reflectors, light weight structures, storage and other).
28. R&D priorities for long term research in the field of solar fuel and commodity productions are:
• Technology development of integrated receiver-reactors, • windows for volumetric and direct absorption receiver-reactors, • secondary concentrators • Specific high temperature high flux measurement techniques. • System evaluation of thermo chemical cycles and concepts • Testing and demonstration of prototype units.
Further needs are: • Reduction of operation and maintenance costs • Stimulate mass production • Development of advanced materials for high-temperature applications and for thermal energy storage.
112
(E) Assessment of solar high-temperature technologies
29. The results of the evaluation of solar high-temperature technologies are listed in the following table.
Criterion Comments
Potential Economic Contributionat current energy prices nil for the forseeable future - only test facilities in operation
at 2 times current possible some - if technology will entre the marketat 4 times current possible large
Health & Safety Impactsto work force very good - installation and maintenance regulated by directives and standards
to public very good Environment Friendliness
locally excellentglobal warming excellent
Input Sustainability excellentSecurity of supply excellent
Compatibility with EU needs good in South Europe - fluctuating solar requires back-up or demand management Deliverability good - modular units can be installed to match demand
The need for EU-wide R & D good- need to maintain competiviteness of EU manufacturers
Secondary (spin-off) merits few to good - export opportunities
Special Factors site depending
Solar High-Temperature Systems against Evaluation Criteria
(D) AGE recommendations
30. The objective for further R&D in the area of solar high-temperature applications should be to develop high efficient solar combined cycle (always in conjunction with gas) for power production as well as solar thermal production of hydrogen or other fuels. This will allow to reduce costs significantly and reduce the need of cooling water thus increasing the solar power contributions significantly in Europe mainly South Europe.
31. AGE recommendation is based on the vision that Europe should maintain its position as the world-leader of both the technological development and the commercial utilisation of solar thermal high-temperature applications. Only the support of medium- to long-term research will keep Europe competitive in solar thermal high temperature technologies, and that would not otherwise be carried out.
32. Solar thermal high temperature technology is an option for sustainable electricity and fuel production, when costs are reduced by a factor of 3-5 compared with the present. Research infrastructures and pilot plant development are costly and would benefit from a European approach.
33. AGE believes that there is not a current need for ‘strong’ coordination in the solar thermal field, but nonetheless there are topics which would be well suited to the EERA concept, including R&D to: • Increase efficiency and reduce costs (high temperature approach, light weight
concentrators, and new reflector concepts).
113
• Explore and develop high-temperature technologies for various purposes including solar thermal hydrogen/fuel production (solar thermal could represent the only technology to compete effectively with nuclear, for the production of hydrogen).
• Reduce operation and maintenance costs and stimulate mass production. • Develop materials for high-temperature applications and for thermal energy storage.
34. The SolLab Network is an important existing opportunity for collaboration and coordination. This should be extended to other members.
35. There is a need for large scale infrastructures such as Plataforma Solar, European access options should be extended.
36. The achievement of such a significant contribution of solar thermal high temperature technologies will not only require technological developments leading to cost reductions, but also necessitate consideration of market development, grid integration, environmental impact, and socio-economic aspects.
37. Initiatives should be taken that utilise all the instruments available through the Framework Programmes. A European Research Platform in solar thermal high temperature technologies that can support the sector through long-term generic and scientific R&D should be the ambition. A necessary basic element will be the establishment in FP7 of an EU research programme dedicated to solar thermal high temperature technologies.
38. There is a key role for IPs to form the basis for large-scale R&D including the construction of pilot/ demo plant. High-temperature aspects, along with other topics related to production of hydrogen, should be included within the scope of the H2/FC Technology Platform.
39. Materials research represents an opportunity for cross-cutting research within the ERA.
114
9. Ocean Energy Technologies
(A) Energy source and ocean energy technologies
1. Ocean energy includes potential and kinetic energy from the ocean. Several types of ocean energy sources with different origins exist and the sources are classed into five principal categories: tidal, wave, marine current, thermal gradient and salinity gradient.
2. There is no commercially leading technology on ocean energy conversion systems at the present time. Nevertheless, there are commercially operated power installation based on tidal and wave power systems.
3. The most developed conversion systems concern tidal energy, which results from the gravitational fields of the moon and the sun. The tides are generated by the rotation of the earth within the gravitational fields of the moon and the sun. The relative motions of these bodies cause the surface of the oceans to be raised and lowered periodically. Tidal energy is predictable in both its timing and magnitude. The locations where tidal power could be developed economically are relatively few, because a mean tidal range of five metres or more is needed for the cost of electricity to be competitive with conventional power plants. Additional requirements are a large reservoir, and a short and shallow dam closure.
4. The energy from ocean waves can be considered to be a concentrated form of solar energy. Winds are generated by the differential heating of the earth, and, as a result of
115
their blowing over large areas of water; part of their energy is converted into waves. Nearshore and mainly at the shoreline the wave power level is in general smaller than offshore because of wave breaking in shallow waters. Other phenomena such as refraction, and diffraction in indented coastlines, can cause significant resource variations alongshore on a scale of 1 km or much less, especially at the shoreline. Power of waves has been recognised for millennia by its destructive capacity, the possibility of harnessing it has also been a challenge. More than one thousand patents of wave energy devices have been filed since the end of the 18th century, but it was only after the first oil crisis in 1973 that the research and development on wave energy appropriate scientific background started.
5. Many wave energy devices have been proposed but few have reached demonstration. Prototypes of onshore, nearshore and offshore Oscillating Water Column systems deployed since 1985 have proven this technology, which is still being developed. Various offshore wave energy devices are reaching the prototype stage as well as devices to exploit the energy resource that marine currents contain.
6. Different types of wave energy devices are now developed and planned to be built in the near future in the framework of international co-operation in the IEA Ocean Energy Systems Programme.
7. Marine currents, caused by thermal differences in addition to tidal effects, is kinetic energy from the sea which can be harnessed using techniques similar in principle to those for extracting energy from the wind, by using submarine converters similar to “underwater windmills”. But this option is still relatively undeveloped. A number of studies have been completed on the energy potential of marine currents but there have been few on the engineering requirements for utilisation of this resource. The start up of the exploitation of the marine currents energy can make use of conventional engineering components and systems but development is required to achieve reliability and durability of the equipment at low operational and maintenance costs. The technique that has been mostly considered for the exploitation of marine currents is to use a turbine rotor, set normal to the flow direction that is mounted on the seabed or suspended from a floating platform. The development of technology for the exploitation of marine currents is also clearly processing: three prototypes are being tested now.
8. Salient gradient utilises the pressure difference arising between fresh water and sea water (Salinity Power). Large amounts of renewable energy can be extracted wherever freshwater from rivers and lakes meets the saltwater of the ocean. When freshwater and saltwater is separated by a proper membrane the freshwater will spontaneously migrate through the membrane and dilute the saltwater in the process known as osmosis. The flux of water through the membrane generates a hydrostatic pressure corresponding to a water head of 100 m or more which can be used to generate power in a hydropower turbine. Within osmosis power ocean salinity increases hydropower potential. This technology has an enormous unexploited power production potential world-wide. Estimates indicate a potential about 250 TWh per year in Europe and 2000 TWh globally.
9. The main objective of the EU-co-funded 3.4 MEUR Salinity Power project is the development of a cheap membrane with a long operating life in order to keep the cost for power down. Recent developments and results suggest that salinity power plant can be constructed with a very gentle environmental impact taking very good care of the local environment and biodiversity. Assuming realistic membrane performance and cost data it is expected that salinity power will be competitive with other emerging
116
renewable energy sources such as off-shore wind power and biomass power generation when commercialised in about 5 to 10 years.
10. Ocean Thermal Conversion uses the thermal gradient between surface water heated by solar radiation and the cold deep water. Ocean thermal energy systems (Ocean Thermal Energy Conversion or OTEC) have been up to now only test prototypes.
(B) Market situation and potential
11. There are three tidal barrages around the world operated as a commercial power plant,
amounting to a worldwide total of 260 MWel of installed capacity. These are based on mature hydropower technologies. Because of their environmental impact on local ecosystems they are not expected to be widely deployed. In the case of wave power there are currently two installations operated as commercial-testing installations, cumulating around 750 kWe l of peak power.
12. The first commercial wave power plant is now installed near Povoa de Varcim, off Portugal’s northern cost, with a total capacity of 2.25 MW. Another 30 wave energy converters with an additional 20 MW will be signed and installed, if the results from the first plant will be positive. The private investor expects several hundred MW along the coast in this region.
13. As there are no purely commercial ocean energy plants operating (aside from tidal barrage in which there is little interest in future development), learning curves and cost figures do not rest on existing experience, but on estimates.
(C) Attractiveness of ocean energy technologies
14. Around 71% of the Earth’s land mass is covered by sea and oceans, and the potential
opportunities to harvest the abundant renewable energy sources that these contain is vast, estimated between 1 – 10 TW globally.
15. The estimated global resource for the 5 types of ocean energy are: • Ocean wave: 8000 – 80000 TWh/year. • Tidal: 200 TWh/year. • Marine current: Up to 5 TW, 800 TWh/year. • Salinity: 2000 TWh/year. • Ocean thermal (OTEC): 10000 TWh/year.
(D) Priorities for augmented R&D
16. Over the last twenty years, ocean energy developers received little R&D funding. For
example, European Communities Framework Programme financed projects over that period for a total contribution of € 26 million (USD 34 million), equivalent to only 10% of the funding contributed towards photovoltaic projects.
17. Increasing R&D funds will speed up the rate of development. The effort and finance put forward in the United Kingdom is already showing an increase in technical progress. Several concepts are envisaging full-scale demonstration prototypes around the British coast.
117
18. There are a number of both technical and non-technical barriers that must be addressed.
Non-technical barriers include: • Resource assessment. • Energy production forecasting and design tools. • Test and measurement standards. • Environmental impacts. • Arrays of farms of Ocean Energy Systems. • Dual-purpose plants that combine energy and other structures
Technical barriers are specific to individual technologies and include: • Wave energy systems (wave behaviour and hydrodynamics of wave absorption, reliability and survivability incorporated into the design, generic mooring techniques, power take-off systems and deployment methodologies). • Tidal Stream Current Systems based on underwater turbines (basic knowledge of current speed along the water column, structure water tightness, cost efficiency and reliability, foundation and installation methods, as well as transfer of knowledge to underwater systems). • Salinity Gradient (development of functioning and efficient membranes). • Ocean Thermal Energy Conversion (thermal cycles, influence of the environment, floating systems and other).
19. In the near term, ocean energy technologies will continue prototype deployments and investigation of multi-device large scale deployments. In the medium term, these technologies may become a significant contributor to those markets adjacent to the resource. In the longer term, when hydrocarbon scarcity becomes an increasing constraint and new forms of energy transmission are justified, ocean energy could become a much more important part of the world’s energy portfolio.
118
(E) Assessment of ocean energy technologies
20. The technologies to extract energy from the many ocean resources are early stage in
comparison with other renewable energies. The results of the evaluation of ocean energy technologies are listed in the following table.
Criterion Comments
Potential Economic Contributionat current energy prices nil - only testfacilities in operation
at 2 times current some - if technology development would be successfullat 4 times current large/very large - at special areas, if ocean energy systems are on the market
Health & Safety Impactsto work force very good - installation and maintenance regulated by directives and standards
to public very goodEnvironment Friendliness
locally good to very good - site dependingglobal warming excellent
Input Sustainability excellentSecurity of supply excellent
Compatibility with EU needs very good - site depending
Deliverability excellent - site depending
The need for EU-wide R & D good - need to maintain competiviteness of EU manufacturers
Secondary (spin-off) merits few to good - export opportunities
Special Factors site depending
Ocean Energy Systems against Evaluation Criteria
(F) AGE recommendations
21. Ocean energy technologies must solve two major problems concurrently: proving the energy conversion potential and overcoming a very high technical risk from a harsh environment. Additional R&D funding would help to mitigate the substantial technical risk faced by device developers daring to harness the energy of the marine environment.
22. Increasing R&D funds will speed up the rate of development, and is critical to advancing the development and the future of ocean energy systems.
23. Following the realisation of successful projects during FP6, AGE recommends that further EU supported projects should focus on continued prototype development and move towards supporting projects that resolve the issues associated with optimising single unit deployment and pave the way for the deployment of demonstration multi device farm projects.
24. The vision of AGE - albeit far distant – is of the emergence of a small number of dominant ocean wave and sea-current technologies, and of a significant deployment of these in appropriate locations around Europe. AGE emphasis collaboration between the
119
European research actors in ensuring the necessary progress on shared issues such as test facilities and the development of common standards.
25. Ocean energy research is currently dominated by SMEs, with support from public research bodies and universities. In general, the need is for only weak levels of coordination, with an adequate level of networking among the research actors and developers.
26. There is a need to ensure that appropriate test facilities, in a range of locations and conditions, are in place and available at a European level. In addition, a European effort is needed to advance thinking on the economics and financing of ocean energy plant, environmental and planning considerations, and shared problems in issues such as maintenance and reliability.
27. There may be a need to ensure links with actors in offshore wind energy technology, to ensure that any possible synergies are pursued.
28. R&D on ocean energy devices can be carried forward using STREPs, with a small number of IPs perhaps being utilised for large-scale demonstration plant.
29. Networking and joint planning has been carried out to date by the European Wave Energy Network (EWEN). Ongoing networking might be adequately addressed via Coordination Actions; a NoE could also be of value in planning and implementing common infrastructure and research facilities.
30. Use could be made of the Integrated Infrastructure Initiatives (I3) instrument for the development of research infrastructure such as European test facilities.